
Submitted:
10 September 2025
Posted:
12 September 2025
You are already at the latest version
Abstract
This study investigates sustainable development in Europe, moving beyond simple SDG scores and linear models. Using data from 2000 to 2024 across European coun-tries, Principal Component Analysis (PCA) was employed to create indices for the People, Planet, and Prosperity domains of sustainable development. Multivariate Adaptive Regression Splines (MARS) captured nonlinearities and interactions in the influence of these domains on sustainable development on the European continent. Re-sults show that progress depends on crossing key thresholds rather than gradual change. In the People domain, exceeding minimum levels leads to significant gains. The Planet domain acts as both stabiliser and constraint: moderate ecological perfor-mance fosters progress, while extremes hinder it. Prosperity has modest direct effects but becomes influential when combined with social and environmental factors. Inter-actions reveal that sustainable development arises from domain synergies, with social progress offering the most significant leverage. Findings recommend targeting lagging regions to surpass social thresholds, protect ecological stability, and ground prosperity in inclusive, eco-friendly frameworks. Overall, the study highlights how data-driven methods can identify tipping points in sustainability and provides a transferable framework for achieving the 2030 Agenda.
Keywords:
Sustainable Development Goals
; Europe
; thresholds
; Multivariate Adaptive Regression Splines
; People–Planet–Prosperity
; nonlinear modelling
; policy leverage
1. Introduction
The 2030 Agenda for Sustainable Development, adopted by the United Nations in 2015, has fundamentally transformed the global policy dialogue by establishing 17 Sustainable Development Goals (SDGs) and 169 targets aimed at promoting a balance between economic growth, social well-being, and environmental protection [1]. Unlike earlier frameworks, the SDGs emphasise multidimensionality and integration, recognising that sustainability outcomes are interdependent and cannot be advanced in isolation [2,3]. Yet, this holistic ambition also raises methodological challenges: sustainable development is inherently nonlinear, heterogeneous, and context-dependent, making its monitoring and evaluation far from straightforward [4,5].
Europe has been widely regarded as a frontrunner in implementing the SDGs, embedding sustainability priorities in flagship initiatives such as the European Green Deal, the EU 2020 Strategy, cohesion policy, and long-term climate neutrality frameworks [2,3]. Despite these efforts, however, progress remains uneven. Gracia-de-Rentería et al. [6] document persistent disparities across European regions, with Northern and Western Europe leading while parts of Southern and Eastern Europe lag. Kudełko [7] shows that member states follow divergent sustainability profiles rather than converging toward a single trajectory. At the same time, Grzebyk and Stec [8] earlier highlighted that newer EU member states consistently underperform relative to the European average. These findings underline the structural asymmetries that continue to shape European sustainability pathways.
Beyond the European context, a growing literature points to similar challenges elsewhere. Zhou [9] demonstrates that ecological goals in Asia exhibit delayed and threshold-dependent dynamics, while Idris and Razak [10] show that nonlinear methods provide richer insights into sustainability transitions in emerging economies. Saeed [11] similarly highlights the role of interaction effects in African contexts, where economic expansion without adequate social or environmental safeguards fails to generate genuine sustainability. Collectively, these studies emphasise that sustainability cannot be captured by static indices or linear models alone. At the same time, comparative works in Europe [6,7,12,13,14] confirm that even in high-income regions, nonlinearities and domain-specific asymmetries persist.
A central limitation of current monitoring practices is the reliance on composite indices, such as the SDG Index Score [6,12,14,15]. While such measures provide a valuable benchmark for cross-country comparison, they risk masking domain-specific dynamics and obscuring trade-offs between goals [6,7,12]. Environmental indicators often exhibit delayed or threshold-based responses [6,8], while social and economic progress may appear rapid but remain unstable without ecological foundations [13,15,16]. Linear aggregation, therefore, oversimplifies these interdependencies, making it challenging to identify leverage points where targeted interventions might deliver systemic improvements.
To address these issues, scholars are increasingly advocating for domain-based and nonlinear approaches. The People–Planet–Prosperity (3P) framework provides a coherent way to cluster SDGs into conceptually meaningful domains [12,15,17,18,19,20]. Methodologically, Principal Component Analysis (PCA) has been widely applied to construct composite indices that reduce dimensionality while preserving interpretability [15,21,22,23,24]. In parallel, nonlinear regression techniques have gained traction for capturing structural breaks and hidden interactions. Numerous studies demonstrate the importance of using nonlinear methods in SDG assessment, indicating they surpass static global scores in identifying interdependencies [25,26,27,28]. Among these methods, Multivariate Adaptive Regression Splines (MARS) are particularly well suited for determining breakpoints, threshold effects, and interaction dynamics that linear models fail to capture [29,30,31,32,33].
Against this backdrop, this study aims to develop a robust, domain-based framework for assessing and modelling sustainable development in European countries from 2000 to 2023. Specifically, our objectives are threefold.
- To construct composite indices for the People, Planet, and Prosperity domains using PCA, thereby capturing the latent structure of domain-specific SDG performance.
- To examine the joint and nonlinear effects of these domains on the overall SDG Index Score using MARS, allowing for the identification of thresholds and interaction effects.
- To provide actionable insights for policy prioritisation by revealing which sustainability domains exert the most decisive influence on overall progress and where domain imbalances may impede the achievement of the 2030 Agenda in Europe.
Through this dual methodological contribution, the study seeks not only to advance the empirical understanding of European SDG trajectories but also to demonstrate the broader value of threshold-sensitive and nonlinear approaches in sustainability research.
2. Theoretical Background
The monitoring and evaluation of sustainable development have become central to contemporary policy and academic debates, especially since the adoption of the 2030 Agenda for Sustainable Development. The 17 SDGs and their 169 targets are inherently multidimensional and interconnected, generating both synergies and trade-offs between social, economic, and environmental goals [1,2,28]. Conventional methods of SDG assessment often depend on global indices or aggregate scores, such as the Sustainable Development Report (SDR) and its SDG Index Score, which aim to offer a single composite value indicating overall progress [3]. Although these metrics support international comparisons, they are increasingly criticised for concealing underlying variations across domains and for treating all SDGs with equal importance, regardless of their functional interdependencies [4,28].
To overcome these limitations, researchers have emphasised the need for domain-based and multidimensional frameworks, which allow the decomposition of SDG performance into coherent clusters of objectives. One widely accepted approach is the People–Planet–Prosperity (3P) framework, which aligns closely with the integrated structure of the 2030 Agenda [1]. The People domain encompasses goals directly associated with human well-being, social inclusion, and equity (SDGs 1–6); the Planet domain addresses environmental integrity, resource efficiency, and ecosystem resilience (SDGs 12–15); and the Prosperity domain reflects economic performance, infrastructure, innovation, and urban sustainability (SDGs 7–11). This tripartite structure has gained traction in empirical studies, as it not only aligns with sustainability science but also provides clearer insights into domain-specific strengths, weaknesses, and bottlenecks. For example, Kudełko demonstrates that, although EU countries made progress across all domains between 2010 and 2021, the environmental dimension consistently lagged, preventing full sustainability despite advancements in social and economic indicators [7]. Gracia-de-Rentería et al. (2023) similarly reveal persistent regional disparities in SDG progress within the EU, with dynamic trajectories differing by both country and domain [6]. Earlier work by Grzebyk and Stec (2015) also highlighted substantial asymmetries in sustainable development performance across the EU, noting that Eastern European countries often perform below the EU average [8].
Beyond Europe, evidence from other regions further emphasises the importance of multidimensional, regionally tailored frameworks. Recent research shows that ASEAN countries display significant disparities and limited upward mobility within sustainable development tiers, with some areas improving (economic growth driven by the digital economy). Conversely, other areas stagnate (ecological environment and resource security) [9]. This underscores the value of frameworks that incorporate emerging drivers, such as digitalisation, alongside traditional economic, social, and environmental metrics.
A further methodological challenge arises from the fact that sustainability dynamics are rarely linear. Relationships between domains often involve thresholds and saturation points: environmental gains may only materialise after social or economic indicators surpass critical levels. In contrast, rapid economic growth can either reinforce or undermine sustainability depending on the governance context [19,21]. Idris and Razak (2025), applying spline regression to Asia-Pacific countries, show that green growth and energy transitions display pronounced non-linear effects, with growth potential shifting once specific thresholds are reached [10]. Likewise, Saeed [11] finds that industrialisation in Sub-Saharan Africa increases ecological and carbon footprints in both the short and long run. At the same time, foreign investment can mitigate these impacts by introducing cleaner technologies [22]. These findings underline the importance of modelling not only non-linearities but also interaction effects between domains, as sustainability outcomes often emerge from their joint dynamics rather than isolated contributions.
In response, scholars have increasingly turned to data-driven multivariate techniques. Principal Component Analysis (PCA) has been widely used to derive latent composite indices from multidimensional sustainability data, reducing redundancy and maximising interpretability [22,23]. However, the descriptive index alone cannot capture how domain-specific performance translates into overall SDG outcomes. To address this gap, nonlinear regression approaches such as Multivariate Adaptive Regression Splines (MARS) have gained traction in sustainability science [31,33]. MARS enables the identification of knot points (thresholds) where relationships between predictors (domain indices) and the dependent variable (overall SDG Index Score) change slope, while also incorporating interaction terms to capture cross-domain dynamics [30].
Taken together, the literature highlights three core insights:
- Domain-specific decomposition is crucial for uncovering the true structure of SDG performance and avoiding the masking effects of aggregated indices.
- Nonlinear and threshold-based modelling more accurately reflects sustainability dynamics than conventional linear methods.
- Integrating PCA and MARS provides a comprehensive framework for analysing both the latent structure of domain indices and their complex, interactive influence on overall SDG outcomes, offering actionable insights for evidence-based policymaking.
By situating our work within this evolving literature, the present study contributes to extending the analytical toolkit for sustainability assessment in Europe, offering a robust and policy-relevant framework for understanding how multidimensional domain performance translates into overall progress toward the 2030 Agenda.
3. Methodology
3.1. Research Design
In this study, we utilise a panel data design to analyse the temporal dynamics of sustainable development across European countries from 2000 to 2024. The primary objective is to evaluate how progress in three domains related to human well-being, prosperity, and environmental sustainability impacts the overall Sustainable Development Index (SDG Index) and to identify non-linear trajectories for detecting structural shifts or ‘breakpoints’ in progress toward sustainability, as well as nonlinear interactions among development domains.
3.2. Data Sources and Variables
Data were obtained from the United Nations Global SDG Database, providing harmonised statistics on SDG indicators. The dataset includes annual performance scores for each of the 17 Sustainable Development Goals (SDGs) and the overall SDG Index Score. The time period covers 2000–2024, with the unit of analysis being country-year (e.g., Germany–2001, Spain–2020).
To ensure geographical consistency, only countries wholly within the European continent were included, excluding transcontinental states such as Turkey, Georgia, Armenia, Azerbaijan, and Kazakhstan. This maintains analytical clarity by sticking to clear geographical boundaries rather than political ones. Ukraine was excluded from the analysis due to missing data for SDG 1 (No Poverty) over the entire period, a crucial variable for maintaining model integrity and cross-country comparability. This absence highlights a wider issue in the UN SDG Global Database, where several countries, including some in Eastern Europe, lack consistent time-series data for specific goals, despite being active participants in SDG reporting frameworks. The exclusion is therefore methodological rather than political, ensuring that all countries retained in the sample have complete and reliable data for the key variables. For all other included countries, the dataset contained complete data, removing the need for imputation or deletion techniques.
SDG 14 (Life Below Water) was excluded due to inconsistent or unavailable indicators for landlocked European countries (e.g., Austria, Switzerland, and the Czech Republic), which could distort comparative analyses.
The SDGs were grouped into three domains—People, Planet, and Prosperity—based on the United Nations Sustainable Development Solutions Network (SDSN) framework (SDSN, 2023). This classification aligns with established sustainability constructs, ensuring theoretical coherence. The domain assignments are presented in Table 1 below.
3.3. Assessment of Internal Consistency and Factorability
Instead of presenting methods in isolation, we structured the diagnostic procedure sequentially. First, the internal reliability of the SDG indicators within each domain was examined using Cronbach’s alpha to assess whether they form a coherent construct. Next, the sampling adequacy and suitability for factor analysis were evaluated through the Kaiser–Meyer–Olkin (KMO) statistic and Bartlett’s test of sphericity. These diagnostics provided the empirical foundation for applying principal component analysis (PCA) with orthogonal Varimax rotation, which was then employed to extract latent indices for the People, Planet, and Prosperity domains, enhancing the interpretability of the underlying structures by maximising the variance of component loadings within each domain.
3.4. Construction of Sustainability Domains Indices
Composite latent indices for the People, Planet, and Prosperity domains were developed using principal component analysis (PCA) with orthogonal Varimax rotation. PCA was selected to extract components that capture the maximum variance among indicators, aligning with the exploratory goal of identifying key sustainability dimensions. Composite indices were calculated as linear combinations of indicators, weighted by component score coefficients derived from PCA. In cases where coefficients were negative due to the arbitrary polarity of the rotated solution, index scores were sign-reversed to ensure that higher values reflected better performance, aiding in intuitive interpretation.
3.5. Multivariate Adaptive Regression Splines (MARS)
Multivariate Adaptive Regression Splines is a non-parametric regression technique designed to flexibly capture complex relationships between predictors and the outcome variable [29]. Unlike conventional linear regression, which assumes a single functional form across the entire data range, MARS approximates the response by combining multiple piecewise linear functions. These functions are smoothly connected at specific values of the predictors, referred to as knots, which are automatically selected by the algorithm. This construction allows the model to adapt to structural changes in the data and to identify threshold effects that would otherwise remain hidden in standard parametric approaches [30].
Formally, a MARS model can be expressed as:
where is the dependent variable, is the intercept, are basis functions derived from the predictors, are the corresponding coefficients, and denotes the error term. The basis functions typically take the truncated form:
with representing the knot position. By combining such functions, the model can approximate non-linear patterns through locally linear segments.
An essential feature of MARS is its ability to incorporate interaction terms between predictors, meaning that the method not only accounts for individual non-linear effects but also captures how variables jointly influence the outcome [31].. Model complexity is controlled through a two-stage procedure: an initial forward step that introduces many candidate basis functions, followed by a backwards pruning step guided by the Generalised Cross Validation (GCV) criterion to avoid overfitting and to retain only those terms that meaningfully improve predictive accuracy [32].
Taken together, this approach provides a highly flexible yet interpretable modelling framework, especially suitable for applications where relationships are expected to be non-linear, involve thresholds, or differ across subgroups of the data. By accommodating both non-linear effects and interactions between predictors, the MARS framework is particularly apt for modelling the complex dynamics of sustainable development. This makes it a dependable tool for identifying thresholds, trade-offs, and synergies across the People, Planet, and Prosperity dimensions of the SDGs, ensuring that the empirical strategy reflects the theoretical complexity outlined above.
4. Results
4.1. Assessment of Internal Consistency and Factorability of SDG Domain Constructs
Before constructing latent indices for the three Sustainable Development Goal (SDG) domains — People, Planet, and Prosperity — a set of diagnostics was carried out to assess the internal consistency and factorability of the indicators within each domain.
Internal consistency, as measured by Cronbach’s alpha, indicated that the SDG indicators within each domain formed coherent scales. Values were 0.79 for the People domain, 0.76 for the Planet domain, and 0.81 for the Prosperity domain. As all coefficients exceeded the conventional threshold of 0.70, these results suggest good reliability and confirm that the indicators can be meaningfully treated as unified constructs.
Turning to sampling adequacy, the KMO measure further supported the application of factor analysis in two out of the three domains. The Prosperity domain achieved an excellent score of 0.80, while the People domain produced a respectable value of 0.74. The Planet domain, by contrast, yielded a lower KMO of 0.57, which falls within what Kaiser (1974) classified as a “mediocre” range. Nevertheless, given the theoretical coherence of the indicators—anchored in the established UN sustainability architecture [17]—this domain remains analytically defensible despite the weaker statistical adequacy.
Bartlett’s test of sphericity was highly significant across all three domains (People: χ² = 1939.01; Planet: χ² = 1362.72; Prosperity: χ² = 1906.53; all p < 0.001). This confirms that the correlation matrices are not identity matrices and that sufficient inter-item associations exist to justify factor extraction.
Taken together, the combination of acceptable internal consistency, adequate sampling adequacy (in two domains), and significant sphericity tests provides strong justification for proceeding with principal component analysis using orthogonal Varimax rotation to construct latent indices for the People, Planet, and Prosperity domains.
4.2. Constructing the Indexes for Sustainability Domains
Building on the diagnostic results, we applied Principal Component Analysis (PCA) separately to each domain to extract latent indices for People, Planet, and Prosperity. In all three cases, a single dominant component emerged, confirming the presence of a strong underlying dimension within each sustainability pillar.
In the People domain, PCA extracted a single dominant component with an eigenvalue of 3.01, capturing 50.2% of the total variance across the six social indicators. This suggests that the selected measures of poverty, health, education, gender equality, and basic services load firmly on a common latent dimension of human well-being. For the Planet domain, one factor also emerged, with an eigenvalue of 2.08 and an explained variance of 69.4%. The high proportion of variance accounted for indicates that the environmental indicators—responsible consumption, climate action, and biodiversity—are tightly interrelated and reflect a coherent ecological dimension. Finally, the Prosperity domain produced a single factor with an eigenvalue of 2.92, explaining 58.4% of the variance. This confirms the presence of a strong underlying structure in the economic indicators related to energy, growth, innovation, and urban sustainability. Factor score coefficients derived from these analyses were subsequently used to calculate composite domain indices for each country-year observation (see Table 2).
The composite index for the People domain was constructed as a weighted linear combination of the six underlying SDG indicators (SDGs 1–6, see Table 2). The estimated coefficients from PCA were initially negative due to the arbitrary polarity of the unrotated solution. To ensure intuitive interpretation, the index was sign-reversed, such that higher scores represent stronger social sustainability performance.
For the Planet domain, the factor loadings were all positive, reflecting the coherence of environmental indicators (SDGs 12, 13, and 15, see Table 2). The resulting Planet therefore directly captures ecological sustainability, with higher values denoting stronger performance in responsible consumption, climate action, and biodiversity protection.
Finally, the Prosperity domain index was derived from five indicators (SDGs 7–11, see Table 2). As with the People domain, the coefficients were negative due to rotation polarity and were therefore reversed to aid interpretation. In this formulation, higher Prosperity scores correspond to stronger performance in energy, growth, innovation, inequality reduction, and sustainable cities.
4.3. Modelling the Influence of Sustainability Domains on SDG Progress Using Multivariate Spline Regression
Building on the composite indices derived from PCA, we next examined how the three sustainability domains—People, Planet, and Prosperity—jointly shape overall SDG progress. To this end, we applied the Multivariate Adaptive Regression Splines (MARS) model, which is particularly well-suited for detecting nonlinearities and interaction effects. Unlike standard regression approaches, MARS flexibly approximates complex relationships by combining piecewise linear functions, while automated pruning and penalisation guard against overfitting.
In this specification, the dependent variable was the overall SDG Index Score, while the predictors were the three domain indices obtained from PCA. The model was estimated using a balanced panel covering European countries over 24 years. After pruning and penalisation (λ = 2; pruning threshold = 0.0005), the final model retained 16 terms derived from 25 basis functions, including both nonlinear and second-order interaction effects. This configuration achieved a firm fit, with an adjusted R² of 0.963, a Generalised Cross-Validation (GCV) error of 0.769, and a residual standard deviation of 0.848, indicating robust explanatory power. The main model specification and performance statistics are summarised in Table 3.
The MARS model identified several knot locations that signal inflexion points in the relationships between sustainability domains and the overall SDG Index Score. Two knots were found in the People domain (0.839 and 0.397), three in the Planet domain (0.532, 1.004, and 1.377), and one in the Prosperity domain (0.147). These thresholds represent points where the marginal contribution of each domain changes in magnitude or direction.
Notably, the presence of two distinct knots in the People domain highlights a nonlinear pattern of influence. The threshold at 0.397 marks the point at which early improvements in human development begin to contribute positively to sustainability performance. At the same time, the knot at 0.839 represents a critical inflexion where further progress in education, health, and basic services generates disproportionately larger improvements, likely due to synergistic spillovers across multiple social indicators.
For the Planet domain, the sequence of knots (0.532, 1.004, and 1.377) delineates multi-threshold behaviour. At lower values, environmental deficits impose significant penalties, while surpassing higher thresholds generates accelerating returns, especially when coupled with favourable conditions in the other domains. The Prosperity domain shows only a single direct knot (0.147), indicating a more modest standalone effect. Still, its influence becomes highly significant in interaction terms, particularly when combined with People or extreme Planet values.
The estimated spline model can be expressed as follows:
The spline model yields several important insights. First, a clear nonlinear threshold emerges in the People domain. Once the index surpasses 0.839, its marginal contribution to the SDG Index rises sharply, signalling a critical leverage point in human development. Second, Planet–People interactions reveal compensatory dynamics, where social progress can partially offset ecological deficits, but also trade-offs when both dimensions remain weak. Third, Prosperity exerts only limited direct influence but shows substantial conditional effects through interactions, particularly under extreme values of Planet. Finally, the model confirms asymmetric responses: the impact of falling below thresholds is often steeper than the gains from crossing them, underscoring the vulnerability of sustainability trajectories to regression in any single domain.
The frequency of domain references across the model’s basis functions further illustrates their relative importance. As shown in Table 4, the People and Planet domains were each referenced nine times, while Prosperity was referenced seven times. This confirms that social and environmental development play the most prominent roles in shaping SDG outcomes, whereas economic effects emerge mainly through interactions.
These reference counts reinforce the interpretation of the model outputs: improvements in People-related indicators consistently underpin sustainable development trajectories, while environmental and economic dimensions exert more conditional and context-dependent influences. This finding suggests that policies prioritising education, health, and social inclusion are likely to yield the strongest and most sustained gains in overall SDG progress, particularly when coupled with complementary advances in environmental sustainability.
4.4. Visualising Nonlinear and Interaction Effects among Domains
To complement the statistical outputs of the MARS model, this subsection presents a set of visualisations designed to illustrate the nonlinear and interactive dynamics between the People, Planet, and Prosperity domains. By depicting fitted response surfaces and scatter relationships, these figures make the identified thresholds and conditional effects more tangible. They reveal not only where marginal returns accelerate or taper off but also how domains interact asymmetrically, creating leverage zones and potential trade-offs. Such visual evidence is critical for interpreting the model beyond coefficients, as it highlights the systemic patterns that underpin sustainable development trajectories in Europe.
Figure 1 visualises the fitted response surface for the interaction between the Planet and Prosperity domains. The plot highlights how ecological performance conditions the impact of economic progress on sustainable development outcomes, revealing both synergies and trade-offs.
The figure illustrates that environmental sustainability is a primary determinant of overall SDG performance: countries with low Planet scores fall into a persistent underperformance zone, regardless of their Prosperity level. Conversely, when Planet indicators surpass critical thresholds (≈1.004 and 1.377), the surface rises sharply, producing the highest SDG Index values. Prosperity alone provides limited gains and, under environmental stress, its influence can become negative, consistent with the penalising interaction effects identified in the MARS model. This visual evidence highlights that economic growth without ecological safeguards undermines long-term sustainability, whereas strong environmental performance can compensate for modest prosperity levels. Thus, policy leverage lies in aligning economic expansion with ecological thresholds, ensuring that growth does not erode the very foundations of sustainable development.
Figure 2 visualises the joint effect of the People and Planet domains on the SDG Index. This response surface illustrates how social capacity and environmental integrity combine to determine sustainability outcomes, highlighting critical thresholds and nonlinearities.
The figure reveals a deep “valley of underperformance” at jointly low People and Planet values, where incremental improvements bring only limited benefits. Once the People index crosses ~0.839, however, the SDG Index rises steeply, underscoring the catalytic role of social progress. Importantly, high Planet values alone do not generate comparable gains, highlighting an asymmetry: strong human development can compensate for moderate environmental deficits, but not vice versa. This suggests that policies aimed at strengthening education, health, and inclusion are essential leverage points for overcoming structural sustainability traps. At the same time, ecological progress becomes more impactful only when paired with adequate social capacity.
Figure 3 depicts the interaction between the People and Prosperity domains, showing how social and economic factors jointly shape SDG outcomes. The surface highlights the nonlinear gains arising when both domains reach higher values.
The figure demonstrates that Prosperity exerts only limited influence when considered in isolation but becomes highly consequential in combination with strong social performance. Once the People index exceeds the critical threshold (~0.839), the addition of Prosperity pushes the SDG Index to its maximum values, forming a “ridge of success” across the surface. This synergy suggests that economic growth is most effective when embedded in robust social systems: education, health, and inclusion create the absorptive capacity needed for innovation, infrastructure, and development to translate into sustainable outcomes. Conversely, high Prosperity without corresponding People values yields much weaker effects, reflecting the fragility of growth that is not socially inclusive. These dynamics imply that long-term sustainability in Europe depends less on economic expansion per se and more on its alignment with strong social foundations.
While the 3D response surfaces illustrate how domains jointly influence SDG outcomes in nonlinear ways, it is equally important to examine the underlying pairwise associations. To this end, Figure 4 and Figure 5 present two-dimensional scatter plots with confidence ellipses, which provide a complementary perspective. These visualisations highlight the degree of correlation between domains, helping to explain why certain variables exert more substantial direct or interaction effects in the spline model.
Figure 4 shows the bivariate relationship between the People and Prosperity domains. The scatter plot, complemented by a regression line and 95% confidence ellipse, highlights the strong linear association between social and economic performance.
The figure reveals that People and Prosperity scores are tightly coupled, with countries that achieve higher levels of social development also tending to perform well economically. This strong correlation helps explain why Prosperity’s direct contribution in the MARS model was limited: much of its variance overlaps with People, reducing its independent effect. However, the dispersion at the extremes of the distribution suggests that Prosperity becomes more influential in interaction terms, particularly when social development is either very high or very low. This nuance is consistent with the model’s findings that economic growth amplifies social progress only when human development surpasses critical thresholds, thereby transforming prosperity into a contextual rather than a standalone driver of sustainability.
Figure 5 illustrates the bivariate relationship between the Planet and Prosperity domains. The scatter plot with quadratic fit and confidence ellipse highlights a nonlinear and asymmetric association, pointing to potential trade-offs between ecological performance and economic development.
The figure reveals that while moderate values of Planet are associated with a broad range of Prosperity outcomes, high levels of environmental sustainability often coincide with lower economic scores. This downward curvature reflects the trade-offs captured by the MARS model, where Prosperity exerts an adverse interaction effect under strong environmental conditions. In practical terms, efforts to strengthen ecological performance may temporarily constrain economic expansion unless accompanied by innovation and structural adjustments. Conversely, high Prosperity under weak environmental performance appears unstable, as it does not translate into higher SDG scores in the spline analysis. This asymmetry reinforces the need for policy coordination: ecological gains must be paired with inclusive economic strategies to avoid sustainability trade-offs and ensure that prosperity is environmentally grounded.
Figure 6 examines the bivariate association between the Planet and People domains. The quadratic fit and confidence ellipse highlight a nonlinear pattern that reveals both synergies and tensions between social and environmental dimensions of sustainability.
The plot shows that at low to moderate Planet scores, higher People values are broadly compatible with improved environmental outcomes, suggesting a complementary relationship. However, as Planet scores increase beyond ~1.0, the fitted curve bends downward, indicating diminishing returns and even potential trade-offs. This pattern reflects the challenge of sustaining social progress once ecological performance reaches advanced levels, possibly due to the stricter policies and behavioural adjustments required to maintain environmental integrity. Conversely, very high People scores do not always correspond to strong Planet values, underscoring the asymmetry: while social progress can drive environmental improvements up to a point, long-term ecological sustainability demands targeted policies that extend beyond social investments. The figure thus highlights the importance of aligning social and environmental strategies to avoid reaching “saturation points” where further progress in one domain no longer translates into gains in the other.
5. Discussion
5.1. Overview of the Main Findings
The present study advances the understanding of sustainable development trajectories in Europe by integrating domain-based indices with nonlinear modelling techniques. By applying principal component analysis, we derived latent constructs for the People, Planet, and Prosperity domains, thereby reducing dimensionality whilst preserving the conceptual integrity of the 2030 Agenda. Subsequent estimation with multivariate adaptive regression splines (MARS) uncovered a set of nonlinear and interaction effects that conventional linear approaches would have overlooked. The results demonstrate three central insights. First, the People domain emerges as the most decisive driver of overall SDG performance, with two critical thresholds indicating that gains in education, health, and social inclusion are particularly influential once a minimum level of development has been attained. Second, the Planet domain exerts asymmetric effects: environmental progress significantly improves sustainability outcomes, but only once certain conditions are met, and in some instances, trade-offs with economic prosperity become apparent. Third, Prosperity on its own contributes modestly, yet it plays a pivotal conditional role when combined with People, highlighting the contextual nature of economic growth in the sustainability transition.
5.2. Thresholds and Nonlinearities in SDG Progress
A distinctive contribution of this research lies in the identification of thresholds that shape the trajectory of sustainable development. For the People domain, the model indicates two inflexion points at approximately 0.597 and 0.839. The lower threshold marks the point at which incremental improvements in social conditions begin to generate measurable gains in the SDG Index. In contrast, the higher threshold reflects a critical juncture where additional investments yield disproportionately large benefits. This aligns with earlier work suggesting that social capacity—particularly education and health—functions as a catalyst for wider sustainability outcomes once a baseline is secured [6].
The Planet domain, in contrast, exhibits nonlinearities of a different character. Environmental performance displays diminishing returns, with gains concentrated once ecological indicators surpass mid-range values. Beyond these thresholds, the benefits of environmental progress may plateau, or even induce trade-offs with prosperity, echoing findings in the literature that emphasise the tensions between economic expansion and ecological integrity [9,16]. The Prosperity domain reveals yet another pattern: whilst its direct effect is comparatively weak, it becomes decisive in interaction with People, particularly at the extremes of the distribution. This conditionality suggests that economic growth and innovation only translate into broader sustainability when embedded in a socially inclusive context, corroborating insights from studies of European heterogeneity [7].
5.3. Comparisons with Existing Studies
A key contribution of this study lies in identifying critical thresholds and leverage zones within European sustainability dynamics. This threshold-based perspective provides an interpretive layer that earlier research, relying primarily on composite indices, could not fully capture. For instance, Gracia-de-Rentería et al. [6] document persistent disparities between Northern and Western Europe, on the one hand, and Southern and Eastern regions, on the other. Our results not only corroborate these imbalances but also explain them in structural terms: countries that remain below the People threshold of ~0.839 are confined to a “valley of underperformance,” whereas those surpassing it experience disproportionately rapid gains. In this way, our findings specify the mechanism underlying the divergence observed in regional studies.
The asymmetric role of the Planet domain offers a refinement similar to earlier work. Kudełko [7] highlighted that although EU member states have advanced in social and economic aspects since adopting the 2030 Agenda, environmental sustainability has fallen behind. Our model confirms this by showing that Planet's influence becomes significant only once intermediate ecological benchmarks are achieved. Below this level, environmental improvements provide modest gains; above it, they may even negatively interact with Prosperity, creating trade-offs that standard indices overlook. This threshold approach advances the debate by moving beyond mere descriptive trends to show how ecological progress becomes both conditional and nonlinear, as also demonstrated in [34,35,36].
Our findings on the conditionality of Prosperity likewise enrich prior scholarship. Grzebyk and Stec [8] noted that newer EU member states consistently ranked lower on composite sustainability measures, attributing this to weaker economic and social performance. Our results nuance this by showing that Prosperity alone exerts limited direct influence but becomes highly significant in interaction with People, particularly once social baselines are secured. This explains why countries with similar prosperity scores may diverge in outcomes depending on their social foundations.
Global studies also underscore the broader implications of these dynamics. Zhou [9] emphasises the delayed and nonlinear nature of ecological indicators, while Idris and Razak [10] and Saeed [11] utilise spline-based techniques to reveal threshold effects in Asia and other regions. Our analysis places Europe clearly within this global pattern but broadens the methodological approach by explicitly identifying zones of underperformance, steady progress, and instability. This enables us to provide a more accurate account of where and when policy actions are most likely to produce a systemic impact, moving beyond the simple linear comparisons that feature in earlier evaluations.
5.4. Policy Implications
The identification of thresholds and interaction zones has direct relevance for the design of sustainability strategies across Europe. Our findings indicate that sustainable development does not advance incrementally but rather accelerates once critical breakpoints are surpassed. This suggests that European policies should prioritise enabling countries to cross decisive thresholds in social and environmental performance rather than distributing marginal improvements uniformly.
The most prominent leverage point lies in the People domain. Once the threshold of approximately 0.839 is exceeded, improvements in education, health, and social inclusion generate steep accelerations in overall SDG performance. This highlights the centrality of investing in human capital and reducing inequalities across the continent, particularly in regions of Central and Eastern Europe that remain below this social frontier.
The Planet domain functions as both a stabiliser and a constraint. Maintaining environmental indicators within a moderate band is critical: ecological deficits undermine social and economic gains, while even highly positive but unstable transitions can destabilise progress. This reinforces the importance of coordinated climate and environmental strategies across Europe—not only within the EU but also in neighbouring countries—since sustainability gains are conditional upon ecological stability.
Prosperity emerges as a conditional contributor. Economic growth and innovation support sustainability only when embedded within robust social and environmental foundations. For Europe, this means that growth-oriented strategies must be coupled with policies that strengthen inclusiveness and ecological resilience; otherwise, material prosperity will fail to translate into long-term sustainable development.
Taken together, these results indicate that Europe’s trajectory towards the 2030 Agenda requires integrated, cross-domain approaches. Policies that jointly target human development, ecological balance, and inclusive prosperity will unlock the most substantial synergies. By contrast, strategies privileging one domain at the expense of others risk deepening structural asymmetries and slowing continental progress.
Beyond the European context, the methodological framework developed in this study has broader applicability. Recent analyses in Asia [10,11] also highlight nonlinear and conditional dynamics in sustainability transitions, albeit shaped by different demographic pressures and institutional conditions. By explicitly identifying threshold effects and interaction zones, our PCA–MARS approach offers a transferable tool for diagnosing leverage points across diverse regions. While the precise locations of thresholds will inevitably vary, the underlying insight—that sustainable development accelerates once critical baselines in social, environmental, or economic dimensions are surpassed—remains generalisable. In this sense, Europe serves as a test case. Still, the policy implications extend globally, suggesting that targeted interventions aligned with tipping dynamics can accelerate SDG progress in other regions as well.
5.5. Limitations and Future Research Directions
Whilst the present study advances understanding of threshold-driven and interaction-based dynamics in European sustainable development, several limitations should be acknowledged. First, the analysis relies on composite indices derived from PCA, which, although effective in reducing dimensionality, inevitably simplify the complexity of the underlying SDG indicators. Future work could test the robustness of these findings using alternative weighting schemes or non-linear dimensionality reduction methods.
Second, the exclusion of specific goals (e.g., SDG 14 due to data gaps for landlocked countries) and incomplete coverage for indicators (such as SDG 1-Poverty in Ukraine) may limit the generalizability of the results. Expanding the dataset to include more comprehensive and harmonised measures would strengthen the reliability of cross-country comparisons.
Third, although the MARS approach effectively captures nonlinearities and interactions, it remains a data-driven technique. The identification of knots and breakpoints, while empirically valid, does not fully capture the institutional or political mechanisms through which such thresholds operate. A fruitful avenue for future research is to combine spline-based modelling with qualitative or institutional analyses to understand better the causal pathways underlying observed patterns.
Finally, this study adopts a continental perspective, treating Europe as a whole. While this provides valuable insights into structural drivers of sustainability, it inevitably abstracts from subnational and regional heterogeneities. Further research could therefore extend the analysis to regional and local scales, exploring how thresholds and synergies manifest differently across territories.
Taken together, these limitations point towards promising directions for future scholarship: developing more nuanced measurement frameworks, integrating political and institutional factors, and examining dynamics at multiple scales. Such advances would not only refine the methodological toolkit but also enhance the policy relevance of sustainability research in Europe and beyond.
6. Conclusions
This study set out to examine the dynamics of sustainable development across Europe by moving beyond aggregate indices and linear modelling. Using principal component analysis to construct latent domain indices and Multivariate Adaptive Regression Splines to capture nonlinearities and interactions, we provide a framework capable of revealing critical thresholds, inflexion points, and conditional synergies among the People, Planet, and Prosperity dimensions.
The results show that European sustainability performance is strongly threshold-driven. Social progress exerts a dominant role, with transformative effects emerging only once critical baselines are surpassed. Environmental performance functions as both an enabler and a constraint, stabilising outcomes at moderate levels but amplifying vulnerabilities at the extremes. Economic prosperity proves contingent: while growth and innovation can reinforce progress, they yield sustainable gains only when embedded in strong social foundations and ecological stability. Crucially, our analysis demonstrates that sustainable development cannot be understood as the sum of independent domain effects but as the outcome of their interactions.
By identifying leverage zones and asymmetries, the study offers actionable insights for policy. It suggests that investments targeted at lifting countries above key social thresholds, maintaining ecological balance, and coupling prosperity with social readiness represent the most effective strategy for accelerating progress towards the 2030 Agenda.
Taken together, the results highlight both the empirical and conceptual contributions of this study. They show that Europe’s progress towards the 2030 Agenda is neither linear nor evenly distributed, but governed by critical thresholds and contingent interactions across the social, environmental, and economic domains. By identifying the leverage points at which minor improvements generate disproportionately large gains, our analysis reframes sustainable development as a process shaped by tipping dynamics rather than incremental accumulation. This insight moves the debate beyond composite rankings and static comparisons, offering a framework that is at once diagnostic and prescriptive. For policymakers, the message is clear: investing in social foundations, safeguarding ecological stability, and aligning prosperity with these conditions will yield transformative outcomes, whereas siloed strategies risk perpetuating stagnation. More broadly, the approach illustrates how data-driven methods such as MARS can uncover the structural logics of sustainability, providing a roadmap not only for Europe but also for other regions grappling with the complexity of achieving the Sustainable Development Goals.
Author Contributions
Conceptualisation, O.L., O.P., K.P., T.L., R.S. M.N. and N.H.; methodology, O.L., O.P., K.P., T.L., R.S. M.N. and N.H.; software, O.L., O.P., K.P., T.L., R.S. M.N. and N.H.; validation, O.L., O.P., K.P., T.L., R.S. M.N. and N.H.; formal analysis, O.L., O.P., K.P., T.L., R.S. M.N. and N.H.; investigation, O.L., O.P., K.P., T.L., R.S. M.N. and N.H.; resources, O.L., O.P., K.P., T.L., R.S. M.N. and N.H.; data curation, O.L., O.P., K.P., T.L., R.S. M.N. and N.H.; writing—original draft preparation, O.L., O.P., K.P., T.L., R.S. M.N. and N.H.; writing—review and editing, O.L., O.P., K.P., T.L., R.S. M.N. and N.H.; visualization, O.L., O.P., K.P., T.L., R.S. M.N. and N.H.; supervision, O.L., O.P., K.P., T.L., R.S. M.N. and N.H.; project administration, O.L., O.P., K.P., T.L., R.S. M.N. and N.H.; funding acquisition, M.N. and N.H. All authors have read and agreed to the published version of the manuscript.
Funding
This work was supported by a subsidy from the Ministry of Education and Science for the School of Business - National-Louis University in Nowy Sącz (Project No. 213/56upo_2025).
Data Availability Statement
The data used in this study are publicly available from the United Nations Global SDG Database at: https://unstats.un.org/sdgs/dataportal. In accordance with the licensing conditions of the United Nations, the authors do not hold the rights to redistribute the dataset. Researchers are therefore encouraged to access it directly through the official portal. All statistical analyses and graphical visualisations were performed using TIBCO© Statistica version 12, operating under a proprietary licence. The complete output files and supplementary material generated during the analysis are available from the corresponding author upon reasonable request.
Acknowledgments
This research has been financed through the MSCA4Ukraine project, funded by the European Union. However, views and opinions expressed herein are those of the authors only and do not necessarily reflect those of the European Union. Neither the European Union nor the MSCA4Ukraine Consortium, nor any individual member institution of the MSCA4Ukraine Consortium, can be held responsible for these views.
Conflicts of Interest
The authors declare that they have no conflicts of interest.
References
- United Nations. Transforming Our World: The 2030 Agenda for Sustainable Development; United Nations: New York, NY, USA, 2015. [Google Scholar]
- Sachs, J.; Schmidt-Traub, G.; Kroll, C.; Lafortune, G.; Fuller, G. Sustainable Development Report 2023: Implementing the SDG Stimulus; Paris: SDSN, Dublin: Dublin University Press, 2023. [Google Scholar] [CrossRef]
- Sachs, J.; Kroll, C.; Lafortune, G.; Fuller, G. The Sustainable Development Goals and COVID-19. Sustain. Dev. Rep. 2022, 1–52. [Google Scholar]
- Griggs, D.; Nilsson, M.; Stevance, A.; McCollum, D. A Guide to SDG Interactions: From Science to Implementation; International Council for Science (ICSU): Paris, France, 2017; Available online: https://council.science/wp-content/uploads/2017/05/SDGs-Guide-to-Interactions.pdf (accessed on 28 June 2025).
- Miola, A.; Schiltz, F. Measuring Sustainable Development Goals Performance: How to Monitor Policy action in the 2030 agenda implementation? Ecol. Econ. 2019, 164, 106373. [Google Scholar] [CrossRef] [PubMed]
- Gracia-de-Rentería, P.; Ramos, R.; Artal-Tur, A. Sustainable Development Goals in the European Union and Its Regions: Measuring Progress and Spatial Disparities. Sustain. Dev. 2023, 31, 456–472. [Google Scholar] [CrossRef]
- Kudełko, J. Development Sustainability Levels in EU Countries. Sustain. Dev. 2024, 32, 1234–1251. [Google Scholar] [CrossRef]
- Grzebyk, M.; Stec, M. Sustainable Development in EU Countries: Concept and Rating of Levels of Development. Sustain. Dev. 2015, 23, 110–123. [Google Scholar] [CrossRef]
- Zhou, K.; Chen, H.; Ismail, M.; Yang, T. Assessment of Sustainable Development Levels, Country Disparities, and Dynamic Evolution Trends of ASEAN-10 Countries. Sustain. Dev. 2025, 0, 1–22. [Google Scholar] [CrossRef]
- Idris, A.; Razak, A.R. Energy Transition, Green Growth and Emission on Economic Growth Using Spline Approach: Evidence from Asia-Pacific Countries. Econ. Innov. Econ. Res. J. 2025, 13, 139–159. [Google Scholar] [CrossRef]
- Saeed, U.F. Achieving SDGs in Developing Economies: A CS-ARDL Analysis of the Effects of Industrial Growth and Foreign Investment on Carbon and Ecological Footprints. J. Sustain. Financ. Account. 2025, 8, 100025. [Google Scholar] [CrossRef]
- Barbier, E.B.; Burgess, J.C. Sustainable Development and the Dynamics of Economic and Environmental Systems. Environ. Dev. Econ. 2019, 24, 451–470. [Google Scholar] [CrossRef]
- Allen, C.; Metternicht, G.; Wiedmann, T. Initial Progress in Implementing the Sustainable Development Goals (SDGs): A Review of Evidence from Countries. Sustain. Sci. 2018, 13, 1453–1467. [Google Scholar] [CrossRef]
- Lopatkova, Y. (2021). Achieving sustainable development: a baseline analysis of Western and Eastern European countries. R-Economy, 7(1), 18-27. [CrossRef]
- Fukuda-Parr, S., & McNeill, D. (2019). Knowledge and politics in setting and measuring SDGs: Introduction to special issue. Global Policy, 10(S1), 5–15. [CrossRef]
- Biermann, F.; Kim, R.E. Architectures of Earth System Governance: Institutional Complexity and Structural Transformation. Curr. Opin. Environ. Sustain. 2020, 42, 51–57. [Google Scholar] [CrossRef]
- United Nations. Sustainable Development Goals Knowledge Platform: 5P Approach (People, Planet, Prosperity, Peace, Partnerships); Available online: https://sdgs.un.org/ (accessed 28 June 2025).
- Carlsen, L. (2022). The state of the ‘Prosperity’ pillar by 2022: A partial ordering-based analysis of the sustainable development goals 7–11. Journal of Cleaner Production, 368, 133140. [CrossRef]
- Liashenko, O.; Mykhailovska, O.; Shestakovska, T.; Selyutin, S. Effectiveness of Governance vs. Social Development: A Multivariate Approach to Countries’ Classification. Adm. Manag. Public 2024, 42, 6–24. [Google Scholar] [CrossRef]
- Trane, M.; Marelli, L.; Siragusa, A.; Pollo, R.; Lombardi, P. Progress by Research to Achieve the Sustainable Development Goals in the EU: A Systematic Literature Review. Sustainability 2023, 15, 7055. [Google Scholar] [CrossRef]
- Mazziotta, M.; Pareto, A. Methods for Constructing Composite Indices: One for All or All for One? Ital. Econ. J. 2016, 2, 229–253. [Google Scholar]
- Mazziotta, M. and Pareto, A. (2018). Use and misuse of PCA for measuring well-being. Social Indicators Research, 142(2), 451-476. [CrossRef]
- Mazziotta, M. and Pareto, A. (2015). Methods for constructing non-compensatory composite indices: a comparative study. Forum for Social Economics, 45(2-3), 213-229. [CrossRef]
- Jolliffe, I.T.; Cadima, J. Principal Component Analysis: A Review and Recent Developments. Philos. Trans. R. Soc. A 2016, 374, 20150202. [Google Scholar] [CrossRef] [PubMed]
- Kroll, C., Warchold, A., & Pradhan, P. (2019). Sustainable development goals (SDGs): Are we successful in turning trade-offs into synergies? Palgrave Communications, 5(1), 140. [CrossRef]
- Dörgő, G., Sebestyén, V. and Abonyi, J. (2018). Evaluating the interconnectedness of the Sustainable Development Goals based on the causality analysis of sustainability indicators. Sustainability, 10(10), 3766. [CrossRef]
- Le Blanc, D. Towards Integration at Last? The Sustainable Development Goals as a Network of Targets. Sustain. Dev. 2015, 23, 176–187. [Google Scholar] [CrossRef]
- OECD. Measuring Distance to the SDG Targets 2019: An Assessment of Where OECD Countries Stand; OECD Publishing: Paris, France, 2019. [Google Scholar] [CrossRef]
- Hastie, T.; Tibshirani, R.; Friedman, J. The Elements of Statistical Learning: Data Mining, Inference, and Prediction; Springer: New York, NY, USA, 2001. [Google Scholar] [CrossRef]
- Perperoglou, A.; Sauerbrei, W.; Abrahamowicz, M. A Review of Spline Function Procedures in R. BMC Med. Res. Methodol. 2019, 19, 46. [Google Scholar] [CrossRef] [PubMed]
- Naser, A.; Badr, A.; Henedy, S.N.; Ostrowski, K.A.; Imran, H. Application of Multivariate Adaptive Regression Splines (MARS) Approach in Prediction of Compressive Strength of Eco-Friendly Concrete. Case Stud. Constr. Mater. 2022, 17, e01262. [Google Scholar] [CrossRef]
- Eilers, P.H.C.; Marx, B.D. Splines, Knots, and Penalties. Wiley Interdiscip. Rev. Comput. Stat. 2010, 2, 637–653. [Google Scholar] [CrossRef]
- Friedman, J.H. Multivariate Adaptive Regression Splines. Ann. Stat. 1991, 19, 1–67. [Google Scholar] [CrossRef]
- Griggs, D.; Nilsson, M.; Stevance, A.; McCollum, D. A Guide to SDG Interactions: From Science to Implementation; International Council for Science (ICSU): Paris, France, 2017. Available online: https://council.science/wp-content/uploads/2017/05/SDGs-Guide-to-Interactions.pdf (accessed 28 June 2025).
- Liashenko, O.; Dluhopolskyi, O. The Statistical Approach to Understanding the Interdependencies among Sustainable Development Goals. Economics—Innovative and Economics Research Journal 2025, 13(3), 449–467. [CrossRef]
- Sala, D.; Liashenko, O.; Pyzalski, M.; Pavlov, K.; Pavlova, O.; Durczak, K.; Chornyi, R. The Energy Footprint in the EU: How CO2 Emission Reductions Drive Sustainable Development. Energies 2025, 18, 3110. [Google Scholar] [CrossRef]
Figure 1.
Response surface of the MARS model showing the joint effect of Planet and Prosperity on the SDG Index. Note: The SDG Index rises steeply with higher Planet values, while the marginal contribution of Prosperity is conditional and even turns negative under extreme environmental conditions.
Figure 1.
Response surface of the MARS model showing the joint effect of Planet and Prosperity on the SDG Index. Note: The SDG Index rises steeply with higher Planet values, while the marginal contribution of Prosperity is conditional and even turns negative under extreme environmental conditions.
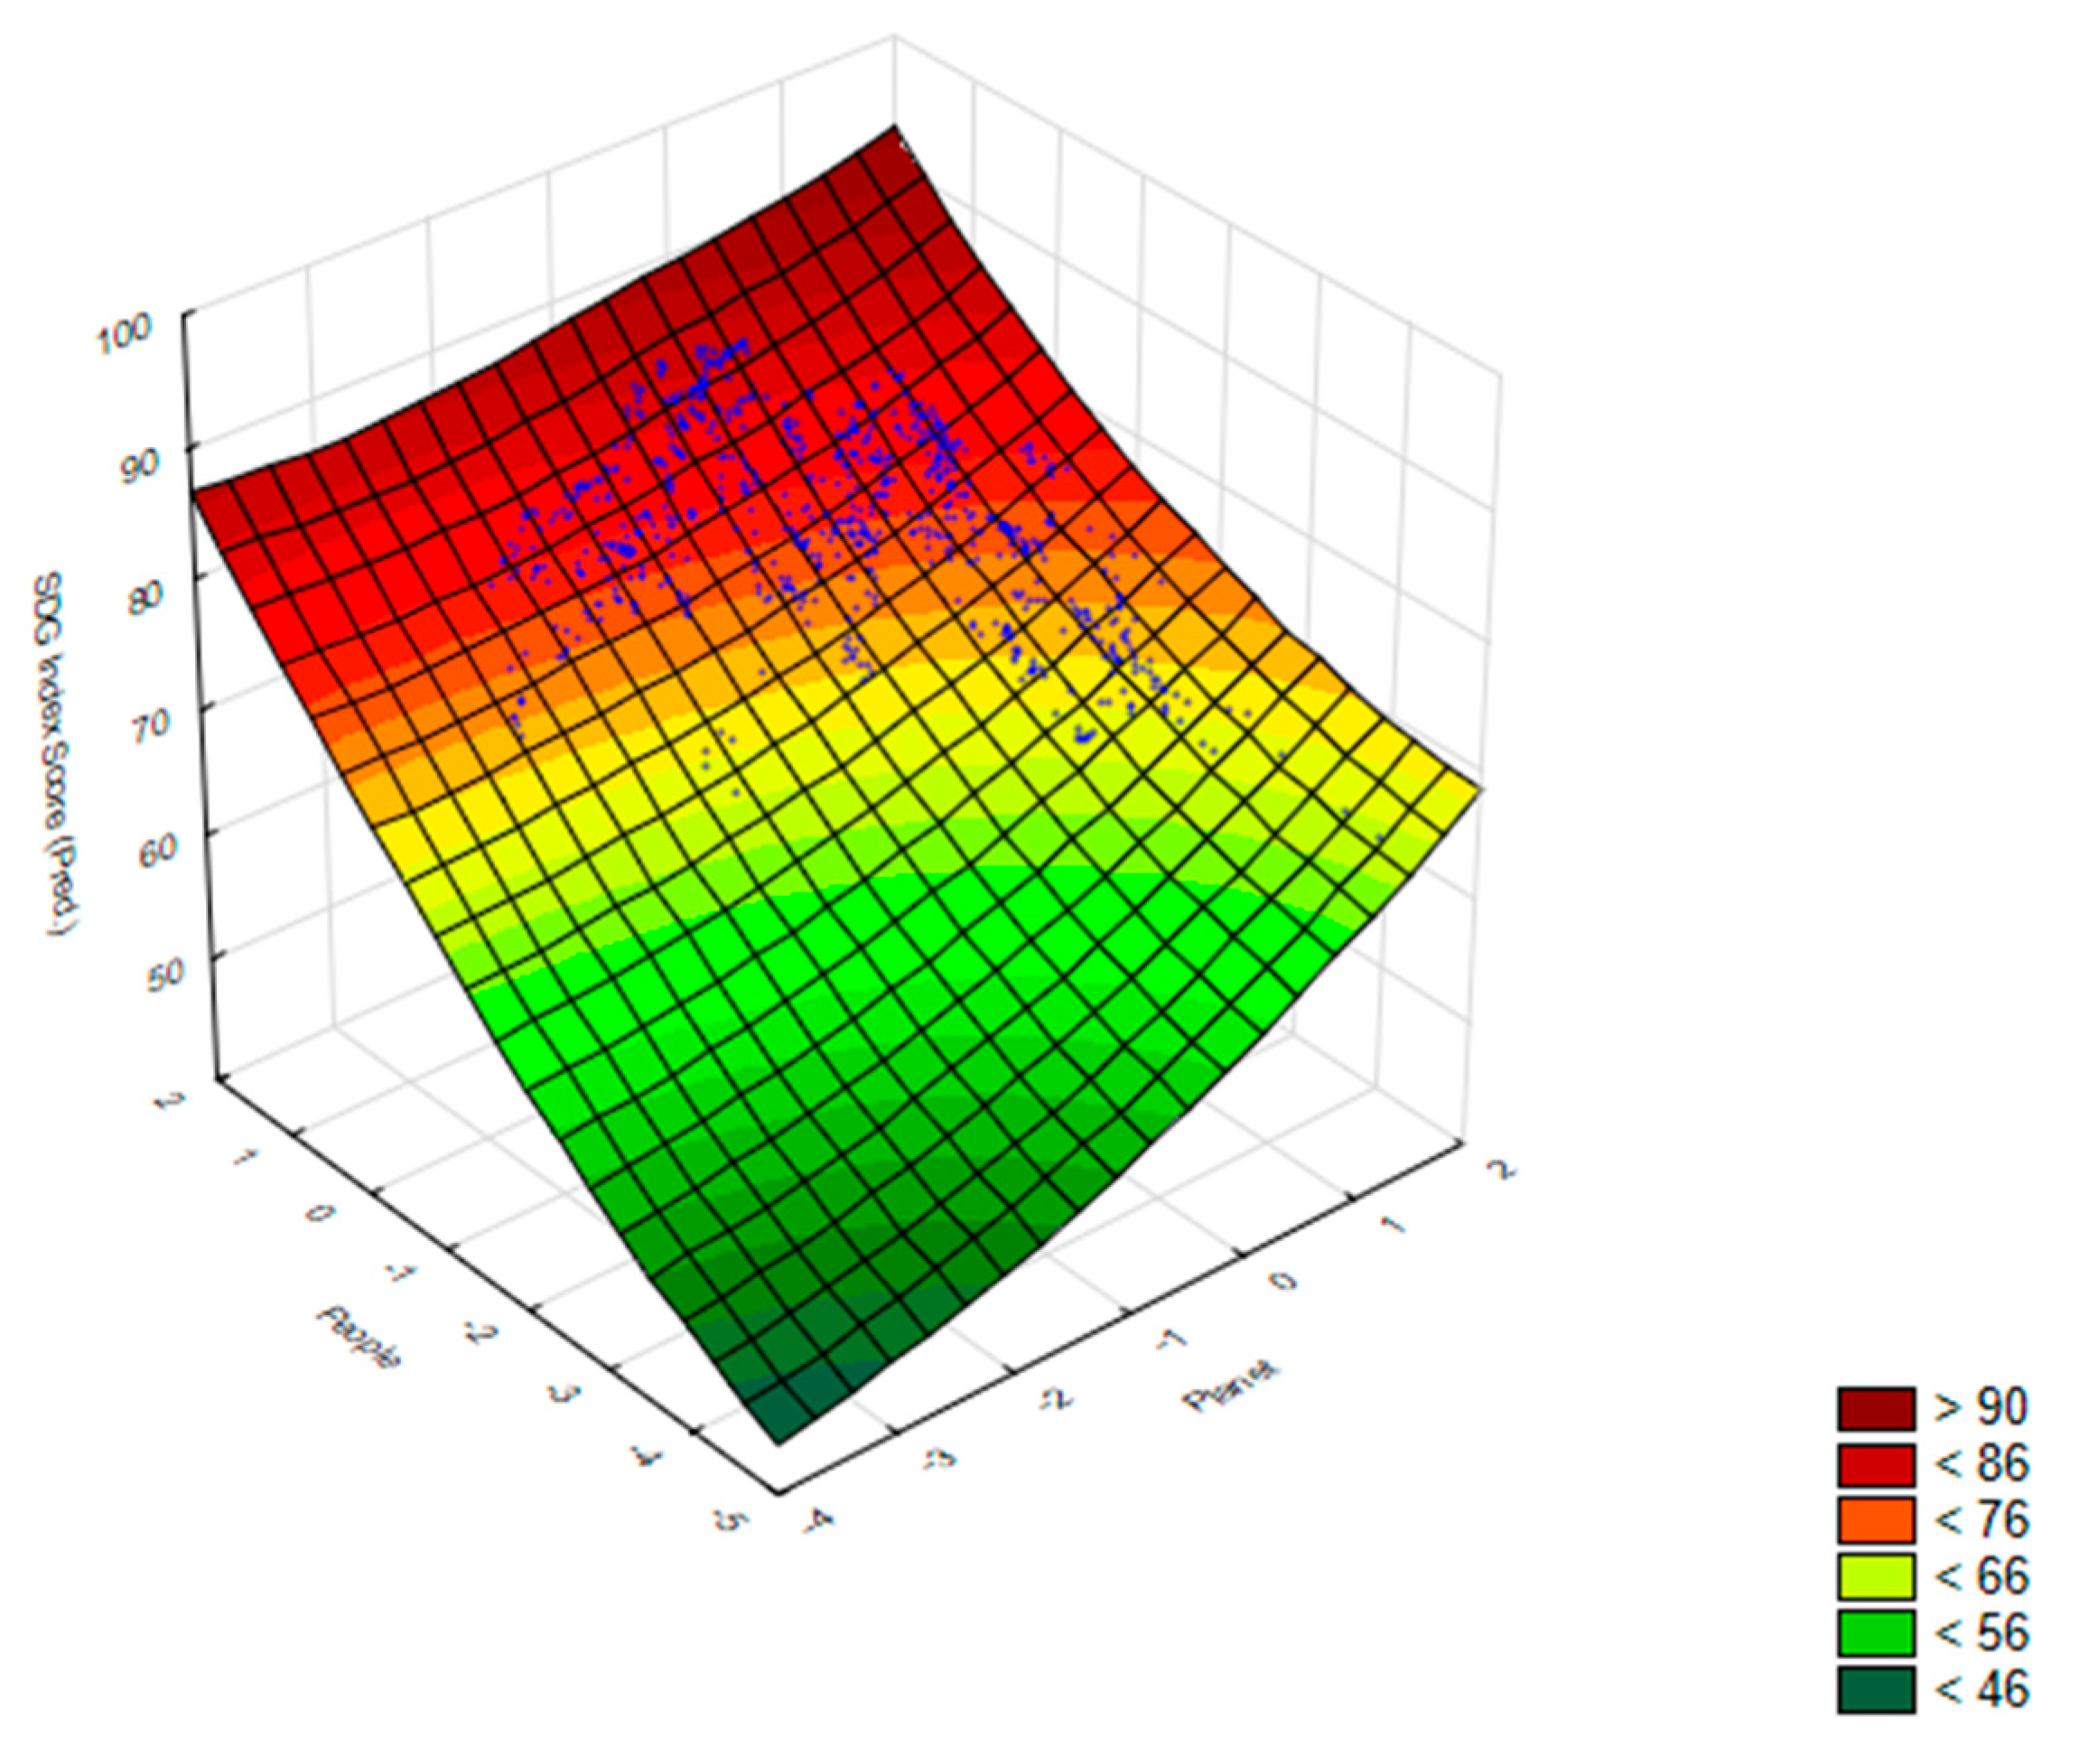
Figure 2.
Response surface of the MARS model showing the interaction between People and Planet on the SDG Index. Note: A sharp upward slope emerges once People exceed the critical threshold (~0.839).
Figure 2.
Response surface of the MARS model showing the interaction between People and Planet on the SDG Index. Note: A sharp upward slope emerges once People exceed the critical threshold (~0.839).
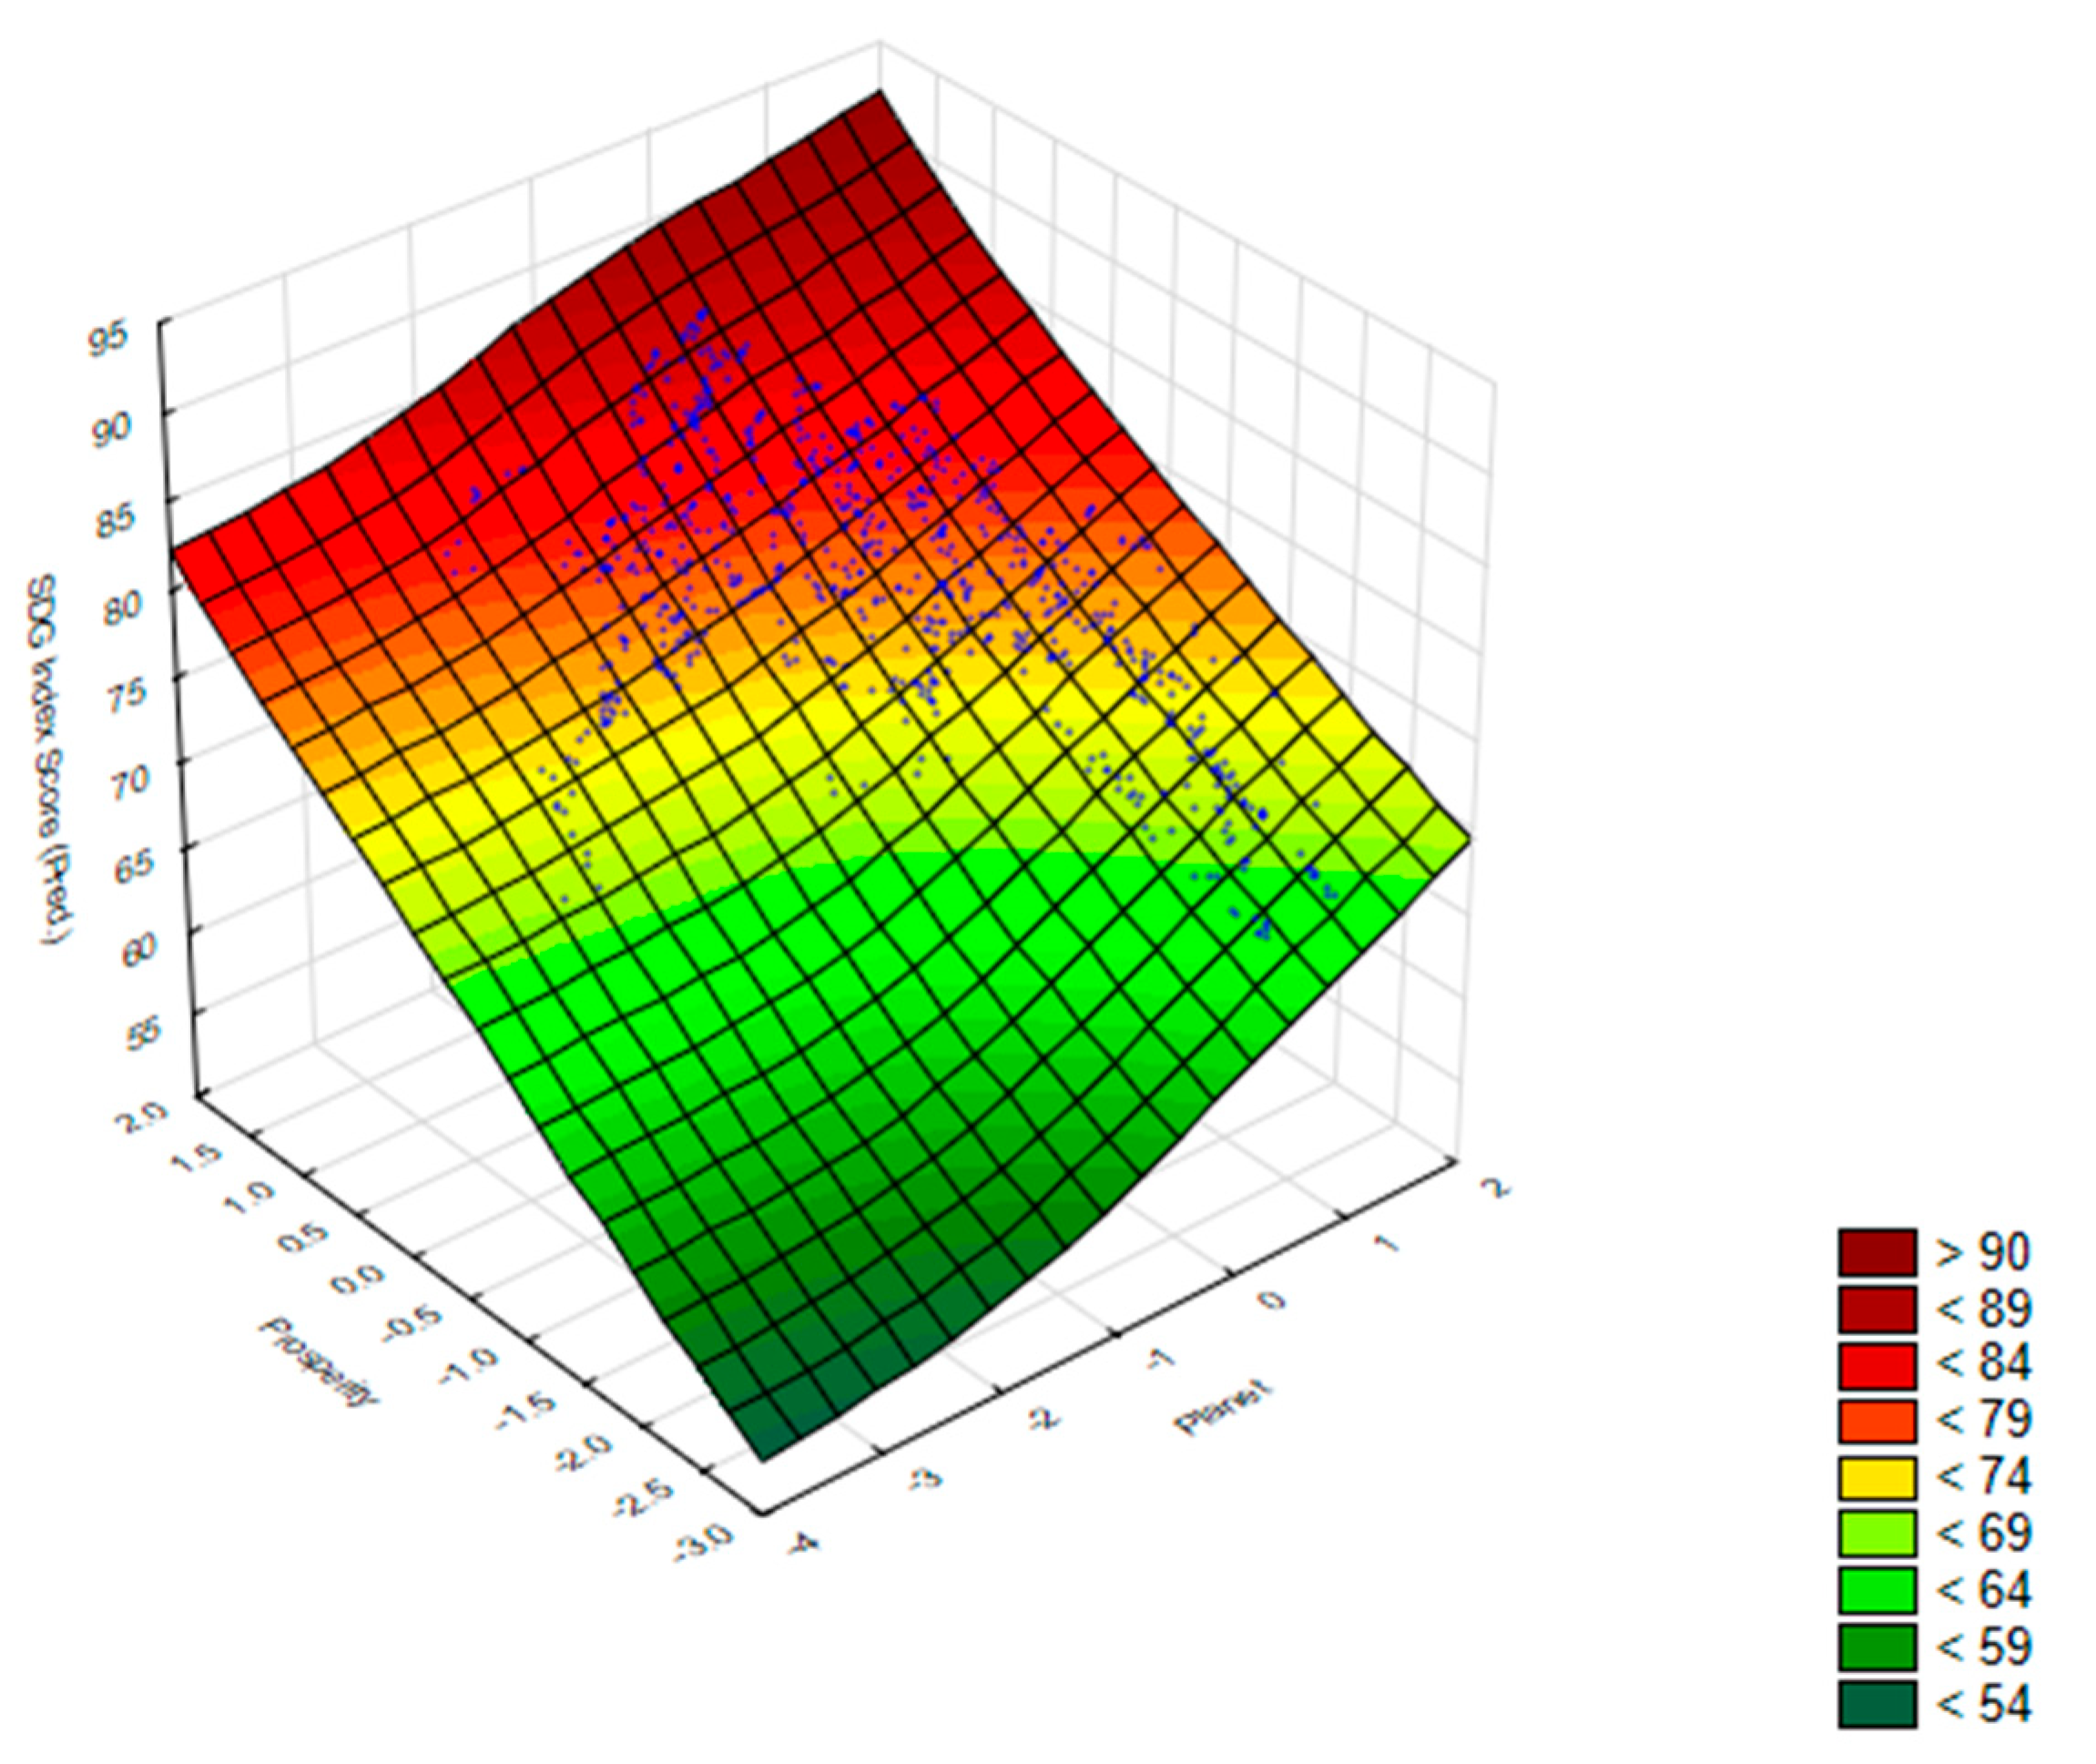
Figure 3.
Response surface of the MARS model showing the joint effect of People and Prosperity on the SDG Index. Note: The highest values occur when both domains simultaneously surpass their thresholds.
Figure 3.
Response surface of the MARS model showing the joint effect of People and Prosperity on the SDG Index. Note: The highest values occur when both domains simultaneously surpass their thresholds.
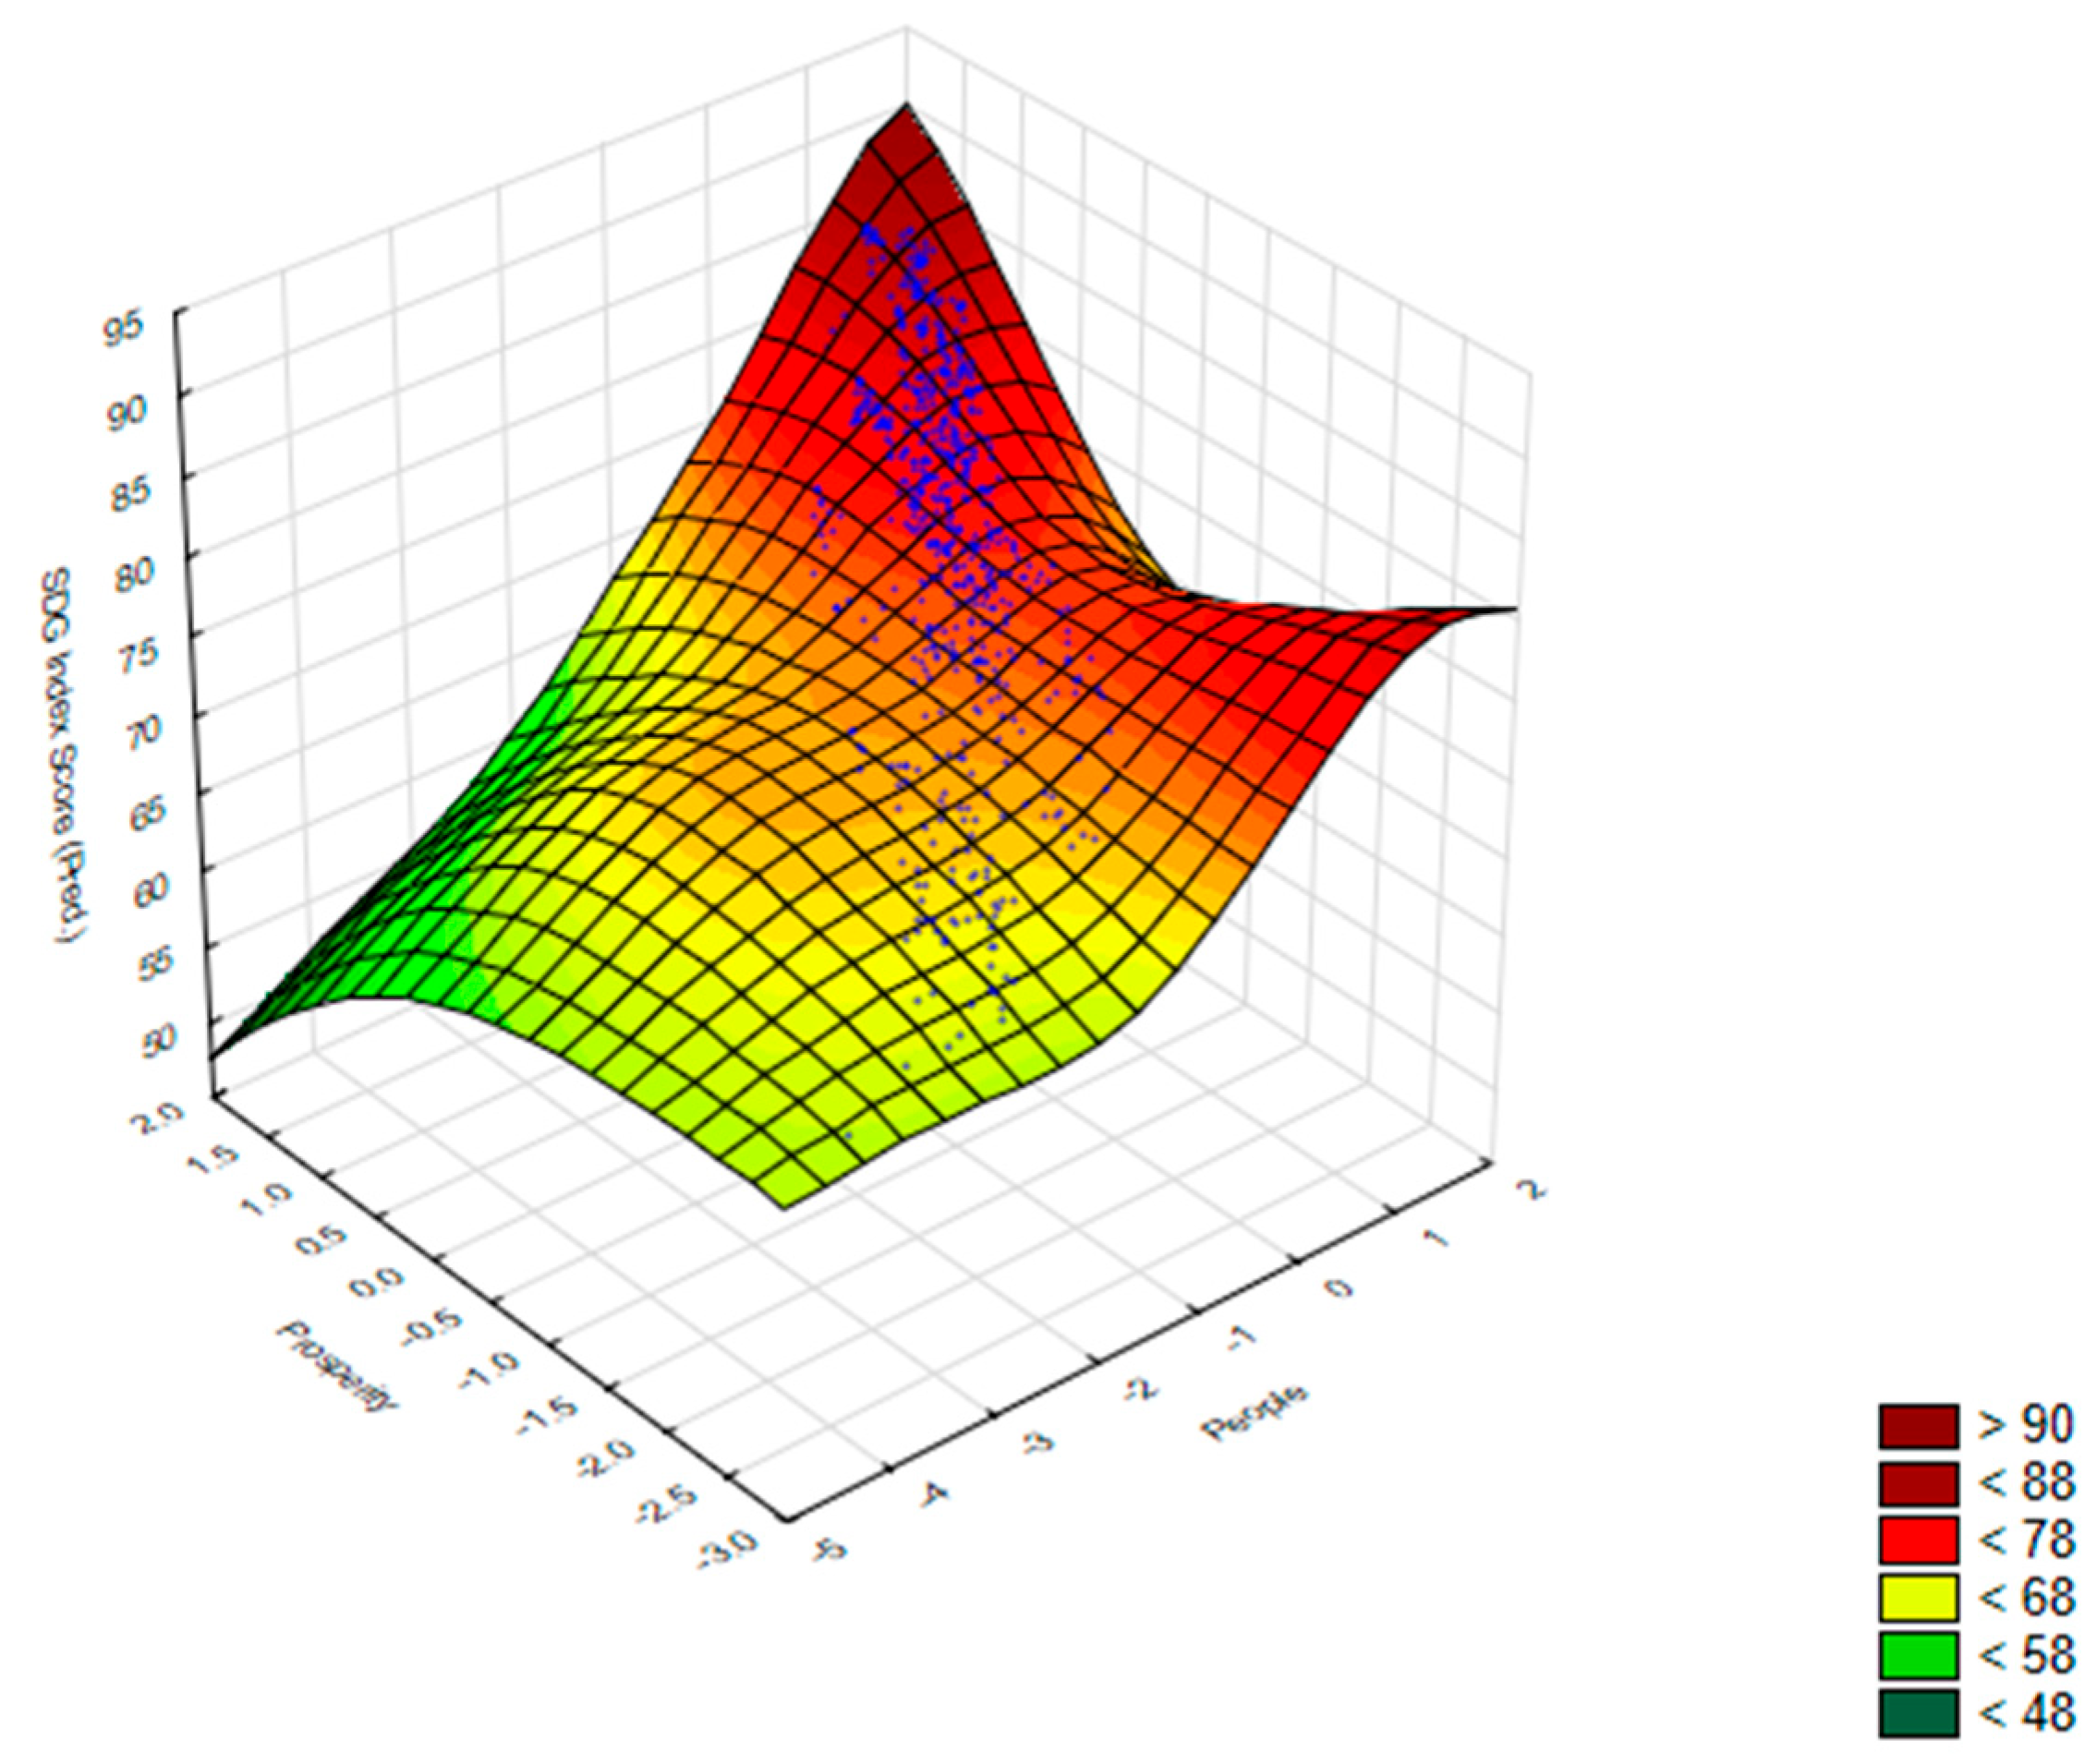
Figure 4.
Scatter plot of People vs. Prosperity with fitted regression line and 95% confidence ellipse. The close alignment indicates a strong positive correlation (r ≈ 0.91).
Figure 4.
Scatter plot of People vs. Prosperity with fitted regression line and 95% confidence ellipse. The close alignment indicates a strong positive correlation (r ≈ 0.91).
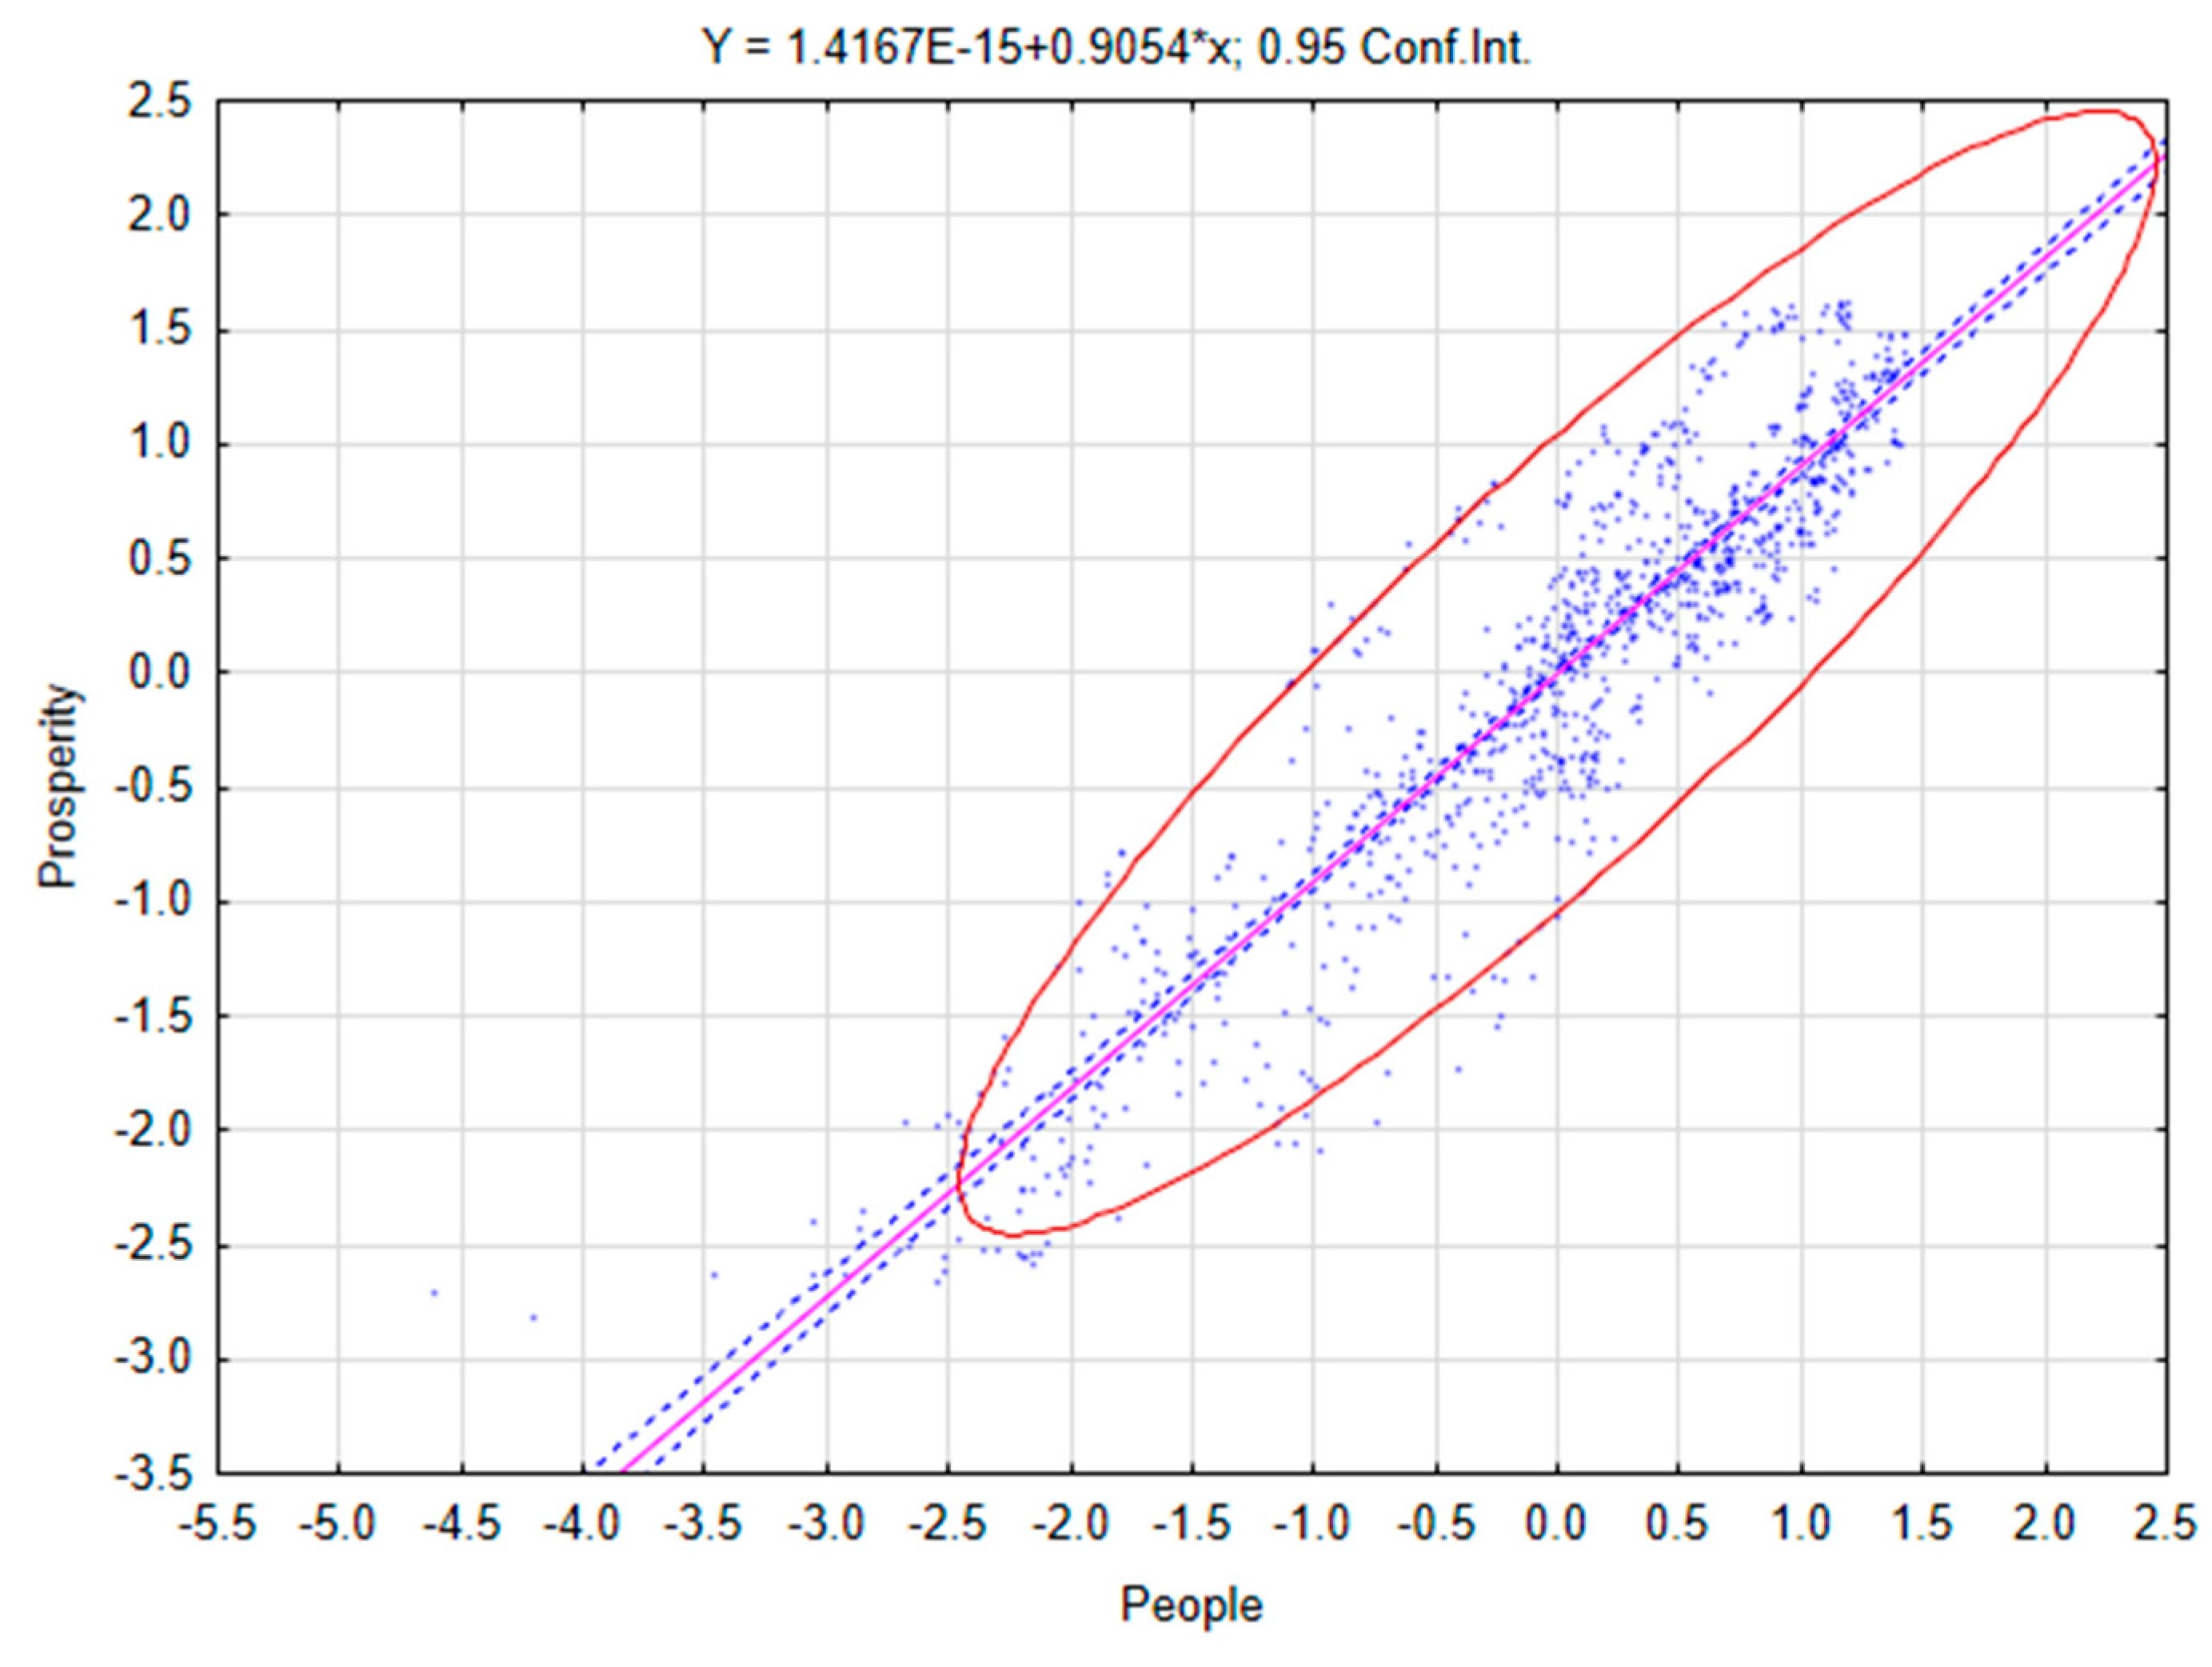
Figure 5.
Scatter plot of Planet vs. Prosperity with quadratic fit and 95% confidence ellipse. The negative slope at higher Planet values suggests a trade-off between environmental and economic performance.
Figure 5.
Scatter plot of Planet vs. Prosperity with quadratic fit and 95% confidence ellipse. The negative slope at higher Planet values suggests a trade-off between environmental and economic performance.
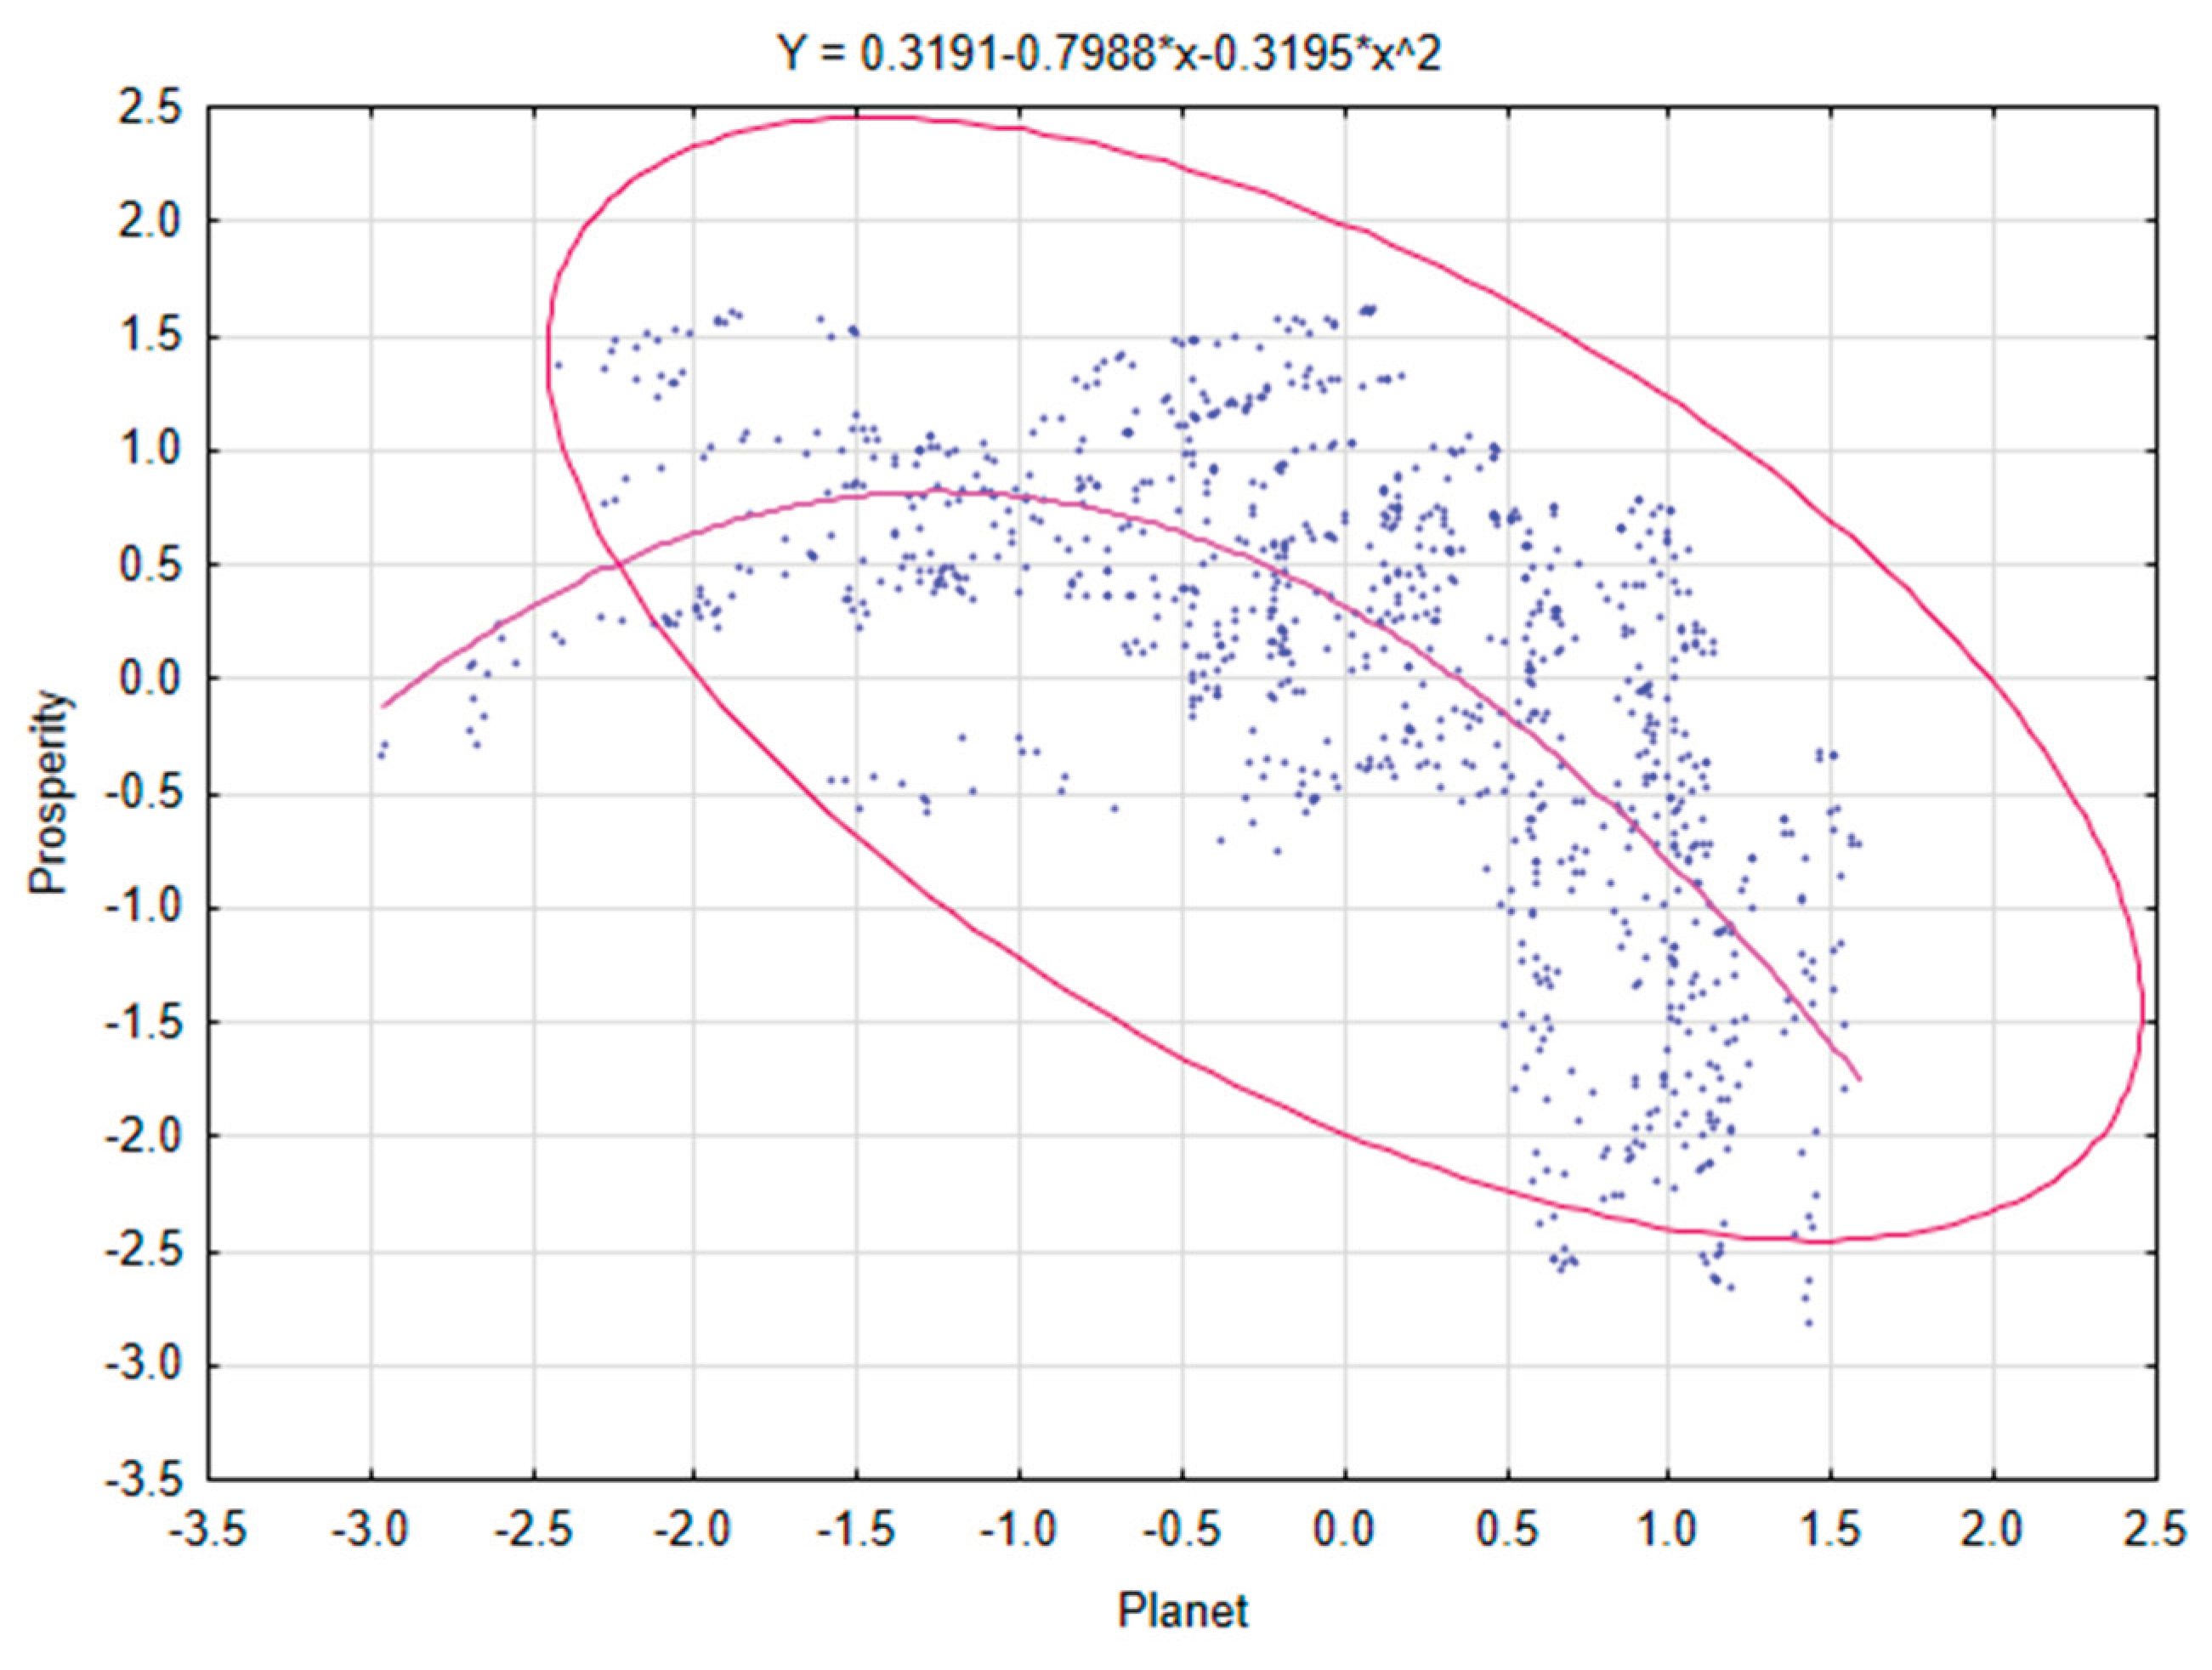
Figure 6.
Scatter plot of Planet vs. People with quadratic fit and 95% confidence ellipse. The curve suggests diminishing returns and trade-offs at higher values of Planet.
Figure 6.
Scatter plot of Planet vs. People with quadratic fit and 95% confidence ellipse. The curve suggests diminishing returns and trade-offs at higher values of Planet.
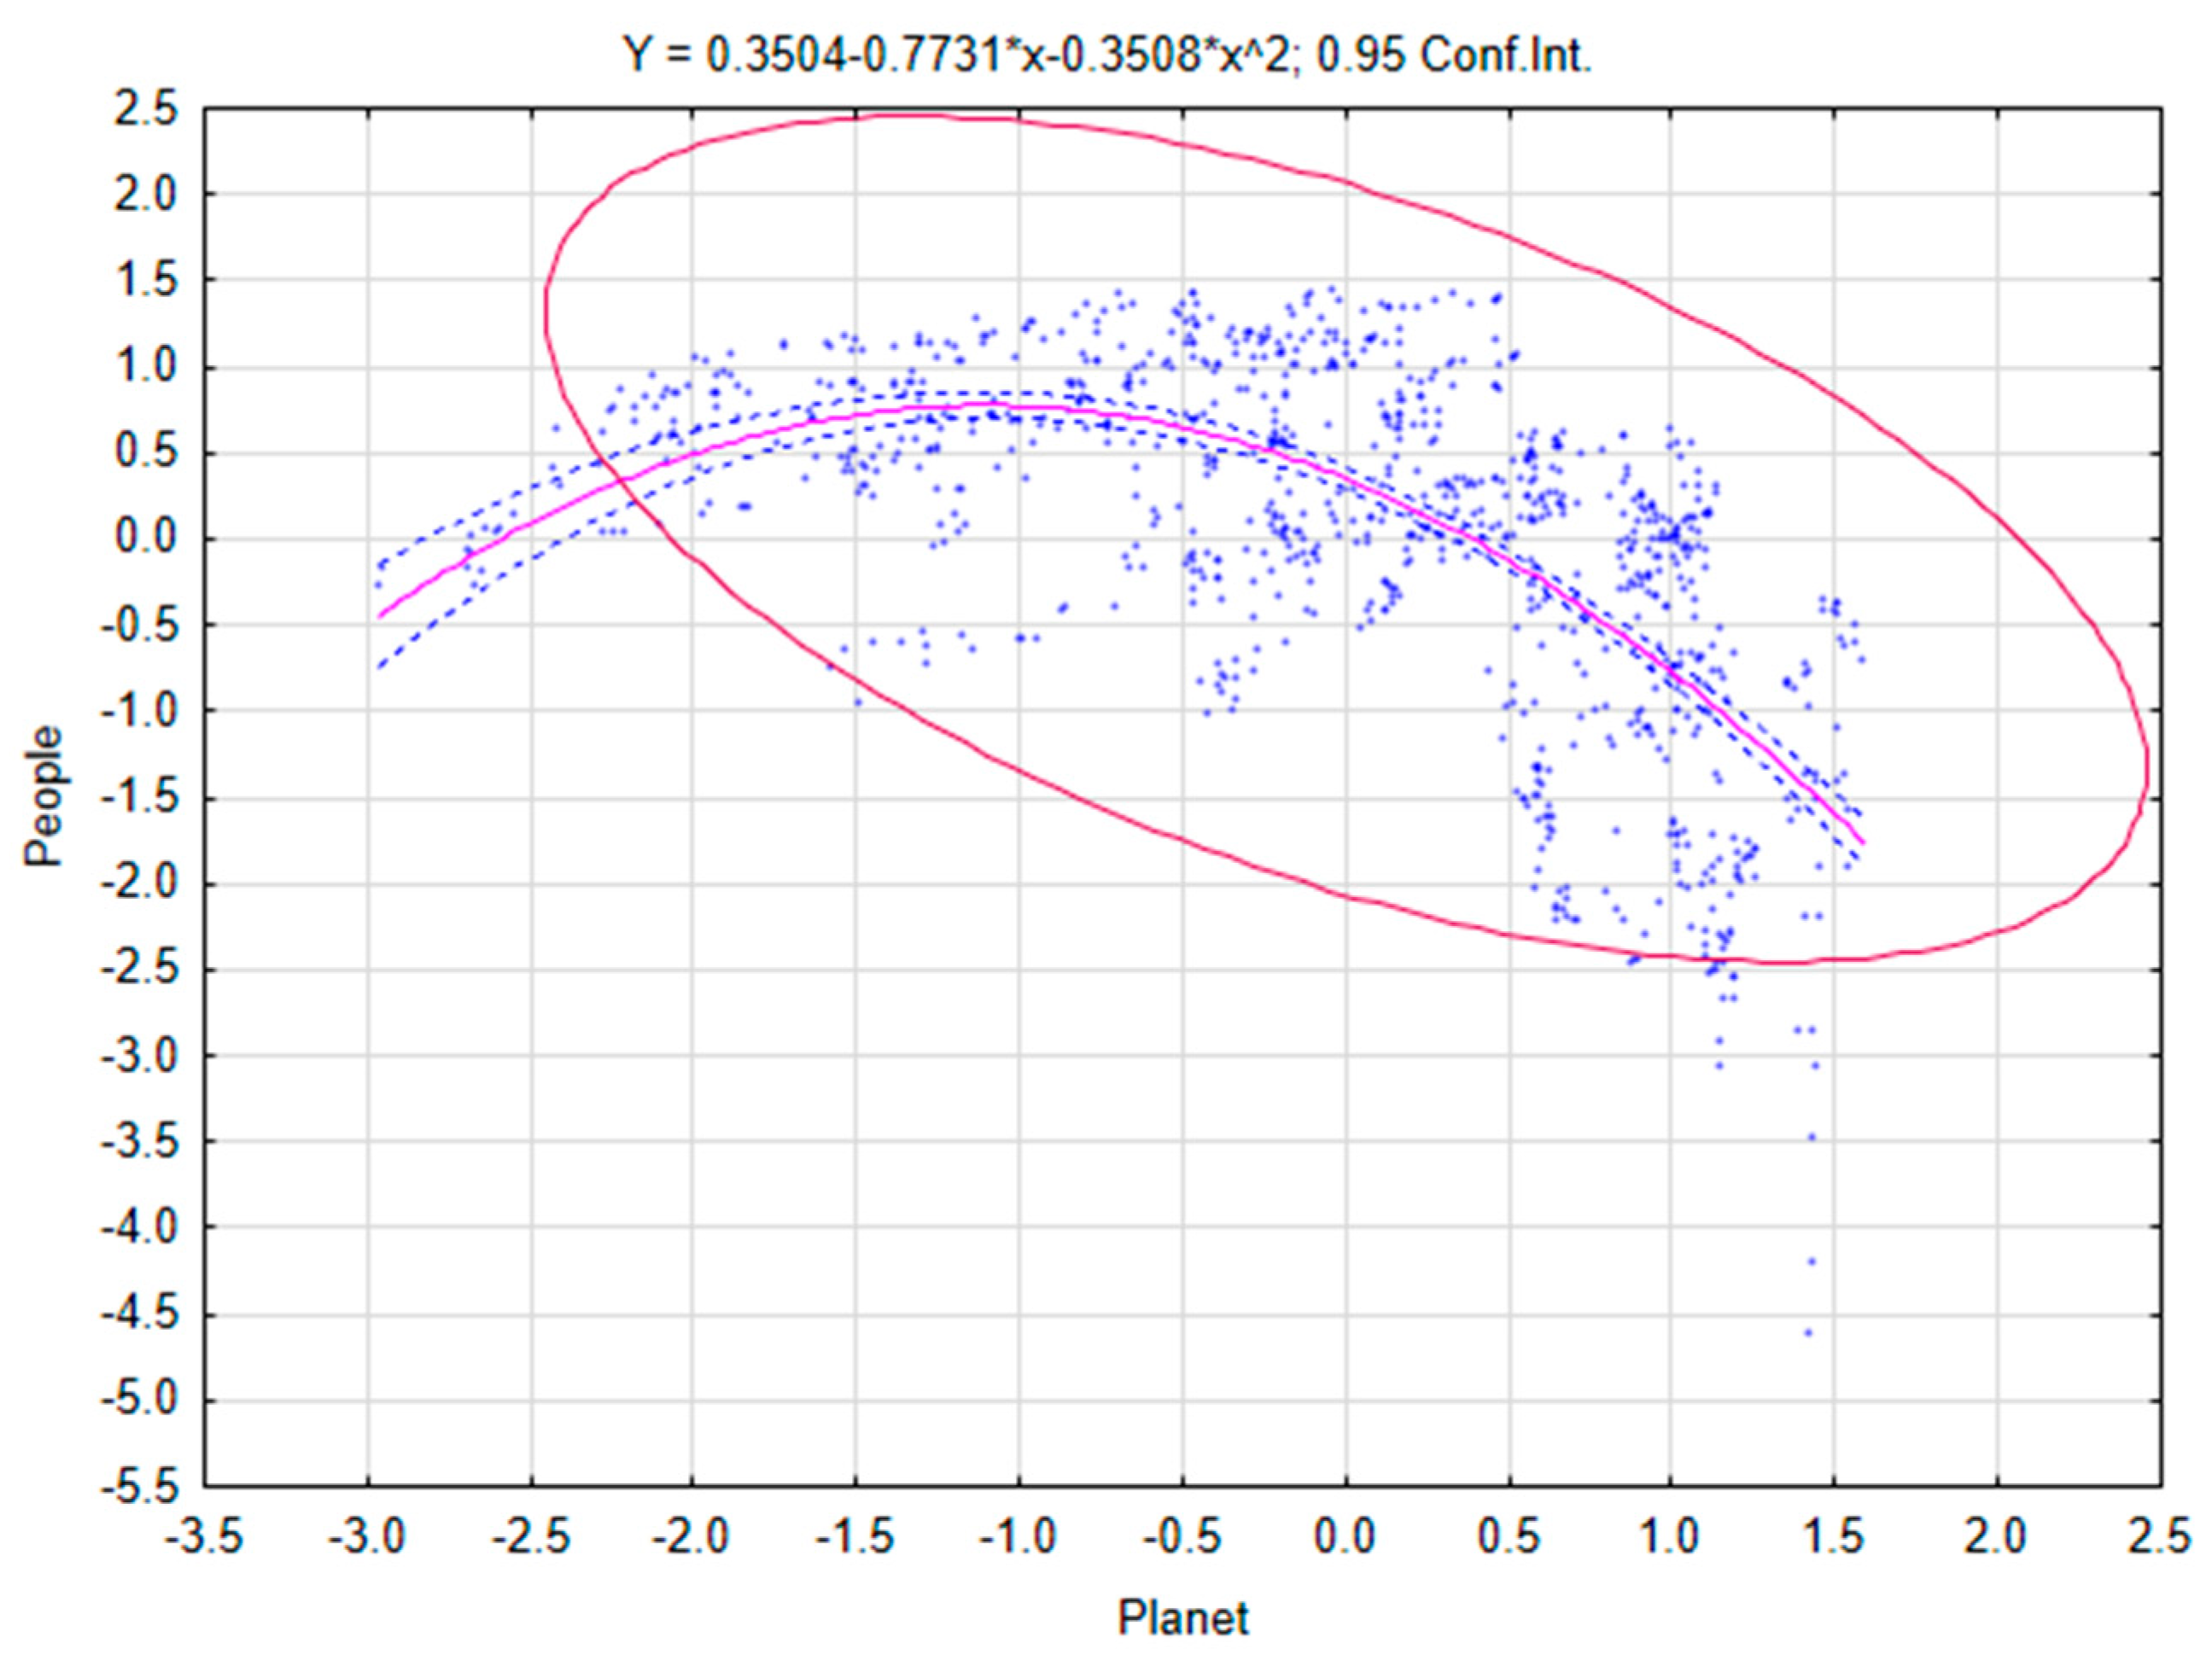

Table 1.
Sustainable Development Domains.
| Domain | SDG | SDG Title |
| People | SDG 1 | No Poverty |
| SDG 2 | Zero Hunger | |
| SDG 3 | Good Health and Well-being | |
| SDG 4 | Quality Education | |
| SDG 5 | Gender Equality | |
| SDG 6 | Clean Water and Sanitation | |
| Planet | SDG 12 | Responsible Consumption and Production |
| SDG 13 | Climate Action | |
| SDG 15 | Life on Land | |
| Prosperity | SDG 7 | Affordable and Clean Energy |
| SDG 8 | Decent Work and Economic Growth | |
| SDG 9 | Industry, Innovation and Infrastructure | |
| SDG 10 | Reduced Inequalities | |
| SDG 11 | Sustainable Cities and Communities |
Table 2.
Factor Score Coefficients derived from PCA.
| People | Planet | Prosperity | |||
| Variable | Factor 1 | Variable | Factor 1 | Variable | Factor 1 |
| goal1 | -0.178 | goal12 | 0.442 | goal7 | -0.177 |
| goal2 | -0.215 | goal13 | 0.45 | goal8 | -0.273 |
| goal3 | -0.279 | goal15 | 0.288 | goal9 | -0.305 |
| goal4 | -0.234 | - | - | goal10 | -0.229 |
| goal5 | -0.275 | - | - | goal11 | -0.301 |
| goal6 | -0.214 | - | - | - | - |
Table 3.
Specification and Summary Statistics of the Spline Model.
| Parameter | Value |
| Dependent variable | SDG Index Score |
| Independent variables | People, Planet, Prosperity |
| Number of terms | 16 |
| Basis functions used | 25 |
| Order of interactions | 2 |
| Penalisation parameter (λ) | 2.000 |
| Generalised Cross-Validation (GCV) error | 0.769 |
| R² (adjusted) | 0.963 |
| Residual standard deviation | 0.848 |
Table 4.
Domain References in Basis Functions.
| Predictor | References in Model |
| People | 9 |
| Planet | 9 |
| Prosperity | 7 |
Disclaimer/Publisher’s Note: The statements, opinions and data contained in all publications are solely those of the individual author(s) and contributor(s) and not of MDPI and/or the editor(s). MDPI and/or the editor(s) disclaim responsibility for any injury to people or property resulting from any ideas, methods, instructions or products referred to in the content. |
© 2025 by the authors. Licensee MDPI, Basel, Switzerland. This article is an open access article distributed under the terms and conditions of the Creative Commons Attribution (CC BY) license (http://creativecommons.org/licenses/by/4.0/).
Copyright: This open access article is published under a Creative Commons CC BY 4.0 license, which permit the free download, distribution, and reuse, provided that the author and preprint are cited in any reuse.


