
Submitted:
29 May 2023
Posted:
31 May 2023
You are already at the latest version
Abstract
This study explores several global and country cluster sustainable development (herein SD) models. It jointly examines constructs from the “Neoliberal-turn” ((e.g., Institutional Enhancers (e.g., business freedom, property rights, government integrity, and judicial effectiveness), Financial Enhancers (e.g., government spending and monetary, trade, investment, and financial freedoms), Foreign Direct Investment, Global Competitiveness-institutions, and Global Competitiveness-innovation-sophistication)), and the “Social-turn” (five SD pillars (e.g., Planet, People, Peace, Prosperity, and Resources), which synthesize the 17 United Nations SD goals); and Happiness and Life Satisfaction (herein H&LS). The study examines a large and diverse set of relationships encompassing 11 years of data of 108 social, economic, and environmental indicators from 129 countries at the global, country cluster, and country levels. We analyze data using structural equation modeling. Remarkably, Planet, an SD pillar constituted by biophysical variables, is the least of the five SD pillars positively related to the "neoliberal-turn" constructs and H&LS. Results show model configurations and scale effects. Furthermore, findings reveal both synergies between neoliberal and the five SD pillars as well as both negative and non-significant relationships among them. The diversity of results calls for further model integration and specificity. Diverse findings entail caution and difficulties in generalizing knowledge. Similarly, results suggest that it is not advisable, since there may be many different and partly legitimate alternatives, to rely on just one perspective (e.g., giving primacy to economic-based analyses) and or in analyses at only one scale. The perspective effects and the stakes involved in SD urgently call for more collaborative efforts at all levels.
Keywords:
Social turn models
; Sustainable development pillars
; Neoliberal turn constructs
; Model configurations
; Collaborative perspective
; Global
; cluster
; and country-level analyses
1. Introduction
Many decades of failed socio-economic development in most countries have prompted questioning of the dominant narratives [1,2,3]. However, critiques of national development, mostly from social perspectives, have existed for centuries. Examples include, among others, Marxism, the French revolution, Russia’s October revolution, other social revolutions for independence or other reasons, and social movements such as anti-globalization, indigenism, environmentalism, civil rights, and feminism. Most of these movements highlight(ed) socio-economic deficits. It is historically relatively recent that the environmental dimension has been added to the discussion.
Growing concerns about the state and dynamics of the biophysical environment have steered many development discussions [4,5]. However, while the biophysical realm is a crucial component of SD, the ultimate concern about (sustainable) development is human, that is, the need to properly evolve, maintain and enhance acceptable forms of human well-being in the medium and long term.
Different narratives have different powers and diffuse and apply differentially [6]. One of the most influential national development narratives is the approach promoted since the 1980s, by the OECD, the Bretton Woods institutions, and federal governments. This approach practically equates national development to the economic dimension. It focuses on technological innovation, "free" trade, competitiveness, foreign direct investment (herein FDI), and institutional voids [7,8,9]. The Washington consensus was/is one of the most notorious operationalizations of such an approach to national development [7,8,9]. Partial rhetorical discredit of the neoliberal turn in the last few decades [9] derives from the lack of understanding of the limitations of markets, improper consideration of earth’s maintenance, and life-giving functions of multiple ecosystems, its focus on a limited (mainly economic) set of factors, the disregard for both countries’ specificity and power and resource asymmetries as well as lack of consideration of external pressures and limitations imposed by the dominant economic system, particularly for less developed countries [1,9].
While quite complex and challenging, national and global development’s multi-dimensionality offers manifold "starting" points, idiosyncratic effects, and substantial room for maneuvering; thus, there may be a vast set of conceptualizations and operationalizations of national, regional, and global SD. Such diversity includes, among others, different: factors considered, relationships, dynamic and static approaches, ideological orientations, degrees of familiarity and novelty, perceptions, meanings, agents’ interactions, leadership approaches, institutions, and power relations [1,10]. However, since we are jointly always making society and nature (Latour, 1992), we urgently need to formulate and operationalize different model configurations reflecting collaboratively worked out problems, globally circumscribed, to strengthen national, regional, and global development systems’ ability to evolve [11] "appropriately."
In recent decades, numerous sets of models, both static and dynamic, from both the natural and social sciences have increasingly integrated social, economic, and environmental dimensions [12,13,14], [5]. However, it seems strange that the social dimension has been somewhat "forgotten and/or sidelined,” having been the first and undoubtedly the most critical development dimension. The main problem has been and still is, the dominant conceptualization of national development. A fundamental deficit has been the degree to which the issues of sustainable development, circumscribed in a global framework, are collaboratively constructed, or otherwise, by different actors.
Although the neoliberal turn is still present in development research and policy studies [9], its shortcomings have prompted increased attention to the "Social-turn" [15,16]. This approach to national development encompasses multiple dimensions and a diverse and variant set of model configurations [17]). The "Social turn" incorporates past and present expectations about social equality and justice and a diverse set of multidimensional conceptualizations of (sustainable) development. The multi-dimensionality of sustainability requires considering a diversity of perspectives. Furthermore, the set of development choices is circumscribed by realities expressed in a) a (large) number of indicators (e.g., indicators manifesting, in different degrees, the current state of development in different countries) and b) established complex socio-ecological processes, generating such indicators. Some of these processes may include biophysical limits (e.g., the desirability to reduce further degrading the natural environment to avoid reaching tipping points) and development constraints, particularly for developing countries, deriving from the need to operate in accordance with the global socio-economic system.
Given the complexity of sustainable development there is no a priori “right model”, in practice model purpose and its corresponding configuration needs to be determined collaboratively. As a result, we examined a diverse set of models. Since the ultimate purpose of sustainable development is human, we integrate “Neoliberal turn” and “Social turn” constructs given due consideration to environmental, social, and economic constructs.
The purpose of this study is to explore several global and country cluster SD models integrating constructs from both the “Neo-liberal turn” -which emphasize the economic dimension- and the “Social turn”, proper- which consider social, environmental, and economic dimensions. However, in this paper we termed “Social turn” all models examined because they integrate the three key dimensions of sustainable development. Thus, our models include different configurations of social, economic, and environmental dimensions. We jointly examine constructs from the “Neoliberal-turn” (e.g., Institutional Enhancers (e.g., business freedom, property rights, government integrity, and judicial effectiveness), Financial Enhancers (e.g., government spending and monetary, trade, investment, and financial freedoms), FDI, Global Competitiveness-institutions (herein GC-Ins), and Global Competitiveness-innovation-sophistication (herein GC-InnS)), and more socially oriented constructs such as the five SD pillars (e.g., Planet, People, Peace, Prosperity, and Resources), which synthesize the 17 United Nations (herein U.N) SD goals; and H&LS. We termed as “Social turn-1” the models in which the “Neoliberal-turn” constructs antecede the five SD pillars, whereas those in which the five SD pillars antecede the “Neoliberal-turn” constructs, we termed “Social turn-2”. Theoretically, we draw from [18] critique of one-dimensional science as well as from the concept of post-normal science [10] and the notion of an evolving parallax [3]. In examining various model configurations, we seek to contribute to the SD conversation.
This research makes several contributions. First, it explores unique model operationalizations including six constructs from the “Neoliberal-turn” and five SD pillars, highlighting the “Social turn”, which summarize the 17 United Nations (herein U.N) SD goals as well as H&LS. It examines a diverse set of relationships encompassing a large set of multi-level social, economic, and environmental indicators at the global, country cluster, and country levels. Our analyses use 11 years of data (2007-2017) of 108 indicators from 129 countries. Second, our results show model configurations and scale effects. Findings show both synergies between neoliberal and the five SD pillars as well as both negative and non-significant relationships among them. The diversity of results calls for further model integration and specificity. Diverse findings entail caution and difficulties in generalizing knowledge. Similarly, results suggest that it is not advisable, since there may be many different and partly legitimate alternatives, to rely on just one perspective (e.g., giving primacy to economic-based analyses) and or on analyses at only one scale. The perspective effects and the stakes involved in SD urgently call for more collaborative efforts at all levels. Third, findings indicate that the different model configurations and levels examined may produce different results reaffirming the need for model specificity. At the same time, SD requires specific models consistent with desirable global results (e.g., ensuring that socio-economic activities are carried out at well-below tipping points). Finally, these findings suggest that it is not advisable, since there may be many different and legitimate alternatives, to rely on just one perspective (e.g., giving primacy to the economic dimension), highlighting the need for collaboratively constructed perspectives.
Overall results suggest that the “neoliberal turn” constructs and the five SD pillars are critical in the "Social-turn" models studied. Remarkably, Planet, a pillar constituted by biophysical variables, is the least of the five SD pillars positively related to the “neoliberal-turn” constructs and H&LS. Although some construct relationships are either negative or insignificant, perhaps manifesting lack of SD, given the nature of the constructs and sustainability’s multi-dimensionally, all model constructs are essential constituents of national, country cluster, and global sustainability models. In addition, there are scales- global, country cluster, and national effects. The stakes involved in global, regional, and national SD, and the perspective effects expressed either in different scales, models, and or model configurations, call for urgently increasing collaborative SD efforts at all levels.
2. Literature Review and Hypotheses Development
2.1. Briefing on national development models
The purpose of this section is to situate our approach, that is, the set of “Social-turn” models used in this study. Our models reflect the increasing confluence of economic, environmental, and social models that have been taking place lately. The briefing below provides an account of some key development models used in the past and the present, and it gives a justification of our models.
Although models simplify reality, different models address different questions and may provide different answers for different uses. The diversity of model configurations illustrates knowledge incompleteness and suggests the need to achieve multiple further integrations. Thus, development complexity and, model diversity calls for "properly" situating model use. The expectation is that models with well-established functional relationships will properly depict realities of interest. Fulfilling such expectations and greater transparency is crucial if models are to help steer well-informed discussions about development because models’ perspectives are reflected in their policy recommendations. However, SD multiplicities may involve functional relationships and model configurations that are not well-defined and that need to be determined collaboratively.
The evolution of development models has partly responded, similarly to the change of paradigms [19], to the limitations of a given (dominant) model. Thus, new models suggest potentially more explanatory and legitimate approaches than previous ones. However, incorporating additional factors/variables, processes, and insights has been, probably due to power asymmetry effects, relatively slow, narrow, and still far from the realities of most individuals and collectives. The current state of affairs results, inter alia, from the dominance of national development models based on neo-classical economics.
Country and world dominant development models include, among others, the Harrod-Domar growth model, which considers labor and (economic) capital, emphasizing investing savings for capital growth [20]. After that, focuses on aid, FDI, liberalization, and development of financial markets expanded the potential capital options. Subsequently, Solow’s model highlights the role of technology in addition to labor and economic capital [21]. Such a model has been the dominant economic model globally for decades. Later, the Washington consensus added the focus on policy reforms, including, among others, fiscal, tax, trade, state spending, exchange rates, and interest rates [22]. Although necessary for a country’s functioning, these policy reforms were introduced from the outside. They disregarded country differences in "starting development" points and the fact that every country has specific development "models" that may be appropriate in particular times and spaces. As a follow-up to the Washington consensus, the next stage of development models focused on institutions [23,24]. Again, in addition to expectations of changing the economic dimension, institutionalism prescribes filling institutional voids (e.g., the rule of law, property rights, and developed capital markets). Although developed institutions are crucial for development, this approach needs to consider history, culture, power, and the types, and quality, of countries’ comprehensive internal and external socio-ecological dynamics [1,25]. Likewise, all these models focus on the production of economic capital, not on its distribution, assuming rationality throughout and that actors respond rapidly to new conditions [26].
The development models sketched above have been generalized, recommended, and tried, at different times and degrees, all over the world because, among other things, classical economists have been very influential in shaping national policies in most countries. But unfortunately, the country success stories following these models are very few (e.g., South Korea, Singapore, Taiwan).
In addition to discussions about which factors/constructs to include (e.g., simplistic formulations in which many important variables are missing) and the functional relationships that should constitute such models, analytically/numerically, most models cannot justify assumptions of homogeneity, stability, invariance, independence, and additivity vis-a-vis the potential complexity of socio-ecological realities [27]. However, models’ numerical and/or analytical problems are bound to be secondary vis a vis the complexities of perspectives, stakes, and dynamics that need to be considered in the immensely complex problem of global, regional, and national development [10].
Given development complexity, there is an infinite set of alternative formulations and operationalizations. A common triad of SD dimensions includes the economic, social, and environmental ones. A key challenge in development studies is to strike interesting and compelling balances and levels of detail, both within and among such dimensions. Our study attempts to follow such a path.
Multivariate, econometric, and integrated assessment models are commonly used in development studies. However, national and global development includes many functional relationships that are not well-known but could be estimated using structural equation models. In addition, structural equation models may encompass an extensive set of nested relationships allowing the consideration of multiple levels and a vast set of variables. Furthermore, structural equation models are increasingly used to examine a diverse set of sustainability problems within and between organizations [28,29]. Thus, structural equation models may add to the insights generated by other model types. Our analyses use structural equation modeling.
The dominant national development model of the last few years has encompassed Economic Enhancers (e.g., government spending and monetary, trade, investment, and financial freedoms), Institutional Enhancers (e.g., business freedom, property rights, government integrity, and judicial effectiveness), FDI, Global Competitiveness (herein GC), and economic growth [1,25,30] constituting the “Neoliberal-turn” approach. However, in addition to these “Neoliberal-turn” constructs, our “Social-turn” approach also includes five SD pillars that synthesize the 17 U.N SD goals as well as H&LS. Our study examines multiple relationships involving a set of 108 socio-ecological indicators of 129 countries.
Drawing from [4], the U.N. 17 SD goals are grouped into five pillars (People, Prosperity, Peace, Planet, and Resources) under three dimensions: economic dimension (Prosperity), social dimensions (People and Peace), and environmental dimensions (Planet and Resources) (Appendix Figure A1).
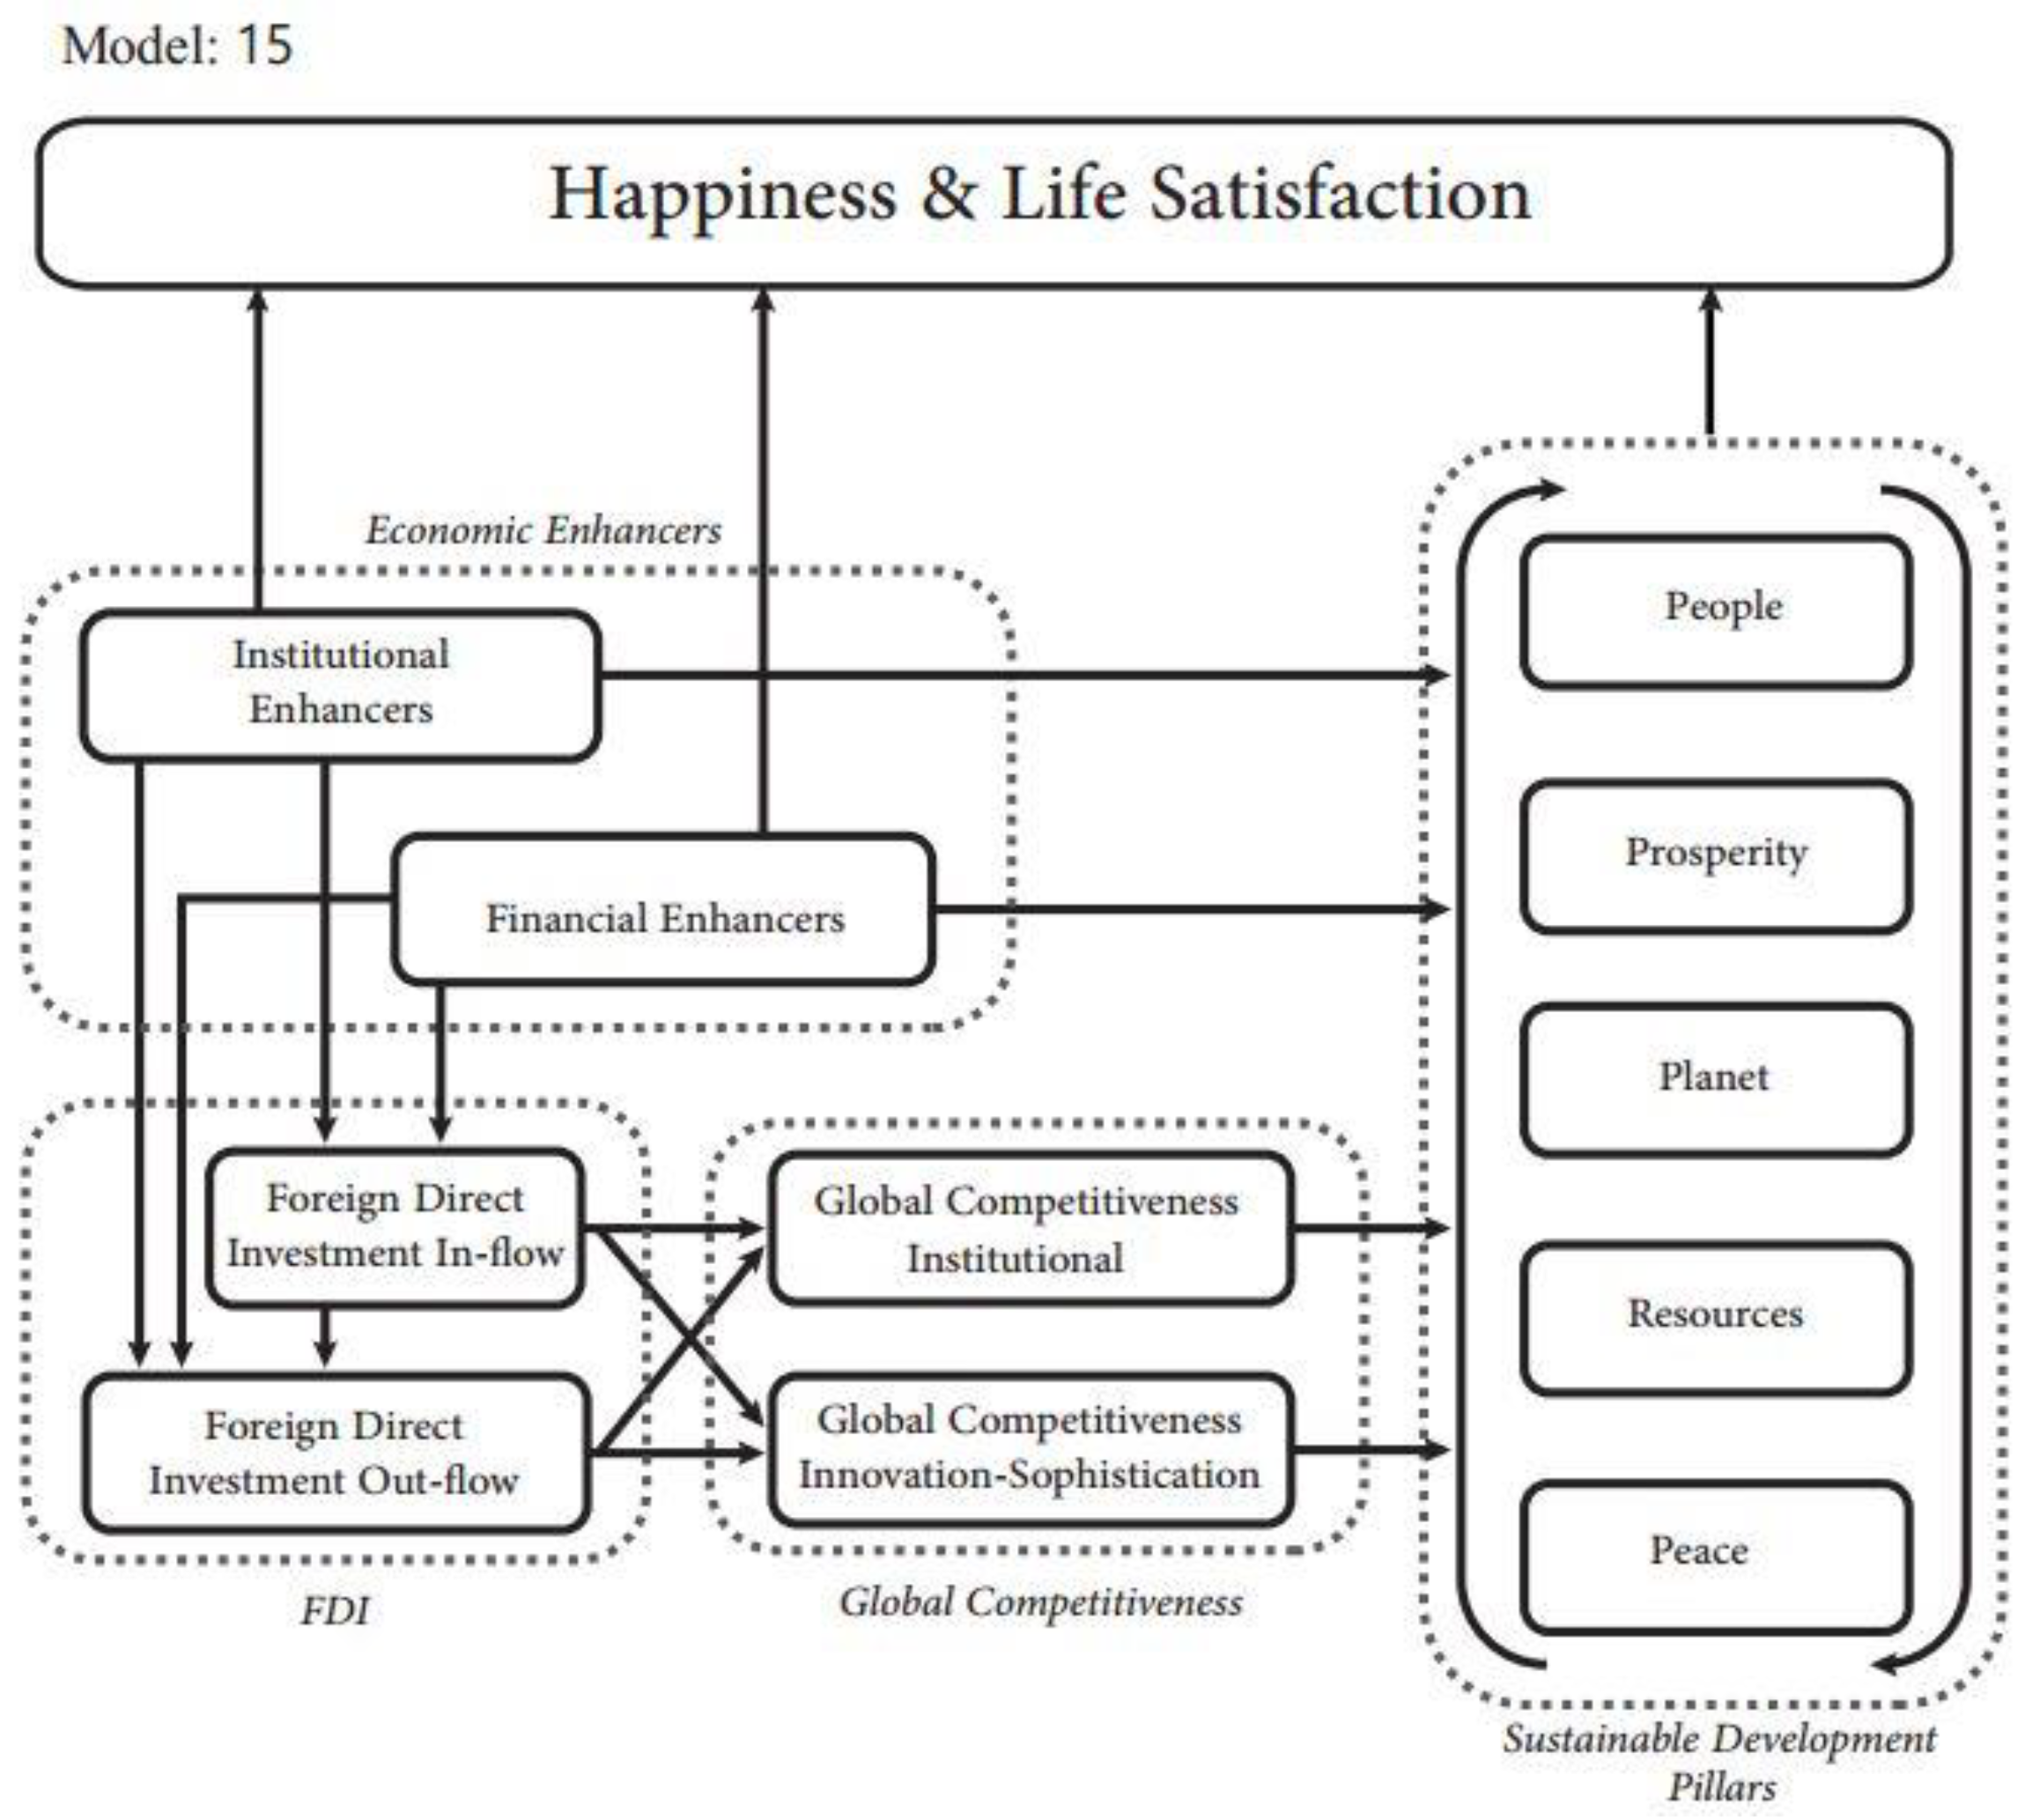
Since development constructs usually exist at the same time, they may be inter-correlated, and relationships may be bidirectional or multi-directional, we constructed two contrasting sets of models: the “Social-turn 1” and the “Social-turn 2” models. The “Social-turn 1” model considers GC-Ins, GC-InnS, FDI inflow (herein FDII), FDI outflow (herein FDIO), Financial Enhancers, and Institutional Enhancers as antecedents of People, Prosperity, Planet, Resources, and Peace. In contrast, the “Social-turn 2” model examines People, Prosperity, Planet, Resources, and Peace as antecedents of GC, FDI, Financial Enhancers, and Institutional Enhancers (Figure 1, Figure 2, Figure 3 and Figure 4).
Below we provide briefings for each of the constructs constituting the “Social-turn 1” and the “Social-turn 2” models and their relationships. Further details about these constructs are provided in Section 3.
2.2. Global Competitiveness
GC is challenging to achieve since most countries worldwide struggle with slowing productivity, income inequality, rapidly changing societies, stagnating income growth, inward-looking governmental policies, and protectionist pressures [31,32]. Therefore, we analyzed GC with two main components, GC-Ins and GC-InnS. GC-Ins comprises five efficiency-driven pillars: goods market efficiency, labor market efficiency, financial market efficiency, technological readiness, and market size. GC-InnS includes two innovation-driven pillars: business sophistication and innovation.
2.3. Sustainable Development
Interactions between the biophysical environment, economic conditions, and the social realm complexify national and global development problems. As noted above, multiple development perspectives may encompass diverse factors, levels, dimensions, functional relationships, times, and spaces.
2.3.1. Economic dimension
This dimension includes the Prosperity pillar.
- Prosperity
The economic dimension entails the distribution and allocation of limited resources [33,34]. Current and future effects of the economy on the natural environment are one of the critical questions related to whether societies could achieve SD or not. GDP, net savings, unemployment, research and development expenditures, inter alia, reflect and impact the economy and influence current and future SD [35,36,37,38]. Although economic activity is a primary culprit of ecological degradation, in the long term, sustainable economic strength could assist in creating balanced social-ecological dynamics.
2.3.2. Social dimension
This dimension includes pillars: People and Peace
- People
People are the core of SD. Improving wealth, gender equality, education, and health levels is one of the crucial components of SD [39,40].
- Peace
Peace results from and contributes to generating multiple development components. For example, institutional development, institutions’ effectiveness, social trust, ethical behavior of citizens and corporations, and transparency in social relationships relate to crime, violence, terrorism, and economic activity and peace of mind or lack of them [41,42,43].
2.3.3. Environmental dimension
This dimension includes pillars: Planet and Resources
- Planet
Environmentally-related problems like CO2 emissions, climate change, deforestation, and depletion and or pollution of water resources are, among others, the consequences of the increasingly evolving demand for economic growth [44,45].
- Resources
Both environmental degradation and lack of resources reflected in poor nutrition of the populace and deficits in drinking water services and renewable energy exacerbate socio-ecological problems [46]. As such, the lack of efficient and effective access to resources limits not only the living conditions of humans but also countries’ productivity and the attainment of desirable socio-ecological goals.
2.4. Happiness &Life Satisfaction
Sustainability is ultimately a human concern. We may live to be happy and satisfied with life. Thus, it is essential to examine how our living conditions encompassing the natural environment and economic and social dimensions affect our H&LS [47,48].
H&LS is a subjective concept; therefore, it is difficult to measure. Individuals’ answers to questions about H&LS may not mirror the “reality” of societies [49]. Furthermore, H&LS may vary regionally in the same country [50]. GDP positively correlates with H&LS [51]. However, since H&LS is multidimensional and diverse, regardless of the countries’ income levels, they may have the same H&LS perceptions [52,53]. Similarly, differences in socio-economic levels and demographic factors play a significant role in H&LS [53]. It is important to note that H&LS could also be an obstacle to progress toward SD. For example, comfortable and nice-looking suburban households may generate large ecological footprints and it may be difficult to renounce enjoying such happy living conditions.
2.5. Foreign Direct Investment
Over the past three decades, FDIs have been one of the most critical features of the global economy [54,55]. However, we should also be aware of FDI’s "Hidden Aspects," such as crowding out effects, profit repatriation, uncontrolled wealth creation, changes in the fabric of the society, and depletion of domestic resources [56,57].
2.5.1. FDII
2.5.2. FDIO
Firms may search for new countries, seek markets and resources, and improve efficiency [77,78]. Similarly, governments may partially promote these strategic moves to increase exports and decrease trade deficits [79,80,81]. FDIO may have positive or negative results for firms and host and home countries depending on the internationalization mode, selected locations, and/or political, economic, and governmental environments of the host and home countries [82]. FDIO may or may not improve countries’ GC [83,84].
2.5.3. FDII-FDIO relationship
FDII’s effects on FDIO vary depending on the country’s development level [85,86]. According to investment development path theory, governments must first focus on increasing their FDII to reach a specific development state [87,88]. Subsequently, they could externally divert, in the form of FDIO, their know-how, and capabilities, together with their networks, to seek new markets and resources [89,90].
When FDII’s spillovers are utilized efficiently by government and firms, FDIO may increase [91,92,93]. On the other hand, FDII and FDIO may negatively associate depending on the country’s governance and development [94,95,96,97]. National elites’ genuine concern for the nation is the decisive factor in achieving FDII and or FDIO positive or negative results for a given country.
2.6. Hypotheses
According to the above literature synthesis, the interactions depicted in the “Social-turn 1” models among Institutional Enhancers, Financial Enhancers, GC-Ins, GC-InnS, FDII, and FDIO are expected to generate positive effects on SD pillars (People, Prosperity, Planet, Resources, and Peace) [72],[98,99,100,101] (Appendix Figure A2 - Models 1 - 6). Therefore, we propose,
Hypothesis 1a (H1a).
GC pillars, Economic Enhancers, and FDI will positively relate to People, Prosperity, Planet, Resources, Peace, and H&LS.
Alternatively, according to the “Social-turn 2” models, the People, Prosperity, Planet, Resources, and Peace pillars will antecede Institutional Enhancers, Financial Enhancers, GC-Ins, GC-InnS, FDIIs, and FDIOs (Appendix Figure A3, Models 7-12). Therefore, we pose,
Hypothesis 1b (H1b).
People, Prosperity, Planet, Resources, and Peace will positively relate to GC pillars, Economic Enhancers, FDI, and HL&S.
A key challenge in development studies is to strike engaging and effective balances and levels of detail, both within and among socio-ecological dimensions. Differences among construct relationships may reflect the effects of both the unit of analysis (e.g., global, country cluster, and country levels) and differences in model conceptualizations (e.g., “Social-turn 1” and “Social-turn 2” models); therefore, we hypothesize,
Hypothesis 2 (H2).
Construct relationships in the “Social-turn 1” and “Social-turn 2” models will differ at the global, and country cluster level.
3. Method
3.1. Measures selection and data sources
U.N sustainable development goals (herein SDGs) include 232 indicators under 17 main goals [102]. However, such a set of indicators includes overlaps, and it could be more convenient [4]. Furthermore, it is not easy to obtain complete data for a large set of countries (Table 1).
In selecting the indicators for each pillar, we examined the data availability of 144 SDG indicators from the [102] database and followed [4] criteria (a) the indicators are relevant for society; (b) indicators need to be science-based; (c) longer-term view has to be included; (d) indicators need to be quantifiable to allow quantitative analysis; and (e) data need to be available for all countries and years. As a result, we use the five pillars of People, Prosperity, Resources, Planet, and Peace which summarize the U.N. 17 SDGs [4] (Appendix Table A1). The distribution of the five SD pillars in the environmental, economic, and social dimensions appears in Figure A1(Appendix)
The Prosperity pillar includes indicators pertaining to SDGs 8, 9, 10, and 11, reflecting socio-economic conditions: economic growth, employment, the functionality of the labor market, and different layers of the infrastructure. It is measured with six indicators. Example indicators are GDP per capita growth, the population percentage of individuals using the Internet, and adjusted net savings.
The People pillar includes indicators belonging to SDGs 1, 3, 4, and 5. The People pillar encompasses poverty, health, gender equality, and education indicators. It is measured with seven indicators. Example indicators are poverty headcount ratio, maternal mortality, and educational attainment.
The Peace pillar includes indicators pertaining to SDGs 16 and 17. They refer to safety, the inclusiveness of society and institutions, and their proper implementation [4]. It is measured with 19 indicators. Example indicators are intentional homicides, organized crime, and the reliability of police services.
The Planet pillar includes indicators of SDGs 13, 14, and 15. The pillar Planet encompasses the condition of the natural environment and planetary boundaries. It is measured with four indicators. Example indicators are CO2 emissions, percentage of forested area, and degree of annual freshwater withdrawals.
The Resources pillar includes indicators of SDGs 2, 6, 7, and 12, encompassing energy, water, and food production. It is measured with five indicators. Example indicators are the prevalence of undernourishment, usage of basic drinking water services, and the degree of renewable energy consumption.
H&LS refers to “the degree to which an individual judges the overall quality of her/his own life as a whole favorably, and it is generally considered to be an ultimate goal in life, and life satisfaction is the feeling of well-being” [103] (p.532). H&LS data were obtained from the Life Satisfaction in Cantril Ladder [104]. The surveys were done in 160 countries in 140 languages and involved approximately 160,000 respondents (an average of 1,000 respondents per country). The evaluation question was "Please imagine a ladder, with steps numbered from 0 at the bottom to 10 at the top. The top of the ladder represents the best possible life for you, and the bottom represents your worst possible life. On which step of the ladder would you say you personally feel you stand at this time?"
FDII and FDIO data (% of the GDP and annual in USD) were obtained from the World Bank [102].
After considering data availability, the indicators for Institutional Enhancers selected were business freedom, property rights, government integrity, and judicial effectiveness. The Financial Enhancers’ selected indicators were government spending and monetary, trade, investment, and financial freedoms. Institutional Enhancers and Financial Enhancers data were obtained from the Heritage Foundation Freedom Index dataset [105,106].
GC is a set of institutions, factors, and policies that govern a country’s productivity level [107]. GC is the crucial long-term mechanism for living standards, prosperity, and expansion [108,109]. GC includes two components, GC-Ins and GC-InnS [2,110,111] (see pillars and indicators details in Appendix Table A1). Example indicators are higher education and training, goods market efficiency, labor market efficiency, financial market efficiency, technology readiness, business sophistication, and innovation. The GC-Ins and GC-InnS data were obtained from World Economic Forum [107,112]. The set of “Neoliberal-turn” constructs comprises 66 indicators, and the five SD pillars include 41 indicators.
Pillars’ indicators were measured by employing several metrics. For details, see Table A1 in the appendix . Analyses standardized the data. Indicators with a meaning contrary to any given pillar were multiplied by -1 so that all indicators within a pillar have the same meaning.
3.2. Country cluster determination
Taking into account regional and economic development levels of countries, the World Bank created the following seven clusters: Advanced Economies, Emerging & Developing Europe, Emerging & Developing Asia, Middle East, North Africa & Pakistan, Latin America & The Caribbean, Sub-Saharan Africa, and Commonwealth [113]. Our analyses use these seven country clusters (Table 1). Countries included in this study comprise 92.94% of the world population and 98.72% of the world GDP (see Appendix Table A2). We use group analysis to test our models by country clusters. We used 11 years (from 2007 to 2017) of data from 108 indicators from 129 countries (Appendix Table A1).

Table 1.
Country clusters.
| Country Cluster | Countries |
|---|---|
| Advanced Economies |
Australia, Austria, Belgium, Canada, Cyprus, Czech Republic, Denmark, Estonia, Finland, France, Germany, Greece, Hon Kong SAR, Iceland, Ireland, Israel, Italy, Japan, Korea, Rep., Latvia, Lithuania, Luxembourg, Malta, Netherlands, New Zealand, Norway, Portugal, Singapore, Slovak Republic, Slovenia, Spain, Sweden, Switzerland, Taiwan, United Kingdom, United States. |
| Emerging & Developing Europe |
Albania, Bosnia and Herzegovina, Bulgaria, Croatia, Hungary, Montenegro, Poland, Romania, Serbia. |
| Emerging & Developing Asia |
Bangladesh, Bhutan, Brunei Darussalam, Cambodia, China, India, Indonesia, Malaysia, Mongolia, Nepal, Philippines, Sri Lanka, Thailand, Timor-Leste, Vietnam. |
| Middle East, North Africa & Pakistan |
Algeria, Bahrain, Egypt, Iran, Islamic Rep., Jordan, Kuwait, Mauritania, Morocco, Oman, Pakistan, Qatar, Saudi Arabia, Tunisia, Turkey, United Arab Emirates. |
| Latin America & the Caribbean |
Argentina, Bolivia, Brazil, Chile, Colombia, Costa Rica, Dominican Republic, Ecuador, El Salvador, Guatemala, Honduras, Jamaica, Mexico, Nicaragua, Panama, Paraguay, Peru, Trinidad and Tobago, Uruguay, Venezuela. |
| Sub-Saharan Africa |
Benin, Botswana, Burkina Faso, Burundi, Cameroon, Cabo Verde, Chad, Côte d’Ivoire, Ethiopia, Ghana, Kenya, Lesotho, Madagascar, Malawi, Mali, Mauritius, Mozambique, Namibia, Nigeria, Senegal, South Africa, Tanzania, Uganda, Zambia, Zimbabwe. |
| Commonwealth | Armenia, Azerbaijan, Georgia, Kazakhstan, Kyrgyz Republic, Moldova, Russian Federation, Tajikistan, Ukraine. |
Source: [113]
3.3. Model selection
The constructs of the “Social-turn 1” and “Social-turn 2” models can generate a continuum of models. Initially, we examined 12 models to explore different plausible model configurations (Appendix Figure A2 and Figure A3, and Figure 3 and Figure 4)
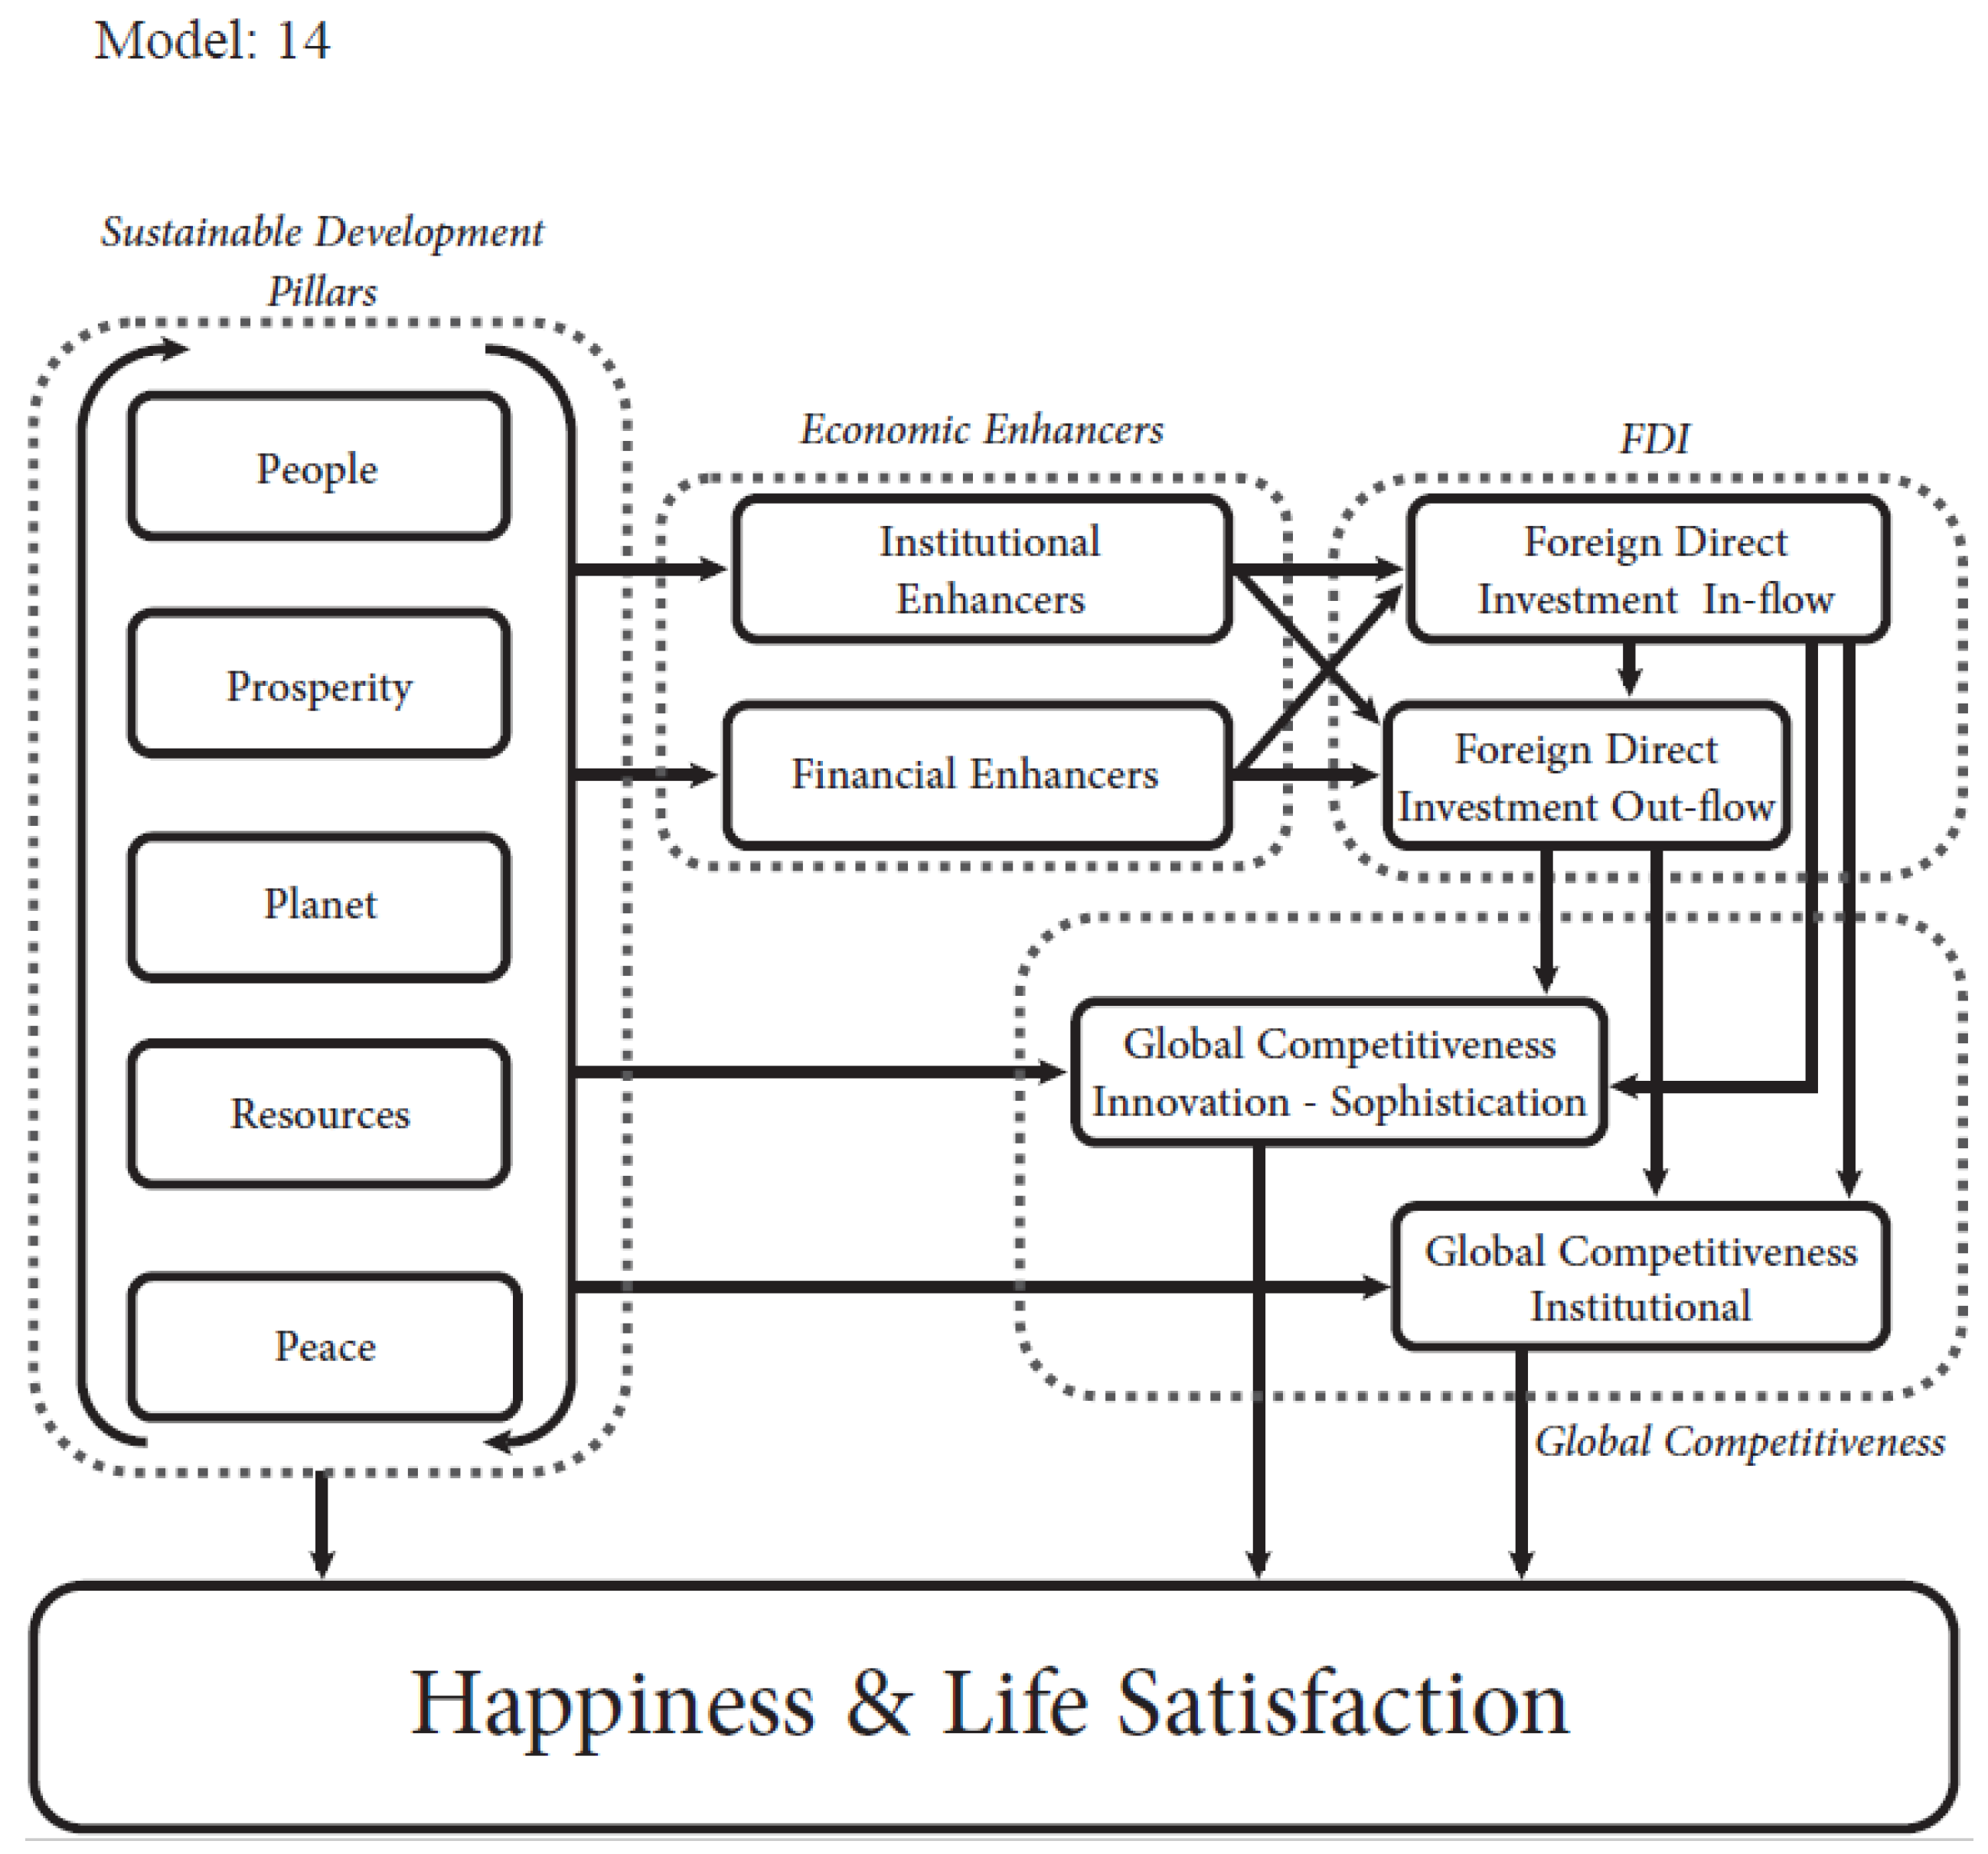
From the 12 models appearing in Table 2, we used, for detailed modeling, the models with the overall highest average adjusted R-squared, that is, Model 4 representing the “Social-turn 1” model (Figure 1) and Model 7 representing the “Social-turn 2” model (Figure 2). In addition, Models 13 (Figure 3) and 14 (Figure 4) were used to assess models 4 and 7’s relationships with H&LS.
Figure 1.
“Social-turn 1” conceptual model.
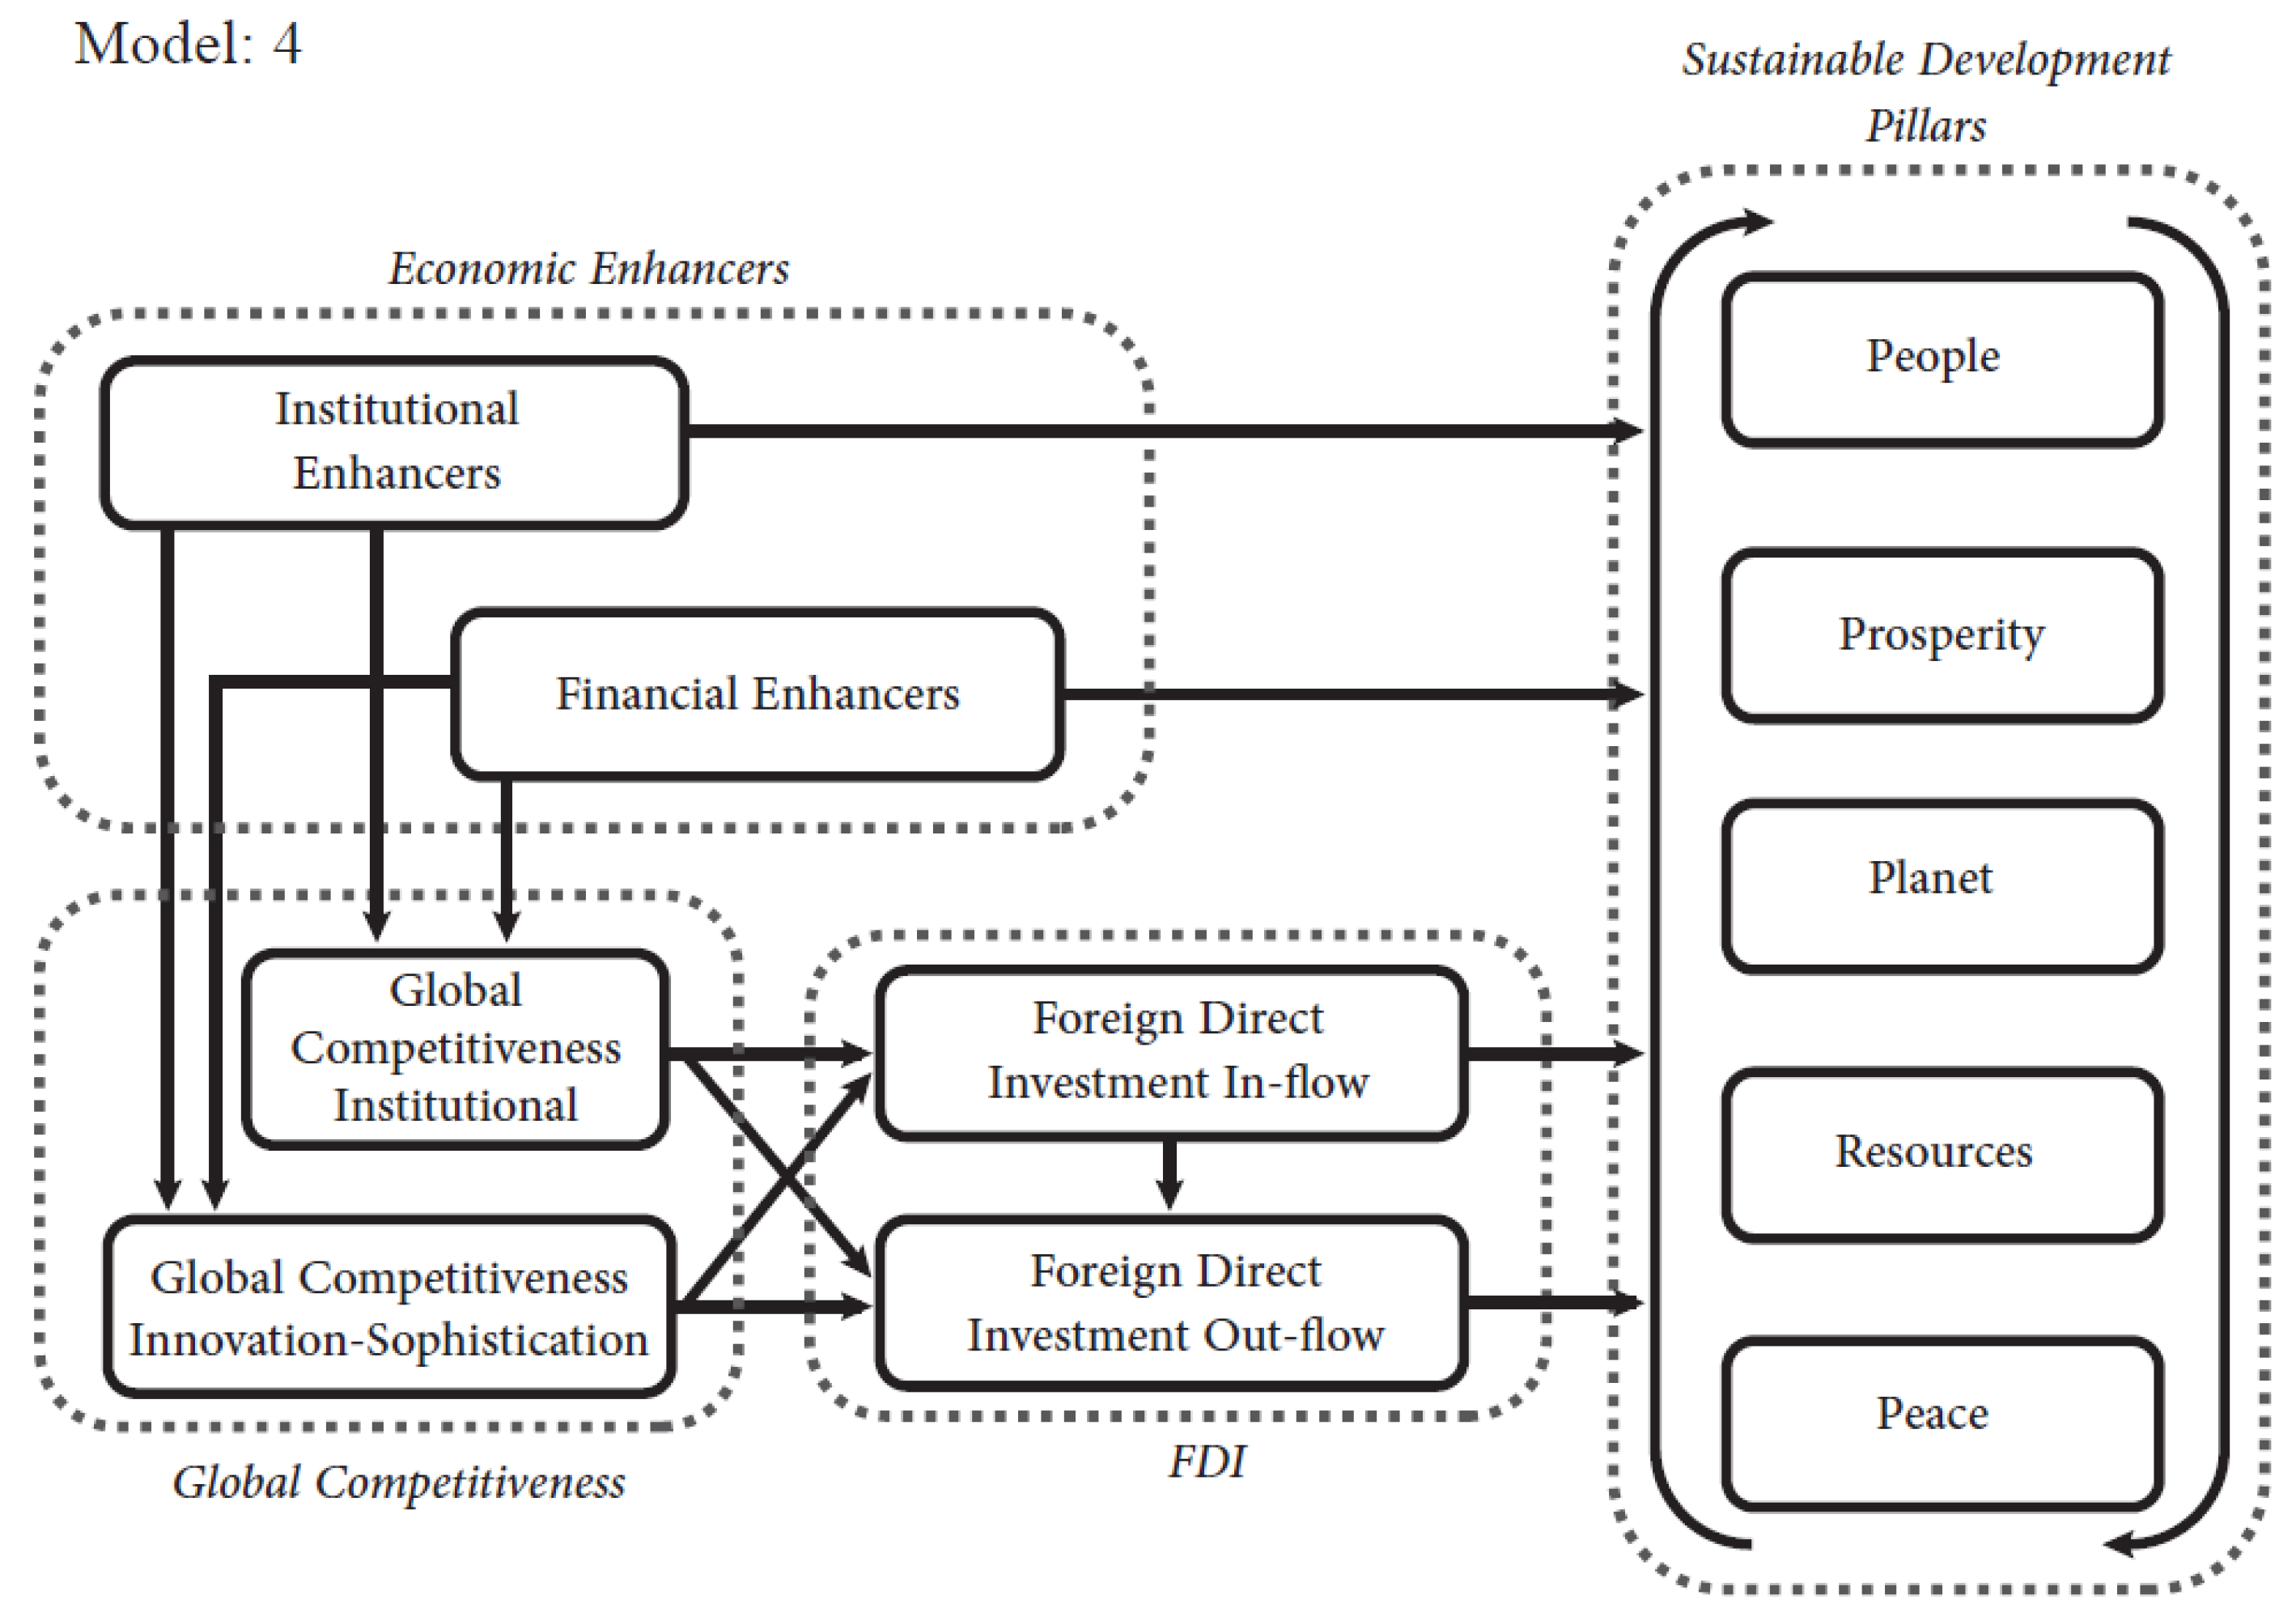
Figure 2.
“Social-turn 2” conceptual model.
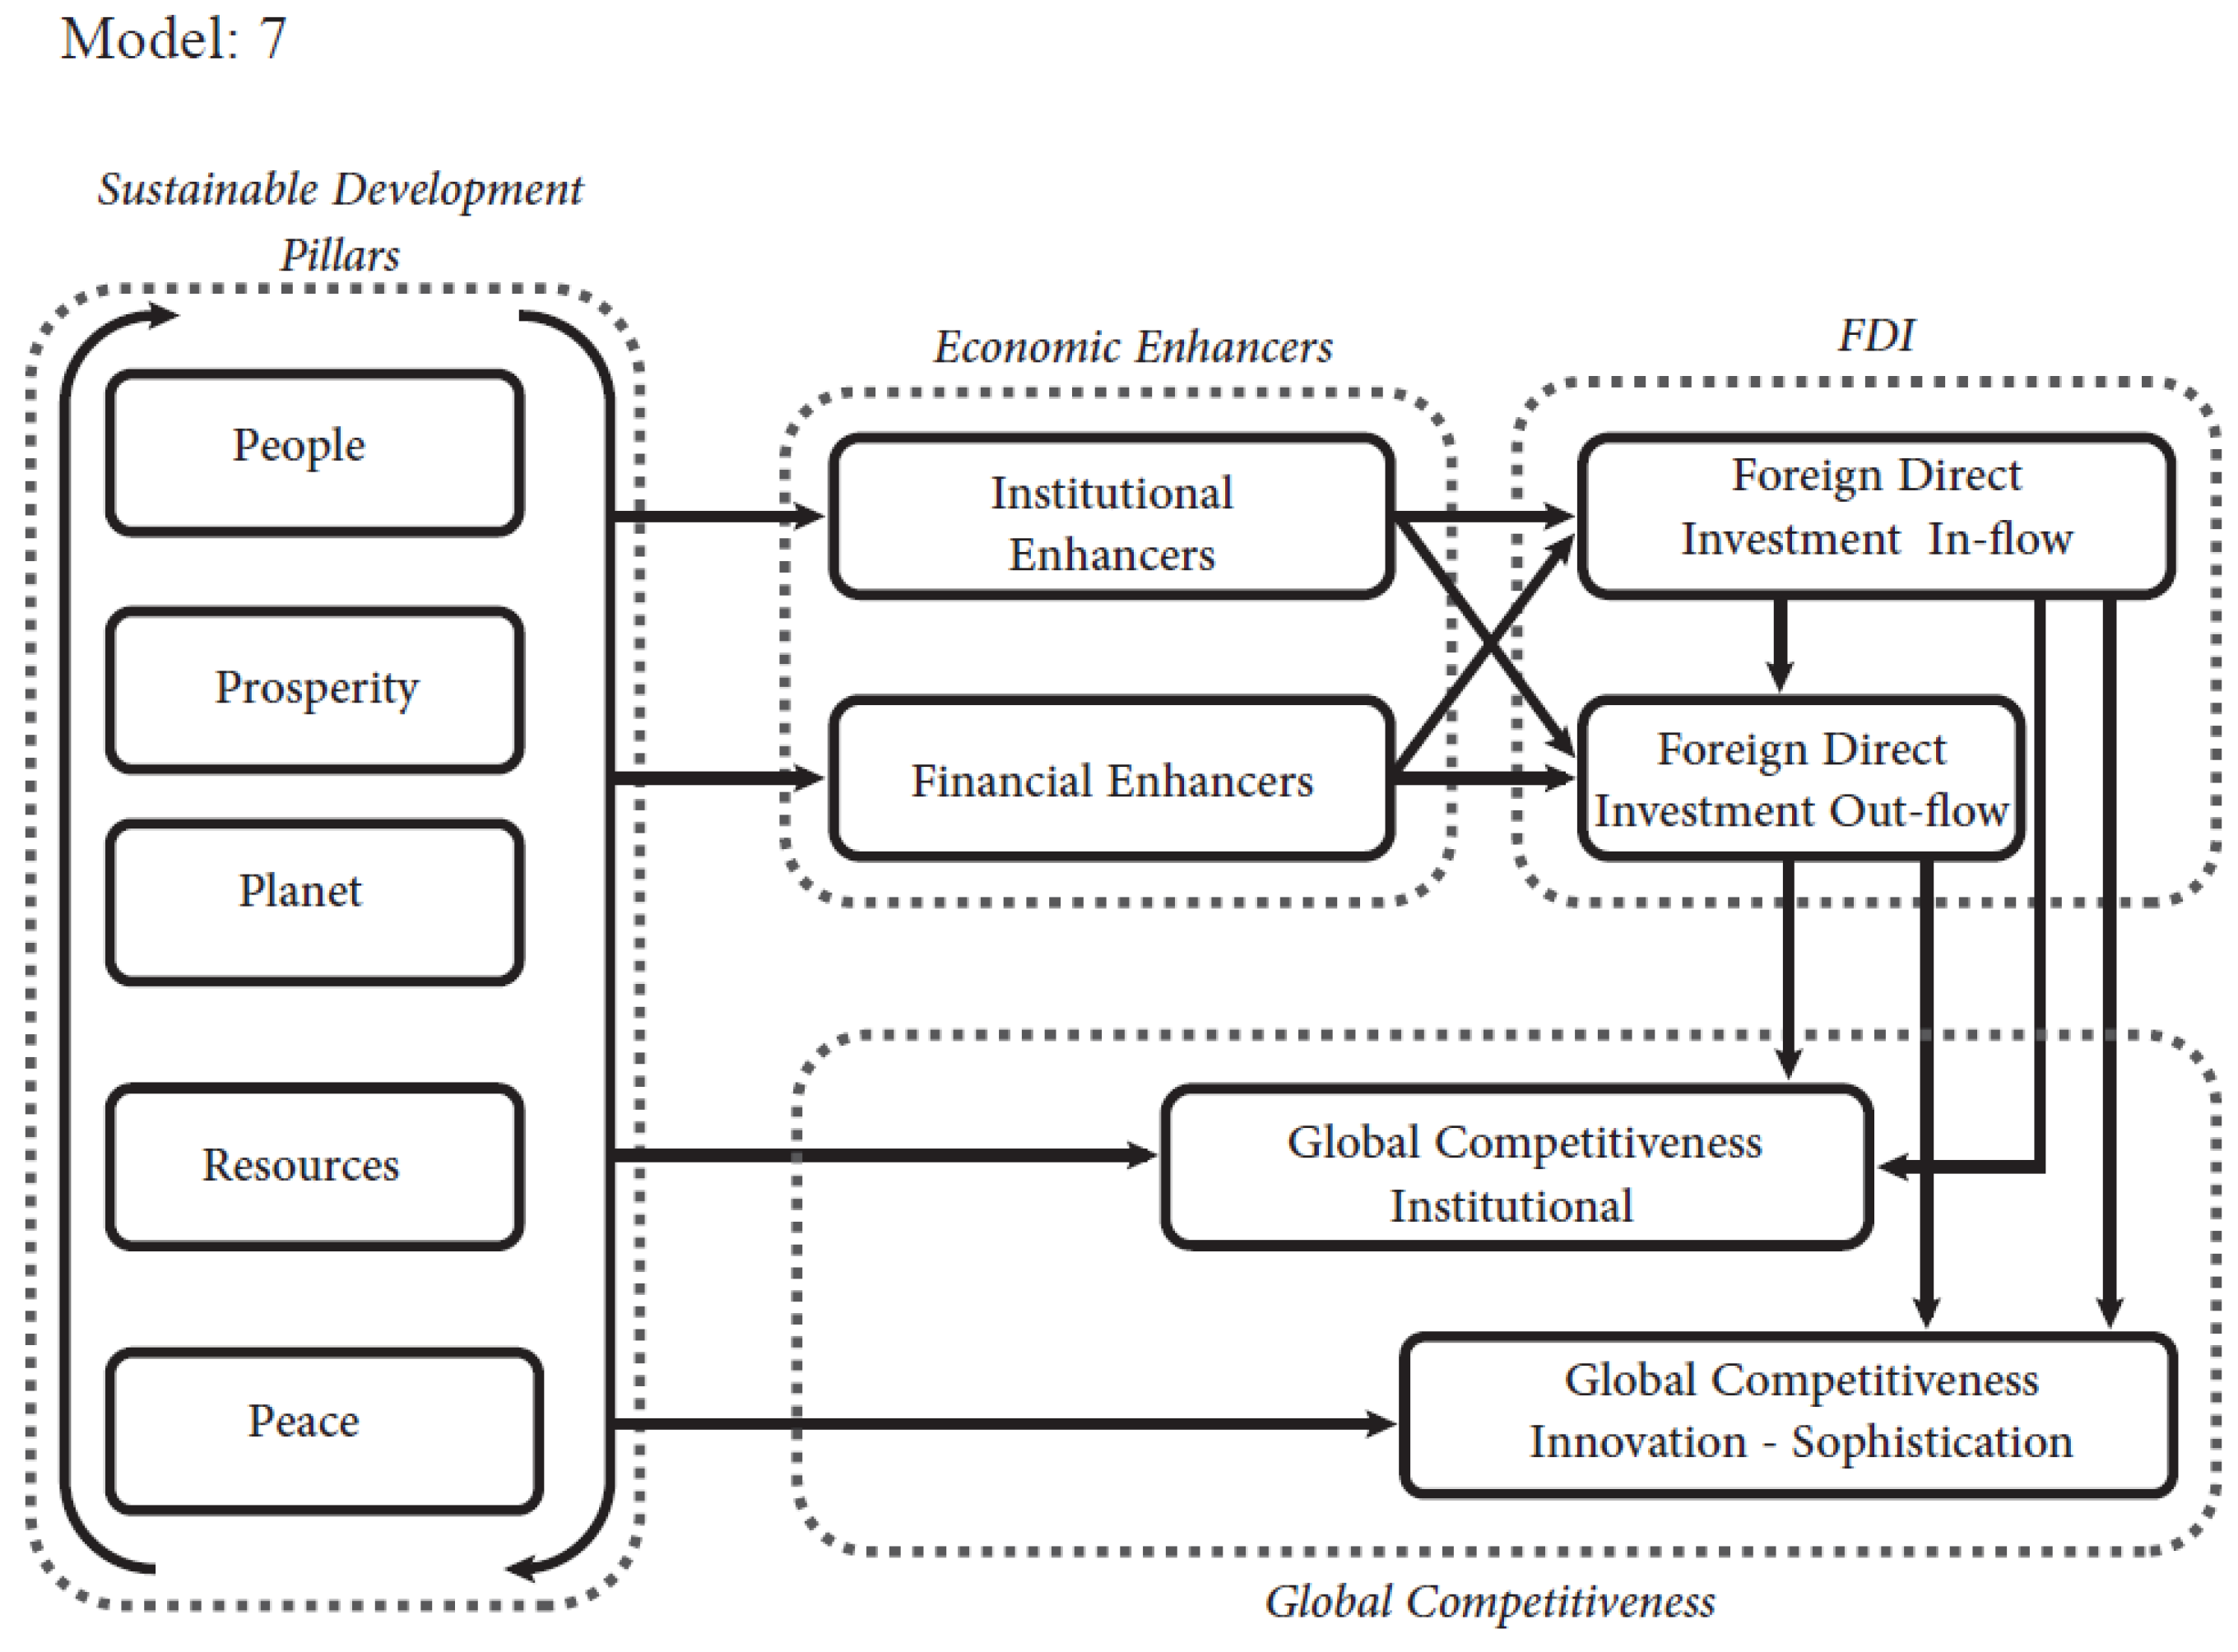
Figure 3.
“Social-turn 1” model including H&LS.
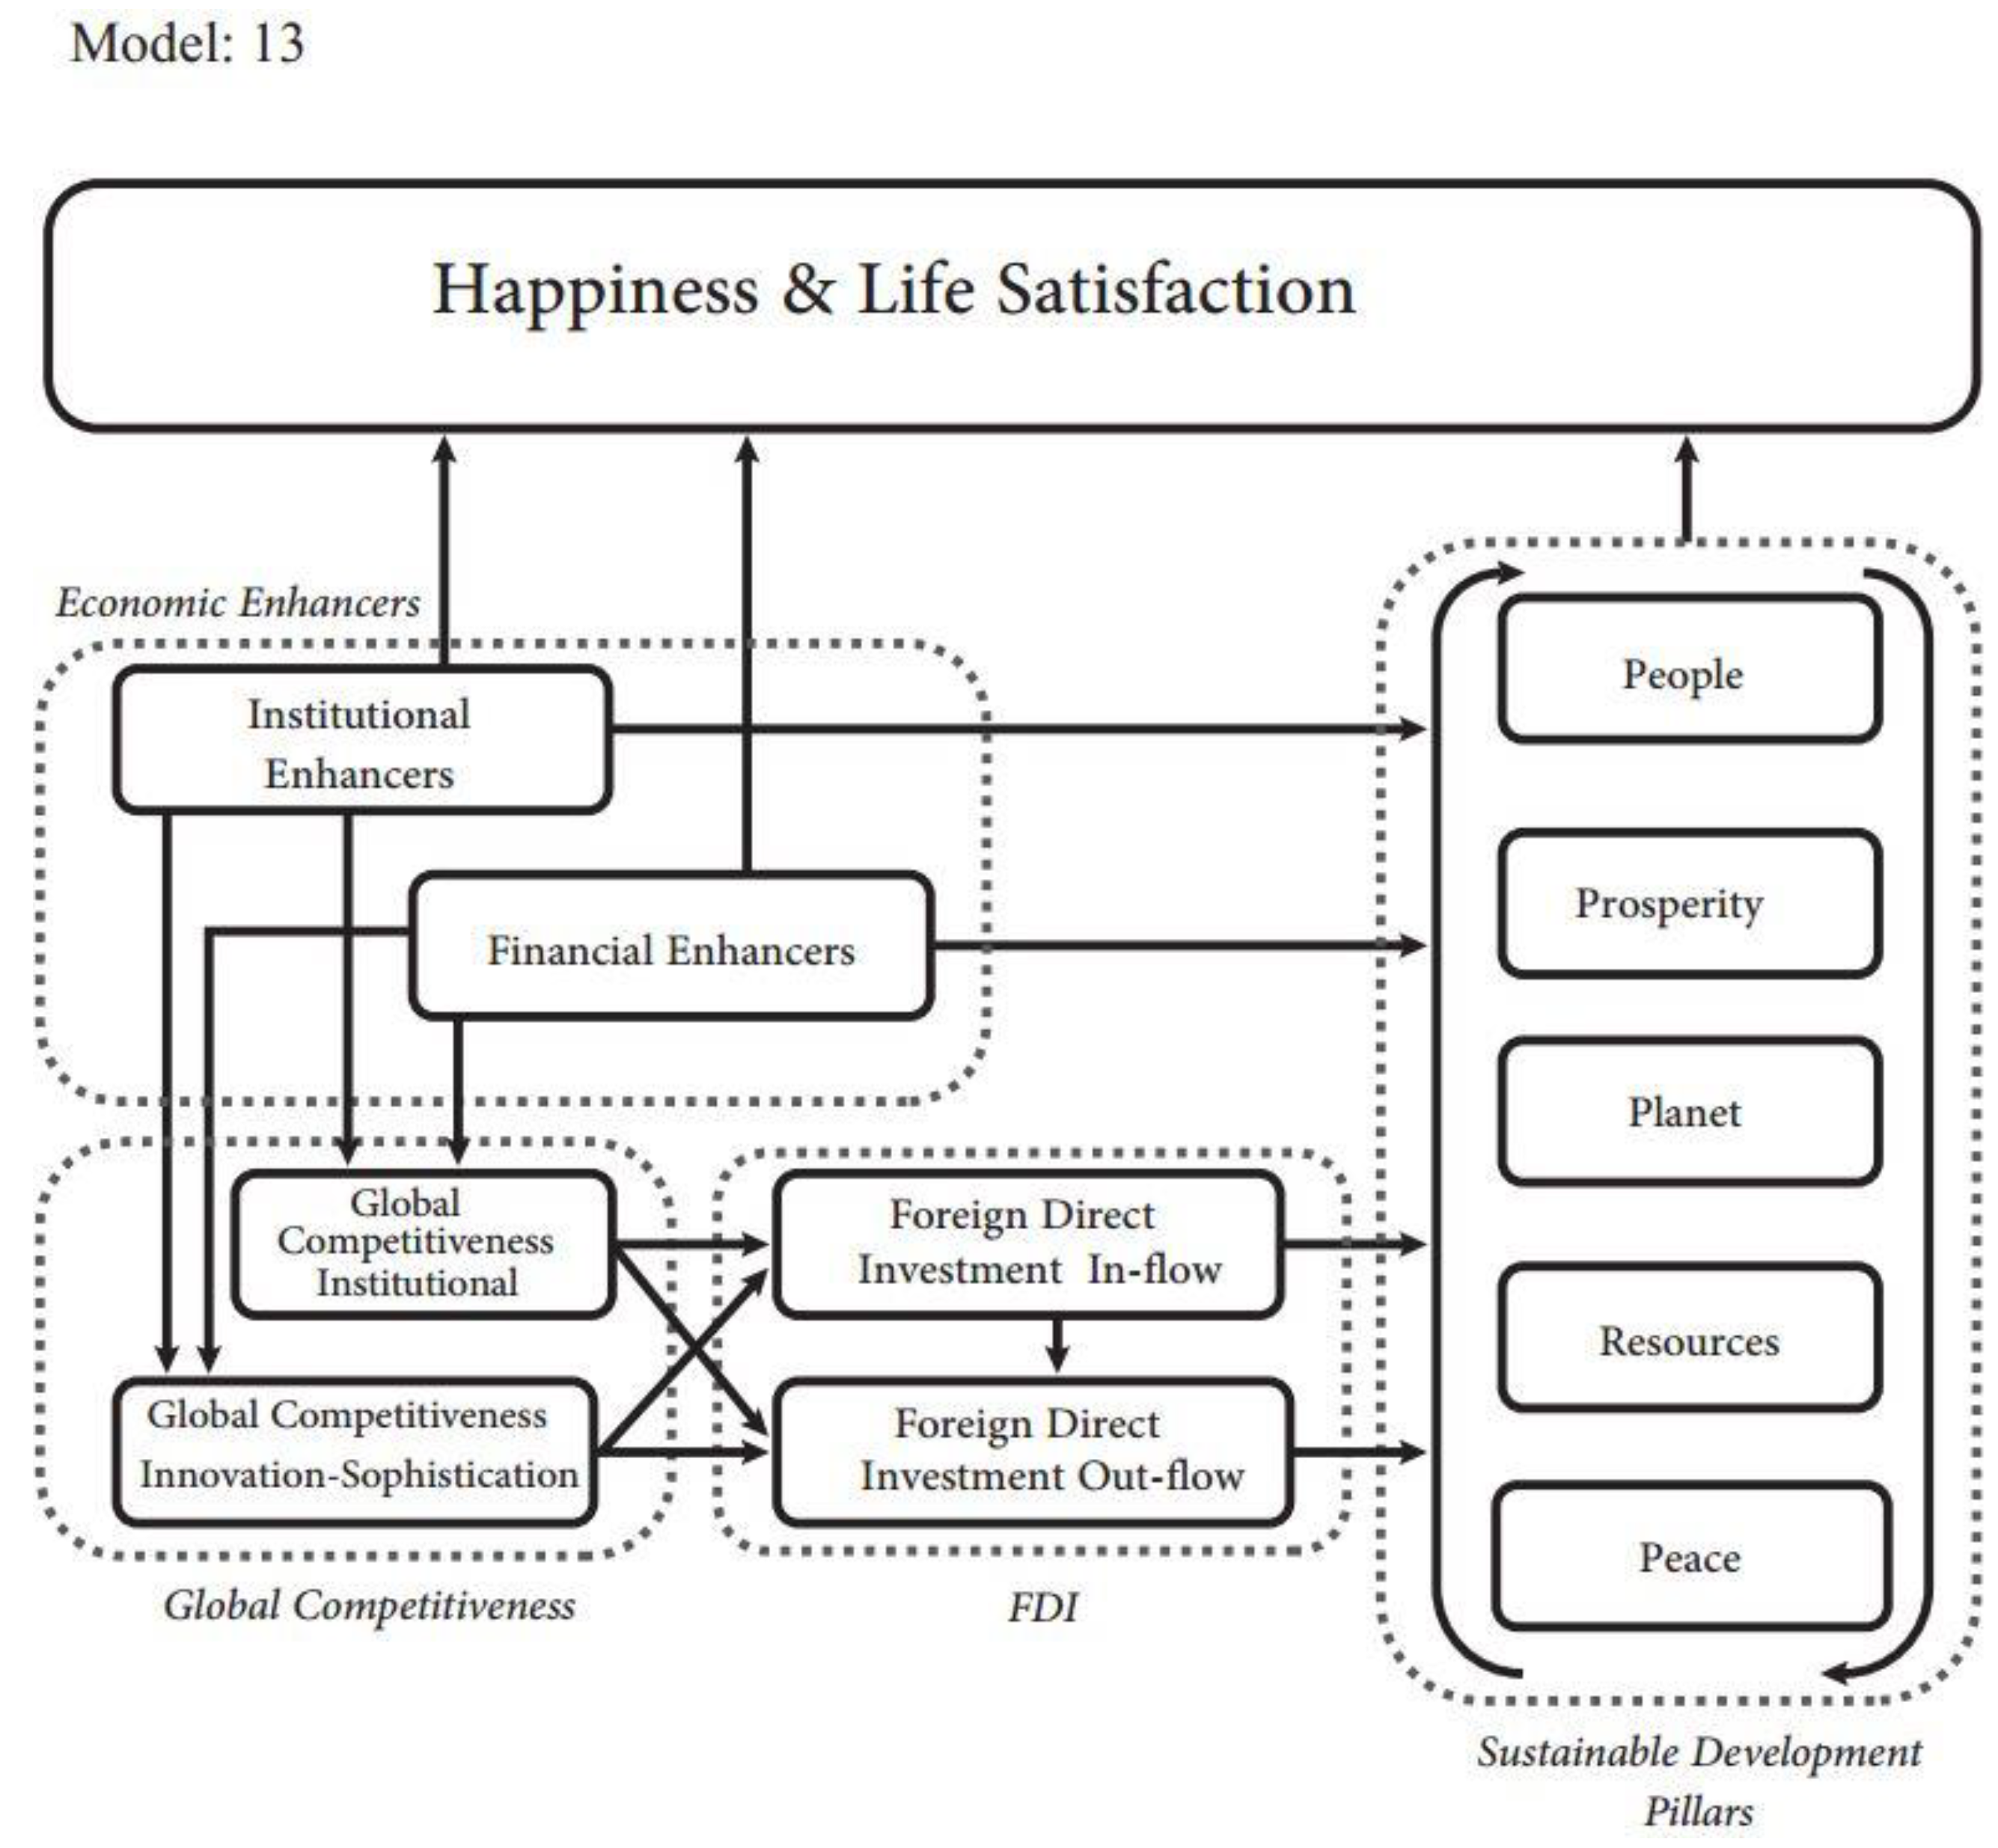
Figure 4.
“Social-turn 2” model including H&LS.
3.4. Creating scores for 129 countries for the relationships among SD pillars and H&LS and country outlier determination.
We employed multilevel analysis to test our theoretical models at the global and country cluster levels. In addition, we used a boxplot chart to determine country outliers for each cluster. Outlier scores are those out of the minimum and maximum whiskers range. Whiskers represent the scores outside the middle (50%) [114] (Figure 5, Figure 7, Figure 9, Figure 11, Figure 13, Figure 15 and Figure 17).
3.5. Assessment of selected models.
Table 3 shows assessment indicators of models 4, 7, 13, and 14. Average full collinearity VIF (AFVIF), Tenenhaus GoF (GoF), and R-squared contribution ratio (RSCR) values for all the models are in the acceptable range. AVIF is acceptable if <= 5, ideally <= 3.3 [115] AFVIF is acceptable if <= 5, ideally <= 3.3 [116]; GoF is small >= 0.1, medium >= 0.25, large >= 0.36 [117] and RSCR is acceptable if >= 0.9, ideally = 1 [118].
Table 3.
Assessment of selected models.
| Model 4 | Model 7 | Model 13 | Model 14 | |
| Average path coefficient (APC) | 0.251, p<0.001 | 0.186, p<0.001 | 0.225, p<0.001 | 0.170, p<0.001 |
| Average adjusted R-squared (AARS) | 0.430, p<0.001 | 0.569, p<0.001 | 0.409, p<0.001 | 0.478, p<0.001 |
| Average full collinearity VIF (AFVIF) | 3.598 | 3.598 | 3.421 | 3.421 |
| Tenenhaus GoF (GoF) | 0.510 | 0.560 | 0.511 | 0.552 |
| R-squared contribution ratio (RSCR) | 0.953 | 0.987 | 0.953 | 0.985 |
4. Results and Discussion
Below, we present the global results, followed by the country clusters and country-level results. Country-level results pertaining to SD pillars’ - H&LS relationships are measured by scores (see Section 3.4). Table 4 shows constructs’ correlations.
4.1. Global level results
We present the results for “Social-turn 1” models first and, after that, those for the “Social-turn 2” models.
4.1.1. Global level results for “Social-turn 1” models (Models 4 and 13)
Table 5 shows global results for the “Social-turn 1” and “Social-turn 2” models.
Institutional Enhancers (i.e., business freedom, property rights, government integrity, and judicial effectiveness) are positively associated with People, Prosperity, Resources, and Peace. These findings are partly supported by [119,120], who found that institutions’ overall efficiency and effectiveness increase the SD level. In contrast, Institutional Enhancers are negatively associated with Planet. In this regard, [121] proposed that although democratic institutions attract investments, most of the investments hurt the quality of the environment.
Financial Enhancers (i.e., government spending, monetary freedom, trade freedom, investment freedom, and financial freedom) are positively associated with People, Prosperity, and Resources. This result is partly in line with the findings of [122], who suggest that the role of government and government spending preferences on education, unemployment, safe water usage, and renewable energy consumption is vital for SD. Financial Enhancers are not associated with Planet but are negatively associated with Peace. The latter findings partly disagree with [123], who noted that economic freedom is negatively associated with homicides. Overall, Financial Enhancers have a weaker association with SD pillars compared to Institutional Enhancers, confirming the importance of countries’ institutional soundness [124]. Both Institutional and Financial Enhancers have a small positive association with H&LS. These findings partly agree with [125], who proposed that both institutional and financial soundness positively influence countries’ multidimensional well-being inequalities.
In sum, GC-Ins positively relate to FDII. It negatively relates to FDIO. It does not relate to Peace, People, Prosperity, Planet, Resources, and H&LS. GC-InnS positively relates to FDII and FDIO. FDII positively relates to FDIO, GC-Ins, Resources, and Peace. It is negatively related to Planet and Prosperity. It does not relate to GC-InnS, People, and H&LS. FDIO positively relates to GC-InnS, Prosperity, and People. It is negatively related to Resources. FDIO does not relate to GC-Ins, Planet, Peace, and H&LS. Institutional Enhancers are positively associated with GC-Ins, GC-InnS, FDII, FDIO, People, Peace, Resources, and Prosperity. However, Institutional Enhancers negatively associate with Planet. Financial Enhancers do not relate to GC-Ins, GC-InnS, FDII, FDIO, and Planet. In contrast, Financial Enhancers positively relate to People, Prosperity, Resources, and H&LS. “Neoliberal-turn” constructs either do not relate (e.g., GC-Ins, FDIO, Financial Enhancers) or relate negatively (FDII, Institutional Enhancers) to Planet. These results illustrate the disconnect between the environmental and economic dimensions. Similarly, “Neoliberal-turn” constructs relate more among themselves and with SD pillars, including economically related indicators.
4.1.2. Global level results for “Social-turn 2” (Models 7 and 14)
Table 5 shows the results for the “Social-turn 2” models. Both GC-Ins and GC-InnS positively relate to H&LS. The positive worldwide association between GC and H&LS suggests positive relationships among national institutions’ effectiveness, research and development, advancement of business development, and H&LS. FDII positively relates to GC-Ins. This finding reaffirms investments’ positive returns-factor interactions generating virtuous cycles leading to attractiveness and confidence in investments. This result also supports the basic idea of institutionalism as well as the requirements and expectations of investments abroad. However, its relationships with GC-InnS and H&LS are insignificant. FDIO positively relates to GC-InnS, but its relationships with GC-Ins and H&LS are insignificant. In accordance with our expectations, advanced economies, which are more likely to be FDIO sources, are to have a higher degree of GC-InnS. However, the insignificant relationship between FDIO and GC-Ins is against expectations. It may have resulted due to canceling out effects. Institutional Enhancers positively relate to GC-Ins, GC-InnS, FDII, and FDIO. These results are in accordance with the basic tenet of the “Neoliberal-turn”. However, its relationship with H&LS is insignificant. Financial Enhancers’ relationships with GC-Ins, GC-InnS, FDII, FDIO, and H&LS were insignificant. These results are against expectations and in contrast to those found for Institutional Enhancers.
Prosperity, Resources, and Peace have the most significant overall effect sizes on GC-Ins, GC-InnS, and H&LS, whereas the corresponding relationships with People and Planet were insignificant. Thus, Prosperity, Resources, and Peace may be viewed as reflecting the degree of national development, which will also include GC-Ins, GC-InnS. These findings suggest that, at the global level, the earth’s biophysical environment is given less importance than wealth generation, building resources, and having safe conditions. These results support, again, the disconnect between the environmental and economic dimensions.
Generally, the results of the “Social-turn 1” and “Social-turn 2” models partly affirm the relationships posed among the socio-ecological constructs in our study, thereby partly supporting Hypothesis 1a and 1b. However, it must be pointed out that 23 out of 30 common relationships between the “Social-turn 1” and “Social-turn 2” models are significantly different. This confirms, like a parallax, the perspective effect. Results’ variability makes it difficult to generalize findings. The only consistent result between these different model types is the strong association between FDII and FDIO.
It may be noted that: a) strictly speaking, it is not possible to relate our findings to prior research when relationships involve any of the five SD pillars because, to the best of our knowledge, this is the first time that such pillars are empirically studied, b) since results are a function of the type and number of relationships, in a study as comprehensive as ours, it is only possible to find past research either, partly supporting or not, specific relationships of our models, as discussed in the literature review as discussed in the literature review section. Similarly, relationships’ codependence also makes it difficult to compare our results to prior research because our models, as systems, have yet to be further tested, and c) we acknowledge our bias because in aiming to steer development, we desire positive relationships among constructs, which as shown by the results such relationships only constitute a subset. However, we acknowledge that specific conditions (e.g., canceling out effects stemming from aggregation and different starting points) may also lead to either negative or insignificant relationships. Consequently, there is the need both to be specific and, for sustainable development, to integrate specific cases in such a way that they produce desirable systemic effects at higher levels.
Table 5.
Results for “Social-turn 1” and “Social-turn 2” models (Models 4, 7, 13, and 14).
| Relationships |
Model 4 Path Coefficients Total Effects / Total Effect Sizes |
Model 7 Path Coefficients Total Effects / Total Effect Sizes |
Model 13 Path Coefficients Total Effects / Total Effect Sizes |
Model 14 Path Coefficients Total Effects / Total Effect Sizes |
| People → GC-Ins | N/A | 0.020 0.022 / 0.010 |
0.372*** 0.202 / 0.101^ |
0.020 0.222 / 0.10 |
| People → GC-InnS | N/A | -0.026 -0.024 / 0.012 |
0.596*** 0.213 / 0.142^ |
-0.164 -0.024 / 0.012 |
| People → H&LS | N/A | N/A | 0.029 0.029 / 0.008 |
0.037 0.036 / 0.011 |
| Prosperity → GC-Ins | N/A | 0.276*** 0.296 / 0.178^^ |
0.530*** 0.102 / 0.052^ |
0.276*** 0.296 / 0.178^^ |
| Prosperity → GC-InnS | N/A | 0.440*** 0.468 / 0.329^^ |
0.669*** 0.678 / 0.426^^^ |
0.440*** 0.468 / 0.329^^^ |
| Prosperity → H&LS | N/A | N/A | 0.130*** 0.130 / 0.053^ |
0.152*** 0.232 / 0.094^ |
| Planet → GC-Ins | N/A | -0.031 -0.030 / 0.008 |
0.204*** 0.390 / 0.214^^ |
-0.031 -0.030 0.008 |
| Planet → GC-InnS | N/A | -0.006 -0.006 / 0.001 |
0.216*** 0.598 / 0.456^^^ |
-0.006 -0.006 / 0.001 |
| Relationships |
Model 4 Path Coefficients Total Effects / Total Effect Sizes |
Model 7 Path Coefficients Total Effects / Total Effect Sizes |
Model 13 Path Coefficients Total Effects / Total Effect Sizes |
Model 14 Path Coefficients Total Effects / Total Effect Sizes |
| Planet → H&LS | N/A | N/A | 0.153*** 0.153 / 0.002 |
0.054* 0.051 / 0.011 |
| Resources → GC-Ins | N/A | 0.177*** 0.185 / 0.099^ |
0.101*** 0.534 / 0.326^^ |
0.177*** 0.185 / 0.099^ |
| Resources → GC-InnS | N/A | 0.159*** 0.170 / 0.095^ |
0.066*** 0.678 / 0.426^^^ |
0.159*** 0.170 / 0.095^^ |
| Resources → H&LS | N/A | N/A | 0.241*** 0.241 / 0.091^ |
0.189*** 0.224 / 0.092^ |
| Peace → GC-Ins | N/A | 0.359*** 0.373 / 0.223^^ |
0.029 0.029 / 0.008 |
0.359*** 0.373 / 0.223^^ |
| Peace → GC-InnS | N/A | 0.279*** 0.299 / 0.171^^ |
0.130*** 0.130 / 0.053^ |
0.279*** 0.299 / 0.171^^ |
| Peace → H&LS | N/A | N/A | -0.050* -0.050 / 0.010 |
0.084*** 0.149 / 0.043^ |
| Institutional Enhancers → GC-Ins | 0.832*** | 0.040 / 0.032^ | 0.802*** | 0.040 / 0.049^ |
| Institutional Enhancers → GC-InnS | 0.854*** | 0.061* / 0.049^ | 0.854*** | 0.061* / 0.078^ |
| Institutional Enhancers → FDII | 0.276*** / 0.082^ | 0.265*** | 0.276*** / 0.082^ | 0.265*** |
| Institutional Enhancers → FDIO | 0.329*** / 0.118^ | 0.162*** | 0.329*** / 0.118^ | 0.162*** |
| Institutional Enhancers → People | 0.372*** 0.390 / 0.214^^ |
N/A | 0.372*** 0.390 / 0.214^^ |
N/A |
| Institutional Enhancers → Prosperity | 0.596*** 0.598 / 0.456^^^ |
N/A | 0.596*** 0.598 / 0.456^^^ |
N/A |
| Institutional Enhancers → Planet | -0.342*** -0.361 / 0.085^ |
N/A | -0.342*** -0.361 / 0.085^ |
N/A |
| Institutional Enhancers → Resources | 0.530*** 0.534 / 0.326^ |
N/A | 0.530*** 0.534 / 0.326^ |
N/A |
| Institutional Enhancers → Peace | 0.669*** 0.678 / 0.426^^^ |
N/A | 0.669*** 0.678 / 0.426^^^ |
N/A |
| Institutional Enhancers → H&LS | N/A | N/A | 0.134*** 0.262 / 0.103^ |
0.011 / 0.004 |
| Financial Enhancers → GC-Ins | 0.016 | 0.004 / 0.002 | 0.016 | 0.004 / 0.002 |
| Financial Enhancers → GC-InnS | 0.074* | -0.003 / 0.002 | -0.074** | -0.003 / 0.002 |
| Financial Enhancers → FDII | -0.011 / 0.003 | 0.040 | -0.011 / 0.003 | 0.040 |
| Financial Enhancers → FDIO | -0.034 / 0.009 | -0.049* | -0.034 / 0.009 | -0.048* |
| Financial Enhancers → People | 0.204*** 0.202 / 0.101^ |
N/A | 0.204*** 0.202 / 0.101^ |
N/A |
| Financial Enhancers → Prosperity | 0.216*** 0.213 / 0.142^ |
N/A | 0.216*** 0.213 / 0.142^ |
N/A |
| Financial Enhancers → Planet | 0.166*** 0.166 / 0.018 |
N/A | 0.166*** 0.166 / 0.018 |
N/A |
| Financial Enhancers → Resources | 0.101*** 0.102 / 0.52^ |
N/A | 0.101*** 0.102 / 0.0.52^ |
N/A |
| Financial Enhancers → Peace | -0.066*** -0.678 / 0.030^ |
N/A | -0.066*** -0.66 / 0.032^ |
N/A |
| Financial Enhancers → H&LS | N/A | N/A | 0.083*** 0.170 / 0.063^ |
-0.000 / 0.000 |
| FDII → GC-Ins | N/A | 0.102*** | N/A | 0.102*** |
| FDII → GC-InnS | N/A | -0.003 | N/A | -0.003 |
| FDII → FDIO | 0.785*** | 0.787*** | 0.785*** | 0.787*** |
| FDII → People | -0.007 | N/A | -0.007 | N/A |
| FDII → Prosperity | -0.117*** | N/A | -0.117*** | N/A |
| Relationships |
Model 4 Path Coefficients Total Effects / Total Effect Sizes |
Model 7 Path Coefficients Total Effects / Total Effect Sizes |
Model 13 Path Coefficients Total Effects / Total Effect Sizes |
Model 14 Path Coefficients Total Effects / Total Effect Sizes |
| FDII → Planet | -0.089*** | N/A | -0.089*** | N/A |
| FDII → Resources | 0.107*** | N/A | 0.107*** | N/A |
| FDII → Peace | 0.070* | N/A | 0.070* | N/A |
| FDII → H&LS | N/A | N/A | -0.006 / 0.001 | 0.025 / 0.004 |
| FDIO → GC-Ins | N/A | 0.034 | N/A | 0.034 |
| FDIO → GC-InnS | N/A | 0.168*** | N/A | 0.168*** |
| FDIO → People | 0.062* | N/A | 0.062* | N/A |
| FDIO → Prosperity | 0.105*** | N/A | 0.105*** | N/A |
| FDIO → Planet | 0.019 | N/A | 0.019 | N/A |
| FDIO → Resources | -0.077* | N/A | -0.077* | N/A |
| FDIO → Peace | -0.033 | N/A | -0.033 | N/A |
| FDIO → H&LS | N/A | N/A | 0.001 / 0.000 | 0.024 / 0.004 |
| GC-Ins → FDII | 0.154*** | N/A | 0.154*** | N/A |
| GC-Ins → FDIO | -0.180*** | N/A | -0.180*** | N/A |
| GC-Ins → People | -0.005 / 0.002 | N/A | -0.005 / 0.002 | N/A |
| GC-Ins → Prosperity | -0.024 / 0.015 | N/A | -0.024 / 0.015 | N/A |
| GC-Ins → Planet | -0.015 / 0.004 | N/A | -0.015 / 0.004 | N/A |
| GC-Ins → Resources | 0.021 / 0.011 | N/A | 0.021 / 0.011 | N/A |
| GC-Ins → Peace | 0.013 / 0.008 | N/A | 0.013 / 0.008 | N/A |
| GC-Ins → H&LS | N/A | N/A | -0.001 / 0.000 | 0.071** |
| GC-InnS → FDII | 0.179*** | N/A | 0.179*** | N/A |
| GC-InnS → FDIO | 0.299*** | N/A | 0.299*** | N/A |
| GC-InnS → People | 0.026 / 0.012 | N/A | 0.026 / 0.012 | N/A |
| GC-InnS → Prosperity | 0.025 / 0.018 | N/A | 0.025 / 0.018 | N/A |
| GC-InnS → Planet | -0.008 / 0.002 | N/A | -0.008 / 0.002 | N/A |
| GC-InnS → Resources | -0.015 / 0.008 | N/A | -0.015 / 0.008 | N/A |
| GC-InnS → Peace | -0.002 / 0.001 | N/A | -0.002 / 0.001 | N/A |
| GC-InnS → H&LS | N/A | N/A | -0.001 / 0.000 | 0.125*** |
| Notes: Significance Level: *p < 0.05, **p <0.01, ***p< 0.001. Effect Sizes ^ 0.02 < e < 0.15 = Low effect size, ^^ 0.15 < e < 0.35 = Medium effect size, ^^^ e > 0.35 = Strong effect size. N/A: The results of the relationships are not available. | ||||
4.2. Comparison of country clusters (“Social-turn 1.2” (Model 15) and “Social-turn 2” (Model 14)).
We created another model, “Social-turn 1.2” (Model 15) (Figure 5), to maximize, and compare, the number of common relationships between the neoliberal turn constructs and the five SD pillars. Table 6 shows the Country Cluster Results for the “Social-turn 1.2” and “Social-turn 2” models (Model 14 and Model 15).
Figure 5.
“Social-turn 1.2” (Model 15).
In Advanced Economies, Institutional Enhancers’ and Financial Enhancers’ relationships with both FDII and FDIO are approximately the same in the “Social-turn 2” model than in “Social-turn 1.2”. On the contrary, FDIO and FDIO’s relationships with both GC-Ins and GC-InnS are stronger in the “Social-turn 1.2” model than in the “Social-turn 2” model.
In Emerging and Developing Europe, Institutional Enhancers’ relationship with FDII is significant only in the “Social-turn 1.2” model, whereas Institutional Enhancers’ relationship with FDIO is not. Financial Enhancers’ relationship with FDII and FDIO is non-significant in both the “Social-turn 1.2” and “Social-turn 2” models. FDII and FDIO’s relationships with GC-Ins and GC-InnS in both “Social-turn 1.2” and “Social-turn 2” models are moderately positive.
In Emerging and Developing Asia, the most common relationships between the “Social-turn 1.2” and “Social-turn 2” models are approximately the same, except the FDIO relationships with both GC-Ins and GC-InsS, which are stronger in the “Social-turn 1.2” model than in the “Social-turn 2” model.
In the Middle East, North Africa & Pakistan, Institutional Enhancers and Financial Enhancers’ relationships with FDII and FDIO are approximately the same in both the “Social-turn 1.2” and “Social-turn 2” models. However, FDII’s and FDIO’s relationships with both GC-Ins and GC-InnS are significant in the “Social-turn 1.2” model, whereas such relationships are insignificant in the “Social-turn 2” model.
In Latin America & the Caribbean, most common relationships are approximately the same in both the “Social-turn 1.2” and “Social-turn 2” models. However, Financial Enhancers’ relationship with FDIO is negative in the “Social-turn 2” model, whereas it is non-significant in the “Social-turn 1.2” model. In addition, FDIO’s relationships with both GC-Ins and GC-InnS are significant in the “Social-turn 1.2” model and non-significant in the “Social-turn 2” model.
In Sub-Saharan Africa, most of the common relationships between the “Social-turn 1.2” and “Social-turn 2” models are approximately the same, except the relationships between FDIO with both GC-Ins and GC-InnS which are only significant in the “Social-turn 1.2” model.
In Commonwealth countries, common relationships between the “Social-turn 1.2” and “Social-turn 2” models are very similar. In the “Social-turn 2” model, FDII’s relationship with GC-Ins is significant, whereas this relationship in the “Social-turn 1.2” model is not. Furthermore, FDII’s relationship with GC-InnS is negative in the “Social-turn 1.2” model and non-significant in the “Social-turn 2” model.
Among all the clusters, only in Emerging and Developing Asia, Institutional Enhancers have a significant negative relationship with FDII. In addition, in Latin America & the Caribbean, Sub-Saharan Africa, and Commonwealth clusters, Financial Enhancers are negatively associated with FDIO. Moreover, only in Emerging and Developing Europe, FDIO has a negative association with GC-Ins. Out of nine common relationships between “Social-turn 1.2” and Social-turn 2” models in seven country clusters, that is, a total of 63 relationships, only about one third of them significantly differ between the two models. Most of such differences involve FDIO relating to GC-Ins and GC-InsS. FDIO variability among 129 countries may explain these results. Common results between the “Social-turn 1.2” and Social-turn 2” models seem to support our expectations expressed in the hypotheses. Similarly, specific model results suggest moderate to strong relationships between SD Pillars and socioeconomic constructs (i.e., Financial Enhancers, Institutional Enhancers, FDII, FDIO, GC-Ins, and GC-InnS). However, the model-specific relationships between SD pillars and neoliberal constructs drastically vary according to the country cluster. Thus, common and different relationships within and between country clusters suggest the need to analyze every single country cluster separately
4.3. Country Cluster Level Comparison of SD Pillars’ relationships with H&LS for “Social-turn 1” (Model 13), “Social-turn 1.2” (Model 15), and “Social-turn 2” (Model 14).
Table 7 shows the comparison of the results of common relationships (SD pillars → H&LS) between the "Social-turn 1" (Model 13), "Social-turn 1.2" (Model 15), and "Social-turn 2" (Model 14). All relationships referred to in this section pertain to the five SD pillars with H&LS.
In Advanced Economies and Emerging & Developing Europe clusters, the results of the “Social-turn 2” and “Social-turn 1”, Social-turn 1.2” models are about the same, in terms of paths’ statistical significance, for the relationships involving Planet, People, and Peace. However, the Prosperity and Resources relationships were only significant for the “Social-turn 2” model. For the Emerging &Developing Asia cluster, results are significant for the three models only for Prosperity as well as for Resources and Peace for only the “Social-turn 2” model. The Middle East, North Africa & Pakistan cluster has only significant relationships for Peace (the three models), and Resources (“Social-turn 1”, Social-turn 1.2” models). Latin America & the Caribbean cluster has strong positive path coefficients for Planet and Resources for the three models. The Sub-Saharan Africa cluster has similar results, in terms of statistical significance, for Peace (positive path coefficients) and Planet (insignificant path coefficients). The Commonwealth cluster has positive path coefficients for People and Prosperity for the three models.
There were either non-significant or negative relationships in the three models for a) the pillar People for Emerging & Developing Asia and Emerging & Developing Europe, and the Middle East, North Africa & Pakistan clusters; b) the pillar Prosperity for Middle East, North Africa & Pakistan, Latin America & the Caribbean, and Sub-Saharan Africa clusters; and c) the pillar Planet for Advanced Economies, Emerging & Developing Asia, Emerging & Developing Europe, the Middle East, North Africa & Pakistan, and Sub-Saharan Africa clusters.
Non-significant or negative relationships for the five SD pillars across clusters are similar, around 50%, except for the pillar Planet, for which only 5 out 21 path coefficients were positive and significant. Advanced Economies and the Commonwealth clusters have the largest number of positive relationships, 8 and 9 out of 15, respectively.
Overall, only 39 out of 105 relationships between any of the five SD pillars and H&LS were positive and significant. In other words, at the cluster level, only 37% of expected positive relationships were supported. Possible explanations include a lack of expected desirable development, canceling out effects due to aggregation, wrong expectations posed, disassociations between H & LS and the five SD pillars, and or the type of models’ functional relationships.
Path coefficient differences occur not only between the “Social-turn 1” and Social-turn 2” models but also between the “Social-turn 1” and “Social-turn 1.2” models.
In Emerging Asia and Emerging Europe, the “Social-turn 2” model has a higher explanatory power of H&LS than the “Social-turn 1” model. The ‘Social-turn 2” model’s comprehensiveness and paths’ configurations may explain such results.
The “Social-turn 2” model (Model 14) reflects the comprehensive effects of the SD’s economic, social, and environmental dimensions on H&LS. In contrast, the “Social-turn 1 and Social-turn 1.2” models give primacy to the economic dimension. The “Social-turn 2” model may be considered superior to the “Social-turn 1 and Social-turn 1.2” models because it has higher explanatory power than the “Social-turn 1 and Social-turn 1.2” models, and conceptually, it circumscribes the economic dimension within a more encompassing socio-ecological framework. Therefore, we base the remainder of our analyses on the “Social-turn 2” model
4.4. Country-Level Results per Cluster (“Social–turn 2” model)
Country level per cluster results provides additional information from the country cluster and global results (Figure 6, Figure 7, Figure 8, Figure 9, Figure 10, Figure 11, Figure 12, Figure 13, Figure 14, Figure 15, Figure 16, Figure 17 and Figure 18).
4.4.1. Advanced economies
People, Prosperity, Resources, and Peace moderately and positively relate to H&LS (Figure 6 and Figure 7); however, Planet negatively relates to it. This result is also partly supported by [126] findings, who, in 23 developed economies, found that the environmental degradation relationship with people’s happiness was not significant. This cluster has two country outliers: Australia (Planet) and Portugal (People) (Figure 6). In Australia, Planet negatively relates to H&LS. Long-term climate change projections show that climate change is more extensive than expected and that irreversibility of environmental changes is highly recognized [127]. Similarly, in Portugal, the People’s pillar is one of the central developmental issues in the country due to the low completion rate of higher education [128,129].
Figure 6.
Advanced Economies - Cluster level SD Pillars - H&LS relationships.
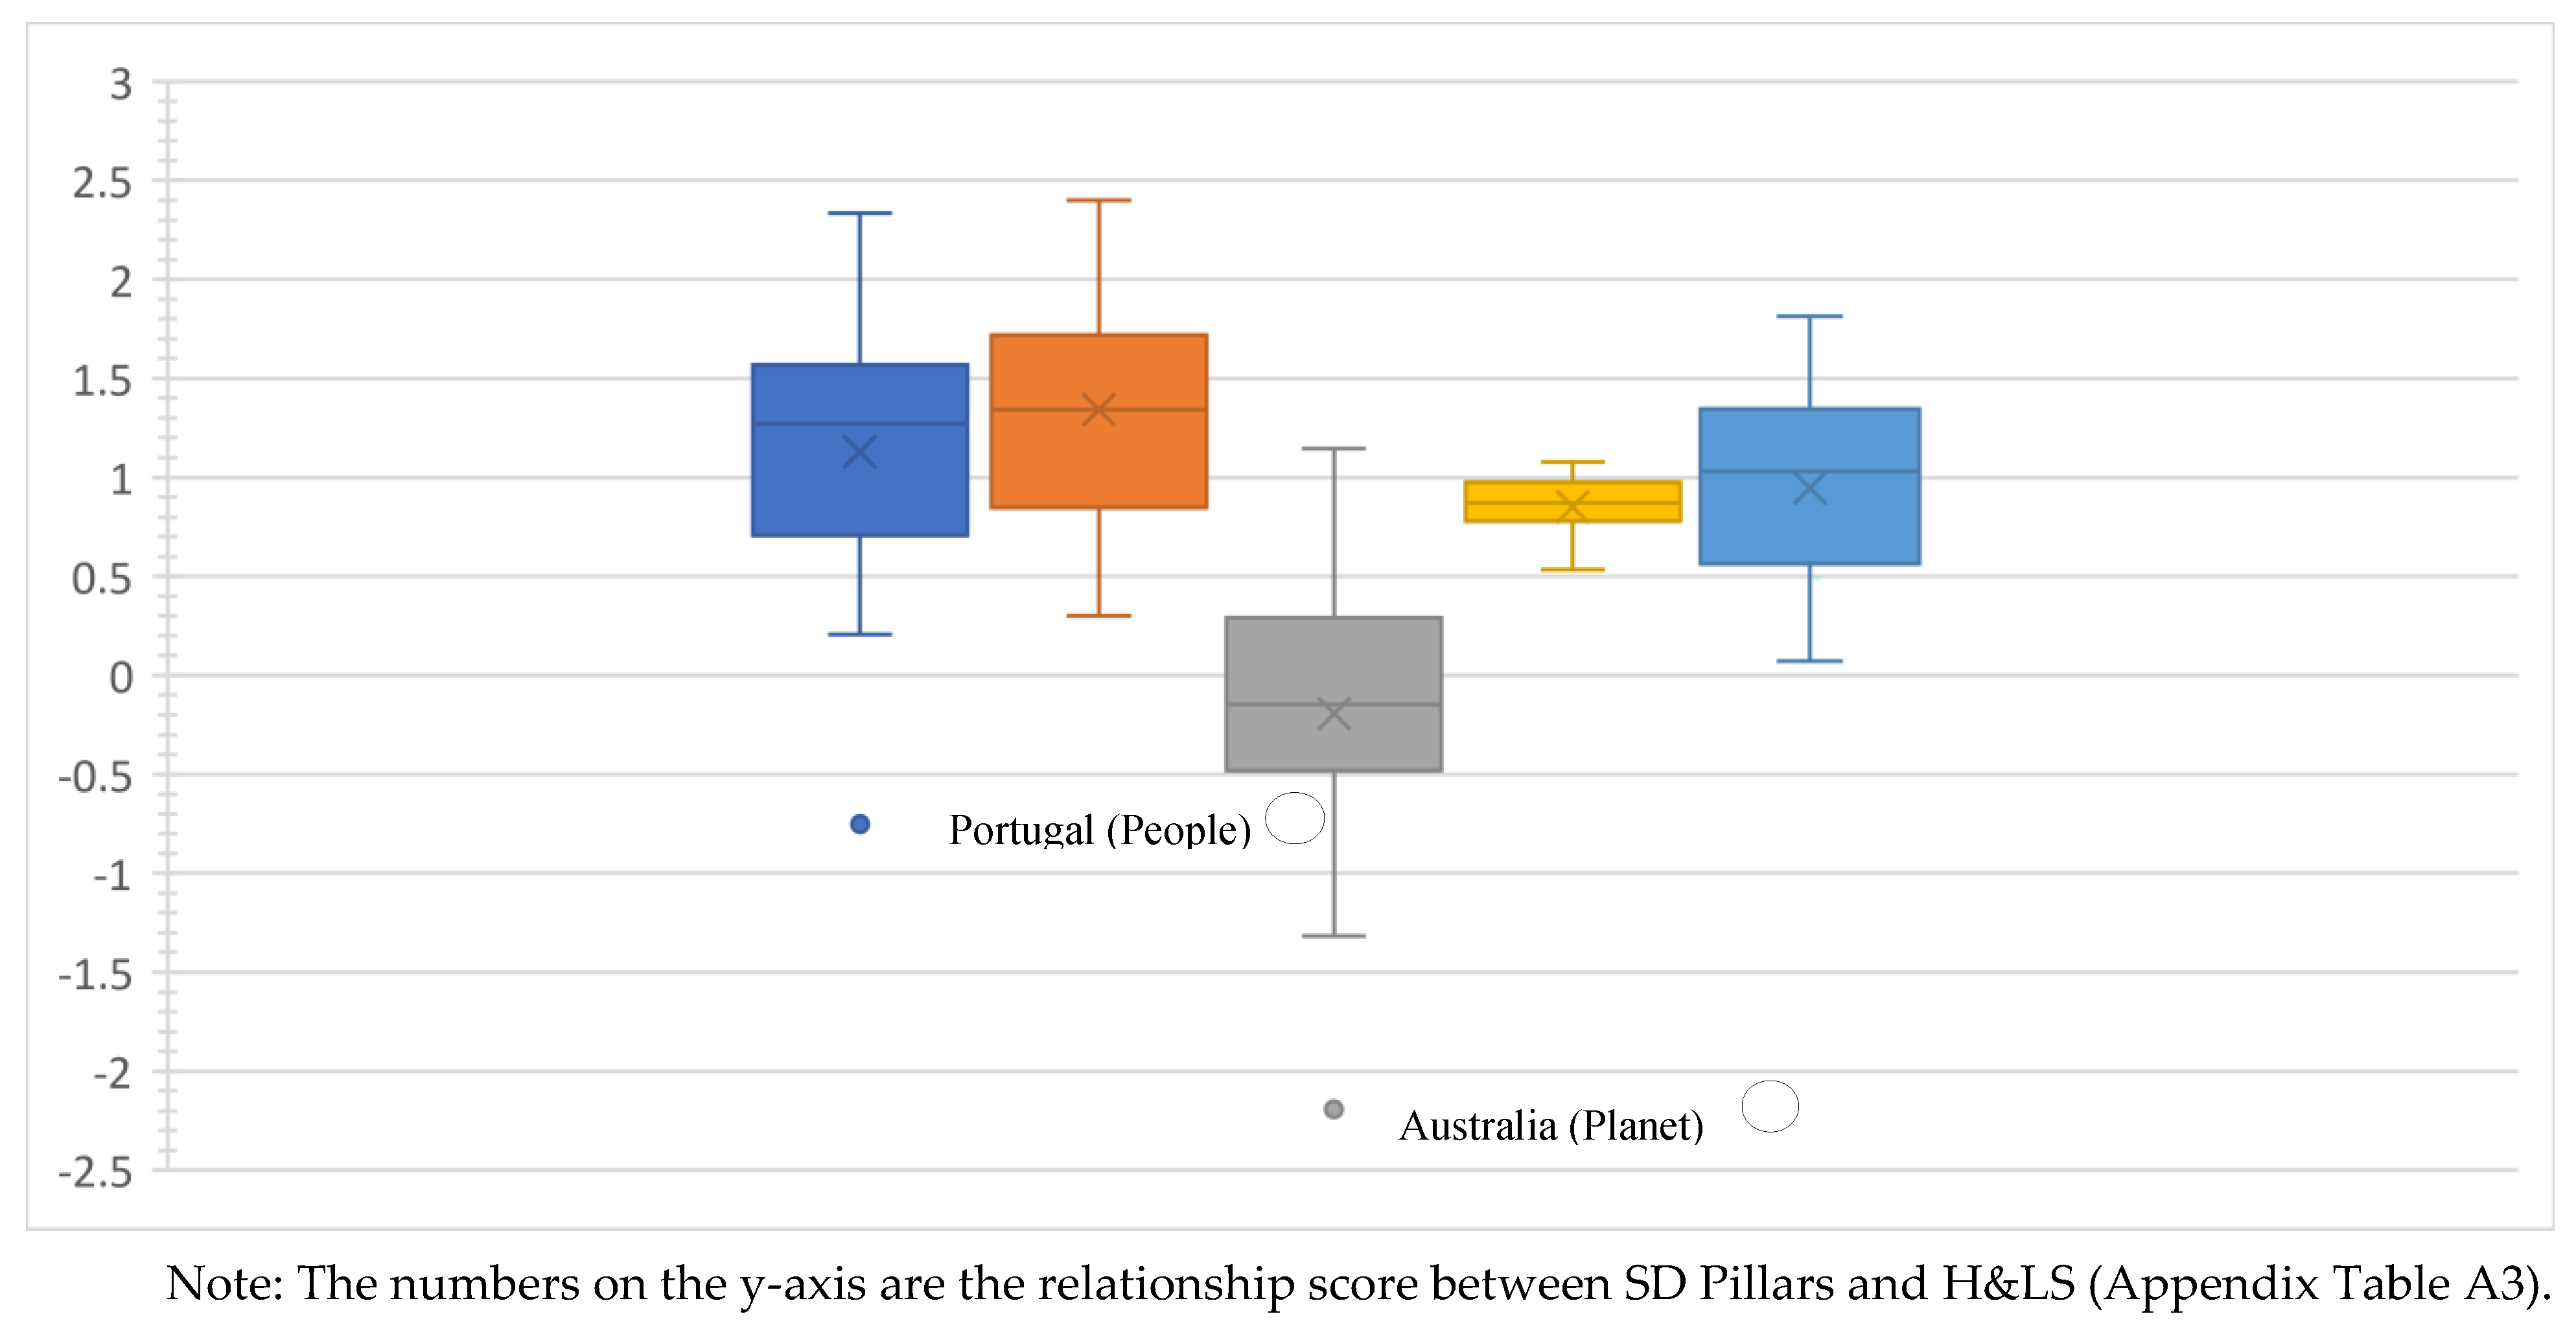
Figure 7.
Advanced Economie - Country level SD Pillars - H&LS relationships.
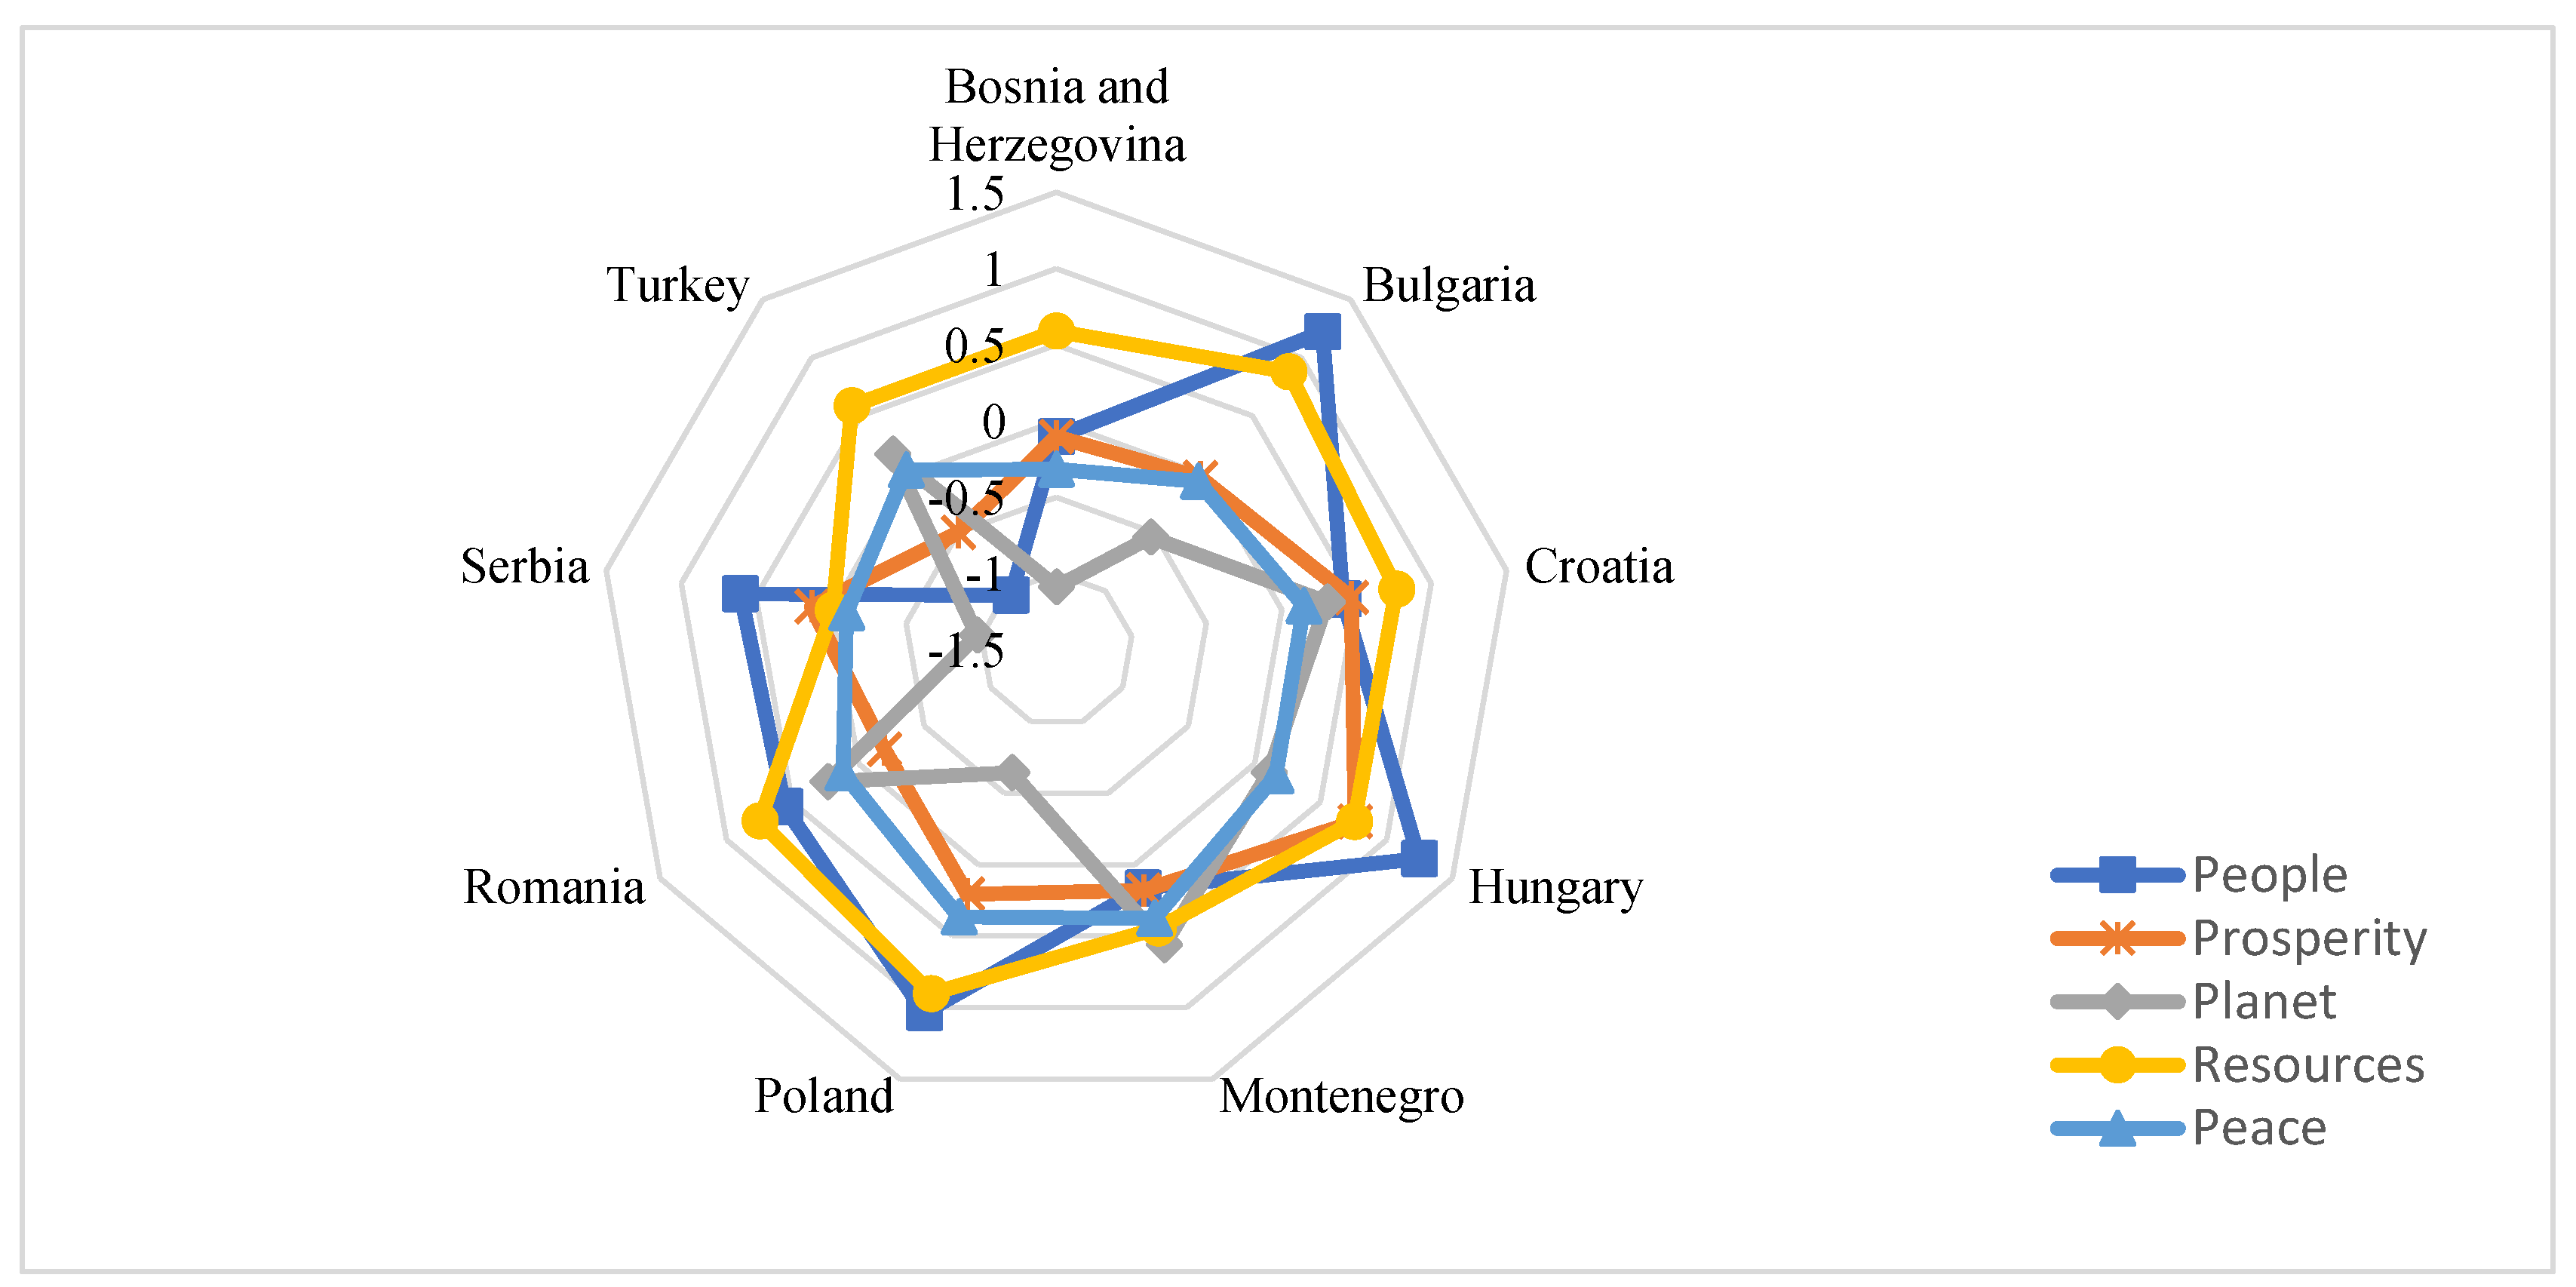
4.4.2. Emerging & Developing Europe
People and Resources contribute the most to H&LS, followed by Prosperity and Peace. However, Planet is negatively associated with H&LS. This is partly in line with the findings of [130,131], who show that environmental degradation impacts life satisfaction. This cluster has no country outlier (Figure 8 and Figure 9).
Figure 8.
Emerging and Developing Europe - Cluster level SD Pillars - H&LS relationships.
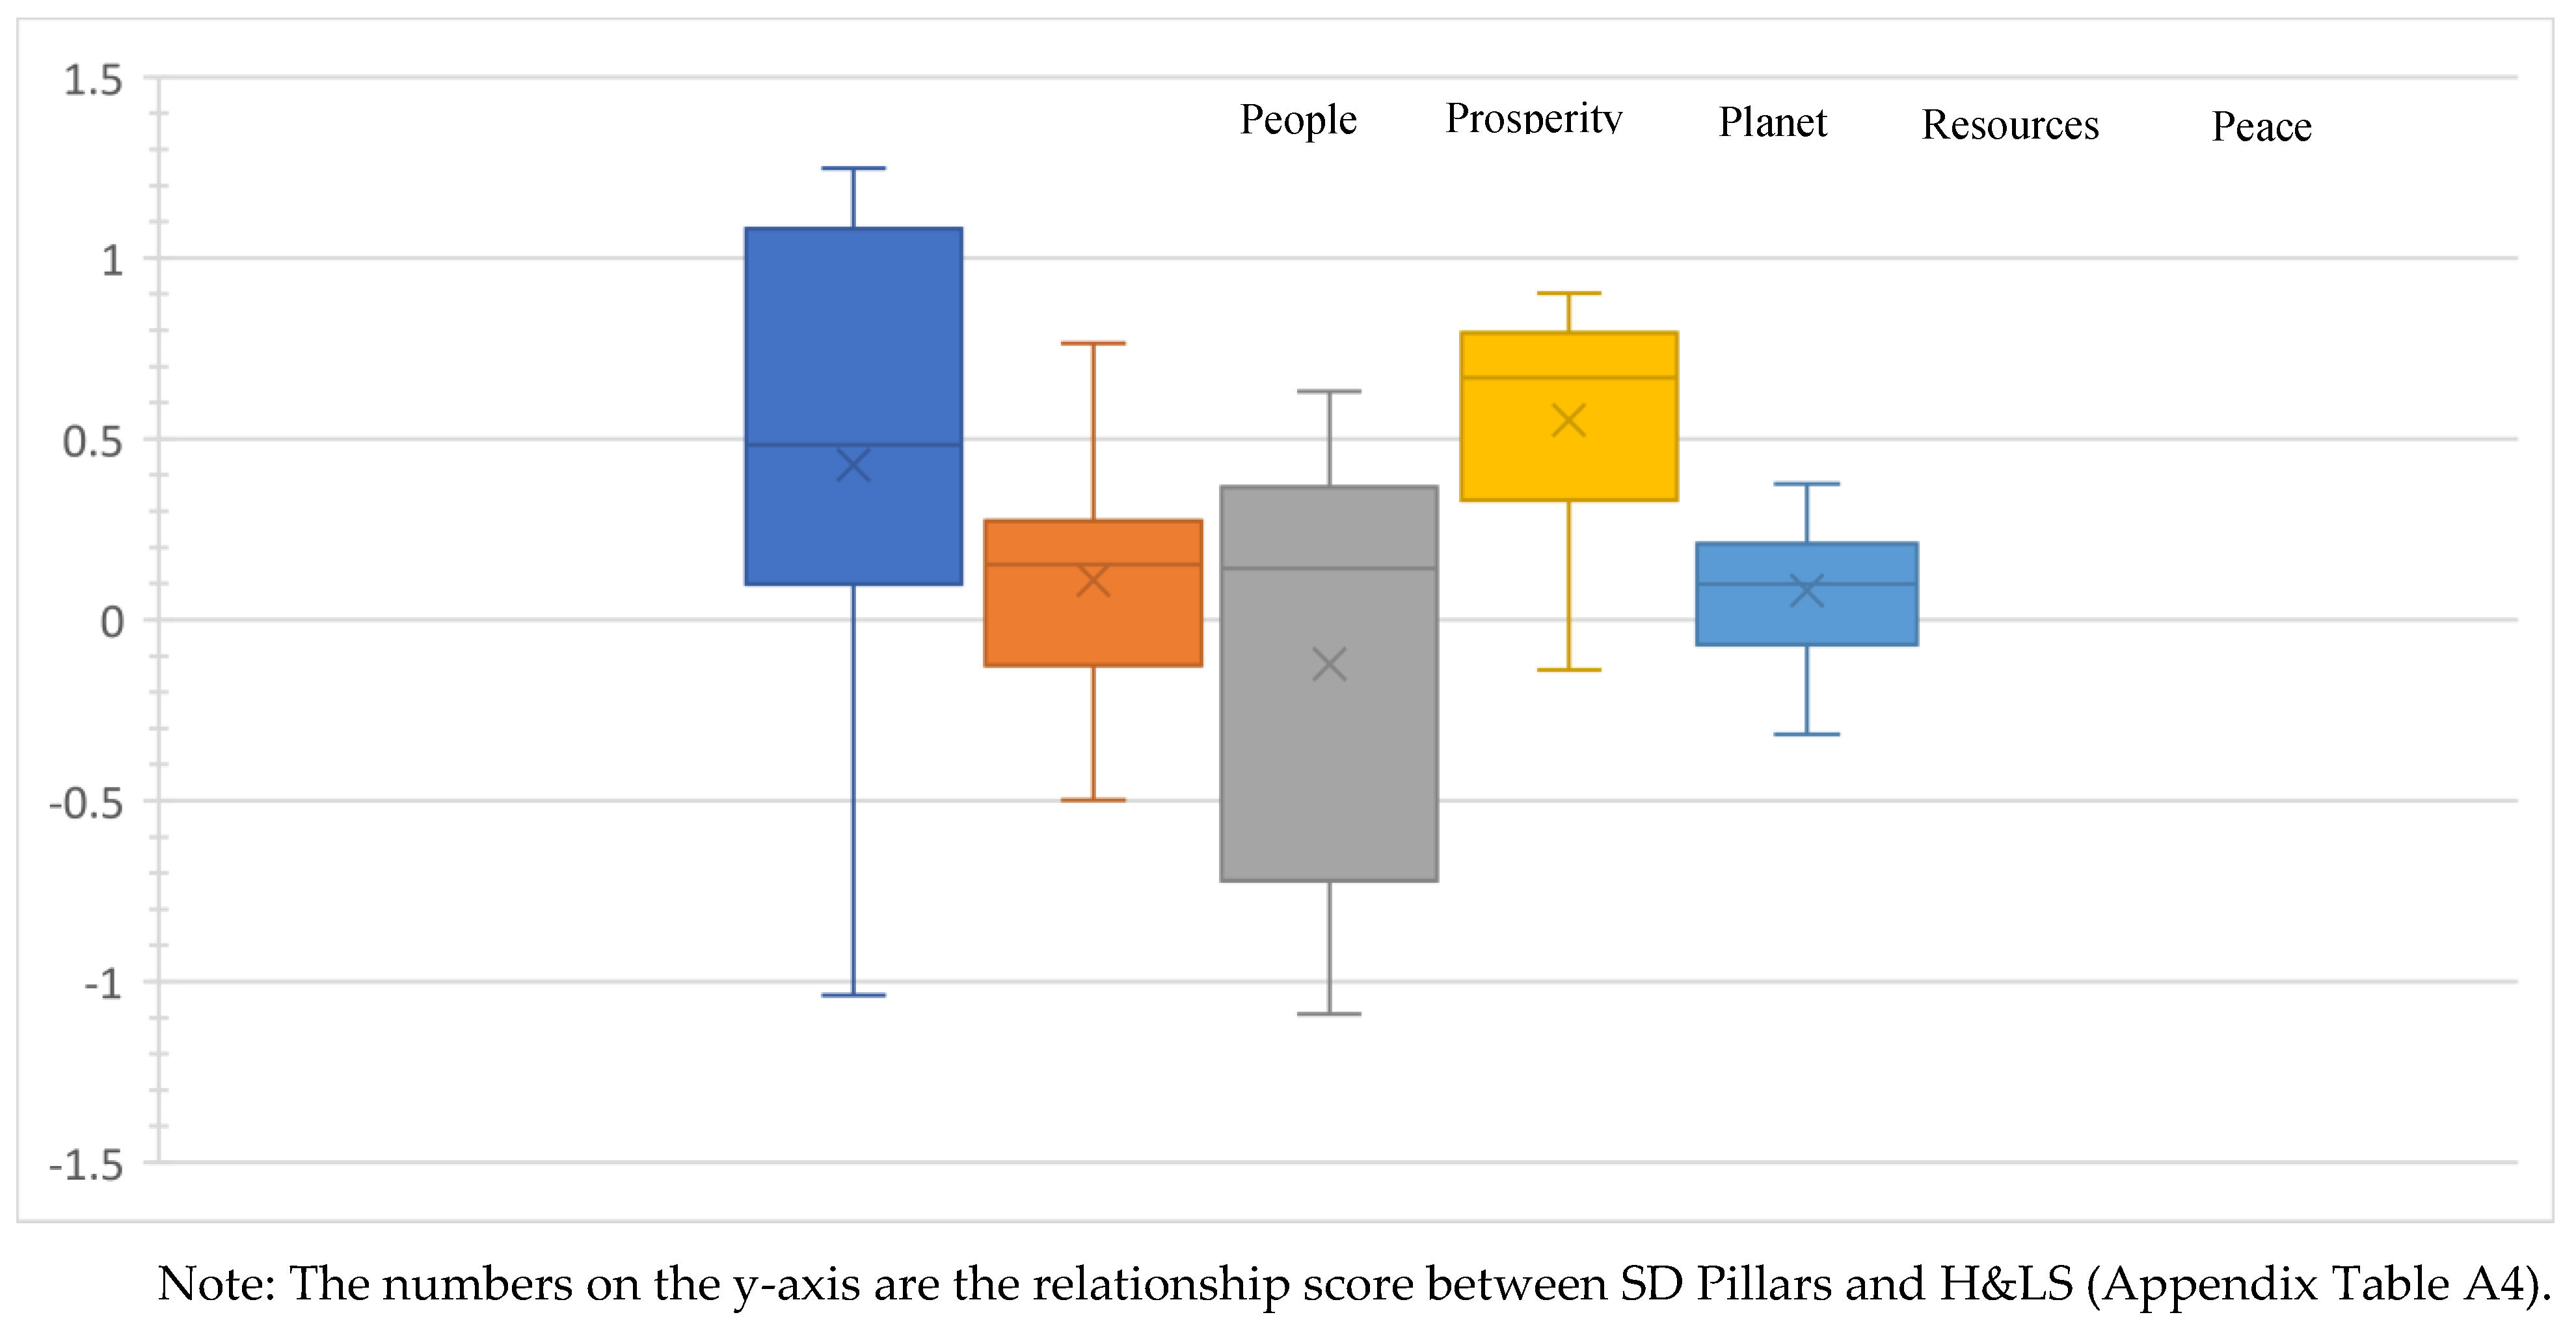
Figure 9.
Emerging and Developing Europe - Country level SD Pillars - H&LS relationships.
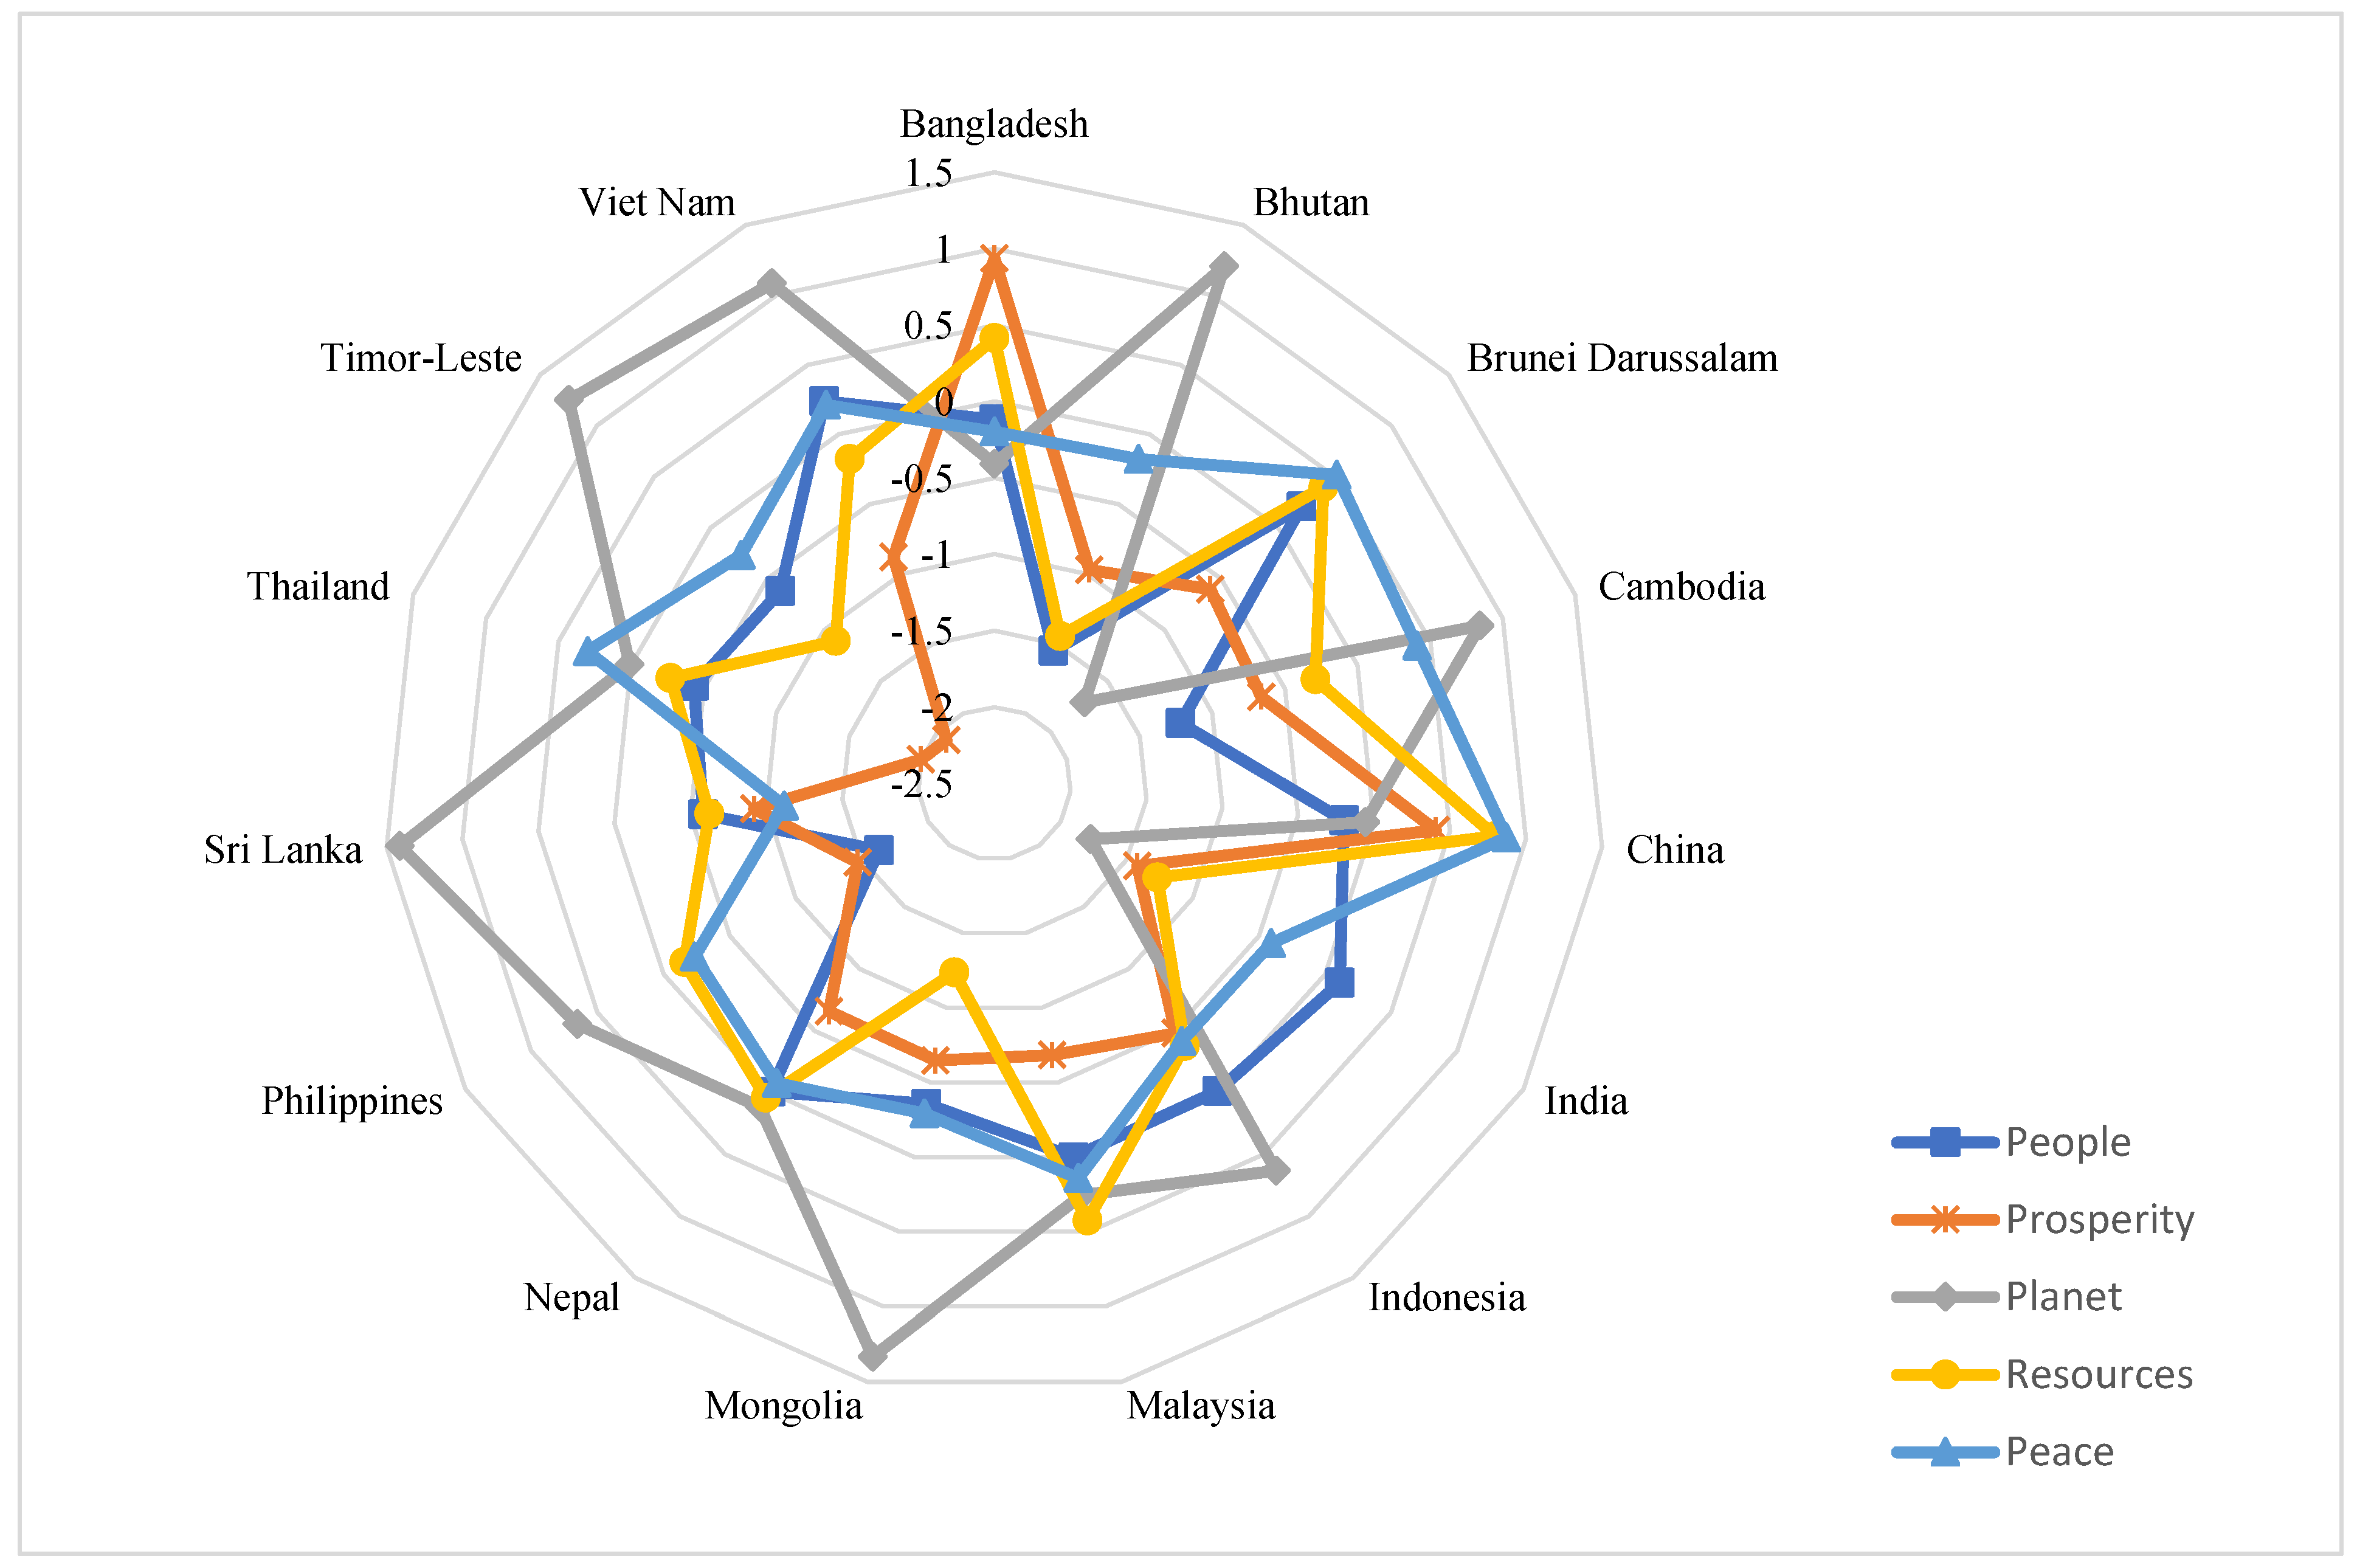
4.4.3. Emerging & Developing Asia
Similar to Emerging & Developing Europe, the People and Prosperity pillars are negatively associated with H&LS. Likewise, the Resources and Peace pillars have negative associations with H&LS. In contrast, the Planet pillar strongly associates with H&LS (Figure 10 and Figure 11). This result is partly in line with the findings of [132], who found that reducing environmental problems (climate change, carbon emissions, and poisoning the atmosphere) significantly increases the happiness and well-being of Asian people. In this cluster there are three country outliers—Bhutan, the Philippines, and Bangladesh (Figure 10). In Bangladesh, Prosperity positively and strongly relates to H&LS. This is partly in agreement with [133], who noted that when policymakers do incremental encouragement toward macroeconomics to formulate policy influences, the happiness of the Bangladeshis significantly increases. In contrast, in Bhutan and the Philippines, People related issues such as low education and low health levels hinder their countries’ H&LS. In this regard, the [113],[134,135,136] argued that poor levels of education and health negatively influence the H&LS levels in East Asian countries.
Figure 10.
Emerging and Developing Asia - Cluster level SD Pillars - H&LS relationships.
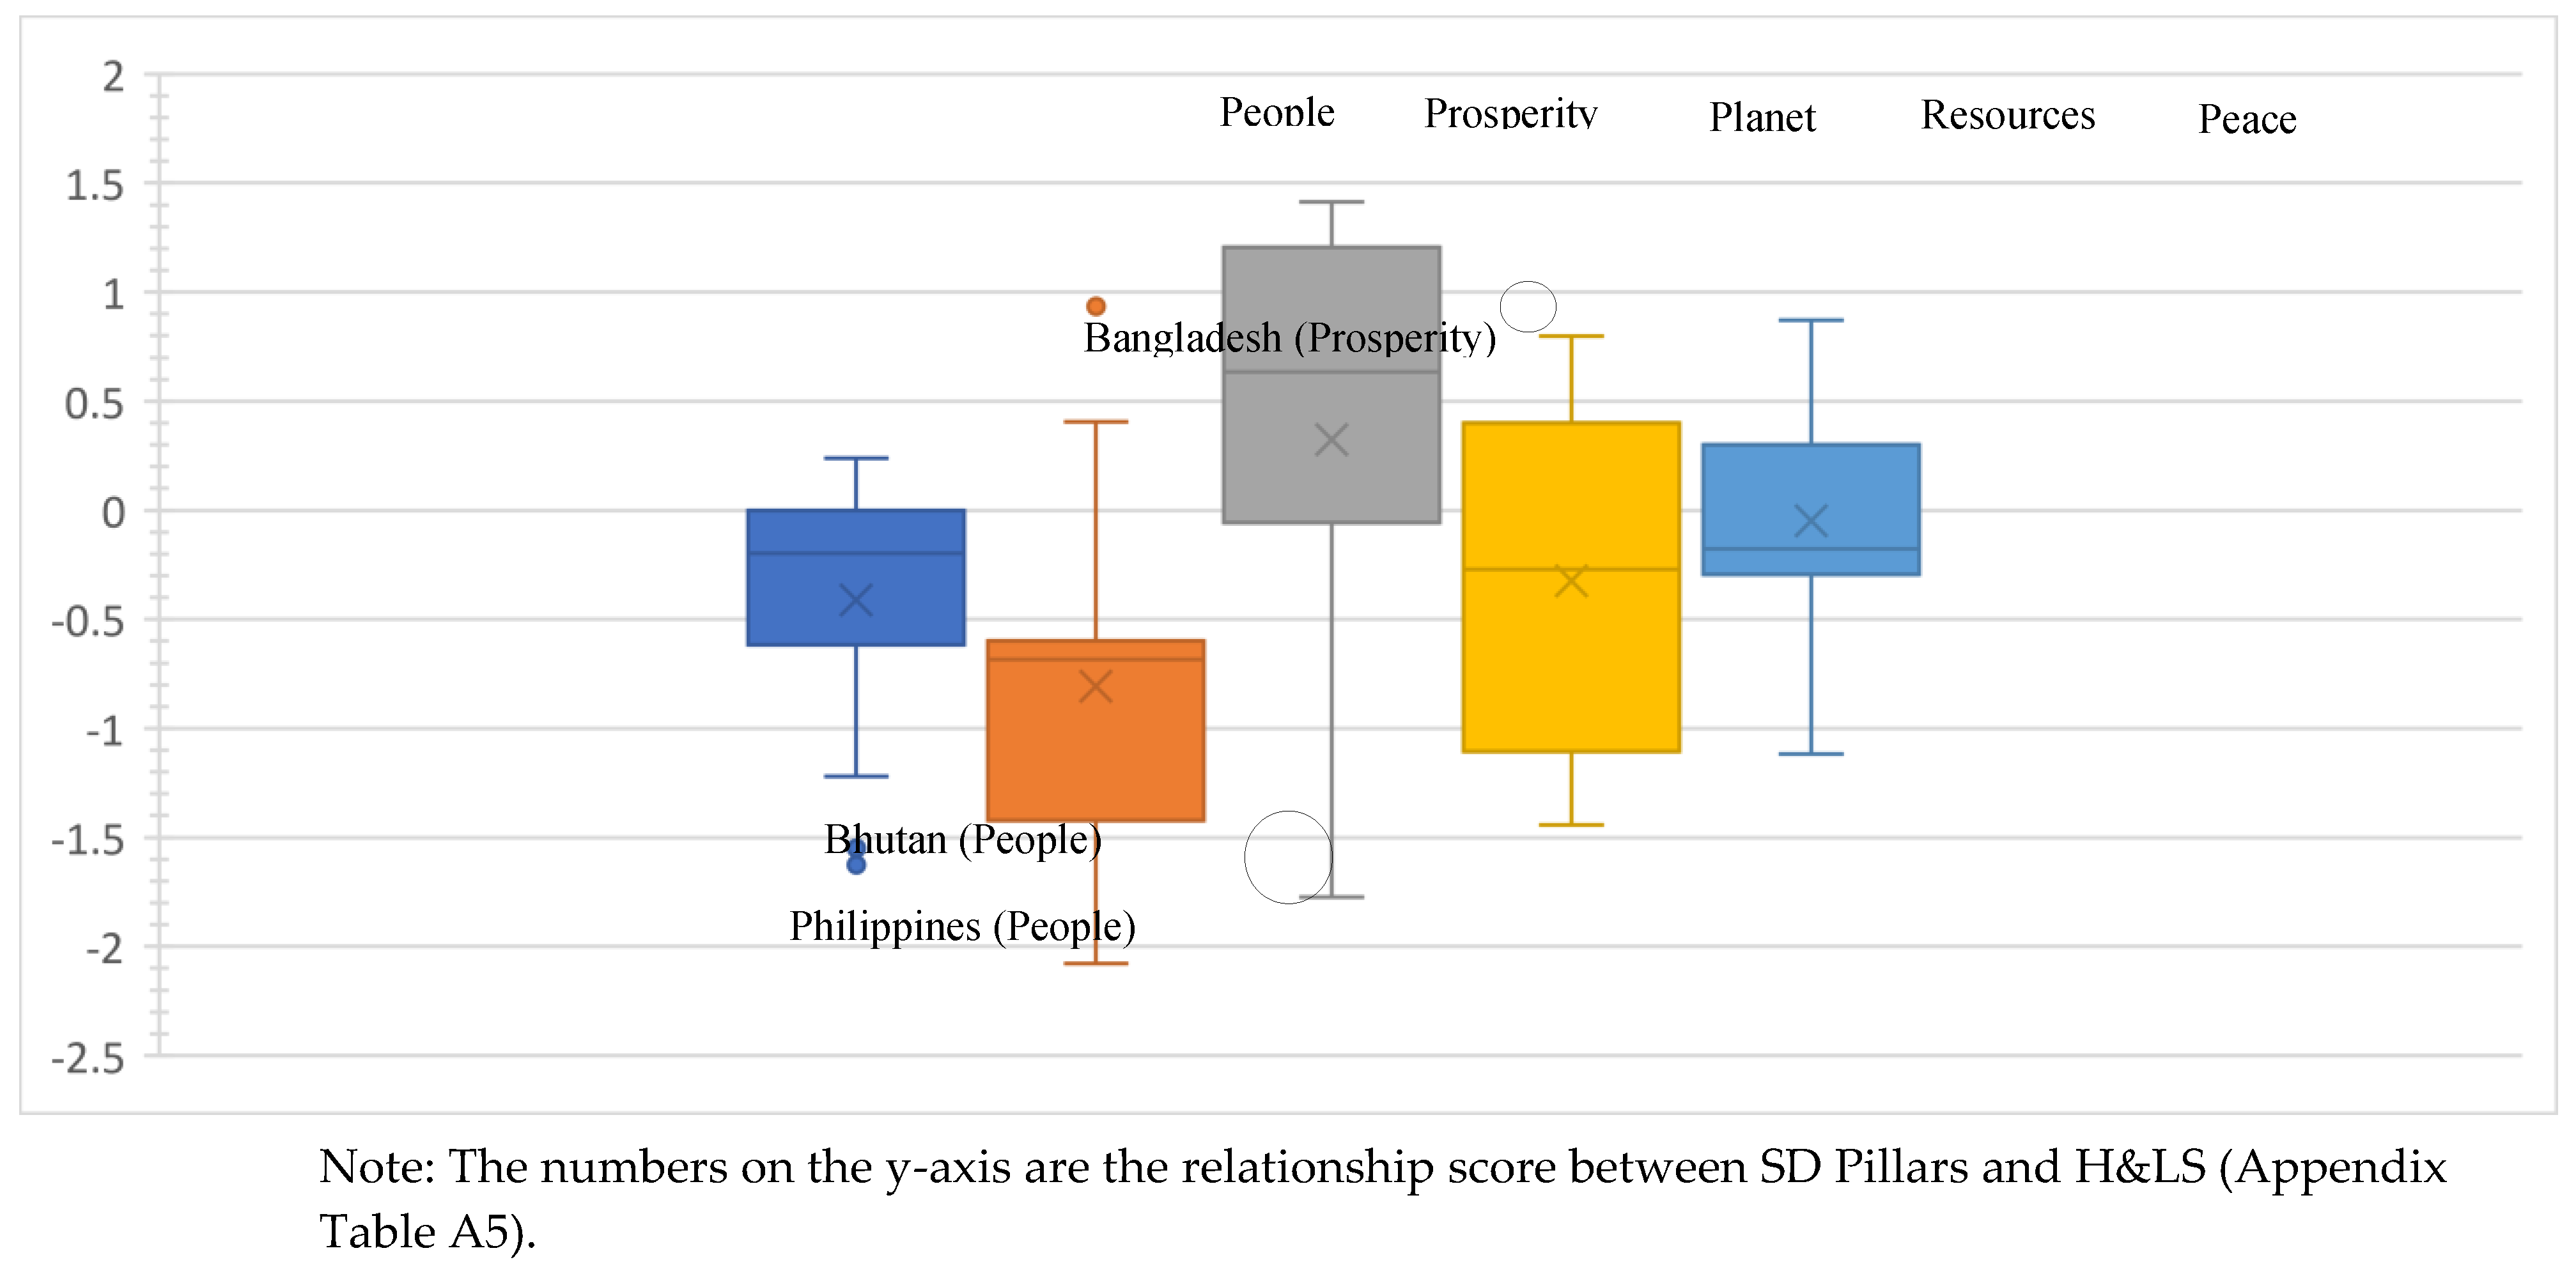
Figure 11.
Emerging and Developing Asia - Country level SD Pillars - H&LS relationships.
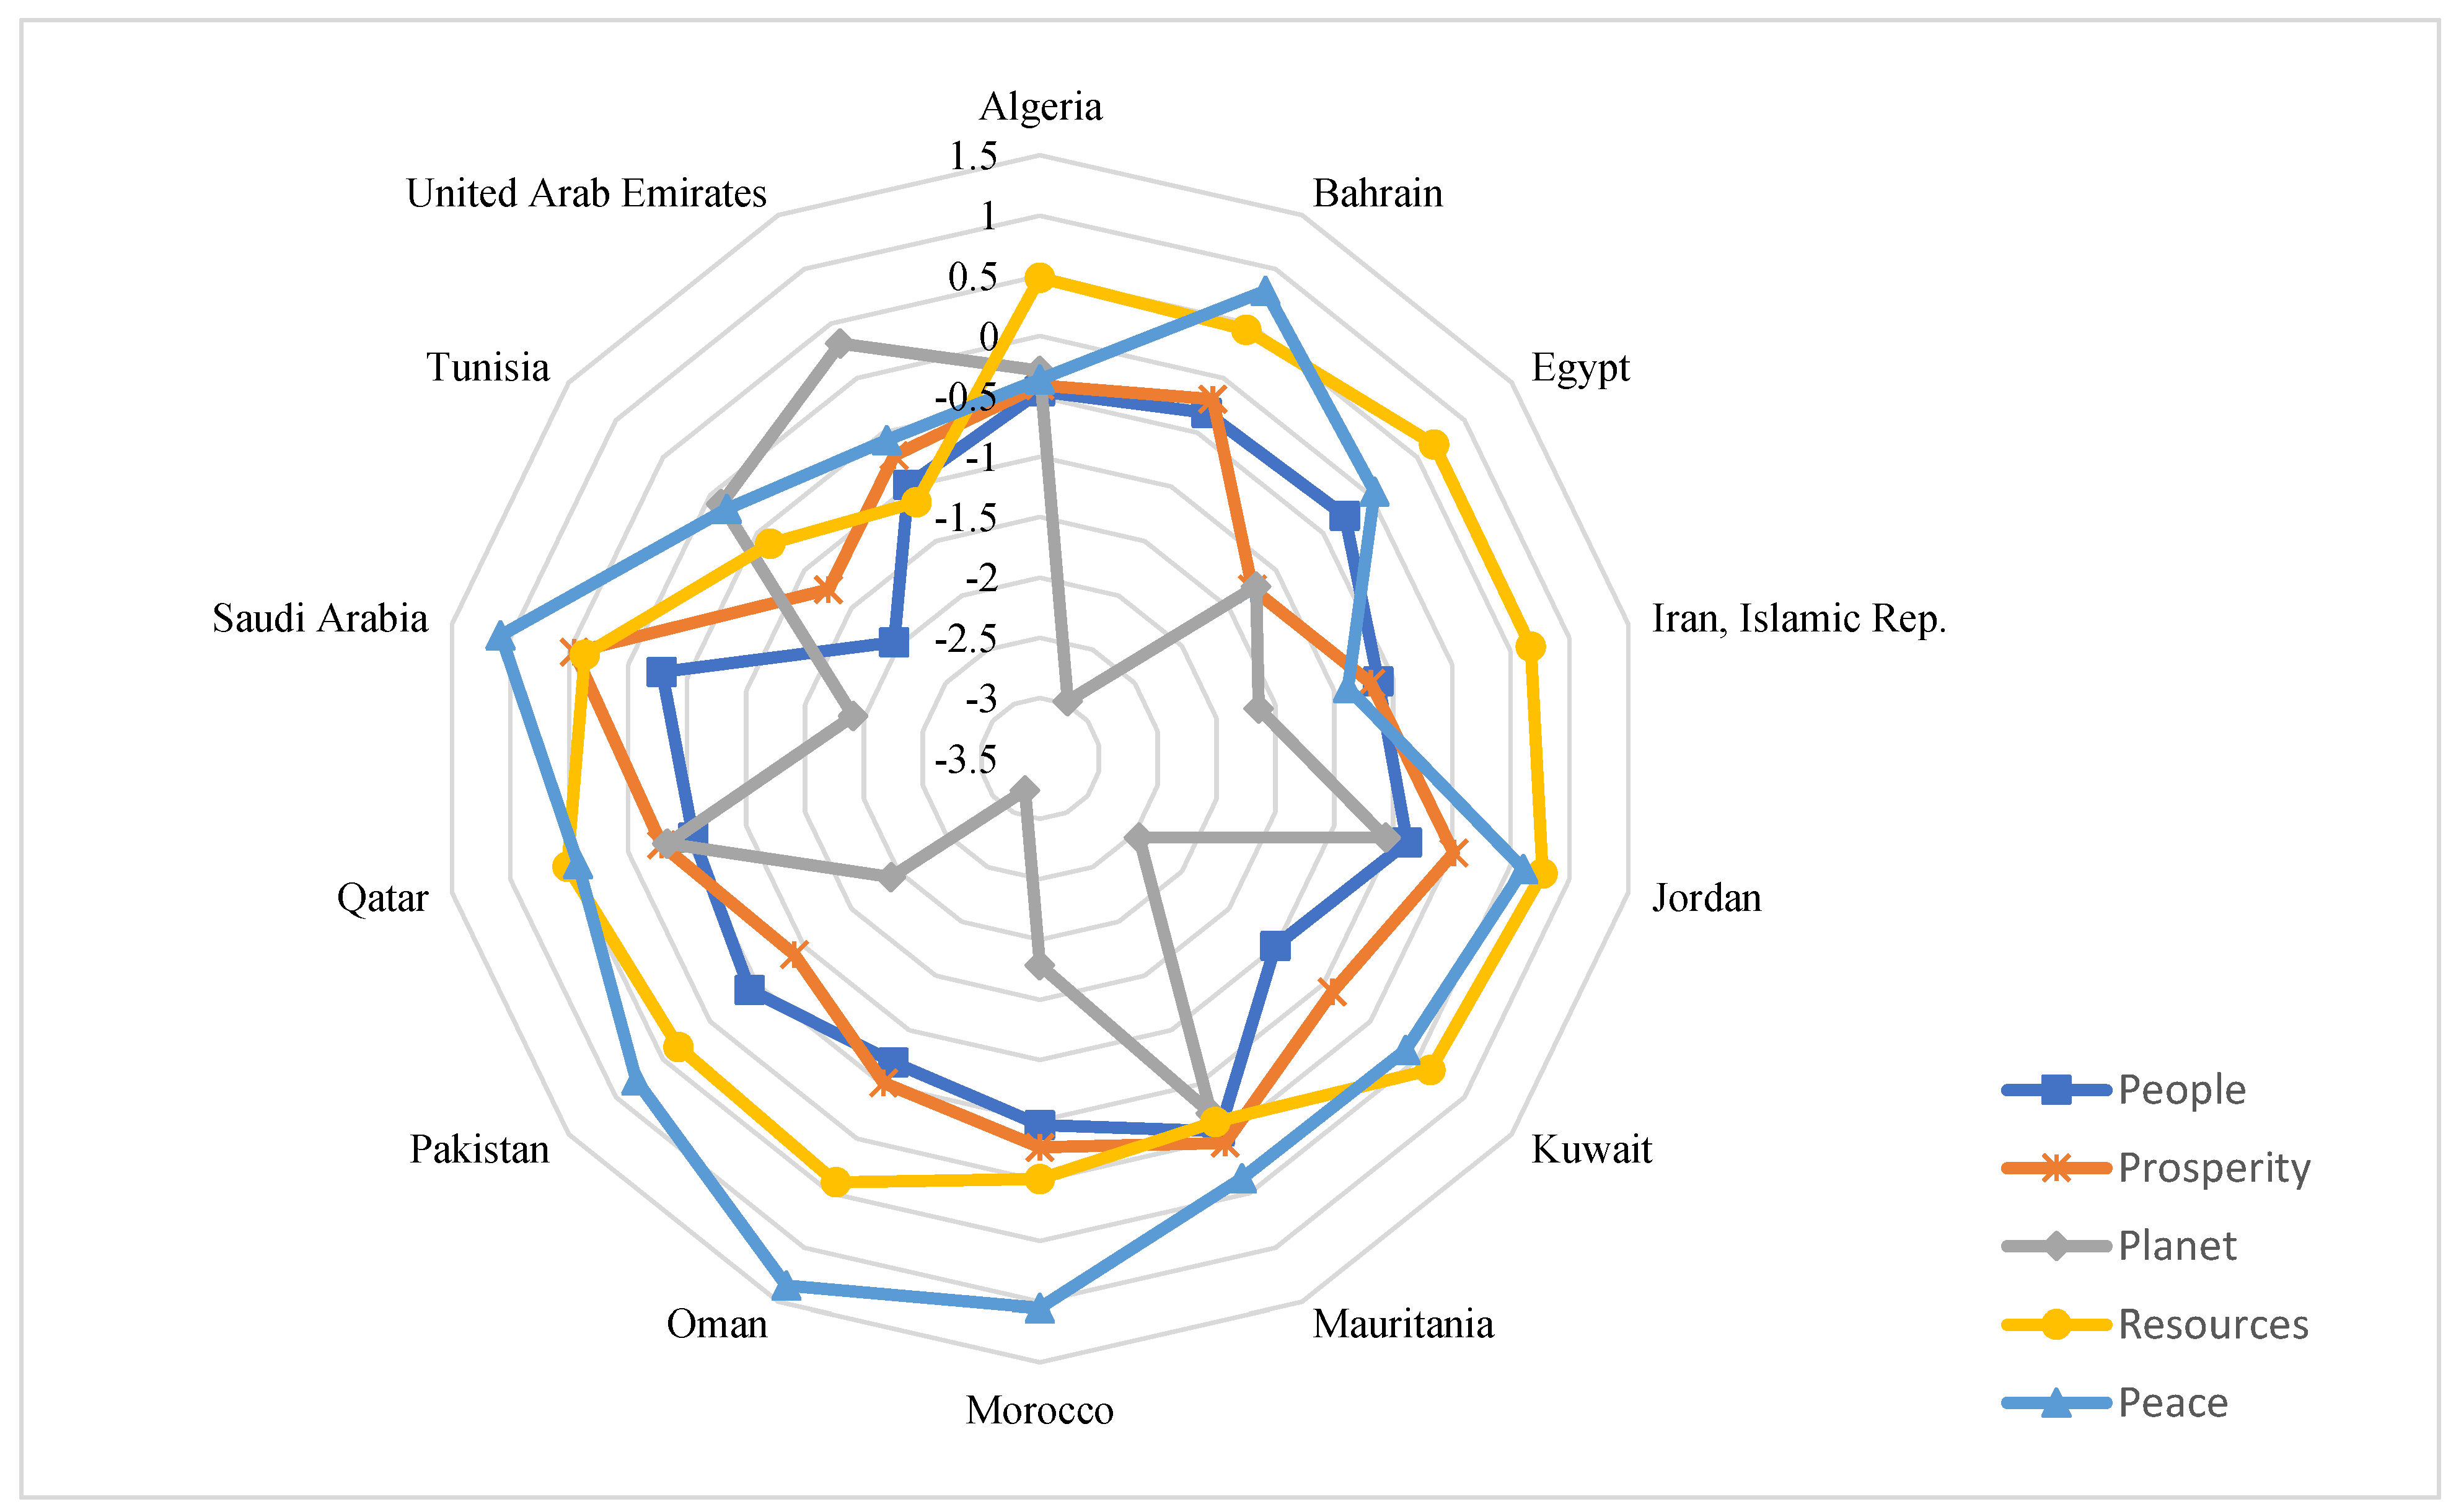
4.4.4. Middle East, North Africa & Pakistan
In this cluster, Planet is negatively related to H&LS. This may be so because the cultural-economic syndrome of oil-wealthy countries has a negative effect on democratic performance, which subsequently reduces the country’s H&LS [137]. (Figure 12 and Figure 13). There are two negative country outliers: Tunisia and the United Arab Emirates. Tunisia is an outlier in terms of People (Figure 12) since a low level of secondary education is negatively associated with disparity of socio-economic factors, causing unemployment and extreme poverty [138]. The United Arab Emirates is an outlier in terms of Resources since its water resources are scarce [139].
Figure 12.
Middle East, North Africa & Pakistan - Cluster level SD Pillars - H&LS relationships.
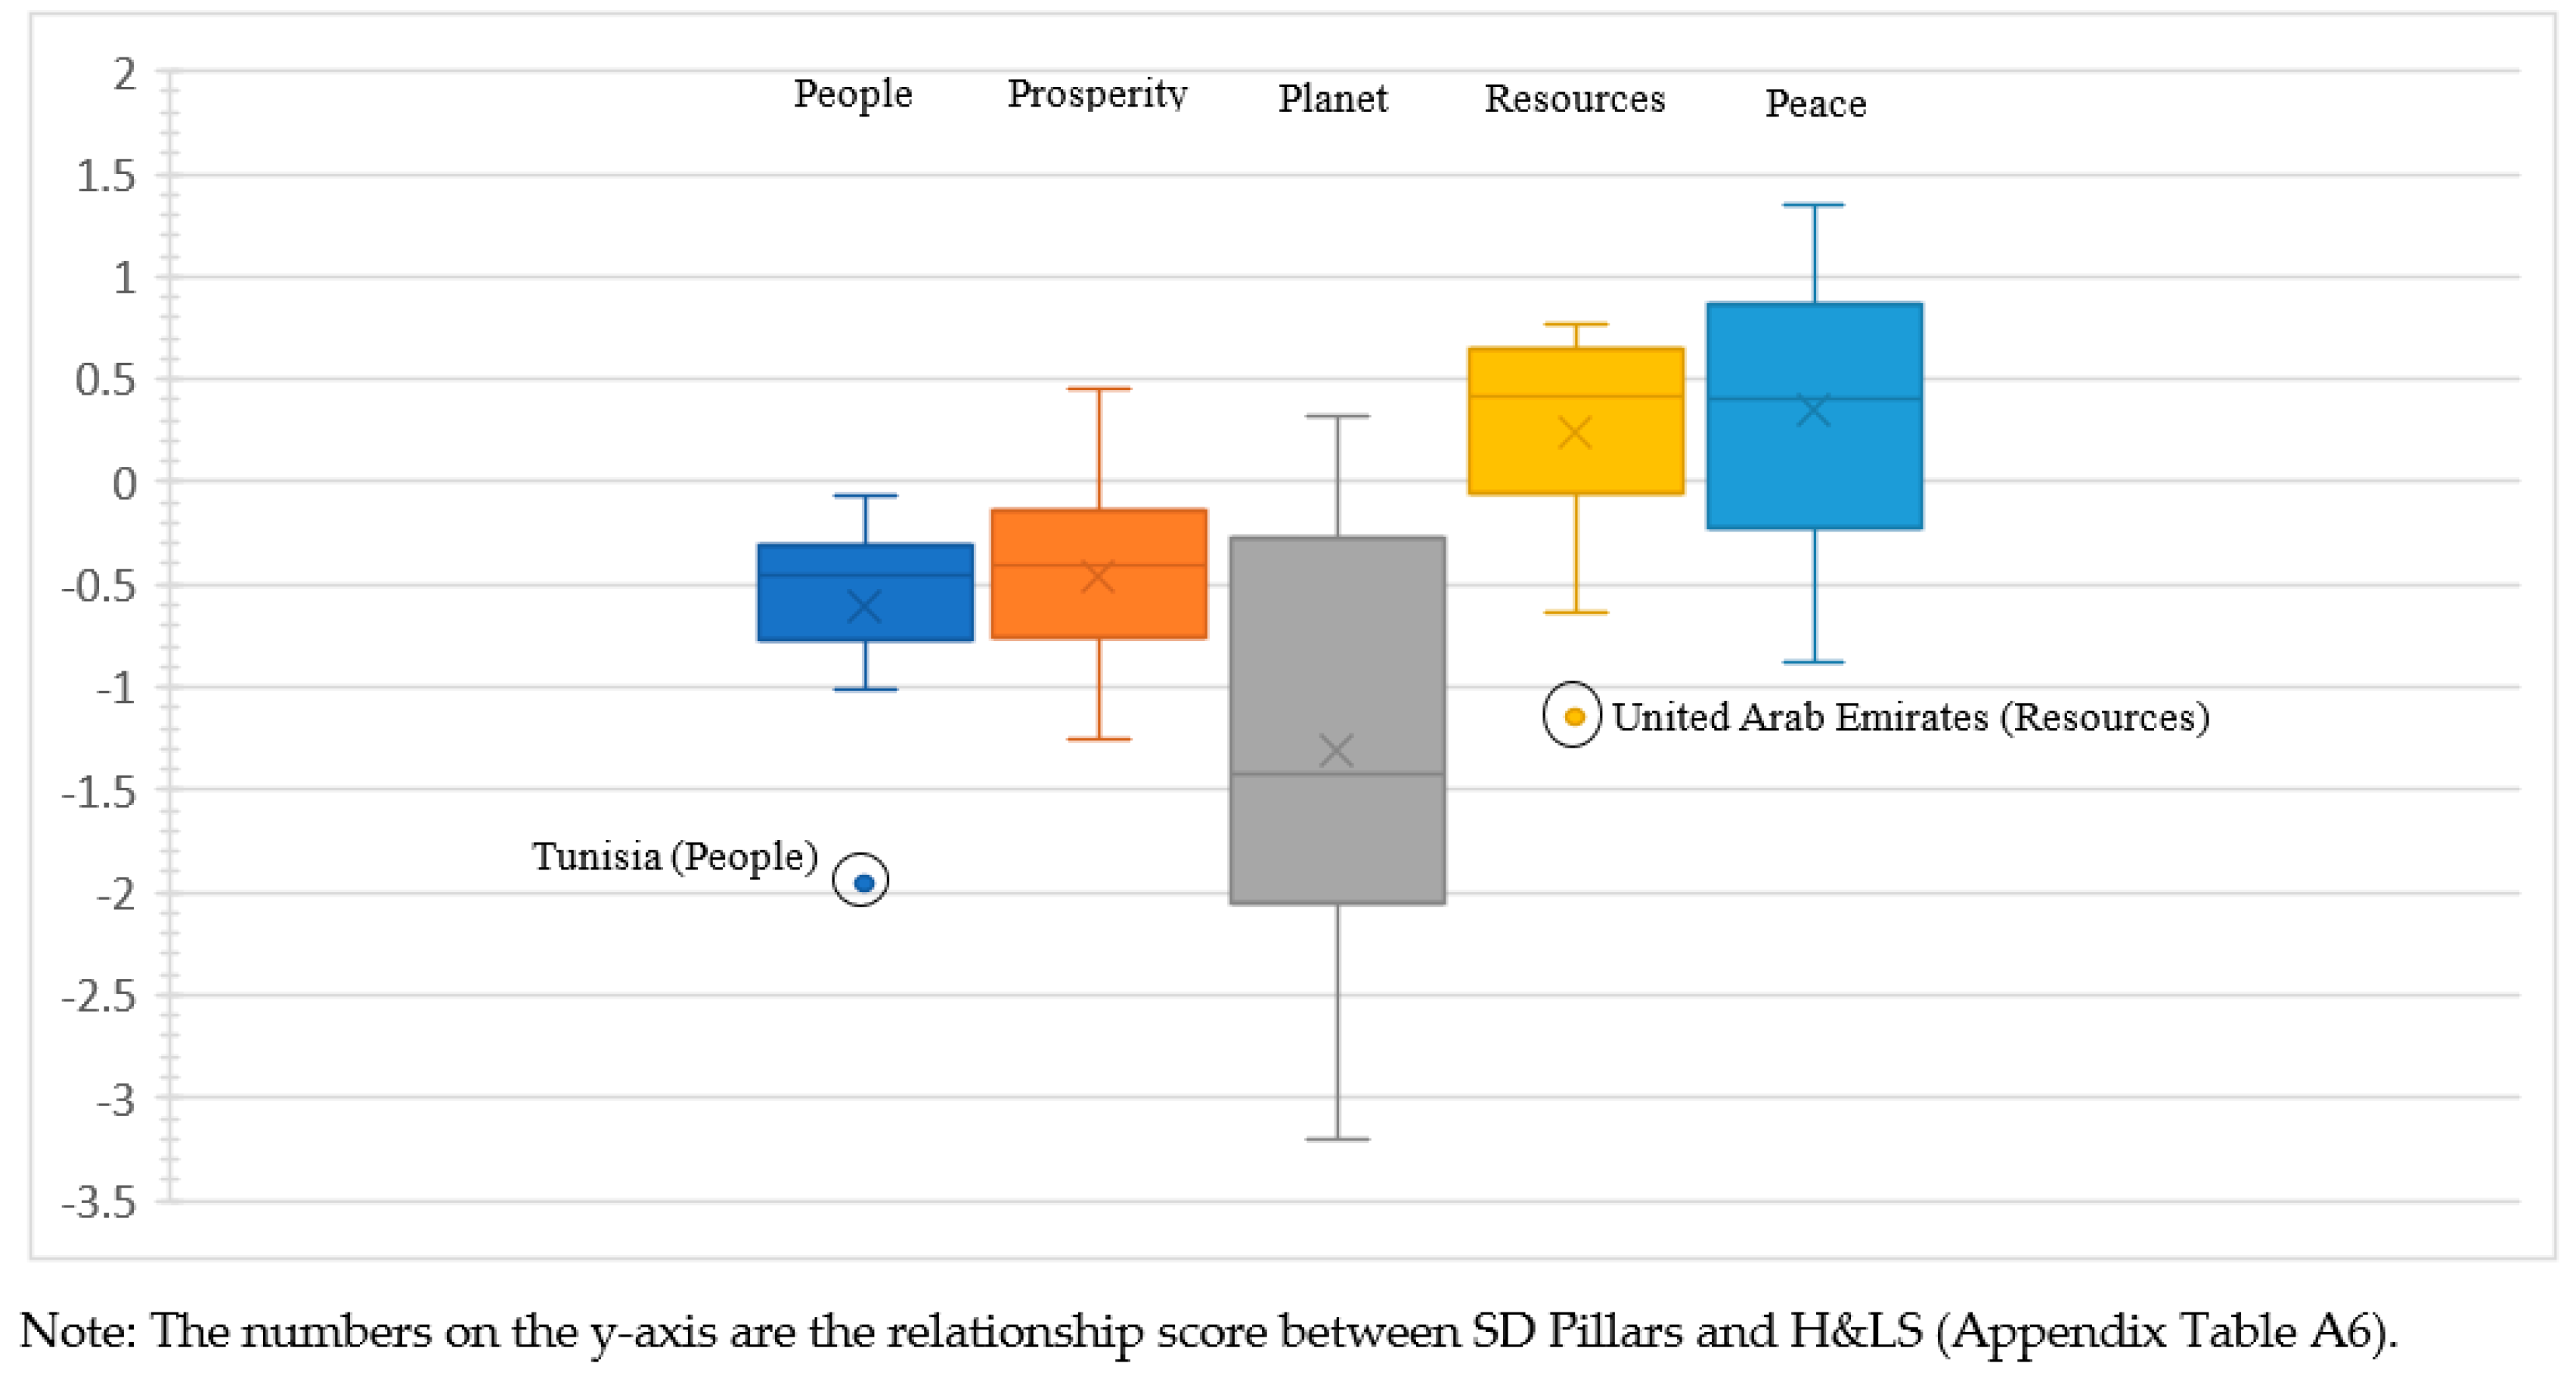
Figure 13.
Middle East, North Africa & Pakistan-Country level SD Pillars - H&LS relationships.
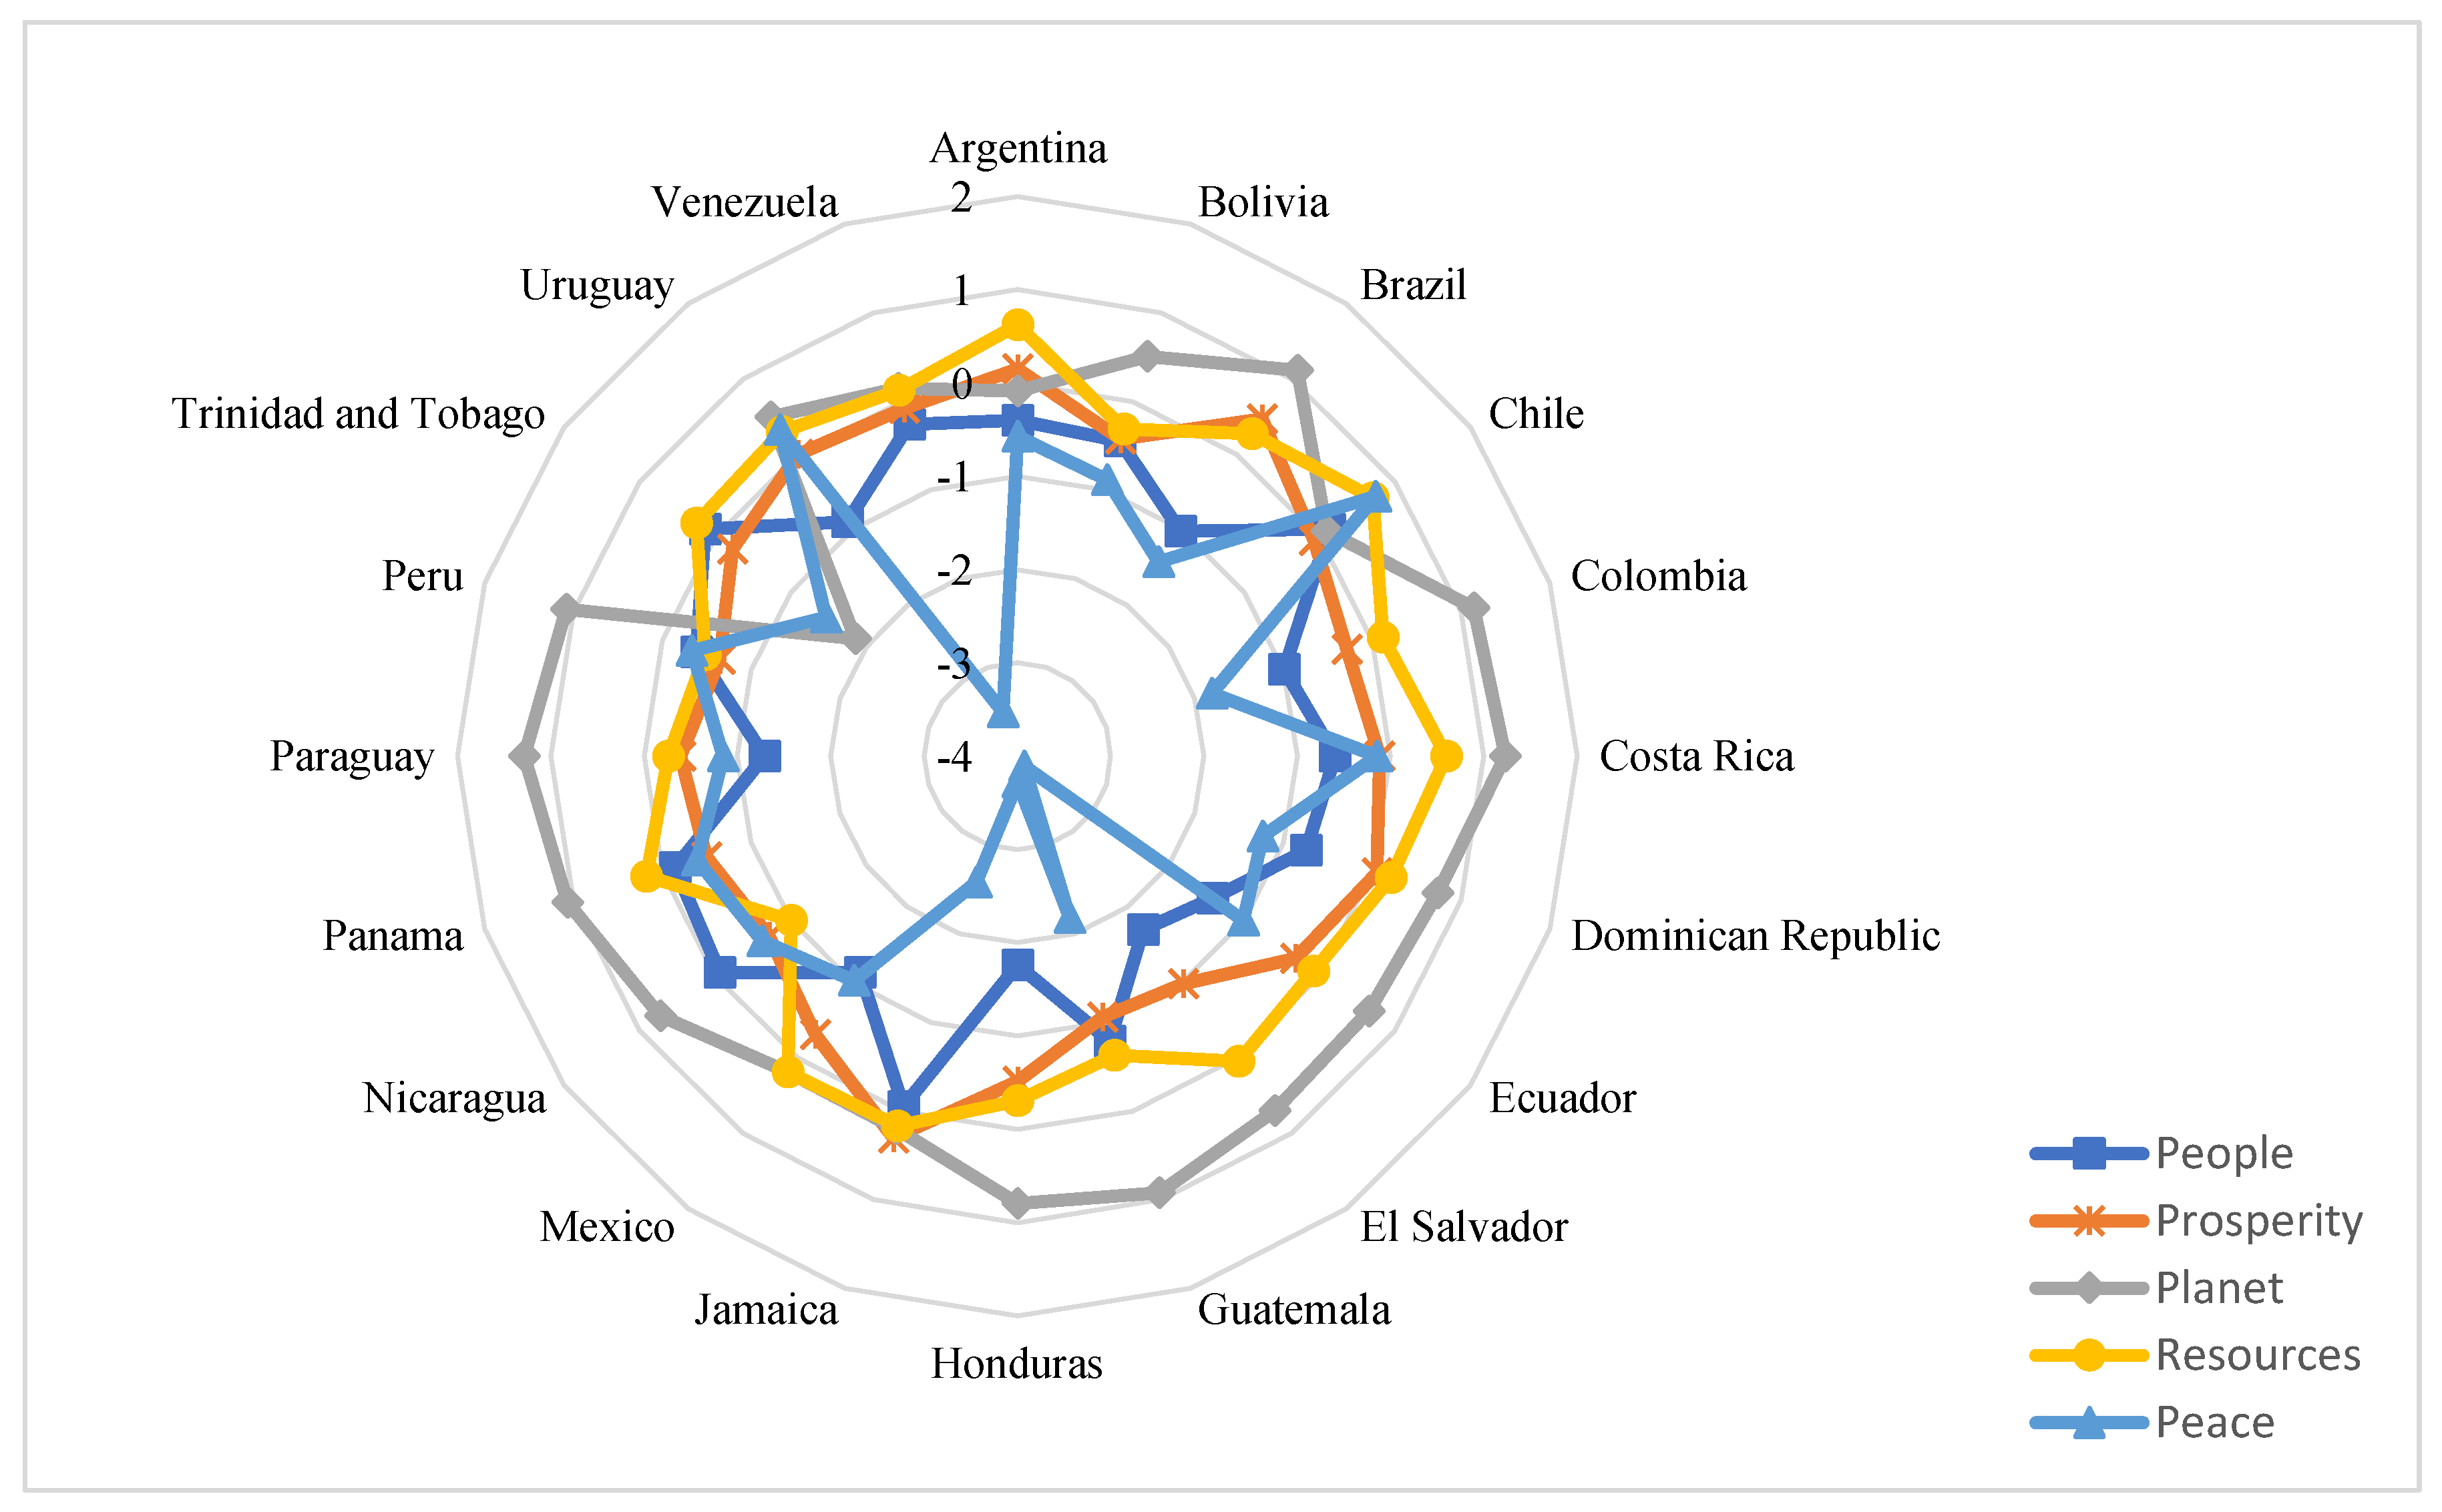
4.4.5. Latin America & the Caribbean
Planet and Resources are this cluster’s only pillars positively associated with H&LS. People, Prosperity, and Peace are negatively related to H&LS (Figure 14 and Figure 15). [140] suggested that the effects of inequality-related issues on Latin American countries are higher than in most other countries. Problems associated with education [141,142], health [143,144] income and peace ( e.g., internal war in Venezuela and issues related to drug cartels in Colombia and Mexico) [145] negatively influence individuals’ H&LS in Latin America & the Caribbean. Trinidad-Tobago is the only negative country outlier (Figure 14). In this country, Planet negatively relates to H&LS. It seems that global oil politics (sudden price increases and decreases) is the primary influencer of Trinidad’s economic wealth since their economy primarily depends on oil; hence, extreme fluctuations in oil prices are one of the focal, affecting factors of their lives and their human well-being [146].
Figure 14.
Latin America & the Caribbean - Cluster level SD Pillars - H&LS relationships.
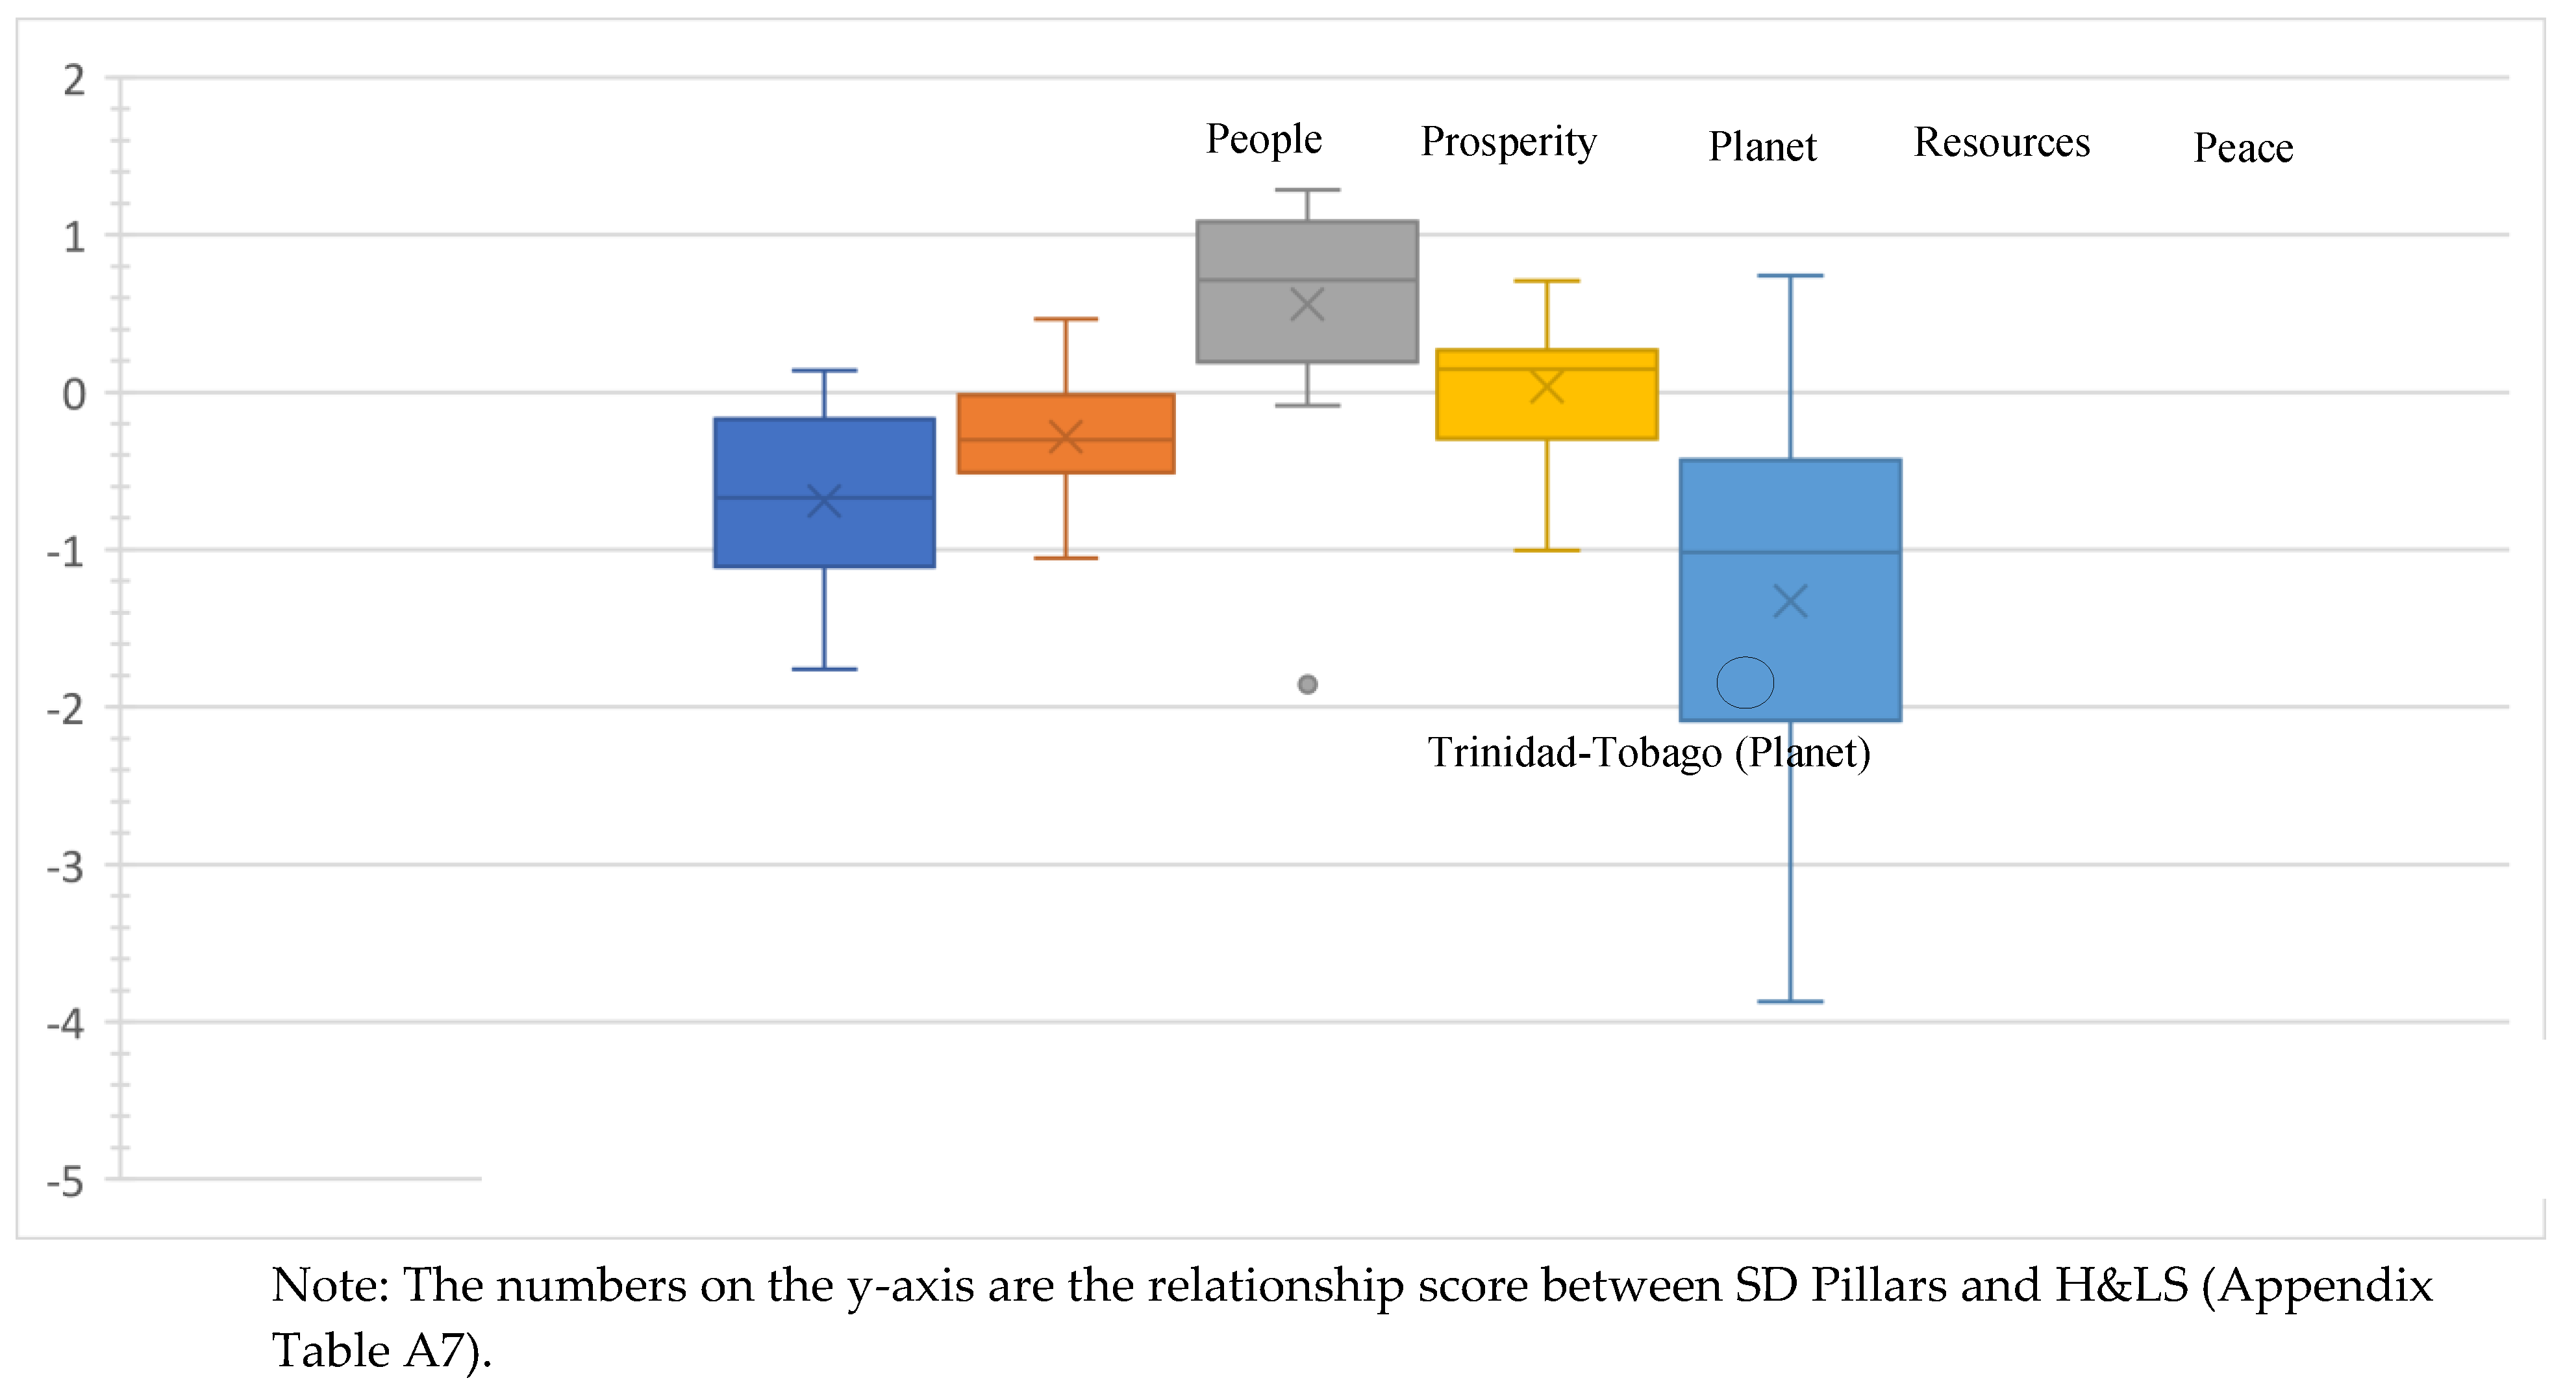
Figure 15.
Latin America & the Caribbean - Country level SD Pillars - H&LS relationships.
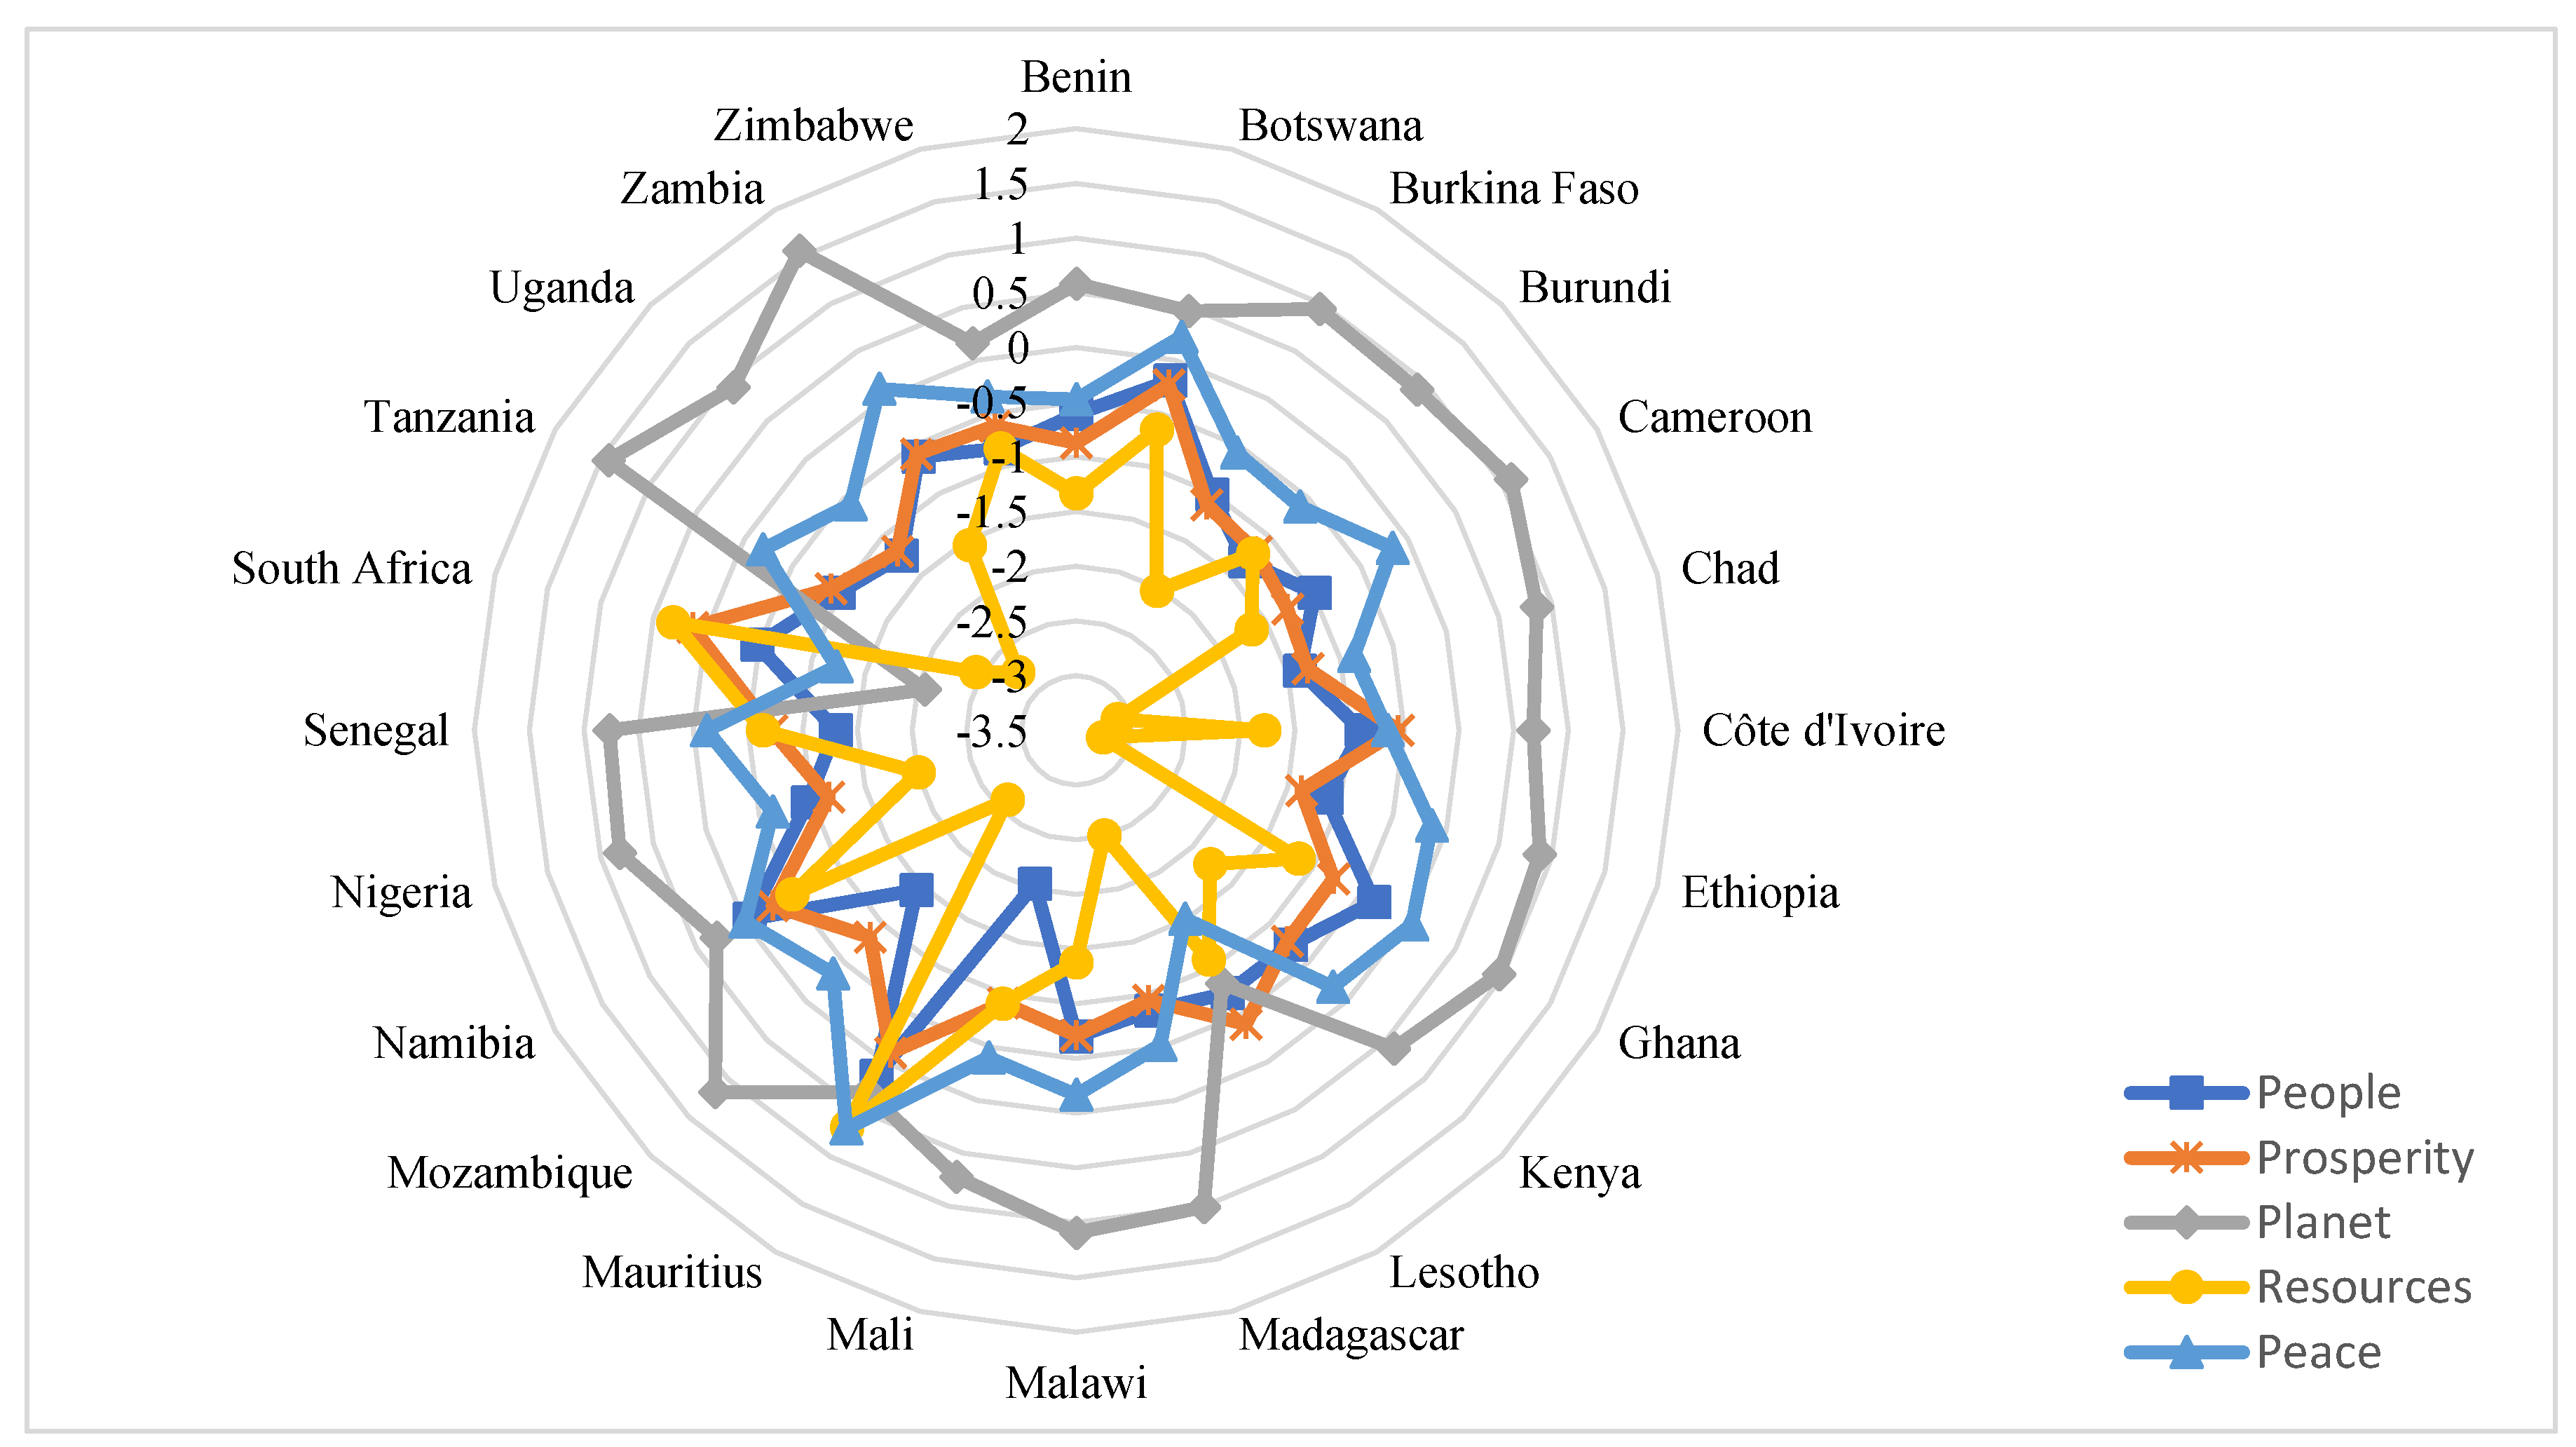
4.4.6. Sub-Saharan Africa
People, Prosperity, Resources, and Peace in this cluster are negatively associated with H&LS (Figure 16 and Figure 17). These results are partly in line with [147,148,149,150], who found lower individual-level education’s negative effect on well-being in Sab-Saharan countries. There are three country outliers, Lesotho (Planet and Peace), South Africa (Planet), and Mauritius (Peace) (Figure 16). Peace negatively relates to H&LS in Lesotho since violence is at the heart of Lesotho’s life due to the historical trend of militarization of politics as well as the politicization of the military [151]. There are also significant issues in Lesotho’s hydro politics. Despite the bi-national Lesotho Highlands water project (LHWO), Lesotho still suffers from the depletion of its water resources [152,153]. Planet negatively associates with H&LS in South Africa. In South Africa, forested areas could be affected in addition to drastic changes in habitat due to a warming climate [154]. Finally, in Mauritius, H&LS levels are the highest due to Peace conditions. Despite the Country’s highly heterogeneous population, Mauritius has extreme Peace levels [155].
Figure 16.
Sub Saharan Africa- Cluster level SD Pillars - H&LS relationships.
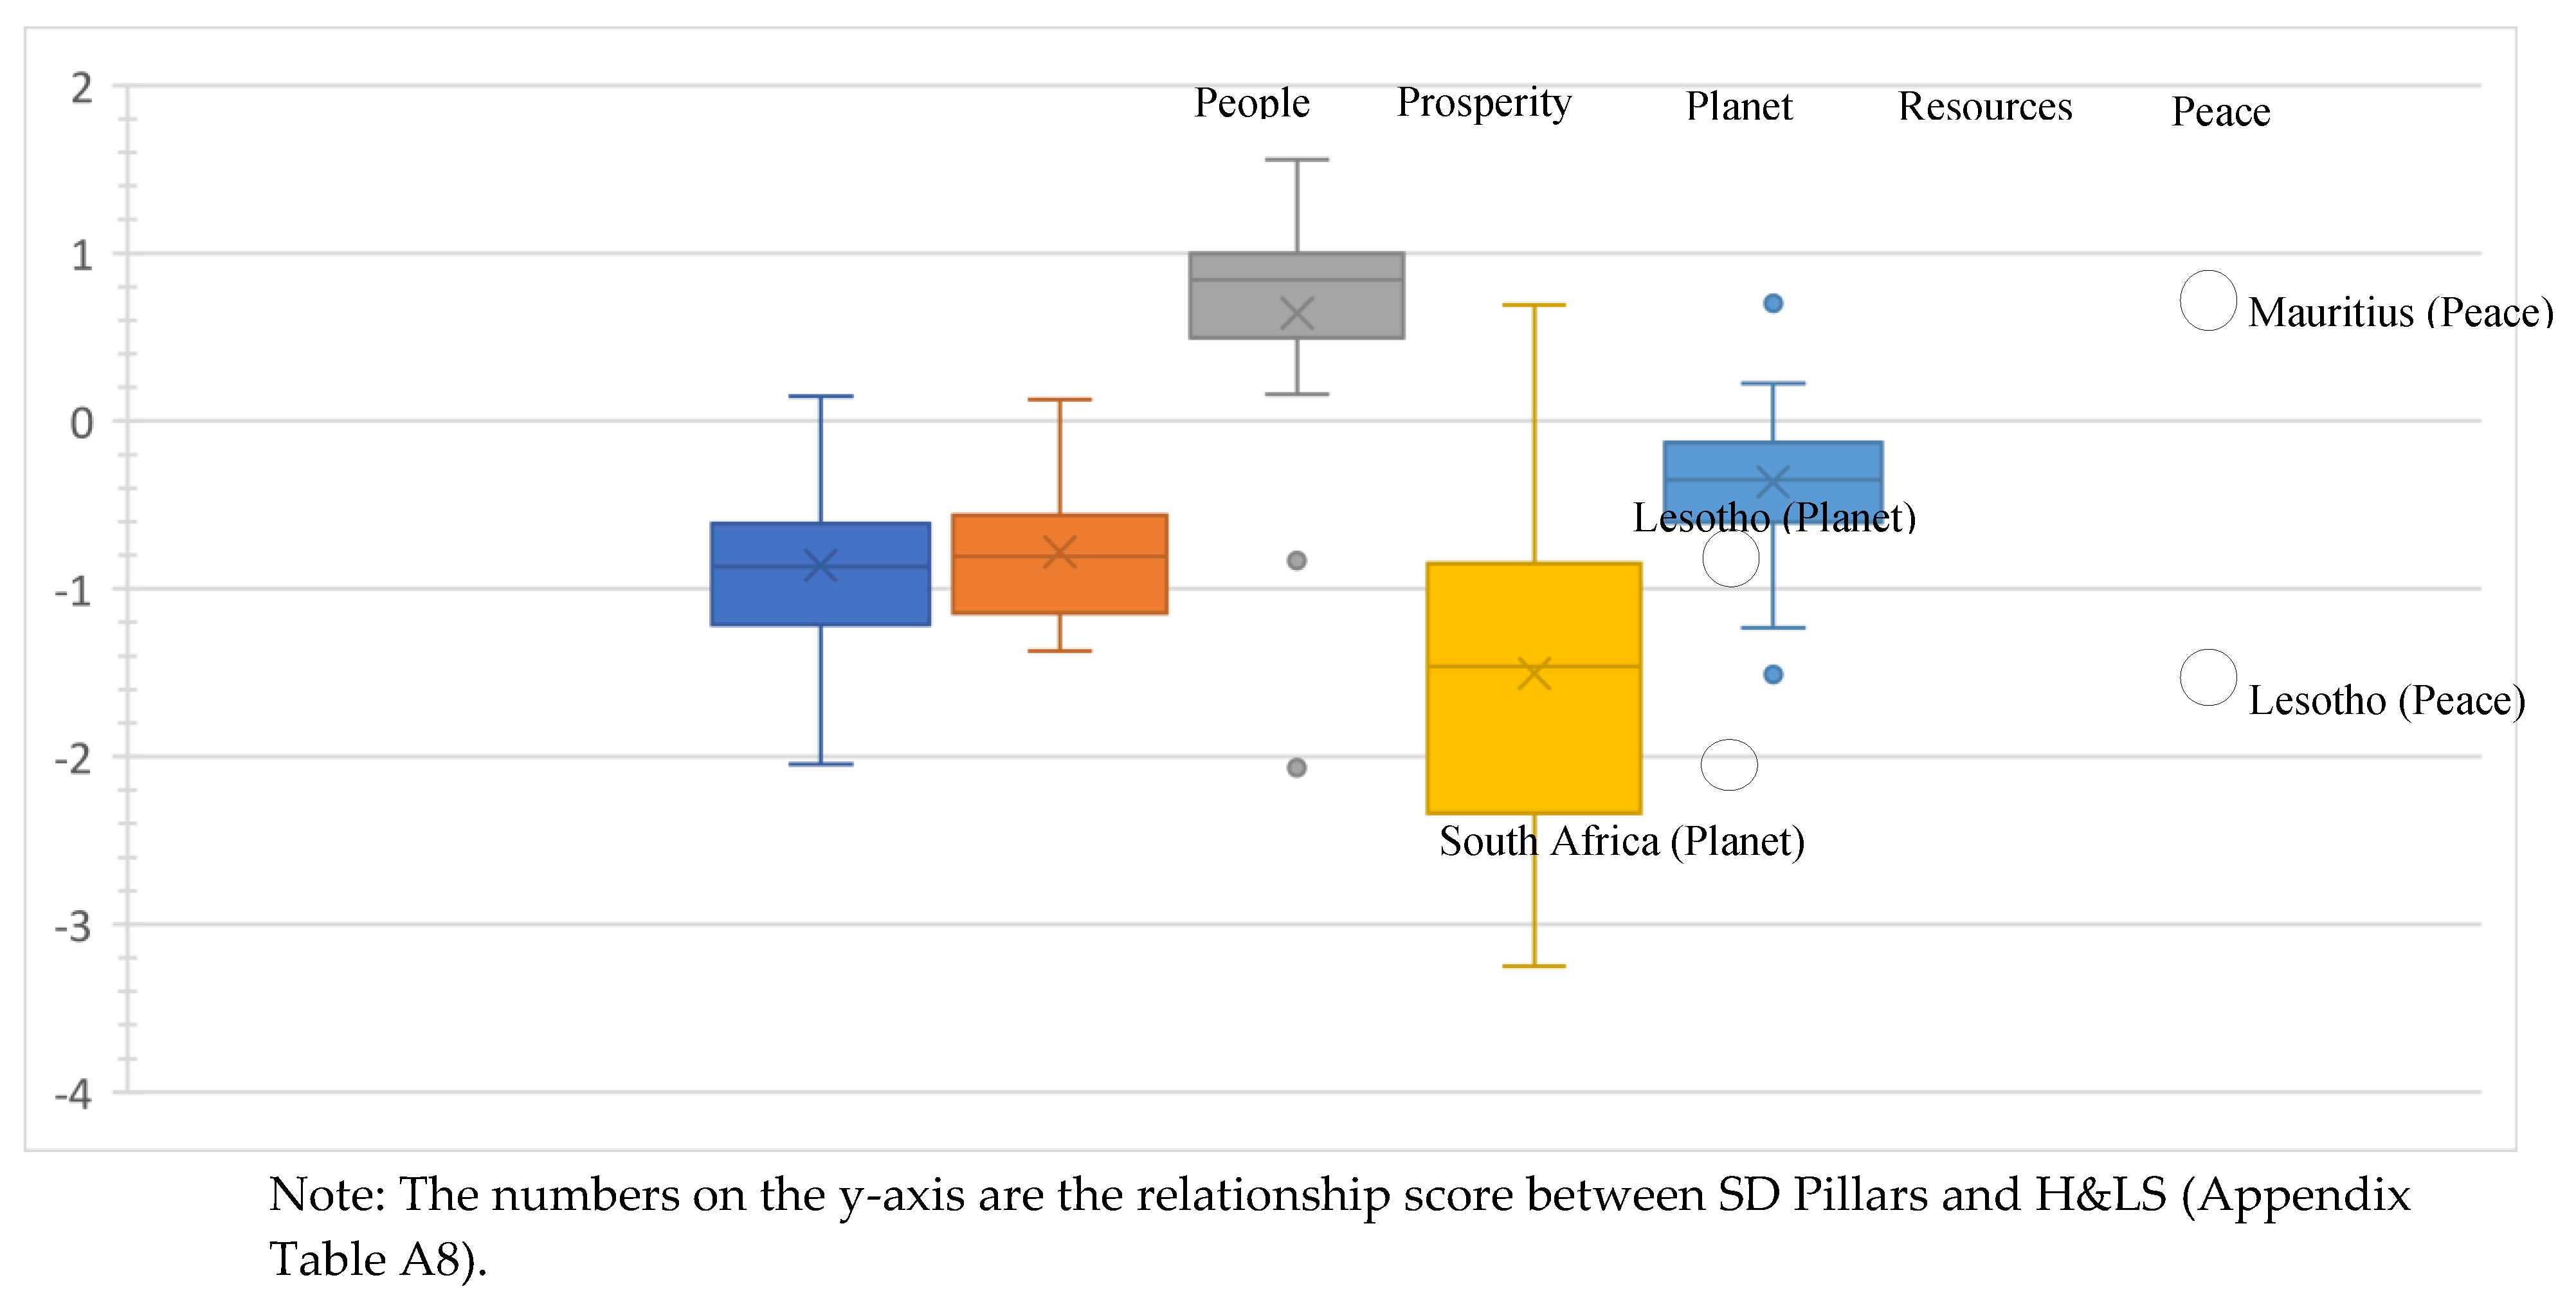
Figure 17.
Sub-Saharan Africa- Country level SD Pillars - H&LS relationships.
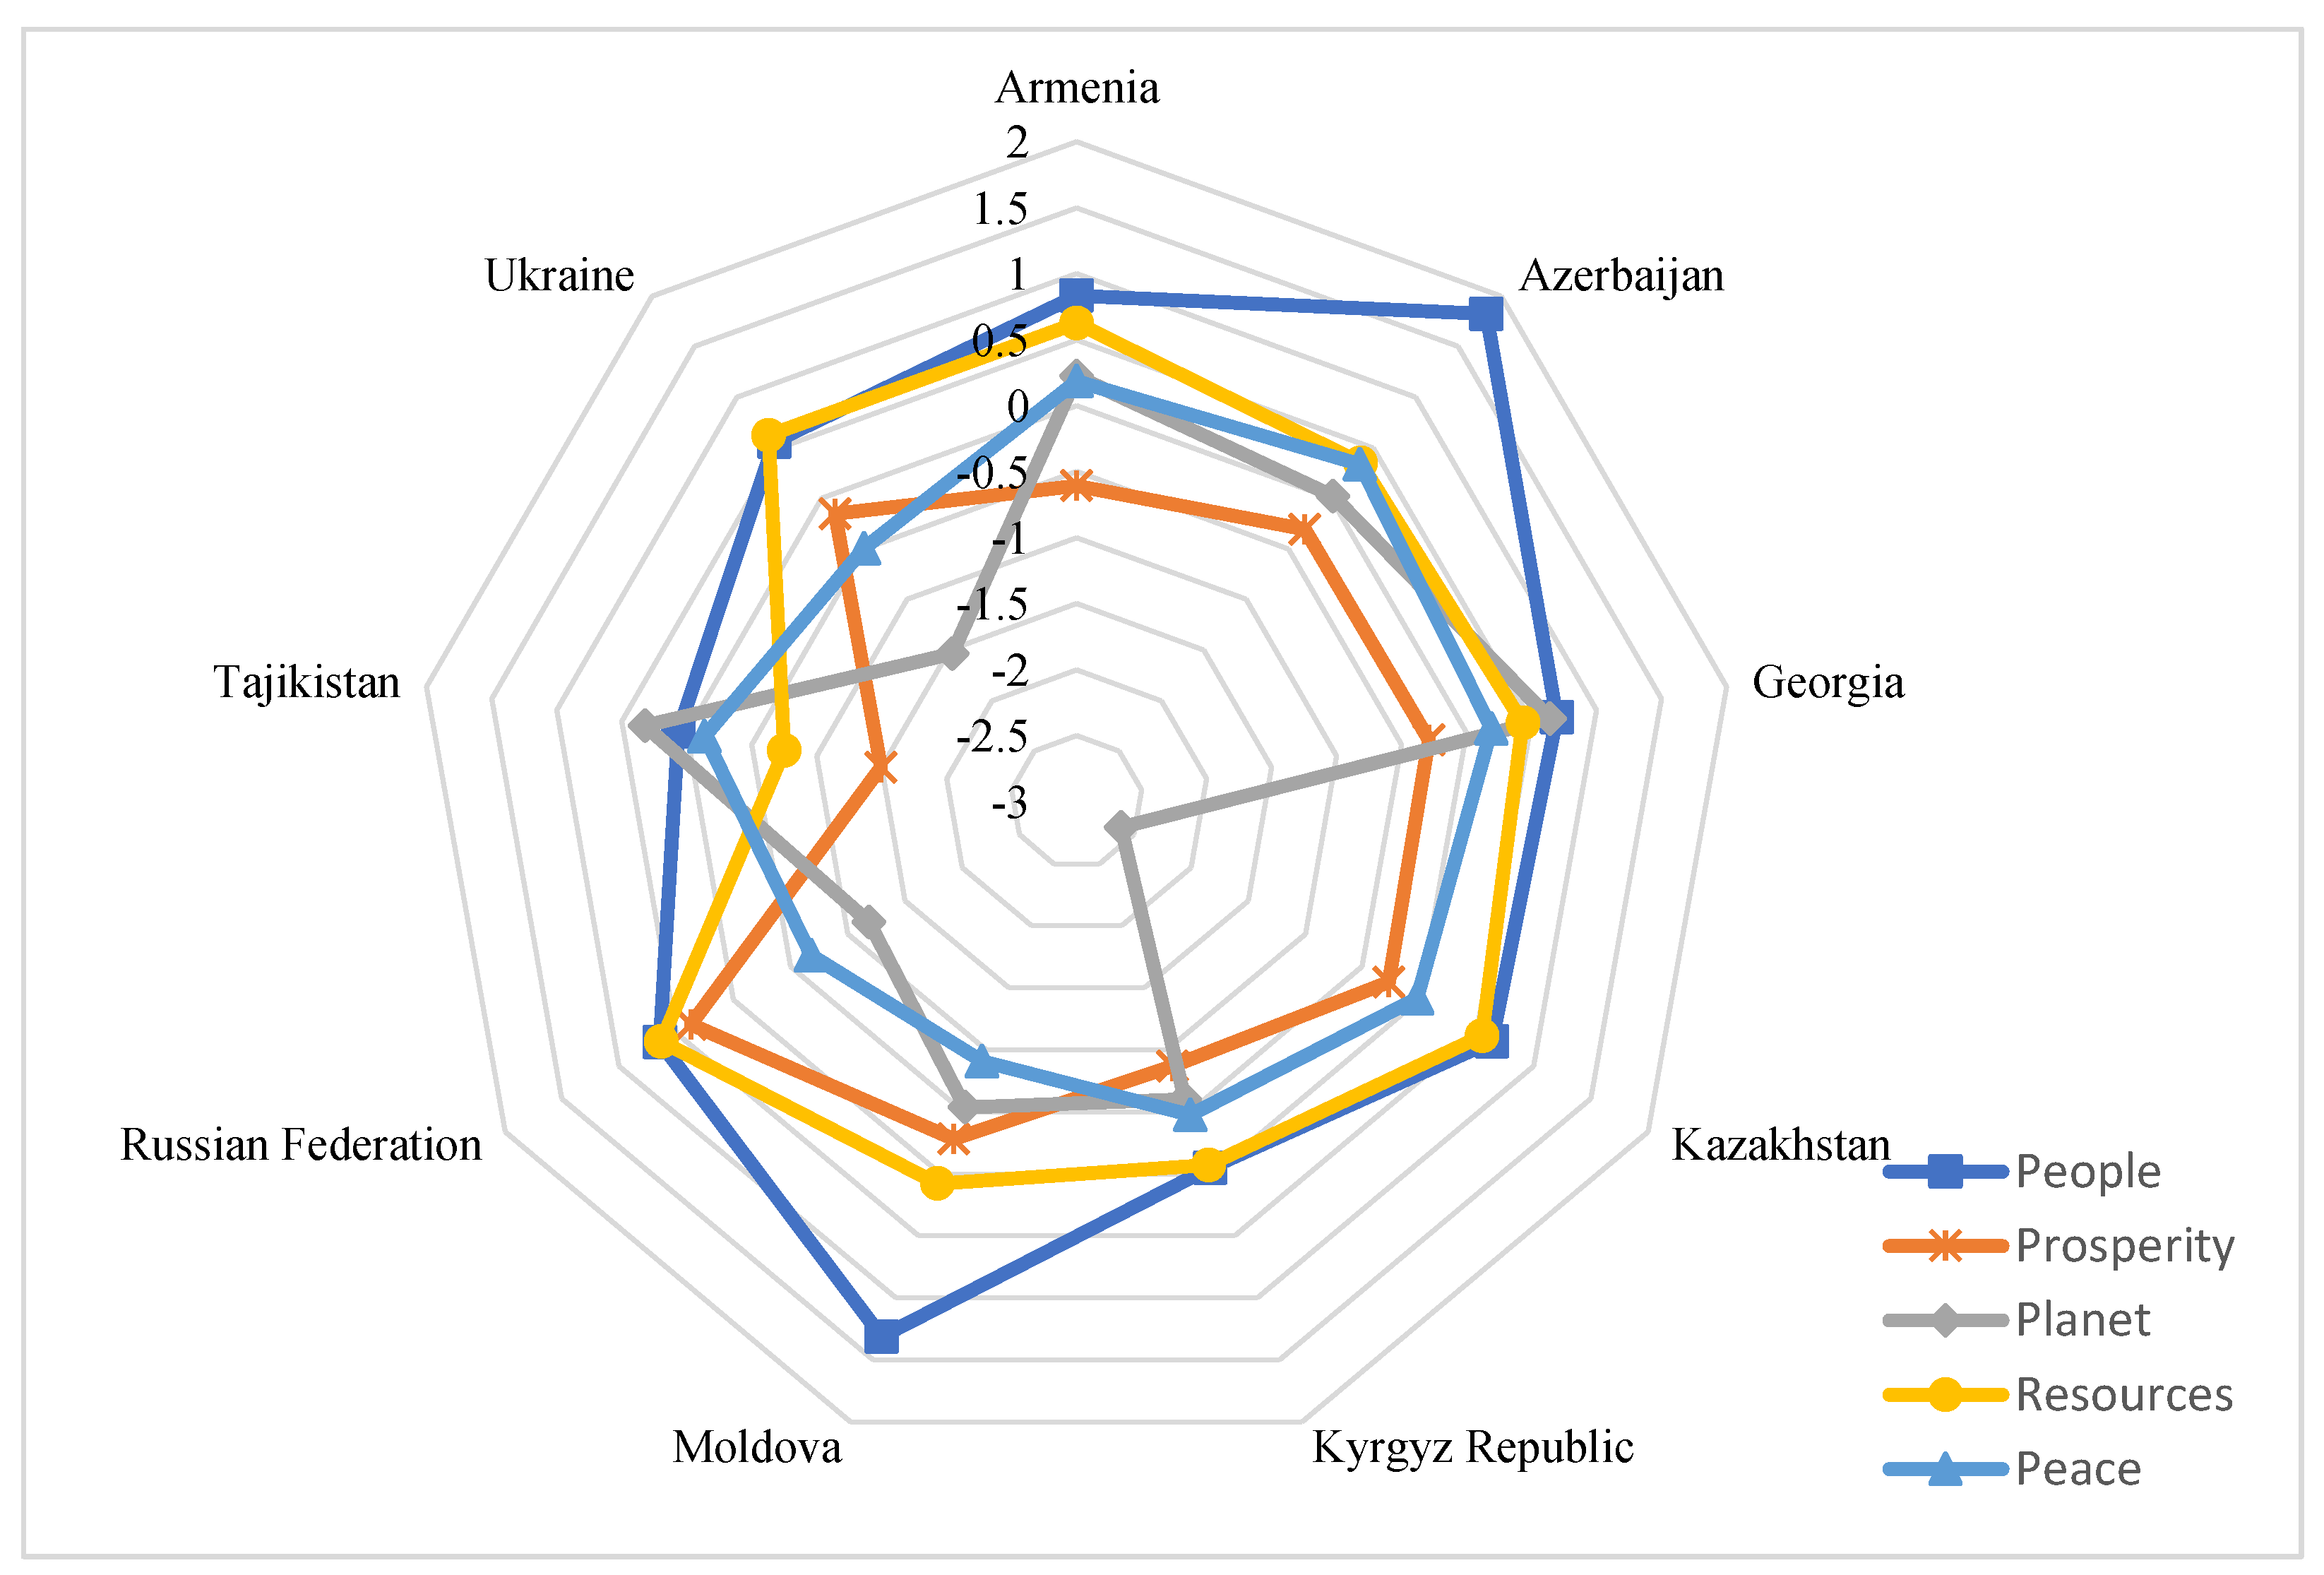
4.4.7 Commonwealth
In this cluster, Prosperity, Planet, and Peace are negatively associated with H&LS. This is partly in agreement with [156,157] who noted that in Commonwealth countries, environmental factors cause resource-related issues such as clean water and renewable energy. Ineffective usage of resources negatively influences the Commonwealth countries’ Peace while causing adverse effects on the economy. Nevertheless, in these countries, People positively relate to H&LS since having high human capital resources, natural resources, economic freedom, and sea access attract FDIs, increasing employment and reducing poverty [158] (Figure 18 and Figure 19). This cluster has no country outliers (Figure 18).
Figure 18.
Commonwealth – Cluster level SD Pillars - H&LS relationships.
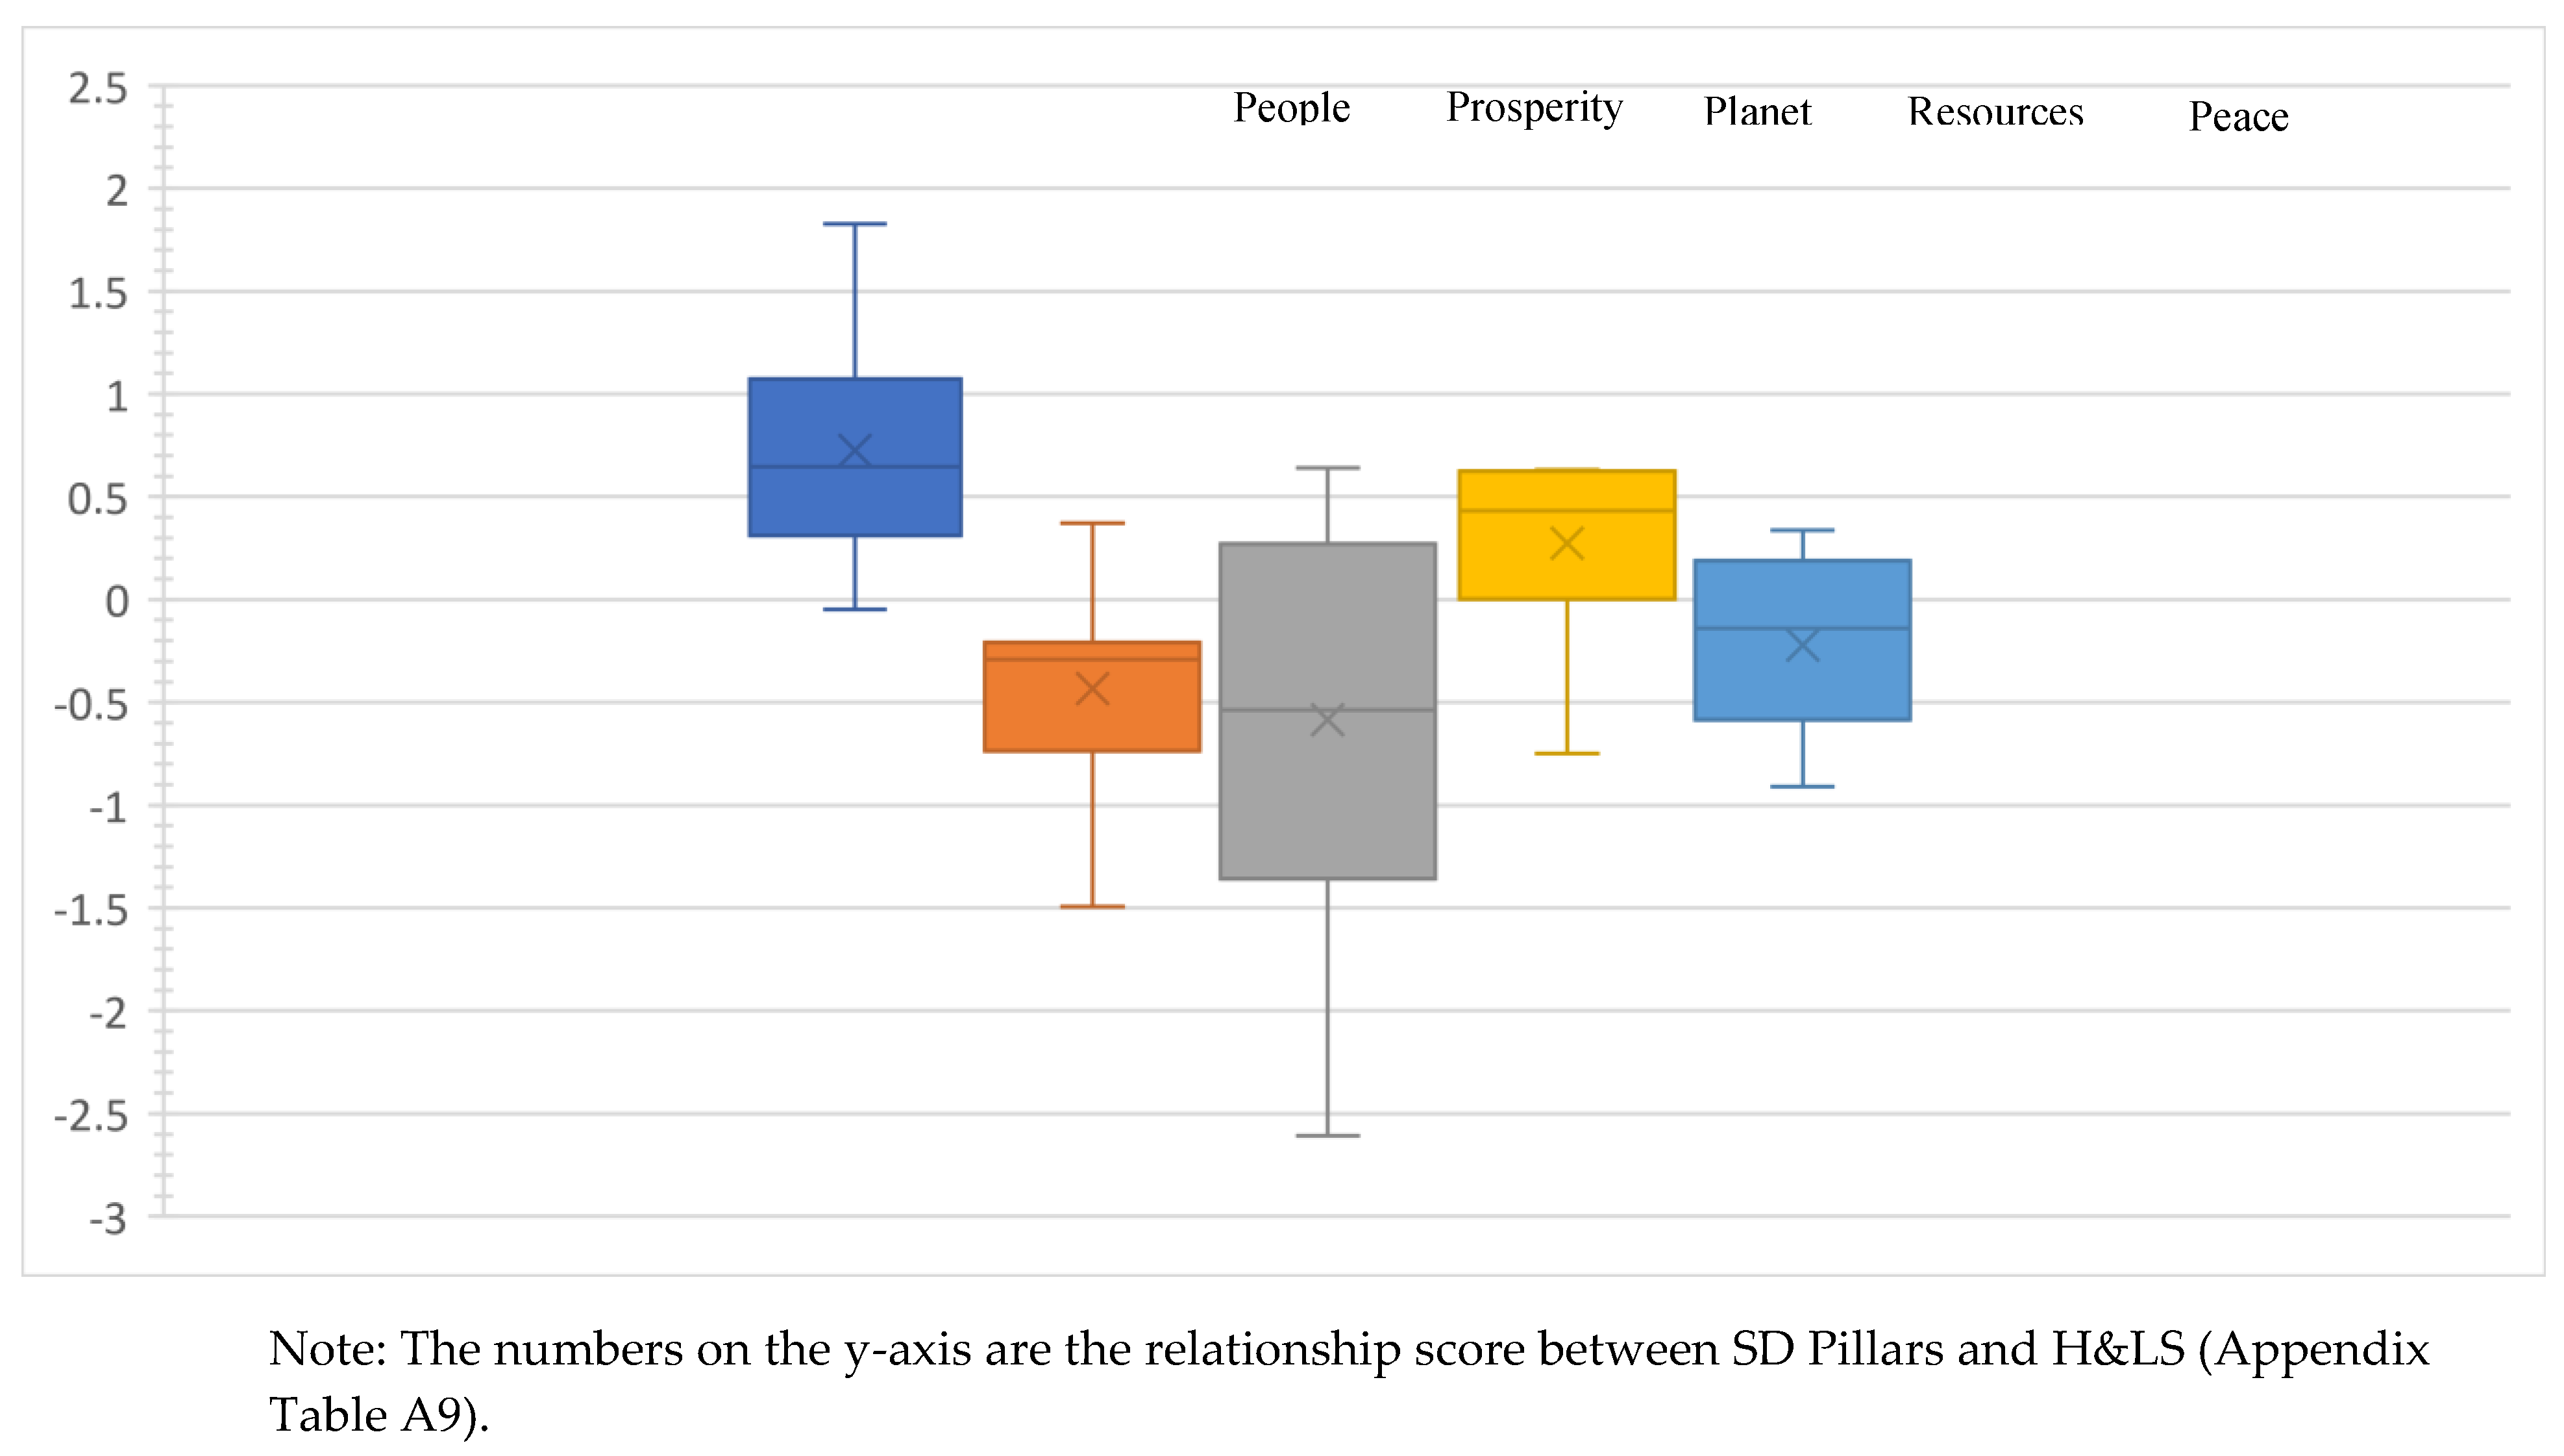
Figure 19.
Commonwealth - Country level SD Pillars - H&LS relationships.
The above results at the global, country cluster, and country level support Hypothesis 2.
4.4.8. Country outliers, globally and per country cluster
Country outliers at the global level are entirely different from those at the country cluster level (Figure 6, Figure 7, Figure 8, Figure 9, Figure 10, Figure 11, Figure 12, Figure 13, Figure 14, Figure 15, Figure 16, Figure 17 and Figure 18 and 20).
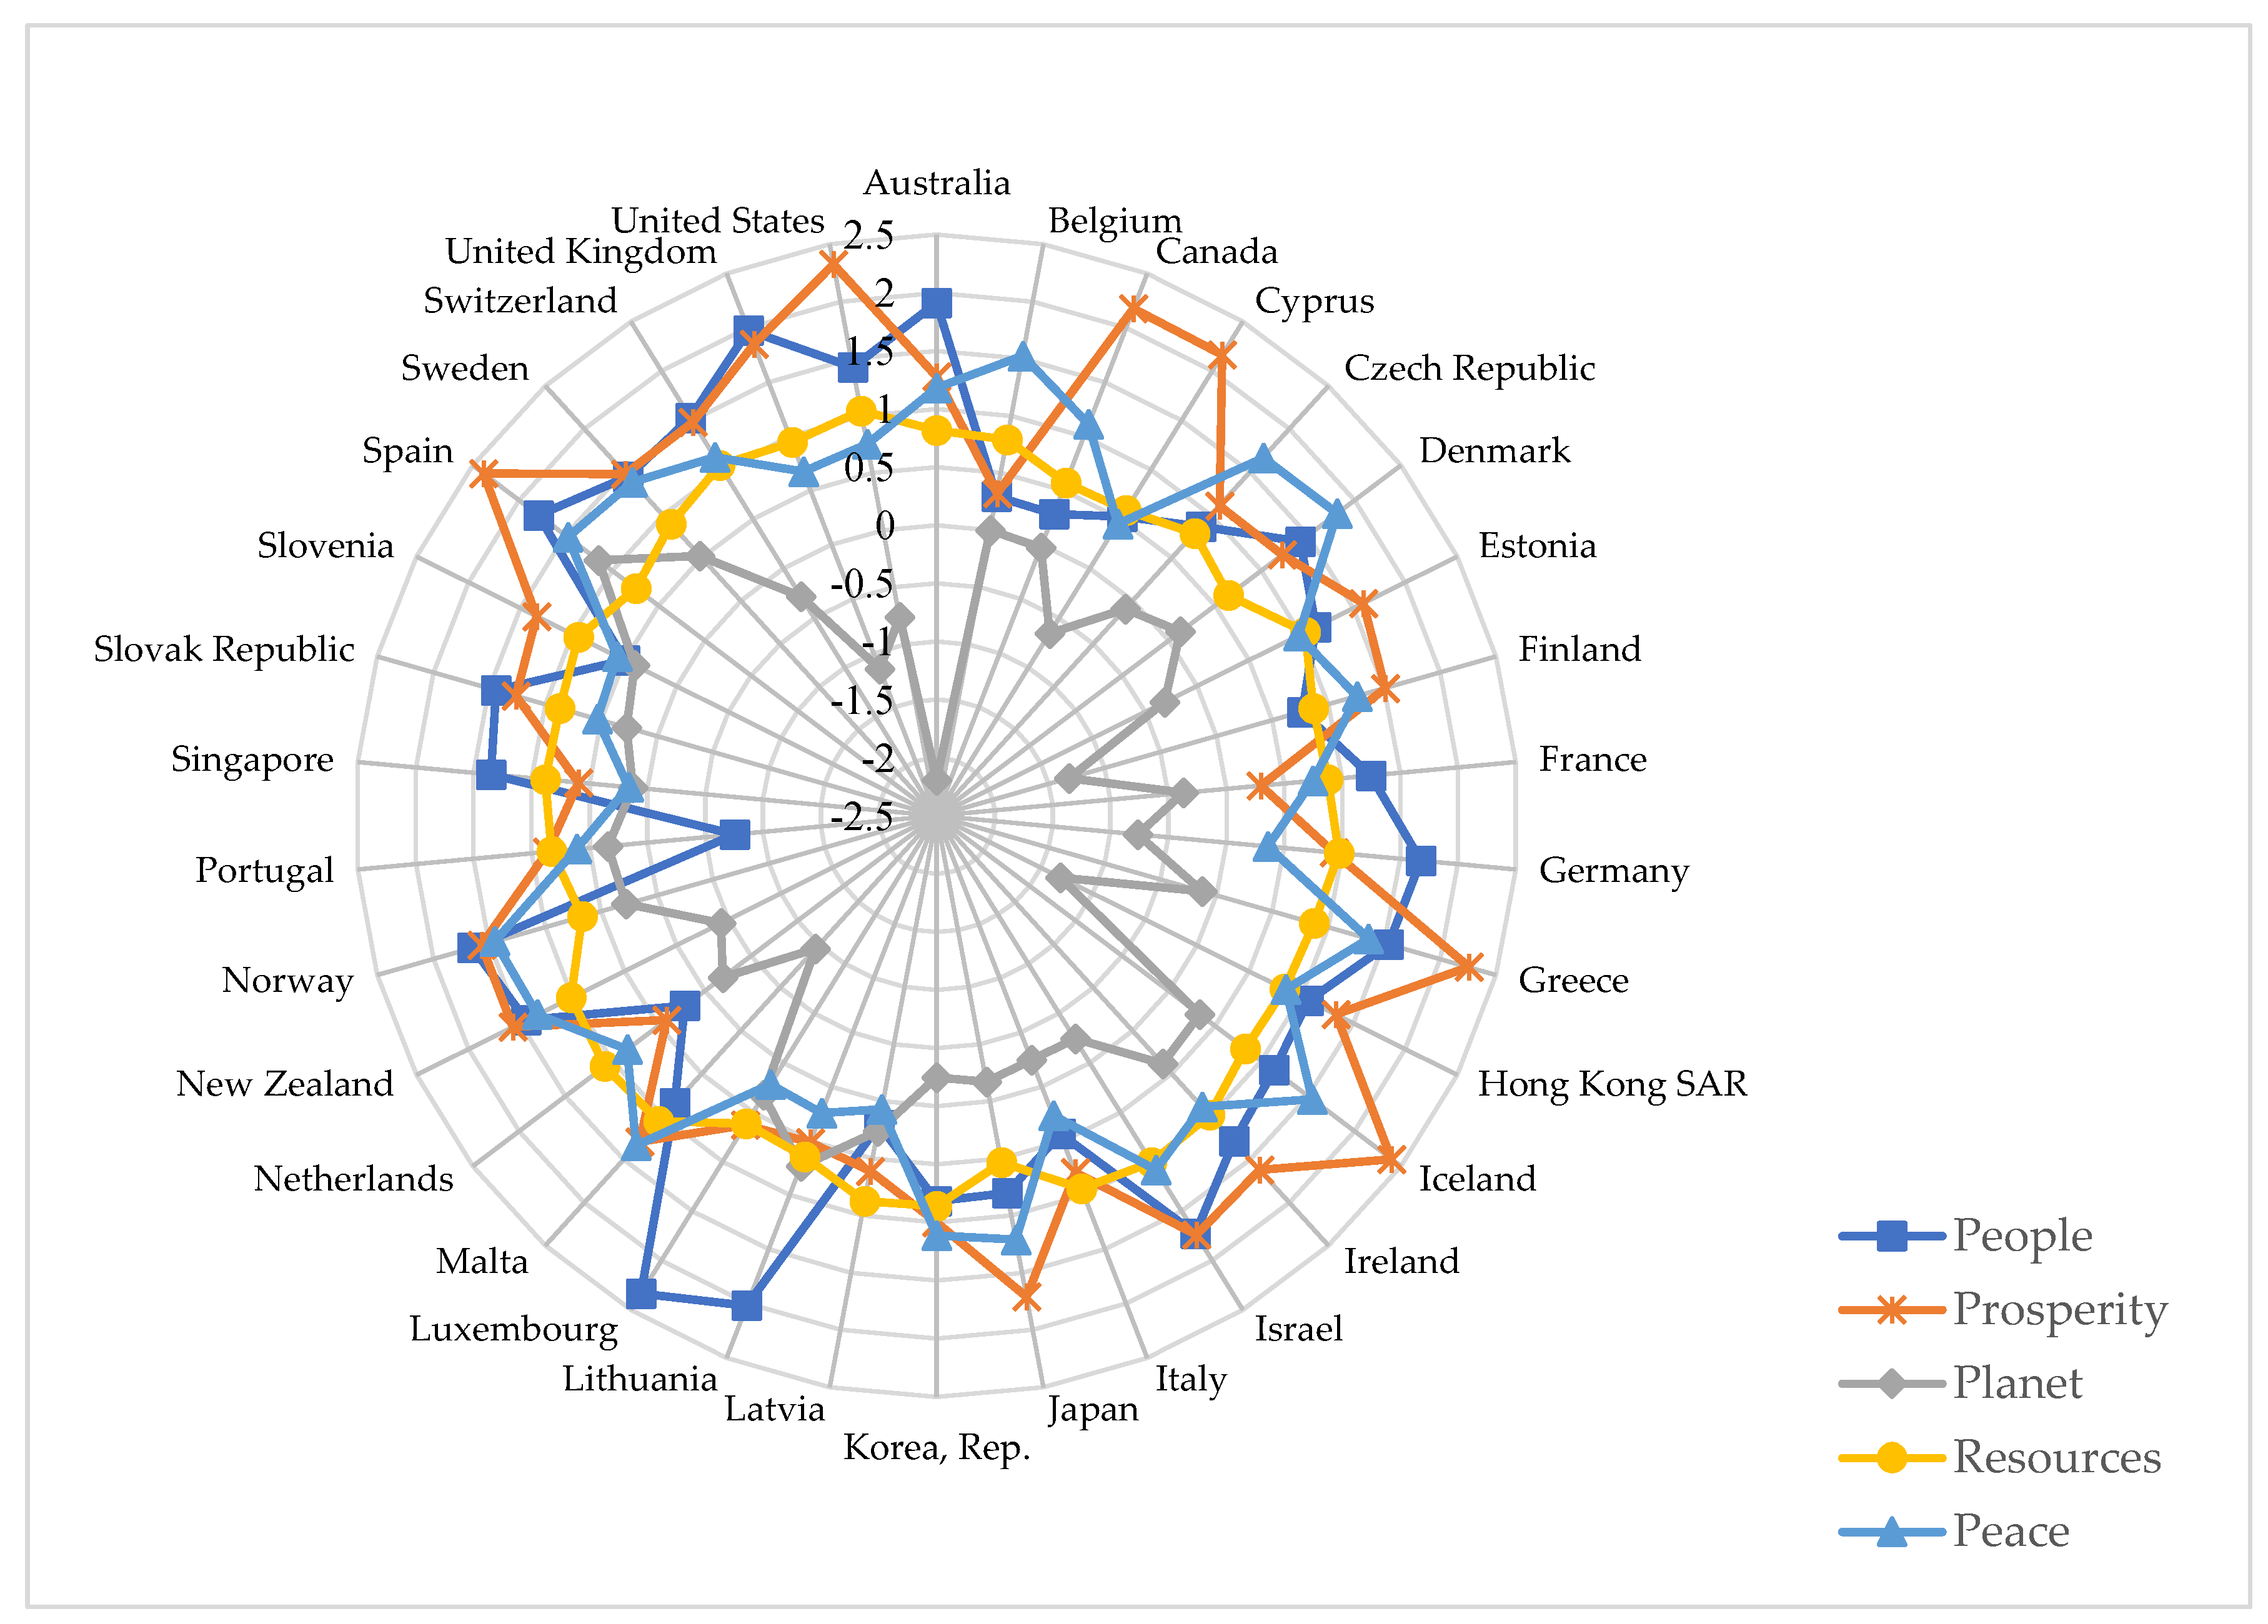
Global-level positive country outliers include Canada, Cyprus, Greece, Iceland, Spain, and the United States in the Prosperity pillar and Luxemburg in the People pillar. Moreover, positive country outliers are strongly and positively related to H&LS. The only positive country outliers at the country cluster level were Bangladesh (People) and Mauritius (Peace).
Global-level negative country outliers were Chad and Ethiopia in the Resources pillar, El Salvador, Honduras, and Venezuela in the Peace pillar, and Oman in the Planet pillar. In all these countries, the referred SD pillars are strongly and negatively related to H&LS (Figure 20). On the other hand, negative countries outliers at the cluster level were Portugal, Bhutan, Philippines, and Tunisia in the People pillar; Australia, Trinidad and Tobago, Lesotho, and South Africa in the Planet pillar; United Arab Emirates in the Resources pillar; and Lesotho in the Peace pillar.
Furthermore, rankings of the top and bottom 25 countries in terms of a comprehensive set of development indicators encompassing the average of the five SD pillars per country and the top and bottom 25 countries according to original H&LS data [104], shown in Table A10 in the appendix, are contrasting. For example, Germany is the fourth highest country in average of the five SD pillars and ranks the lowest in H&LS. A similar situation applies to Luxembourg. In contrast, Cameroon ranks the third lowest average of the five SD pillars but ranks 17th among the top H&LS countries. These differences suggest that citizens’ perceptions of H&LS are based on a narrow and diverse set of indicators. In turn, this represents a challenge for SD because factors contributing to H&LS may, at the same time, degrade the natural environment.
In paying more attention to the natural environment, the Global Footprint Network’s calculations (footprintnetwork.org) show that 30% of the countries with the highest biocapacity deficits- resource demands higher than their capacity for biophysical regeneration- are from Advanced Economies. At the same time, considering our scores for the five SD pillars for the different country clusters, shown in Table A3, Table A4, Table A5, Table A6, Table A7, Table A8 and Table A9 in the appendix, Advanced Economies rank the highest in all these pillars except the Planet pillar. These contrasting results suggest that, among others, the increasing global transfer of resources through economic/financial transactions are a key component yet to appear in most research, including ours.
All cases above reaffirm the perspective (parallax) effect. Because of such effects as well as the collective and complex nature of global and national SD, the only way forward is to create collaborative perspectives.
5. Implications, Limitations, and Future Research
5.1. Theoretical implications
This study explores a set of different “Social-turn” SD models relating the “Neoliberal-turn” with SD pillars. Our research makes several theoretical contributions. First, it examines a set of different “Social-turn” SD models relating six constructs from the “Neoliberal-turn” (e.g., Institutional Enhancers, Financial Enhancers, FDII, FDIO, GC-Ins, GC-InnS), with five SD pillars (Planet, People, Peace, Prosperity, and Resources) synthesizing the 17 U.N SDGs, and H&LS at the global and country cluster levels. This study uses 11 years of data (from 2007 to 2017) of 108 indicators from 129 countries. At the country level, we also related the five SD pillars to H&LS. Second, findings indicate that the different model configurations and levels examined may produce different results reaffirming the need for model specificity. However, SD requires specific models that need to be consistent with desirable global results (e.g., making sure that socio-economic activities are carried out well below tipping points). Finally, the model configurations studied are just a few among many possible because knowledge is incomplete, and global national (sustainable) development is diverse, multiple, and complex. Thus, the nomological network of global and national SD offers many other possibilities yet to be explored.
5.2. Practical implications
Our findings reaffirm that a comprehensive approach is needed and that social, economic, and environmental constructs are necessary in modeling SD. Given that different models address different questions and thus may produce different answers for different uses, it is essential to "properly" situate the results of a given model. Therefore, policymakers need to be cognizant of models’ assumptions and limitations. Similarly, since a diversity of space and time integrations are required, policymakers ought to facilitate dialogue and collaboration among different stakeholders to reach common ground and SD progress.
5.3. Limitations and future research
As with any research, our study has limitations. As noted above, our research examines only a narrow set of vast multiple possibilities yet to be explored in comprehensive examinations of global and national development. Thus, it is necessary to study alternative models incorporating multiple additional relationships and/or constructs as well as to carry out sensitivity analysis involving differential aggregation levels. Moreover, our approach can be expanded to include other possibilities. For example, future studies may incorporate relationships among SD pillars.
The model constituents of the “Neoliberal-turn” (e.g., Financial Enhancers) assume that free market assumptions will apply to all countries. However, this assumption has been shown not to hold, given that in many countries, the market system is not sufficiently developed and or does not function "freely" [1], which prompts questions about how to appropriately model such countries and the degree of confidence to give results from models based on such assumptions.
Our approach is static. SD goals entail transitions. Therefore, dynamic models may be more informative in the future. Similarly, future studies must explore different integrations within and between levels over time since phenomena occur at different spaces and times. Formulating different construct scenario sets considering diverse periods will shed light on more desirable paths for national SD. Time considerations are key because disorderly or delayed sustainability transitions may increase risks, costs, and the probability of failure. In addition, many transitions and integrations are required to progress toward national SD. The specifics and effectiveness of these transitions and integrations depend fundamentally on the quality of social organizing. Thus, in accordance with post-normal science, governance is the most critical factor in progressing toward a more sustainable world. In other words, normal science can only inform and help advance sustainability. However, it needs to create synergies with the willingness and ability to collaboratively formulate and implement desirable SD paths between different actors at different spatial scales (levels) and at different times. Such exercises may help the much-needed democratic dialogs for SD because the central problem of SD is the definition of the problem. The problem of SD may be viewed as a post-normal science problem [10] in which stakes, uncertainties, and diversity of interests are high. In this framework, models, inform and support democratically made decisions. Thus, future studies should iterate normal science results with post-normal science social processes. The problem of sustainable national and global development starts and finishes with the quality of social relationships.
6. Conclusion
This study shows that most relationships depicted in the “Social-turn 1," “Social-turn 1.2”, and “Social-turn 2” models differ in these configurations. In addition to model configuration differences, our research shows relationship differences between the global, country cluster, and country levels. Not significant, negative, or weak construct relationships suggest that SD deficits must be urgently addressed. For example, Planet, People, and Peace have either negative relationships or weak effects. Thus, deficits appear to be worse for the environmental and social dimensions reaffirming the need to continue taking a “Social-turn” approach. Addressing the complex challenges of SD entails strengthening, reconfiguring, and or creating new relationships. Paraphrasing [18], in co-creating societies and nature, we urgently need to do it creatively and more effectively than in the past.
Author Contributions
L.P.: Conceptualization, Methodology, Formal Analysis, Investigation, Resources, Data Curation, Writing- Original Draft, Writing- Review and Editing, Supervision, Project Administration; A.C.: Conceptualization, Methodology, Formal Analysis, Investigation, Resources, Data Curation, Writing- Original Draft, Writing- Review and Editing, Visualization; M.R.A.: Conceptualization, Methodology, Formal Analysis, Investigation, Resources, Data Curation, Writing- Original Draft, Writing- Review and Editing, Visualization. All authors have read and agreed to the published version of the manuscript.
Funding
This research received no external funding.
Institutional Review Board Statement
The study was conducted in accordance with the Declaration of Helsinki. Since the data used in this paper is publicly available data it was not required for this research to be approved by the Institutional Review Board of Texas A&M International University.
Informed Consent Statement
Informed consent was not required because the data is secondary data, and it is publicly available.
Data Availability Statement
Data supporting reported results can be found at the sources referred to in the Method section.
Acknowledgments
The authors acknowledge the support provided by the Graduate School, Texas A&M International University.
Conflicts of Interest
The authors declare no conflict of interest.
Appendix
Table A1.
Pillars and Indicators.
| Global Competitiveness (Institutional) (41) | |
| Higher Education and Training |
Secondary education enrollment, gross %* |
| Tertiary education enrollment, gross %* | |
| Quality of the education system, 1-7 (best) | |
| Quality of math and science education, 1-7 (best) | |
| Quality of management schools, 1-7 (best) | |
| Internet access in schools, 1-7 (best) | |
| Availability of research and training services, 1-7 (best) | |
| Extent of staff training, 1-7 (best) | |
| Goods Market Efficiency |
Intensity of local competition, 1-7 (best) |
| Extent of market dominance, 1-7 (best) | |
| Effectiveness of anti-monopoly policy, 1-7 (best) | |
| No. procedures to start a business* | |
| No. days to start a business* | |
| Agricultural policy costs, 1-7 (best) | |
| Total tax rate, % profits* | |
| Prevalence of trade barriers, 1-7 (best) | |
| Prevalence of foreign ownership, 1-7 (best) | |
| Business impact of rules on FDI, 1-7 (best) | |
| Table A1.Cont. | |
| Goods Market Efficiency |
Burden of customs procedures, 1-7 (best) |
| Imports as a percentage of GDP* | |
| Trade tariffs, % duty* | |
| Degree of customer orientation, 1-7 (best) | |
| Buyer sophistication, 1-7 (best) | |
| Labor Market Efficiency |
Cooperation in labor-employer relations, 1-7 (best) |
| Hiring and firing practices, 1-7 (best) | |
| Flexibility of wage determination, 1-7 (best) | |
| Redundancy costs, weeks of salary* | |
| Pay and productivity, 1-7 (best) | |
| Reliance on professional management, 1-7 (best) | |
| Women in labor force, ratio to men* | |
| Financial Market Efficiency |
Financing through local equity market, 1-7 (best) |
| Ease of access to loans, 1-7 (best) | |
| Venture capital availability, 1-7 (best) | |
| Soundness of banks, 1-7 (best) | |
| Regulation of securities exchanges, 1-7 (best) | |
| Technological Readiness |
Legal rights index, 0–10 (best)* |
| Availability of latest technologies, 1-7 (best) | |
| Firm-level technology absorption, 1-7 (best) | |
| FDI and technology transfer, 1-7 (best) | |
| Individuals using Internet, %* | |
| Fixed broadband Internet subscriptions/100 pop. * | |
| Global Competitiveness (Innovation Sophistication) (14) | |
| Business Sophistication |
Local supplier quantity, 1-7 (best) |
| Local supplier quality, 1-7 (best) | |
| State of cluster development, 1-7 (best) | |
| Nature of competitive advantage, 1-7 (best) | |
| Production process sophistication, 1-7 (best) | |
| Control of international distribution, 1-7 (best) | |
| Extent of marketing, 1-7 (best) | |
| Value chain breadth, 1-7 (best) | |
| Innovation | Capacity for innovation, 1-7 (best) |
| Quality of scientific research institutions, 1-7 (best) | |
| Company spending on R&D, 1-7 (best) | |
| University-industry collaboration in R&D, 1-7 (best) | |
| Gov’t procurement of advanced tech products, 1-7 (best) | |
| Available of scientists and engineers, 1-7 (best) | |
| Economic Enhancers (Institutional) (4) | |
| Business Freedom | |
| Table A1. Cont. | |
| Property Rights | |
| Government Integrity | |
| Judicial Effectiveness | |
| Economic Enhancers (Financial) (5) | |
| Government Spending | |
| Monetary Freedom | |
| Trade Freedom | |
| Investment Freedom | |
| Financial Freedom | |
| Foreign Direct Investment | |
| FDI IN % of the GDP and Annual USD | |
| FDI OUT % of the GDP and Annual USD | |
| Sustainable Development Dimension (People) (7) | |
| SDG1 | Poverty headcount ratio at $1.90 a day (2011 PPP) (% of the population) |
| Poverty headcount ratio at national poverty lines (% of the population) | |
| SDG3 | Maternal mortality ratio (modeled estimate per 100,000 live births) |
| SDG4 | Educational attainments, at least completed upper secondary, population 25+, total (%) (cumulative) |
| Educational attainment, at least completed post-secondary, population 25+, total (%) (cumulative) | |
| Educational attainment, at least completed lower secondary, population 25+, total (%) (cumulative) | |
| SDG5 | Women Business and the Law Index Score (scale 1-100) |
| Sustainable Development Dimension (Prosperity) (6) | |
| SDG8 | GDP per capita growth (annual %) |
| Unemployment, total (% of the total labor force) (modeled ILO estimate) | |
| SDG9 | Research and development expenditure (% of GDP) |
| Individuals using the Internet (% of the population) | |
| SDG10 | Adjusted net savings, excluding particulate emission damage (% of GNI) |
| SDG11 | PM2.5 air pollution, mean annual exposure (micrograms per cubic meter) |
| Sustainable Development Dimension (Planet) (4) | |
| SDG13 | CO2 emissions (metric tons per capita) |
| SDG14 | CO2 emissions (kg per PPP $ of GDP) |
| SDG15 | Forest area (% of land area) |
| Annual freshwater withdrawals, total (% of internal resources) | |
| Sustainable Development Dimension (Resources) (5) | |
| SDG2 | Prevalence of undernourishment (% of the population) |
| SDG6 | People using at least basic drinking water services, rural (% of rural population) |
| People using at least basic drinking water services, urban (% of urban population) | |
| People using safely managed drinking water services (% of the population) | |
| Table A1. Cont. | |
| SDG7 | Renewable energy consumption (% of total final energy consumption) |
| Sustainable Development Dimension (Peace) (19) | |
| SDG16 | Intentional homicides (per 100,000 people) |
| SDG17 (adjusted average of following indicators) |
Property rights, 1-7 (best) |
| Intellectual property protection, 1-7 (best) | |
| Diversion of public funds, 1-7 (best) | |
| Public trust in politicians, 1-7 (best) | |
| Judicial independence, 1-7 (best) | |
| Favoritism in decisions of government officials, 1-7 (best) | |
| Wastefulness of government spending, 1-7 (best) | |
| Burden of government regulation, 1-7 (best) | |
| Transparency of government policymaking, 1-7 (best) | |
| Business costs of terrorism, 1-7 (best) | |
| Business costs of crime and violence, 1-7 (best) | |
| Organized crime, 1-7 (best) | |
| Reliability of police services, 1-7 (best) | |
| Ethical behavior of firms, 1-7 (best) | |
| Strength of auditing and reporting standards, 1-7 (best) | |
| Efficacy of corporate boards, 1-7 (best) | |
| Protection of minority shareholders’ interests, 1-7 (best) | |
| Strength of investor protection, 0–10 (best)* | |
| Happiness & Life Satisfaction | |
| Adjusted to 100 (score) Life Satisfaction in Cantril Ladder (Helliwell, Huang, & Wang, 2019) (The underlying source of the happiness scores in the World Happiness Report is the Gallup World Poll—a set of nationally representative surveys undertaken in more than 160 countries in over 140 languages. The main life evaluation question asked in the poll is: “Please imagine a ladder, with steps numbered from 0 at the bottom to 10 at the top. The top of the ladder represents the best possible life for you, and the bottom of the ladder represents the worst possible life for you. On which step of the ladder would you say you personally feel you stand at this time?” (Also known as the “Cantril Ladder.”) |
|
Table A2.
Country Cluster Population and GDP.
| Populations | Percentages | GDP | Percentages | |
|---|---|---|---|---|
| Advanced Economies | 977,693,601.00 | 15.76057015 | 36,083,063,161,670.50 | 54.14794 |
| Emerging Europe | 164,754,708.00 | 2.655871052 | 1,880,760,824,314.84 | 2.822358 |
| Emerging Asia | 3,208,431,222.00 | 51.72040125 | 16,993,899,236,746.00 | 25.50184 |
| Middle East | 475,969,475.00 | 7.672700622 | 5,467,148,817,836.51 | 8.204261 |
| Latin America | 542,274,035.00 | 8.741540254 | 3,752,384,843,371.03 | 5.631005 |
| Sub Saharan | 598,914,908.00 | 9.654599776 | 849,177,983,890.26 | 1.274316 |
| Commonwealth | 235,377,230.00 | 3.794316892 | 1,611,488,033,222.07 | 2.418275 |
| Clusters Total | 6,203,415,179.00 | 66,637,922,901,051.30 | ||
| World | 6,674,000,000.00 | 67,500,000,000,000.00 | ||
| % Of World | 92.94% | 98.72% |
Source: World Bank Group, 2019.
Table A3.
Advanced economies SD pillars relationships with H&LS score.
| Countries | People | Prosperity | Planet | Resources | Peace |
|---|---|---|---|---|---|
| Australia | 1.913 | 1.278 | -2.192 | 0.816 | 1.179 |
| Belgium | 0.296 | 0.319 | 0 | 0.79 | 1.526 |
| Canada | 0.285 | 2.177 | -0.026 | 0.569 | 1.114 |
| Cyprus | 0.529 | 2.164 | -0.652 | 0.59 | 0.453 |
| Czech Republic | 0.87 | 1.108 | -0.092 | 0.79 | 1.665 |
| Denmark | 1.414 | 1.224 | 0.127 | 0.644 | 1.814 |
| Estonia | 1.144 | 1.599 | -0.309 | 1.04 | 0.976 |
| Finland | 0.768 | 1.509 | -1.318 | 0.869 | 1.257 |
| France | 1.247 | 0.301 | -0.372 | 0.878 | 0.747 |
| Germany | 1.68 | 0.928 | -0.763 | 0.973 | 0.36 |
| Greece | 1.539 | 2.257 | -0.127 | 0.872 | 1.361 |
| Hong Kong SAR | 1.072 | 1.336 | -1.312 | 0.844 | 0.853 |
| Iceland | 1.131 | 2.4 | 0.333 | 0.823 | 1.547 |
| Ireland | 1.291 | 1.62 | 0.384 | 0.981 | 0.886 |
| Israel | 1.727 | 1.742 | -0.241 | 1.007 | 1.083 |
| Italy | 0.432 | 0.792 | -0.249 | 0.943 | 0.269 |
| Japan | 0.802 | 1.711 | -0.169 | 0.535 | 1.21 |
| Korea, Rep. | 0.817 | 0.997 | -0.247 | 0.859 | 1.111 |
| Latvia | 0.207 | 0.612 | 0.262 | 0.871 | 0.071 |
| Lithuania | 2.021 | 0.512 | 0.736 | 0.646 | 0.241 |
| Luxembourg | 2.334 | 0.629 | 0.328 | 0.614 | 0.218 |
| Malta | 0.848 | 1.293 | -0.949 | 1.054 | 1.341 |
| Netherlands | 0.214 | 0.413 | -0.191 | 1.076 | 0.838 |
| New Zealand | 1.448 | 1.57 | -0.424 | 1.013 | 1.339 |
| Norway | 1.652 | 1.571 | 0.278 | 0.668 | 1.452 |
| Portugal | -0.753 | 0.866 | 0.342 | 0.828 | 0.613 |
| Singapore | 1.348 | 0.593 | 0.123 | 0.882 | 0.165 |
| Slovak Republic | 1.441 | 1.264 | 0.272 | 0.873 | 0.536 |
| Slovenia | 0.499 | 1.347 | 0.402 | 0.944 | 0.571 |
| Spain | 1.789 | 2.388 | 1.146 | 0.744 | 1.476 |
| Sweden | 1.445 | 1.477 | 0.524 | 0.897 | 1.385 |
| Switzerland | 1.525 | 1.482 | -0.282 | 1.048 | 1.13 |
| United Kingdom | 1.978 | 1.85 | -1.148 | 0.949 | 0.678 |
| United States | 1.423 | 2.327 | -0.761 | 1.045 | 0.754 |
Note:Scores are created by converting categorical data (country) to numerical data to build a number (score; between - 4 and + 4).
Table A4.
Emerging Europe SD pillars relationships with H&LS score.
| Countries | People | Prosperity | Planet | Resources | Peace |
|---|---|---|---|---|---|
| Bosnia and Herzegovina | -0.104 | -0.104 | -1.09 | 0.589 | -0.32 |
| Bulgaria | 1.219 | -0.028 | -0.54 | 0.874 | -0.06 |
| Croatia | 0.408 | 0.467 | 0.303 | 0.765 | 0.15 |
| Hungary | 1.248 | 0.764 | 0.112 | 0.758 | 0.16 |
| Montenegro | 0.166 | 0.182 | 0.561 | 0.444 | 0.376 |
| Poland | 1.035 | 0.208 | -0.64 | 0.902 | 0.364 |
| Romania | 0.558 | -0.194 | 0.232 | 0.749 | 0.117 |
| Serbia | 0.605 | 0.132 | -0.97 | -0.011 | -0.1 |
| Turkey | -1.038 | -0.498 | 0.172 | 0.586 | 0.034 |
Note: Scores are created by converting categorical data (country) to numerical data to build a number (score; between - 4 and + 4).
Table A5.
Emerging Asia SD pillars relationships with H&LS score.
| Countries | People | Prosperity | Planet | Resources | Peace |
|---|---|---|---|---|---|
| Bangladesh | -0.12 | 0.935 | -0.41 | 0.413 | -0.2 |
| Bhutan | -1.549 | -0.969 | 1.206 | -1.443 | -0.18 |
| Brunei Darussalam | 0.207 | -0.599 | -1.71 | 0.401 | 0.519 |
| Cambodia | -1.219 | -0.662 | 0.842 | -0.29 | 0.408 |
| China | -0.199 | 0.406 | -0.06 | 0.798 | 0.872 |
| India | 0.113 | -1.421 | -1.77 | -1.266 | -0.41 |
| Indonesia | -0.012 | -0.479 | 0.635 | -0.376 | -0.41 |
| Malaysia | 0 | -0.683 | 0.254 | 0.425 | 0.142 |
| Mongolia | -0.357 | -0.647 | 1.331 | -1.235 | -0.29 |
| Nepal | -0.007 | -0.658 | 0.114 | 0.044 | -0.08 |
| Philippines | -1.626 | -1.468 | 0.653 | -0.158 | -0.23 |
| Sri Lanka | -0.585 | -0.918 | 1.414 | -0.624 | -1.12 |
| Thailand | -0.433 | -1.995 | 0.011 | -0.271 | 0.3 |
| Timor-Leste | -0.617 | -2.079 | 1.247 | -1.105 | -0.27 |
| Viet Nam | 0.238 | -0.878 | 1.082 | -0.176 | 0.212 |
Note: Scores are created by converting categorical data (country) to numerical data to build a number (score; between - 4 and + 4).
Table A6.
Middle East SD pillars relationships with H&LS score.
| Countries | People | Prosperity | Planet | Resources | Peace |
|---|---|---|---|---|---|
| Algeria | -0.457 | -0.408 | -0.29 | 0.485 | -0.36 |
| Bahrain | -0.321 | -0.196 | -2.97 | 0.442 | 0.801 |
| Egypt | -0.273 | -1.246 | -1.21 | 0.678 | 0.048 |
| Iran, Islamic Rep. | -0.625 | -0.688 | -1.64 | 0.674 | -0.88 |
| Jordan | -0.38 | 0.016 | -0.56 | 0.771 | 0.609 |
| Kuwait | -1.008 | -0.399 | -2.45 | 0.637 | 0.373 |
| Mauritania | -0.071 | 0.037 | -0.24 | -0.157 | 0.361 |
| Morocco | -0.462 | -0.278 | -1.79 | -0.017 | 1.053 |
| Oman | -0.705 | -0.515 | -3.21 | 0.399 | 1.348 |
| Pakistan | -0.422 | -0.894 | -1.92 | 0.334 | 0.782 |
| Qatar | -0.554 | -0.285 | -0.33 | 0.519 | 0.427 |
| Saudi Arabia | -0.285 | 0.459 | -1.91 | 0.371 | 1.085 |
| Tunisia | -1.956 | -1.255 | -0.12 | -0.641 | -0.18 |
| United Arab Emirates | -0.983 | -0.714 | 0.317 | -1.142 | -0.57 |
Note: Scores are created by converting categorical data (country) to numerical data to build a number (score; between - 4 and + 4).
Table A7.
Latin America SD pillars relationships with H&LS score.
| Countries | People | Prosperity | Planet | Resources | Peace |
|---|---|---|---|---|---|
| Argentina | -0.398 | 0.15 | -0.08 | 0.624 | -0.57 |
| Bolivia | -0.446 | -0.423 | 0.506 | -0.309 | -0.88 |
| Brazil | -1.021 | 0.466 | 1.11 | 0.273 | -1.42 |
| Chile | 0.138 | -0.071 | 0.099 | 0.709 | 0.742 |
| Colombia | -0.992 | -0.29 | 1.143 | 0.118 | -1.81 |
| Costa Rica | -0.594 | -0.117 | 1.23 | 0.598 | -0.14 |
| Dominican Republic | -0.747 | 0.052 | 0.74 | 0.209 | -1.23 |
| Ecuador | -1.41 | -0.313 | 0.654 | -0.077 | -1.01 |
| El Salvador | -1.702 | -0.98 | 0.696 | 0.04 | -3.87 |
| Guatemala | -0.788 | -1.056 | 0.922 | -0.63 | -2.18 |
| Honduras | -1.761 | -0.514 | 0.795 | -0.309 | -3.72 |
| Jamaica | -0.051 | 0.302 | 0.199 | 0.168 | -2.58 |
| Mexico | -1.136 | -0.315 | 0.188 | 0.18 | -1.02 |
| Nicaragua | -0.054 | -0.708 | 0.731 | -1.003 | -0.62 |
| Panama | -0.143 | -0.498 | 1.068 | 0.179 | -0.39 |
| Paraguay | -1.293 | -0.389 | 1.285 | -0.259 | -0.85 |
| Peru | -0.382 | -0.649 | 1.087 | -0.482 | -0.33 |
| Trinidad and Tobago | 0.139 | -0.227 | -1.86 | 0.249 | -1.46 |
| Uruguay | -0.898 | -0.002 | 0.498 | 0.296 | 0.33 |
| Venezuela | -0.261 | -0.078 | 0.144 | 0.121 | -3.5 |
Note: Scores are created by converting categorical data (country) to numerical data to build a number (score; between - 4 and + 4).
Table A8.
Sub-Saharan SD pillars relationships with H&LS score.
| Countries | People | Prosperity | Planet | Resources | Peace |
|---|---|---|---|---|---|
| Benin | -0.609 | -0.87 | 0.584 | -1.331 | -0.47 |
| Botswana | -0.191 | -0.23 | 0.468 | -0.654 | 0.224 |
| Burkina Faso | -1.011 | -1.117 | 0.947 | -2.03 | -0.57 |
| Burundi | -1.319 | -1.185 | 0.907 | -1.215 | -0.61 |
| Cameroon | -0.983 | -1.276 | 1.088 | -1.652 | -0.16 |
| Chad | -1.384 | -1.31 | 0.86 | -3.112 | -0.87 |
| Côte d’Ivoire | -0.894 | -0.557 | 0.678 | -1.786 | -0.66 |
| Ethiopia | -1.129 | -1.371 | 0.886 | -3.249 | -0.14 |
| Ghana | -0.357 | -0.784 | 0.963 | -1.154 | 0.044 |
| Kenya | -0.729 | -0.77 | 0.608 | -1.77 | -0.18 |
| Lesotho | -0.729 | -0.403 | -0.83 | -1.083 | -1.51 |
| Madagascar | -0.846 | -0.949 | 1.009 | -2.503 | -0.52 |
| Malawi | -0.701 | -0.714 | 1.09 | -1.379 | -0.17 |
| Mali | -2.046 | -0.919 | 0.726 | -0.911 | -0.4 |
| Mauritius | 0.148 | -0.099 | 0.313 | 0.69 | 0.703 |
| Mozambique | -1.435 | -0.832 | 1.17 | -2.608 | -0.36 |
| Namibia | -0.055 | -0.293 | 0.296 | -0.5 | -0.01 |
| Nigeria | -0.959 | -1.155 | 0.82 | -2.009 | -0.63 |
| Senegal | -1.302 | -0.718 | 0.766 | -0.638 | -0.12 |
| South Africa | -0.483 | 0.13 | -2.07 | 0.311 | -1.23 |
| Tanzania | -0.989 | -0.914 | 1.438 | -2.44 | -0.19 |
| Uganda | -1.243 | -1.186 | 0.935 | -2.751 | -0.59 |
| Zambia | -0.615 | -0.582 | 1.56 | -1.546 | 0.107 |
| Zimbabwe | -0.833 | -0.619 | 0.159 | -0.831 | -0.35 |
Note: Scores are created by converting categorical data (country) to numerical data to build a number (score; between - 4 and + 4).
Table A9.
Commonwealth SD pillars relationships with H&LS score.
| Countries | People | Prosperity | Planet | Resources | Peace |
|---|---|---|---|---|---|
| Armenia | 0.833 | -0.607 | 0.223 | 0.626 | 0.185 |
| Azerbaijan | 1.826 | -0.309 | 0.024 | 0.35 | 0.337 |
| Georgia | 0.694 | -0.29 | 0.641 | 0.432 | 0.192 |
| Kazakhstan | 0.631 | -0.266 | -2.608 | 0.549 | -0.019 |
| Kyrgyz Republic | -0.048 | -0.868 | -0.601 | -0.072 | -0.475 |
| Moldova | 1.312 | -0.281 | -0.536 | 0.079 | -0.91 |
| Russian Federation | 0.645 | 0.373 | -1.182 | 0.632 | -0.675 |
| Tajikistan | 0.063 | -1.495 | 0.321 | -0.749 | -0.14 |
| Ukraine | 0.559 | -0.151 | -1.536 | 0.625 | -0.495 |
Note: Scores are created by converting categorical data (country) to numerical data to build a number (score; between - 4 and + 4).
Table A10.
Top and bottom 25 countries according to H&LS data (Helliwell, Huang, & Wang, 2019), Top and bottom 25 countries according to the average of five SD pillars.
Table A10.
Top and bottom 25 countries according to H&LS data (Helliwell, Huang, & Wang, 2019), Top and bottom 25 countries according to the average of five SD pillars.
| Top 25 Countries’ H&LS |
Top 25 Countries’ Pillars Avg |
Bottom 25 Countries H&LS |
Bottom 25 Countries Pillars Avg |
|---|---|---|---|
| Georgia | Cyprus | Ecuador | Chad |
| France | Finland | Saudi Arabia | El Salvador |
| Ukraine | Singapore | Benin | Honduras |
| Hungary | Germany | Belgium | Ethiopia |
| Azerbaijan | Korea, Rep. | Tunisia | Uganda |
| Brazil | Malta | Czech Republic | India |
| Australia | Slovenia | Venezuela | Lesotho |
| Egypt | Japan | Paraguay | Tunisia |
| Nicaragua | Canada | Bolivia | Mozambique |
| Netherlands | Luxembourg | Slovenia | Nigeria |
| Algeria | Lithuania | Luxembourg | Madagascar |
| Malta | United Kingdom | Bahrain | Burkina Faso |
| Croatia | Czech Republic | Dominican Republic | Guatemala |
| United Kingdom | Slovak Republic | Indonesia | Venezuela |
| Qatar | Estonia | Jamaica | Mali |
| Tanzania | United States | Mozambique | Burundi |
| Cameroon | Switzerland | Timor-Leste | South Africa |
| Sweden | New Zealand | Bosnia and Herzegovina | Côte d’Ivoire |
| Switzerland | Ireland | Burkina Faso | Iran, Islamic Rep. |
| Malawi | Denmark | Italy | Trinidad and Tobago |
| Uganda | Israel | Zimbabwe | Tanzania |
| Guatemala | Norway | China | United Arab Emirates |
| Philippines | Sweden | Colombia | Cameroon |
| Sri Lanka | Greece | Mexico | Bhutan |
| Tajikistan | Iceland | Germany | Kuwait |
Figure A1.
[4].
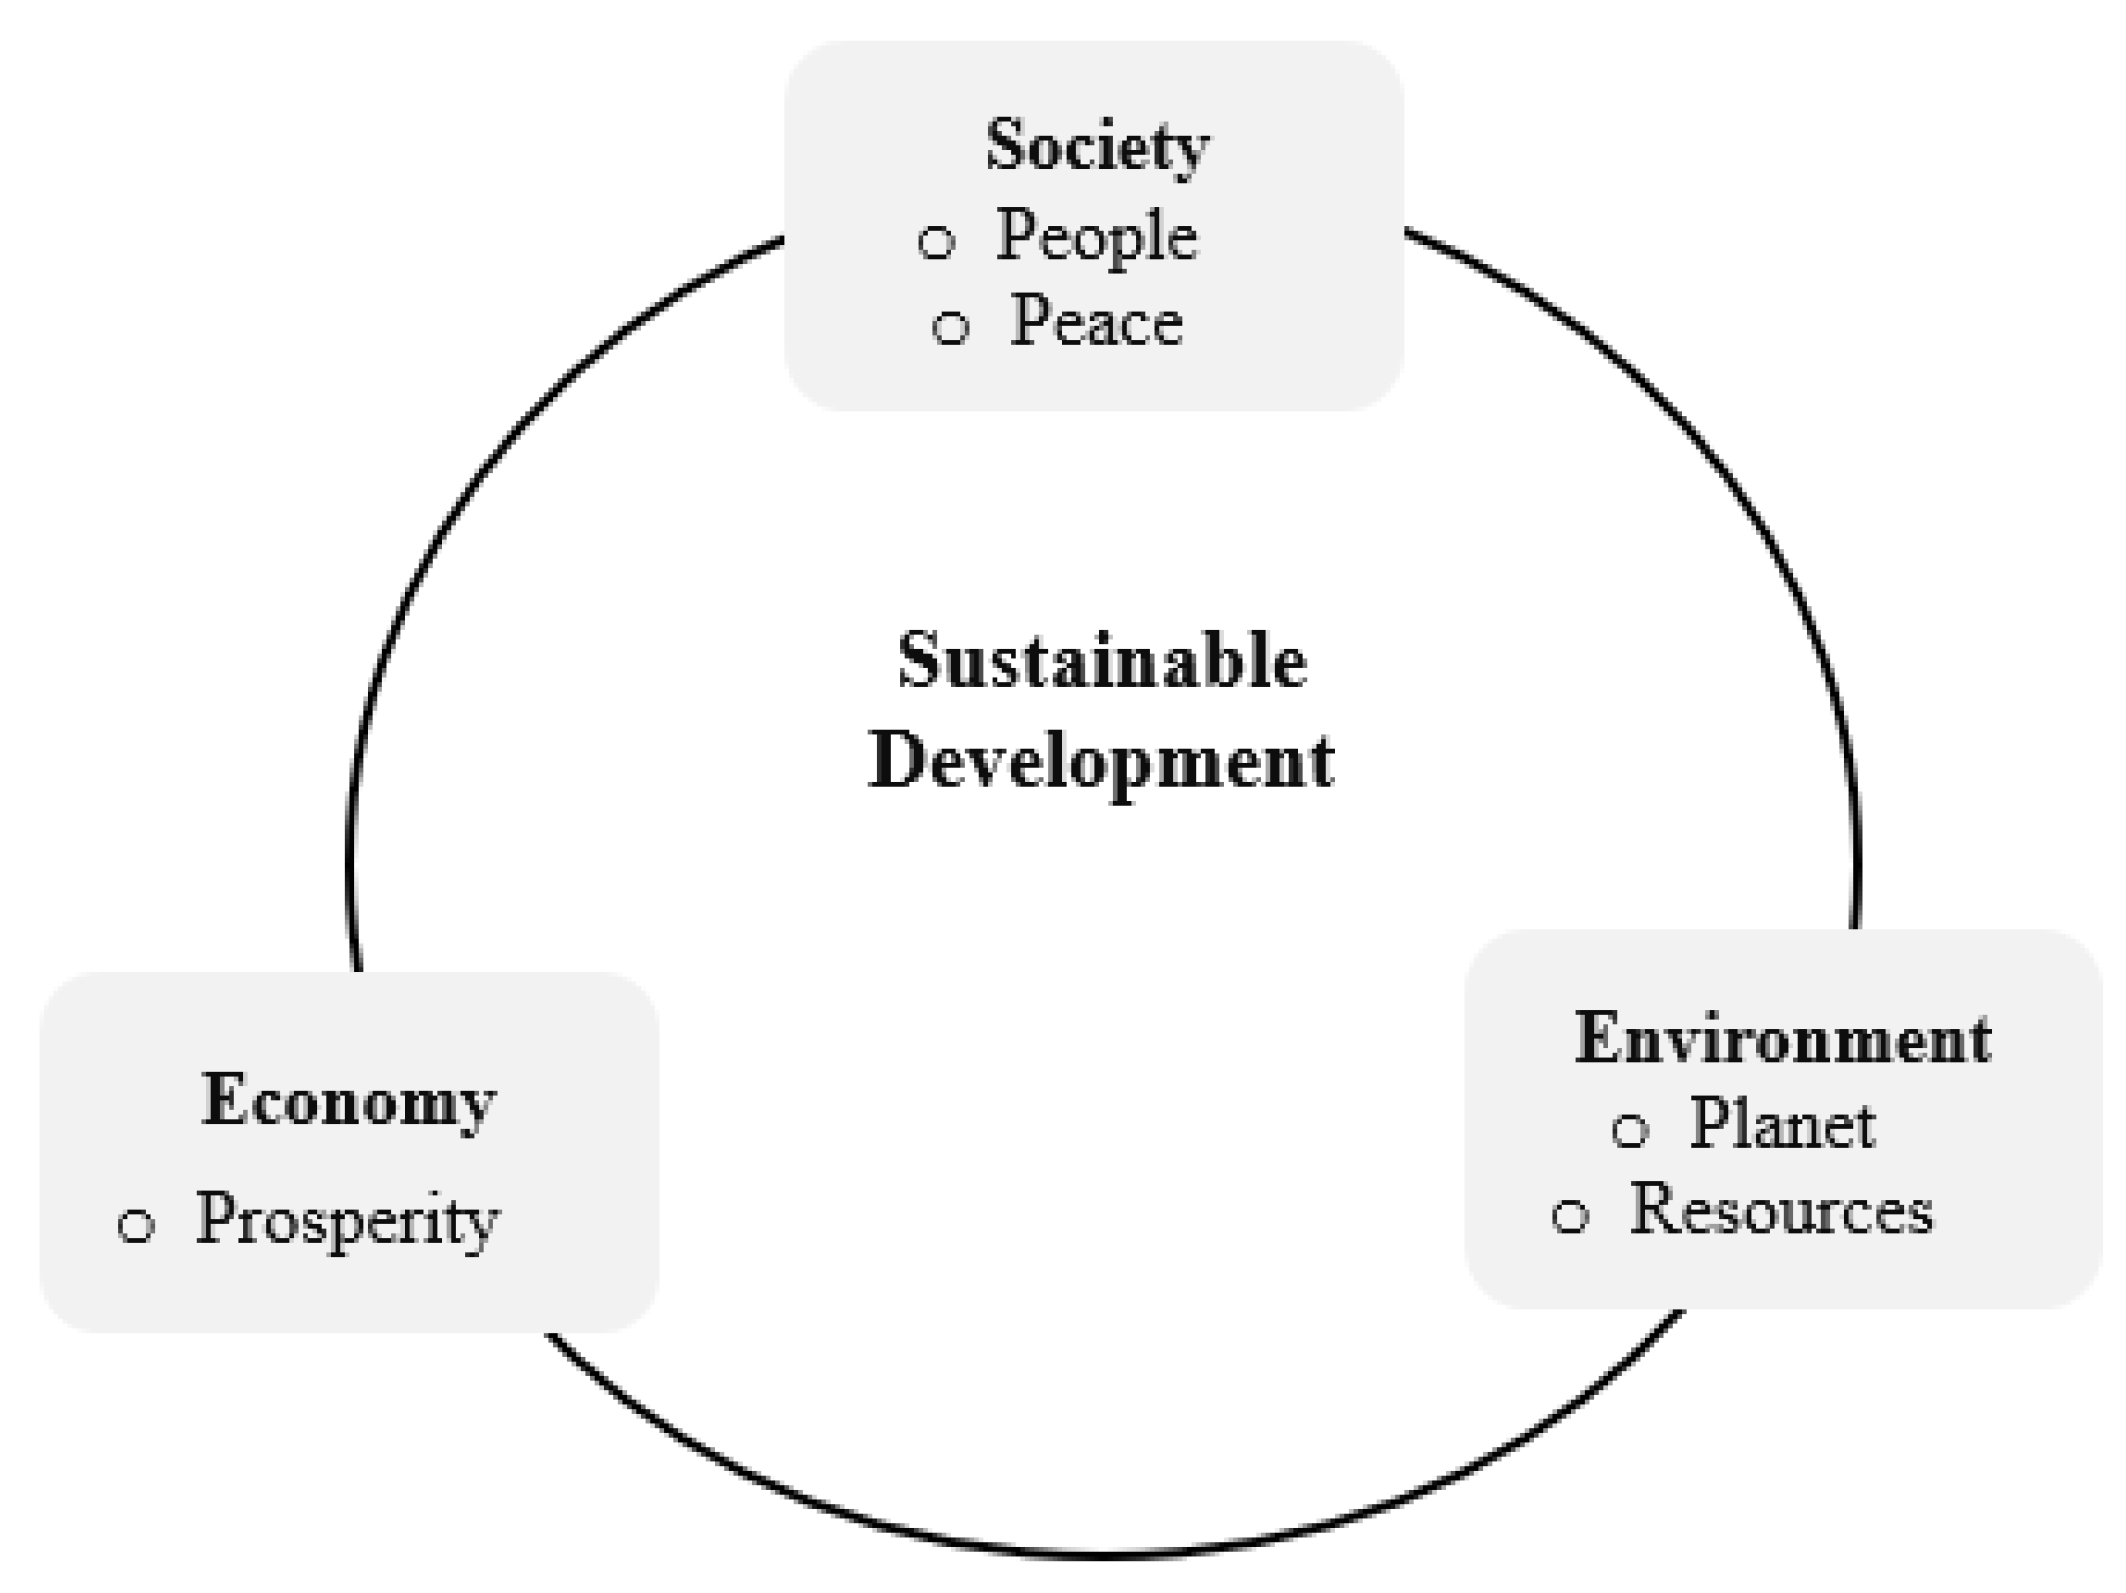
References
- Perry, K.K. Innovation, institutions and development: a critical review and grounded heterodox economic analysis of late-industrialising contexts. Camb. J. Econ. 2020, 44, 391–415, . [CrossRef]
- Stiglitz, J. E. (2002). Competition and competitiveness in a new economy. Competition and Competitiveness in A New Economy, 11-26.
- Zizek, S. (2006). The Parallax View. Cambridge, Massachusetts: The MIT Press.
- van Vuuren, D.P.; Zimm, C.; Busch, S.; Kriegler, E.; Leininger, J.; Messner, D.; Nakicenovic, N.; Rockstrom, J.; Riahi, K.; Sperling, F.; et al. Defining a sustainable development target space for 2030 and 2050. One Earth 2022, 5, 142–156, . [CrossRef]
- Pianta, S.; Brutschin, E. Emissions Lock-in, Capacity, and Public Opinion: How Insights From Political Science Can Inform Climate Modeling Efforts. Politi- Gov. 2022, 10, 186–199, . [CrossRef]
- Rosile, G.A.; Boje, D.M.; Carlon, D.M.; Downs, A.; Saylors, R. Storytelling Diamond. Organ. Res. Methods 2013, 16, 557–580, . [CrossRef]
- Gore, C. The Rise and Fall of the Washington Consensus as a Paradigm for Developing Countries. World Dev. 2000, 28, 789–804, . [CrossRef]
- Rodrik, D. (2018). What do trade agreements really do? Journal of Economic Perspectives, Vol. 32 (2), Spring 2018, Pages 73–90.
- Arrighi, G., & Zhang, L. (2011). Beyond the Washington consensus: a new Bandung? Globalization and beyond: New Examinations of Global Power and Its Alternatives, 25-57.
- Ravetz, J.R. Post-Normal Science and the complexity of transitions towards sustainability. Ecol. Complex. 2006, 3, 275–284, . [CrossRef]
- Peneder, M. Competitiveness and industrial policy: from rationalities of failure towards the ability to evolve. Camb. J. Econ. 2017, 41, 829–858, . [CrossRef]
- Khan, Z.; Abraham, E.; Aggarwal, S.; Khan, M.A.; Arguello, R.; Babbar-Sebens, M.; Bereslawski, J.L.; Bielicki, J.M.; Campana, P.E.; Carrazzone, M.E.S.; et al. Emerging Themes and Future Directions of Multi-Sector Nexus Research and Implementation. Front. Environ. Sci. 2022, 10, 1–11. [CrossRef]
- Hoffmann, R.; Wiederkehr, C.; Dimitrova, A.; Hermans, K. Agricultural livelihoods, adaptation, and environmental migration in sub-Saharan drylands: a meta-analytical review. Environ. Res. Lett. 2022, 17, 083003, . [CrossRef]
- Brutschin, E.; Andrijevic, M. Why Ambitious and Just Climate Mitigation Needs Political Science. Politi- Gov. 2022, 10, 167–170, . [CrossRef]
- Koehler, G., Kühner, S., & Neff, D. (2021). Social policy development and its obstacles: an analysis of the South Asian welfare geography during and after the social turn. In Handbook of Development Policy. Edward Elgar Publishing.
- West, W., Jamila Haider,L., Stålhammar, S., & Woroniecki, S. (2020) A relational turn for sustainability science? Relational thinking, leverage points and transformations, Ecosystems and People, 16:1, 304-325.
- Ellis, B.J.; Figueredo, A.J.; Brumbach, B.H.; Schlomer, G.L. Fundamental Dimensions of Environmental Risk. Hum. Nat. 2009, 20, 204–268, . [CrossRef]
- Latour, B. (1992). One more turn after the social turn: Easing science studies into the non-modern world. The Social Dimensions of Science, 292, 272-94.
- Kuhn, T. S. (1996). The Structure of Scientific Revolutions (3rd ed.). University of Chicago Press.
- Sato, R. The Harrod-Domar Model vs the Neo-Classical Growth Model. Econ. J. 1964, 74, 380, . [CrossRef]
- Solow, R.M. Perspectives on Growth Theory. J. Econ. Perspect. 1994, 8, 45–54, . [CrossRef]
- Kanbur, R. (2009) "The Co-Evolution of the Washington Consensus and the Economic Development Discourse," Macalester International: Vol. 24, Article 8. http://digitalcommons.macalester.edu/macintl/vol24/iss1/8.
- Acemoglu, D., Gallego, F. A., & Robinson, J. A. (2014). Institutions, human capital, and development. Annu. Rev. Econ., 6(1), 875-912.
- Street, J.H. The Institutionalist Theory of Economic Development. J. Econ. Issues 1987, 21, 1861–1887, . [CrossRef]
- Munir, K.A. Challenging Institutional Theory’s Critical Credentials. Organ. Theory 2020, 1, . [CrossRef]
- Lebaron, F. (2003). Pierre Bourdieu: economic models against economicism. Theory and Society, 32(5/6): 551-565.
- Syll, L. (2018). The main reason why almost all econometric models are wrong. World Economics Association Commentaries, 8(3). June 2018. https://www.worldeconomicsassociation.org/newsletterarticles/econometric-models-wrong/ (accessed in June 2022).
- Mardani, A.; Kannan, D.; Hooker, R.E.; Ozkul, S.; Alrasheedi, M.; Tirkolaee, E.B. Evaluation of green and sustainable supply chain management using structural equation modelling: A systematic review of the state of the art literature and recommendations for future research. J. Clean. Prod. 2020, 249, 119383, . [CrossRef]
- Mardani, A.; Zavadskas, E.K.; Streimikiene, D.; Jusoh, A.; Khoshnoudi, M. A comprehensive review of data envelopment analysis (DEA) approach in energy efficiency. Renew. Sustain. Energy Rev. 2017, 70, 1298–1322, . [CrossRef]
- Ramos, G. & Hynes, W. (2019). Beyond growth: Towards a new economic approach. OECD, General Secretariat. https://www.oecd.org/naec/averting-systemic-collapse/SG-NAEC(2019)3_Beyond%20Growth.pdf (accessed in September 2022).
- Ghag, N.; Acharya, P.; Khanapuri, V. Prioritizing the Challenges Faced in Achieving International Competitiveness by Export-Oriented Indian SMEs: a DEMATEL Approach. Int. J. Glob. Bus. Competitiveness 2022, 17, 12–24, . [CrossRef]
- Kowal, J.; Paliwoda-Pękosz, G. ICT for Global Competitiveness and Economic Growth in Emerging Economies: Economic, Cultural, and Social Innovations for Human Capital in Transition Economies. Inf. Syst. Manag. 2017, 34, 304–307, . [CrossRef]
- Wojewódzka-Wiewiórska, A.; Kłoczko-Gajewska, A.; Sulewski, P. Between the Social and Economic Dimensions of Sustainability in Rural Areas—In Search of Farmers’ Quality of Life. Sustainability 2019, 12, 148, . [CrossRef]
- Pawłowski, A. (2008). How many dimensions does sustainable development have? Sustainable Development, 16(2), 81-90.
- Alam, M. S., & Kabir, N. (2013). Economic growth and environmental sustainability: empirical evidence from East and South-East Asia. International Journal of Economics and Finance, 5(2).
- Cebula, R. J. (2013). Which economic freedoms influence per capita real income? Applied Economics Letters, 20(4), 368-372.
- Ekins, P. (2002). Economic growth and environmental sustainability: the prospects for green growth. Routledge.
- Chai, J.; Hao, Y.; Wu, H.; Yang, Y. Do constraints created by economic growth targets benefit sustainable development? Evidence from China. Bus. Strat. Environ. 2021, 30, 4188–4205, . [CrossRef]
- Sachs, J.D.; Schmidt-Traub, G.; Mazzucato, M.; Messner, D.; Nakicenovic, N.; Rockström, J. Six Transformations to achieve the Sustainable Development Goals. Nat. Sustain. 2019, 2, 805–814, . [CrossRef]
- Albright, A.; Bundy, D.A.P. The Global Partnership for Education: forging a stronger partnership between health and education sectors to achieve the Sustainable Development Goals. Lancet Child Adolesc. Heal. 2018, 2, 473–474, . [CrossRef]
- Adebiyi M.A. & O. Oladele. (2005). Public Education Expenditure and Defense Spending in Nigeria: An Empirical Investigation. http//www.saga. cornell. educ /saga/educconf/adebiyi.pdf (accessed February 10, 2010).
- Bende-Nabende, A. (2017). Globalisation, FDI, regional integration and sustainable development: theory, evidence, and policy. Routledge.
- Bečić, E.; Mulej, E.M.; Švarc, J. Measuring Social Progress by Sustainable Development Indicators: Cases of Croatia and Slovenia. Procedia - Soc. Behav. Sci. 2012, 37, 458–465, . [CrossRef]
- de Angelis, E.M.; Di Giacomo, M.; Vannoni, D. Climate Change and Economic Growth: The Role of Environmental Policy Stringency. Sustainability 2019, 11, 2273, . [CrossRef]
- Gupta, J. Global Sustainable Development Governance: Institutional Challenges from a Theoretical Perspective. Int. Environ. Agreements: Politi- Law Econ. 2002, 2, 361–388, . [CrossRef]
- Declaration, M. (2000, May). Malmö Ministerial Declaration, adopted by the Global Ministerial Environment Forum—Sixth Special Session of the Governing Council of the United Nations Environment Programme. In Fifth Plenary Meeting (Vol. 31).
- Frey, B.S.; Luechinger, S.; Stutzer, A. The Life Satisfaction Approach to Environmental Valuation. Annu. Rev. Resour. Econ. 2010, 2, 139–160, . [CrossRef]
- Esteban Ortiz-Ospina and Max Roser (2013) - "Happiness and Life Satisfaction". Published online at Our World in Data.org. https://ourworldindata.org/happiness-and-life-satisfaction (accessed in August 2022).
- Duffy, B. (2018). The perils of perception: Why we’re wrong about nearly everything. Atlantic Books.
- Petrunyk, I.; Pfeifer, C. Life Satisfaction in Germany After Reunification: Additional Insights on the Pattern of Convergence. 2016, 236, 217–239, . [CrossRef]
- Stevenson, B., & Wolfers, J. (2008). Happiness inequality in the United States. The Journal of Legal Studies, 37(S2), S33-S79.
- Diener, E., & Diener, M. (2009). Cross-cultural correlates of life satisfaction and self-esteem. In Culture and Well-Being (pp. 71-91). Springer, Dordrecht.
- Clark, A.E.; Flèche, S.; Senik, C. Economic Growth Evens Out Happiness: Evidence from Six Surveys. Rev. Income Wealth 2015, 62, 405–419, . [CrossRef]
- Fosfuri, A.; Motta, M.; Rønde, T. Foreign direct investment and spillovers through workers’ mobility. J. Int. Econ. 2001, 53, 205–222, . [CrossRef]
- Khan, S., & Mehboob, F. (2014). Impact of FDI on GDP: An analysis of global economy on production function.
- Fernandez, M.; Alnuaimi, A.A.A.A.; Joseph, R. FDI Environment in China: A Critical Analysis. Int. J. Financial Res. 2020, 11, 238, . [CrossRef]
- Anh, N. T. N., & Huong, M. N. L. (2019). Impacts of Foreign Direct Investment on Vietnam’s Economy in a Relation to Natural Environment. Socio-Economic And Environmental Issues in Development, 977.
- Kumar, N. (1998). Globalization, Foreign Direct Investment and Technology Transfers. Taylor & Francis.
- Cooper, R.N.; Moran, T.H. Foreign Direct Investment and Development: The New Policy Agenda for Developing Countries and Economies in Transition. Foreign Aff. 1999, 78, 166, . [CrossRef]
- Glass, A.J.; Saggi, K. Multinational Firms and Technology Transfer. Scand. J. Econ. 2002, 104, 495–513, . [CrossRef]
- Balasubramanyam, V. N., Salisu, M., & Sapsford, D. (1996). Foreign direct investment and growth in E.P. and I.S. countries. The Economic Journal, 106(434), 92-105.
- Borensztein, E., De Gregorio, J., & Lee, J. W. (1998). How does foreign direct investment affect economic growth? Journal of International Economics, 45(1), 115-135.
- Alguacil, M.; Cuadros, A.; Orts, V. Foreign direct investment, exports and domestic performance in Mexico: a causality analysis. Econ. Lett. 2002, 77, 371–376, . [CrossRef]
- Liu, X., Burridge, P., & Sinclair, P. J. (2002). Relationships between economic growth, foreign direct investment, and trade: evidence from China. Applied Economics, 34(11), 1433-1440.
- Delevic, U., & Heim, I. (2017). Institutions in transition: is the E.U. integration process relevant for inward FDI in transition European economies? Eurasian Journal of Economics and Finance, 5(1), 16-32.
- Kok, R.; Ersoy, B.A. Analyses of FDI determinants in developing countries. Int. J. Soc. Econ. 2009, 36, 105–123, . [CrossRef]
- Akkemik, K. A. (2008). Industrial Development in East Asia: A Comparative Look at Japan, Korea, Taiwan, And Singapore (With Cd-rom). World Scientific, (Vol. 3).
- Görg, H., & Greenaway, D. (2004). Much ado about nothing? Do domestic firms really benefit from foreign direct investment? The World Bank Research Observer, 19(2), 171-197.
- Wooster, R.B.; Diebel, D.S. Productivity Spillovers from Foreign Direct Investment in Developing Countries: A Meta-Regression Analysis. Rev. Dev. Econ. 2010, 14, 640–655, . [CrossRef]
- Bwalya, S.M. Foreign direct investment and technology spillovers: Evidence from panel data analysis of manufacturing firms in Zambia. J. Dev. Econ. 2006, 81, 514–526, . [CrossRef]
- Gorg, H., & Strobl, E. (2001). Multinational companies and productivity spillovers: A meta-analysis. The Economic Journal, 111(475), F723-F739.
- Javorcik, B. S., & Spatareanu, M. (2008). To share or not to share: Does local participation matter for spillovers from foreign direct investment? Journal of Development Economics, 85(1-2), 194-217.
- Kugler, M. (2006). Spillovers from foreign direct investment: within or between industries? Journal of Development Economics, 80(2), 444-477.
- Sjöholm, F. Productivity Growth in Indonesia: The Role of Regional Characteristics and Direct Foreign Investment. Econ. Dev. Cult. Chang. 1999, 47, 559–584, . [CrossRef]
- Smeets, R. Collecting the Pieces of the FDI Knowledge Spillovers Puzzle. World Bank Res. Obs. 2008, 23, 107–138, . [CrossRef]
- Xu, X.; Sheng, Y. Productivity Spillovers from Foreign Direct Investment: Firm-Level Evidence from China. World Dev. 2012, 40, 62–74, . [CrossRef]
- Dunning, J. H. (1977). Trade, location of economic activity and the MNE: A search for an eclectic approach. In The International Allocation of Economic Activity (pp. 395-418). Palgrave Macmillan, London.
- Dunning, J.H. Globalization and the new geography of foreign direct investment. Oxf. Dev. Stud. 1998, 26, 47–69, . [CrossRef]
- Pradhan, J.P. The evolution of Indian Outward Foreign Direct Investment: changing trends and patterns. Int. J. Technol. Glob. 2008, 4, 70, . [CrossRef]
- Sauvant, K.P. China: Inward and Outward Foreign Direct Investment. Transnatl. Corp. Rev. 2011, 3, 1–4, . [CrossRef]
- Sauvant, K. P., Mallampally, P., McAllister, G., Xian, G., Bellak, C., Mayer, S., ... & Garcia, D. (2013). Inward and outward FDI country profiles.
- Buckley, P. J., & Casson, M. (1976). A long-run theory of multinational enterprise. In The Future of the Multinational Enterprise (pp. 32-65). Palgrave Macmillan, London.
- Irandoust, J. E. M. (2001). On the causality between foreign direct investment and output: a comparative study. The International Trade Journal, 15(1), 1-26.
- de Vita, G.; Kyaw, K.S. Growth effects of FDI and portfolio investment flows to developing countries: a disaggregated analysis by income levels. Appl. Econ. Lett. 2009, 16, 277–283, . [CrossRef]
- Lensink, R., & Morrissey, O. (2006). Foreign direct investment: Flows, volatility, and the impact on growth. Review of International Economics, 14(3), 478-493.
- Al-Sadiq, M. A. J. (2013). Outward foreign direct investment and domestic investment: The case of developing countries. International Monetary Fund.
- Carkovic, M., & Levine, R. (2005). Does foreign direct investment accelerate economic growth. Does foreign direct investment promote development, 195, 220.
- Blomström, M., Kokko, A., & Mucchielli, J. L. (2003). The economics of foreign direct investment incentives. In Foreign Direct Investment in The Real and Financial Sector of Industrial Countries (pp. 37-60). Springer, Berlin, Heidelberg.
- Wei, S. J. (1995). The open-door policy and China’s rapid growth: Evidence from city-level data. In Growth theories in light of the East Asian experience, 4, 73-104.
- Dees, S. Foreign Direct Investment in China: Determinants and Effects. Econ. Chang. Restruct. 1998, 31, 175–194, . [CrossRef]
- Wells, L.T. (1983) Third World Multinationals: The Rise of Foreign Investments from Developing Countries, Cambridge MA: MIT Press.
- Buckley, P.J.; Clegg, J.; Wang, C. The Impact of Inward FDI on the Performance of Chinese Manufacturing Firms. J. Int. Bus. Stud. 2002, 33, 637–655, . [CrossRef]
- Javorcik, B.S. Does Foreign Direct Investment Increase the Productivity of Domestic Firms? In Search of Spillovers Through Backward Linkages. Am. Econ. Rev. 2004, 94, 605–627, . [CrossRef]
- Dasgupta, N. Examining the Long Run Effects of Export, Import and FDI Inflows on the FDI Outflows from India: A Causality Analysis. 2009, 10, 65–88, . [CrossRef]
- Gorynia, M., Nowak, J., & Wolniak, R. (2008). Poland’s investment development path and industry structure of FDI inflows and outflows. Journal of East-West Business, 14(2), 189-212.
- Alfaro, L.; Chanda, A.; Kalemli-Ozcan, S.; Sayek, S. Does foreign direct investment promote growth? Exploring the role of financial markets on linkages. J. Dev. Econ. 2010, 91, 242–256, . [CrossRef]
- Vasa, L.; Angeloska, A. Foreign direct investment in the Republic of Serbia: Correlation between foreign direct investments and the selected economic variables. J. Int. Stud. 2020, 13, 170–183, . [CrossRef]
- Markusen, J.R.; Venables, A.J. Foreign direct investment as a catalyst for industrial development. Eur. Econ. Rev. 1999, 43, 335–356, . [CrossRef]
- Lin, P., Liu, Z., & Zhang, Y. (2009). Do Chinese domestic firms benefit from FDI inflow? Evidence of horizontal and vertical spillovers. China Economic Review, 20(4), 677-691.
- Marcin, K. How does FDI inflow affect productivity of domestic firms? The role of horizontal and vertical spillovers, absorptive capacity and competition. J. Int. Trade Econ. Dev. 2008, 17, 155–173, . [CrossRef]
- Rodriguez-Clare, A. (1996). Multinationals, linkages, and economic development. The American Economic Review, 852-873.
- World Bank database (2019). https://databank.worldbank.org/source/sustainable-development-goals-(sdgs) (accessed on January 2021).
- Selim, S. Life Satisfaction and Happiness in Turkey. Soc. Indic. Res. 2008, 88, 531–562, . [CrossRef]
- Helliwell, J. F., Huang, H., & Wang, S. (2019). Changing world happiness. World Happiness Report, 2019, 11-46.
- The Heritage Foundation. (2021a). Business Freedom. Business Freedom Index: Regulations on Starting & Operating a Business, 2021, https://www.heritage.org/index/business-freedom (accessed in February 2021).
- The Heritage Foundation. (2021b). The 12 economic freedoms: Policies for lasting progress and prosperity. Business Freedom Index: Regulations on Starting & Operating a Business.
- World Economic Forum. (2018). Introduction. Global Competitiveness Index 2017-2018, http://reports.weforum.org/global-competitiveness-index-2017-2018/introduction/ accessed February 2022).
- Dima, A.M.; Begu, L.; Vasilescu, M.D.; Maassen, M.A. The Relationship between the Knowledge Economy and Global Competitiveness in the European Union. Sustainability 2018, 10, 1706, . [CrossRef]
- Bowen, H.P.; Moesen, W. Composite competitiveness indicators with endogenous versus predetermined weights. Competitiveness Rev. Int. Bus. J. 2011, 21, 129–151, . [CrossRef]
- Bucher, S. The Global Competitiveness Index As an Indicator of Sustainable Development. Her. Russ. Acad. Sci. 2018, 88, 44–57, . [CrossRef]
- Stiglitz, J. E., Sen, A., & Fitoussi, J. P. (2010). Mismeasuring our lives: Why GDP doesn’t add up. The New Press.
- World Economic Forum. (2019) Global Competitiveness Report 2019: How to End a Lost Decade of Productivity Growth?
- World Bank Group. (2019). Bhutan Development Report, January 2019: A Path to Inclusive and Sustainable Development. World Bank.
- McLeod, S. (2020). What does a box plot tell you? Simply psychology. Retrieved from https://www.simplypsychology.org/boxplots.html on November 2022.
- Kock, N. (2017). Common method bias: a full collinearity assessment method for PLS-SEM. In Partial least squares path modeling (pp. 245-257). Springer, Cham.
- Kock, N. (2015). Common method bias in PLS-SEM: A full collinearity assessment approach. International Journal of e-Collaboration (IJEC), 11(4), 1-10.
- Tenenhaus, M., Amato, S., & Esposito Vinzi, V. (2004, June). A global goodness-of-fit index for PLS structural equation modelling. In Proceedings of the XLII SIS scientific meeting (Vol. 1, No. 2, pp. 739-742).
- Hayes, T. R-squared change in structural equation models with latent variables and missing data. Behav. Res. Methods 2021, 53, 2127–2157, . [CrossRef]
- Glass, L.-M.; Newig, J. Governance for achieving the Sustainable Development Goals: How important are participation, policy coherence, reflexivity, adaptation and democratic institutions?. Earth Syst. Gov. 2019, 2, 100031, . [CrossRef]
- Olawumi, T.O.; Chan, D.W. A scientometric review of global research on sustainability and sustainable development. J. Clean. Prod. 2018, 183, 231–250, . [CrossRef]
- Kinda, S. (2011). Democratic institutions and environmental quality: effects and transmission channels. Available at SSRN 2714300.
- Kulin, J.; Sevä, I.J. The Role of Government in Protecting the Environment: Quality of Government and the Translation of Normative Views about Government Responsibility into Spending Preferences. Int. J. Sociol. 2019, 49, 110–129, . [CrossRef]
- Stringham, E. P., & Levendis, J. (2010). The relationship between economic freedom and homicide. Economic Freedom of the World: 2010 Annual Report, 203-217.
- Hockett, R. (2014). The Macroprudential Turn: From Institutional Safety and Soundness to Systematic Financial Stability in Financial Supervision. Va. L. & Bus. Rev., 9, 201.
- Ferrara, A.R.; Nisticò, R. Does Institutional Quality Matter for Multidimensional Well-Being Inequalities? Insights from Italy. Soc. Indic. Res. 2019, 145, 1063–1105, . [CrossRef]
- Tiwari, A.K.; Mutascu, M. The relationship between environmental degradation and happiness in 23 developed contemporary economies. Manag. Environ. Qual. Int. J. 2015, 26, 301–321, . [CrossRef]
- Collins, M., Knutti, R., Arblaster, J., Dufresne, J. L., Fichefet, T., Friedlingstein, P., ... & Booth, B. B. (2013). Long-term climate change: projections, commitments, and irreversibility. In Climate change 2013-The physical science basis: Contribution of working group I to the fifth assessment report of the intergovernmental panel on climate change (pp. 1029-1136). Cambridge University Press.
- Williams, J. (2017). Addressing the Completion Challenge in Portuguese Higher Education. M-RCBG Associate Working Paper Series, 8.
- Dawson, R. F., Kearney, M. S., & Sullivan, J. X. (2020). Comprehensive approaches to increasing student completion in higher education: A survey of the landscape (No. w28046). National Bureau of Economic Research.
- Arvin, B. M., Barillas, F., & Lew, B. (2002). Is democracy a component of donors’ foreign aid policies. New Perspectives on Foreign Aid and Economic Development, 171-198.
- Branden, J.B. and Bromley, D. (1981), ‘The economics of cooperation over collective bads’, Journal of Environmental Economics and Management, Vol. 8, No. 2, pp.134–150.
- Khan, S.A.R.; Sharif, A.; Golpîra, H.; Kumar, A. A green ideology in Asian emerging economies: From environmental policy and sustainable development. Sustain. Dev. 2019, 27, 1063–1075, . [CrossRef]
- Islam, R. (2017). The Role of Macro-Economic Variables for Determining Happiness: The Empirical Evidence from South Asian Region.
- Childs, A.; Tenzin, W.; Johnson, D.; Ramachandran, K. Science Education in Bhutan: Issues and challenges. Int. J. Sci. Educ. 2012, 34, 375–400, . [CrossRef]
- Adhikari, C.; Yadav, R.K.; Timilshina, P.; Ojha, R.; Gaire, D.; Ghimire, A. Proportion and factors affecting for post-natal care utilization in developing countries: A systematic review. J. Manmohan Mem. Inst. Heal. Sci. 2016, 2, 14–19, . [CrossRef]
- Tobgay, T.; Dophu, U.; Torres, C.; Bangchang, N. Health and Gross National Happiness: review of current status in Bhutan. J. Multidiscip. Heal. 2011, 4, 293–298, . [CrossRef]
- Weiffen, B. The Cultural-Economic Syndrome: Impediments to Democracy in the Middle East. Comp. Sociol. 2004, 3, 353–375, . [CrossRef]
- Ramzi, S.; Afonso, A.; Ayadi, M. Assessment of efficiency in basic and secondary education in Tunisia: A regional analysis. Int. J. Educ. Dev. 2016, 51, 62–76, . [CrossRef]
- Gaaloul, N. Water resources and management in Tunisia. Int. J. Water 2011, 6, 92, . [CrossRef]
- Graham, C., & Felton, A. (2009). Does inequality matter to individual welfare? An initial exploration based on happiness surveys from Latin America. In Happiness, Economics and Politics. Edward Elgar Publishing.
- Wolff, L., Schiefelbein, E., & Schiefelbein, P. (2002). ͞Primary education in Latin America. The unfinished agenda. Technical Paper Series Nº EDU-120. Washington, DC: Interamerican Development Bank.
- Psacharopoulos, G.; Ng, Y.C. Earnings and Education in Latin America. Educ. Econ. 1994, 2, 187–207, . [CrossRef]
- A Montenegro, R.; Stephens, C. Indigenous health in Latin America and the Caribbean. Lancet 2006, 367, 1859–1869, . [CrossRef]
- Mascayano, F.; Irrazabal, M.; Emilia, W.D.; Vaner, S.J.; Sapag, J.C.; Alvarado, R.; Yang, L.H.; Sinah, B. Suicide in Latin America: a growing public health issue.. 2015, 72, 295–303.
- Briceño-León, R. Urban violence and public health in Latin America: a sociological explanatory framework. 2005, 21, 1629–1648, . [CrossRef]
- Shelley, T. (2005). Oil: Politics, poverty, and the planet. Zed Books.
- Kravdal, . Education and fertility in sub-Saharan africa: Individual and community effects. Demography 2002, 39, 233–250, . [CrossRef]
- Deaton, A. Income, Health, and Well-Being around the World: Evidence from the Gallup World Poll. J. Econ. Perspect. 2008, 22, 53–72, . [CrossRef]
- Amavilah, V.; Asongu, S.A.; Andrés, A.R. Effects of globalization on peace and stability: Implications for governance and the knowledge economy of African countries. Technol. Forecast. Soc. Chang. 2017, 122, 91–103, . [CrossRef]
- Millennium ecosystem assessment, M. E. A. (2005). Ecosystems and Human Well-Being (Vol. 5, pp. 563-563). Washington, DC: Island press.
- Matlosa, K. Pondering the culture of violence in Lesotho: a case for demilitarisation. J. Contemp. Afr. Stud. 2020, 38, 381–398, . [CrossRef]
- Mwangi, O. Hydropolitics, Ecocide and Human Security in Lesotho: A Case Study of the Lesotho Highlands Water Project *. J. South. Afr. Stud. 2007, 33, 3–17, . [CrossRef]
- De Villiers, G. D. T. (1996). South Africa’s water resources and the Lesotho highlands water scheme: a partial solution to the country’s water problems. International Journal of Water Resources Development, 12(1), 65-78.
- Letcher, T. M. (2021). Global warmingda complex situation. Climate Change: Observed Impacts on Planet Earth, 2.
- Aumeerally, N., Chen-Carrel, A., & Coleman, P. T. (2022). Learning with Peaceful, Heterogeneous Communities: Lessons on Sustaining Peace in Mauritius. Peace and Conflict Studies, 28(2), 3.
- Baker, M. (2013). Poverty, Social Assistance, and the Employability of Mothers in Four Commonwealth Countries. In Women’s Work is Never Done (pp. 87-112). Routledge.
- M’Cormack-Hale, F. A., & M’Cormack-Hale, F. A. O. (2012). Gender, peace, and security: women’s advocacy and conflict resolution. Commonwealth Secretariat.
- Lu, W.; Kasimov, I.; Karimov, I.; Abdullaev, Y. Foreign Direct Investment, Natural Resources, Economic Freedom, and Sea-Access: Evidence from the Commonwealth of Independent States. Sustainability 2020, 12, 3135, . [CrossRef]
Figure 20.
Global level - Country Outliers SD Pillars - H&LS relationship.
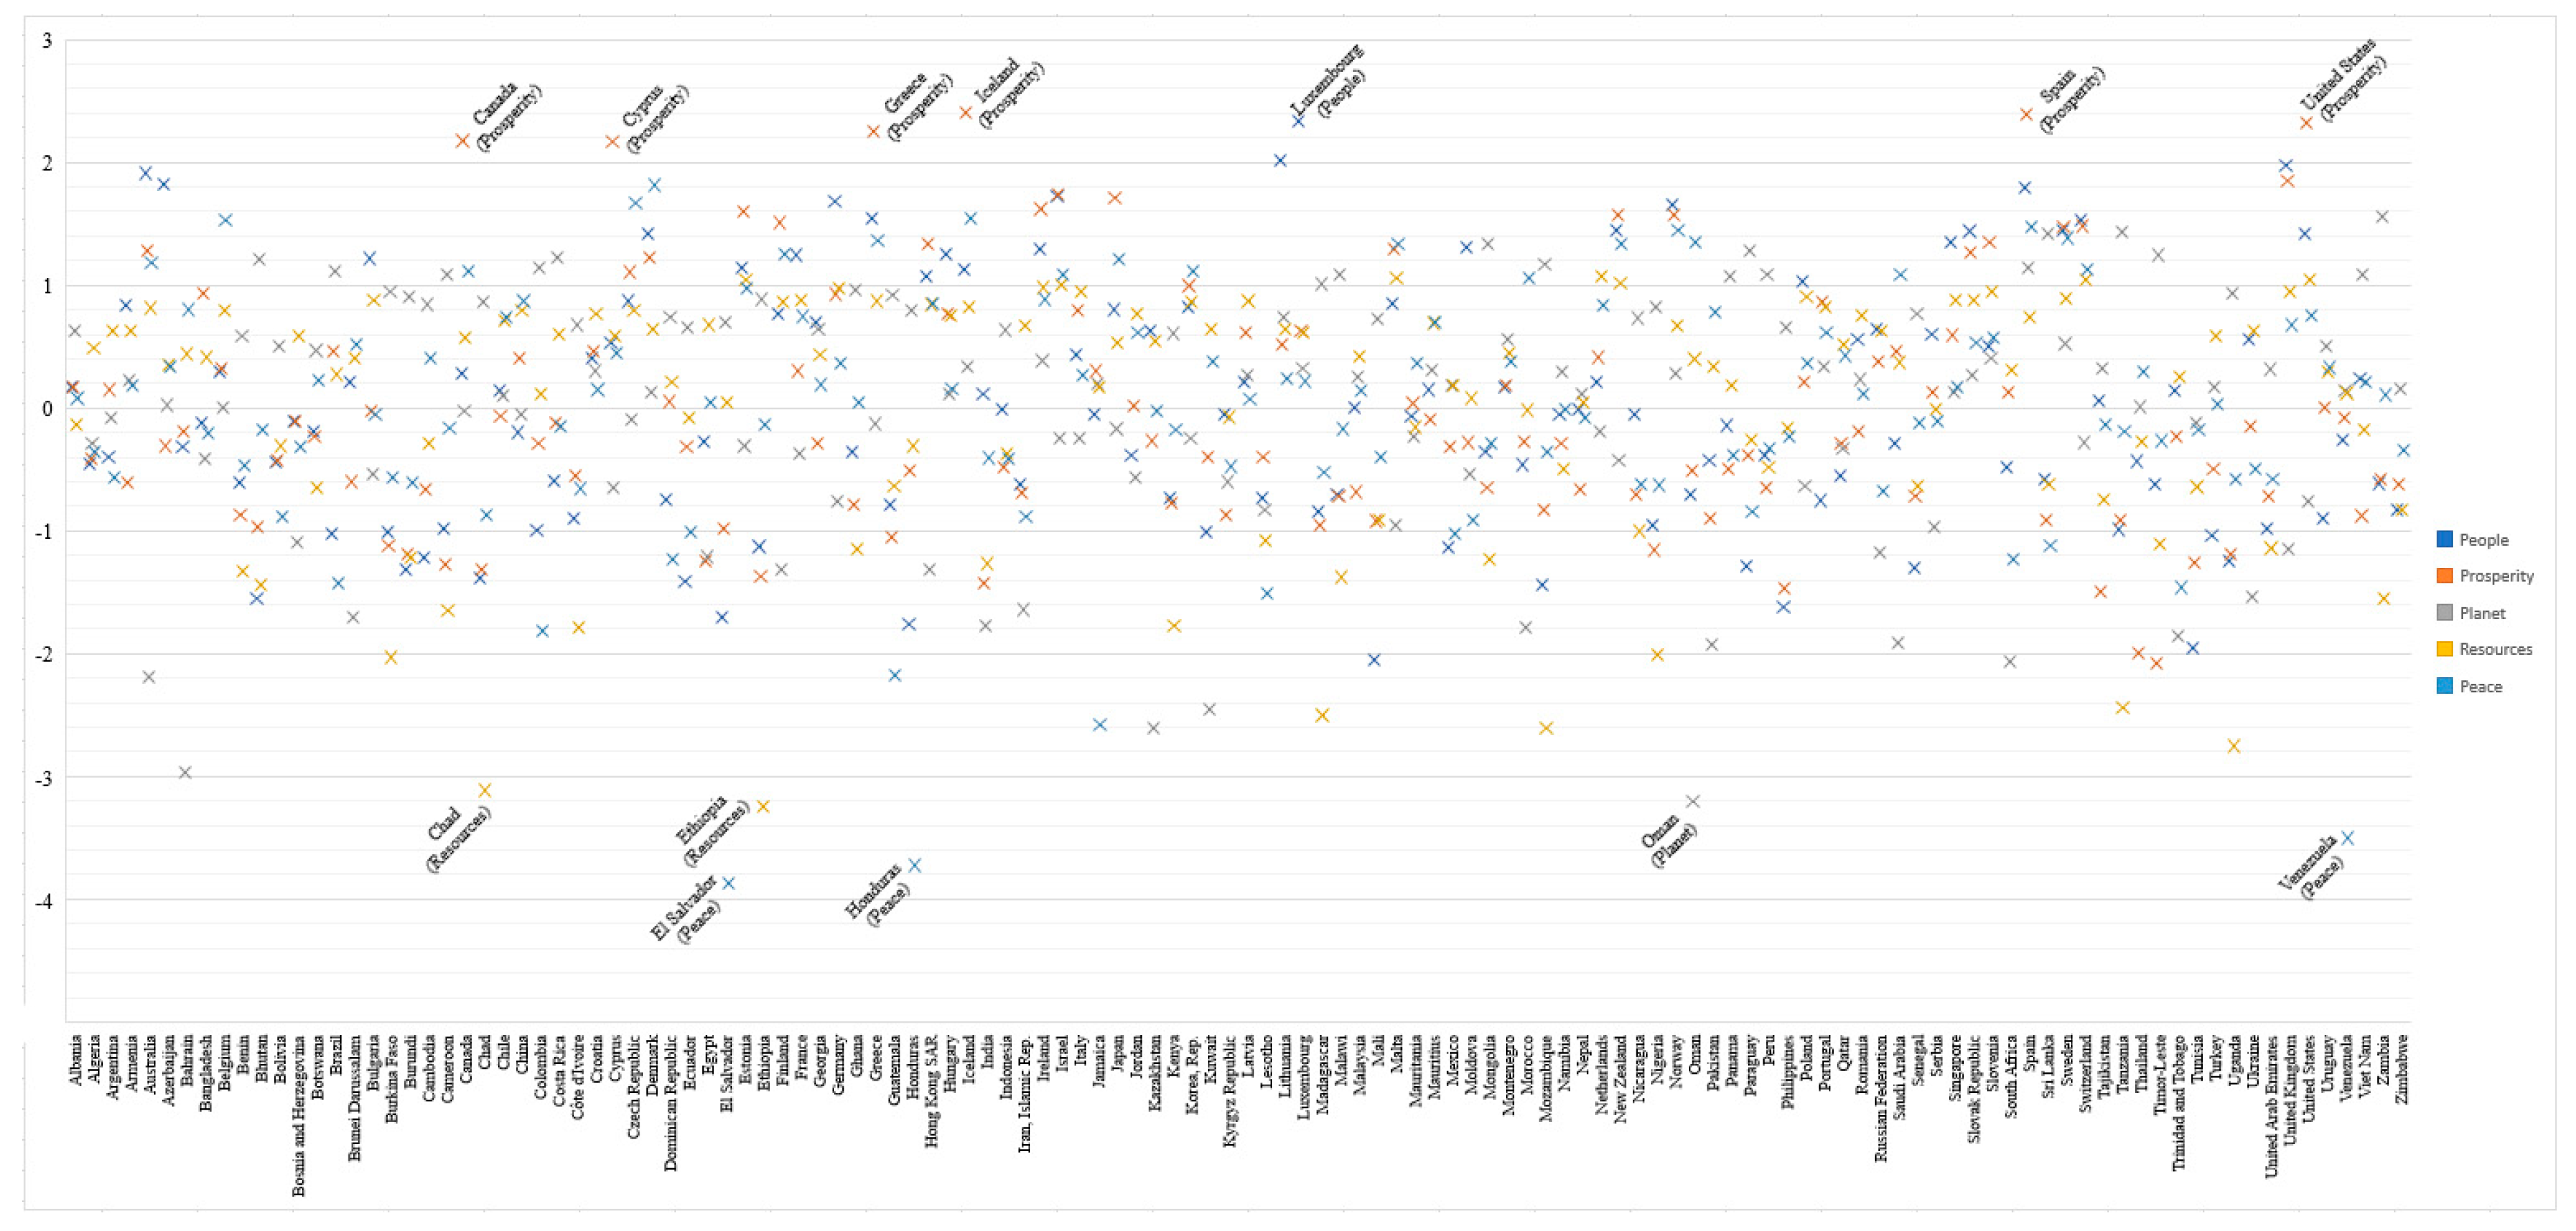
Table 2.
Average Adjusted R-squares of selected models.
| “Social-turn 1” models | Model 1 | Model 2 | Model 3 | Model 4 | Model 5 | Model 6 |
| 0.379 | 0.367 | 0.325 | 0.430 | 0.321 | 0.373 | |
| “Social-turn 2” models | Model 7 | Model 8 | Model 8 | Model 10 | Model 11 | Model 12 |
| 0.569 | 0.551 | 0.519 | 0.497 | 0.399 | 0.387 |
Table 4.
Correlation matrix (Models 4, 7, 13, and 14).
| People | Prosperity | Planet | Resources | Peace | Financial Enhancers | InstitutionalEnhancers | GC-Ins | GC-InnS | FDIIn-flow | FDIOut-flow | H&LS | |
| People | (0.651) | |||||||||||
| Prosperity | 0.588 | (0.542) | ||||||||||
| Planet | 0.220 | 0.181 | (0.623) | |||||||||
| Resources | 0.523 | 0.627 | 0.437 | (0.808) | ||||||||
| Peace | 0.423 | 0.468 | 0.244 | 0.362 | (0.802) | |||||||
| Financial Enhancers | 0.501 | 0.668 | 0.111 | 0.509 | 0.451 | (0.774) | ||||||
| Institutional Enhancers | 0.547 | 0.763 | 0.236 | 0.611 | 0.628 | 0.760 | (0.818) | |||||
| GC-Ins | 0.462 | 0.602 | 0.269 | 0.534 | 0.600 | 0.626 | 0.814 | (0.889) | ||||
| GC-InnS | 0.475 | 0.702 | 0.240 | 0.562 | 0.574 | 0.575 | 0.798 | 0.890 | (0.980) | |||
| FDI In-flow | 0.203 | 0.198 | 0.135 | 0.224 | 0.225 | 0.242 | 0.296 | 0.313 | 0.316 | (0.770) | ||
| FDI Out-flow | 0.243 | 0.279 | 0.133 | 0.227 | 0.247 | 0.265 | 0.358 | 0.333 | 0.388 | 0.823 | (0.783) | |
| H&LS | 0.291 | 0.405 | 0.010 | 0.376 | 0.194 | 0.369 | 0.392 | 0.343 | 0.382 | 0.147 | 0.178 | (1.000) |
Note: Correlation of H&LS with other constructs are only valid for Models 13 and 14.
Table 6.
Country Cluster Results for “Social-turn 1.2” and “Social-turn 2” models (Model 14 and Model 15).
Table 6.
Country Cluster Results for “Social-turn 1.2” and “Social-turn 2” models (Model 14 and Model 15).
| Relationships | Advanced Economies |
Emerging & Developing Europe |
Emerging & Developing Asia |
Middle East, North Africa & Pakistan | Latin America & the Caribbean | Sub Saharan Africa |
Commonwealth |
| Path Coeff. Total Effects / Effect Sizes |
Path Coeff. Total Effects / Effect Sizes |
Path Coeff. Total Effects / Effect Sizes |
Path Coeff. Total Effects / Effect Sizes |
Path Coeff. Total Effects / Effect Sizes |
Path Coeff. Total Effects / Effect Sizes |
Path Coeff. Total Effects / Effect Sizes |
|
| Institutional Enhancers → FDII (“Social-turn 2”) |
0.097* | n.s. | -0.212** | n.s. | 0.370*** | 0.130* | n.s. |
| Institutional Enhancers → FDII (“Social-turn 1.2”) |
0.067* | 0.248** | -0.212** | n.s | 0.370*** | n.s | n.s |
| Institutional Enhancers → FDIO (“Social-turn 2”) |
0.094* | 0.211* | 0.354*** | 0.457*** | 0.433*** | 0.251*** | n.s. |
| Institutional Enhancers → FDIO (“Social-turn 1.2”) |
0.094* | n.s | 0.354*** | 0.457*** | 0.433*** | 0.251*** | n.s |
| Financial Enhancers → FDII (“Social-turn 2”) |
0.103* | n.s. | 0.141* | 0.142* | n.s. | n.s. | n.s. |
| Financial Enhancers → FDII (“Social-turn 1.2”) |
0.103* | n.s | 0.141* | 0.142* | n.s | n.s | n.s |
| Financial Enhancers → FDIO (“Social-turn 2”) |
n.s. | n.s. | n.s. | n.s. | -0.204*** | -0.103* | -0.287** |
| Financial Enhancers → FDIO (“Social-turn 1.2”) |
n.s | n.s | n.s | n.s | n.s | -0.13* | -0.287** |
| FDII → GC-Ins (“Social-turn 2”) |
0.264*** | 0.746*** | n.s. | n.s. | 0.444*** | n.s. | 0.246** |
| FDII → GC-Ins (“Social-turn 1.2”) |
0.154** | 0.669*** | n.s | 0.158** | 0.318*** | n.s | n.s |
| FDII → GC-InnS (“Social-turn 2”) |
-0.169*** | 0.248** | n.s. | n.s. | 0.480*** | 0.118* | n.s. |
| FDII → GC-InnS (“Social-turn 1.2”) |
-0.209*** | 0.264** | n.s | 0.141* | 0.379*** | 0.109* | -0.216* |
| FDII → FDIO (“Social-turn 2”) |
0.819*** | 0.980*** | 0.403*** | n.s. | 0.500*** | 0.192*** | 0.573*** |
| FDII → FDIO (“Social-turn 1.2”) |
0.819*** | 0.939*** | 0.403*** | n.s. | 0.500*** | 0.192*** | 0.573*** |
| Relationships | Advanced Economies |
Emerging & Developing Europe |
Emerging & Developing Asia |
Middle East, North Africa & Pakistan | Latin America & the Caribbean | Sub Saharan Africa |
Commonwealth |
| Path Coeff. Total Effects / Effect Sizes |
Path Coeff. Total Effects / Effect Sizes |
Path Coeff. Total Effects / Effect Sizes |
Path Coeff. Total Effects / Effect Sizes |
Path Coeff. Total Effects / Effect Sizes |
Path Coeff. Total Effects / Effect Sizes |
Path Coeff. Total Effects / Effect Sizes |
|
| FDIO → GC-Ins (“Social-turn 2”) |
n.s. | -0.551*** | 0.159* | n.s. | n.s. | n.s. | n.s. |
| FDIO → GC-Ins (“Social-turn 1.2”) |
0.085* | -0.444*** | 0.546*** | 0.395*** | 0.146* | 0.127* | n.s |
| FDIO → GC-InnS (“Social-turn 2”) |
0.380*** | n.s. | 0.227** | n.s. | n.s. | n.s. | 0.338*** |
| FDIO → GC-InnS (“Social-turn 1.2”) |
0.438*** | n.s | 0.576*** | 0.383*** | 0.186** | 0.239*** | 0.500*** |
| People → GC-Ins (“Social-turn 2”) |
0.143** 0.147 / 0.055^ |
n.s. | n.s. | 0.216** 0.225 / 0.096^ |
0.032* 0.115 / 0.031^ |
0.278*** 0.268 / 0.126^ |
n.s. |
| People → GC-InnS (“Social-turn 2”) |
n.s. | n.s. | n.s. | 0.315*** 0.326 / 0.152^^ |
n.s. | 0.228*** 0.209 / 0.098^ |
0.287*** 0.502 / 0.105^ |
| People → H&LS (“Social-turn 2”) |
0.172*** 0.190 / 0.038^ |
n.s. | n.s. | n.s. | n.s. | 0.130*** 0.220 / 0.024^ |
n.s. |
| Prosperity → GC-Ins (“Social-turn 2”) |
0.390*** 0.398 / 0.280^^ |
0.308*** 0.303 / 0.088^ |
0.211*** 0.235 / 0.087^ |
0.416*** 0.428 / 0.228^^ |
n.s. | 0.394*** 0.427 / 0.231^^ |
n.s. |
| Prosperity → GC-InnS (“Social-turn 2”) |
0.596*** 0.608 / 0.424^^^ |
0.202* 0.096 / 0.041^ |
0.146* 0.117 / 0.055^ |
0.411*** 0.427 / 0.205^^ |
n.s. | 0.398*** 0.439 / 0.234^^ |
n.s. |
| Prosperity → H&LS (“Social-turn 2”) |
0.096** 0.156 / 0.026^ |
n.s. | 0.331*** 0.388 / 0.142^ |
n.s. | n.s. | n.s. | 0.498*** 0.575 / 0.331^^ |
| Planet → GC-Ins (“Social-turn 2”) |
n.s. | 0.241** 0.238 / 0.075^ |
n.s. | n.s. | n.s. | 0.321*** 0.268 / 0.090^ |
n.s. |
| Planet → GC-InnS (“Social-turn 2”) |
n.s. | n.s. | n.s. | 0.169* 0.173 / 0.076^ |
n.s. | n.s. | n.s. |
| Planet → H&LS (“Social-turn 2”) |
n.s. | n.s. | n.s. | n.s. | 0.446*** 0.472 / 0.197^^ |
n.s. | n.s. |
| Resources → GC-Ins (“Social-turn 2”) |
n.s. | 0.361*** 0.365 / 0.109^ |
0.529*** 0.539 / 0.380^^^ |
n.s. | 0.407*** 0.458 / 0.150^^ |
0.364*** 0.359 / 0.195^^ |
0.440*** 0.431 / 0.165^^ |
| Resources → GC-InnS (“Social-turn 2”) |
n.s. | 0.632*** 0.642 / 0.374^^^ |
0.464*** 0.484 / 0.330^^ |
n.s. | 0.599*** 0.635 / 0.357^^^ |
0.183*** 0.187 / 0.085^ |
0.241* 0.195 / 0.076^ |
| Resources → H&LS (“Social-turn 2”) |
0.167** 0.141 / 0.029^ |
0.122* 0.164 / 0.026^ |
0.151*** 0.263 / 0.071^ |
n.s. | 0.204*** 0.280 / 0.051^^ |
n.s. | n.s. |
| Peace → GC-Ins (“Social-turn 2”) |
0.528*** 0.549 / 0.349^^ |
n.s. | n.s. | n.s. | 0.181* 0.115 / 0.033^ |
0.041** 0.156 /0.025^ |
0.381*** 0.378 / 0.150^^ |
| Peace → GC-InnS (“Social-turn 2”) |
0.173*** 0.205 / 0.112^ |
n.s. | 0.144* 0.130 / 0.050^ |
0.012* 0.176 / 0.083^ |
0.105* 0.122 / 0.044^ |
0.165*** 0.295 / 0.031^ |
0.295** 0.289 / 0.045^ |
| Peace → H&LS (“Social-turn 2”) |
0.103* 0.175 / 0.042^ |
n.s. | n.s. | n.s. | n.s. | 0.183*** 0.254 / 0.027^ |
n.s. |
| GC-Ins → H&LS (“Social-turn 2”) |
0.124** | -0.354*** | 0.406*** | n.s. | -0.531*** | n.s. | n.s. |
| GC-InnS → H&LS (“Social-turn 2”) |
n.s. | 0.646*** | -0.221** | -0.314*** | 0.493*** | 0.435*** | -0.276** |
| Institutional Enhancers → People (“Social-turn 1.2”) |
-0.113* -0.099 / 0.026^ |
0.392*** 0.366 / 0.088^ |
0.137* 0.169 / 0.042^ |
0.753*** 0.740 / 0.388^^^ |
0.618*** 0.647 / 0.310^^ |
0.562*** 0.588 / 0.313^^ |
n.s |
| Institutional Enhancers → Prosperity (“Social-turn 1.2”) |
0.148** 0.178 / 0.116^ |
0.548*** 0.540 / 0.292** |
0.211** 0.231 / 0.074^ |
n.s | 0.635*** 0.667 / 0.219^^ |
0.757*** 0.779 / 0.560^^^ |
n.s |
| Institutional Enhancers → Planet (“Social-turn 1.2”) |
n.s | n.s | 0.314*** 0.276 / 0.051^ |
-0.500*** -0.517 / 0.266^^ |
n.s | -0.730*** -0.758 / 0.346^^ |
n.s |
| Institutional Enhancers → Resources (“Social-turn 1.2”) |
0.106* 0.121 / 0.028^ |
n.s | 0.221** 0.334 / 0.164^^ |
0.844*** 0.822 / 0.309^^ |
0.529*** 0.617 / 0.305^^ |
0.604*** 0.619 / 0.390^^^ |
0.324*** 0.326 / 0.090^ |
| Institutional Enhancers → Peace (“Social-turn 1.2”) |
0.556*** 0.566 / 0.403^^^ |
n.s | n.s | 0.509*** 0.514 / 0.355^^^ |
0.653*** 0.628 / 0.375^^^ |
-0.574*** -0.582 / 0.242^^ |
n.s |
| Institutional Enhancers → H&LS (“Social-turn 1.2”) |
-0.302*** -0.238 / 0.023^ |
0.272** 0.251 / 0.078^ |
0.139* 0.263 / 0.075^ |
-0.443*** -0.403 / 0.064^ |
n.s | n.s | n.s |
| Financial Enhancers → People (“Social-turn 1.2”) |
n.s | 0.284*** 0.309 / 0.100^ |
n.s | -0.246*** -0.247 / 0.037^ |
n.s | -0.278*** -0.285 / 0.068^ |
-0.349*** -0.398 / 0.183^^ |
| Relationships | Advanced Economies |
Emerging & Developing Europe |
Emerging & Developing Asia |
Middle East, North Africa & Pakistan | Latin America & the Caribbean | Sub Saharan Africa |
Commonwealth |
| Path Coeff. Total Effects / Effect Sizes |
Path Coeff. Total Effects / Effect Sizes |
Path Coeff. Total Effects / Effect Sizes |
Path Coeff. Total Effects / Effect Sizes |
Path Coeff. Total Effects / Effect Sizes |
Path Coeff. Total Effects / Effect Sizes |
Path Coeff. Total Effects / Effect Sizes |
|
| Financial Enhancers → Prosperity (“Social-turn 1.2”) |
n.s | 0.378*** 0.377 / 0.207^^ |
0.439*** 0.443 / 0.231^^ |
0.255*** 0.253 / 0.103^ |
-0.534*** -0.539 / 0.166^^ |
-0.238*** -0.244 / 0.093^ |
-0.402*** -0.445 / 0.165^^ |
| Financial Enhancers → Planet (“Social-turn 1.2”) |
n.s | n.s | n.s | n.s | 0.625*** 0.626 / 0.131^ |
0.544*** 0.552 / 0.025^ |
0.483*** 0.485 / 0.194^^ |
| Financial Enhancers → Resources (“Social-turn 1.2”) |
n.s | 0.205* 0.226 / 0.062^ |
n.s | n.s | n.s | -0.213*** -0.216 / 0.070^ |
n.s |
| Financial Enhancers → Peace (“Social-turn 1.2”) |
-0.101* -0.099 / 0.028^ |
0.496*** 0.528 / 0.229^^ |
-0.286*** -0.248 / 0.037^ |
0.273*** 0.272 / 0.155^^ |
0.179** 0.182 / 0.059^ |
0.321*** 0.323 / 0.036^ |
0.578*** 0.540 / 0.262^^ |
| Financial Enhancers → H&LS (“Social-turn 1.2”) |
n.s | 0.212* 0.155 / 0.039^ |
n.s | 0.237** 0.331 / 0.032^ |
n.s | n.s | n.s |
| GC-Ins → People (“Social-turn 1.2”) |
0.425*** | -0.257* | -0.135* | -0.283*** | n.s | n.s | -0.234** |
| GC-Ins → Prosperity (“Social-turn 1.2”) |
0.352*** | n.s | 0.533*** | 0.186** | -0.411*** | n.s | n.s |
| GC-Ins → Planet (“Social-turn 1.2”) |
-0.221*** | 0.656*** | 0.556*** | -0.152* | -0.758*** | 0.269*** | n.s |
| GC-Ins → Resources (“Social-turn 1.2”) |
n.s | -0.533*** | 0.653*** | -0.434*** | -0.444*** | 0.249*** | n.s |
| GC-Ins → Peace (“Social-turn 1.2”) |
0.192*** | -0.427*** | 0.230** | n.s | -0.452*** | n.s | n.s |
| GC-InnS → People (“Social-turn 1.2”) |
n.s | -0.160* | 0.327*** | 0.210** | n.s | 0.309*** | 0.397*** |
| GC-InnS → Prosperity (“Social-turn 1.2”) |
0.362*** | -0.340*** | -0.418*** | 0.223** | 0.459*** | 0.316*** | 0.324*** |
| GC-InnS → Planet (“Social-turn 1.2”) |
0.167*** | -0.569*** | -0.784*** | n.s | 0.558*** | -0.509*** | n.s |
| GC-InnS → Resources (“Social-turn 1.2”) |
0.251*** | 0.979*** | n.s | n.s | 0.708*** | n.s | 0.502*** |
| GC-InnS → Peace (“Social-turn 1.2”) |
n.s | n.s | 0.331*** | 0.155* | 0.273*** | -0.101* | 0.230** |
| People → H&LS (“Social-turn 1.2”) |
0.198*** | n.s | n.s | n.s | 0.110* | 0.223*** | 0.254** |
| Prosperity → H&LS (“Social-turn 1.2”) |
-0.099* | n.s | 0.465*** | n.s | -0.311*** | 0.212*** | 0.556*** |
| Planet → H&LS (“Social-turn 1.2”) |
n.s | n.s | -0.213** | n.s | 0.524*** | n.s | -0.643*** |
| Resources → H&LS (“Social-turn 1.2”) |
n.s | n.s | 0.185** | -0.146* | 0.316** | -0.231*** | -0.597*** |
| Peace → H&LS (“Social-turn 1.2”) |
0.153*** | n.s | -0.325*** | 0.202** | n.s | 0.252*** | n.s |
| Notes: Significance Level: *p < 0.05, **p <0.01, ***p<0.001. Effect sizes ^ 0.02 < e < 0.15 = Low effect size, ^^ 0.15 < e < 0.35 = Medium effect size, ^^^ e > 0.35 = Strong effect size. n.s.: Nonsignificant results. | |||||||
Table 7.
Country Cluster Level Results: SD Pillars’ Relationships with H&LS for “Social-turn 1”, “Social-turn 1.2” and “Social-turn 2” (Models 13, 14, and 15).
Table 7.
Country Cluster Level Results: SD Pillars’ Relationships with H&LS for “Social-turn 1”, “Social-turn 1.2” and “Social-turn 2” (Models 13, 14, and 15).
| SD Pillars ↓ H&LS |
Advanced Economies |
Emerging & Developing Europe |
Emerging & Developing Asia |
Middle East, North Africa & Pakistan | Latin America & the Caribbean | Sub Saharan Africa | Commonwealth |
| Path Coeff. Total Effects/ Effect Sizes |
Path Coeff. Total Effects/ Effect Sizes |
Path Coeff. Total Effects/ Effect Sizes |
Path Coeff. Total Effects/ Effect Sizes |
Path Coeff. Total Effects/ Effect Sizes |
Path Coeff. Total Effects/ Effect Sizes |
Path Coeff. Total Effects/ Effect Sizes |
|
| People → H&LS “Social-turn 1” |
0.234*** 0.234 / 0.046^ |
n.s | n.s | n.s | n.s | n.s | 0.265* 0.265 / 0.107^ |
| People → H&LS “Social-turn 1.2” |
0.198*** | n.s. | n.s. | n.s. | 0.110* | 0.223*** | 0.254** |
| People → H&LS “Social-turn 2” |
0.172*** 0.190 / 0.038^ |
n.s | n.s | n.s | n.s | 0.123* 0.220 / 0.024^ |
0.207* 0.123 / 0.050^ |
| Prosperity → H&LS “Social-turn 1” | n.s | n.s | 0.453*** 0.453 / 0.166^^ |
n.s | n.s | n.s | 0.560*** 0.560 / 0.366^^^ |
| SD Pillars ↓ H&LS |
Advanced Economies |
Emerging & Developing Europe |
Emerging & Developing Asia |
Middle East, North Africa & Pakistan | Latin America & the Caribbean | Sub Saharan Africa | Commonwealth |
| Path Coeff. Total Effects/ Effect Sizes |
Path Coeff. Total Effects/ Effect Sizes |
Path Coeff. Total Effects/ Effect Sizes |
Path Coeff. Total Effects/ Effect Sizes |
Path Coeff. Total Effects/ Effect Sizes |
Path Coeff. Total Effects/ Effect Sizes |
Path Coeff. Total Effects/ Effect Sizes |
|
| Prosperity → H&LS “Social-turn 1.2” | -0.099* | n.s. | 0.465*** | n.s. | -0.311*** | 0.212*** | 0.556*** |
| Prosperity → H&LS “Social-turn 2” | 0.096 0.156 / 0.026^ |
0.120 0.148 / 0.027^ |
0.331*** 0.388 / 0.142^ |
n.s | n.s | n.s | 0.498*** 0.502 / 0.331^^ |
| Planet → H&LS “Social-turn 1” |
n.s | n.s | n.s | n.s | 0.474*** 0.474 / 0.198^^ |
n.s | 0.630*** 0.630 / 0.341^^ |
| Planet → H&LS “Social-turn 1.2” |
n.s. | n.s. | -0.213** | n.s. | 0.524*** | n.s. | -0.643*** |
| Planet → H&LS “Social-turn 2” |
n.s | n.s | n.s | n.s | 0.446*** 0.472 / 0.197^^ |
n.s | 0.322*** 0.275 / 0.149^^ |
| Resources- H&LS “Social-turn 1” |
n.s | n.s | n.s | 0.193 0.201 / 0.333^^ |
0.200** 0.200 / 0.036^ |
0.273*** 0.273 / 0.019^ |
0.583*** 0.583 / 0.058^ |
| Resources- H&LS “Social-turn 1.2” |
n.s. | n.s. | 0.185** | -0.146* | 0.316** | -0.231*** | -0.597*** |
| Resources- H&LS “Social-turn 2” |
0.167*** 0.141 / 0.029^ |
0.122 0.164 / 0.026^ |
0.151 0.263 / 0.071^ |
n.s | 0.204*** 0.208 / 0.051^ |
n.s | n.s |
| Peace → H&LS “Social-turn 1” |
0.217*** 0.217/ 0.034^ |
n.s | n.s | 0.195 0.150 / 0.023^ |
n.s | 0.187*** 0.187 / 0.020^ |
0.085 0.085 / 0.028^ |
| Peace → H&LS “Social-turn 1.2” |
0.153*** | n.s. | -0.325*** | 0.202** | n.s. | 0.252*** | n.s. |
| Peace → H&LS “Social-turn 2” |
0.103 0.175 / 0.042^ |
n.s | 0.342*** 0.327 /0.062^ |
0.208 0.208 / 0.025^ |
n.s | 0.183** 0.254 / 0.027^ |
n.s |
| Notes: Significance level: *p<0.05, **p<0.01, ***p<0.001 Effect Sizes ^ 0.02 < e < 0.15 = Low effect size, ^^ 0.15 < e < 0.35 = Medium effect size, ^^^ e > 0.35 = Strong effect size. n.s.: Nonsignificant results. | |||||||
Disclaimer/Publisher’s Note: The statements, opinions and data contained in all publications are solely those of the individual author(s) and contributor(s) and not of MDPI and/or the editor(s). MDPI and/or the editor(s) disclaim responsibility for any injury to people or property resulting from any ideas, methods, instructions or products referred to in the content. |
© 2023 by the authors. Licensee MDPI, Basel, Switzerland. This article is an open access article distributed under the terms and conditions of the Creative Commons Attribution (CC BY) license (http://creativecommons.org/licenses/by/4.0/).
Copyright: This open access article is published under a Creative Commons CC BY 4.0 license, which permit the free download, distribution, and reuse, provided that the author and preprint are cited in any reuse.


