
Submitted:
16 January 2026
Posted:
19 January 2026
You are already at the latest version
Abstract
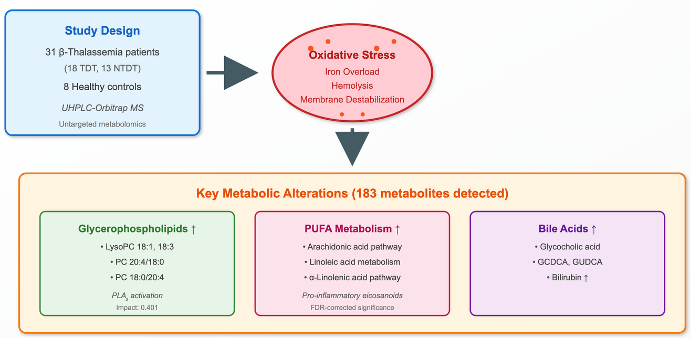
Background/Objectives: Oxidative stress and iron overload remodel erythrocyte mem-branes in β-thalassemia, but their systemic metabolic correlates are not well defined. We applied untargeted metabolomics to identify serum biomarkers reflecting these patho-physiological processes. Methods: Thirty-one adults with β-thalassemia [18 transfu-sion-dependent (TDT), 13 non-transfusion-dependent (NTD)] and 8 age/sex-matched healthy controls were studied. Fasting serum was profiled using untargeted UHPLC-Orbitrap MS. Multivariate modeling (SIMCA-P) and FDR-controlled univariate statistics identified discriminant features, followed by pathway enrichment analysis. Associations with clinical variables (chelation regimen, ferritin, cardiac MRI T2* and liver iron concentration) were examined. Results: A total of 183 metabolites were detected; versus controls, 124 were decreased, 54 increased, and 5 remained unchanged in patients. Key discriminants included lysophosphatidylcholines (LysoPC 18:1, 18:3), polyunsatu-rated fatty acid (PUFA)-bearing phosphatidylcholines (PC 20:4/18:0, PC 18:0/20:4), con-jugated bile acids (glycocholic acid, glycochenodeoxycholic acid, glycoursodeoxycholic acid), and bilirubin. Pathway analysis revealed significant enrichment (FDR-corrected) in linoleic acid metabolism (q = 0.024, impact = 1.000) and arachidonic acid metabolism (q = 0.022, impact = 0.433), with supportive nominal signals from glycerophospholipid (impact = 0.401) and porphyrin/heme (impact = 0.242) pathways. No significant metabolic dif-ferences were observed between TD and NTD patients. Conclusions: β-thalassemia serum metabolomics reflects oxidative membrane lipid remodeling with a prominent PLA₂/LysoPC–arachidonic axis and evidence of heme turnover and altered bile-acid signaling. These data propose a practical biomarker panel - LysoPCs, arachidonic ac-id-enriched PCs and conjugated bile acids - warranting targeted validation alongside conventional clinical parameters for disease monitoring and therapeutic assessment.
Keywords:
β-thalassemia
; serum metabolomics
; lysophosphatidylcholine
; phospholipase A₂
; arachidonic acid
; iron overload
; bile acids
1. Introduction
β-Thalassemia is an autosomal-recessive hemoglobinopathy caused by deficient β-globin synthesis. Homozygous or compound heterozygous mutations produce transfusion-dependent (TD) disease with life-long anemia, whereas milder genotypes may be non-transfusion-dependent (NTD) with intermittent transfusion needs. Excess unpaired α-chains form hemichromes that catalyze reactive oxygen species, driving lipid/protein oxidation, membrane destabilization, apoptosis of erythroblasts, and ineffective erythropoiesis; peripheral hemolysis further aggravates anemia [1,2]. Beyond hematologic manifestations, chronic hemolysis, endothelial adhesion, inflammation, oxidative stress, and iron overload contribute to multisystem—especially cardiovascular—injury [3,4].
Metabolomics, by quantifying small-molecule intermediates and end products, offers a systems view of these processes [5,6]. Prior studies have reported altered organic and amino acids by NMR, targeted MS predictors of iron overload/oxidative damage, and GC-MS–defined serum pathway disturbances; hydroxyurea may partially normalize profiles [7,8,9,10,11]. Work in thalassemia models and patients highlights tissue-specific macrophage reprogramming, bile-acid perturbations, plasma/erythrocyte redox remodeling, and microbiome–metabolome links—including taxa that modify anemia and iron burden [12,13,14,15,16].
We therefore applied untargeted UHPLC–Orbitrap MS to serum samples from β-thalassemia patients versus healthy controls and explored associations between metabolites/pathways and clinical features (e.g., transfusion status, iron indices, MRI T2*, liver iron concentration, and therapy). Mapping these metabolic derangements aims to identify biomarkers and therapeutic targets that link the primary hemoglobin defect to multisystem disease. Such a transformation of hemoglobin-centered problem into a multisystemic disease will certainly help to discover new biomarkers and therapeutic strategies in β-thalassemia.
2. Materials and Methods
The study included 31 patients with β-thalassemia living on region of Northwestern Greece and followed at the pediatric and adult Thalassemia Units at the University Hospital of Ioannina. The diagnosis was based on the clinical, hematological, biosynthetic, and genetic studies. Medical files of the patients were retrieved, and detailed data were recorded and analyzed. Other parameters such as type of iron chelators, serum ferritin, cardiac MRI T2* and MRI liver iron concentration (LIC) were enrolled in the study. The demographic, laboratory and clinical data are shown in Table 1. Fourteen patients were male, and the age range was 12-67 years with a median 36 years. Eighteen had TD β-thalassemia and 13 NTD. Eight apparently healthy individuals matched for age and sex respectively, to patients, served as controls. All participants provided written informed consent, and the study was conducted in accordance with the Declaration of Helsinki.
Peripheral blood was drawn after an overnight fast and, for transfused patients, prior to the scheduled transfusion to minimize acute post-transfusion effects. Patients having any evidence of other chronic illnesses unrelated to thalassemia were excluded. Samples were allowed to clot, centrifuged to obtain serum, aliquoted to avoid repeated freeze–thaw, and stored at −80 °C until analysis. All steps were performed on ice or at 4 °C to limit ex vivo metabolic change and oxidation. Sterile pipettes and tips were used, and appropriate precautions were taken during the performance of assays (using a laminal flow instrument in a cell culture room) to protect samples from subsequent environmental contamination.
Acetonitrile, methanol, and formic acid were obtained from Fluka/Riedel-de Haën (Switzerland). Millipore’s Milli-Q Plus water purification system (Milford, MA, USA) was utilized to create high-quality purified water.
Serum samples were prepared following a specific protocol: initially, the samples were thawed on ice at 4 °C for 30 to 60 minutes. Then, 200 μL of each serum sample was placed into labeled 1.5 mL Eppendorf tubes, and 800 μL of methanol was added, followed by 15 seconds of vortexing. Afterward, the samples were centrifuged at 15800g for 15 minutes at room temperature to separate the protein precipitate. The resulting supernatant were transferred into two separate labeled 1.5 mL Eppendorf tubes. These were then evaporated in the GeneVac at 50 °C and stored (-80oC) until analysis. For HRMS analysis, 100 μL of 80:20 H2O:AcN was added to reconstitute the sample, vortexed for 15 seconds, centrifuged at 15800g for 15 minutes, and transferred to 200 μL inserts in appropriate screw-capped autosampler vials. Throughout these processes, the samples were kept on ice before each centrifugation, and all steps were conducted at a controlled temperature of 4 °C.
A pooled quality control (QC) sample was made to oversee the consistency of LC and MS performance across sample runs. This QC sample was formed by mixing equal small portions from all the samples in the experimental set before the evaporation process. Afterward, the combined mixture was evaporated until completely dry and managed consistently with the previously outlined procedures as a control throughout the experiments. Sample handling and analysis is depicted as a workflow in Figure 1.
Samples were analyzed using a Thermo Scientific ESI-LTQ-Orbitrap Discovery XL mass spectrometer connected to an Accela UHPLC system, also from Thermo Scientific. The UHPLC setup included an autosampler, vacuum degasser, binary pump, and a column with controlled temperature. Analysis was conducted using a Waters Corp. ACQUITY UPLC BEH C18 reversed-phase column. The system used a binary gradient solvent method with formic acid (0.1%v/v)-water (solvent A) and acetonitrile (solvent B). Sample analysis covered both positive (ESI+) and negative (ESI−) ion modes, maintaining a constant flow rate of 0.4 mL/min. The gradient method spanned 32 minutes with specific solvent ratios at different time points, while the column temperature remained at 40 °C and the autosampler tray temperature at 5 °C. The injection volume was 10 μL. In positive ion mode, the capillary temperature and voltage were adjusted to 320 °C and 40 V, respectively. The sheath gas flow was set at 40, aux gas flow at 8 arb. units, spray voltage at 3.30 kV, and tube lens voltage at 120 V. Conversely, for negative ion mode, the capillary temperature and voltage were set to 320 °C and −40 V, respectively. The sheath gas flow and aux gas flow were maintained at 40 and 8 arb. units, while the spray voltage was set to 2.70 kV and the tube lens voltage to −120 V. In both positive and negative ion modes, the analysis employed Fourier transform mass spectrometry (FTMS) in full scan ion mode, scanning within the range of mass-to-charge (m/z) ratio 100–1000 and a resolution of 30,000 FWHM, while spectra were acquired in centroid mode.
Before conducting the multivariate statistical analysis, the data underwent preprocessing using several tools. Xcalibur® from Thermo Fisher Scientific, MZmine 2.10 available at mzmine.sourceforge.net. Microsoft Excel, and the web-based MetaboAnalyst suite [17] were utilized. Initially, Xcalibur® converted the instrument’s native data files (.raw) to the cdf data format (.cdf) through the Xcalibur® Xconvert program. Subsequently, MZmine 2.10 processed the data, employing baseline correction, peak detection, deconvolution, deisotoping, alignment, and gap filling procedures. The resulting peak list, displaying accurate mass - tR versus intensity, was exported as a .csv file to Microsoft Excel and further manipulated using commands such as CONCATENATE, ROUND, and TRANSPOSE for appropriate adjustments.
Next, the MetaboAnalyst workflow was used for statistical analysis. Within this analysis, several steps were taken: (a) missing values were addressed using the k-nearest neighbor (KNN) algorithm, (b) data filtering involved applying the interquartile range (IQR) to eliminate 25–40% of near-constant values throughout the experiment as a robust estimator of noise, and (c) row-wise normalization was conducted by averaging all samples (creating a pseudo-reference sample) in the control group. Additionally, either unit variance (UV) or Pareto scaling was explored to approximate a normal distribution as closely as possible.
Initially, Principal Component Analysis (PCA) was utilized to explore the inherent variations within the datasets, identify potential outliers through 2D scores plots, and assess the method’s quality by visually inspecting the QC clustering. Subsequently, Partial Least Square-Discriminant Analysis (PLS-DA) was employed in a sequential manner to unveil potential underlying classifications among the studied groups and to investigate the crucial features contributing to this clustering. The performance of the PLS-DA models underwent assessment using k-fold cross-validation (k = 10), leave-one-out cross-validation (LOOCV), and permutation testing (100 permutations) (18) R2 and Q2 values were employed for selecting the optimal parameters and evaluating the model’s predictive capacity. Variables with a Variable Importance in Projection (VIP) exceeding 1.5 were considered as highly influential in classifying the healthy controls versus patients groups. Additionally, orthogonal projection to latent structures–discriminant analysis (OPLS-DA) was employed using SIMCA P+ 10.5 (Umetrics, Umea, Sweden) and EZinfo 2.0 (Umetrics, Umea, Sweden). VIP scores and S-plots were constructed to assess the most influential metabolites in this scenario, while model quality was assessed based on R2X, R2Y, Q2, and permutation testing involving 100 random permutations.
Furthermore, an additional assessment of the generated outcomes involved conducting univariate data analysis through several methods: t-tests, fold change (FC) examination, and their amalgamation represented as a heatmap plot. Throughout these analyses, a consistent FC threshold of 2 was set, and the significance threshold was established at 95% (p-value = 0.05). To assess normality, the data underwent the Shapiro–Wilk, Kolmogorov–Smirnov, and Lilliefors tests using the ‘nortest’ R-package.
3. Results
3.1. Global Serum Metabolome and Data Structure
Untargeted UHPLC–Orbitrap MS detected 183 serum features across patients and controls. Based on combined multivariate and univariate analyses, 124 features were decreased, 54 were increased, and 5 were unchanged in patients versus controls
Two approaches were adopted for data scaling: UV (auto-scaling) and Pareto scaling for both negative and positive ion modes. UV scaling equalizes the importance of all metabolites but amplifies baseline noise. Conversely, Pareto scaling retains the original measurements to a greater extent but is responsive to significant changes [18]. As depicted in Figure 2 and Figure 3 for positive and negative ion modes, respectively, the samples showed close clustering in PCA score plots (data were not shown for UV scaling). However, the distinction between the two groups was not deemed satisfactory and therefore supervised methods, such as PLS-DA or OPLS-DA, were employed.
Both methods were able to distinguish between the two sets (controls versus patients), displaying distinctive clustering that suggested varying metabolic profiles in both modes both for UV and Pareto scaling. However, in these supervised models, that users categorize samples into pre-established groups, carries the risk of creating biased clustering or overfitting. Hence, permutation testing involving 100 permutations was used to evaluate the significance of the classification, utilizing the prediction accuracy during training as a statistical test. Τhe results of the Permutation test indicated that UV Scaling was over-fitted to the data since R2 and Q2 values derived from the permuted data exceeded the original values on the validation plot. This indicates that relying on the model using UV Scaling might not be dependable for subsequent statistical analysis, as it fails to precisely represent the inherent patterns within the data.
3.2. Feature Selection and Identification
The VIP-plot and S-plot in positive (Figure 4a,b) and negative (Figure 4c,d) mode were computed to pinpoint potentially crucial variables that contribute to the distinct clustering observed in the OPLS. VIP values (>1.0) were utilized to pinpoint the metabolites responsible for distinguishing between the two groups.
Additionally, to validate the outcomes related to the selection of VIPs from both modes (positive and negative), univariate data analysis was conducted using, t-test, FC monitoring, and their amalgamation in the form of a heatmap plot (Figure 5).
By merging the findings from both univariate and multivariate analyses, a compilation of features that differentiate the two groups was assembled for structural identification. The identification strategy involved comparing the selected features with online databases based on mass accuracy, isotopic patterns, RDBeq information, and potential low-energy or in-source fragmentation data for assessment. As a result, 20 metabolites (Table 2) were recognized via Orbitrap-based analysis.
Pathway analysis (MetaboAnalyst/KEGG) [17] showed significant enrichment for arachidonic acid metabolism (q = 0.022, impact = 0.433) and linoleic acid metabolism (q = 0.024, impact = 1.000) (Figure 6). Glycerophospholipid metabolism (q = 0.220, impact = 0.401) and porphyrin metabolism (q = 0.145, impact = 0.242) reached nominal significance but did not survive FDR correction. These patterns, together with LysoPC up-regulation at the feature level, support a PUFA (Polyunsaturated fatty acid)- and membrane-lipid–centered remodeling under oxidative stress, with eicosanoid precursor flux as a plausible downstream consequence. Primary bile-acid biosynthesis and α-linolenic acid metabolism were not significant after correction in this dataset.
3.4. Subgroup and Clinical Correlations
Within the β-thalassemia cohort, no significant differences were observed between TDT and NTDT groups in global multivariate structure or in individual metabolites. This lack of separation persisted after considering demographic, clinical, and laboratory covariates provided in Table 1.
4. Discussion
The present study utilized untargeted metabolomic analysis identified a set of significantly up-regulated metabolites that cluster into two biologically coherent groups: (A) phosphatidylcholine (PC)–related species along the glycerophospholipid axis and (B) conjugated bile acids belonging to primary/secondary bile-acid biosynthesis. Together, these findings support a unifying model in β-thalassemia whereby oxidative membrane remodeling of erythrocytes and iron-related hepatobiliary signaling leave distinct, measurable footprints in the serum metabolome.
A. Phosphatidylcholine biosynthesis and remodeling
Several phosphatidylcholines (PCs) and lysophosphatidylcholines (LysoPCs) were significantly elevated in β-thalassemia patients compared to healthy controls.
Phosphatidylcholines. PC(O-14:0/2:0) or 1-Tetradecyl-2-acetyl-sn-glycero-3-phosphocholine PC(0:0/18:1(9E) or 2-oleoyl-sn-glycero-3-phosphocholine, PC(17:2(9Z,12Z)/19:0) or 1,2-diacyl-sn-glycero-3-phosphocholine, PC(20:4(5Z,8Z,11Z,14Z)/18:0) and PC(18:0/20:4(8Z,11Z,14Z,17Z)) are PCs (glycerophospholipids) in which a phosphorylcholine moiety occupies a glycerol substitution site and are intermediates in the metabolic pathway of PCs. PCs and sphingomyelin are the dominant phospholipids of the erythrocyte outer membrane layer, whereas phosphatidylethanolamine and phosphatidylserine (PS) reside largely on the inner layer. This transbilayer asymmetry—maintained by flippases/floppases/scramblases—is essential for RBC deformability and for evading macrophage recognition [19]. In β-thalassemia, excess α-globin chains, labile iron, and elevated intracellular Ca²⁺ promote lipid peroxidation and scramblase activation, causing PS externalization that accelerates splenic clearance and contributes to vascular/thrombotic complications [20]. Furthermore, phosphocholine and phosphatidylcholine catabolism play a key role in ATP production and terminal erythropoiesis and the deregulation of this process may contribute to ineffective erythropoiesis in thalassemia [21].
Lysophosphatidylcholines (LysoPCs). LysoPC(18:1(11Z)) and LysoPC(18:3(9Z,12Z,15Z)) are monoacyl-glycerophospholipids bearing a phosphorylcholine headgroup. In plasma, LPCs arise primarily from PC hydrolysis by lipoprotein-associated phospholipase A₂ (Lp-PLA₂) and from lecithin:cholesterol acyltransferase (LCAT) during cholesterol esterification. Beyond their structural role, LysoPCs function as bioactive lipids: they engage lysophospholipid-responsive pathways, generally upregulating genes involved in cholesterol biosynthesis while suppressing programs of hepatic fatty-acid oxidation, and at elevated concentrations they provoke endothelial dysfunction and oxidative stress. Excess LysoPCs production can reflect increased PLA₂ flux, including Lp-PLA₂ overexpression/activation [22]. Notably, β-thalassemia patients exhibit elevated circulating Lp-PLA₂ activity [23], plausibly driven by monocyte/macrophage activation and heightened lipoprotein/erythrocyte oxidative stress. Together with our data, these observations support a mechanistic model in which erythroid and systemic redox imbalance expands the pool of oxidized PCs; PLA₂ activities (including Lp-PLA₂) cleave these substrates to generate LysoPCs that accumulate in the circulation and, in turn, amplify endothelial and inflammatory signaling.
Arachidonic-acid (AA). We detected enrichment of arachidonic-acid–linked pathways, with AA-related features among the top discriminants. AA is a PUFA esterified predominantly in phosphatidylethanolamine, phosphatidylcholine, and phosphatidylinositol pools of cellular membranes. Upon activation, PLA₂ hydrolyzes the sn-2 ester bond to liberate free AA, which is then converted by cyclooxygenases (COX-1/2), lipoxygenases (5-/12-/15-LOX), and cytochrome P450 epoxygenases into eicosanoids—potent autacoids governing inflammation, vascular tone, platelet function, and leukocyte trafficking [24].
In our cohort, the up-regulation of arachidonic-acid methyl ester and related signals indicates accelerated PUFA turnover and a shift toward pro-inflammatory oxylipin biosynthesis, consistent with elevated oxidative stress and sterile inflammation. These findings align with prior untargeted metabolomics in β-thalassemia that reported broad perturbations in lipid and energy pathways and a chronic pro-inflammatory milieu (9). In thalassemia patiens, chronic hemolysis and iron-driven reactive oxygen species (ROS) production may both increase PLA₂-dependent AA liberation and promote non-enzymatic PUFA peroxidation yielding nonclassic eicosanoids, such as isoprostanes, that further amplify vascular inflammation [23,25]. Although our untargeted approach cannot resolve individual eicosanoids, the combined signatures—elevated LysoPCs, perturbation of PUFA-rich PCs, and pathway enrichment—indicate increased flow of the PLA₂/AA axis.
B. Bile acid biosynthesis
We observed up-regulation of conjugated primary bile acids - glycocholic acid (GCA), glycolchenodeoxyglycocholic acid (GCDCA) and and of the C27 intermediate (25R)-3α,7α-dihydroxy-5β-cholestan-27-oyl taurine alongside the secondary species glycoursodeoxycholic acid (GUDCA). Primary bile acids are synthesized from cholesterol in hepatocytes and conjugated to glycine/taurine before biliary secretion; most are reabsorbed in the ileum, but a fraction undergoes microbial deconjugation and 7α-dehydroxylation/epimerization to form secondary bile acids e.g., ursodeoxycholic acid (UDCA), GUDCA, deoxycholic acid (DCA) [26]. The elevation of bilirubin and primary bile acids in our patients suggests coupled effects of hemolysis-driven heme turnover and hepatic stress. The increased levels of bile acids may have several systemic effects such as deterioration of hemolysis [28].
Functionally, excess bile acids can worsen red-cell fragility and exert system-wide metabolic and immunologic effects via the nuclear receptor FXR (farnesoid X receptor) and TGR5/GPBAR1 (Takeda G protein-coupled receptor 5/G protein-coupled bile acid receptor 1) receptor—pathways that regulate FGF19 (Fibroblast growth factor 19) signaling, lipid and glucose metabolism, energy homeostasis, and macrophage-mediated inflammation [28]. Notably, iron overload has been shown to suppress hepatocellular FXR signaling and disrupt bile-acid homeostasis, increasing circulating biosynthetic intermediates [28]—coherent with our detection of the taurine-conjugated C27 intermediate above.
The presence of GUDCA implicates active microbiome remodeling of the bile-acid pool: UDCA/GUDCA arise from bacterial epimerization of chenodeoxycholic acid followed by hepatic re-conjugation. This aligns with emerging β-thalassemia microbiome–metabolome data linking intestinal bilirubin/stercobilin turnover and specific taxa (e.g., Cupriavidus metallidurans) to anemia severity and hepatic/splenic iron burden [16]. Collectively, these results support a gut–liver axis in β-thalassemia wherein iron-related hepatobiliary signaling and microbiome-driven bile-acid transformations intersect with lipid/oxidative pathways, complementing the membrane-lipid remodeling signature seen elsewhere in our dataset.
5. Conclusions
Untargeted UHPLC–Orbitrap MS metabolomics of β-thalassemia serum samples revealed a dual metabolic signature: (i) disrupted glycerophospholipid metabolism with elevated PC/LysoPC species and (ii) altered bile acid biosynthesis marked by increased conjugated bile acids and a taurine-linked C27 intermediate. These findings suggest that oxidative stress from iron overload and hemolysis drives membrane remodeling and inflammation, while hepatobiliary and gut-derived signals reshape the bile acid pool. Notably, these metabolic alterations were consistent across TD and NTD patients. The results propose potential biomarkers (LysoPCs, AA-derivatives, bile acids) and therapeutic targets (oxidative stress, PLA₂ pathways, FXR/TGR5 signaling, microbiome modulation). Larger longitudinal studies integrating metabolomics with clinical outcomes are needed for biomarker validation and clinical translation.
Limitations of the study include the modest sample size; the wide age range; the potential confounding by transfusion timing, chelation, diet, and microbiota not fully controlled; and the inherent constraints of untargeted annotation. Finally, our cross-sectional design may under-power subgroup contrasts (TDT vs. NTDT) and cannot resolve causality.
Author Contributions
Conceptualization, A.M. and V.S.; methodology, T.P., D.P, E.G. and V.S.; software, E.G., D.P., V,S.; formal analysis, D.P, E.G. and V.S.; data curation, A. M, T.P., E.H. and E.K.; writing—original draft preparation, A.M., E.H. and V.S.; writing—review and editing, A.M., E.H., E.G. and V.S.; supervision, A.M and V.S., X. All authors have read and agreed to the published version of the manuscript.”.
Informed Consent Statement
Informed consent was obtained from all subjects involved in the study.
Data Availability Statement
Dataset available on request from the authors.
Acknowledgments
During the preparation of this manuscript, the authors used ChatGPT5 for the purposes of interpretation of the results and Claude for the preparation of the graphical abstract. The authors have reviewed and edited the output and take full responsibility for the content of this publication.
Conflicts of Interest
The authors declare no conflicts of interest.
Abbreviations
The following abbreviations are used in this manuscript:
| ATP | Adenosine triphosphate |
| ATP | Adenosine triphosphate |
| COX | Cyclooxygenase |
| COX | Cyclooxygenase |
| DCA | Deoxycholic acid |
| DCA | Deoxycholic acid |
| DFP | Deferiprone |
| DFR | Deferasirox |
| DFX | Deferoxamine |
| ESI | Electrospray ion source |
| FC | Fold change |
| FDR | False discovery rate |
| FDR | False Discovery Rate |
| FGF19 | Fibroblast growth factor 19 |
| FTMS | Fourier transform mass spectrometry |
| FWHM | Full width at half maximum |
| FXR | Farnesoid X receptor |
| GC | Gas chromatography |
| GCA | Glycocholic acid |
| GCDCA | Glycolchenodeoxyglycocholic acid |
| GUDCA | Glycoursodeoxycholic acid |
| HRMS | High-resolution mass spectrometry |
| IQR | Interquartile range |
| KNN | k-nearest neighbor |
| LCAT | Lecithin:cholesterol acyltransferase |
| LIC | Liver iron concentration |
| LOOCV | leave-one-out cross-validation |
| LOX | Lipoxygenases |
| Lp-PLA2 | Lipoprotein-associated phospholipase A₂ |
| LTQ | Linear trap quadrupole |
| MRI | Magnetic resonance imaging |
| MS | Mass spectrometry |
| NMR | Nuclear magnetic resonance |
| NTDT | Non-transfusion-dependent thalassemia |
| OPLS-DA | Orthogonal projection to latent structures–discriminant analysis |
| PC | Phosphatidylcholine |
| PCA | Principal Component Analysis |
| PLA | Phospholipase |
| PLS-DA | Partial Least Square-Discriminant Analysis |
| PS | Phosphatidylserine |
| PUFA | Polyunsaturated fatty acid |
| QC | Quality control |
| ROS | Reactive oxygen species |
| TDT | Transfusion-dependent thalassemia |
| TGR5/GPBAR1 | Takeda G protein-coupled receptor 5/G protein-coupled bile acid receptor 1 |
| UDCA | Ursodeoxycholic acid |
| UHPLC | Ultrahigh-performance liquid chromatography |
| USA | United States of America |
| UV | Unit variance |
| VIP | Variable Importance in Projection |
References
- Taher, A.T.; Musallam, K.M.; Cappellini, M.D. β-Thalassemias. N Engl J Med. 2021, 384, 727–743. [Google Scholar] [CrossRef]
- Kattamis, A.; Kwiatkowski, J.L.; Aydinok, Y. Thalassaemia. Lancet 2022, 399(10343), 2310–2324. [Google Scholar] [CrossRef]
- Chaliasos, N.; Challa, A.; Hatzimichael, E.; Koutsouka, F.; Bourantas, D.K.; Vlahos, A.P.; Siamopoulou, A.; Bourantas, K.L.; Makis, A. Serum adipocytokine and vascular inflammation marker levels in Beta-thalassaemia major patients. Acta Haematol. 2010, 124(4), 191–196. [Google Scholar] [CrossRef] [PubMed]
- Makis, A; Voskaridou, E.; Papassotiriou, I.; Hatzimichael, E. Novel Therapeutic Advances in beta-Thalassemia. Biology (Basel) 2021, 10(6). [Google Scholar]
- Trivedi, D.K.; Hollywood, K.A.; Goodacre, R. Metabolomics for the masses: The future of metabolomics in a personalized world. New Horiz Transl Med. 2017, 3(6), 294–305. [Google Scholar] [CrossRef]
- Katsantoni, E. Omics Studies in Hemoglobinopathies. Mol Diagn Ther. 2019, 23(2), 223–234. [Google Scholar] [CrossRef]
- Capolongo, G.; Zacchia, M.; Beneduci, A.; Costantini, S.; Cinque, P.; Spasiano, A.; De Luca, G.; Di Pietro, M.E.; Ricchi, P.; Trepiccione, F.; Capasso, G.; Filosa, A. Urinary Metabolic Profile of Patients with Transfusion-Dependent beta-Thalassemia Major Undergoing Deferasirox Therapy. Kidney Blood Press Res. 2020, 45(3), 455–466. [Google Scholar] [CrossRef] [PubMed]
- Sayani, F.; Zhang, Y.; Abdolmohammadi, N.; Lauf, A.M.; Evans, P.; Porter, J.B; Weljie, A.M. Metabolomic Biomarkers As Predictors of Iron Load and Oxidative Damage in Iron Overloaded Thalassemia Patients. Blood 2012, 120(21), 3265–3265. [Google Scholar] [CrossRef]
- Musharraf, S.G.; Iqbal, A.; Ansari, S.H.; Parveen, S.; Khan, I.A.; Siddiqui, A.J. beta-Thalassemia Patients Revealed a Significant Change of Untargeted Metabolites in Comparison to Healthy Individuals. Sci Rep. 2017, 7, 42249. [Google Scholar] [CrossRef]
- Iqbal, A; Ansari, S.H.; Parveen, S.; Khan, I.A.; Siddiqui, A.J.; Musharraf, S.G. Hydroxyurea Treated beta-Thalassemia Children Demonstrate a Shift in Metabolism Towards Healthy Pattern. Sci Rep. 2018, 8(1), 15152. [Google Scholar] [CrossRef]
- Monni, G.; Murgia, F.; Corda, V.; Peddes, C.; Iuculano, A.; Tronci, L.; Balsamo, A.; Atzori, L. Metabolomic Investigation of beta-Thalassemia in Chorionic Villi Samples. J Clin Med. 2019, 8(6). [Google Scholar] [CrossRef]
- Lisk, C.; Cendali, F.; Setua, S.; Thangaraju, K.; Pak, D.I.; Swindle, D.; Dzieciatkowska, M.; Gamboni, F.; Hassell, K.; Nuss, R.; George, G.; Davizon-Castillo, P.; Buehler, P.W.; D’Alessandro, A.; Irwin, D.C. Metabolic and Proteomic Divergence Is Present in Circulating Monocytes and Tissue-Resident Macrophages from Berkeley Sickle Cell Anemia and beta-Thalassemia Mice. J Proteome Res. 2023, 22(9), 2925–2935. [Google Scholar] [CrossRef]
- Xion, H.; Zhang, C.; Han, L.; Xu, T.; Saeed, K.; Han, J.; Liu, J.; Klaassen, C.D.; Gonzalez, F.J.; Lu, Y.; Zhang, Y. Suppressed farnesoid X receptor by iron overload in mice and humans potentiates iron-induced hepatotoxicity. Hepatology 2022, 76(2), 387–403. [Google Scholar] [CrossRef] [PubMed]
- Rana, N.K.; Lisk, C.; Cendali, F.; Lucero, M.J.; Grier, A.; Setua, S.; Thangaraju, K.; Khan, A.; Reisz, J.A; Dzieciatkowska, M.; Pak, D.I.; Swindle, D.; Danaher, M.X.; Khan, S.; Westover, N.; Carter, M.; Hassell, K.; Nuss, R.; George, G.; Buehler, P.W.; D’Alessandro, A.; Irwin, D.C. Metabolic and proteomic divergence is present in spleens and livers from Berkeley SCD and β-thalassemia mice. J Proteome Res. 2025, 24(4), ePub, ahead of print. [Google Scholar] [CrossRef] [PubMed]
- Theocharaki, K.; Anastasiadi, A.T.; Delicou, S.; Tzounakas, V.L; Barla, I.; Rouvela, S.; Kazolia, E; Tzafa, G.; Mpekoulis, G.; Gousdovas, T.; Pavlou, E.; Kostopoulos, I.V.; Velentzas, A.D.; Simantiris, N.; Xydaki, A.; Vassilaki, N.; Voskaridou, E.; Aggeli, I.K.; Nomikou, E.; Tsitsilonis, O.; Papageorgiou, E.; Thomaidis, N.; Gikas, E.; Politou, M.; Komninaka, V.; Antonelou, M.H. Cellular and biochemical heterogeneity contributes to phenotypic diversity of transfusion-dependent β-thalassemia. Blood Adv. 2025, 9(11), 2818–2835. [Google Scholar] [CrossRef]
- Guo, X.; Lin, S.; Zhang, X.; Li, M.; Wang, Z.; Peng, Y.; He, X.; Liu, J. Integrated metabolomic and microbiome analysis identifies Cupriavidus metallidurans as a potential therapeutic target for β-thalassemia. Ann Hematol. 2024, 103(12), 5169–5179. [Google Scholar] [CrossRef]
- Available online: https://www.metaboanalyst.ca/MetaboAnalyst/ModuleView.xhtml (accessed on 22/11/2025).
- Xia, J.; Psychogios, N.; Young, N.; Wishart, D.S. MetaboAnalyst: a web server for metabolomic data analysis and interpretation. Nucleic Acids Res 2009, 37(Web Server issue), W652–60. [Google Scholar] [CrossRef] [PubMed]
- Mohandas, N.; Gallagher, P.G. Red cell membrane: past, present, and future Blood. 2008, 112(10), 3939–48. [Google Scholar] [CrossRef]
- Borenstain-Ben Yashar, V.; Barenholz, Y.; Hy-Am, E.; Rachmilewitz, E.A; Eldor, A. Phosphatidylserine in the outer leaflet of red blood cells from beta-thalassemia patients may explain the chronic hypercoagulable state and thrombotic episodes. Am J Hematol 1993, 44(1), 63–5. [Google Scholar] [CrossRef]
- Huang, N.J.; Lin, Y.C.; Lin, C.Y; Pishesha, N.; Lewis, C.A; Freinkman, E.; Farquharson, C.; Millán, J.L.; Lodish, H. Enhanced phosphocholine metabolism is essential for terminal erythropoiesis. Blood 2018, 131(26), 2955–2966. [Google Scholar] [CrossRef]
- Law, S.H.; Chan, M.L; Marathe, G.K.; Parveen, F.; Chen, C.H; Ke, L.Y. An Updated Review of Lysophosphatidylcholine Metabolism in Human Diseases. Int J Mol Sci 2019, 20(5), 1149. [Google Scholar] [CrossRef]
- Tselepis, A.D.; Hahalis, G.; Tellis, C.C.; Papavasiliou, E.C; Mylona, P.T.; Kourakli, A.; Alexopoulos, D.C. Plasma levels of lipoprotein-associated phospholipase A₂ are increased in β-thalassemia. J Lipid Res. 2010, 51, 3331–3341. [Google Scholar] [CrossRef]
- Zhang, Y.; Liu, Y.; Sun, J.; Zhang, W.; Guo, Z.; Ma, Q. MedComm (2020). 2023, 4, e363. [Google Scholar]
- Matayatsuk, C.; Lee, C.Y.J.; Kalpravidh, R.W.; Sirankapracha, P.; Wilairat, P.; Fucharoen, S.; Halliwell, B. Elevated F2-isoprostanes in thalassemic patients. Free Radic Biol Med 2007, 43(12), 1649–5. [Google Scholar] [CrossRef] [PubMed]
- Di Ciaula, A.; Garruti, G.; Baccetto, R.L.; Molina-Molina, E.; Bonfrate, L.; Wang, D.Q.H.; Portincasa, P. Bile Acid Physiology. Ann Hepatol 2017, 16 (Suppl. 1: s3-105.), s4-s14. [Google Scholar] [CrossRef] [PubMed]
- Lang, E.; Pozdeev, V.I; Gatidis, S.; Qadri, S.M.; Häussinger, D.; Kubitz, R.; Herebian, D.; Mayatepek, E.; Lang, F.; Lang, K.S; Lang, P.A. Bile Acid-Induced Suicidal Erythrocyte Death. Cell Physiol Biochem. 2016, 38(4), 1500–9. [Google Scholar] [CrossRef] [PubMed]
- Xiong, H.; Zhang, C.; Han, L.; Xu, T.; Saeed, K.; Han, J.; Liu, J.; Klaassen, C.D.; Gonzalez, F.J.; Lu, Y.; Zhang, Y. Suppressed farnesoid X receptor by iron overload in mice and humans potentiates iron-induced hepatotoxicity. Hepatology 2022, 76(2), 387–403. [Google Scholar] [CrossRef]
Figure 1.
This is a figure. Schemes follow the same formatting.
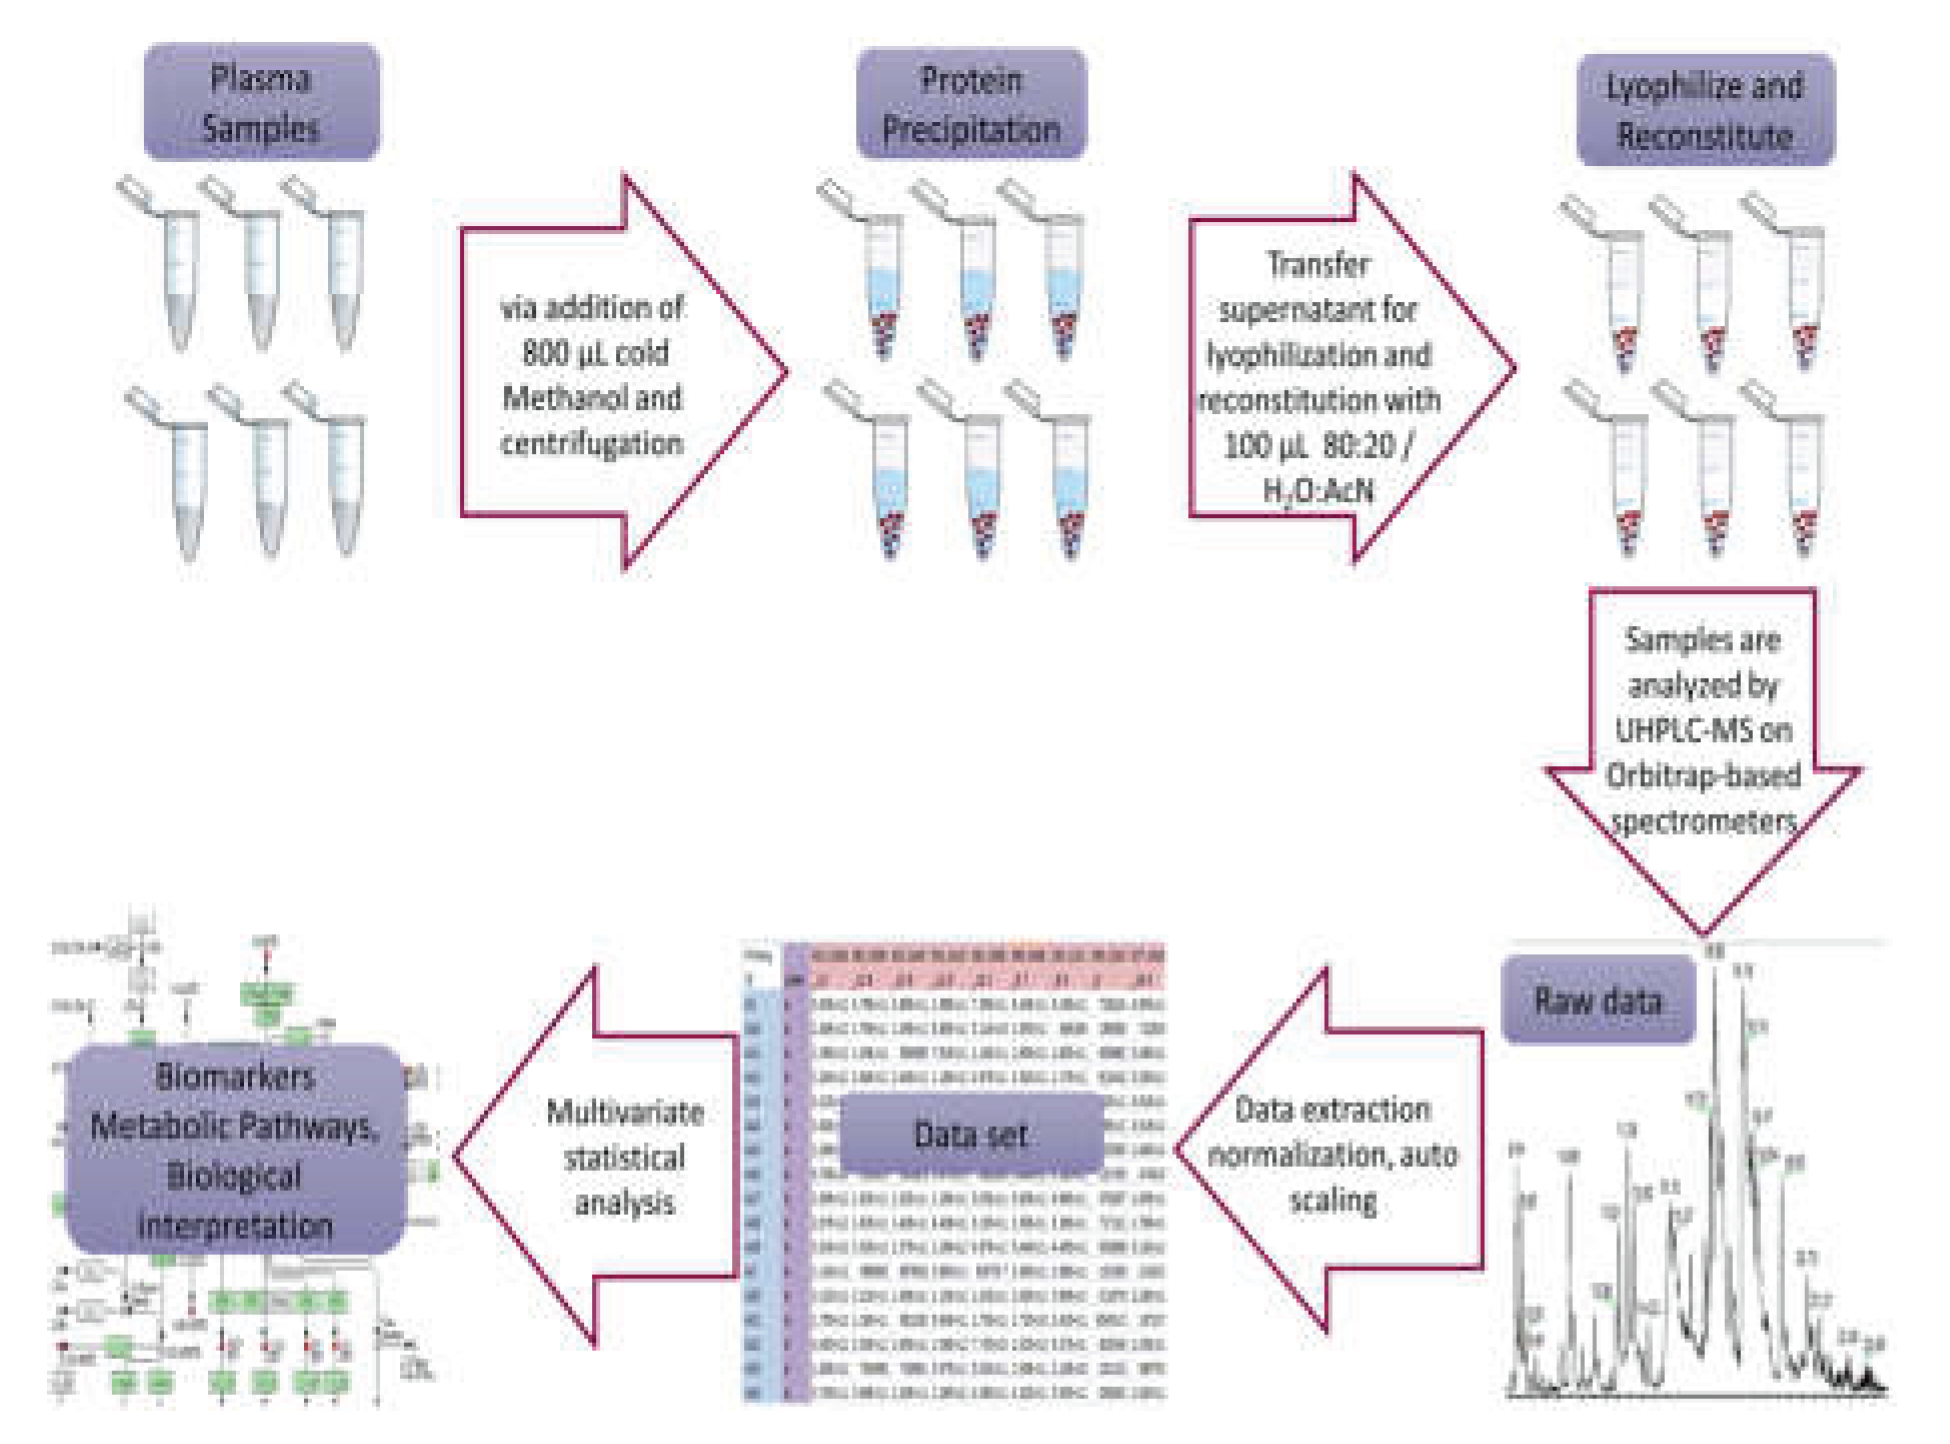
Figure 2.
(a) PCA, (. PLS-DA and (c) OPLS-DA score plots for UHPLC-MS serum analysis in Positive Ionization ESI (+) between controls (Y, red) and patients (A, green).
Figure 2.
(a) PCA, (. PLS-DA and (c) OPLS-DA score plots for UHPLC-MS serum analysis in Positive Ionization ESI (+) between controls (Y, red) and patients (A, green).
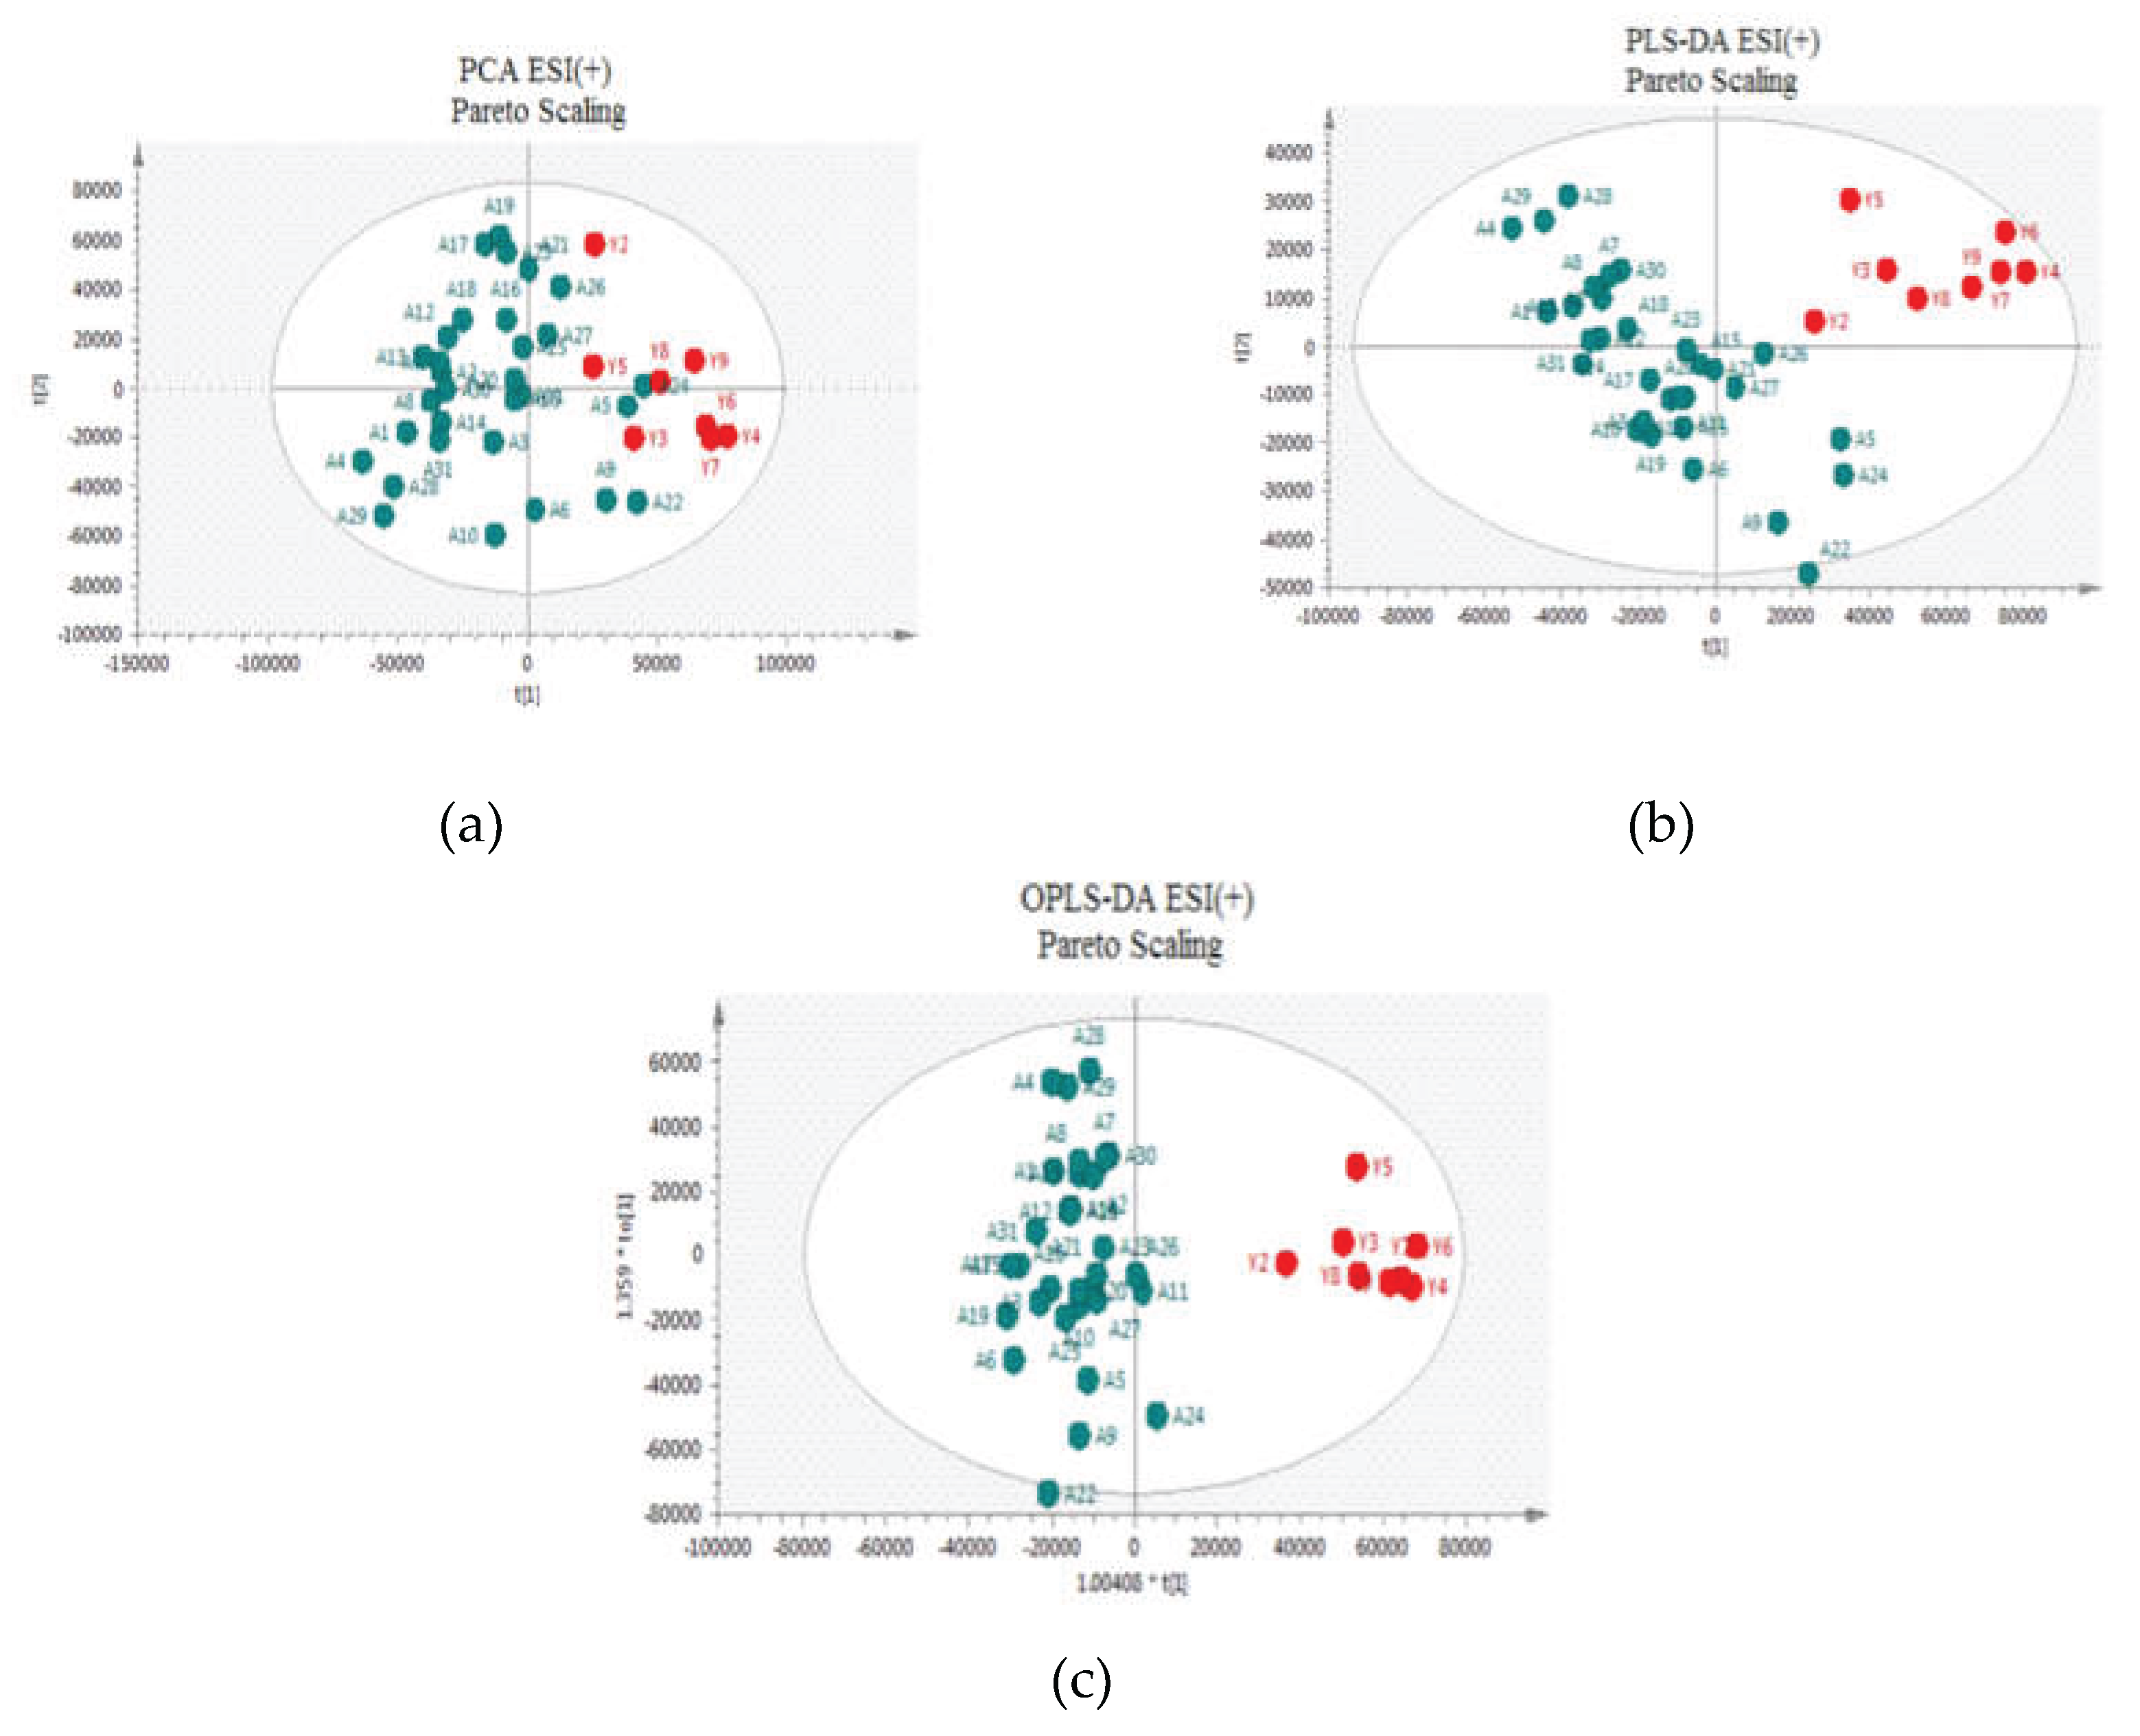
Figure 3.
(a) PCA, (b) PLS-DA and (c) OPLS-DA score plots for UHPLC-MS serum analysis in Negative Ionization ESI (-) between controls (Y, red) and patients (A, green).
Figure 3.
(a) PCA, (b) PLS-DA and (c) OPLS-DA score plots for UHPLC-MS serum analysis in Negative Ionization ESI (-) between controls (Y, red) and patients (A, green).
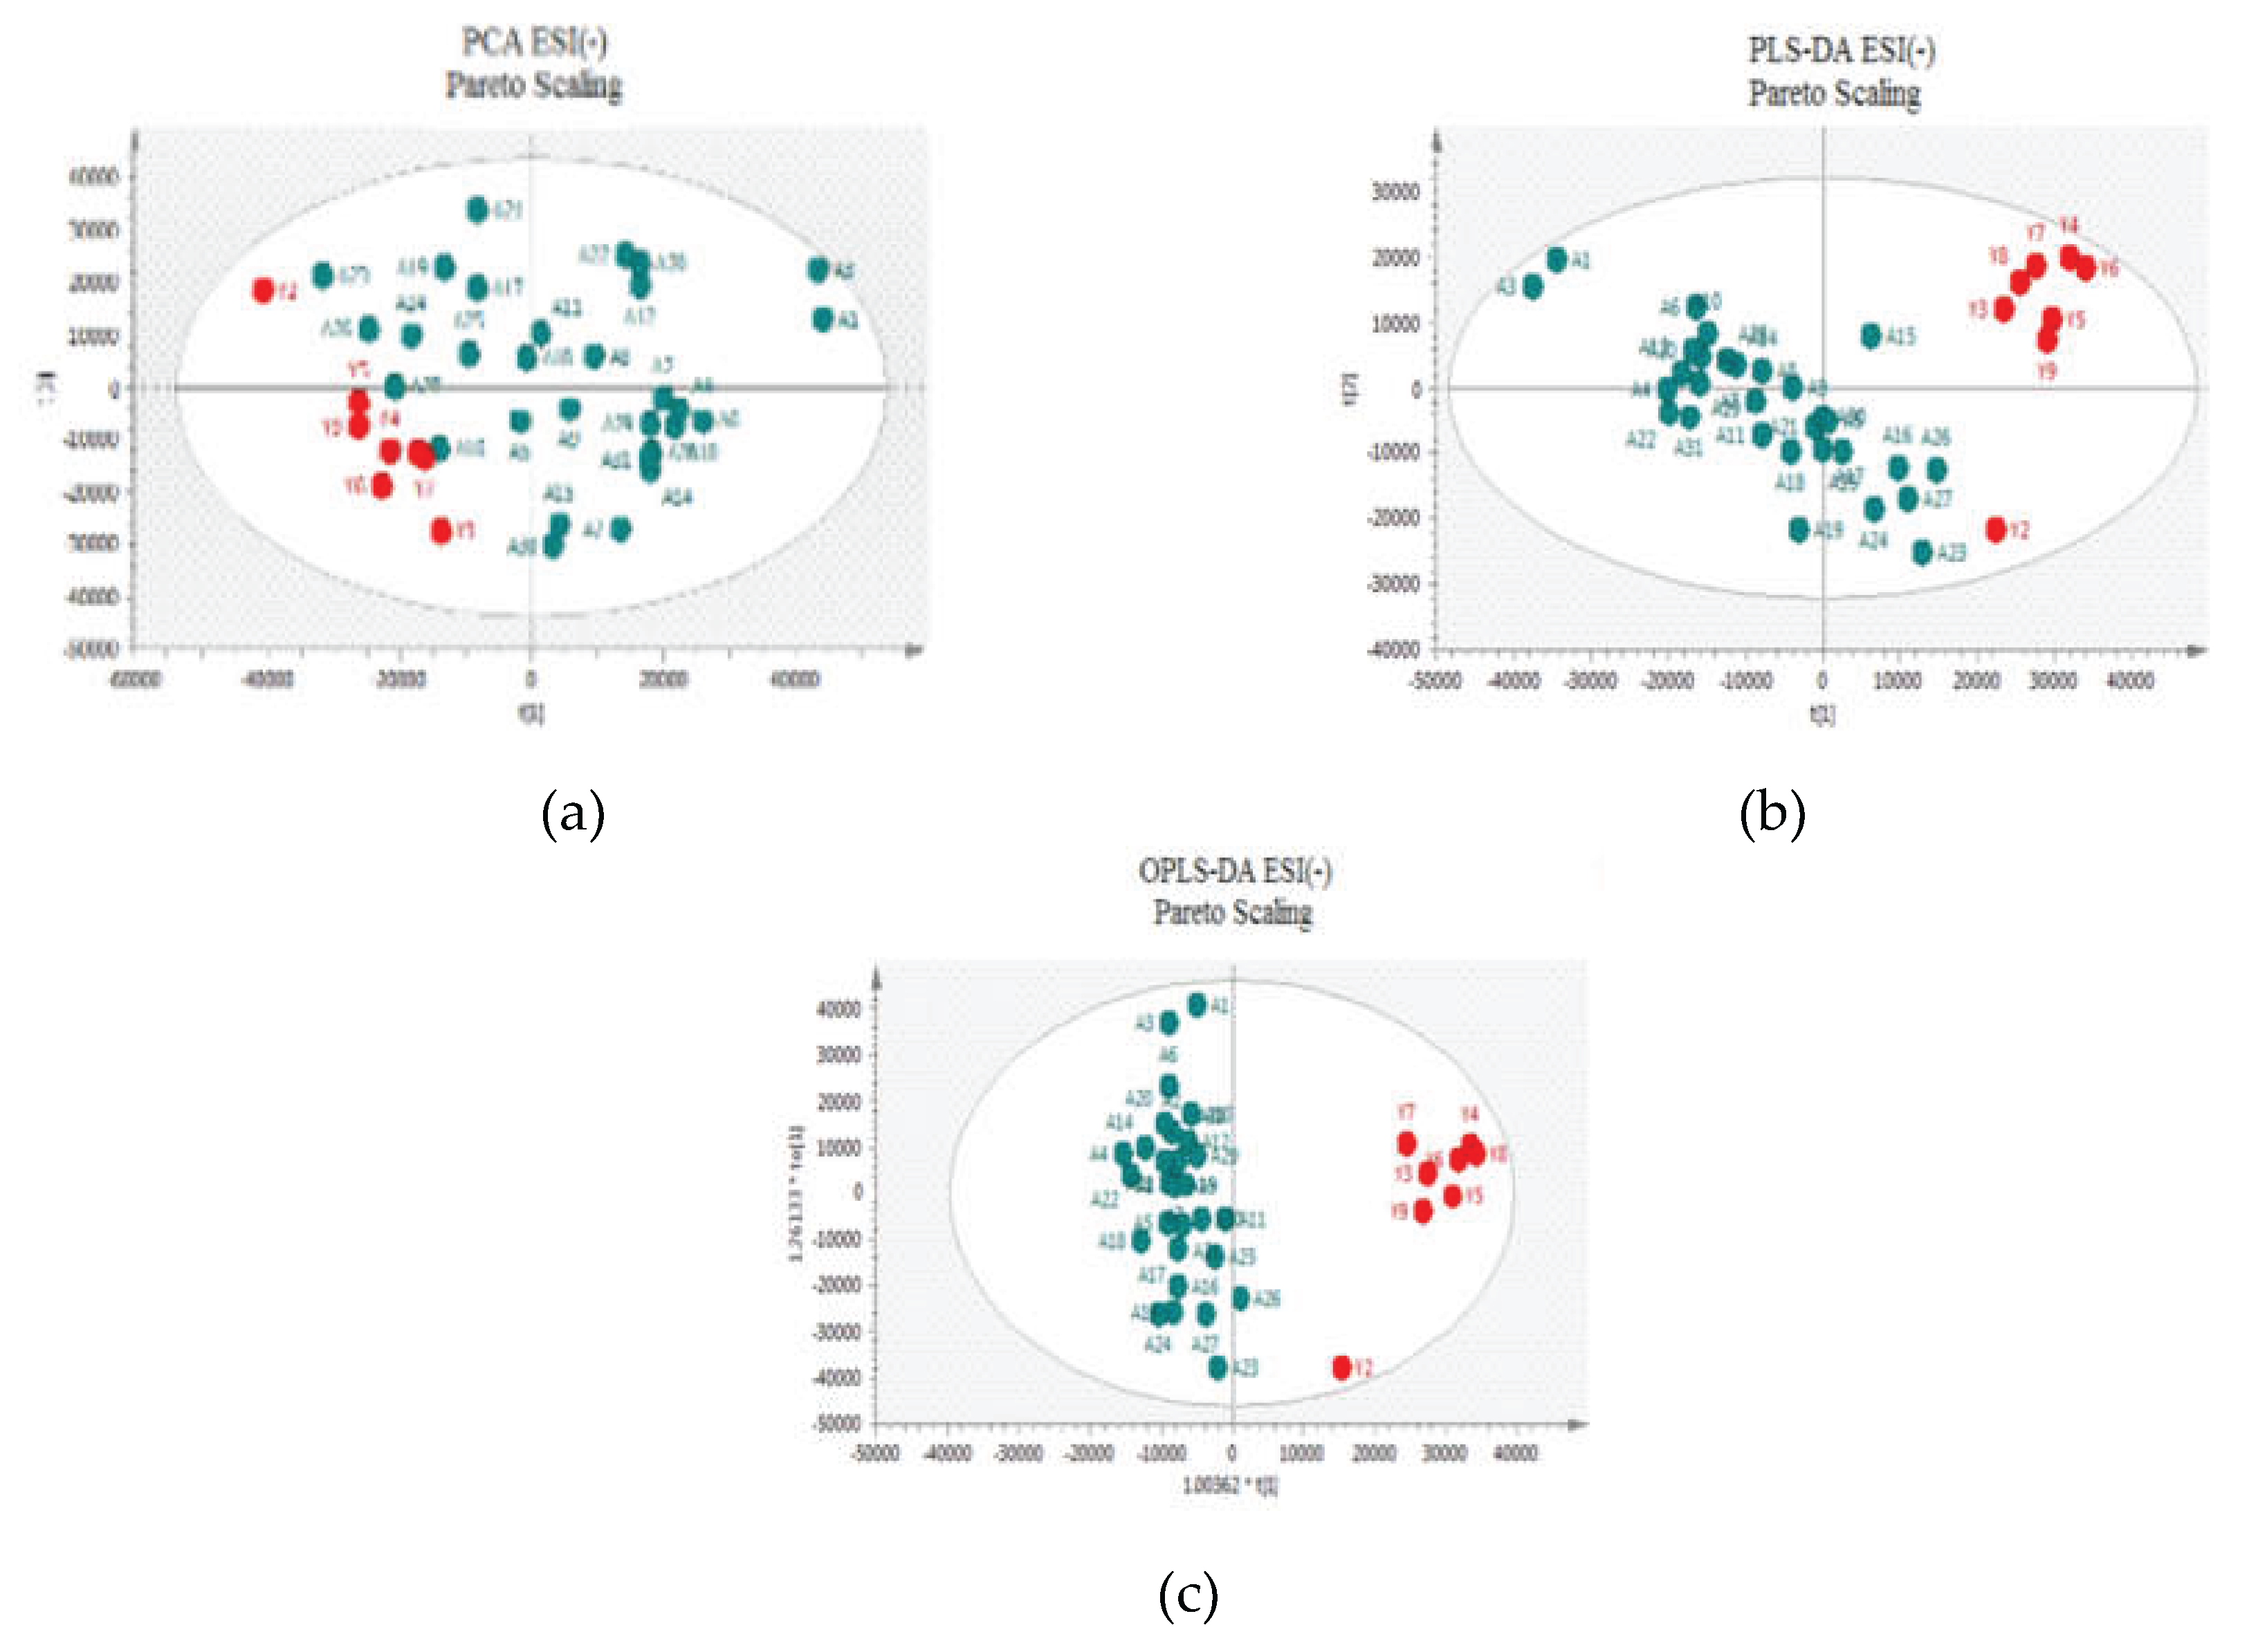
Figure 4.
The VIP-plot and S-plot in positive (Figure 4a,b) and negative (Figure 4c,d) (a) VIP-plot and (b) S-plot of OPLS-DA. In the VIP-plot the variables are ranked from the most statistically significant to the least. In the S-plot the features positioned at the extremes, farthest from the central cluster, display substantial variation and consistency, thereby holding significant importance when searching for potential biomarkers (characteristics in the lower left quadrant belong to the patients, while those in the upper right quadrant belong to the healthy individuals).
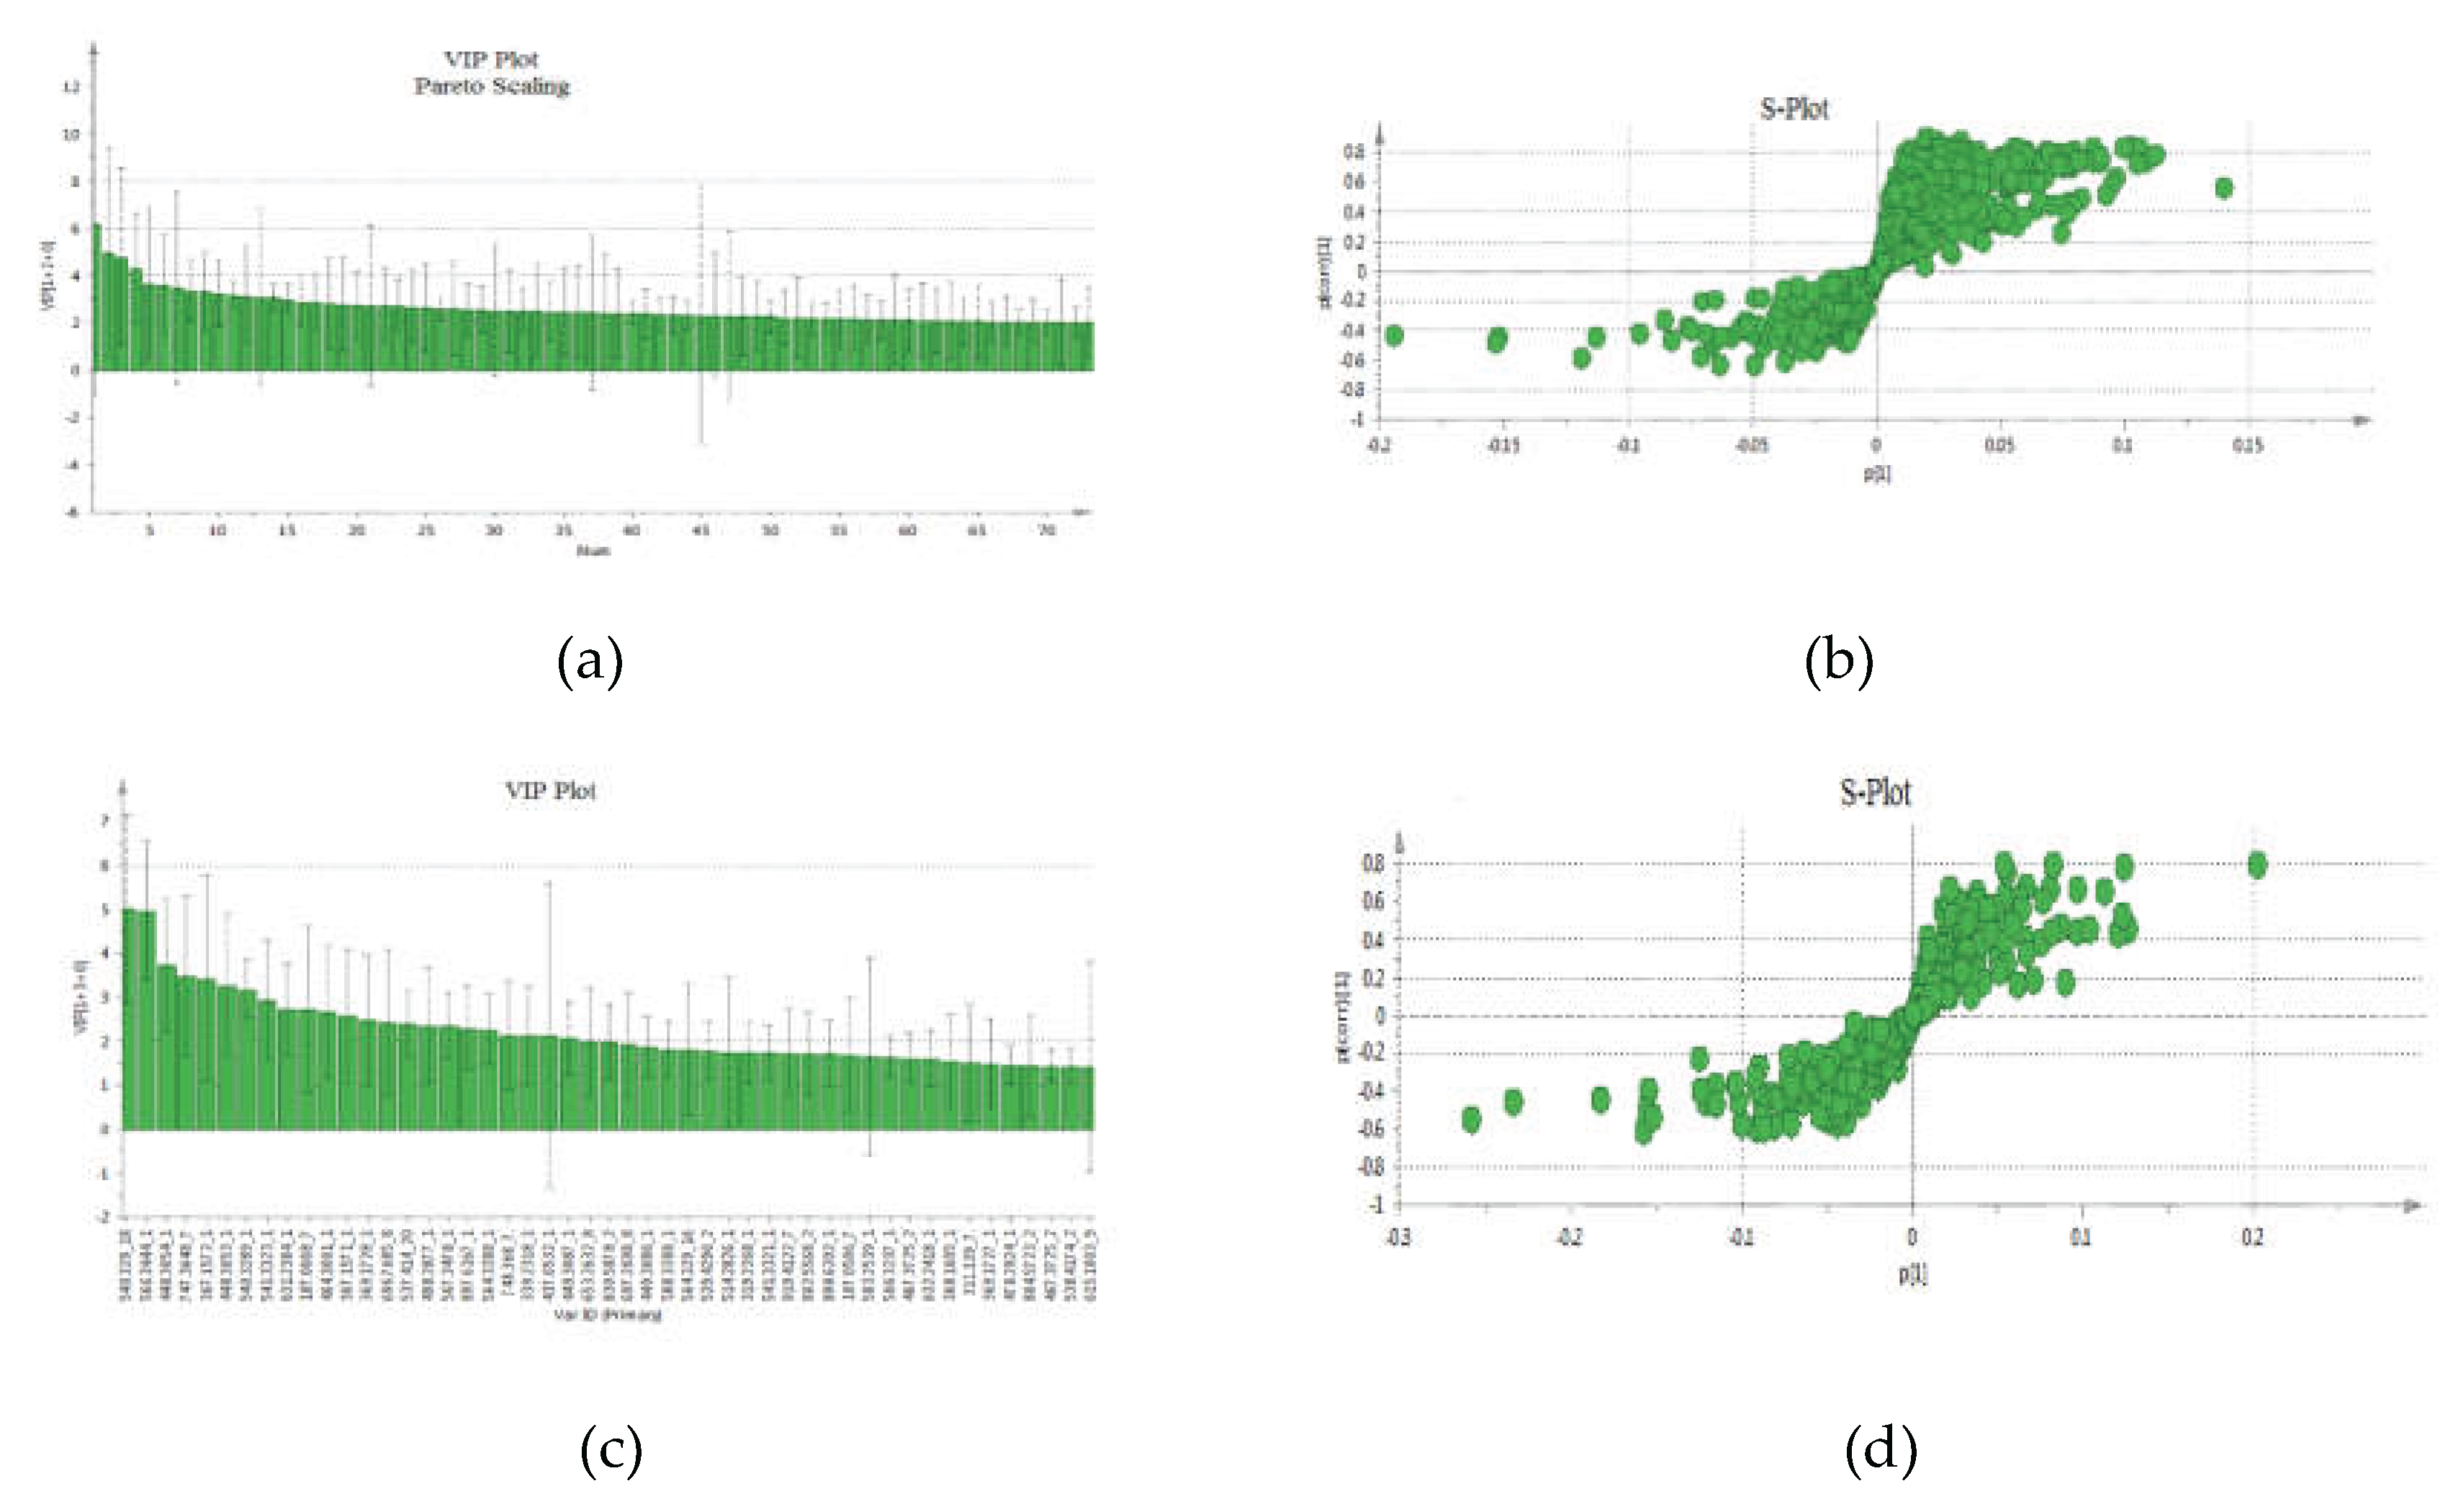
Figure 5.
Heatmap representation of significant differences between patients (red) and controls (green).
Figure 5.
Heatmap representation of significant differences between patients (red) and controls (green).
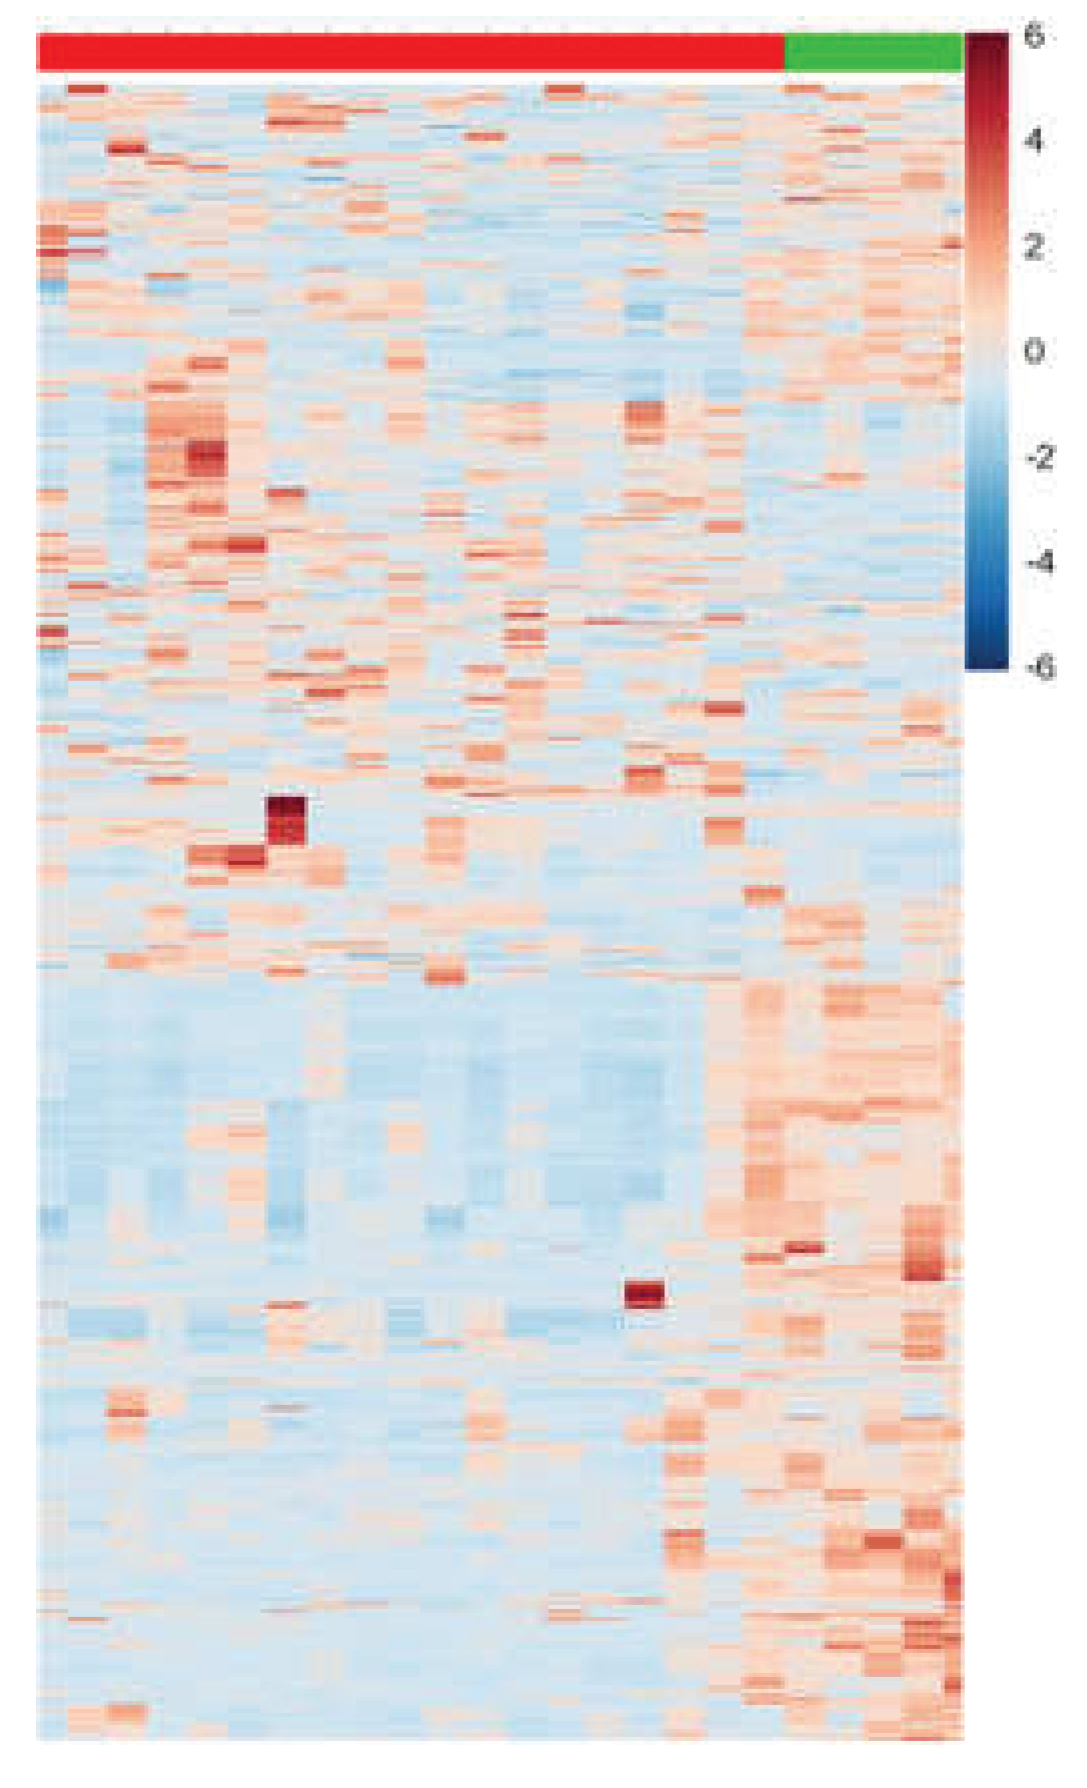
Figure 6.
KEGG pathway analysis (MetaboAnalyst) [–log10(p) vs pathway impact; bubble size = hits. Significant after FDR: linoleic acid (q = 0.0245, impact = 1.000) and arachidonic acid (q = 0.0220, impact = 0.433). Glycerophospholipid and porphyrin nominal only].
Figure 6.
KEGG pathway analysis (MetaboAnalyst) [–log10(p) vs pathway impact; bubble size = hits. Significant after FDR: linoleic acid (q = 0.0245, impact = 1.000) and arachidonic acid (q = 0.0220, impact = 0.433). Glycerophospholipid and porphyrin nominal only].
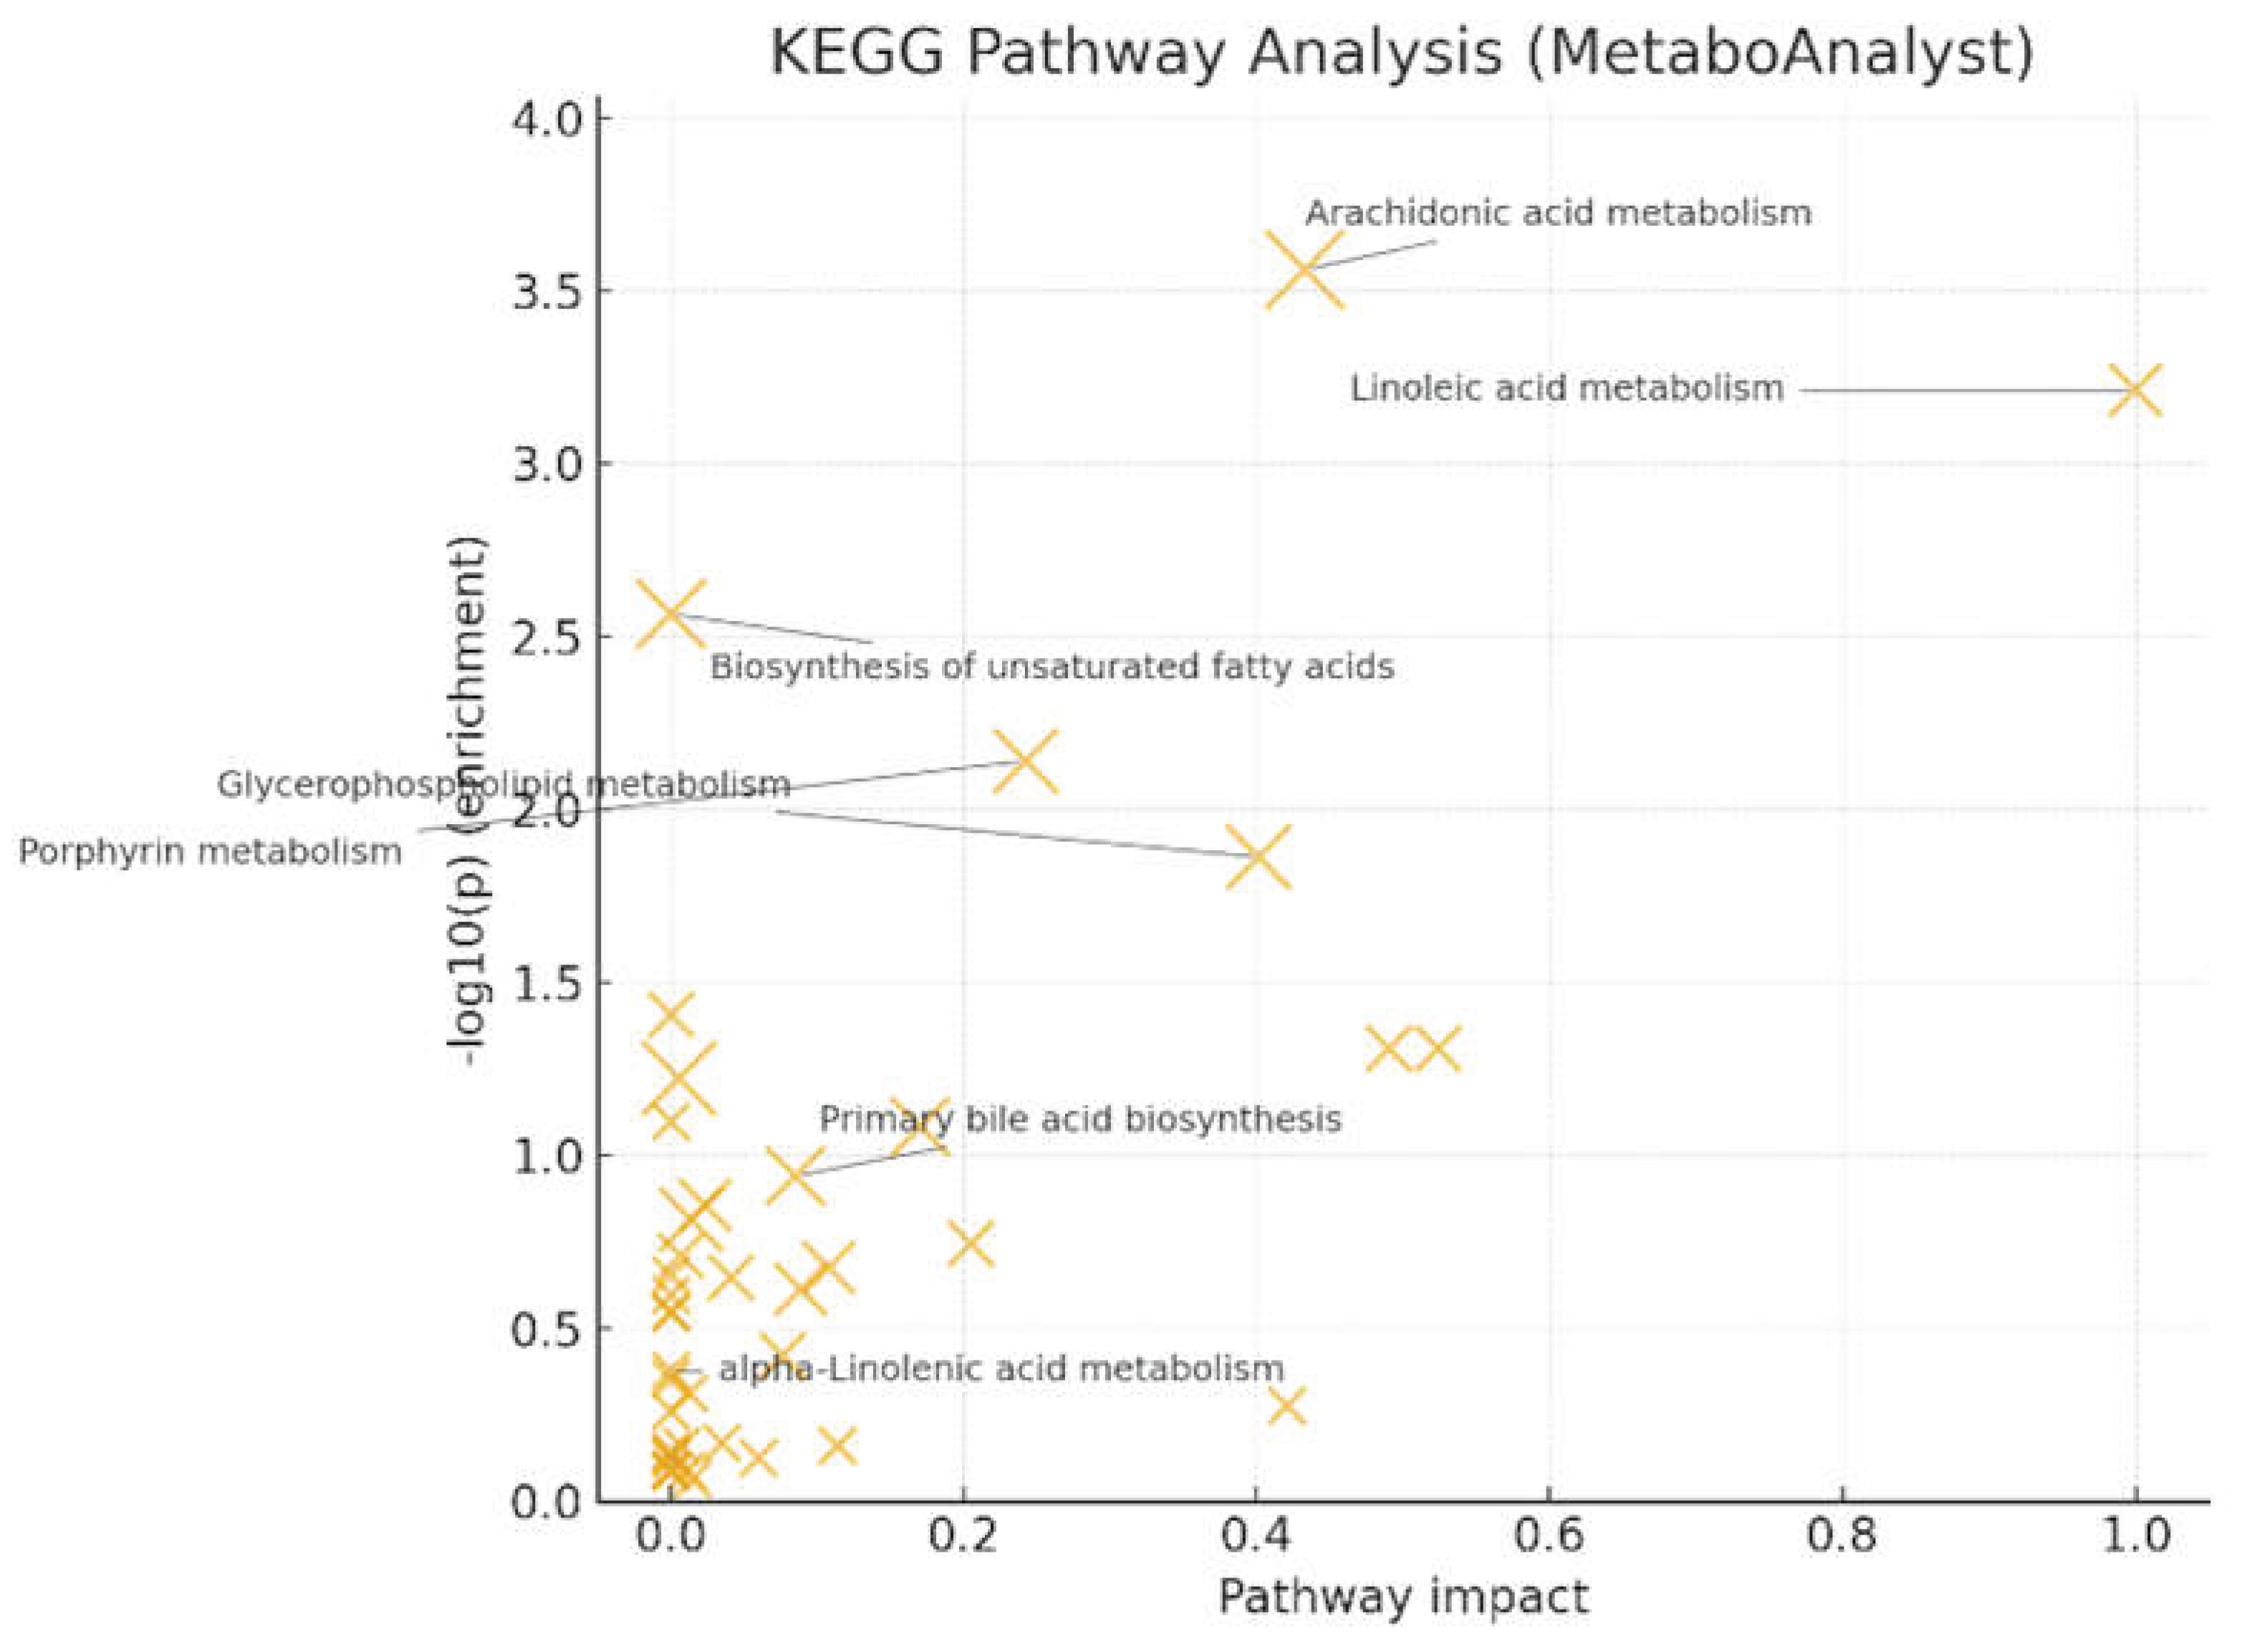

Table 1.
Demographic, clinical and laboratory data from 31 thalassemia patients.
| Patient number | Age | Gender | Type of thalassemia | Ferritin, (μg/L) | Iron chelator |
LIC (mg Fe/g dry weight) |
Heart MRI T2* (msec) |
| 1 | 18 | F | NTD | 1250 | DFR | 4.2 | 30.1 |
| 2 | 32 | M | NTD | 780 | DFR | 4.1 | 29.2 |
| 3 | 21 | M | NTD | 1406 | DFR | 4.9 | 30.4 |
| 4 | 49 | M | NTD | 460 | DFX + DFP | 3.1 | 21.1 |
| 5 | 13 | F | NTD | 777 | DFP | 3.9 | 28.8 |
| 6 | 62 | M | NTD | 377 | DFR | 3.9 | 38.6 |
| 7 | 43 | F | NTD | 2036 | DFX + DFP | 6.1 | 13.8 |
| 8 | 47 | F | NTD | 648 | DFR | 4.7 | 31.3 |
| 9 | 13 | M | NTD | 199 | No | 2.8 | 35.2 |
| 10 | 17 | M | NTD | 172 | No | 3.8 | 37.7 |
| 11 | 15 | M | NTD | 277 | No | 2.9 | 31.7 |
| 12 | 67 | M | NTD | 646 | DFR | 4.5 | 23.2 |
| 13 | 50 | M | NTD | 284 | DFX + DFP | 3.9 | 34.8 |
| 14 | 49 | M | TD | 230 | DFX + DFP | 2.8 | 26.8 |
| 15 | 12 | F | TD | 2167 | DFR | 6.2 | 23.1 |
| 16 | 13 | F | TD | 2740 | DFR | 5.4 | 23.7 |
| 17 | 66 | F | TD | 1469 | DFR | 4.4 | 19.1 |
| 18 | 25 | F | TD | 1020 | DFR | 5.6 | 19.5 |
| 19 | 34 | F | TD | 280 | DFR | 2.9 | 31.8 |
| 20 | 28 | F | TD | 5713 | DFP | 6.9 | 38.3 |
| 21 | 43 | F | TD | 801 | DFR | 4.9 | 31.0 |
| 22 | 39 | F | TD | 726 | DFP | 3.6 | 33.8 |
| 23 | 33 | M | TD | 479 | DFP | 3.8 | 29.4 |
| 24 | 28 | M | TD | 418 | DFP | 4.8 | 27.6 |
| 25 | 45 | F | TD | 701 | DFR | 4.9 | 36.0 |
| 26 | 63 | F | TD | 266 | DFP | 3.2 | 26.6 |
| 27 | 50 | F | TD | 1240 | DFP | 4.0 | 30.4 |
| 28 | 36 | M | TD | 1066 | DFR | 5.1 | 34.2 |
| 29 | 39 | M | TD | 266 | DFR | 3.3 | 37.2 |
| 30 | 36 | F | TD | 995 | DFR | 4.9 | 32.8 |
| 31 | 39 | F | TD | 296 | DFR | 3.0 | 36.9 |
LIC=liver iron concentration, DFP=Deferiprone, DFR=Deferasirox, DFX=Deferoxamine.
Table 2.
List of the most significant up-regulated metabolites in β-thalassemia patients in comparison to healthy controls.
Table 2.
List of the most significant up-regulated metabolites in β-thalassemia patients in comparison to healthy controls.
| mz RT | VIP value | P value | Identification |
|---|---|---|---|
| 496.3388_18.1 | 618.569 | 0.0021 | PC(O-14:0/2:0)[U] |
| 540.329_18.1 | 501.372 | 0.0072 | (25R)-3alpha,7alpha…-oyl taurine |
| 991.6709_18.1 | 497.706 | 0.0001 | PC(0:0/18:1(9E)) |
| 566.3444_18.7 | 496.688 | 0.0015 | unidentified |
| 522.3544_18.6 | 480.667 | 0.0011 | LysoPC(18:1(11Z)) |
| 786.6001_19.9 | 431.837 | 0.0037 | PC(17:2(9Z,12Z)/19:0) |
| 448.3054_13.4 | 373.599 | 0.0042 | Glycoursodeoxycholic acid |
| 633.2547_12.9 | 364.633 | 0.0014 | BQ 518 |
| 448.3053_13.7 | 327.565 | 0.0011 | unidentified |
| 540.3289_17.6 | 318.967 | 0.0001 | unidentified |
| 585.2696_11 | 317.973 | 0.0001 | Bilirubin |
| 810.6_20 | 279.483 | 0.0122 | PC(20:4(5Z,8Z,11Z,14Z)/18:0) |
| 631.2384_13 | 272.556 | 0.0008 | unidentified |
| 464.3001_12 | 267.582 | 0.0021 | Glycocholic acid |
| 831.6408_10.1 | 266.528 | 0.0310 | PC(18:0/20:4(8Z,11Z,14Z,17Z)) |
| 537.414_20.7 | 252.404 | 0.0001 | Plerixafor |
| 498.2877_14.4 | 236.346 | 0.0019 | LysoPC(18:3(9Z,12Z,15Z)) |
| 567.3478_18.7 | 235.863 | 0.0009 | unidentified |
| 897.6167_13.4 | 230.278 | 0.0003 | Chenodeoxyglycocholic acid |
| 339.2318_19.7 | 214.343 | 0.0020 | Arachidonic Acid methyl ester |
m/z= mass-to-charge ratio, RT=retention time, VIP= Variable importance in projection, PC= Phosphatidylcholine, LysoPC= lysophosphatidylcholine.
Disclaimer/Publisher’s Note: The statements, opinions and data contained in all publications are solely those of the individual author(s) and contributor(s) and not of MDPI and/or the editor(s). MDPI and/or the editor(s) disclaim responsibility for any injury to people or property resulting from any ideas, methods, instructions or products referred to in the content. |
© 2026 by the authors. Licensee MDPI, Basel, Switzerland. This article is an open access article distributed under the terms and conditions of the Creative Commons Attribution (CC BY) license (http://creativecommons.org/licenses/by/4.0/).
Copyright: This open access article is published under a Creative Commons CC BY 4.0 license, which permit the free download, distribution, and reuse, provided that the author and preprint are cited in any reuse.


