
Submitted:
30 October 2025
Posted:
04 November 2025
You are already at the latest version
Abstract
: Thalassemia is an inherited hematologic disorder characterized by abnormal or reduced synthesis of hemoglobin chains, leading to ineffective erythropoiesis and anemia. It can be classified into two main genetic types—α-thalassemia and β-thalassemia—depending on whether the α- or β-globin gene is affected. Infrared (IR) Microspectroscopy has emerged as a powerful, label-free analytical tool for biomedical and clinical applications, providing molecular fingerprints that reflect biochemical alterations associated with various disease states. In this study, IR Microspectroscopy was combined with multivariate statistical techniques, including Principal Component Analysis (PCA) and Partial Least Squares Discriminant Analysis (PLS-DA), to characterize and classify thalassemia blood samples into normal, carrier, and disease groups. Blood samples were obtained from patients diagnosed with various types of thalassemia. This technique offers several advantages: it is non-destructive, reagent-free, and highly sensitive, enabling comprehensive analysis of the biochemical composition of biological samples. The classification models developed in this study demonstrated specificity and sensitivity values ranging from 80–90%, indicating strong diagnostic performance. In the future, the integration of advanced machine learning algorithms with IR Microspectroscopy is expected to enhance early diagnosis of thalassemia, facilitate accurate risk stratification, and support more effective strategies for disease prevention and management.
Keywords:
Thalassemia
; Infrared microspectroscopy
; blood samples
1. Introduction
Thalassemia is an inherited hematologic disorder caused by defects in the synthesis of globin chains, which are protein components of hemoglobin responsible for transporting oxygen to various tissues throughout the body [2,18,53]. This disease is transmitted in an autosomal recessive manner and is highly prevalent in Thailand. It can be divided into two main groups: the Disease group, consisting of patients with thalassemia, and the Carrier group, comprising individuals who carry the thalassemia gene without symptoms. Each group exhibits different levels of disease severity and clinical characteristics [6]. In severe cases within the Disease group, affected fetuses may die in utero or shortly after birth. In moderate and mild forms, patients often present mild anemia and slight hepatosplenomegaly, which become more pronounced during febrile episodes. Meanwhile, individuals in the Carrier group are typically healthy and asymptomatic, but they can transmit the thalassemia gene to their offspring.
In Thailand, the combined prevalence of the Disease group and Carrier group reaches up to 40% of the tested population, representing a major public health burden. Currently, thalassemia screening is primarily conducted among married couples; however, the testing process remains expensive and time-consuming. Developing more efficient and accessible diagnostic methods is therefore crucial for improving national healthcare services [18,52,54].
This study aims to establish a practical, accessible, and cost-effective diagnostic approach for thalassemia screening by identifying and classifying biochemical alterations in blood-derived hemoglobin lysate samples among normal, carrier, and disease groups using infrared (IR) Microspectroscopy. This vibrational spectroscopic technique provides a unique molecular fingerprint that reflects the chemical composition and structural organization of biomolecules such as proteins, lipids, and nucleic acids.IR Microspectroscopy offers several advantages—it is non-destructive, label-free, inexpensive, rapid, and requires minimal sample preparation without chemical reagents. The acquired spectral data will be statistically analyzed and processed using artificial intelligence (AI) and multivariate analysis to develop predictive classification models and an infrared spectral database for accurate thalassemia differentiation. Thalassemia comprises several subtypes, including β-thalassemia (β⁰ and β⁺ types), α-thalassemia (α⁰ and α⁺ types), hemoglobin H disease (HbH), and hemoglobin E (HbE). Reliable classification of these subtypes is essential for genetic counseling, family planning, and clinical management, especially among carrier couples who risk producing offspring with severe thalassemia.
In this research, IR Microspectroscopy combined with Principal Component Analysis (PCA) and Partial Least Squares Discriminant Analysis (PLS-DA) will be applied to construct an extensive spectral database and mathematical models for distinguishing the biochemical severity among carrier and disease groups. The models will be evaluated based on sensitivity, specificity, and predictive accuracy, providing a robust foundation for the integration of spectroscopic-based diagnostics into clinical screening programs for thalassemia.
2. Materials and Methods
The study participants were classified into three major groups—Normal, Carrier, and Disease—based on their hematological and genotypic profiles. Each major group was further subdivided into specific genotypic or phenotypic subgroups according to molecular characteristics confirmed by Hb typing and/or DNA analysis. The detailed classification of all subgroups is summarized in Table 1.
2.1. Analysis of Blood Samples Using IR Microspectroscopy
Blood samples were analyzed using a Fourier Transform Infrared (FTIR) spectrometer (Tensor 27, Bruker Optics) coupled with an IR Microscope (Hyperion 3000, Bruker Optics) equipped with an MCT detector. Spectral acquisition and instrument control were performed using OPUS 7.5 software (Bruker Optics, Germany). Measurements were conducted in transmission mode using a 15× objective lens, with a spectral resolution of 4 cm⁻¹ and a background scan of 64 scans. The spectral range was recorded between 4000 and 600 cm⁻¹, and each sample was measured to obtain approximately 40–45 spectra.
2.2. Spectral Preprocessing and Multivariate Data Analysis
All spectra were subjected to data preprocessing prior to analysis. Baseline correction was applied using a polynomial of order 3, and spectral smoothing was performed using nine smoothing points. The preprocessed spectra were then analyzed using multivariate data analysis (MVDA), particularly Principal Component Analysis (PCA), to identify and compare biochemical variations among different types of thalassemia. PCA was performed using The Unscrambler X version 10.1 (CAMO Software, Norway).
2.3. Construction of a Spectral Database for Thalassemia Classification
The processed data were compiled into a database to classify the IR spectral characteristics of different thalassemia subtypes, including normal hemoglobin, Alpha-thalassemia 2 heterozygote, Beta (0,+)-thalassemia heterozygote, Alpha-thalassemia 1 heterozygote, Hb E homozygote and Hb H Disease. Further classification and predictive modeling were carried out using Partial Least Squares Discriminant Analysis (PLS-DA) with The Unscrambler X version 10.3 (CAMO Software, Norway). Samples were categorized based on disease severity into moderate, Carrier, and Normal groups, with at least 30 samples per group. PLS-DA was then employed to analyze and validate the classification performance and model discrimination capability among these groups.
3. Results
3.1. Clinical and Hematological Data
A total of 414 blood samples were analyzed, using complete blood count (CBC) parameters (RBC, Hb, Hct, MCV, MCH, RDW) in conjunction with hemoglobin typing results (%HbA₂ or %HbE, %HbF) and DNA testing as summarized in Table 2. Based on these combined parameters, the samples were classified into three groups: Normal (n = 118), Carrier (n = 152), and Disease (n = 144). In the Carrier and Disease groups, several samples exhibited clearly abnormal hematological values, such as Hb < 12 g/dL, Hct < 36%, MCV < 80 fL, and MCH < 27 pg, along with RBC and RDW values consistent with thalassemia carriers or patients. Moreover, Hb typing results revealed distinctive abnormal profiles consistent with diagnostic criteria, such as %HbA₂ > 3.5% in β-thalassemia trait, %HbE ≈ 25–30% in HbE trait, and %HbF > 1% in β-thalassemia intermedia or major. These findings enabled clear differentiation of samples into the Carrier and Disease groups and were further confirmed through additional molecular testing. In contrast, samples classified as Normal occasionally showed abnormal CBC indices—such as low Hb, Hct, MCV, and MCH—while exhibiting normal Hb typing results (%HbA₂ ≤ 3.5% and %HbF < 1%). Such profiles are generally indicative of microcytic hypochromic anemia, warranting further investigation. Nevertheless, these samples were temporarily categorized as “Normal.” To confirm their status, DNA testing was performed on all Normal group samples, revealing that out of 118 samples, only 42 were truly normal, while 57 were latent carriers (Group 22) and 19 carried (Group 25), which are genetic variants undetectable by Hb typing alone.
These results highlight that the combination of CBC parameters and Hb typing allows for accurate classification of Carrier and Disease groups consistent with standard diagnostic criteria. However, the findings also emphasize that a subset of the so-called “Normal” group may harbor silent carrier mutations that would be missed without DNA confirmation. Therefore, an integrated diagnostic approach—combining CBC cut-off values, Hb typing, and DNA testing—is essential for improving screening accuracy and minimizing the risk of misclassifying individuals as “normal” when underlying genetic abnormalities are present.
3.2. IR Microspectroscopy and Functional Group Analysis
FTIR spectra of Hb lysate samples from each group (40–50 spectra per sample) were collected, followed by outlier screening and Principal Component Analysis (PCA). The dataset included samples from the following subtypes: Normal (Group 10), Alpha-thalassemia 2 heterozygote (Group 22), Hb Constant Spring or Hb Paksae heterozygote (Group 25), Alpha-thalassemia 1 heterozygote (Group 21), Hb E heterozygote with Alpha-thal 2 heterozygote (Group 45), Compound Alpha-thalassemia 2 heterozygote (Group 24), Beta (0)-thalassemia heterozygote (Group 31), Beta (+)-thalassemia heterozygote (Group 34), Hb E heterozygote (Group 32), Hb E heterozygote with Alpha-thalassemia 1 heterozygote (Group 44), Hb E heterozygote? (Group 39), Hb E homozygote with Alpha-thalassemia 1 heterozygote (Group 47), Hb E homozygote (Group 33), Hb H Disease (Group 51) and EA Bart Disease? (Group 89), Each group contained approximately 15–31 samples. The analysis compared three representative clinical categories: the Disease group (Group 51), the Carrier group (Group 21), and the Normal group (Group 10).
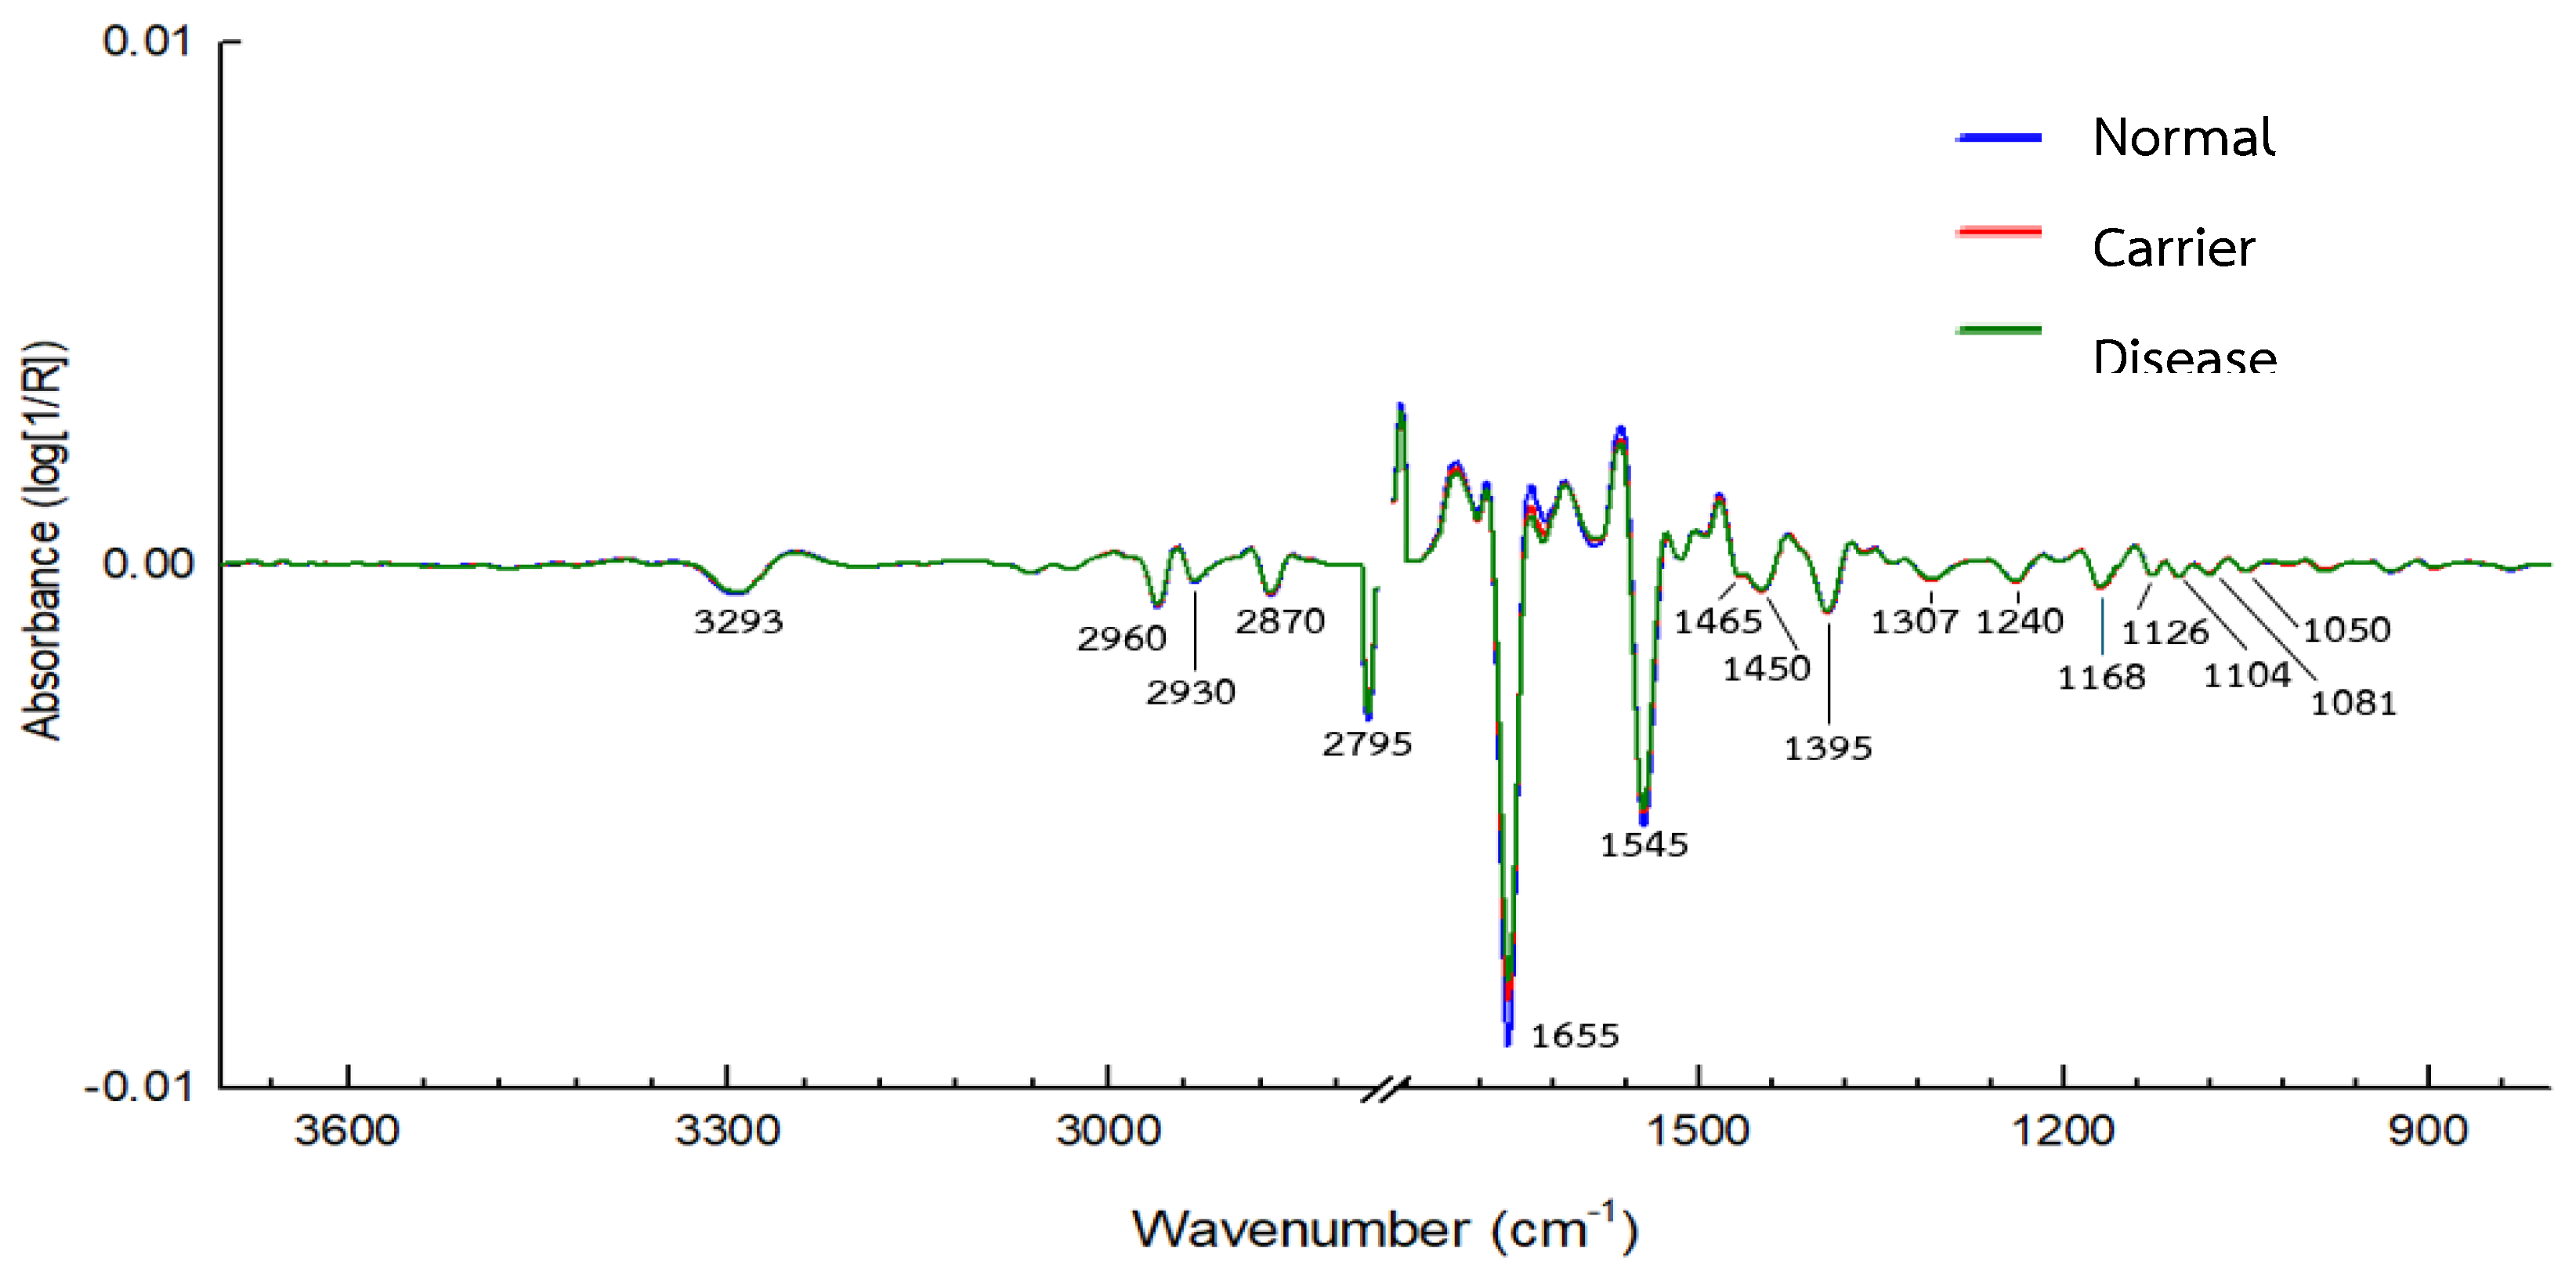
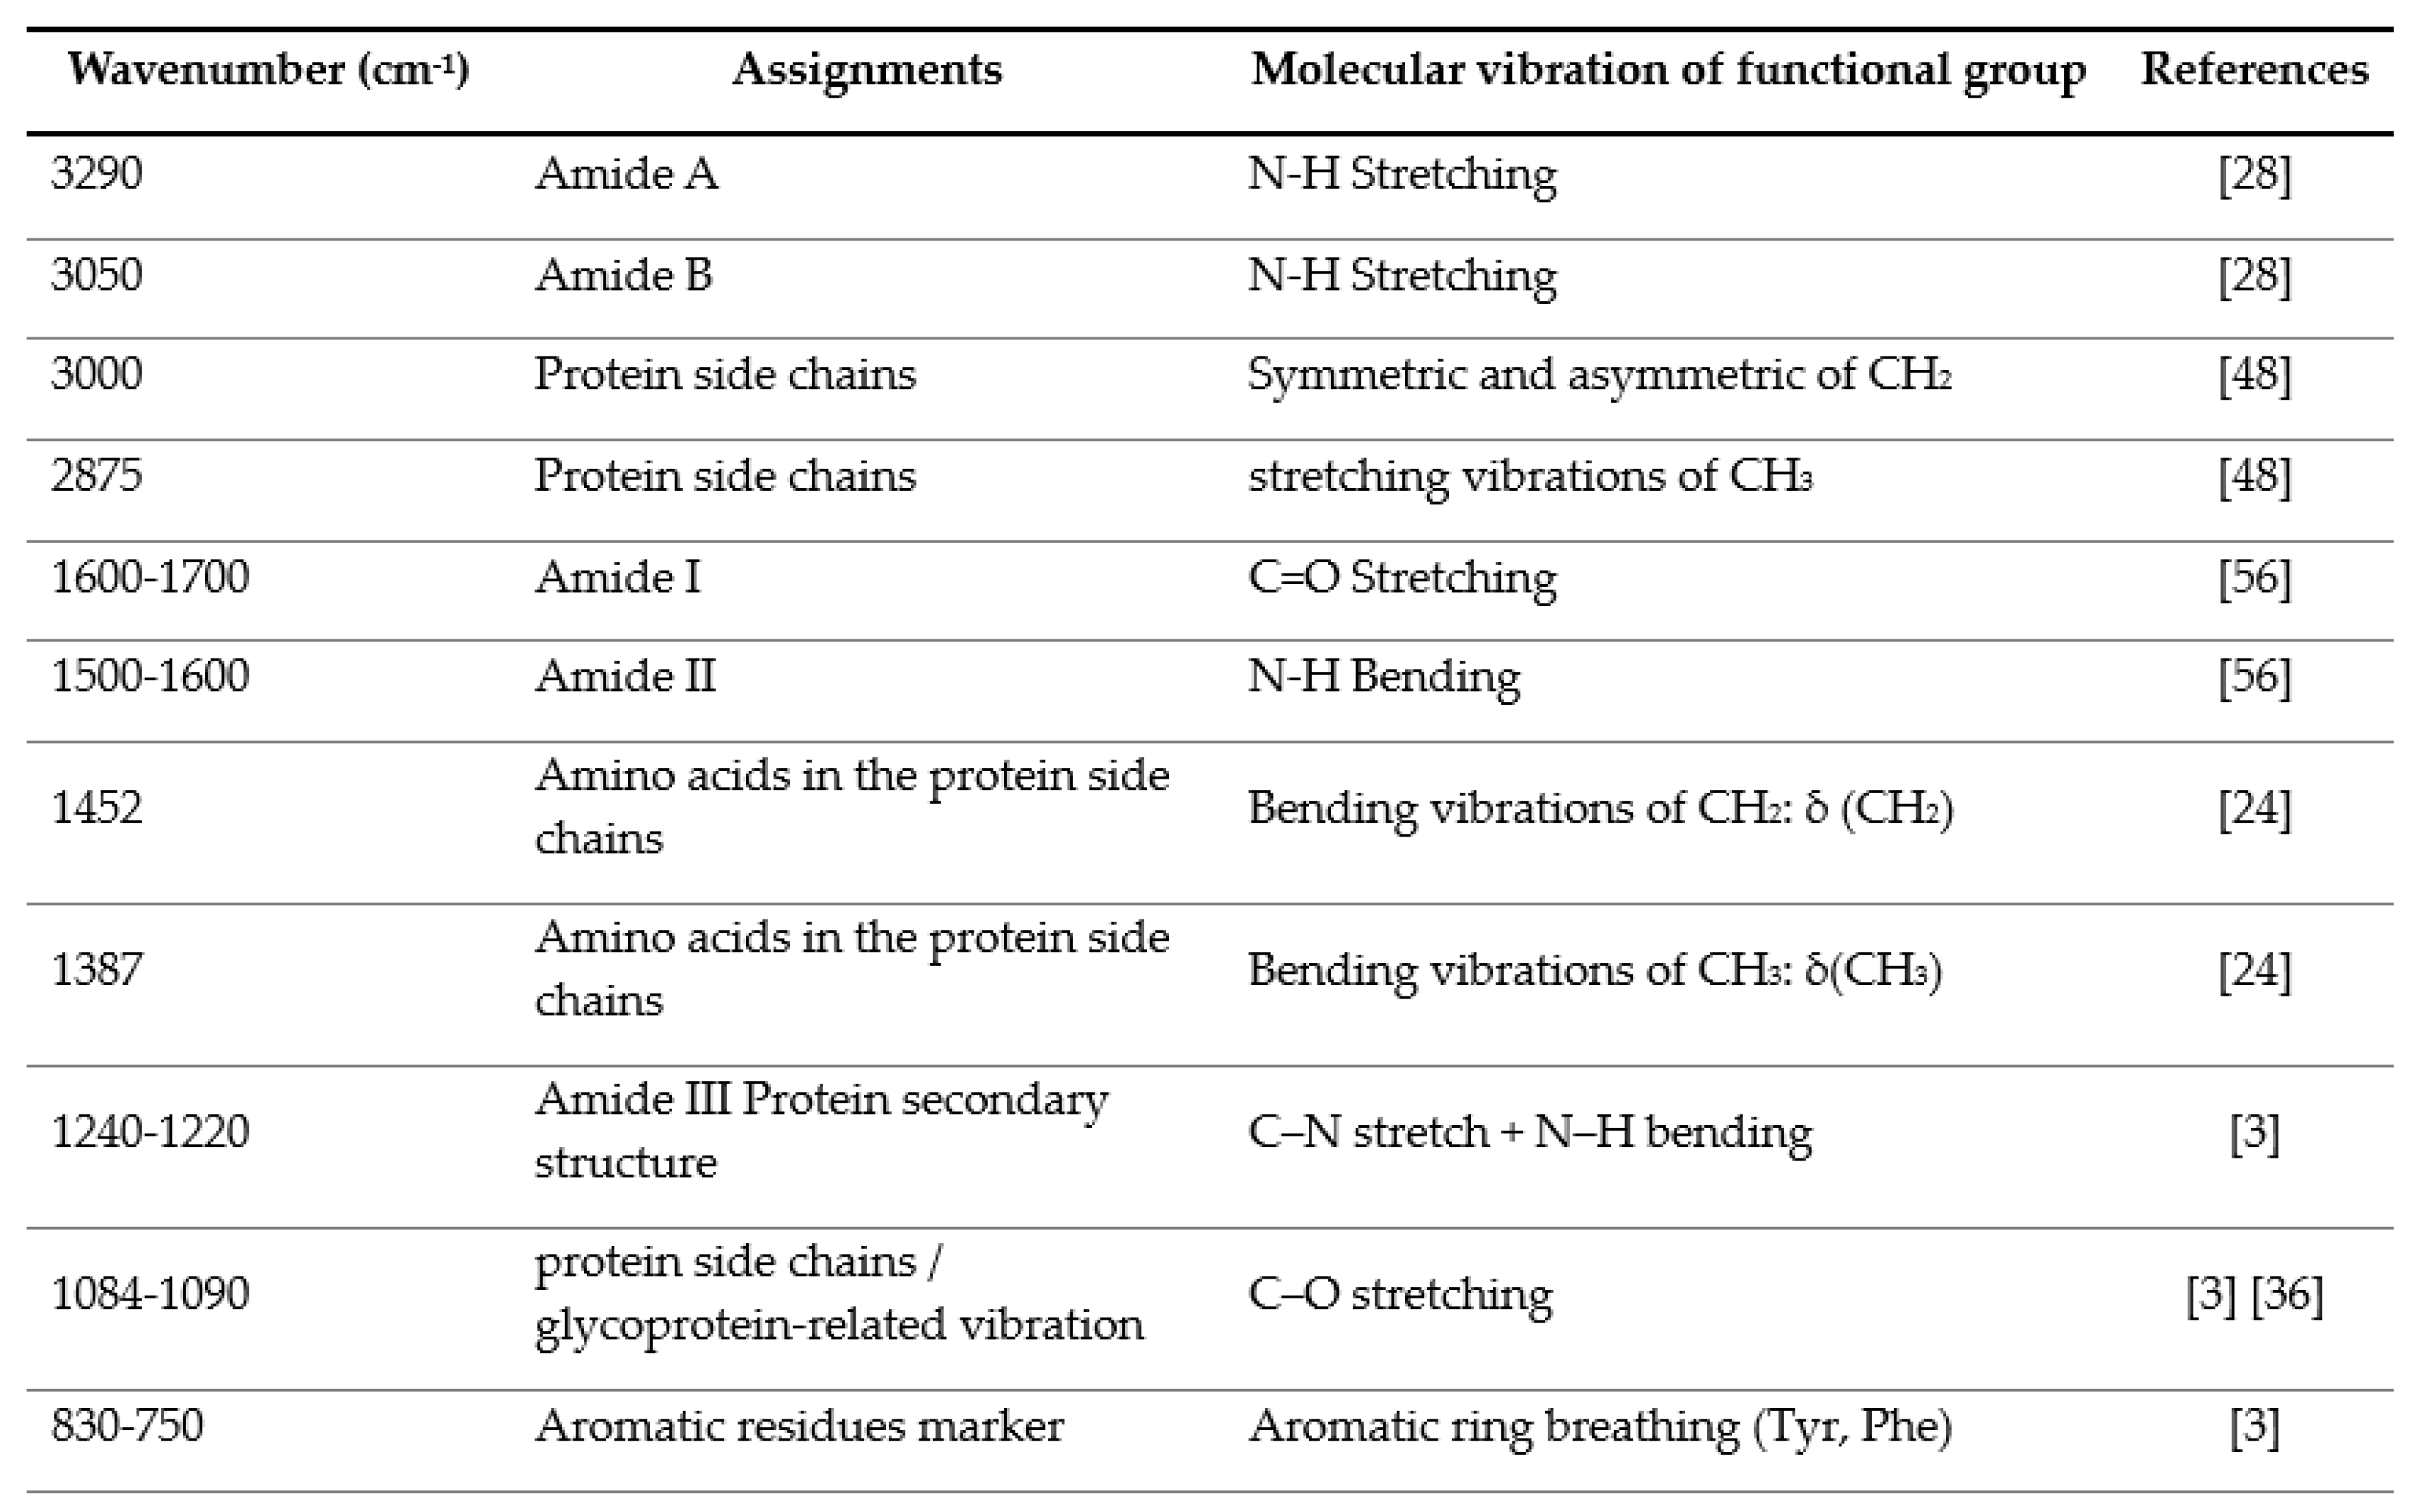
Characteristic FTIR absorption bands corresponding to major functional groups were observed (Table 3). Prominent protein-related bands included Amide A (~3290 cm⁻¹) and Amide B (~3050 cm⁻¹), arising from N–H stretching vibrations of the peptide backbone. Additional peaks at 3000 and 2875 cm⁻¹ corresponded to CH₂ and CH₃ sidechain stretching modes. The Amide I region (1600–1700 cm⁻¹) reflected variations in protein secondary structure, while the Amide II region (1500–1600 cm⁻¹) was associated with peptide bond vibrations. Moreover, distinct differences were detected in the 1452 and 1387 cm⁻¹ regions, representing side-chain deformations that varied between the Disease and Carrier groups.
Overall, the FTIR spectra of Hb lysate clearly revealed vibrations corresponding to the peptide backbone (Amide I–III, A, B) and side-chain functional groups, consistent with the molecular composition of hemoglobin. These spectral variations reflect the biochemical heterogeneity among samples and can be effectively used to differentiate thalassemia groups according to disease severity.
Figure 1.
Average FTIR spectra of Hb lysate red blood cell samples from the Normal group, recorded in the 4000–900 cm⁻¹ range using IR microscopy (100×100 µm, 4 cm⁻¹ resolution, 64 scans). Spectra were preprocessed using baseline correction, smoothing, and Extended Multiplicative Signal Correction (EMSC), followed by PCA analysis (n = 32).
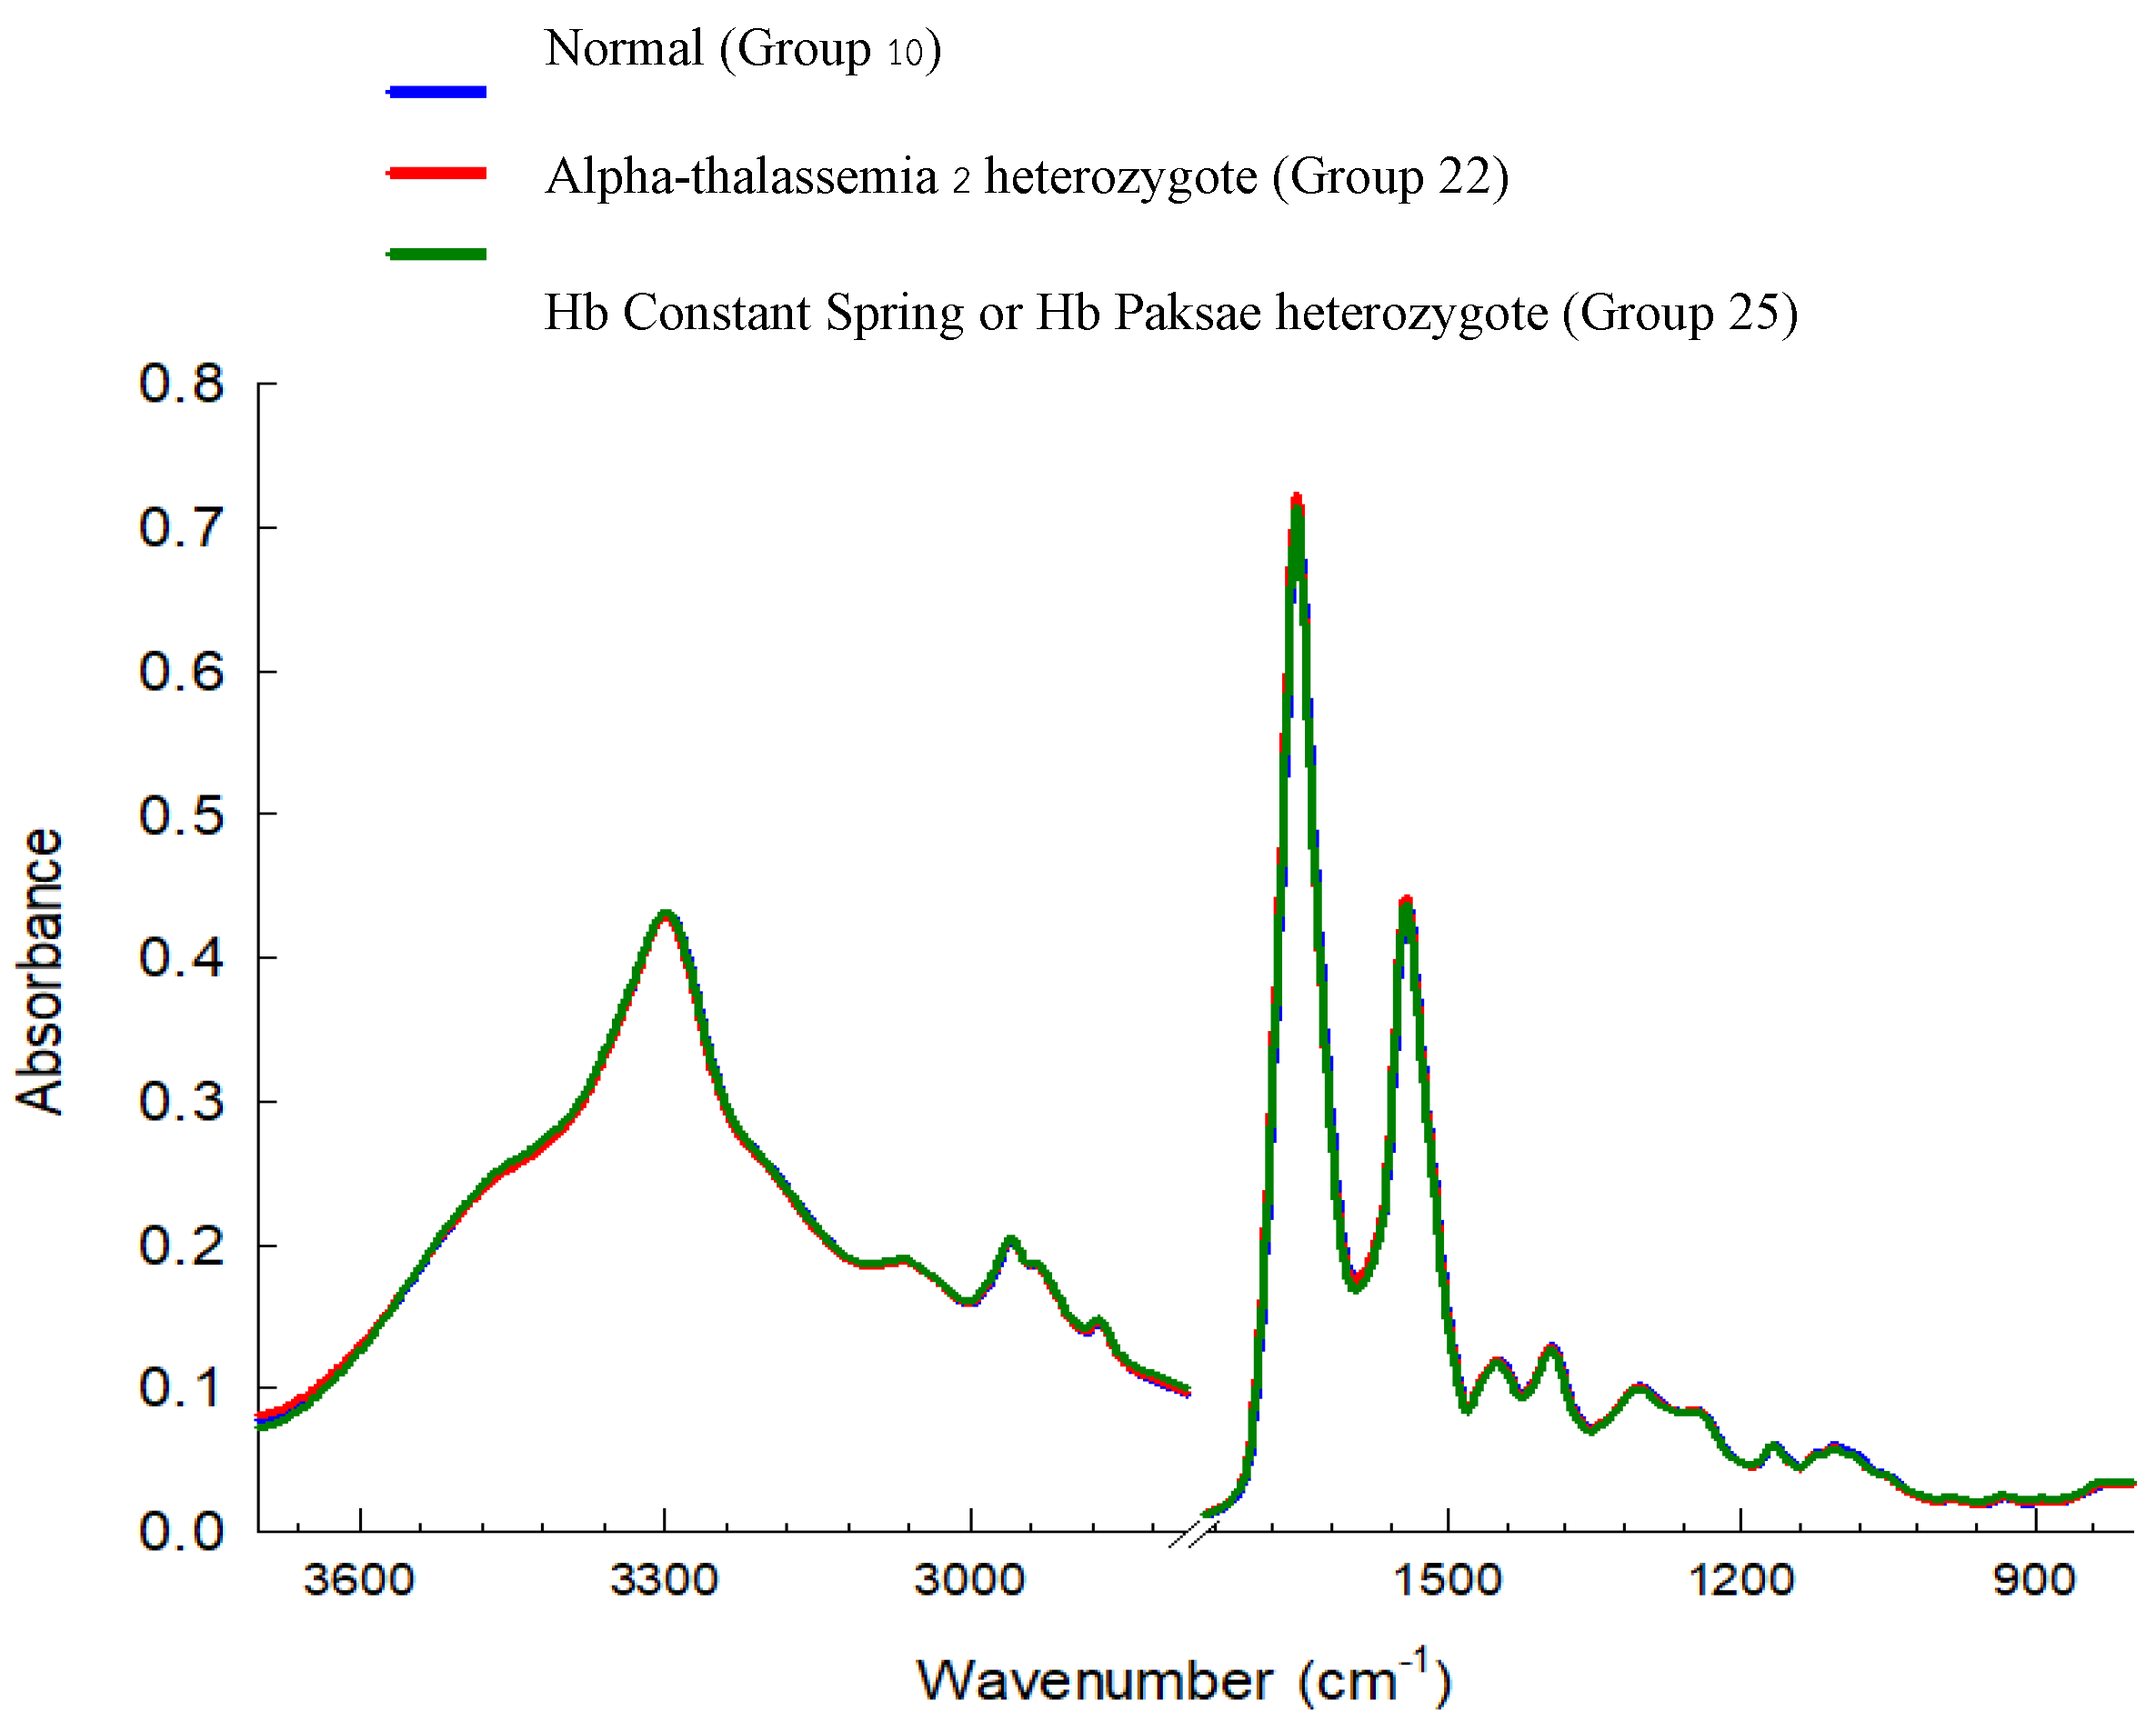
Figure 2.
Average FTIR spectra of Hb lysate red blood cell samples from the Carrier group, recorded in the 4000–900 cm⁻¹ range using IR microscopy (100×100 µm, 4 cm⁻¹ resolution, 64 scans). Spectra were preprocessed using baseline correction, smoothing, and Extended Multiplicative Signal Correction (EMSC), followed by PCA analysis (n = 20).
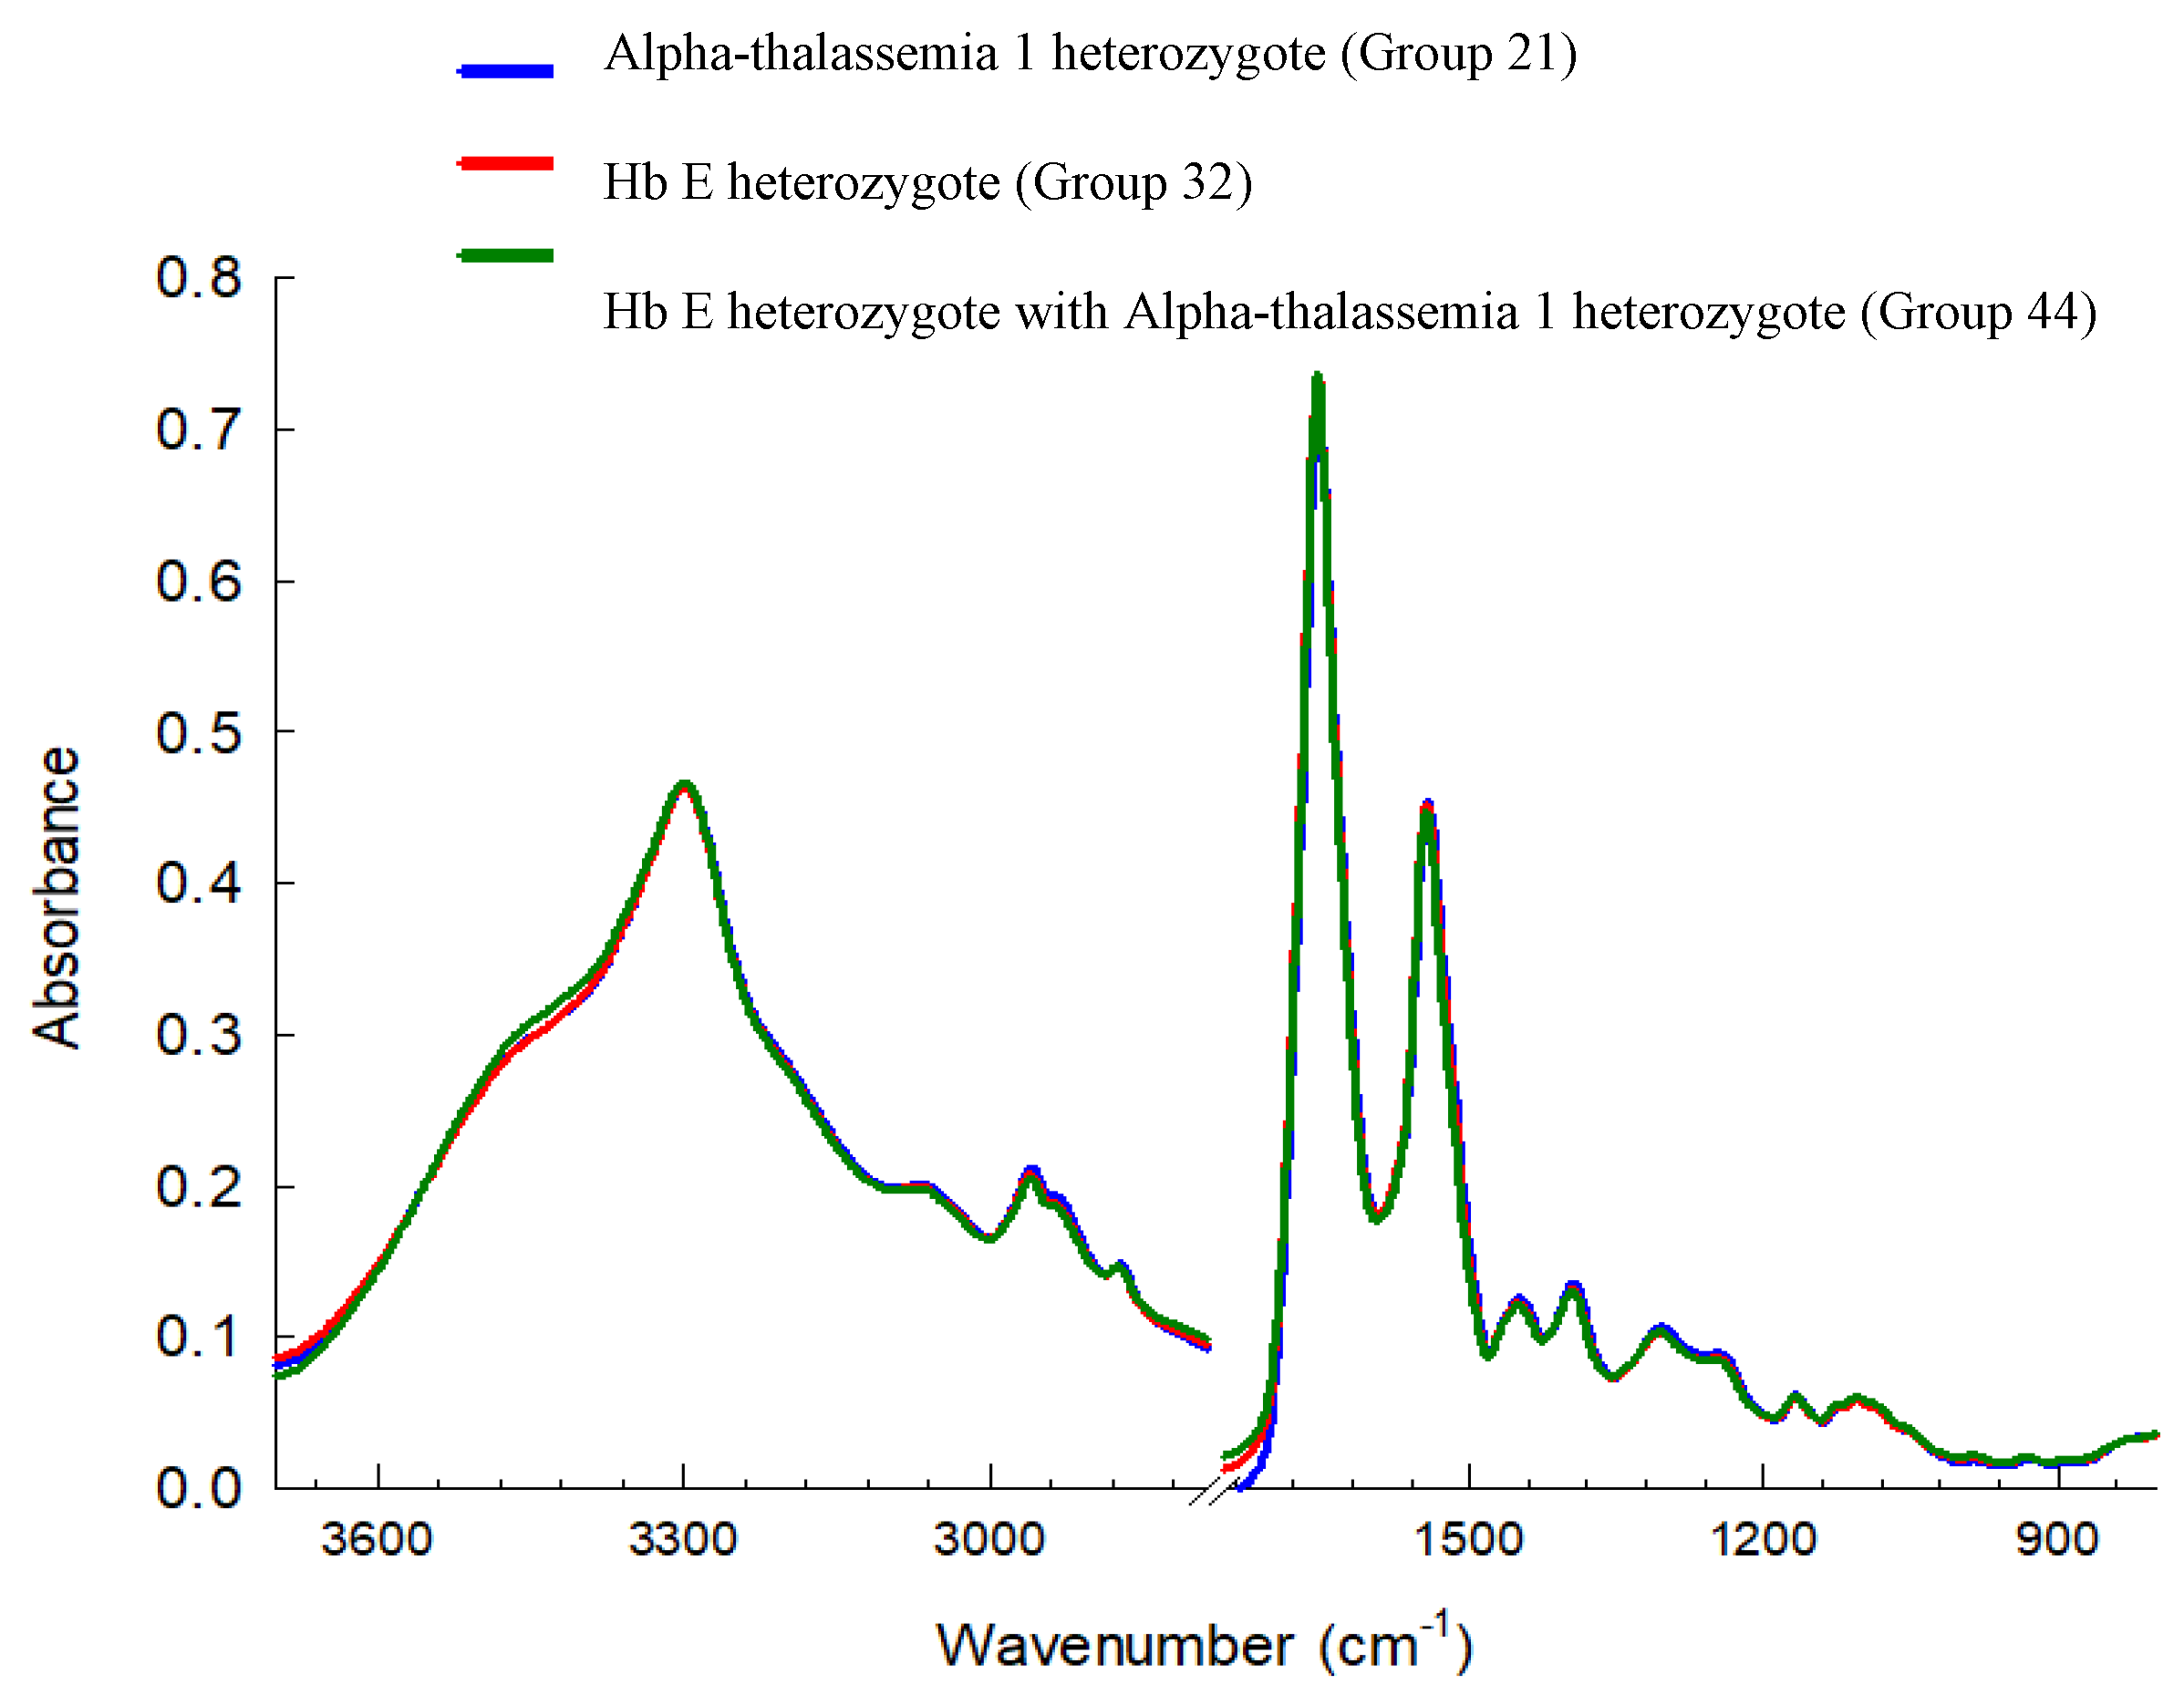
Figure 3.
Average FTIR spectra of Hb lysate red blood cell samples from the Carrier group, recorded in the 4000–900 cm⁻¹ range using IR microscopy (100×100 µm, 4 cm⁻¹ resolution, 64 scans). Spectra were preprocessed using baseline correction, smoothing, and Extended Multiplicative Signal Correction (EMSC), followed by PCA analysis (n = 15).
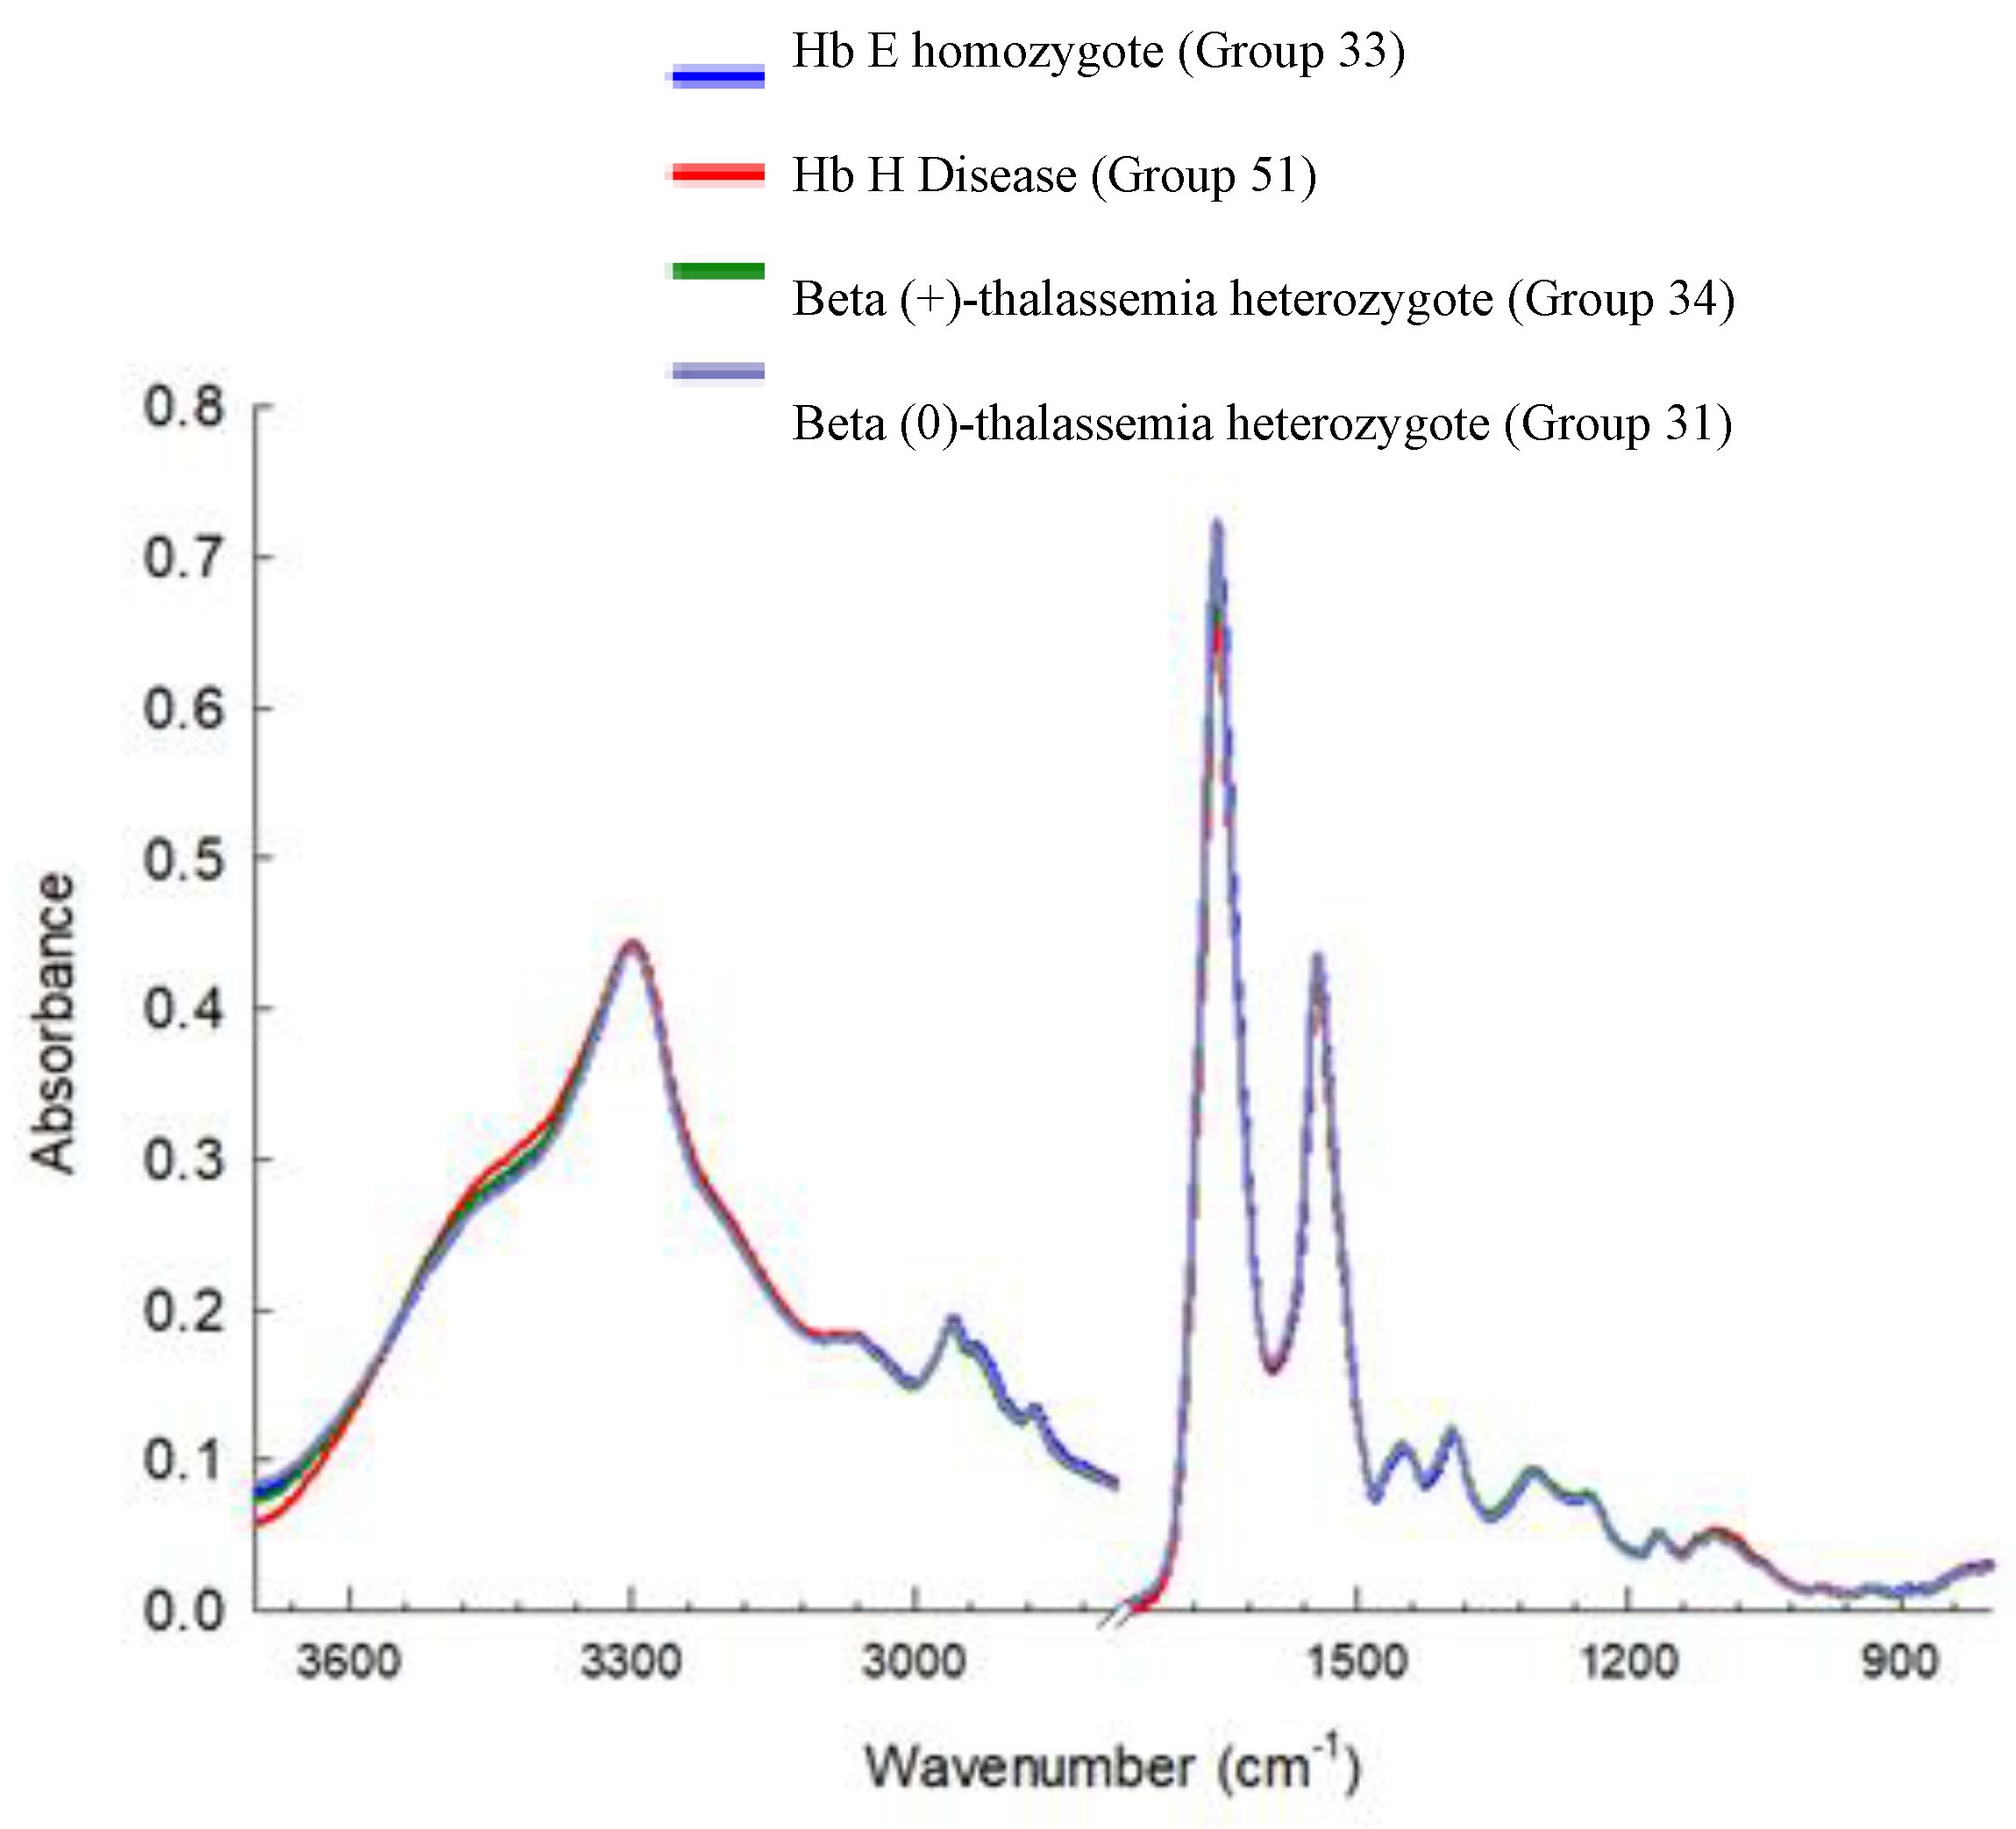
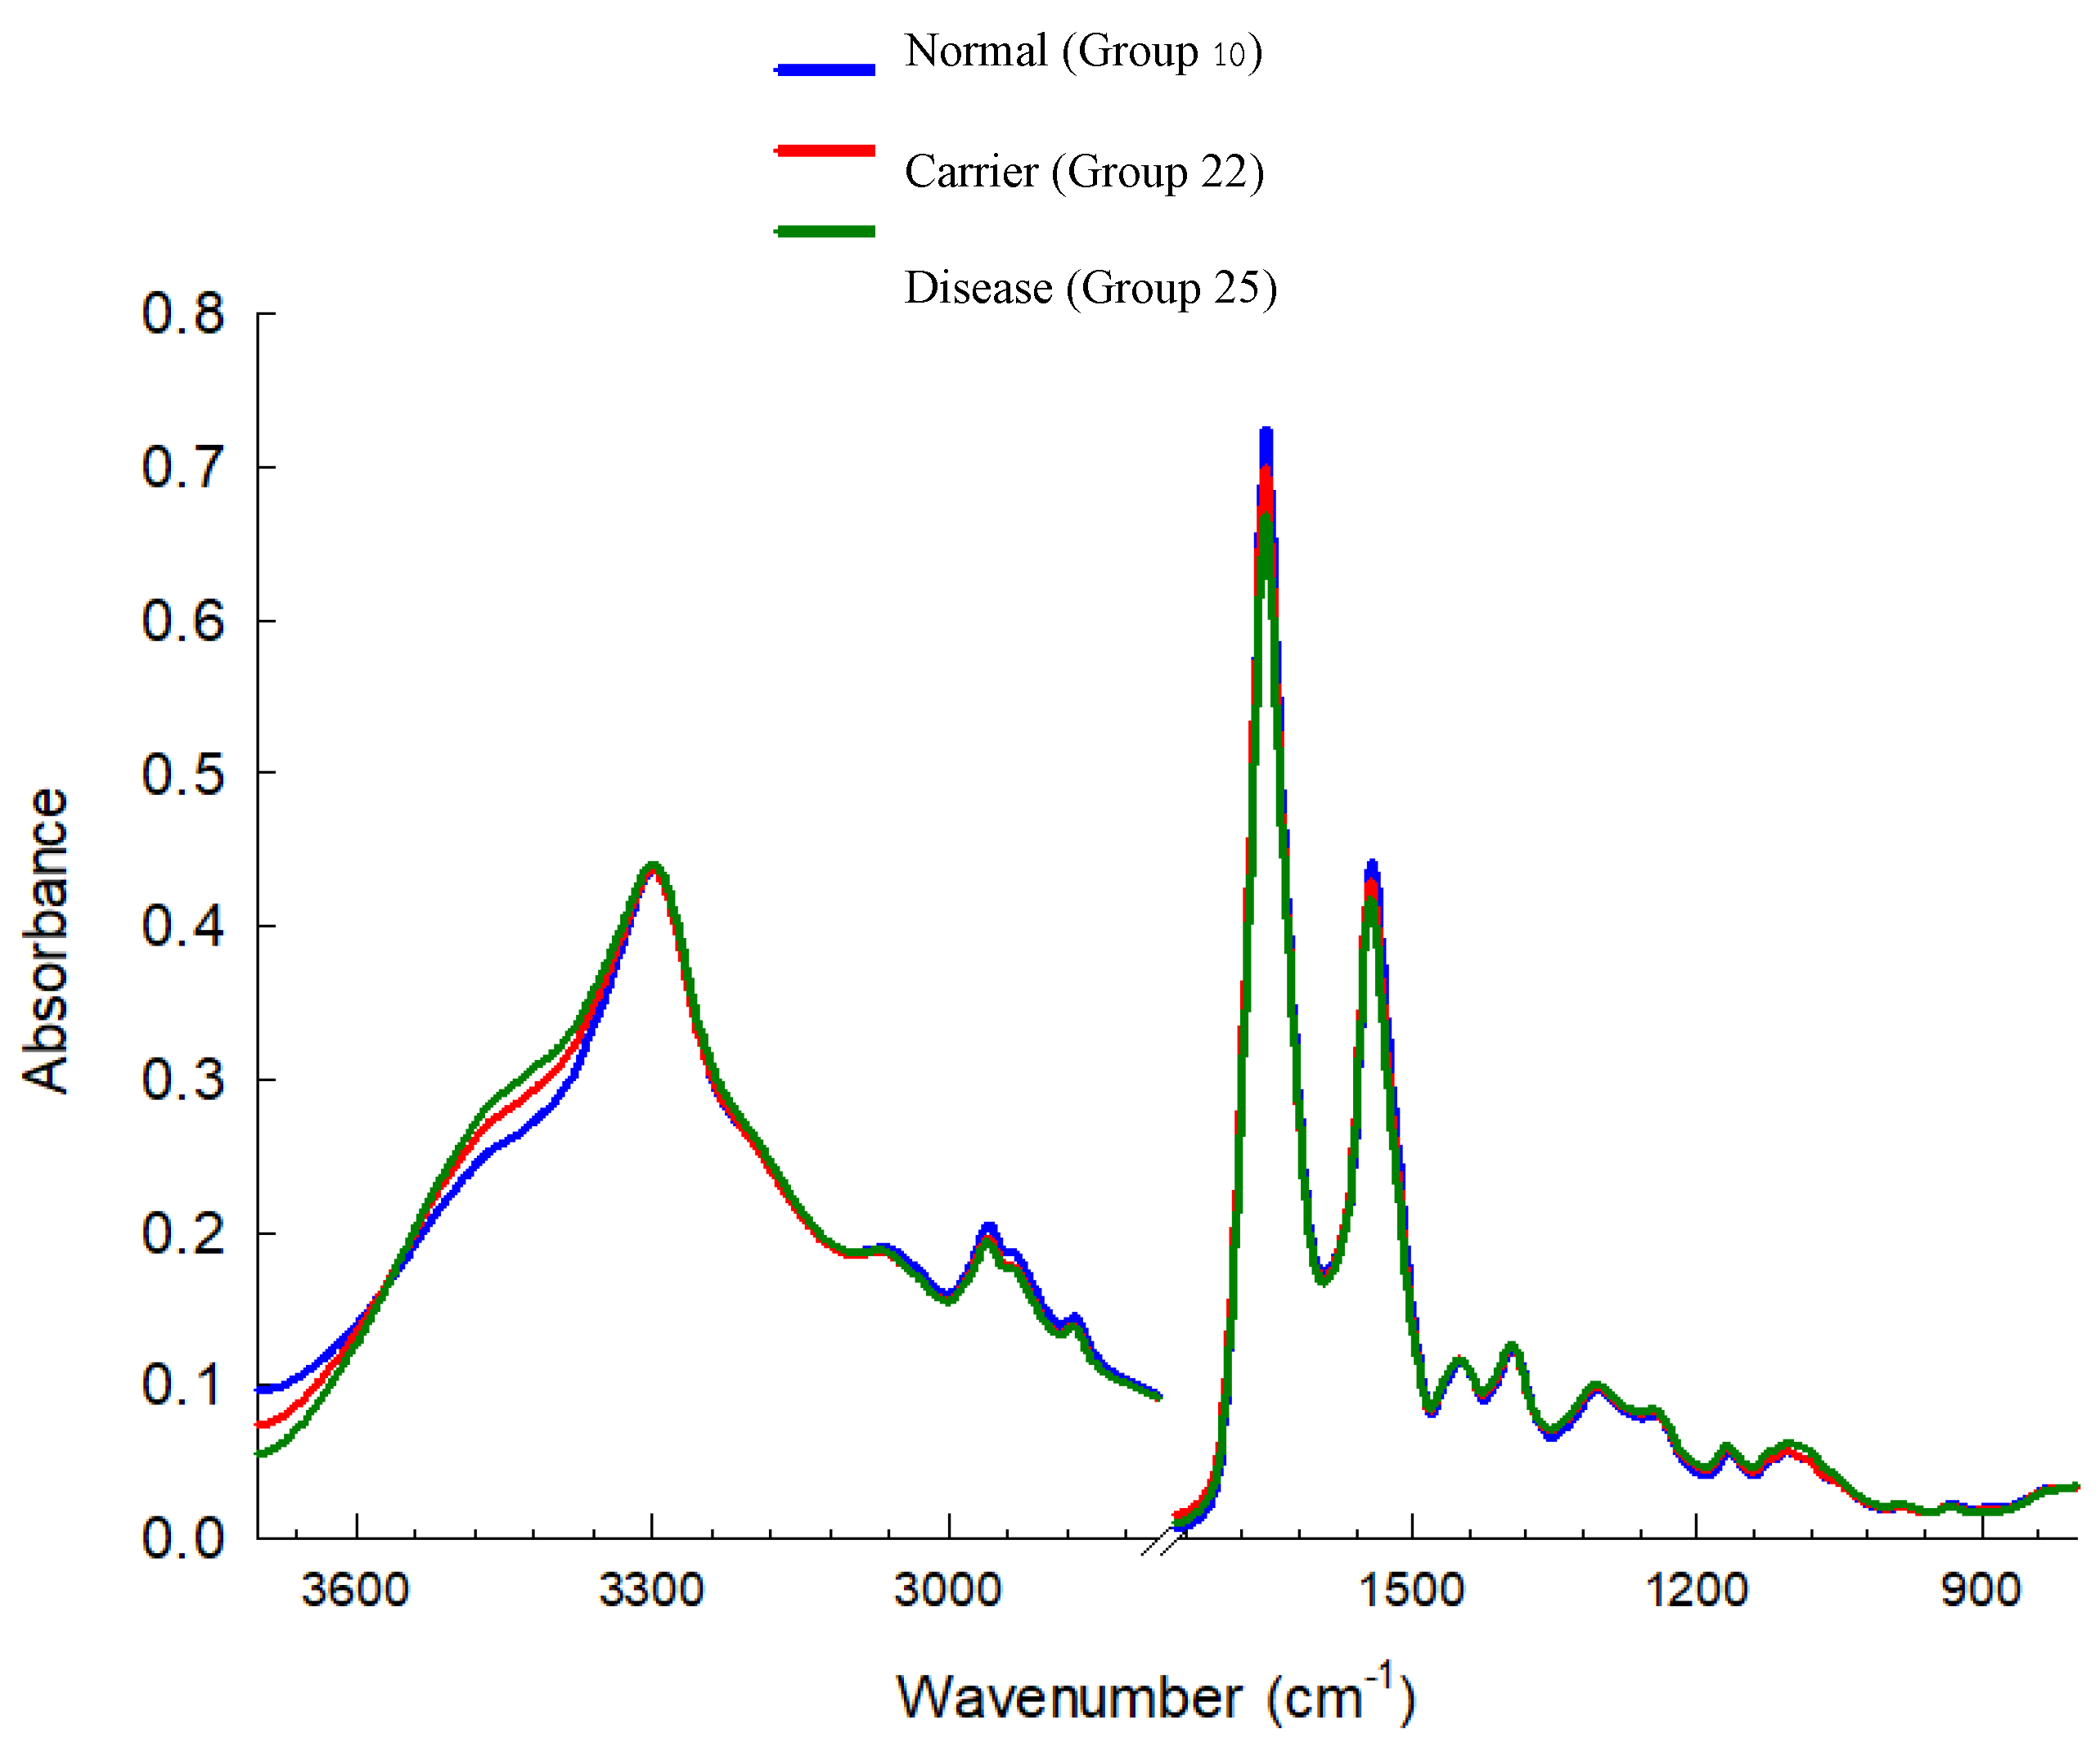
Figure 4.
Average FTIR spectra of Hb lysate red blood cell samples compared 3 groups, recorded in the 4000–900 cm⁻¹ range using IR microscopy (100×100 µm, 4 cm⁻¹ resolution, 64 scans). Spectra were preprocessed using baseline correction, smoothing, and Extended Multiplicative Signal Correction (EMSC), followed by PCA analysis (n = 31).
3.3. Cluster Analysis of FTIR Spectra of Hb Lysate
Cluster analysis of the FTIR spectra was performed to evaluate the similarity and differentiation among thalassemia subtypes and severity levels. For the Normal group (Figure 5), the samples were divided into Cluster A (Hb Constant Spring or Hb Paksae heterozygote: Others-1, Group 25) and Cluster B, which further separated into B1 (Alpha-thalassemia 2 heterozygote (Group 22) and B2 (Normal). This subdivision indicates distinct protein structural variations between the two sub-clusters, despite their overall proximity in spectral space.
In the Carrier group (Figure 6), two primary clusters were observed: Cluster A (Hb E heterozygote, Group 32) and Cluster B (Alpha-thalassemia 1 heterozygote). The latter could be subdivided into B1 (Hb E heterozygote with Alpha-thalassemia 1 heterozygote, Group 44) and B2 (Alpha-thalassemia 1 heterozygote, Group 21), reflecting the biochemical similarity among individuals carrying different Alpha-thalassemia 1 heterozygote mutations. These results suggest that despite genetic heterogeneity, carriers with related thalassemic genotypes share comparable molecular characteristics in their hemoglobin spectra.
For the Disease group (Figure 7), two major clusters were evident: Cluster A (Hb H Disease, Group 51) and Cluster B Within Cluster B, further subdivision revealed B1 (Beta (+)-thalassemia heterozygote, Group 34) and B2 within B2, the spectra were separable into B21 (Beta (0)-thalassemia heterozygote, Group 31) and B22 (Hb E homozygote, Group 33). This hierarchical organization indicates that FTIR spectra can discriminate not only between Disease and Carrier groups but also among subtypes within the Disease group.
When integrating all datasets (Figure 8), two major clusters were observed: Cluster A (Normal) and Cluster B (Carrier + Disease). Cluster B could be further divided into B1 (Carrier) and B2 (Disease), clearly demonstrating the ability of FTIR spectral profiles to distinguish between severity levels of thalassemia. When correlated with FTIR spectral features, these group separations were associated with specific functional group variations, particularly within the Amide I (1600–1700 cm⁻¹) and Amide II (1500–1600 cm⁻¹) regions related to protein secondary structure. These bands played a key role in differentiating Normal samples from Carrier and Disease groups. In addition, signals corresponding to side-chain vibrations (CH₂, CH₃) and C–O stretching modes (1400–1000 cm⁻¹) contributed to the discrimination of Disease subtypes with greater specificity.
Overall, FTIR Microspectroscopy combined with hierarchical cluster analysis (HCA) proved effective for molecular-level screening and classification of thalassemia. The technique shows strong potential as a biomarker-based approach for predicting disease severity and supporting early diagnosis in clinical practice.
3.4. Principal Component Analysis (Scores and Loadings) of FTIR Spectra of Hb Lysate
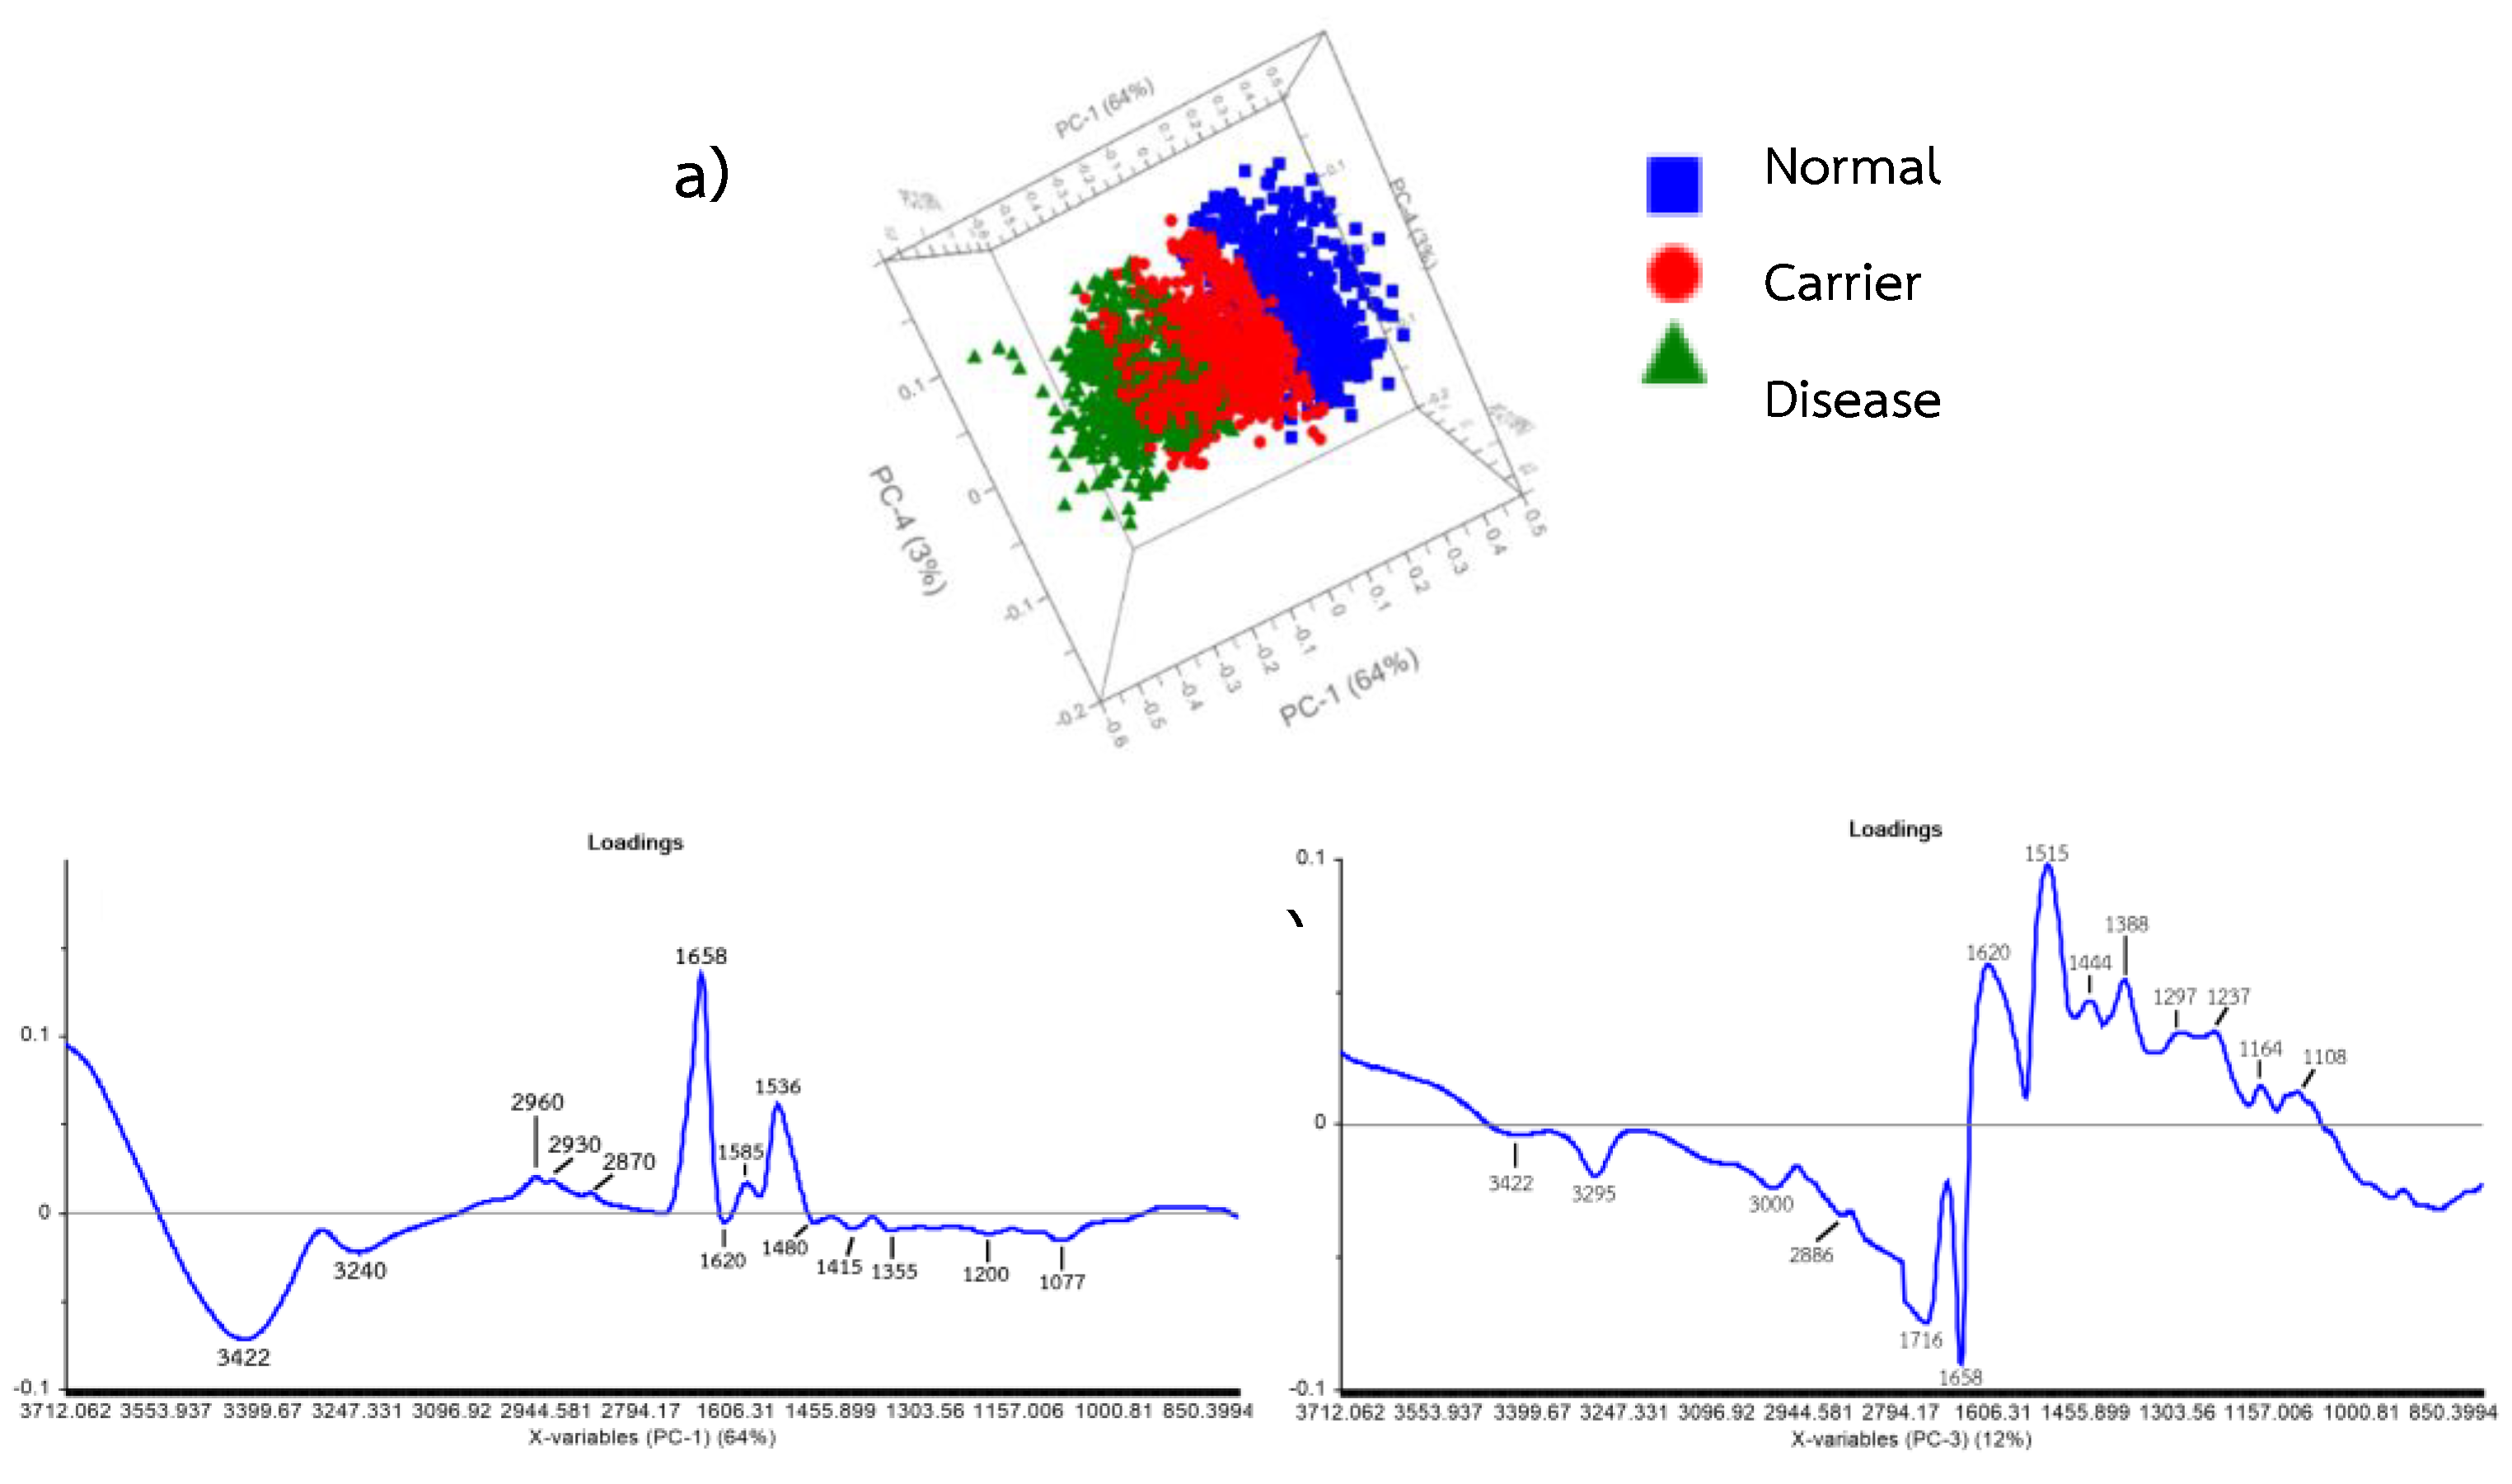
Principal Component Analysis (PCA) of the FTIR spectra of Hb lysate samples revealed that the first three principal components (PCs) accounted for approximately 94% of the total spectral variance, with PC-1 explaining 64%, PC-2 explaining 18%, and PC-3 explaining 12%, respectively. The scores plot demonstrated a clear separation between the Normal group and the Carrier and Disease groups along the PC-1 axis, whereas PC-2 and PC-3 contributed to further differentiation between the Carrier and Disease groups. Analysis of the loading plots indicated that PC-1 exhibited dominant peaks in the regions 3247–3399 cm⁻¹ (Amide A, N–H stretching), 2944–2873 cm⁻¹ (CH₂ and CH₃ side-chain vibrations), and 1606–1455 cm⁻¹ (Amide I and Amide II regions). These correspond to variations in protein secondary structure and peptide bonding, which differentiate normal from thalassemic samples. PC-2 showed major loadings within the C–H stretching region (2944–2794 cm⁻¹) and the Amide I–II regions (1606–1455 cm⁻¹), reflecting subtle structural changes that assist in discriminating between Carrier and moderate Disease subgroups. Meanwhile, PC-3 was characterized by features in the Amide I (1600–1700 cm⁻¹), Amide II (1500–1600 cm⁻¹), and 1153–1000 cm⁻¹ regions, which correspond to C–O stretching and Amide III vibrations, indicating alterations in protein tertiary and side-chain structures at a finer molecular level.
Overall, PCA demonstrated that distinct molecular variations in protein secondary and side-chain structures, as captured in the FTIR spectra, can be effectively used to distinguish between Normal, Carrier, and Disease groups of thalassemia.
Figure 9.
Principal Component Analysis (PCA) of Hb lysate samples classified by thalassemia severity. (a) PCA score plot of Normal (Group 10), Carrier (Alpha-thalassemia 1 heterozygote, Group 21), and Disease (Hb H Disease, Group 51) groups (n = 31). (b) PCA loading plot for PC-1 (64% explained variance) of FTIR spectra. (c) PCA loading plot for PC-3 (12% explained variance) of FTIR spectra.
3.5. Correlation Loadings Analysis of PCA from FTIR Spectra of Hb Lysate
PCA results revealed that PC-1 (79%) was the principal component responsible for explaining the major variance among groups, particularly in distinguishing the Normal group from the Carrier and Disease groups. This observation was consistent with the group separation pattern observed in the scores plot (Figure 10). The variables with the highest positive loadings on PC-1 were located at 3243 and 3422 cm⁻¹ (Amide A; N–H stretching) and 2873–2958 cm⁻¹ (CH₂, CH₃ side-chain stretching), indicating differences in hydrogen bonding and side-chain environments of hemoglobin proteins between normal and thalassemic samples. Conversely, the 1658 cm⁻¹ band (Amide I; C=O stretching) exhibited a strong negative loading on PC-1, primarily associated with the Normal group, suggesting structural stability of the protein secondary structure in non-thalassemic samples. In contrast, the 1536 and 1587 cm⁻¹ bands (Amide II; N–H bending and C–N stretching) showed prominent contributions to the Carrier and Disease groups, reflecting alterations in peptide bond vibrations of Hb lysate proteins. PC-3 (7%) played a secondary role in distinguishing Carrier from Disease groups, with major contributions from bands at 1081 and 1197 cm⁻¹, corresponding to Amide III and C–O stretching / glycoprotein-related vibrations. These peaks represent differences in side-chain structures and glycoprotein-associated vibrational modes between the two groups.
Overall, the correlation loading plot analysis confirmed that the major peptide backbone bands (Amide A, Amide I, Amide II) and side-chain-related bands (CH₂, CH₃, and glycoprotein-associated vibrations) play critical roles in differentiating the FTIR spectral profiles of Hb lysate among Normal, Carrier, and Disease groups. These findings are consistent with variations in the biochemical composition and structural integrity of hemoglobin corresponding to the severity levels of thalassemia.
Figure 10.
PCA score plot (PC-1 vs PC-3) and correlation loading plot of FTIR spectra of Hb lysate samples, demonstrating clear separation among Normal, Carrier, and Disease groups.
Figure 10.
PCA score plot (PC-1 vs PC-3) and correlation loading plot of FTIR spectra of Hb lysate samples, demonstrating clear separation among Normal, Carrier, and Disease groups.
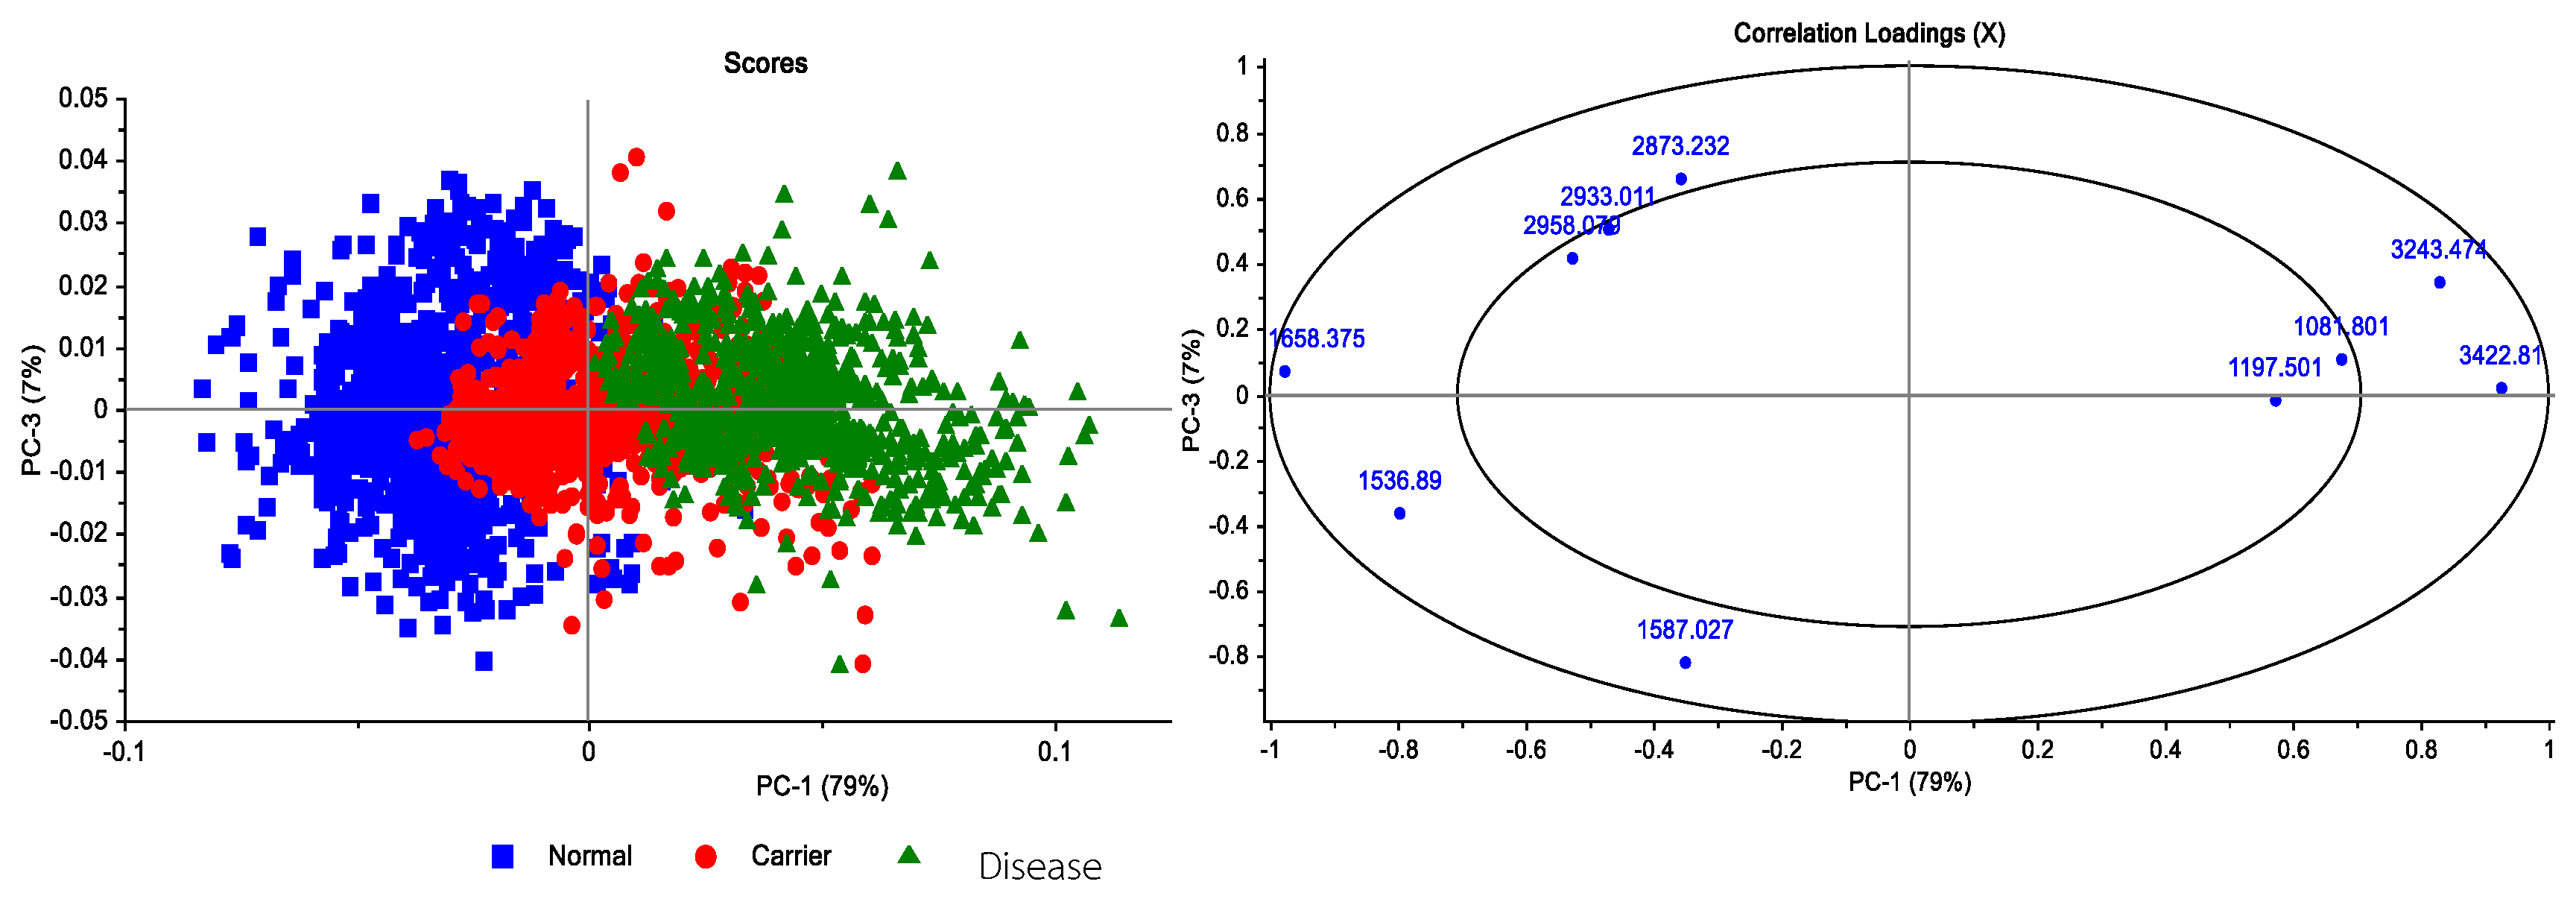
Figure 11.
Second-derivative FTIR spectra of Hb lysate samples from Normal, Carrier, and Disease groups, highlighting the characteristic absorption bands associated with specific molecular vibrations.
Figure 11.
Second-derivative FTIR spectra of Hb lysate samples from Normal, Carrier, and Disease groups, highlighting the characteristic absorption bands associated with specific molecular vibrations.
Based on the experimental results, further analysis was conducted using Partial Least Squares Discriminant Analysis (PLS-DA) to classify the severity levels among the Disease, Carrier, and Normal groups. For the classification model, the Normal group was represented by samples of Normal (Group 10), the Carrier group by Alpha-thalassemia 1 heterozygote (Group 21), and the Disease group by Hb H Disease (Group 51) samples. The model performance was evaluated in terms of the R² coefficient, where the Disease group achieved an R² of 0.82, the Carrier group achieved R² = 0.80, and the Normal group achieved R² = 0.53, as shown in Figure 12.
Figure 12.
(a) PLS-DA analysis of Hb lysate samples classified into three severity levels: Normal, Carrier, and Disease. (b–d) Calibration curves for Disease, Carrier, and Normal groups, respectively. Each group contained 31 samples (Normal: Normal; Carrier: Alpha-thalassemia 1 heterozygote (Group 21); Disease: Hb H Disease (Group 51), with a total of 3021 spectra analyzed.
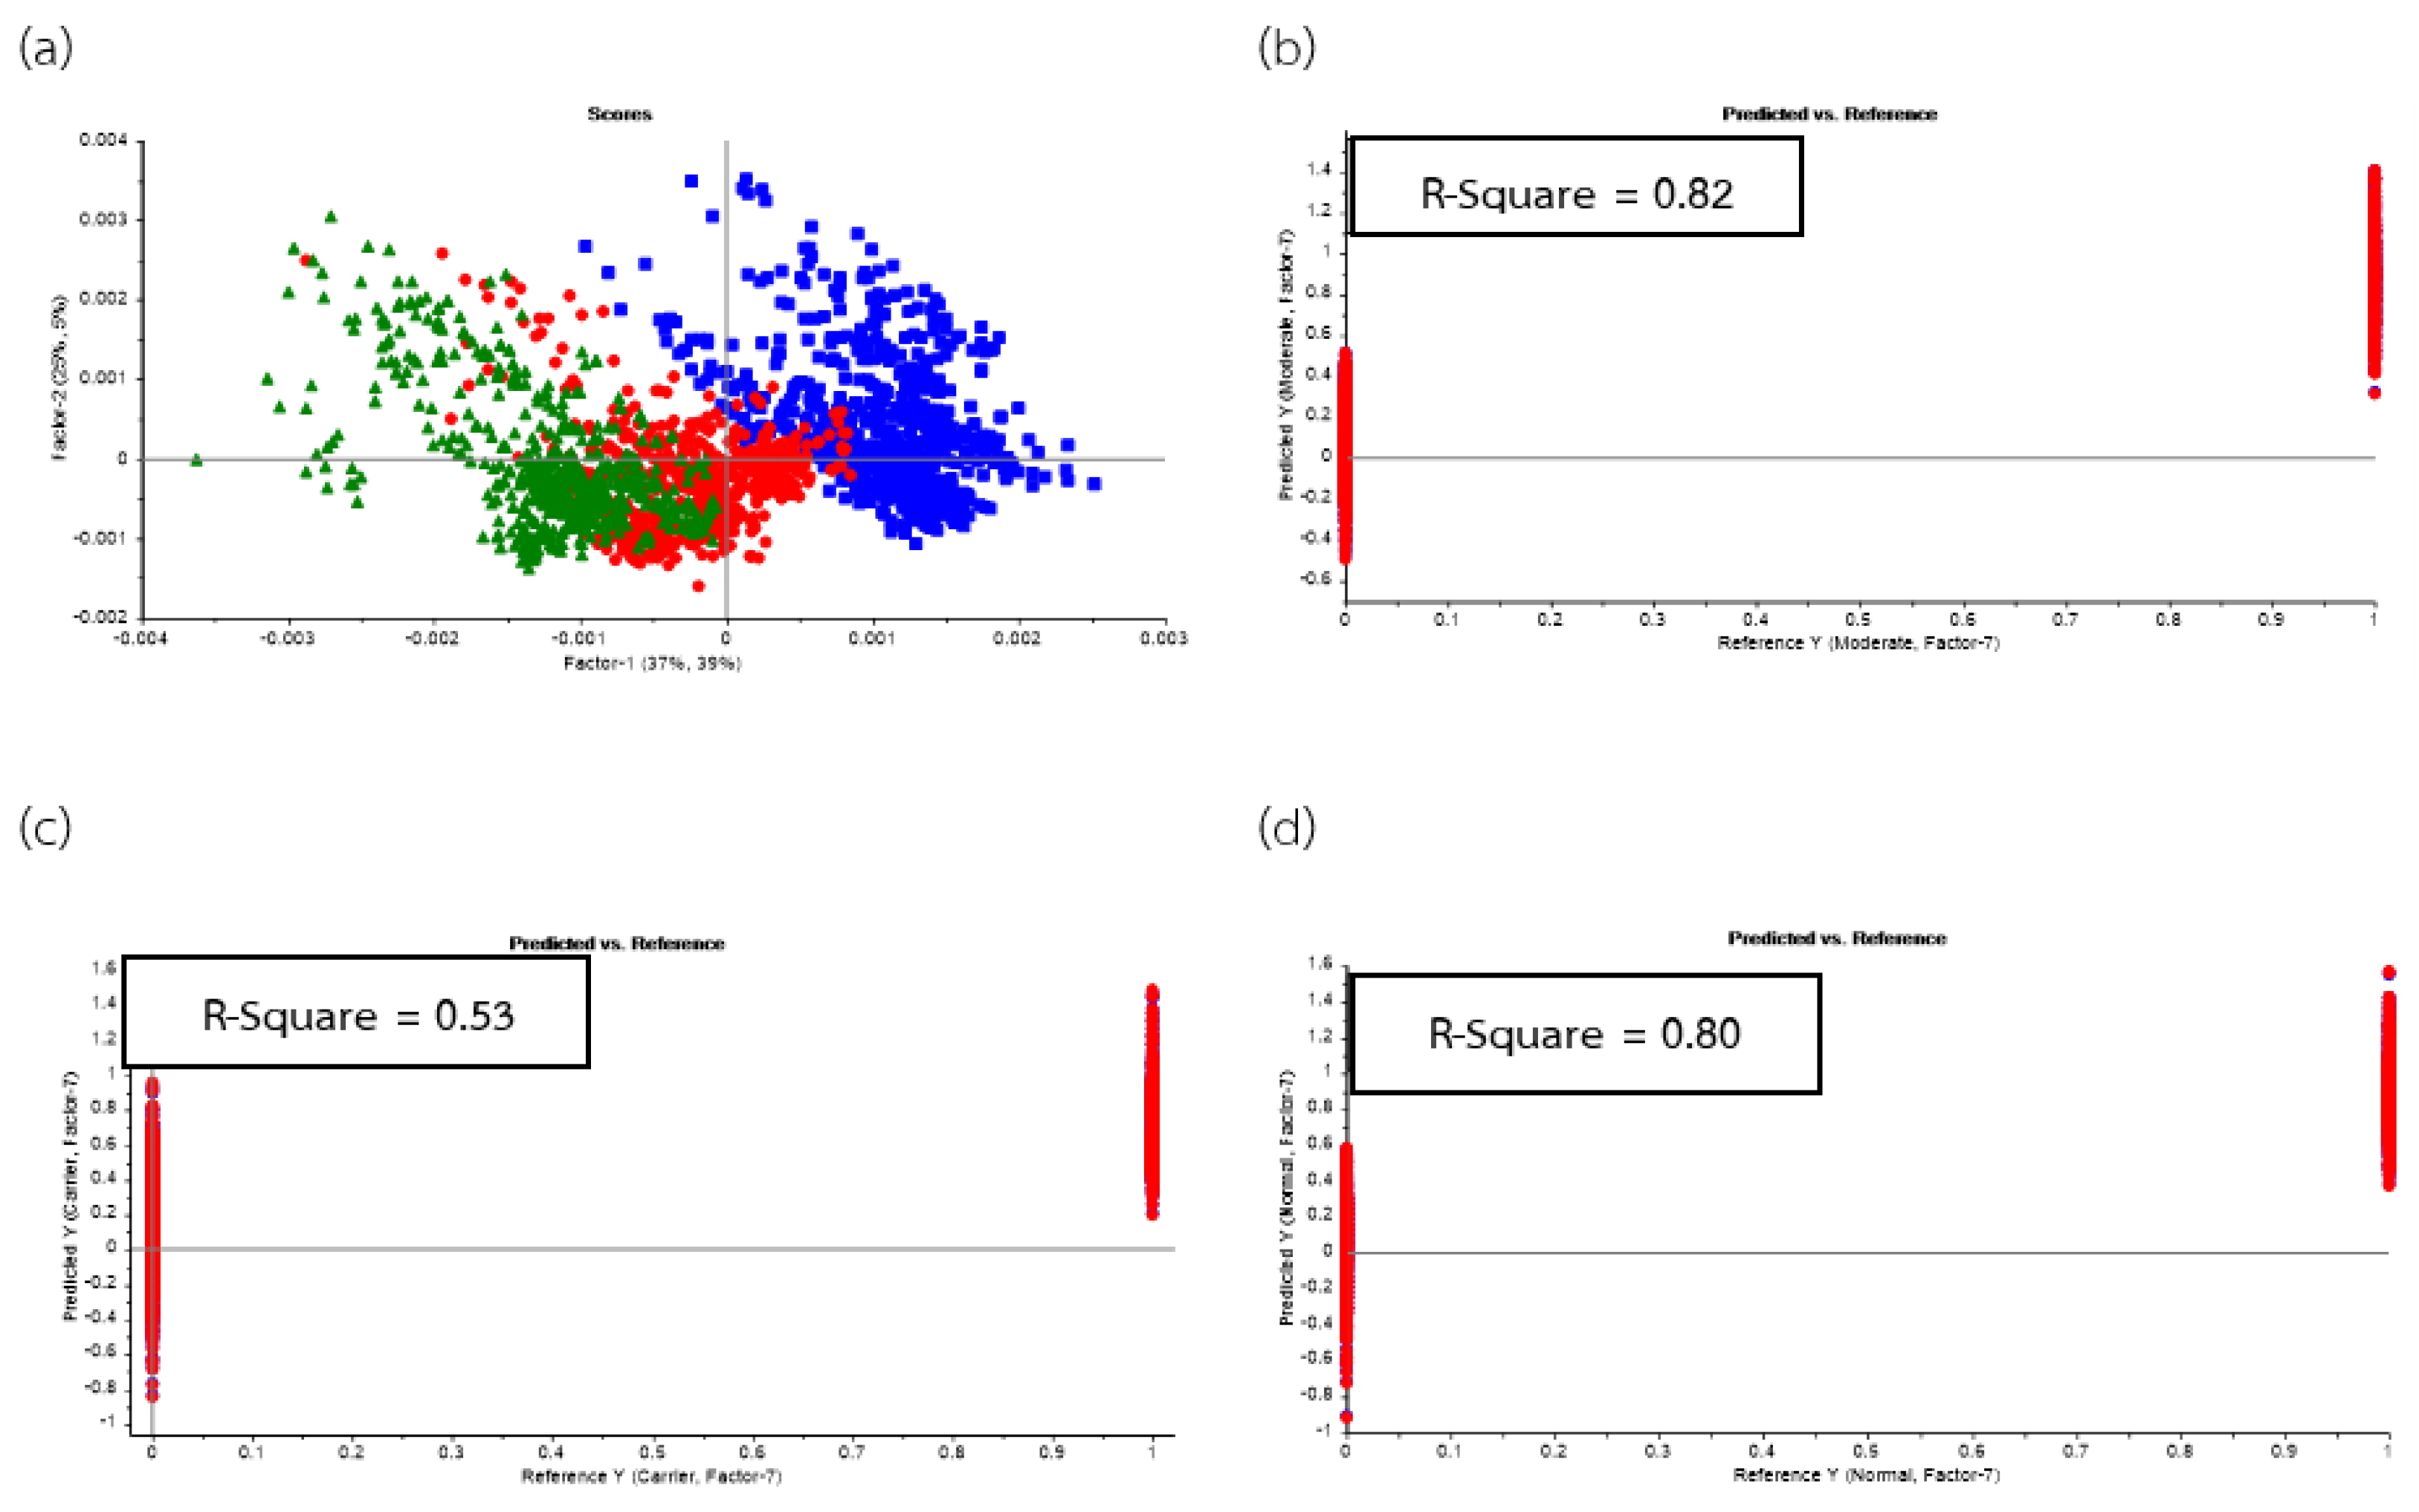
Figure 13.
PLS-DA prediction model for Hb lysate samples, demonstrating classification among Normal (Normal, Group 10), Carrier (Alpha-thalassemia 1 heterozygote, Group 21) and Disease (Hb H Disease, Group 51) groups. Each group contained 31 samples (n = 31), with a total of 3021 spectra analyzed.
Figure 13.
PLS-DA prediction model for Hb lysate samples, demonstrating classification among Normal (Normal, Group 10), Carrier (Alpha-thalassemia 1 heterozygote, Group 21) and Disease (Hb H Disease, Group 51) groups. Each group contained 31 samples (n = 31), with a total of 3021 spectra analyzed.
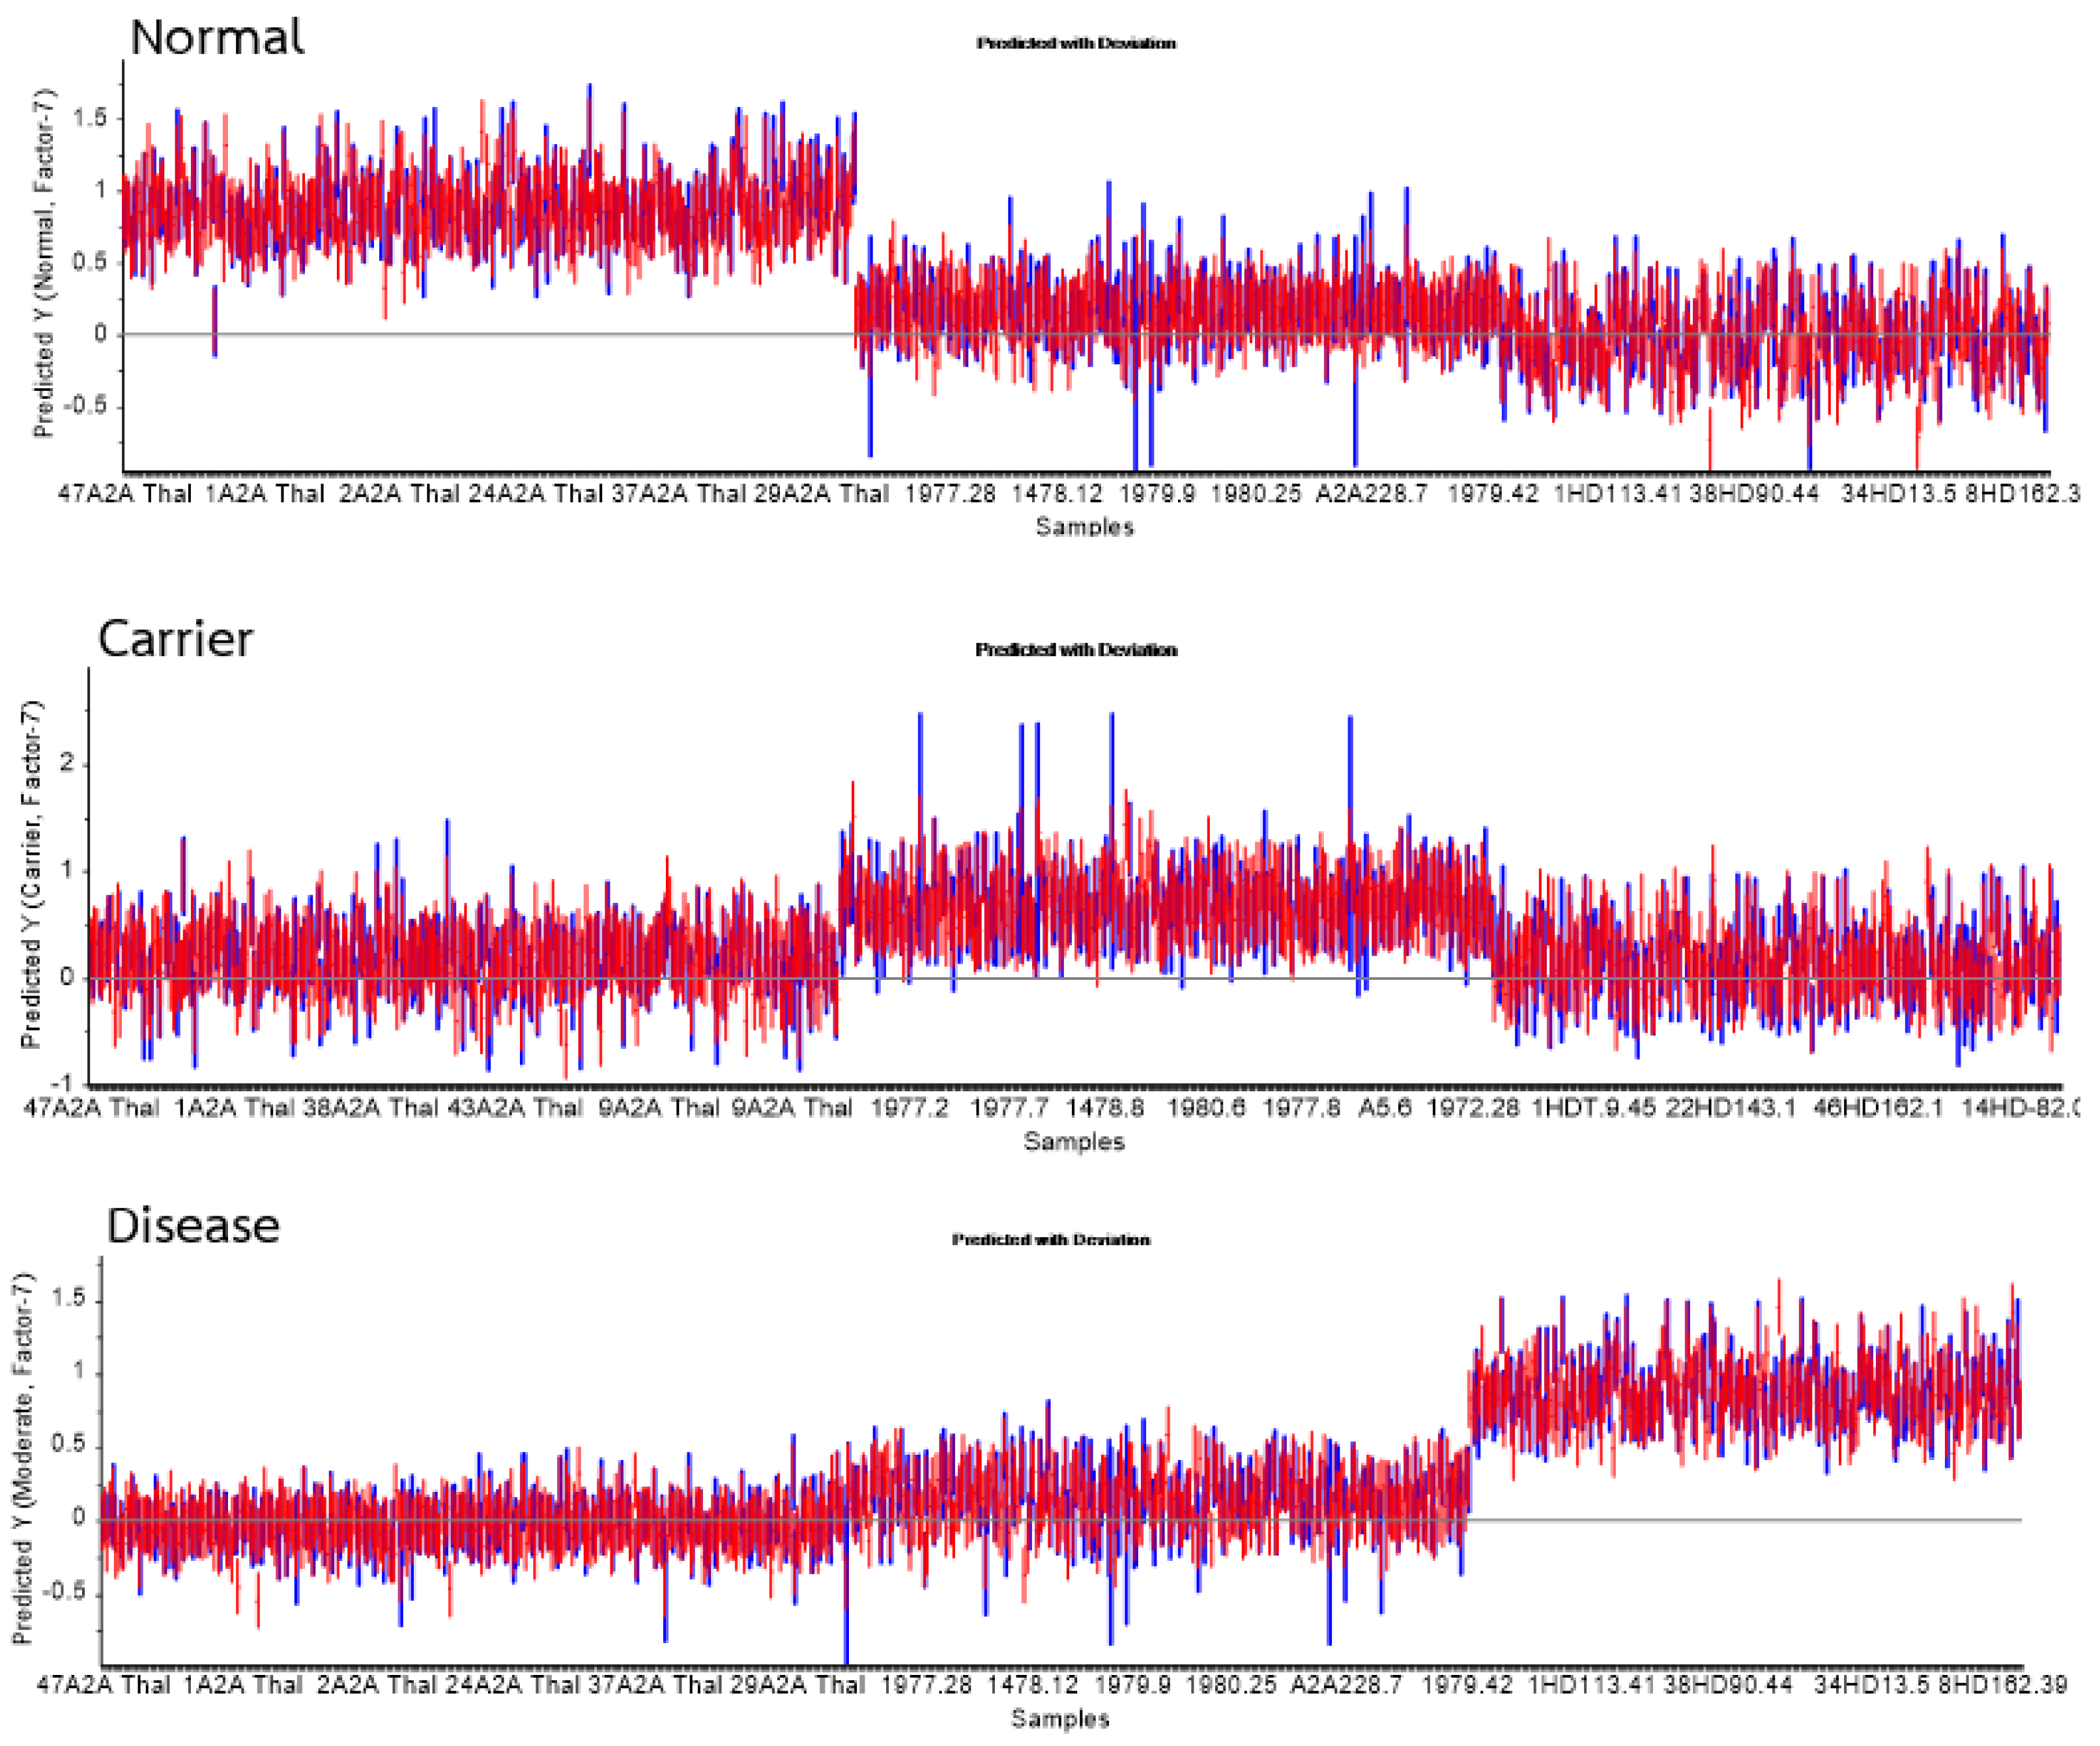
Figure 14.
Heatmap of FTIR spectra of Hb lysate samples comparing absorbance values across functional group regions among (Normal, Group 10), Carrier (Alpha-thalassemia 1 heterozygote, Group 21) and Disease (Hb H Disease, Group 51) groups. The analysis was conducted using Orange (Quasar) with normalization and Min–Max scaling applied per functional group. Normal.
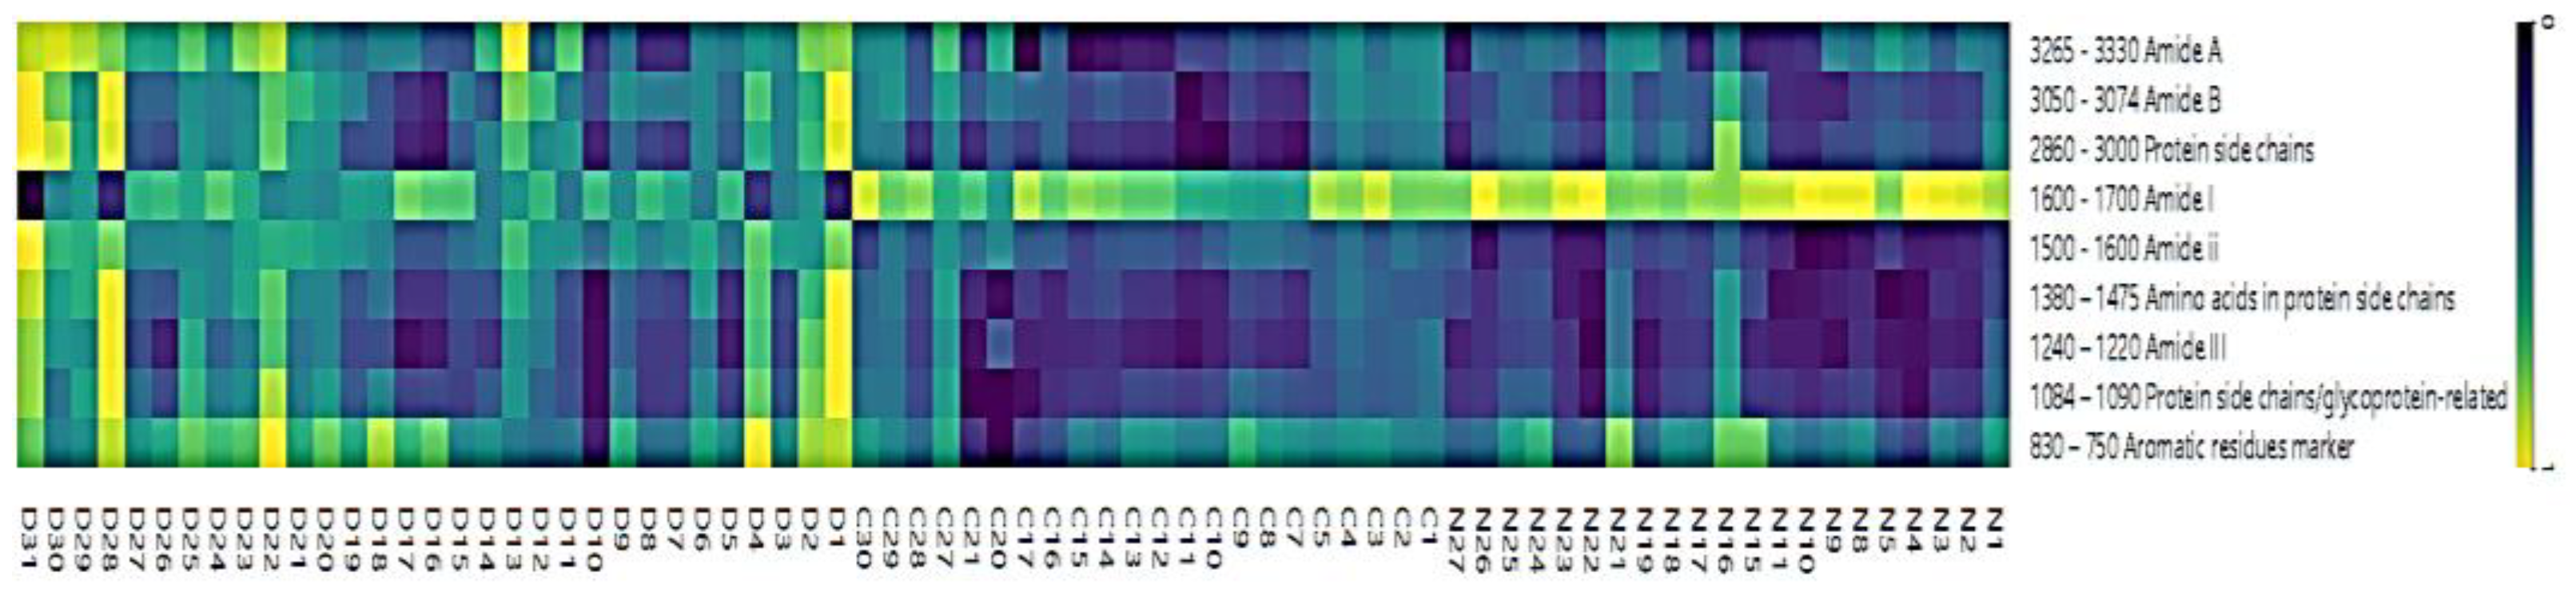

Table 4.
Sensitivity and specificity values calculated from the PLS-DA prediction analysis for model performance evaluation.
Table 4.
Sensitivity and specificity values calculated from the PLS-DA prediction analysis for model performance evaluation.
| Group | Statistics | No. Vigor | Sensitivity | Specificity |
|---|---|---|---|---|
| Normal | True positive | 378 | 0.98 | 0.99 |
| False Positive | 6 | |||
| Carrier | True positive | 272 | 0.81 | 0.91 |
| False Positive | 62 | |||
| Disease | True positive | 287 | 0.99 | 1.00 |
| False Positive | 3 |
The analysis revealed that the Normal group exhibited the highest absorbance intensity in the Amide I region (1600–1700 cm⁻¹), particularly around ~1650 cm⁻¹, corresponding to a well-preserved α-helix protein structure of red blood cells. In addition, this group showed higher absorbance than both the Carrier and Disease groups in the Amide II region (1500–1600 cm⁻¹) and amino-acid side-chain bands (1452 and 1387 cm⁻¹), confirming the stability of the secondary structure and amino-acid side-chain environments in healthy individuals. The Carrier group displayed slightly reduced absorbance in both Amide I and Amide II bands compared with the Normal group but remained higher than the Disease group across several regions, indicating partial alteration of the protein structure due to genetic mutation, though not severe. Absorbance in protein side-chain regions (3000 and 2875 cm⁻¹) was slightly lower than that of the Normal group, suggesting moderate perturbation of protein lateral chains. In contrast, the Disease group demonstrated the most pronounced abnormalities. Absorbance in Amide I and Amide II markedly decreased compared with both the Normal and Carrier groups, indicating loss of secondary-structure stability. Meanwhile, this group exhibited the highest absorbance in Amide A (3265–3329 cm⁻¹, N–H stretching), reflecting hydrogen-bond disruption and possible protein unfolding or aggregation. Elevated absorbance was also observed in Amide III (1240–1220 cm⁻¹) and aromatic-residue markers (830–750 cm⁻¹), implying tertiary-structure disruption and alteration of aromatic amino acids such as tyrosine and phenylalanine.
In summary, the Normal group showed the highest absorbance in functional groups related to stable protein structures—Amide I, Amide II, and amino-acid side chains—whereas the Disease group exhibited the highest absorbance in Amide A, Amide III, and aromatic-residue markers, indicative of structural destabilization and protein conformational changes associated with the severity of thalassemia. The Carrier group presented intermediate spectral features between the Normal and Disease groups, reflecting mild structural alterations consistent with its subclinical phenotype.
4. Conclusion
This study employed infrared Microspectroscopy to analyze and differentiate various forms of thalassemia and to develop a spectral database for identifying blood samples at risk of thalassemia. By constructing a comprehensive IR spectral database from patient blood samples classified according to disease severity—namely Normal, Carrier, and Disease groups—and applying Principal Component Analysis (PCA) and Partial Least Squares Discriminant Analysis (PLS-DA), it was possible to successfully classify the samples based on their biochemical characteristics. The analysis revealed clear molecular-level differences among groups, particularly in protein secondary structure variations (Amide I region) and changes in amino acid side-chain composition. These findings demonstrate that specific alterations in hemoglobin structure are closely correlated with thalassemia severity. When evaluated in terms of diagnostic performance, the classification models achieved sensitivity and specificity values ranging from 80–90%, confirming the reliability of the proposed analytical approach. Future work will involve expanding the dataset by collecting additional blood samples from each thalassemia subtype, with a particular focus on PCR-based genotyping of α-Thalassemia 1 and α-Thalassemia 2. This will help refine classification of Normal individuals without latent α-thalassemia mutations and enhance model robustness through AI-assisted spectral analysis. Furthermore, a petty patent has been officially registered under the title “Process for Preparation and Measurement of Blood Samples” (Application No. 2503002000). The next phase of this research will focus on integrating the developed system for pilot screening of thalassemia at the Thai Red Cross Society, aiming to establish a practical, rapid, and cost-effective diagnostic tool for clinical implementation.
Author Contributions
Conceptualization, K.T.; Methodology, T.K., S.Tu. and R.Pu.; Software, R.Ph. and R.R.; Validation, K.T. and R.Ph.; Formal analysis, T.K., S.S., and S.Tu .; Investigation, S.N.; Resources, R.K.; Data curation, B.K., S.T., S.W. and W.T.; Writing—original draft, K.N. and T.S.; Writing—review & editing, B.K., S.T., S.W. and W.T. All authors have read and agreed to the published version of the manuscript.
Funding
This work was supported by Fundamental fund research grant number ID4779133. The study was conducted in accordance with the Declaration of Helsinki and approved by the Human Research Ethics Committee of the Naradhiwas Rajanagarindra Hospital (REC 001/2564). Date: 1 April 2021.
Institutional Review Board Statement
Faculty of Allied Health Sciences, Nakhon Ratchasima College, Certificate of Approval NMCEC-0020/2566, 10 April 2025
Informed Consent Statement
Written informed consent was obtained from all participants involved in this study.
Data Availability Statement
The datasets used and/or analyzed during the current study are available from the corresponding author upon reasonable request.
Acknowledgments
We thank Synchrotron Light Research Institute (public organization), Blood Testing Section, Regional Blood Centre, Medical Technology, Faculty of Allied Health Sciences, Regional health promotion center 9, Faculty of Public Health, Mahasarakham University, provided general support for their support and collaboration throughout the study.
Conflicts of Interest
The authors declare that they have no competing interests.
References
- Aksoy, C.; Uckan, D.; Severcan, F. FTIR spectroscopic imaging of mesenchymal stem cells in beta thalassemia major disease state. Biomedical Spectroscopy and Imaging 2012, 1, 67–78.
- Bajwa, H.; Basit, H. Thalassemia. In: StatPearls [Internet]. Treasure Island (FL): StatPearls Publishing; 2022.
- Barth, A. Infrared spectroscopy of proteins. Biochimica et Biophysica Acta (BBA) – Bioenergetics 2007, 1767(9), 1073–1101.
- Berzal, F. Redes Neuronales & Deep Learning. 2018.
- Breiman, L. Bagging predictors. Machine Learning 1996, 24, 123–140.
- Butler, H. J.; Cameron, J. M.; Jenkins, C. A.; Hithell, G.; Hume, S.; Hunt, N. T.; Baker, M. J. Shining a light on clinical spectroscopy: Translation of diagnostic IR, 2D-IR and Raman spectroscopy towards the clinic. Clinical Spectroscopy 2019, 1, 100003. [CrossRef]
- Chonat, S.; Quinn, C. T. Current standards of care and long-term outcomes for thalassemia and sickle cell disease. In: Malik, P.; Tisdale, J. (Eds.) Gene and Cell Therapies for Beta-Globinopathies. Advances in Experimental Medicine and Biology 2017, 1013.
- Chukiatsiri, S.; Siriwong, S.; Thumanu, K. Pupae protein extracts exert anticancer effects by down-regulating IL-6, IL-1β, and TNF-α via biomolecular changes in human breast cancer cells. Biomedicine & Pharmacotherapy 2020, 128, 110278.
- De Bruyne, S.; Speeckaert, M. M.; Delanghe, J. R. Applications of mid-infrared spectroscopy in the clinical laboratory setting. Critical Reviews in Clinical Laboratory Sciences 2017. [CrossRef]
- Derczynski, L. Complementarity, F-score, and NLP evaluation. In: Proceedings of LREC 2016 2016, 261–266.
- Devore, J. L. Probability and Statistics for Engineering and the Sciences. Cengage Learning: 2010.
- Dunkhunthod, B.; Chira-atthakit, B.; Chitsomboon, B.; Kiatsongchai, R.; Thumanu, K.; Musika, S.; Sittisart, P. Apoptotic induction of the water fraction of Pseuderanthemum palatiferum ethanol-extract powder in Jurkat cells monitored by FTIR microspectroscopy. ScienceAsia 2021. [CrossRef]
- Dybas, J.; Alcicek, F. C.; Wajda, A.; Kaczmarska, M.; Zimna, A.; Bulat, K.; Marzec, K. M. Trends in biomedical analysis of red blood cells—Raman spectroscopy versus other spectroscopic, microscopic and classical techniques. TrAC Trends in Analytical Chemistry 2022, 146, 116481. [CrossRef]
- Efron, B. Bootstrap methods: another look at the jackknife. Annals of Statistics 1979, 7(1), 1–26. [CrossRef]
- Fadlelmoula, A.; Pinho, D.; Carvalho, V. H.; Catarino, S. O.; Minas, G. Fourier Transform Infrared (FTIR) spectroscopy to analyse human blood over the last 20 years: A review towards lab-on-a-chip devices. Micromachines (Basel) 2022, 13(2). [CrossRef]
- Fawcett, T. An introduction to ROC analysis. Pattern Recognition Letters 2006, 27(8), 861–874.
- Ferih, K.; Elsayed, B.; Elshoeibi, A. M.; Elsabagh, A. A.; Elhadary, M.; Soliman, A.; Abdalgayoom, M.; Yassin, M. Applications of artificial intelligence in thalassemia: A comprehensive review. Diagnostics 2023, 13, 1551. [CrossRef]
- Finlayson, D.; Rinaldi, C.; Baker, M. J. Is infrared spectroscopy ready for the clinic? Analytical Chemistry 2019, 91, 12117–12128. [CrossRef]
- Fucharoen, S.; Winichagoon, P. Haemoglobinopathies in Southeast Asia. Indian Journal of Medical Research 2011, 134(4), 498–506.
- Gareth, J.; Witten, D.; Hastie, T.; Tibshirani, R. An Introduction to Statistical Learning. Springer: 2013.
- Guo, S.; Wei, G.; Chen, W.; Lei, C.; Xu, C.; Guan, Y.; Liu, H. Fast and deep diagnosis using blood-based ATR-FTIR spectroscopy for digestive tract cancers. Biomolecules 2022, 12(12). [CrossRef]
- Harnsajarupant, P. Thalassemia. Jetanin Academic Journal 2023, 10(1). Available from: https://jetanin.com/th.
- James, G.; Witten, D.; Hastie, T.; Tibshirani, R. An Introduction to Statistical Learning. Springer: 2013.
- Joyce, E. J.; Krimm, S.; Miller, W. G. Infrared spectra and assignments for the amide I band in polypeptides. Biopolymers 1993, 33(12), 1741–1752.
- Kaimuangpak, K.; Tamprasit, K.; Thumanu, K.; Weerapreeyakul, N. Extracellular vesicles derived from microgreens of Raphanus sativus L. var. caudatus Alef contain bioactive macromolecules and inhibit HCT116 cell proliferation. Scientific Reports 2022, 12, 15686. [CrossRef]
- Kochan, K.; Bedolla, D. E.; Perez-Guaita, D.; Adegoke, J. A.; Veettil, T. C. P.; Martin, M.; Wood, B. R. Infrared spectroscopy of blood. Applied Spectroscopy 2020, 75(6), 611–646. [CrossRef]
- Kohavi, R. A study of cross-validation and bootstrap for accuracy estimation and model selection. In: Proceedings of IJCAI 1995.
- Krimm, S.; Bandekar, J. Vibrational spectroscopy and conformation of peptides, polypeptides, and proteins. Advances in Protein Chemistry 1986, 38, 181–364. [CrossRef]
- Liu, K.-Z.; Tsang, K.; Li, C.; Shaw, A.; Mantsch, H. Infrared spectroscopic identification of beta-thalassemia. Clinical Chemistry 2003, 49, 1125–1132. [CrossRef]
- Lorthongpanich, C.; Thumanu, K.; Tangkiettrakul, K.; Jiamvoraphong, N.; Laowtammathron, C.; Damkham, N.; Upratya, Y.; Issaragrisil, S. YAP as a key regulator of adipo-osteogenic differentiation in human MSCs. Stem Cell Research & Therapy 2019, 10, 402. [CrossRef]
- Luanpitpong, S.; Janan, M.; Thumanu, K.; Poohadsuan, J.; Rodboon, N.; Klaihmon, P.; Issaragrisil, S. Deciphering elevated lipid via CD36 in mantle cell lymphoma with bortezomib resistance using synchrotron-based FTIR spectroscopy of single cells. Cancers 2019, 11, 576. [CrossRef]
- MedlinePlus. Alpha thalassemia. [Online] 2023 [cited 2022 Dec 02]. Available from: https://3billion.io/blog/rare-disease-series-3-thalassemia/.
- Metz, C. E. Basic principles of ROC analysis. Seminars in Nuclear Medicine 1978, 8(4), 283–298.
- Mistek-Morabito, E.; Lednev, I. K. FT-IR spectroscopy for identification of biological stains for forensic purposes. Spectroscopy (Santa Monica) 2018, 33, 8–19.
- Mostaço-Guidolin, L. B.; Bachmann, L. Application of FTIR spectroscopy for identification of blood and leukemia biomarkers: A review over the past 15 years. Applied Spectroscopy Reviews 2011, 46(5), 388–404. [CrossRef]
- Movasaghi, Z.; Rehman, S.; Rehman, I. U. Fourier transform infrared (FTIR) spectroscopy of biological tissues. Applied Spectroscopy Reviews 2008, 43(2), 134–179. [CrossRef]
- Peng, L. X.; Wang, G. W.; Yao, H. L.; Huang, S. S.; Wang, Y. B.; Tao, Z. H.; Li, Y. Q. [FTIR-HATR to identify beta-thalassemia and its mechanism study]. Guang Pu Xue Yu Guang Pu Fen Xi 2009, 29(5), 1232–1236.
- Powers, D. M. W. Evaluation: from precision, recall and F-factor to ROC, informedness, markedness & correlation. Journal of Machine Learning Technologies 2007, 2, 37–63.
- Raschka, S. Model evaluation, model selection, and algorithm selection in machine learning. arXiv preprint 2018.
- Remanan, S.; Rajeev, P.; Sukumaran, K.; Savithri, S. Robustness of FTIR-based ultrarapid COVID-19 diagnosis using PLS-DA. ACS Omega 2022, 7(50), 47357–47371.
- Saito, T.; Rehmsmeier, M. The precision-recall plot is more informative than the ROC plot for imbalanced datasets. PLoS ONE 2015, 10(3).
- Sammut, C.; Webb, G. I. Encyclopedia of Machine Learning. 2010.
- Sanchaisuriya, K.; Fucharoen, G.; Sae-ung, N.; Sae-ue, N.; Baisungneon, R.; Jetsrisuparb, A.; Fucharoen, S. Molecular and hematological characterization of HbE heterozygote with alpha-thalassemia determinant. Southeast Asian Journal of Tropical Medicine and Public Health 1997, 28 Suppl. 3, 100–103.
- Sasaki, Y. The Truth of the F-measure. School of Computer Science, University of Manchester: 2007.
- Srisongkram, T.; Weerapreeyakul, N.; Thumanu, K. Evaluation of melanoma (SK-MEL-2) cell growth between 3D and 2D cell cultures with FTIR microspectroscopy. International Journal of Molecular Sciences 2020, 21, 4141.
- Spoto, F.; Martimort, P.; Drusch, M. Selecting and interpreting measures of thematic classification accuracy. Remote Sensing of Environment 1997, 62(1), 77–89.
- Sukpong, S.; Thumanu, K.; Saovana, T.; Siriwong, S.; Changlek, S. Application of infrared spectroscopy for classification of thalassemia and hemoglobin E. Suranaree Journal of Science & Technology 2018, 25(2).
- Surewicz, W. K.; Mantsch, H. H.; Chapman, D. Determination of protein secondary structure by Fourier transform infrared spectroscopy: A critical assessment. Biochemistry 1993, 32(2), 389–394. [CrossRef]
- Tantiworawit, A.; et al. Hematologic parameters and thalassemia diagnosis in Northern Thailand. Hemoglobin 2019.
- Taylor, J. R. An Introduction to Error Analysis. University Science Books: 1997.
- Tharwat, A. Classification assessment methods. Applied Computing and Informatics 2018.
- Thongprasert, S.; et al. Hemoglobin typing and thalassemia carrier screening in Thai population. Southeast Asian Journal of Tropical Medicine and Public Health 2012.
- Thumanu, K.; Sangrajrang, S.; Khuhaprema, T.; Kalalak, A.; Tanthanuch, W.; Pongpiachan, S.; Heraud, P. Diagnosis of liver cancer from blood sera using FTIR microspectroscopy: A preliminary study. Journal of Biophotonics 2014, 1–10. [CrossRef]
- Thumanu, K.; Tanthanuch, W.; Ye, D.; Sangmalee, A.; Lorthongpanich, C.; Heraud, P.; Parnpai, R. Spectroscopic signature of mouse embryonic stem-cell–derived hepatocytes using synchrotron FTIR microspectroscopy. Journal of Biomedical Optics 2011, 16(5), 057005.
- Tian, F.; Rodtong, S.; Thumanu, K.; Hua, Y.; Roytrakul, S.; Yongsawatdigul, J. Molecular insights into antibacterial peptides derived from chicken plasma hydrolysates. Foods 2022, 11, 3564.
- Walton, D. S.; Baker, M. J.; Goodacre, R.; et al. Structural characterization of proteins and their assemblies using FTIR spectroscopy. Nature Protocols 2015, 10(1), 100–118.
- Wang, R.; Wang, Y. Fourier transform infrared spectroscopy in oral cancer diagnosis. International Journal of Molecular Sciences 2021, 22(3), 1206. [CrossRef]
- Wasi, P.; Pootrakul, S.; Pootrakul, P.; Pravatmuang, P.; Initiator, P.; Fucharoen, S. Thalassemia in Thailand. Annals of the New York Academy of Sciences 1980, 344, 352–363. [CrossRef]
- Weatherall, D. J.; Clegg, J. B. The Thalassemia Syndromes, 4th ed.; Blackwell Science: 2001.
- World Health Organization. Guidelines for the Control of Haemoglobin Disorders. Geneva: 2011.
- Xu, Y.; Goodacre, R. On splitting training and validation set: a comparative study of cross-validation, bootstrap and systematic sampling for estimating generalization. n.d. (Preprint/Technical Report). [CrossRef]
Figure 5.
Dendrogram generated from Unsupervised Hierarchical Cluster Analysis (UHCA) of FTIR spectra from the Normal group using Ward’s algorithm, covering spectral regions 781–1751 cm⁻¹ and 2788–3712 cm⁻¹ (n = 32).
Figure 5.
Dendrogram generated from Unsupervised Hierarchical Cluster Analysis (UHCA) of FTIR spectra from the Normal group using Ward’s algorithm, covering spectral regions 781–1751 cm⁻¹ and 2788–3712 cm⁻¹ (n = 32).
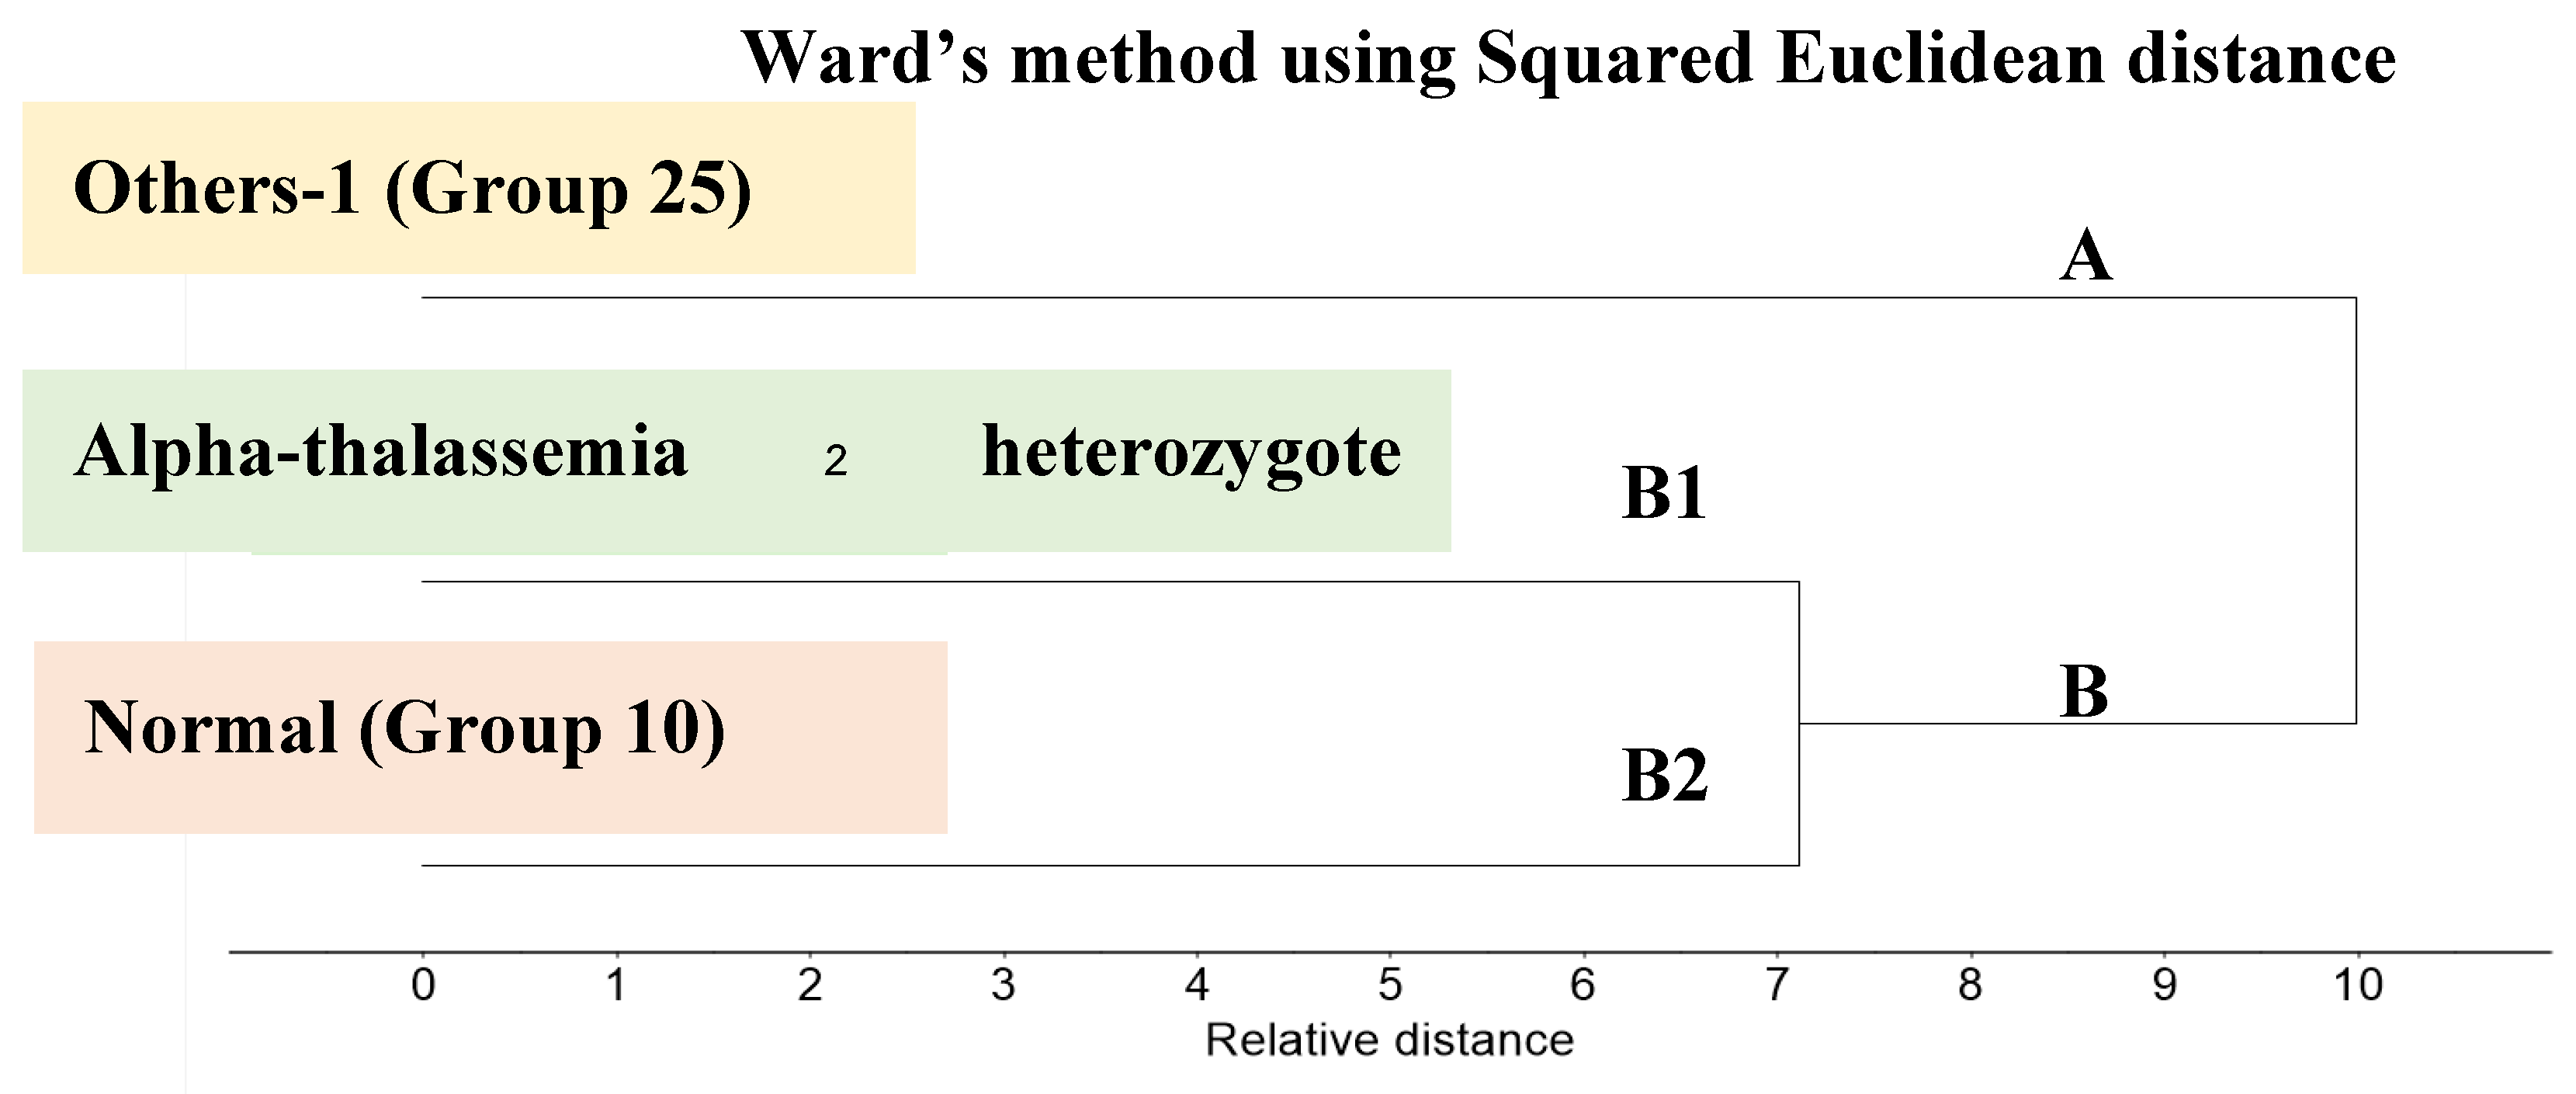
Figure 6.
Dendrogram generated from Unsupervised Hierarchical Cluster Analysis (UHCA) of FTIR spectra from the Carrier group using Ward’s algorithm, covering spectral regions 781–1751 cm⁻¹ and 2788–3712 cm⁻¹ (n = 20).
Figure 6.
Dendrogram generated from Unsupervised Hierarchical Cluster Analysis (UHCA) of FTIR spectra from the Carrier group using Ward’s algorithm, covering spectral regions 781–1751 cm⁻¹ and 2788–3712 cm⁻¹ (n = 20).
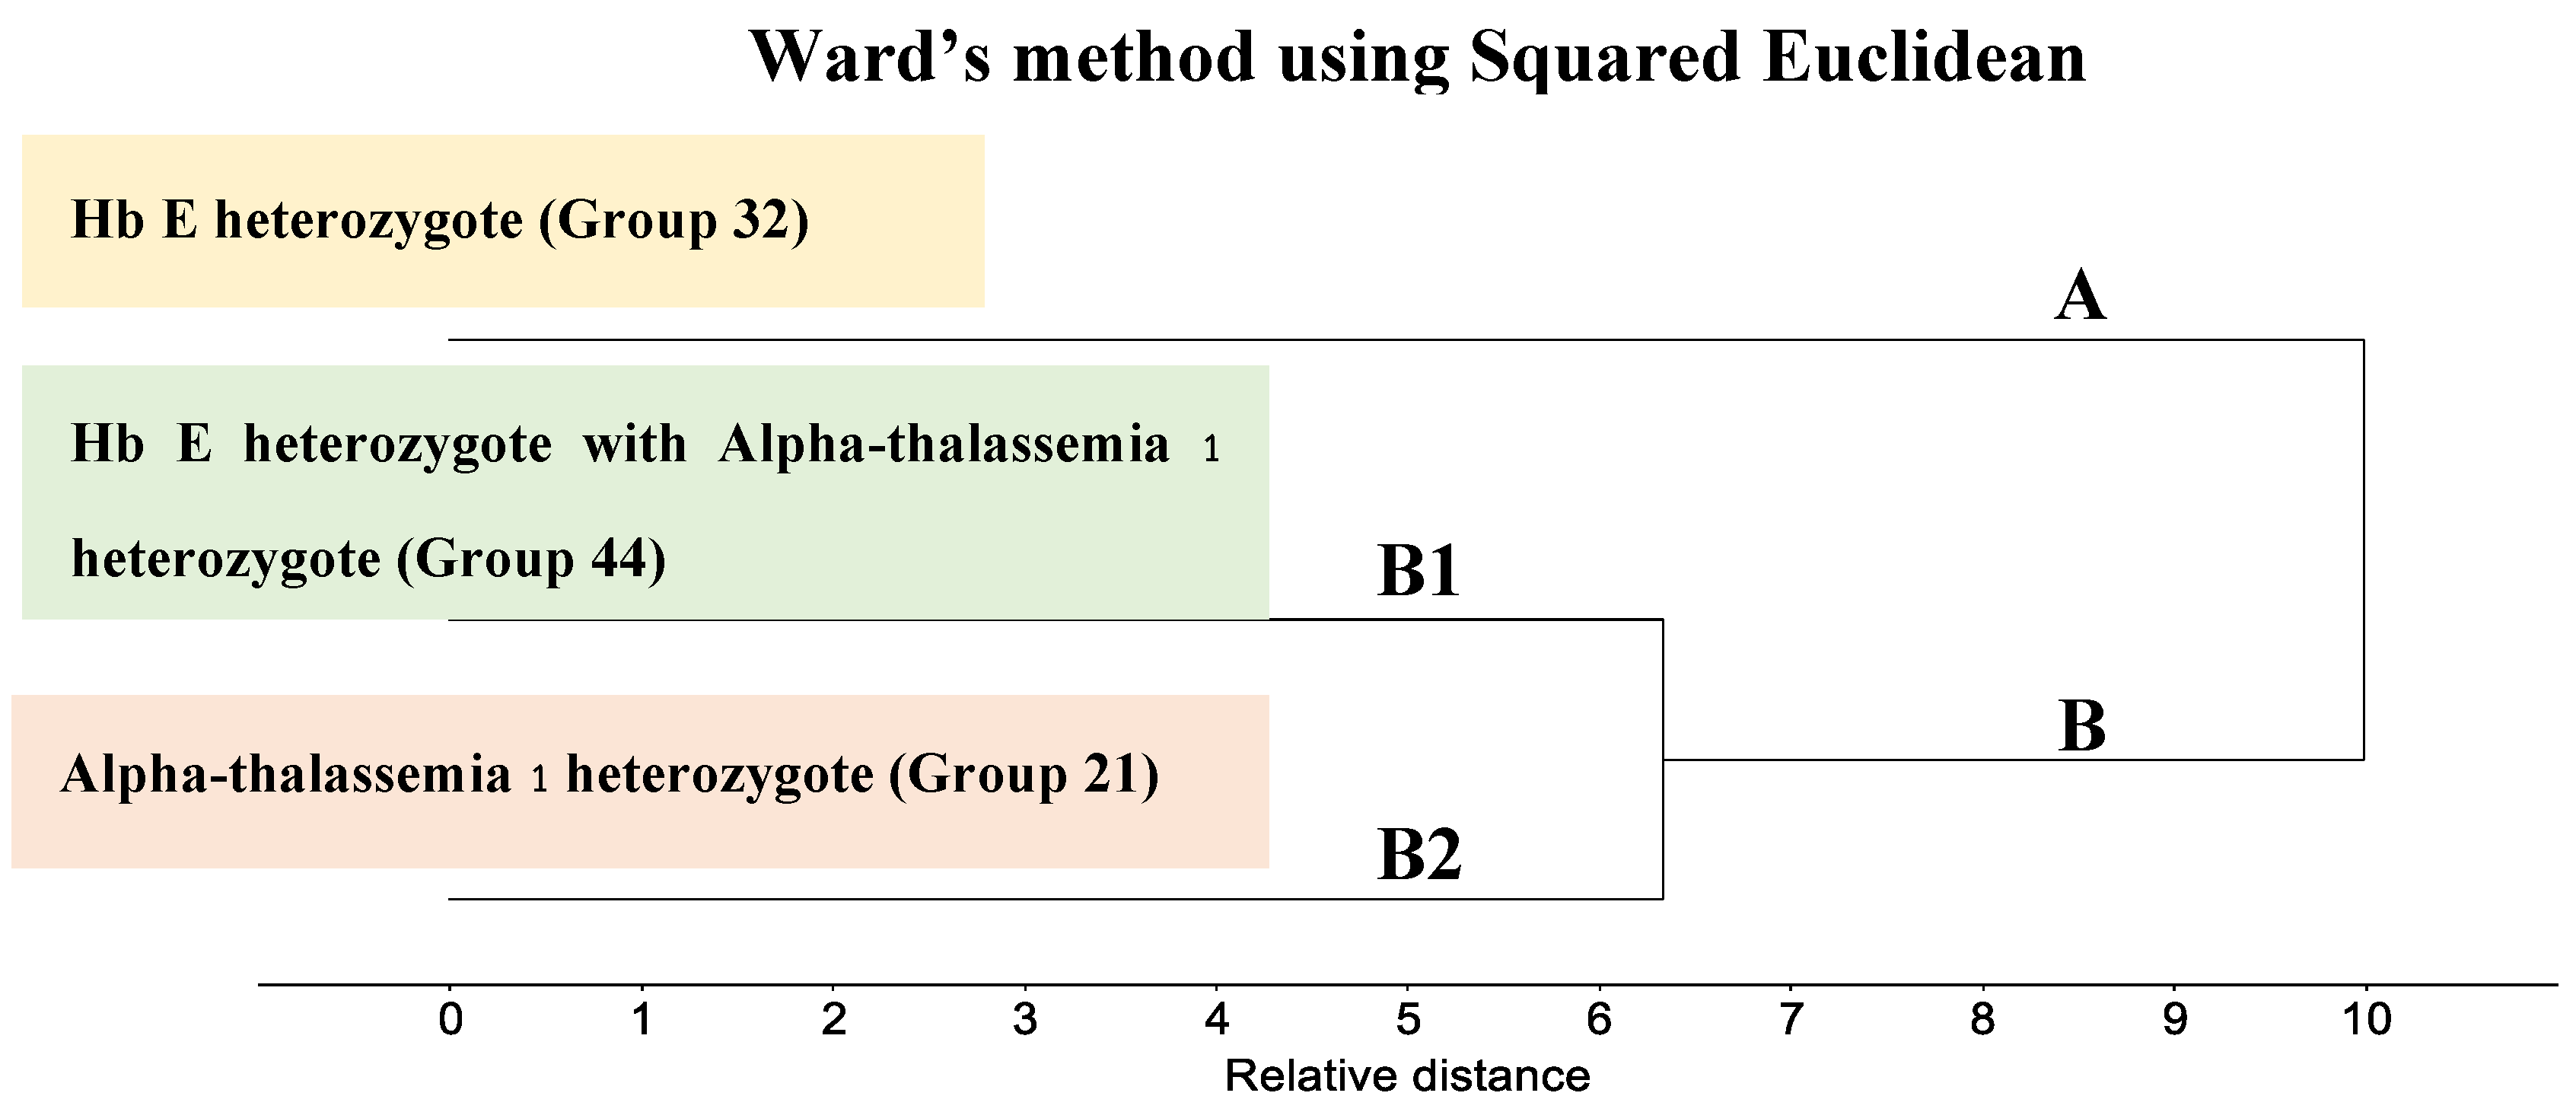
Figure 7.
Dendrogram generated from Unsupervised Hierarchical Cluster Analysis (UHCA) of FTIR spectra from the Disease group using Ward’s algorithm, covering spectral regions 781–1751 cm⁻¹ and 2788–3712 cm⁻¹ (n = 15).
Figure 7.
Dendrogram generated from Unsupervised Hierarchical Cluster Analysis (UHCA) of FTIR spectra from the Disease group using Ward’s algorithm, covering spectral regions 781–1751 cm⁻¹ and 2788–3712 cm⁻¹ (n = 15).
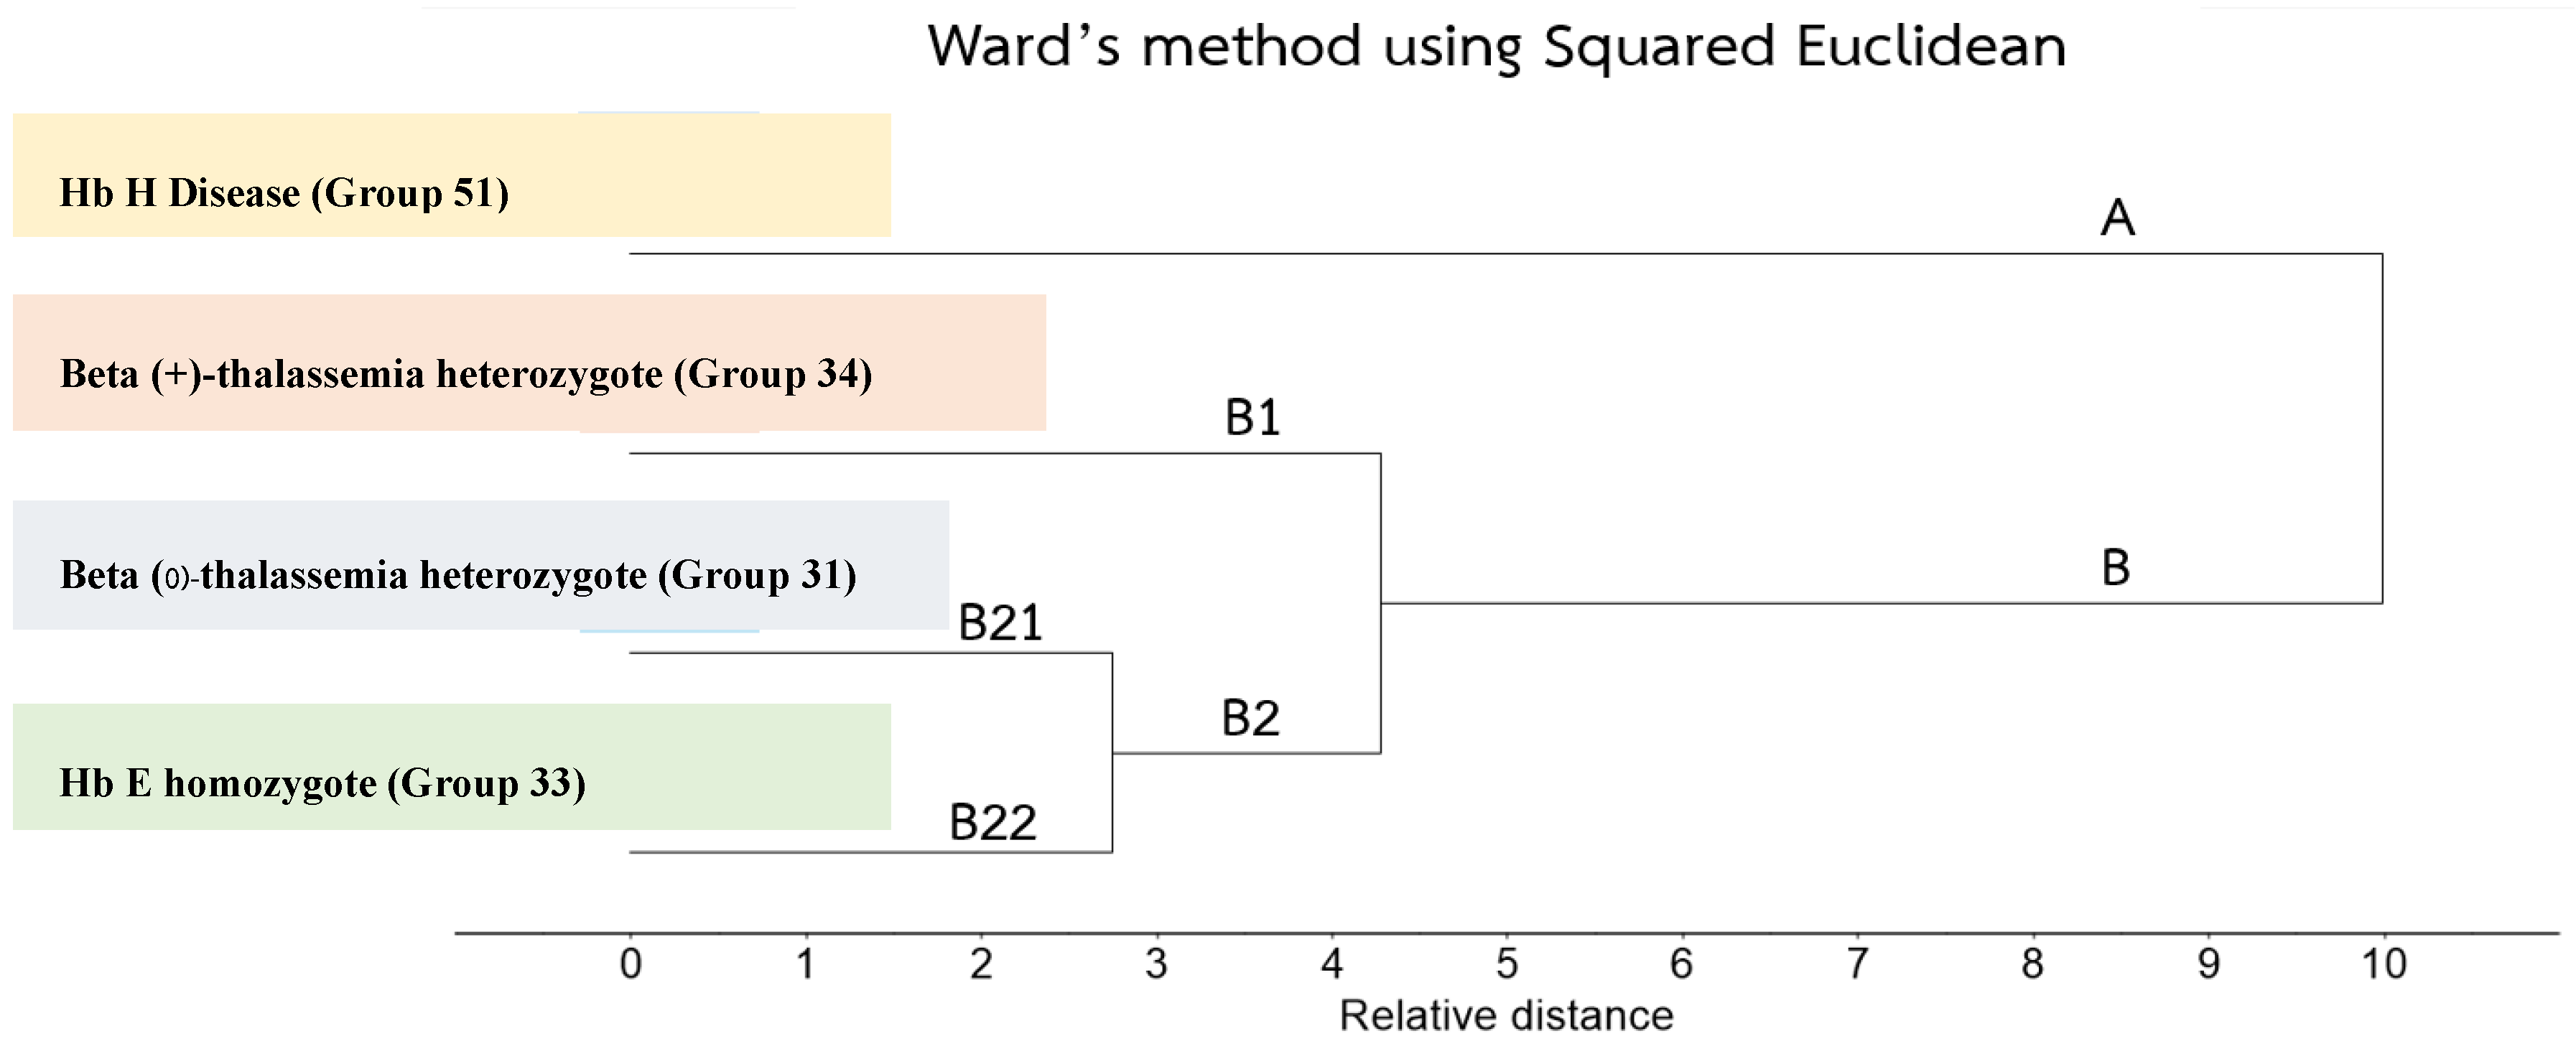
Figure 8.
Dendrogram generated from Unsupervised Hierarchical Cluster Analysis (UHCA) comparing FTIR spectra of Normal, Carrier, and Disease groups using Ward’s algorithm, covering spectral regions 781–1751 cm⁻¹ and 2788–3712 cm⁻¹ (n = 31).
Figure 8.
Dendrogram generated from Unsupervised Hierarchical Cluster Analysis (UHCA) comparing FTIR spectra of Normal, Carrier, and Disease groups using Ward’s algorithm, covering spectral regions 781–1751 cm⁻¹ and 2788–3712 cm⁻¹ (n = 31).
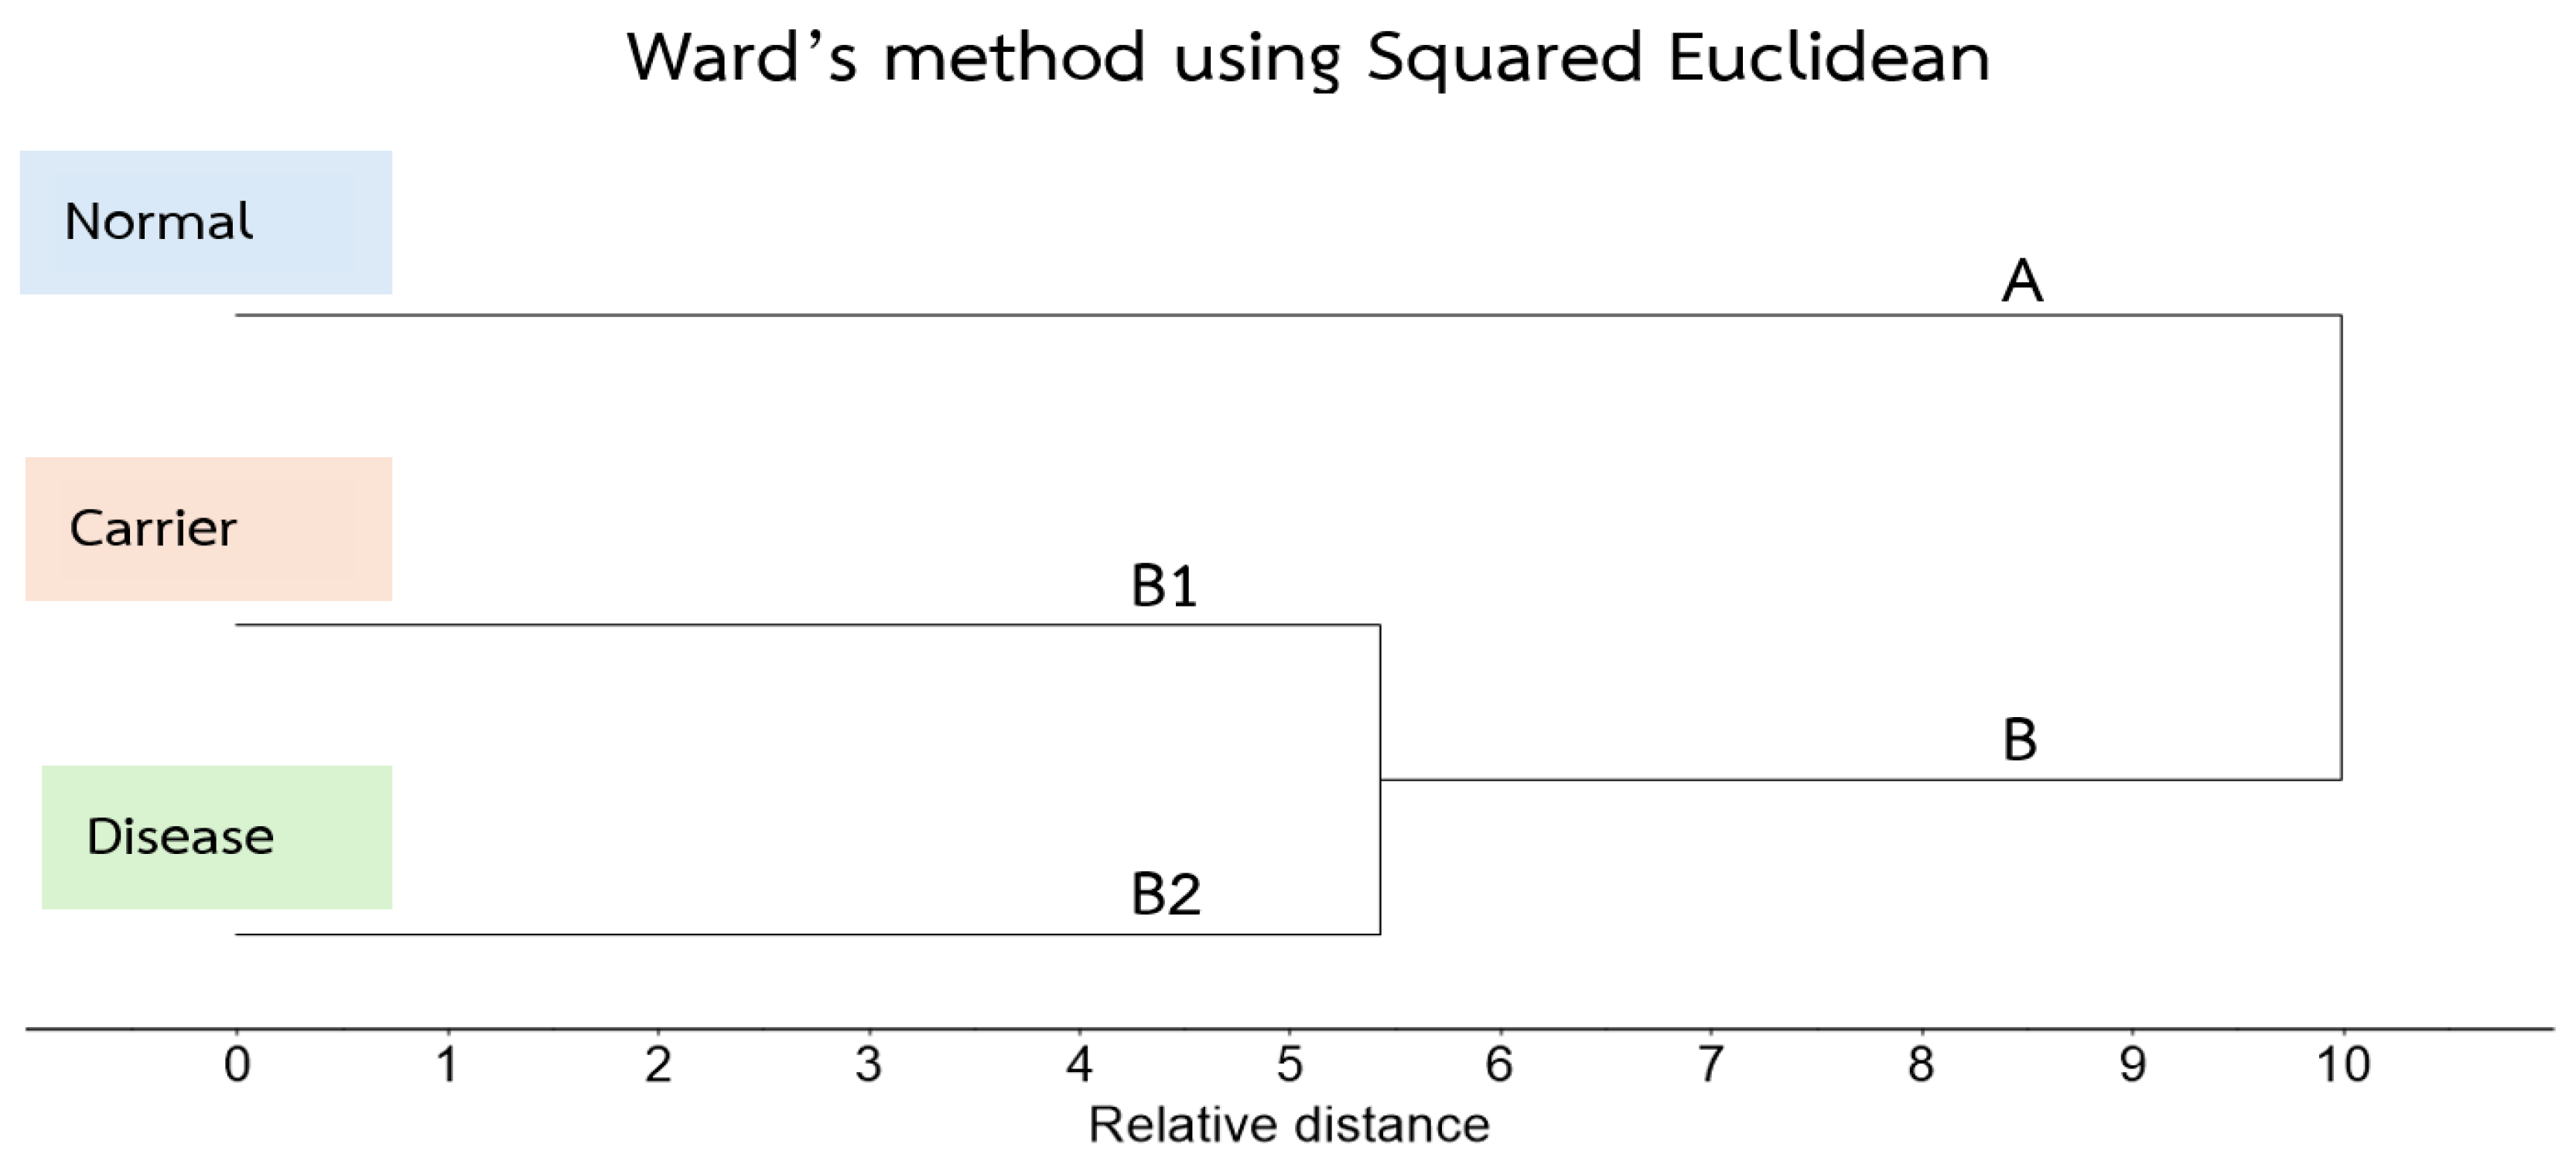
Table 1.
Genotypic and Phenotypic Classification of Thalassemia Study Groups.
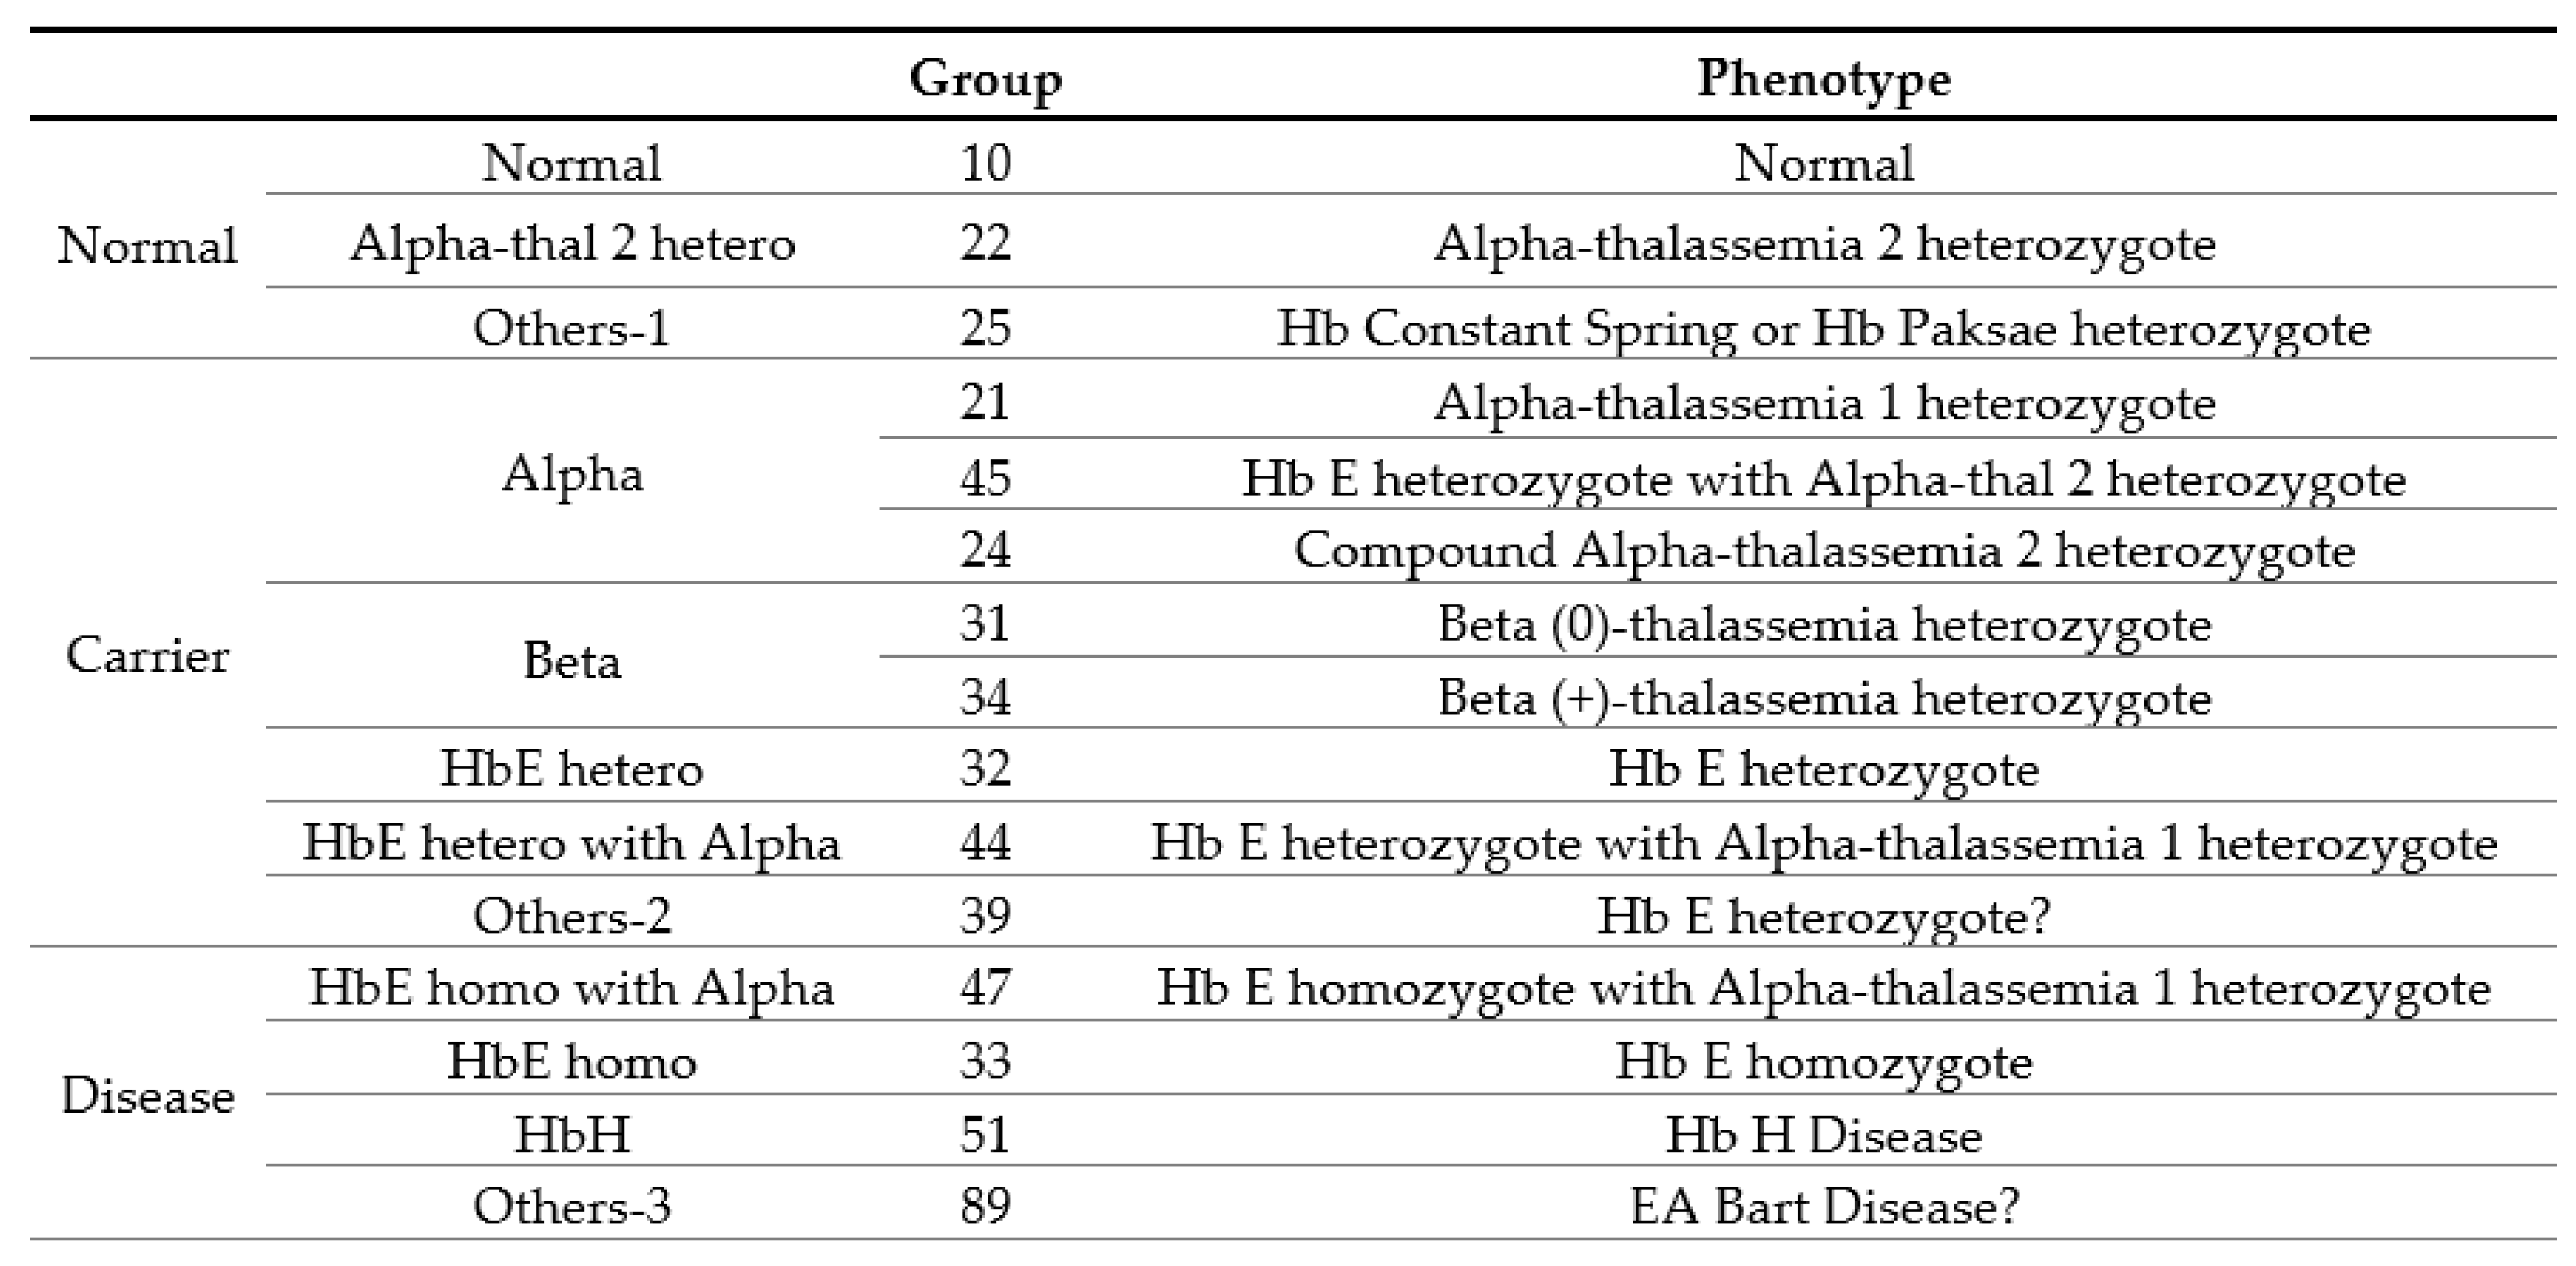
Table 2.
Clinical and Hematological Criteria for Thalassemia Classification.
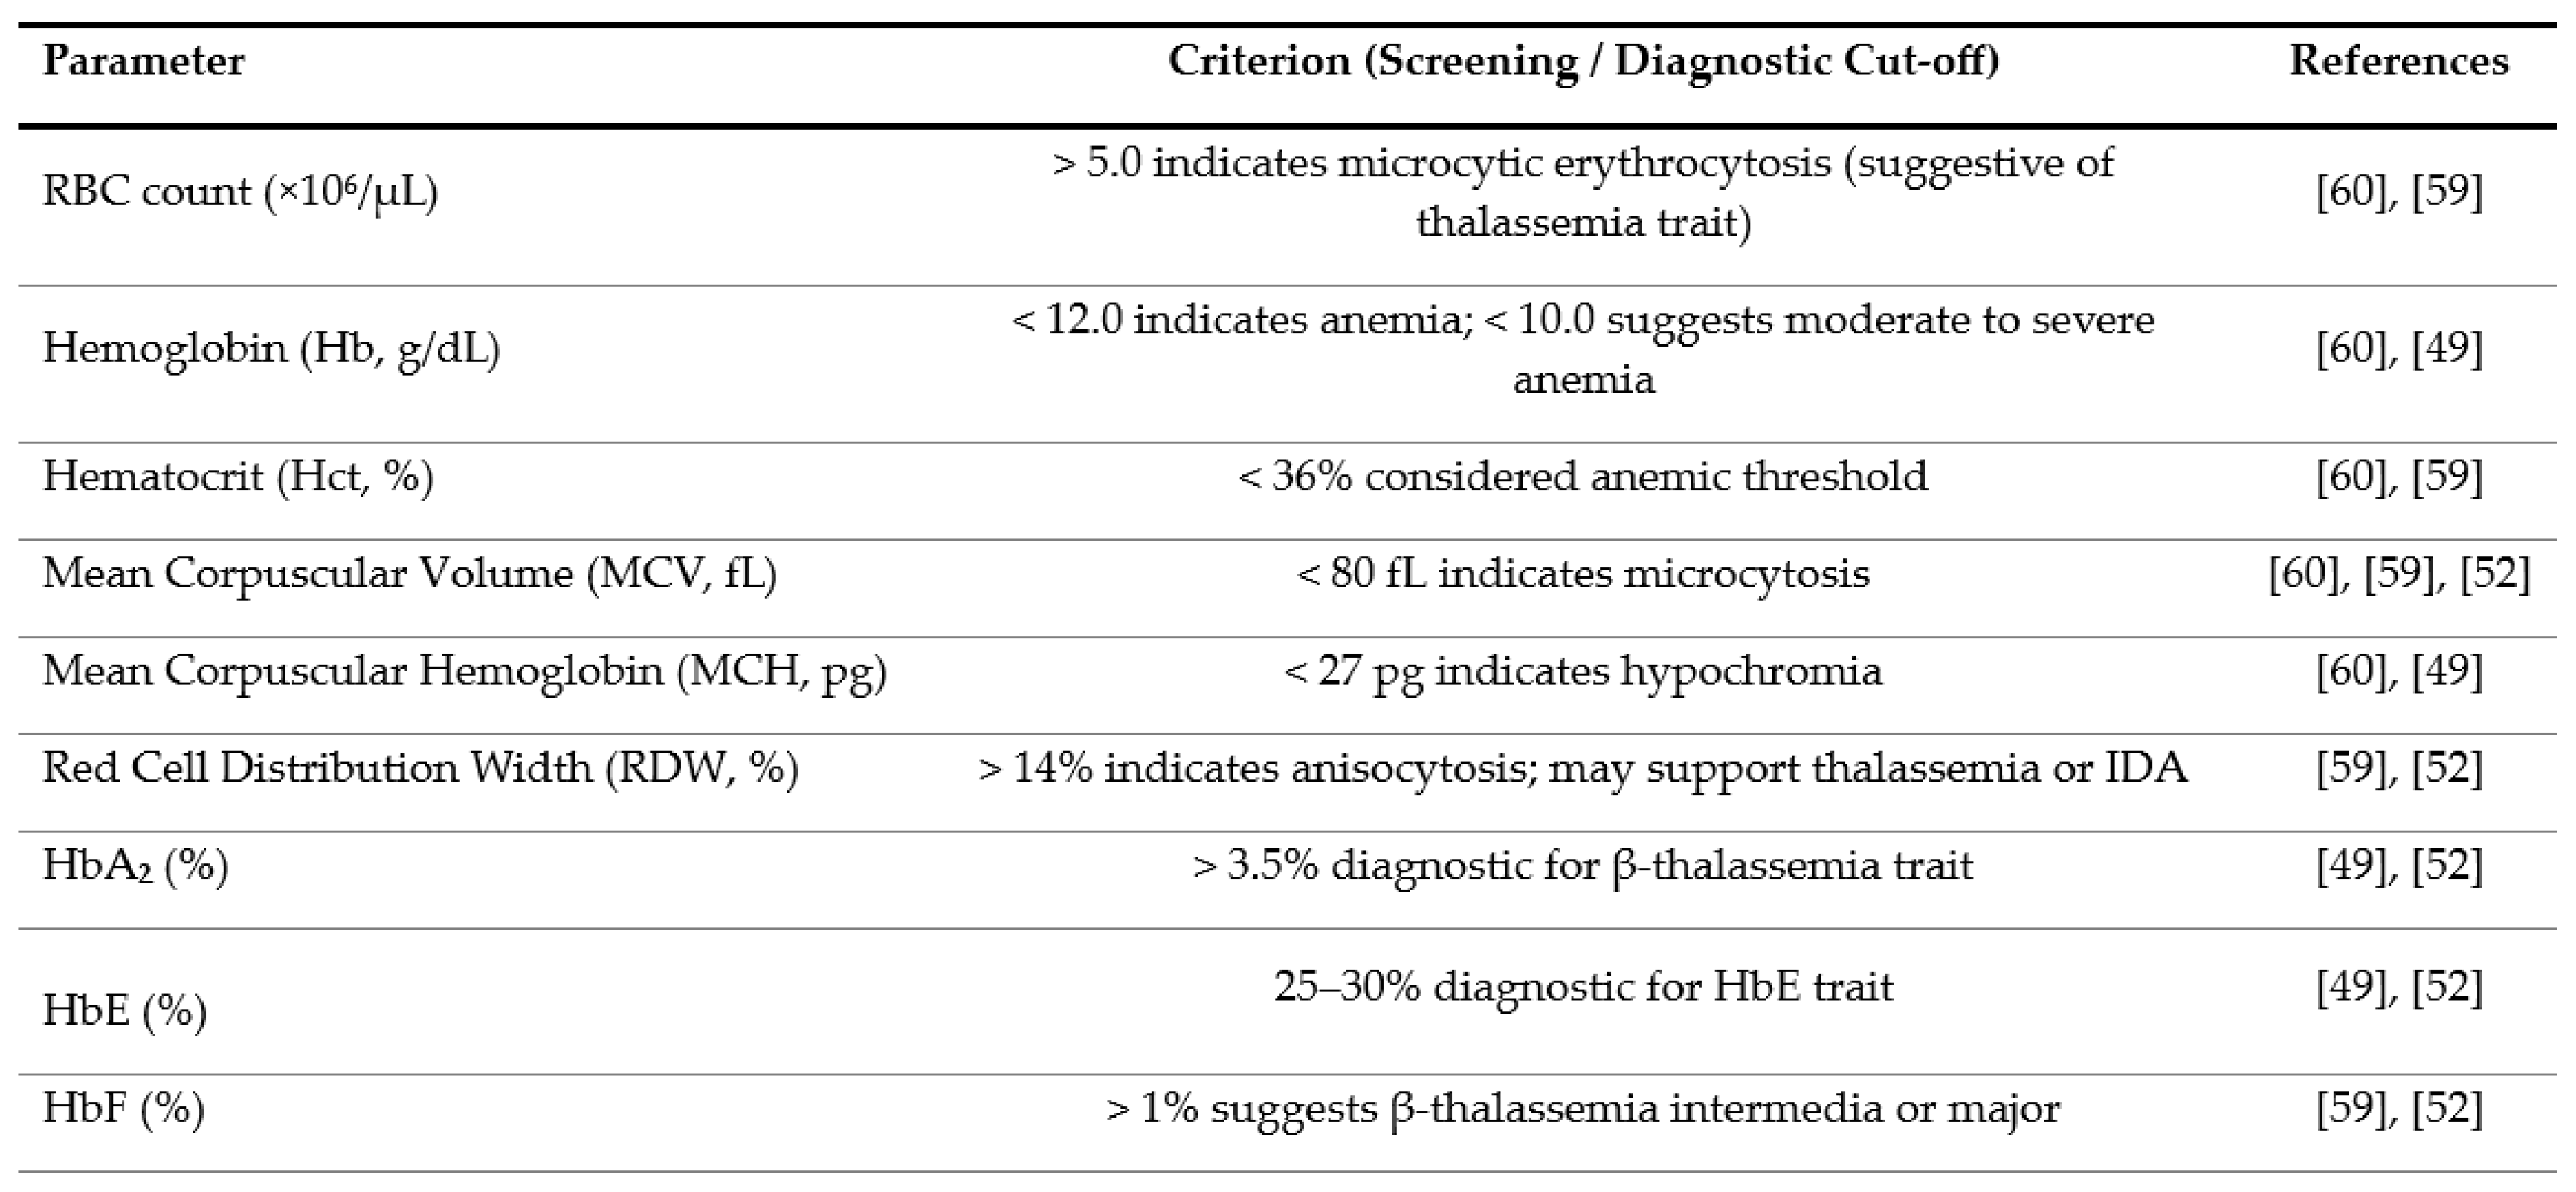
Table 3.
Band assignments of the chemical structure and composition of hemoglobin.
Disclaimer/Publisher’s Note: The statements, opinions and data contained in all publications are solely those of the individual author(s) and contributor(s) and not of MDPI and/or the editor(s). MDPI and/or the editor(s) disclaim responsibility for any injury to people or property resulting from any ideas, methods, instructions or products referred to in the content. |
© 2025 by the authors. Licensee MDPI, Basel, Switzerland. This article is an open access article distributed under the terms and conditions of the Creative Commons Attribution (CC BY) license (http://creativecommons.org/licenses/by/4.0/).
Copyright: This open access article is published under a Creative Commons CC BY 4.0 license, which permit the free download, distribution, and reuse, provided that the author and preprint are cited in any reuse.


