
Submitted:
18 January 2026
Posted:
19 January 2026
You are already at the latest version
Abstract
This pilot EEG study examined the feasibility of a soundscape-based 40-Hz auditory stimulation format by using a soundscape-only condition as a contrast control. We tested whether a nature-based soundscape with an additively layered pure 40-Hz sine component (40-Hz ON; not amplitude modulation) produces a more pronounced narrowband neural response around 40 Hz than the same soundscape without the 40-Hz layer (40-Hz OFF). Participants completed both conditions in a single-blind, randomized-order, within-participant crossover session with a washout interval. EEG outcomes included 40-Hz power, frequency-domain SNR around 40 Hz, scalp distribution of 40-Hz power, and phase-based connectivity in the gamma range. Across metrics, the 40-Hz ON soundscape showed a consistent ON>OFF directionality, including localized electrode-level signals and a temporal-region summary signal under nominal, uncorrected testing, accompanied by a clearer narrowband feature near 40 Hz in spectral profiles. These convergent patterns support the interpretation that embedding a 40-Hz layer into a naturalistic soundscape can engage frequency-specific gamma activity and may be a viable neuroacoustic stimulation approach. As an exploratory pilot study without multiplicity control, the findings are hypothesis-generating and motivate confirmatory studies with larger samples and preregistered endpoints.
Keywords:
40 Hz auditory stimulation
; gamma-band entrainment
; electroencephalography (EEG)
; soundscape
; frequency-domain SNR
; phase-locking value (PLV)
1. Introduction
Population ageing and the growing burden of chronic conditions reinforce the need to address brain-health problems, including dementia, from a long-term management perspective rather than a short-term treatment-only framework. In neurodegenerative diseases such as Alzheimer’s disease (AD), maintaining function over time is a central challenge, and limitations of pharmacological approaches alone—particularly regarding repeated use and adherence in daily life—have been widely discussed. Accordingly, repeatedly applicable non-invasive interventions have been explored as complementary strategies. For example, repetitive transcranial magnetic stimulation (rTMS) combined with cognitive training has reported improvements in cognitive function and cortical metabolic measures in AD [1]. Rhythmic sensory stimulation paradigms incorporating gamma-frequency components have also been presented through exploratory studies and longer-term case reports [2,3]. More recently, a prospective study directly evaluated the safety and acceptability of 40-Hz auditory stimulation, further extending discussions on real-world feasibility of sensory-stimulation approaches [4].
Global ageing further amplifies this need. According to a United Nations report, the worldwide population aged 65 years and older is projected to increase from approximately 0.8 billion in 2023 to about 1.6 billion by 2050 [5]. Alongside demographic ageing, the burden of AD and dementia continues to rise. AD is defined as one of the most common causes of dementia and is characterized by progressive deterioration of brain function [6]. Recent reports also project sustained increases in global dementia burden through 2050, with a substantial proportion of the growth occurring in low- and middle-income countries [7]. Mental health conditions represent another major global health burden [8], and the WHO emphasizes prevention, early intervention, risk-factor management, and long-term national-level responses for dementia and related brain-health conditions [9]. Together, these trends indicate that brain-health interventions should establish neurophysiological evidence of engagement while also considering delivery formats that can realistically support repeated use in everyday environments.
A key scientific rationale for sensory-stimulation approaches is neural entrainment. Gamma-band activity (approximately 30–70 Hz) has been linked to higher-order cognitive processes such as perception, attention, and memory, and accumulating evidence suggests gamma-band abnormalities in neurological conditions including AD. On this basis, inducing gamma entrainment at specific frequencies—particularly around 40 Hz—has been proposed as a means to modulate neurophysiological responses and potentially influence disease-relevant processes [10,11]. Preclinical work has reported that 40-Hz acoustic stimulation may reduce pathological markers and modulate brain rhythms in an AD animal model [10], and human EEG research has suggested enhanced neural responses during 40-Hz auditory entrainment under eyes-closed conditions [11]. This line of work supports the plausibility of 40-Hz auditory stimulation as a non-invasive, sensory-based approach, while also highlighting the importance of quantitative validation of the delivered stimulus in humans [10,11].
At the same time, delivery design is a practical constraint for repeated use. Presenting a standalone pure 40-Hz tone may elicit adverse perceptual experiences such as discomfort or tinnitus-like sensations, which can limit formats intended for prolonged listening [12]. Integrating 40-Hz components into existing audio content (e.g., music) has been proposed to mitigate this burden; however, music-based approaches can be preference-dependent and may introduce perceived audio-quality changes that affect listening experience. Therefore, there is a need for auditory formats that (i) embed a controlled 40-Hz component in an everyday-compatible listening context with relatively neutral content and (ii) provide objective, EEG-based evidence that the resulting composite stimulus produces detectable frequency-specific signatures around 40 Hz.
The present study is an exploratory pilot quantitative EEG investigation designed to test whether a nature-based soundscape can serve as a low-burden carrier for a frequency-specific 40-Hz component that remains EEG-quantifiable in a realistic listening context. Critically, the 40-Hz OFF (soundscape-only) condition is not positioned as a competing intervention; rather, it functions as a contrast control to isolate the incremental contribution of additively layering a pure 40-Hz sine component within an otherwise identical soundscape experience (same content, preprocessing/mastering chain, and within-participant session structure). Within this contrast-control framework, we examine whether the 40-Hz ON condition yields stronger 40-Hz–centered EEG signatures—operationalized as narrowband 40-Hz power and frequency-domain SNR around 40 Hz—and whether it is accompanied by supportive changes in phase-based synchronization indices (phase-locking value, PLV) in a narrow gamma band (35–45 Hz).
To avoid overclaiming, we use the term gamma entrainment operationally to denote stimulus-linked, EEG-quantifiable signatures centered at 40 Hz observed during exposure to the 40-Hz–layered stimulus (e.g., a clearer narrowband feature near 40 Hz in spectral profiles and corresponding changes in 40-Hz power/SNR, with supportive PLV tendencies). These outcomes are interpreted as evidence of frequency-specific neural engagement that is consistent with entrainment-oriented framing in the sensory-stimulation literature, but they do not by themselves establish clinical benefit, disease-modifying mechanisms, or definitive causal pathways beyond what is measurable at the EEG level in a small pilot. Accordingly, the primary contribution of this study is to assess detectability, directionality, and spatial tendency of 40-Hz–centered EEG signatures when a controlled 40-Hz component is embedded into a naturalistic soundscape carrier, thereby providing a defensible basis for subsequent confirmatory and translational work.
Hypotheses.
Relative to the 40-Hz OFF contrast control, the 40-Hz ON condition will (H1) increase EEG signatures centered at 40 Hz (narrowband power and SNR around 40 Hz) and (H2) show an ON>OFF tendency in phase-based synchronization (PLV) in the 35–45 Hz band. These hypotheses concern stimulus-locked, EEG-quantifiable signatures of the embedded 40-Hz layer, rather than clinical or behavioral efficacy. Because this is an exploratory pilot study, hypothesis tests are reported as hypothesis-generating signals rather than confirmatory inference.
2. Related Work
2.1. Gamma Oscillations and Network-Oriented Rationale for 40-Hz Stimulation
Recent neuroscience and cognitive-neuroscience research on cognitive decline and neurodegenerative disorders increasingly emphasizes not only regional dysfunction but also network disruption and reduced functional connectivity across brain regions. Gamma oscillations are widely regarded as a mechanism that supports inter-regional information integration and efficient cognitive processing, and disrupted gamma activity alongside network-level connectivity loss has been repeatedly discussed in cognitive impairment, including Alzheimer’s disease. Against this background, a growing line of work has explored whether externally delivered stimulation near 40 Hz can drive gamma entrainment and potentially support network functions.
Early human MEG evidence demonstrated coherent thalamocortical 40-Hz activity, establishing gamma oscillations as a rhythm implicated in large-scale network coordination rather than a purely local phenomenon [13]. Subsequent animal studies reported that 40-Hz visual stimulation can induce gamma entrainment and accompany changes in pathology-related markers [14], while multisensory stimulation combining visual and auditory channels has been suggested to recruit broader cortical areas and yield stronger gamma-related responses and pathology modulation than unimodal approaches [15]. Long-term gamma-frequency tACS in animal models further reported improvements in memory-related performance alongside gamma-rhythm measures [16], supporting the plausibility that gamma modulation may relate to network function. Human work has also linked gamma-band modulation to connectivity-related outcomes and cognition, reinforcing the network-level framing of gamma stimulation [1,17].
2.2. Quantitative Validation in Humans: EEG Markers of Gamma Entrainment
Human studies have reported that 40-Hz stimulation can be quantified via EEG as increased responses around 40 Hz in the power spectrum and strengthened phase-based synchronization metrics (e.g., PLV). In animal models, 40-Hz acoustic stimulation has been associated with pathology-related changes and rhythm modulation [10], and in humans, EEG evidence has reported enhanced neural responses during 40-Hz auditory entrainment [11,17]. Importantly, gamma entrainment can depend on contextual factors such as sensory state; stronger gamma power and PLV during eyes-closed conditions highlights the importance of procedural control (e.g., eye-state standardization) for EEG-based quantification [11]. In addition, exploratory human work using gamma-frequency entrainment paradigms has discussed frequency-dependent patterns in mood, memory, and cognition outcomes, underscoring translational interest while also highlighting variability across protocols and endpoints [18].
From a translational standpoint, accumulating EEG-based evidence that a given auditory design reliably elicits measurable entrainment signatures remains essential. In particular, whether entrainment patterns remain consistent across different content types (e.g., different sound contents) and how power-based versus phase-based metrics converge or diverge are practical questions that motivate further quantitative work.
2.3. Safety/Acceptability and the Need for User-Burden–Aware Auditory Design
Beyond efficacy signals, gamma-based interventions have been evaluated for feasibility and tolerability. A pilot γ-tACS study in Alzheimer’s disease, using a randomized double-blind sham-controlled crossover design, reported that exposure was feasible without major adverse events [19]. For auditory stimulation, a prospective study in healthy older adults evaluated repeated exposure to 40-Hz amplitude-modulated stimulation and reported safety and acceptability outcomes [4].
At the same time, qualitative evidence suggests that pure 40-Hz sound presented alone may be perceived as unpleasant or tinnitus-like in some listeners [12], implying a design need to reduce user burden. Although approaches that embed or transform 40-Hz components into music have been proposed, music-based delivery can be constrained by preference variability and potential changes in perceived sound quality. Therefore, it is practically important to explore auditory materials that are more broadly acceptable, integrate 40-Hz components in a low-burden manner, and confirm that the resulting stimulus still yields quantifiable EEG signatures of gamma entrainment.
2.4. Soundscapes and Restorative Outcomes: Toward EEG-Grounded Extensions
Soundscape research has expanded from noise mitigation to quantitative and mixed-method investigations examining whether natural and environmental sound compositions support stress recovery and emotional well-being. Prior studies have reported faster post-stress sympathetic recovery (e.g., skin conductance) during exposure to nature sounds [20], enhanced physiological recovery in VR settings when nature sounds are integrated [21], mood recovery effects during natural sound exposure [22], and restorative outcomes measured with multiple physiological indices such as heart rate, respiration, and skin conductance [23]. Urban soundscapes have also been discussed as potentially restorative depending on context and design [24], and recent work comparing different natural soundscapes has reported differentiated psychological and physiological recovery profiles across soundscape types [25].
These findings position soundscapes as an everyday-compatible auditory context that can be repeatedly presented with relatively low cognitive demand. From the standpoint of translational auditory stimulation, this “carrier” quality is practically valuable: a soundscape format may reduce user burden compared with presenting a standalone tonal stimulus while remaining sufficiently stable and repeatable for controlled exposure. However, restorative soundscape evidence alone does not establish whether embedding a frequency-specific component (e.g., 40 Hz) yields objectively verifiable neurophysiological engagement. Therefore, an important next step is to examine whether a soundscape can function as a carrier that accommodates a controlled 40-Hz layer and produces detectable, frequency-specific EEG signatures around 40 Hz under a rigorously defined contrast-control design.

Table 1.
Summary of prior studies on 40-Hz gamma stimulation and soundscapes (network/connectivity, delivery modality, safety/acceptability, and restorative outcomes).
Table 1.
Summary of prior studies on 40-Hz gamma stimulation and soundscapes (network/connectivity, delivery modality, safety/acceptability, and restorative outcomes).
| Category | Study (Author, Year ) |
Sample /Context |
Modality /Measure |
Key findings (as used in this manuscript) |
|---|---|---|---|---|
| 40-Hz & network/connectivity | Ribary et al., 1991 [13] | Humans | MEG | Coherent thalamocortical 40-Hz activity; gamma as a large-scale coordinating rhythm. |
| 40-Hz & pathology-related evidence | Iaccarino et al., 2016 [14] | AD mouse model | 40-Hz visual flicker | Gamma entrainment associated with pathology-related and microglial changes. |
| Multisensory 40-Hz | Martorell et al., 2019 [15] | AD mouse model | Visual + auditory 40-Hz |
Multisensory stimulation recruited broader responses and improved pathology/cognition indicators. |
| Long-term gamma electrical stimulation | Wu et al., 2022 [16] | AD mouse model | Long-term gamma tACS | Long-term gamma tACS reported memory-related improvements and gamma rhythm changes. |
| Gamma modulation & connectivity in humans | Liu et al., 2022 [1] | Humans with probable AD | Gamma modulation + connectivity metrics | Gamma-band modulation linked to improvements in local/long-range/ dynamic connectivity and cognition. |
| Human fMRI network effect | Lin et al., 2021 [17] | Humans | 40-Hz visual (blue light) + fMRI |
40-Hz condition associated with hippocampal activation/connectivity changes. |
| Human gamma sensory stimulation | Chan et al., 2022 [26] | Humans | Sensory stimulation + EEG | Human gamma-frequency sensory stimulation study; supports feasibility of quantifying entrainment markers. |
| Auditory 40-Hz evidence | Lee et al., 2018 [10] | AD mouse model | 40-Hz acoustic | Acoustic 40-Hz stimulation associated with amyloid reduction and rhythm modulation. |
| Auditory entrainment & state dependence | Han et al., 2023 [11] | Humans | Auditory 40-Hz + EEG | Eyes-closed state showed stronger 40-Hz power/PLV; highlights procedural control. |
| Safety/tolerability (electrical) | Benussi et al., 2021 [19] | AD patients | γ-tACS, crossover pilot | Feasible without major adverse events in a pilot crossover setting. |
| Safety/acceptability (auditory) | Sato et al., 2025 [4] | Healthy older adults | 40-Hz AM auditory | Prospective evaluation of safety/ acceptability of repeated auditory stimulation. |
| User burden concerns | Wang et al., 2024 [12] | Older adults with MCI | 40-Hz sound/music, qualitative |
Standalone 40-Hz can be unpleasant/tinnitus-like; music integration reduced aversion. |
| Soundscape restorative physiology | Alvarsson et al., 2010 [20] | Humans | Nature sound vs. noise | Nature sound facilitated sympathetic recovery (skin conductance) after stress. |
| VR soundscape recovery | Annerstedt et al., 2013 [21] | Humans | VR forest + nature sounds | Nature sounds in VR supported physiological recovery markers. |
| Mood recovery | Benfield et al., 2014 [22] | Humans | Natural sound exposure |
Natural sounds facilitated mood recovery. |
| Multi-physiology restoration | Medvedev et al., 2015 [23] | Humans | Pleasant soundscapes vs. unpleasant noise |
Physiological indices favored restorative soundscapes. |
| Urban soundscape restoration | Jeon et al., 2021 [24] | Humans | Urban soundscapes | Urban soundscapes can have restorative potential depending on context/design. |
| Different natural soundscapes | Bai et al., 2024 [25] | Humans | Natural soundscape types | Different natural soundscapes yield different psychological/physiological recovery profiles. |
2.5. Gap and Positioning of the Present Study
Prior work has advanced 40-Hz gamma stimulation from animal models to human studies under a network-oriented rationale, and human EEG studies have shown that 40-Hz stimulation can yield quantifiable signatures around 40 Hz using both power- and phase-based metrics [1,11,26]. In parallel, translational discussions increasingly emphasize feasibility considerations—safety, tolerability, and acceptability—because repeated exposure in everyday contexts is essential for any practical, long-term brain-health application [4,12,19]. Notably, qualitative evidence indicates that a standalone pure 40-Hz tone can be perceived as unpleasant or tinnitus-like by some listeners [12], underscoring that auditory delivery format is not incidental but can determine whether repeated use is viable.
Despite this progress, a practical gap remains: how to realize an everyday-compatible auditory carrier that can accommodate a controlled 40-Hz component while still yielding objectively verifiable EEG signatures. Music-based embedding has been proposed as a burden-reduction strategy, but preference dependence and perceived audio-quality changes can introduce additional variability that complicates repeated use at scale [12]. Soundscapes represent an alternative carrier because nature-based auditory materials have accumulated psychophysiological evidence related to stress recovery and emotional stabilization and are often used as low-demand listening contexts [20,21,22,23,24,25]. However, it remains underexplored whether a soundscape-based format with an additively layered 40-Hz component produces detectable, frequency-specific EEG signatures around 40 Hz when contrasted against an otherwise identical soundscape-only condition.
Accordingly, the present study is positioned as an EEG-grounded, exploratory pilot that evaluates the plausibility of a 40-Hz layered soundscape as a frequency-specific stimulation format. Importantly, the soundscape-only condition is included as a contrast control to isolate the incremental contribution of the 40-Hz layer, not to evaluate soundscapes as an intervention per se. We operationalize EEG signatures using 40-Hz power and frequency-domain SNR as primary metrics and examine 35–45 Hz PLV as a supportive, hypothesis-generating index of synchronization-related patterns. By emphasizing contrast-control logic and transparent reporting of analysis endpoints, this study aims to provide a defensible basis for subsequent confirmatory work on soundscape-based 40-Hz auditory delivery.
3. Materials and Methods
3.1. Study Design Overview
This pilot quantitative EEG study examined whether a nature-based soundscape combined with a pure 40-Hz sine wave via additive layering elicits stronger narrowband gamma responses around 40 Hz than a soundscape-only control. We used a single-blind, randomized-order, within-participant crossover design in which each participant completed both conditions—40-Hz OFF (control) and 40-Hz ON (experimental)—within the same assigned soundscape set (Figure 1). To reduce content-specific bias, participants were assigned to one of two soundscape sets (Waves or Forest; between-participants factor), and the within-participant condition order was counterbalanced (Table 2). Figure 1 summarizes the overall workflow from recruitment and set assignment to the listening session, washout, and EEG analysis.
3.2. Ethics
The study protocol was approved by the Institutional Review Board (IRB No. KMU-202509-HR-503). Written informed consent was obtained from all participants after they were informed of the study objectives, procedures, potential risks, and the processing and protection of personal data. Participants were free to withdraw at any time without penalty and received compensation after completing the study.
3.3. Participants
Adults aged ≥ 40 years living in Seoul, Republic of Korea, were recruited via online channels. Inclusion criteria were: (1) age ≥ 40 years; (2) no substantial difficulty in everyday listening; and (3) ability to complete the listening and EEG procedures.
Hearing status was screened by pure-tone audiometry, requiring hearing thresholds ≤ 25 dB HL at 0.5–4 kHz in both ears, consistent with clinical criteria for normal-to-mild hearing.
Exclusion criteria included neurological disorders (e.g., epilepsy, Parkinson’s disease), ongoing psychiatric treatment or psychoactive medication, severe tinnitus, implanted medical devices, pregnancy or breastfeeding, and medications known to affect brain activity.
A total of 11 participants were enrolled. Two participants (P01 and P04) were excluded from quantitative EEG analyses because the experimenter observed repeated drowsiness/sleep during the listening blocks, indicating non-adherence to the wakefulness requirement. Accordingly, quantitative EEG analyses were conducted on 9 participants (Table 2). Table 2 summarizes participant characteristics, set assignment, within-participant condition order, and inclusion status (with exclusion reasons).
3.4. Conditions and Counterbalancing
Two conditions were tested within each assigned soundscape set:
-
40-Hz OFF (control): soundscape-only(with an identical preprocessing/mastering chain).
- 40-Hz ON (experimental): the same soundscape with an additively layered pure 40-Hz sine component (not amplitude modulation).
Condition order was randomized and counterbalanced across participants. Participants were not informed whether a given condition contained the 40-Hz component (single-blind).
3.5. Auditory Stimuli
3.5.1. Stimulus Structure
Stimuli followed a soundscape-by-layer structure: soundscape content (Waves vs. Forest) and presence of the 40-Hz layer (OFF vs. ON). For the Waves set, OFF and ON were denoted as A′ and A, respectively; for the Forest set, OFF and ON were denoted as B′ and B. Each participant was assigned to one set (between-participants factor) and completed both OFF and ON within that set (within-participant crossover).
3.5.2. Audio Preprocessing and Additive 40-Hz Layering
All auditory stimuli were rendered as stereo WAV files and followed a unified preprocessing and mastering chain across conditions. To stabilize low-frequency energy and reduce uncontrolled variability that can complicate stimulus characterization (e.g., large, content-dependent sub-bass fluctuations) while preserving the perceived naturalness of the soundscape, we applied a steep high-pass filter (HPF; 78 Hz cutoff, 96 dB/oct) to the base soundscape signal. The HPF was applied offline using a fixed, identical processing preset for all base soundscape files (both OFF and ON) to ensure consistent magnitude characteristics across stimuli. The resulting attenuation profile was verified via file-based spectral inspection on the rendered WAV outputs (Figure 2a). The cutoff and slope were selected through iterative internal pilot checks as a pragmatic compromise: sufficiently attenuating low-frequency energy that could obscure or confound interpretation of a 40-Hz–specific component, while retaining a naturalistic soundscape impression for sustained listening. In our pilot listening checks, the HPF-processed soundscapes were judged to maintain the overall “natural” character of the original content without noticeable degradation relevant to the study purposes.
For the 40-Hz ON condition, a pure 40-Hz sine component was then additively layered onto the HPF-processed soundscape (not amplitude modulation). Let the left and right soundscape channels be and . The 40-Hz component was defined as
and the final stereo outputs were
Here, is an amplitude coefficient controlling the relative level of the added 40-Hz component. Spectrogram examples confirm that the 40-Hz OFF stimuli do not show a narrowband 40-Hz line component, whereas the corresponding 40-Hz ON stimuli exhibit a distinct narrowband line at 40 Hz (Figure 2b). Post-export file-based verification further documented integrated loudness (LUFS), true peak level (dBTP), DC offset, clipping, and loudness range (LRA), indicating small loudness shifts after layering and no clipping across files (Table 3). Together, these steps support that OFF/ON stimuli differed primarily by the intended 40-Hz layer under an otherwise consistent production chain.
3.5.3. Block Structure and Duration
Each condition comprised seven cycles of 50 s playback followed by 10 s silence, yielding 420 s (~7 min) per condition. Quantitative EEG analyses included playback segments only (50 s) and excluded the silence intervals (10 s).
3.5.4. Post-Export File Verification and Loudness Consistency Checks
Waveform statistics were extracted from the final rendered WAV files to document integrated loudness (LUFS), true-peak level (dBTP), clipping, DC offset, and loudness range (LRA). Overall loudness changes after layering were small (Waves: +0.1 LUFS; Forest: +0.3 LUFS, ON relative to OFF), and no clipping was detected in any file (Table 3). Table 3 retains the same underlying values but is presented with a slightly revised layout to facilitate EEG-oriented interpretation, including condition-wise comparisons.
3.6. Procedure
Sessions were conducted in a quiet indoor room. After fitting the EEG cap and adjusting electrode impedances, participants listened to the two conditions within the assigned soundscape set in a randomized and counterbalanced order. Each condition lasted ~7 min, and a 10-min washout period was provided between conditions (Figure 1). During listening, participants were instructed to keep their eyes closed, minimize movement (particularly jaw and facial muscle tension), and maintain a stable seated posture. During washout, participants were allowed to open their eyes and were reminded to remain awake. Throughout the session, the experimenter monitored participants’ vigilance (e.g., head nodding, reduced responsiveness) and provided verbal reminders when drowsiness was suspected. Nevertheless, clear drowsiness was observed during the listening blocks for P01 and P04, and their concurrent EEG traces were deemed unsuitable for stable narrowband 40-Hz estimation. These datasets were therefore excluded from the quantitative EEG analyses according to the predefined quality-control decision.
3.7. Playback Equipment
Stimuli were presented from a laptop computer positioned approximately 3 m away from the EEG system to reduce potential electromagnetic interference. Audio was delivered via wired in-ear earphones (Sony XBA-A2). Individual ear-canal sound pressure level (SPL) was not measured in this pilot study. Instead, prior to data collection, the research team conducted pilot listening across all stimulus files and fixed the playback level to a comfortable, clearly audible setting without audible distortion; the same device, earphones, and software volume setting were applied identically across participants and across both conditions. Given the within-participant crossover design and the contrast-control pairing of OFF vs. ON within the same soundscape set, any unmeasured between-participant SPL variability is less likely to explain the within-participant ON–OFF directionality. Nevertheless, we acknowledge the absence of calibrated SPL as a limitation and plan future confirmatory work to include coupler-based calibration (or equivalent SPL estimation), documentation of device/software gain settings, and personalization procedures where appropriate (e.g., level setting relative to comfort or audibility thresholds).
3.8. EEG Acquisition
EEG was recorded using a multichannel system (BIOS-S series, BioBrain Inc., Republic of Korea). Twenty-one electrodes were placed according to the international 10–20 system (Fp1, Fpz, Fp2, F7, F3, Fz, F4, F8, T3, C3, Cz, C4, T4, T5, P3, Pz, P4, T6, O1, Oz, O2). Sampling rate was 250 Hz, impedances were maintained below 10 kΩ, and the device-default reference and ground configuration was used.
Although O1 was recorded in the 10–20 montage, persistent noise/unstable contact was repeatedly observed at this channel; therefore, O1 was excluded from quantitative analyses. Accordingly, all EEG metrics (power, SNR, and PLV) were computed using the remaining 20 electrodes.
3.9. EEG Preprocessing
All EEG signals were processed in MATLAB (R2024b). Channel-wise mean removal was first applied to correct DC offsets. To attenuate 60-Hz power-line interference, a zero-phase two-pass IIR notch filter was applied. For spectral analyses (40-Hz power and SNR), a 4th-order two-pass IIR band-pass filter (0.5–50 Hz) was used. For PLV analyses, a 4th-order two-pass IIR band-pass filter (35–45 Hz) was applied, and the instantaneous phase was computed using the Hilbert transform.
Automated epoch-based artifact rejection (e.g., ICA or auto-epoch rejection) was not applied in this pilot study. Instead, behavioral compliance (eyes closed, minimal movement, and vigilance monitoring) was emphasized, and participants showing drowsiness (P01, P04) were excluded as described in Section 4.1.
Because broad-spectrum artifacts (e.g., EMG/motion) typically manifest across wider frequency ranges rather than as a circumscribed narrowband feature, the observed 40-Hz-centered contrasts are less likely to be fully explained by such artifacts alone. Accordingly, under the within-participant contrast-control design, these contrasts are treated as candidate stimulus-locked, frequency-specific EEG signatures.
3.10. Outcome Measures
3.10.1. 40-Hz Power
The 40-Hz response was quantified from the power spectral density (PSD) as narrowband 40-Hz power, defined as the PSD value at the frequency bin nearest to 40 Hz (in μV2/Hz). Channel-level outcomes were computed for all valid electrodes that passed quality control (O1 excluded as described in Section 3.8), and region-level summaries (frontal, temporal, central, and parietal–occipital) were calculated for descriptive comparison.
This narrowband metric was intended to reflect frequency-specific responses centered at 40 Hz rather than broadband power differences.
3.10.2. Frequency-Domain SNR
We quantified frequency-domain signal-to-noise ratio (SNR) around 40 Hz from the power spectral density (PSD) by comparing the PSD at the target frequency bin to the mean PSD of neighboring bins. Specifically, for each channel, SNR at frequency was computed as:
where denotes the PSD value at the FFT bin closest to , and denotes the mean PSD of the neighboring bins around the center bin (i.e., 10 bins total), excluding the center bin itself. A small constant was added to the denominator to avoid numerical instability when the neighborhood power approached zero. For the main analysis, SNR was evaluated at Hz.
3.10.3. Topographic Mapping
Condition-wise channel-averaged 40-Hz power was visualized as scalp topographies using standard 10–20 coordinates with interpolation. Identical color scales were applied across conditions.
3.10.4. Phase-Locking Value (PLV)
Phase-based connectivity was quantified using the phase-locking value (PLV) in a narrow gamma band centered on the stimulation frequency. For each electrode pair, EEG signals were bandpass-filtered to 35–45 Hz (4th-order zero-phase bidirectional IIR), and the instantaneous phase was obtained via the Hilbert transform. PLV was computed for all unique channel pairs among the analyzed electrodes as:
where T denotes the number of time samples and Δϕ(t) is the instantaneous phase difference between the two channels at time t. The 35–45 Hz band was selected to center on 40 Hz while allowing margin for inter-individual variability in how narrowband phase synchronization expresses around the target frequency. Because the O1 electrode was excluded due to persistent noise/artifacts, PLV analyses were conducted on the remaining 20 electrodes, yielding 190 unique pairs (20×19/2).
3.11. Statistical Analysis and Multiple Testing Considerations
This study was designed as an exploratory pilot investigation to assess whether a nature-based soundscape can serve as a low-burden carrier for a frequency-specific 40-Hz component that remains EEG-quantifiable in a realistic listening context. Importantly, the 40-Hz OFF condition (soundscape-only) was treated as a contrast control to isolate the incremental contribution of the additively layered 40-Hz sine component within an otherwise identical listening context (same content set, preprocessing/mastering chain, playback procedure, and within-participant block structure). Accordingly, the primary analytic goal was to examine detectability, directionality, and spatial tendencies of 40-Hz–centered EEG signatures in 40-Hz ON relative to 40-Hz OFF, rather than to make competitive efficacy claims about the soundscape-only condition.
Within-participant condition differences (40-Hz ON vs. 40-Hz OFF) were evaluated using two-sided Wilcoxon signed-rank tests. For channel-wise outcomes (40-Hz power and frequency-domain SNR), tests were conducted across the analyzed electrodes; because the O1 electrode (left occipital) was excluded due to persistent noise, channel-wise inference was based on the remaining 20 electrodes. For phase-based connectivity, PLV was computed in the 35–45 Hz band for all unique channel pairs among the analyzed electrodes (20 electrodes, 190 unique pairs), and condition differences were evaluated per pair using the same two-sided nonparametric framework.
Given the exploratory nature of this pilot study, no multiplicity control (e.g., FDR) was applied across electrodes or channel pairs. Therefore, all reported p-values are uncorrected and are presented to indicate where signals may concentrate as hypothesis-generating evidence, not to support confirmatory inference. Consistent with this rationale, any visual markers of “significance” (e.g., asterisks) should be interpreted as nominal, uncorrected reference cues only. Future confirmatory work should preregister primary endpoints, incorporate multiplicity-aware inference (or cluster-based/permutation approaches for spatial/connectivity structure), and include calibrated playback-level documentation (e.g., coupler-based SPL estimation) to strengthen reproducibility and external validity.
4. Results
4.1. EEG Data Quality Control and Analyzed Sample
A total of 11 participants completed the study. Two participants (P01 and P04) exhibited clear drowsiness during the listening blocks as observed by the experimenter, and their concurrent EEG traces were deemed unsuitable for stable narrowband 40-Hz estimation. These datasets were therefore excluded from the quantitative EEG analyses. The final quantitative EEG results are based on 9 participants.
In addition, the O1 electrode (left occipital) showed persistent noise and was excluded from channel-wise comparisons. For scalp-topography visualization, the O1 location reflects interpolation from neighboring electrodes; this limitation is explicitly noted in the figure caption.
4.2. 40-Hz Power
Table 4(a) reports electrode-wise comparisons of 40-Hz power between conditions, and Table 4(b) provides region-wise summaries (Frontal/Temporal/Central/Parietal–Occipital). Overall, 40-Hz power tended to be higher in 40-Hz ON (soundscape with an additively layered pure 40-Hz sine component) than in 40-Hz OFF (soundscape-only) (Table 4(a), Table 4(b)). At the electrode level, Cz, C4, T4, and T6 showed ON>OFF differences with uncorrected p < 0.05 signals (Table 4(a)). In the region-wise summaries, the temporal region showed an ON>OFF pattern with an uncorrected p = 0.039 (Table 4(b)), whereas the frontal region and the grand average exhibited trend-level differences (p = 0.055 and p = 0.074, respectively) (Table 4(b)). Because this pilot study did not apply multiple-comparison correction, the p-values in Table 4 should be interpreted as exploratory, hypothesis-generating signals rather than confirmatory significance (see Section 3.11 for the statistical rationale).
Figure 3 visually summarizes the quantitative results in Table 4. The top panel shows electrode-wise 40-Hz power (ON vs. OFF), the middle panel shows region-wise summaries, and the bottom panel shows the grand average. Across panels, ON values are generally higher than OFF, with a more noticeable ON>OFF pattern around central–temporal adjacent channels (Figure 3).
The O1 electrode (left occipital) was excluded due to persistent recording noise. The overall ON>OFF pattern was primarily observed in central–temporal and adjacent frontal/parietal channels; therefore, excluding O1 is not expected to alter the qualitative directionality or the spatial interpretation of the main pattern (consistent with the data-quality rules in Section 3.9). Taken together, Table 4 and Figure 3 suggest that additive 40-Hz layering onto a natural soundscape may increase narrowband responses around 40 Hz relative to the soundscape-only control. Given the exploratory nature and the lack of multiplicity control, these findings should be viewed as supporting evidence for follow-up confirmatory studies rather than definitive conclusions.
4.3. Frequency-Domain SNR (30–50 Hz)
The frequency-domain SNR spectrum computed over 30–50 Hz showed a more pronounced narrowband feature around 40 Hz in the 40-Hz ON condition (Figure 4). Spatial patterns differed by electrode location. Consistent with the exploratory aim of this pilot study, Figure 4 is presented as a descriptive comparison of spectral shape and directionality near 40 Hz (ON > OFF), rather than as a multiple-comparison–controlled significance map.
4.4. Scalp Topography of 40-Hz Power
Condition-wise scalp topographies were generated to examine the spatial distribution of 40-Hz power (Figure 5). Identical color scales were used across conditions to support direct comparison. Overall, the 40-Hz ON condition showed a distribution consistent with the directionality observed in Figure 3 and Table 4. Because O1 was excluded from channel-wise comparisons due to noise, the O1 location in the topography should be interpreted cautiously as an interpolated (not directly measured) value.
4.5. PLV-Based Connectivity
PLV was computed in the 35–45 Hz band for all unique channel pairs. Because the O1 electrode exhibited persistent noise/artifacts and was excluded from downstream analyses, connectivity analyses were performed on the remaining 20 electrodes, yielding 190 unique pairs. For each pair, we computed the mean PLV in each condition and defined the condition contrast as ΔPLV = PLV_{40-Hz ON} − PLV_{40-Hz OFF}.
Given the large number of pairwise comparisons and the absence of multiple-comparison correction, we avoided visualizing the network using a nominal “p < 0.05 significant-edge” threshold, which can be misleading in this context. Instead, Figure 6 presents a descriptive network visualization based on the Top-N edges ranked by the magnitude of ΔPLV (here, N = 20; ranking by |ΔPLV|), alongside condition-specific PLV values for the same set of edges. This visualization is intended to highlight where the largest PLV changes may concentrate rather than to provide confirmatory evidence of statistically reliable connectivity effects.
To contextualize this descriptive selection, Figure 7 shows the distribution of ΔPLV across all 190 edges. Accordingly, the connectivity results should be interpreted as exploratory and hypothesis-generating, and any apparent network pattern should be validated in future work using appropriate multiple-comparison control and/or pre-registered hypotheses.
5. Discussion and Conclusion
This pilot EEG study evaluated the plausibility of a soundscape-based auditory format as a practical carrier for a frequency-specific 40-Hz component that remains EEG-quantifiable under a realistic listening context. The central contribution is not a competitive comparison between “soundscape-only” and “soundscape-plus,” but a contrast-control test that isolates the incremental contribution of an additively layered 40-Hz sine component within an otherwise identical soundscape experience. From this perspective, the convergent ON>OFF directionality across multiple EEG readouts supports a cautious, design-oriented interpretation: a naturalistic soundscape can accommodate a controlled 40-Hz layer in a way that yields detectable 40-Hz–centered EEG signatures, thereby motivating more rigorous confirmatory work. The stimulus-production chain also reflected a pragmatic trade-off between suppressing low-frequency variability that could mask a 40-Hz–centered signal and preserving perceived soundscape naturalness, as described in Section 3.5.2.
Across complementary EEG readouts, the 40-Hz ON soundscape showed consistent ON>OFF directionality in 40-Hz–centered signatures. This convergence is important from an applied-science perspective because it supports a design-oriented interpretation: a naturalistic soundscape can accommodate a controlled 40-Hz component while preserving an everyday-compatible listening context, and the embedded component remains detectable at the EEG level. The appropriate inference is therefore about feasibility of EEG quantification and pattern plausibility—not definitive localization, generalizable effect sizes, or functional/clinical benefit.
The exploratory connectivity (PLV) findings should be interpreted with particular caution. Pairwise connectivity involves many simultaneous tests; without multiplicity-aware inference, thresholded “significant-edge” networks can be over-read. In this study, PLV results are best treated as a hypothesis-generating map of where larger ON–OFF phase-consistency differences may concentrate, motivating preregistered, multiplicity-aware replication and network-level statistical approaches.
Several limitations delimit interpretation and define next steps. First, the study was not powered for confirmatory inference; future work should increase sample size, preregister primary endpoints, and adopt multiplicity-aware (or cluster-/permutation-based) inference for spatial and connectivity structure. Second, playback SPL was not individually calibrated in this pilot; although the within-participant contrast-control design reduces the likelihood that unmeasured SPL variability alone explains ON–OFF directionality, calibrated SPL documentation (e.g., coupler-based estimation) is needed for reproducibility and cross-study comparability. Third, the present outcomes quantify EEG-level signatures and do not establish cognitive or clinical benefit; integrating behavioral proxies and longer-term feasibility protocols will be essential to connect EEG detectability to functional relevance. Finally, future studies should systematically parameterize the embedding strategy (e.g., relative 40-Hz level, personalization, audibility/comfort constraints) to derive robust design rules that maximize EEG detectability while maintaining a natural listening experience.
In conclusion, using a soundscape-only contrast control to isolate the incremental contribution of a 40-Hz layer, this pilot EEG study provides hypothesis-generating evidence that soundscapes can carry a controlled 40-Hz component in a manner that remains EEG-quantifiable.
Author Contributions
Conceptualization, K.N., K.L., J.S., and M.L.; methodology, K.N., K.L. and K.K.; software, D.Y. and K.N.; validation, K.N., K.K. and H.K.; formal analysis, K.N., K.K. and D.Y.; investigation, K.N., H.K., S.Y., Y.L. and J.Y.; resources, K.N. and S.J.; data curation, K.N., D.Y. and H.K.; writing—original draft preparation, K.N. and H.K.; writing—review and editing, K.N., K.K., K.L., S.J. and M.L.; visualization, D.Y. and K.N.; supervision, K.N. and K.K.; project administration, K.N.; funding acquisition, K.N. All authors have read and agreed to the published version of the manuscript.
Funding
This work was supported by the Ministry of Education of the Republic of Korea and the National Research Foundation of Korea.(NRF-2025S1A5B5A16006803). The APC was funded by the authors.
Institutional Review Board Statement
The study was conducted in accordance with the Declaration of Helsinki, and approved by the Institutional Review Board of Kookmin University (protocol code KMU-202509-HR-503, date of approval: 30 September 2025).
Informed Consent Statement
Informed consent was obtained from all subjects involved in the study.
Data Availability Statement
The EEG data generated and analyzed in this study contain potentially identifiable information and are therefore not publicly available due to Institutional Review Board (IRB) and privacy/ethical restrictions. De-identified data may be made available from the corresponding author upon reasonable request, subject to IRB approval and appropriate data-use agreements.
Acknowledgments
The authors thank all participants for their time and contributions. During the preparation of this manuscript, the authors used ChatGPT (OpenAI) for language editing and drafting assistance. The authors reviewed and edited the output and take full responsibility for the content of this publication.
Conflicts of Interest
The authors declare no conflicts of interest.
Appendix A
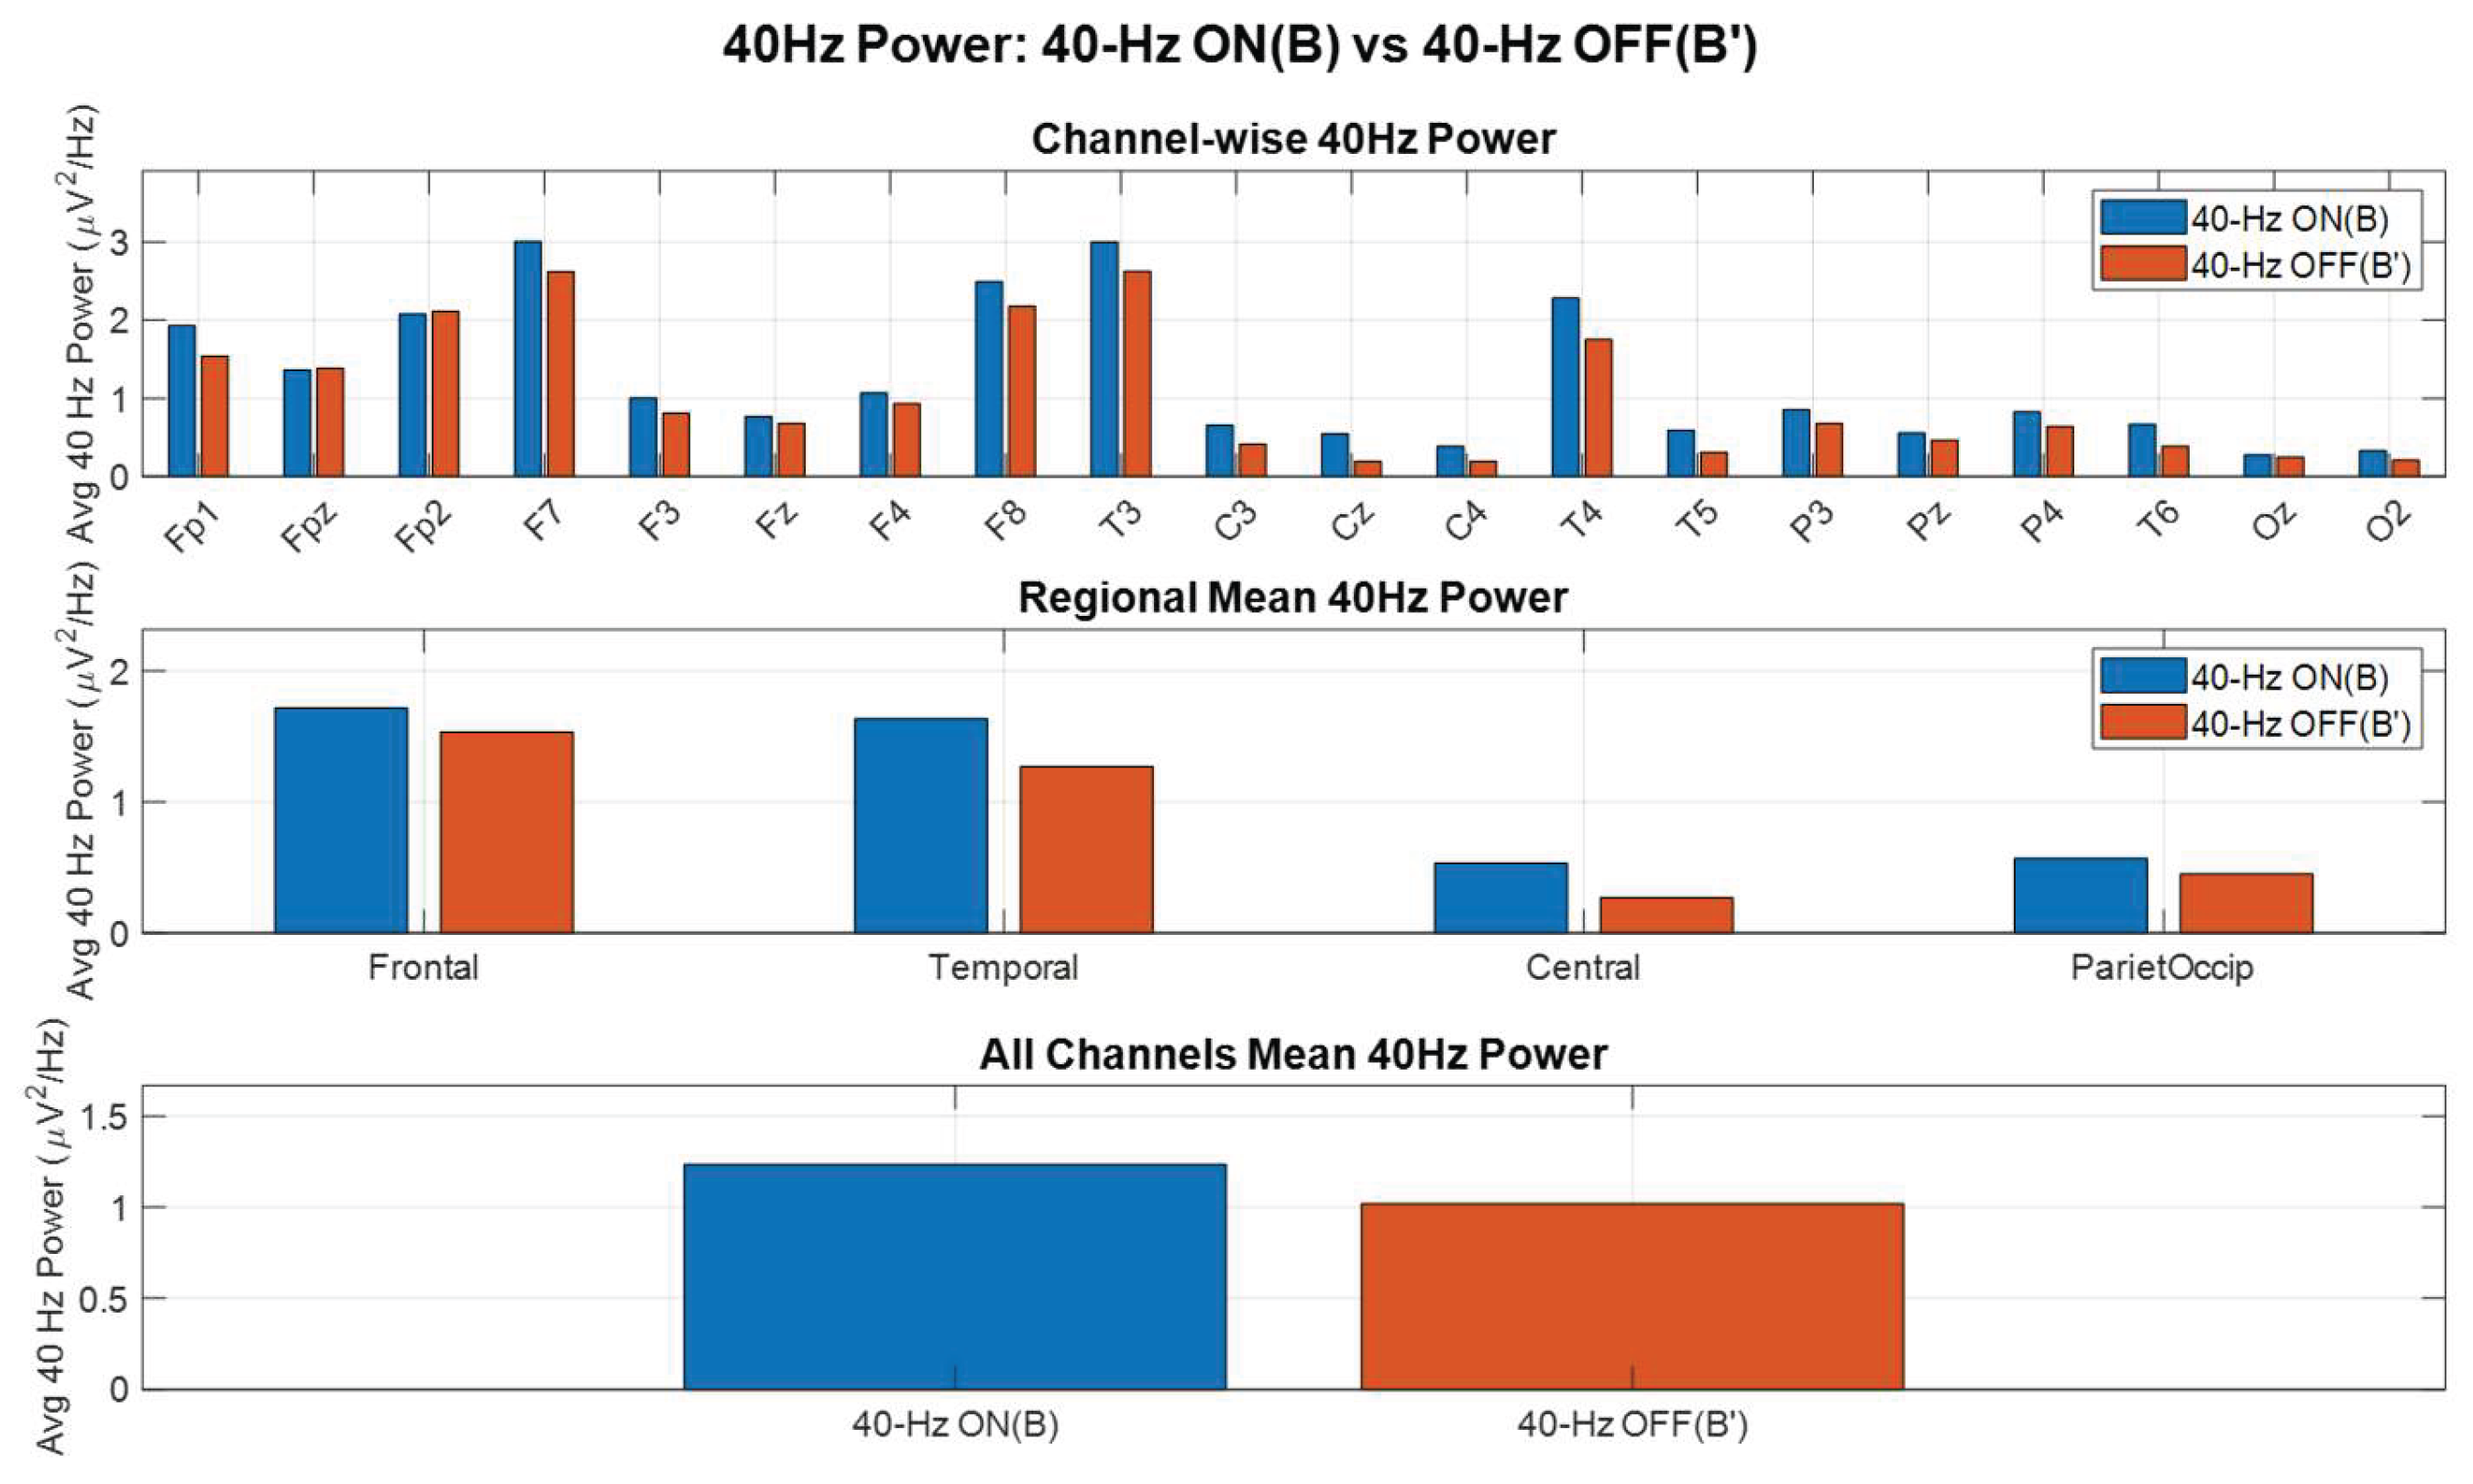
To examine whether the ON>OFF directionality is robust across different background contents, we present supplementary EEG results separately for the Waves set (Set A) and the Forest set (Set B). Because the per-set sample size is limited and these analyses involve multiple channels/metrics, results are provided for descriptive, hypothesis-generating purposes only and were not used to derive primary conclusions. Figure A1, Figure A2, Figure A3 and Figure A4 display set-wise summaries of 40-Hz power and 30–50 Hz SNR spectra using the same outcome definitions as in the main text.
Appendix A.1. Set-Wise 40-Hz Power (40-Hz ON vs. 40-Hz OFF)
Figure A1 and Figure A2 visualize the channel-wise, region-wise, and grand-average 40-Hz power comparisons within each soundscape set. Across both sets, the plotted summaries provide a descriptive check on whether the ON>OFF directionality observed in the main analysis appears similarly when Waves and Forest are inspected separately. Any asterisks or nominal p-value markings (if shown in the plots) should be interpreted strictly as uncorrected, exploratory references.
Figure A1.
Set-wise 40-Hz power comparison for the Waves set (Set A; 40-Hz ON vs. 40-Hz OFF). Top: channel-wise mean 40-Hz power across electrodes. Middle: region-wise means (Frontal, Temporal, Central, Parietal–Occipital). Bottom: grand-average 40-Hz power across all included electrodes. This figure is provided as a descriptive set-wise summary; any significance markers, if present, reflect nominal uncorrected testing and do not imply confirmatory inference.
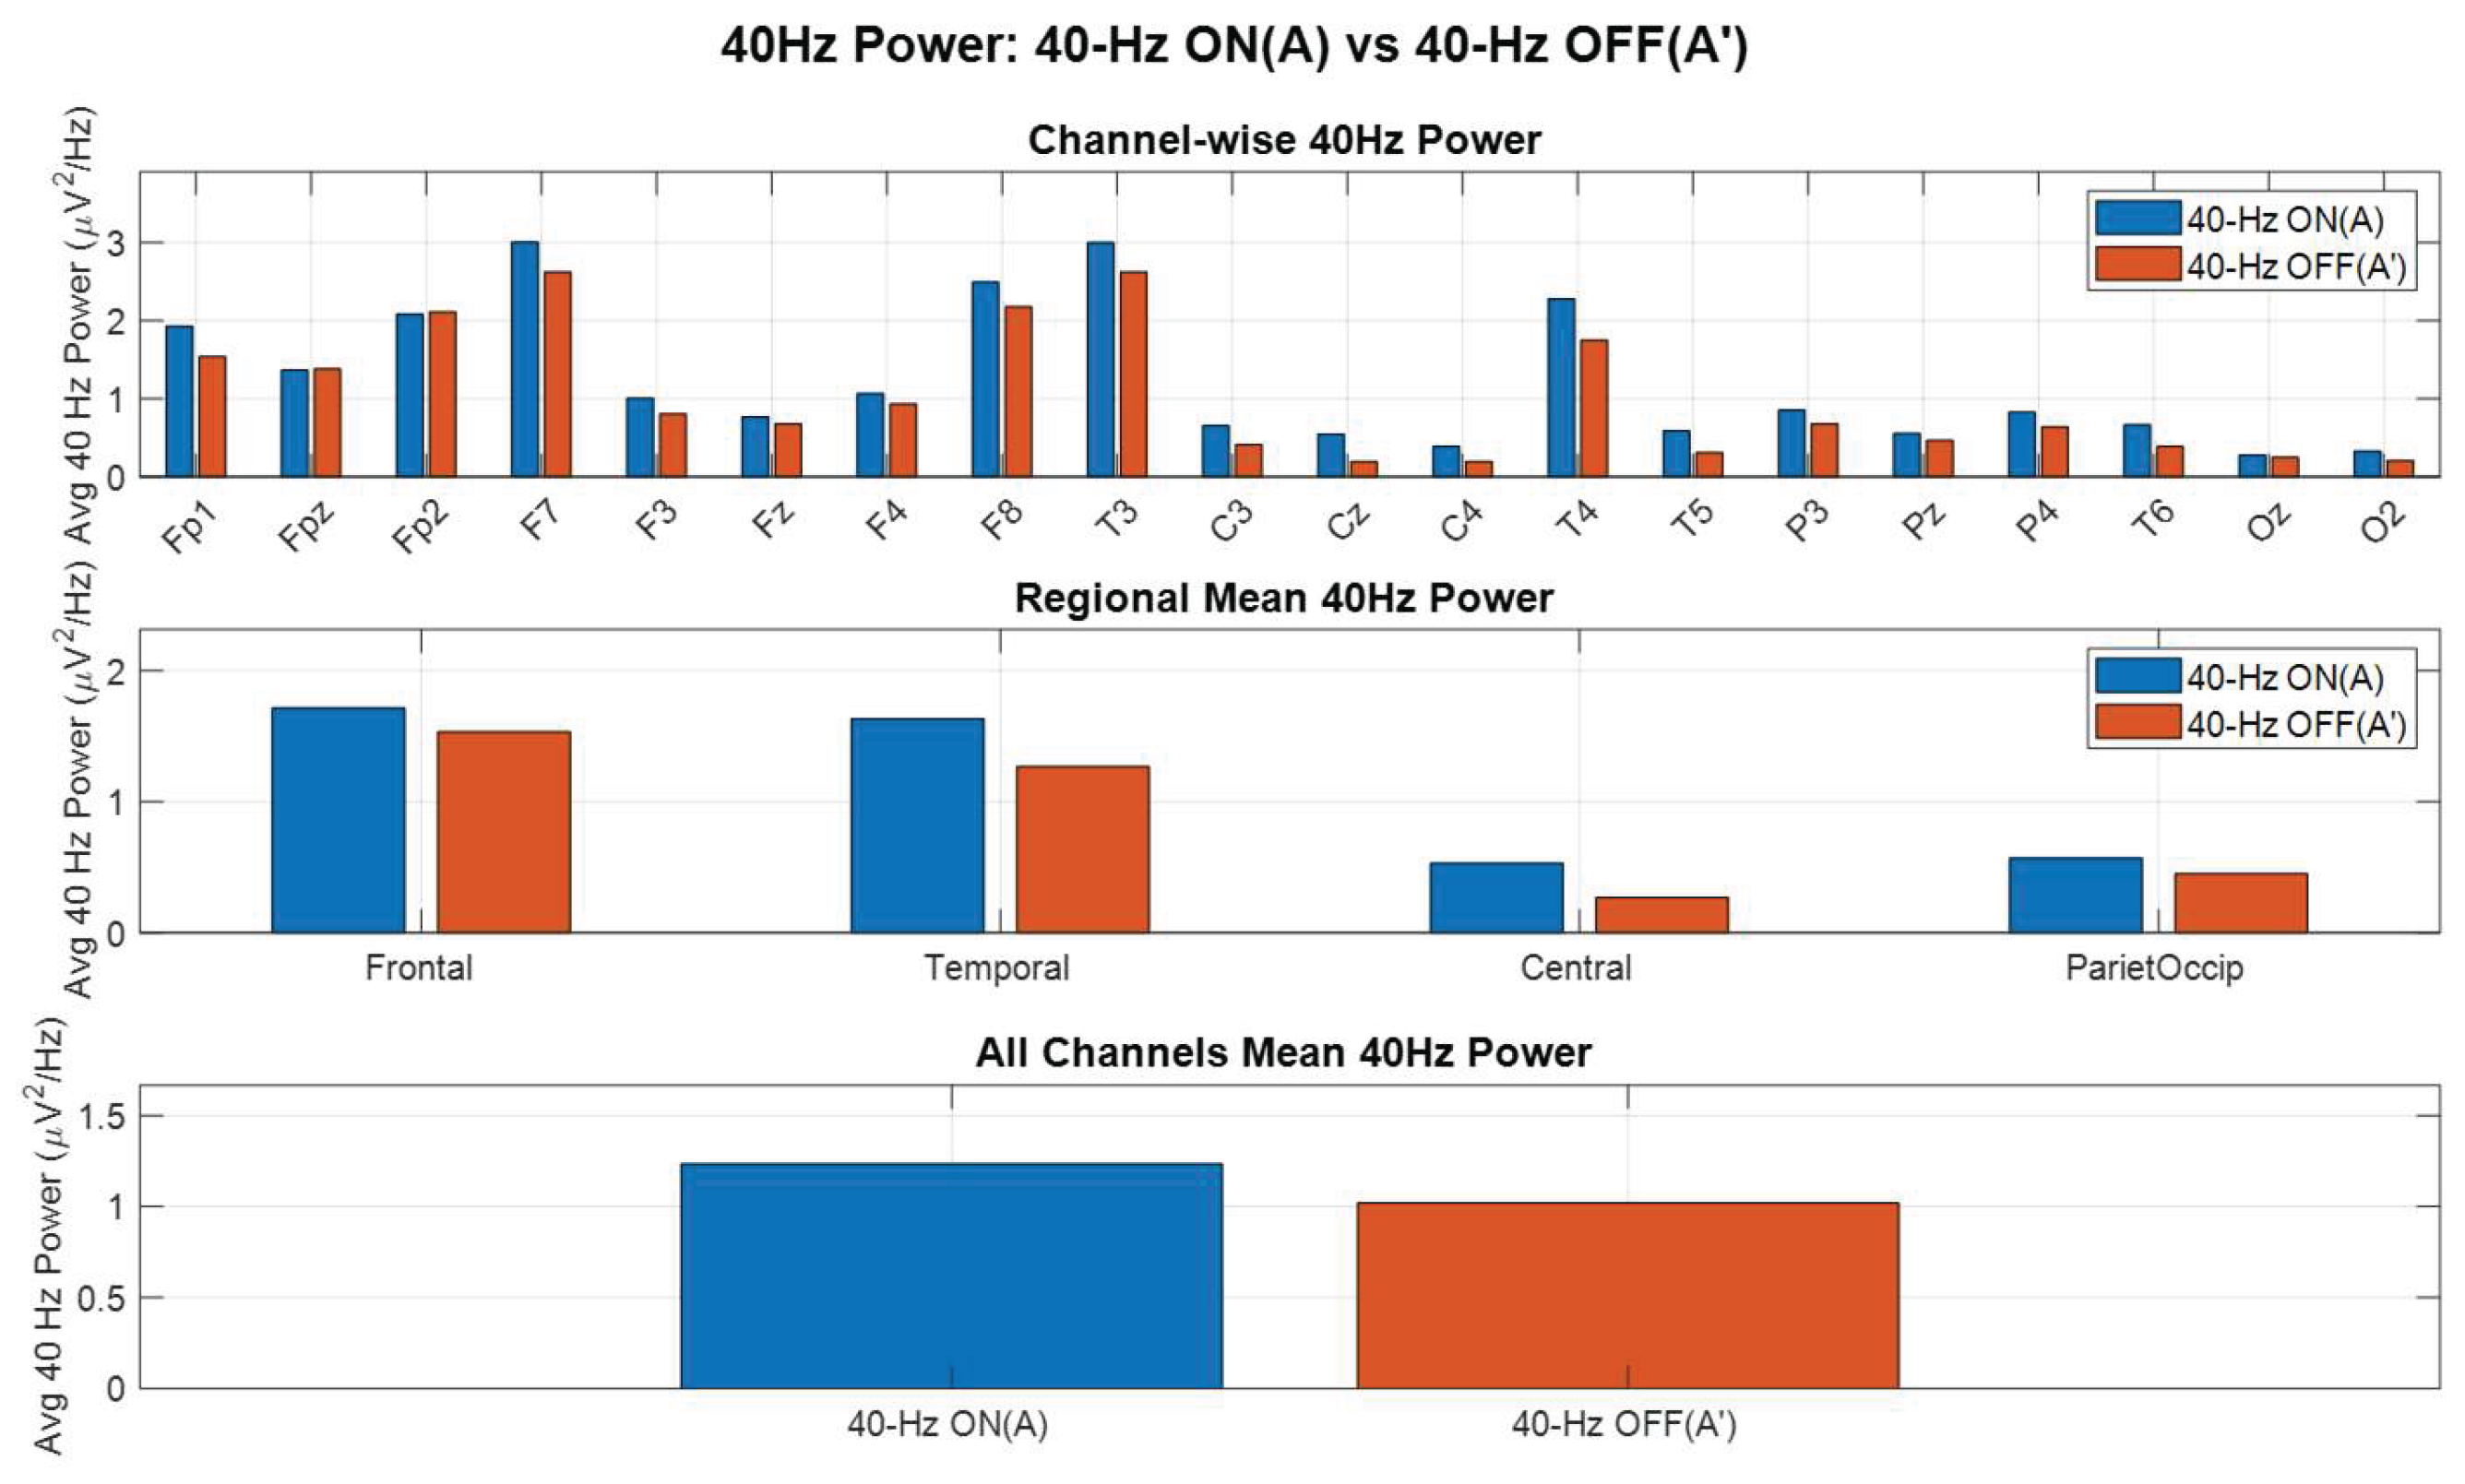
Figure A2.
Set-wise 40-Hz power comparison for the Forest set (Set B; 40-Hz ON vs. 40-Hz OFF). Top: channel-wise mean 40-Hz power across electrodes. Middle: region-wise means (Frontal, Temporal, Central, Parietal–Occipital). Bottom: grand-average 40-Hz power across all included electrodes. This figure is provided as a descriptive set-wise summary; any significance markers, if present, reflect nominal uncorrected testing and do not imply confirmatory inference.
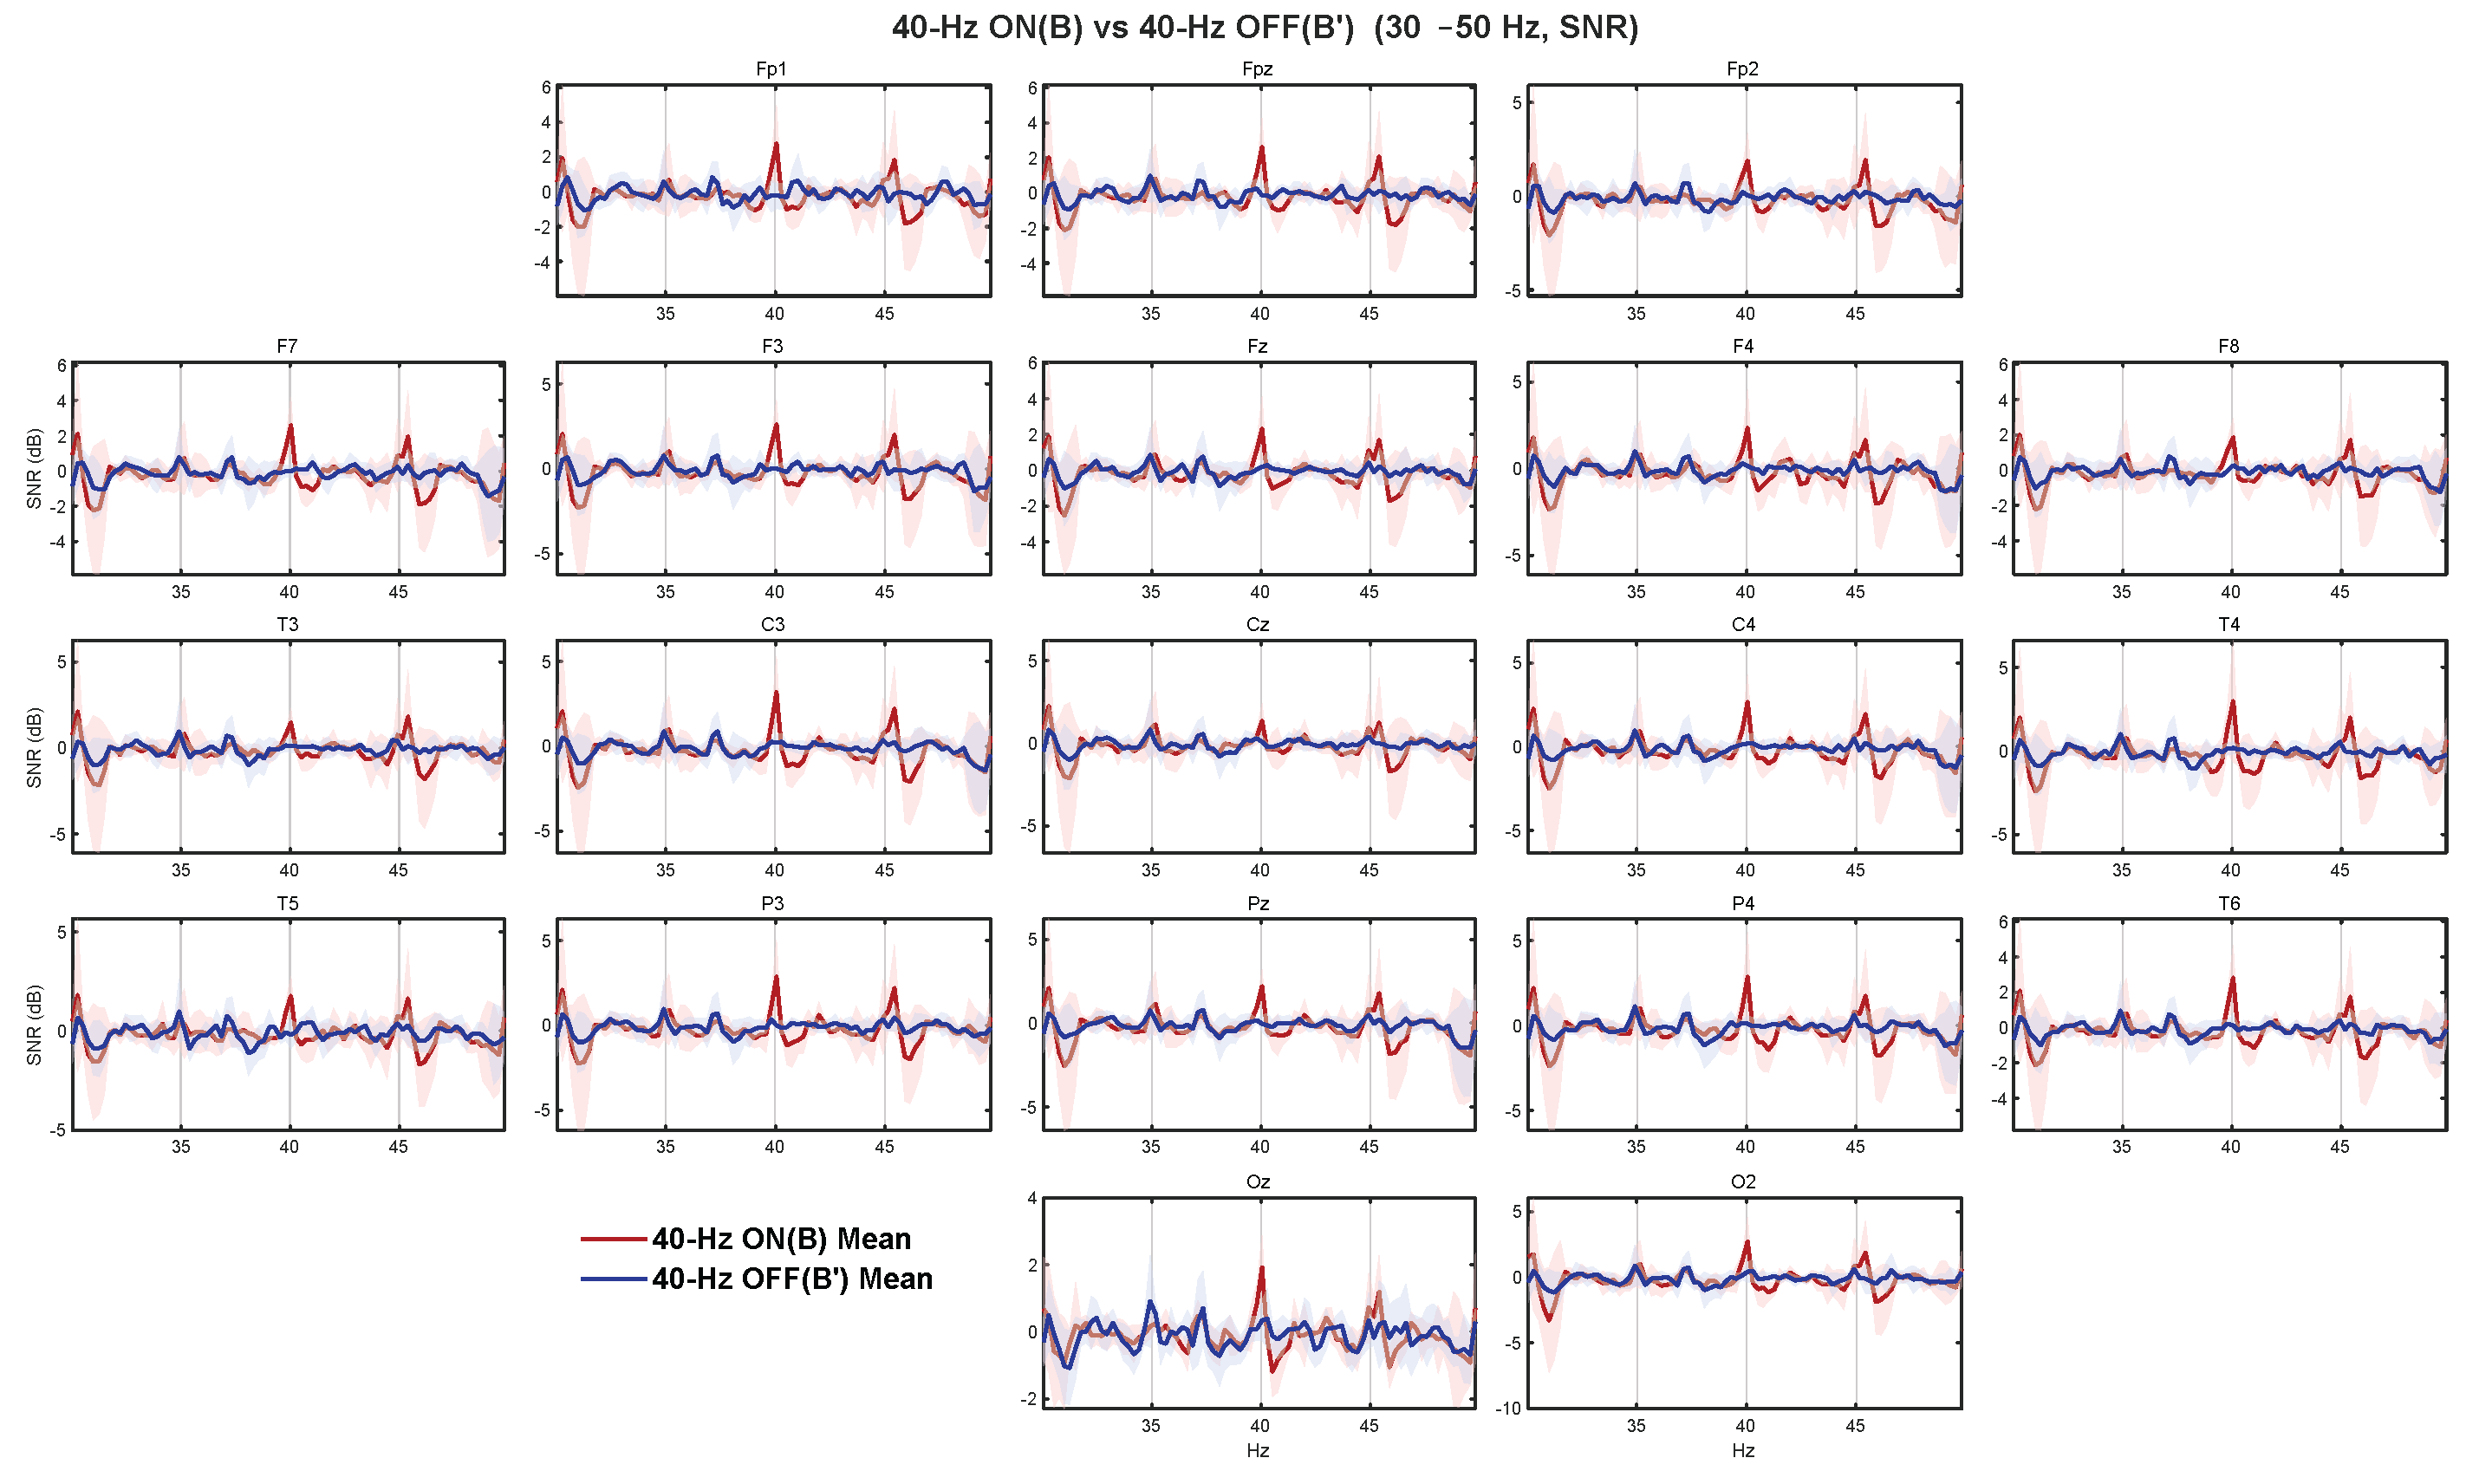
Appendix A.2. Set-Wise Frequency-Domain SNR (30–50 Hz)
Figure A3 and Figure A4 present the 30–50 Hz SNR spectra separately for the Waves and Forest sets. Each panel shows an electrode-wise mean SNR (dB) spectrum for 40-Hz ON vs. 40-Hz OFF, with shaded bands indicating between-participant variability. These spectra are intended to support a descriptive inspection of whether the narrowband feature around 40 Hz appears more pronounced in the ON condition within each set, consistent with the stimulus definition.
Figure A3.
Set-wise frequency-domain SNR spectra (30–50 Hz) for the Waves set (Set A; 40-Hz ON vs. 40-Hz OFF). Panels show electrode-wise mean SNR (dB) over 30–50 Hz for the two conditions (see plot legend). Shaded bands indicate mean ± SD across participants within the set. SNR was computed from Welch PSD estimates by normalizing each frequency-bin power by the mean of neighboring bins (excluding the center bin) and converting to dB. This figure is descriptive and is not a multiple-comparison–controlled significance map.
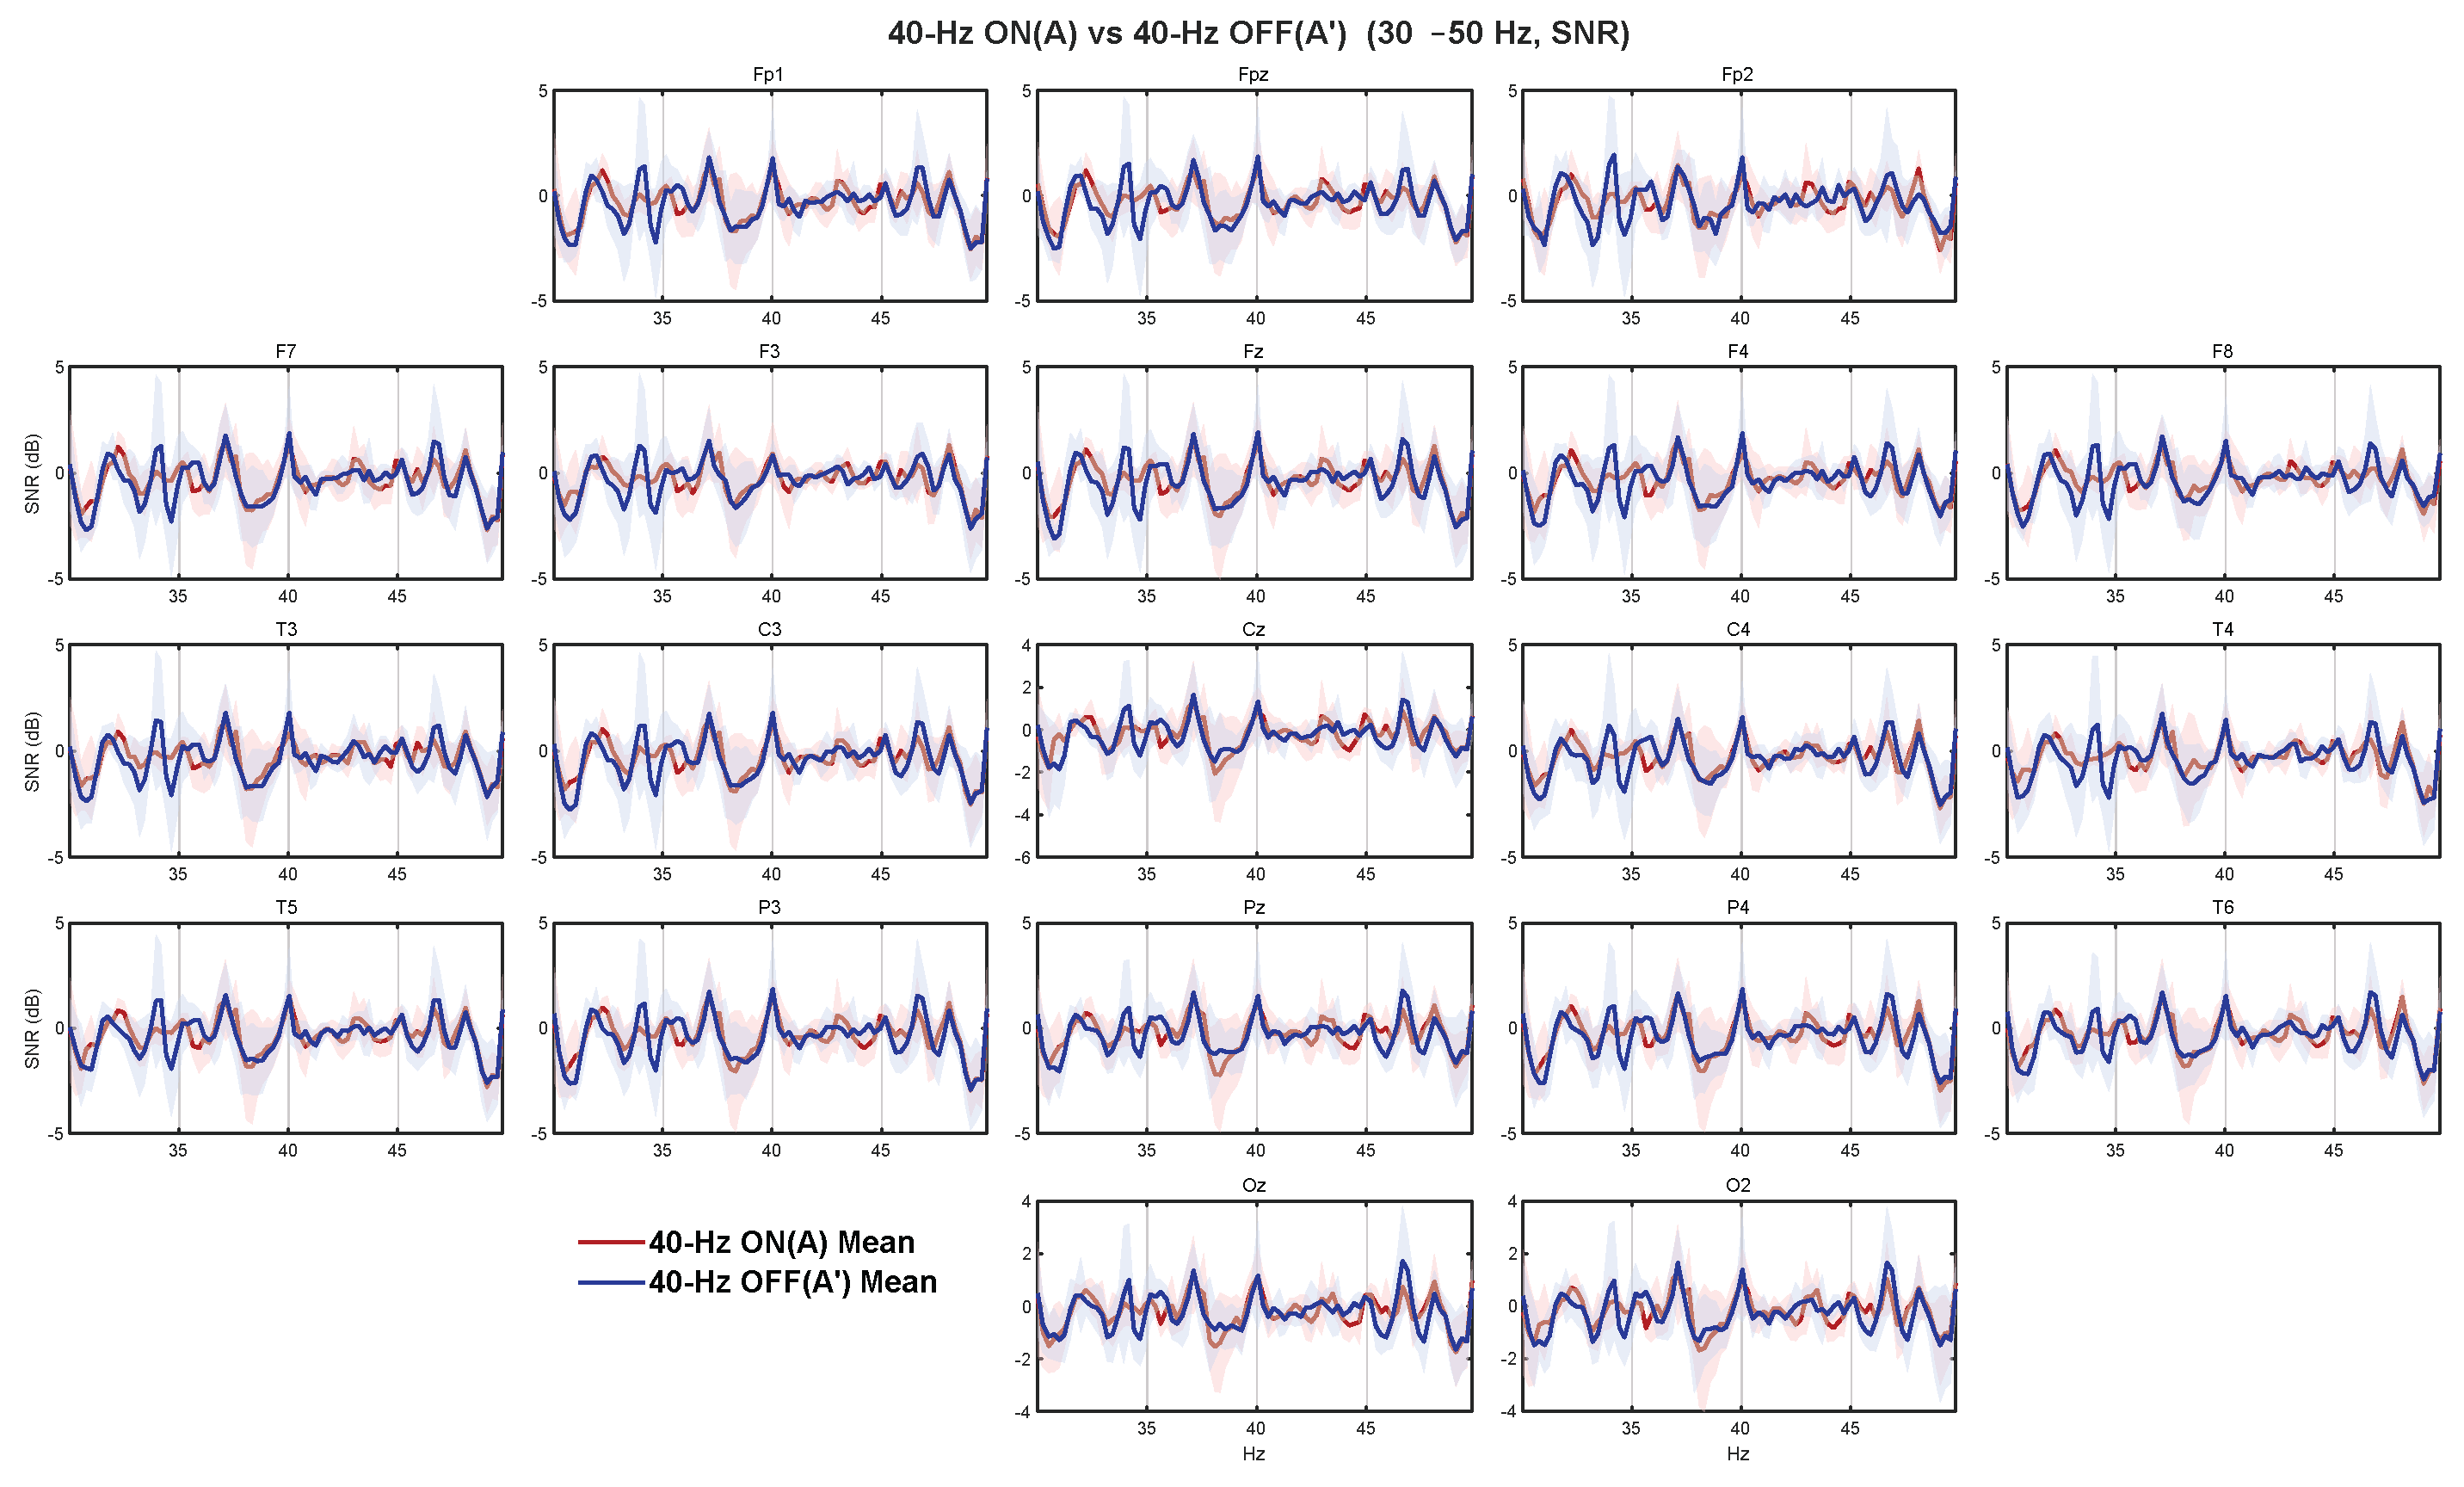
Figure A4.
Set-wise frequency-domain SNR spectra (30–50 Hz) for the Forest set (Set B; 40-Hz ON vs. 40-Hz OFF). Panels show electrode-wise mean SNR (dB) over 30–50 Hz for the two conditions (see plot legend). Shaded bands indicate mean ± SD across participants within the set. SNR was computed from Welch PSD estimates by normalizing each frequency-bin power by the mean of neighboring bins (excluding the center bin) and converting to dB. This figure is descriptive and is not a multiple-comparison–controlled significance map.
References
- Liu, C.; Han, T.; Xu, Z.; Liu, J.; Zhang, M.; Du, J.; Zhou, Q.; Duan, Y.; Li, Y.; Wang, J.; Cui, D.; Wang, Y. Modulating gamma oscillations promotes brain connectivity to improve cognitive impairment. Cerebral Cortex 2022, 32, 2644–2658. [CrossRef]
- Clements-Cortés, A.; Ahonen, H.; Evan, M.; Freedman, M.; Bartel, L. Short term effects of rhythmic sensory stimulation in Alzheimer’s disease: An exploratory pilot study. Journal of Alzheimer’s Disease 2016, 52, 651–660. [CrossRef]
- Clements-Cortés, A.; Bartel, L. Long-term multi-sensory gamma stimulation of dementia patients: A case series report. International Journal of Environmental Research and Public Health 2022, 19, 15553. [CrossRef]
- Sato, S.; Maeda, K.; Chinen, H.; Hiroi, S.; Tanaka, K.; Ogura, E.; Fukuju, H.; Morimoto, K.; Nagatani, Y.; Takazawa, K.; et al. Evaluation of safety and acceptability of 40 Hz amplitude-modulated auditory stimulation in healthy older people: A prospective study from Japan. Healthcare 2025, 13, 2638. [CrossRef]
- United Nations, Department of Economic and Social Affairs, Population Division. World Population Ageing 2023; United Nations: New York, NY, USA.
- National Institute on Aging. What is Alzheimer’s disease? National Institutes of Health. Published 4 March 2025.
- Alzheimer’s Association. Alzheimer’s disease facts and figures. Alzheimer’s & Dementia 2024, 20(5), 3763–3820.
- World Health Organization. World mental health report: Transforming mental health for all 2022; WHO: Geneva, Switzerland.
- World Health Organization. Global Action Plan on the Public Health Response to Dementia 2017–2025 2024; WHO: Geneva, Switzerland.
- Lee, J.; Ryu, S.; Jung, J.; Lee, B.; Kim, T. 40 Hz acoustic stimulation decreases amyloid beta and modulates brain rhythms in a mouse model of Alzheimer’s disease. bioRxiv 2018, 390302. [CrossRef]
- Han, C.; Zhao, X.; Li, M.; Haihambo, N.; Teng, J.; Li, S.; Qiu, J.; Feng, X.; Gao, M. Enhancement of the neural response during 40 Hz auditory entrainment in closed-eye state in human prefrontal region. Cognitive Neurodynamics 2023, 17, 399–410. [CrossRef]
- Wang, C.; Li, M.; Szanton, S.; Courtney, S.; Pantelyat, A.; Li, Q.; Huang, J.; Li, J. A qualitative exploration of 40 Hz sound and music for older adults with mild cognitive impairment. Geriatric Nursing 2024, 56, 259–269. [CrossRef]
- Ribary, U.; Ioannides, A.A.; Singh, K.D.; Hasson, R.; Bolton, J.P.; Lado, F.; Llinás, R. Magnetic field tomography of coherent thalamocortical 40-Hz oscillations in humans. Proceedings of the National Academy of Sciences 1991, 88(24), 11037–11041. [CrossRef]
- Iaccarino, H.F.; Singer, A.C.; Martorell, A.J.; Rudenko, A.; Gao, F.; Gillingham, T.Z.; Tsai, L.-H. Gamma frequency entrainment attenuates amyloid load and modifies microglia. Nature 2016, 540, 230–235. [CrossRef]
- Martorell, A.J.; Paulson, A.L.; Suk, H.-J.; Abdurrob, F.; Drummond, G.T.; Guan, W.; Tsai, L.-H. Multi-sensory gamma stimulation ameliorates Alzheimer’s-associated pathology and improves cognition. Cell 2019, 177(2), 256–271.e22. [CrossRef]
- Wu, L.; Cao, T.; Li, S.; Yuan, Y.; Zhang, W.; Huang, L.; Wang, J.; Wang, J. Long-term gamma transcranial alternating current stimulation improves the memory function of mice with Alzheimer’s disease. Frontiers in Aging Neuroscience 2022, 14, 980636. [CrossRef]
- Lin, Z.; Hou, G.; Yao, Y.; Zhou, Z.; Zhu, F.; Liu, L.; Ma, J. 40-Hz Blue Light Changes Hippocampal Activation and Functional Connectivity Underlying Recognition Memory. Frontiers in Human Neuroscience 2021, 15, 739333. [CrossRef]
- Sharpe, R.L.S.; Mahmud, M.; Kaiser, M.S.; Chen, J. Gamma entrainment frequency affects mood, memory and cognition: An exploratory pilot study. Brain Informatics 2020, 7, 17. [CrossRef]
- Benussi, A.; Cantoni, V.; Cotelli, M.S.; Cotelli, M.; Brattini, C.; Datta, A.; Borroni, B. Exposure to gamma tACS in Alzheimer’s disease: A randomized, double-blind, sham-controlled, crossover, pilot study. Brain Stimulation 2021, 14(3), 531–540. [CrossRef]
- Alvarsson, J.J.; Wiens, S.; Nilsson, M.E. Stress recovery during exposure to nature sound and environmental noise. International Journal of Environmental Research and Public Health 2010, 7(3), 1036–1046. [CrossRef]
- Annerstedt, M.; Jönsson, P.; Wallergård, M.; Johansson, G.; Karlson, B.; Grahn, P.; Hansen, Å.M.; Währborg, P. Inducing physiological stress recovery with sounds of nature in a virtual reality forest—Results from a pilot study. Physiology & Behavior 2013, 118, 240–250. [CrossRef]
- Benfield, J.A.; Taff, B.D.; Newman, P.; Smyth, J. Natural sound facilitates mood recovery. Ecopsychology 2014, 6(3), 183–188. [CrossRef]
- Medvedev, O.N.; Shepherd, D.; Hautus, M.J. The restorative potential of soundscapes: A physiological investigation. Applied Acoustics 2015, 96, 20–26. [CrossRef]
- Jeon, J.Y.; Hong, J.Y.; Lee, P.J. Potential restorative effects of urban soundscapes. Landscape and Urban Planning 2021, 214, 104173. [CrossRef]
- Bai, Z.; Zhang, X.; Liu, Y.; Zhang, Y. Effects of different natural soundscapes on human psychological and physiological recovery. Scientific Reports 2024, 14, 67812.
- Chan, D.; Suk, H.-J.; Jackson, M.; Milman, N.P.; Stark, D.; Klerman, E.B.; Tsai, L.-H. Gamma frequency sensory stimulation in humans. PLOS Biology 2021, 19(8), e3001347.
Figure 1.
Experimental workflow and session timeline. Participants were recruited and screened and assigned to one of two soundscape sets (waves vs. forest). During the listening session, each participant completed two within-participant conditions (40-Hz ON vs. OFF) in a randomized and counterbalanced order while EEG was recorded continuously. A 10-min washout period was provided between blocks. EEG analyses were conducted on playback segments only and quantified 40-Hz power, frequency-domain SNR, and phase-locking value (PLV).
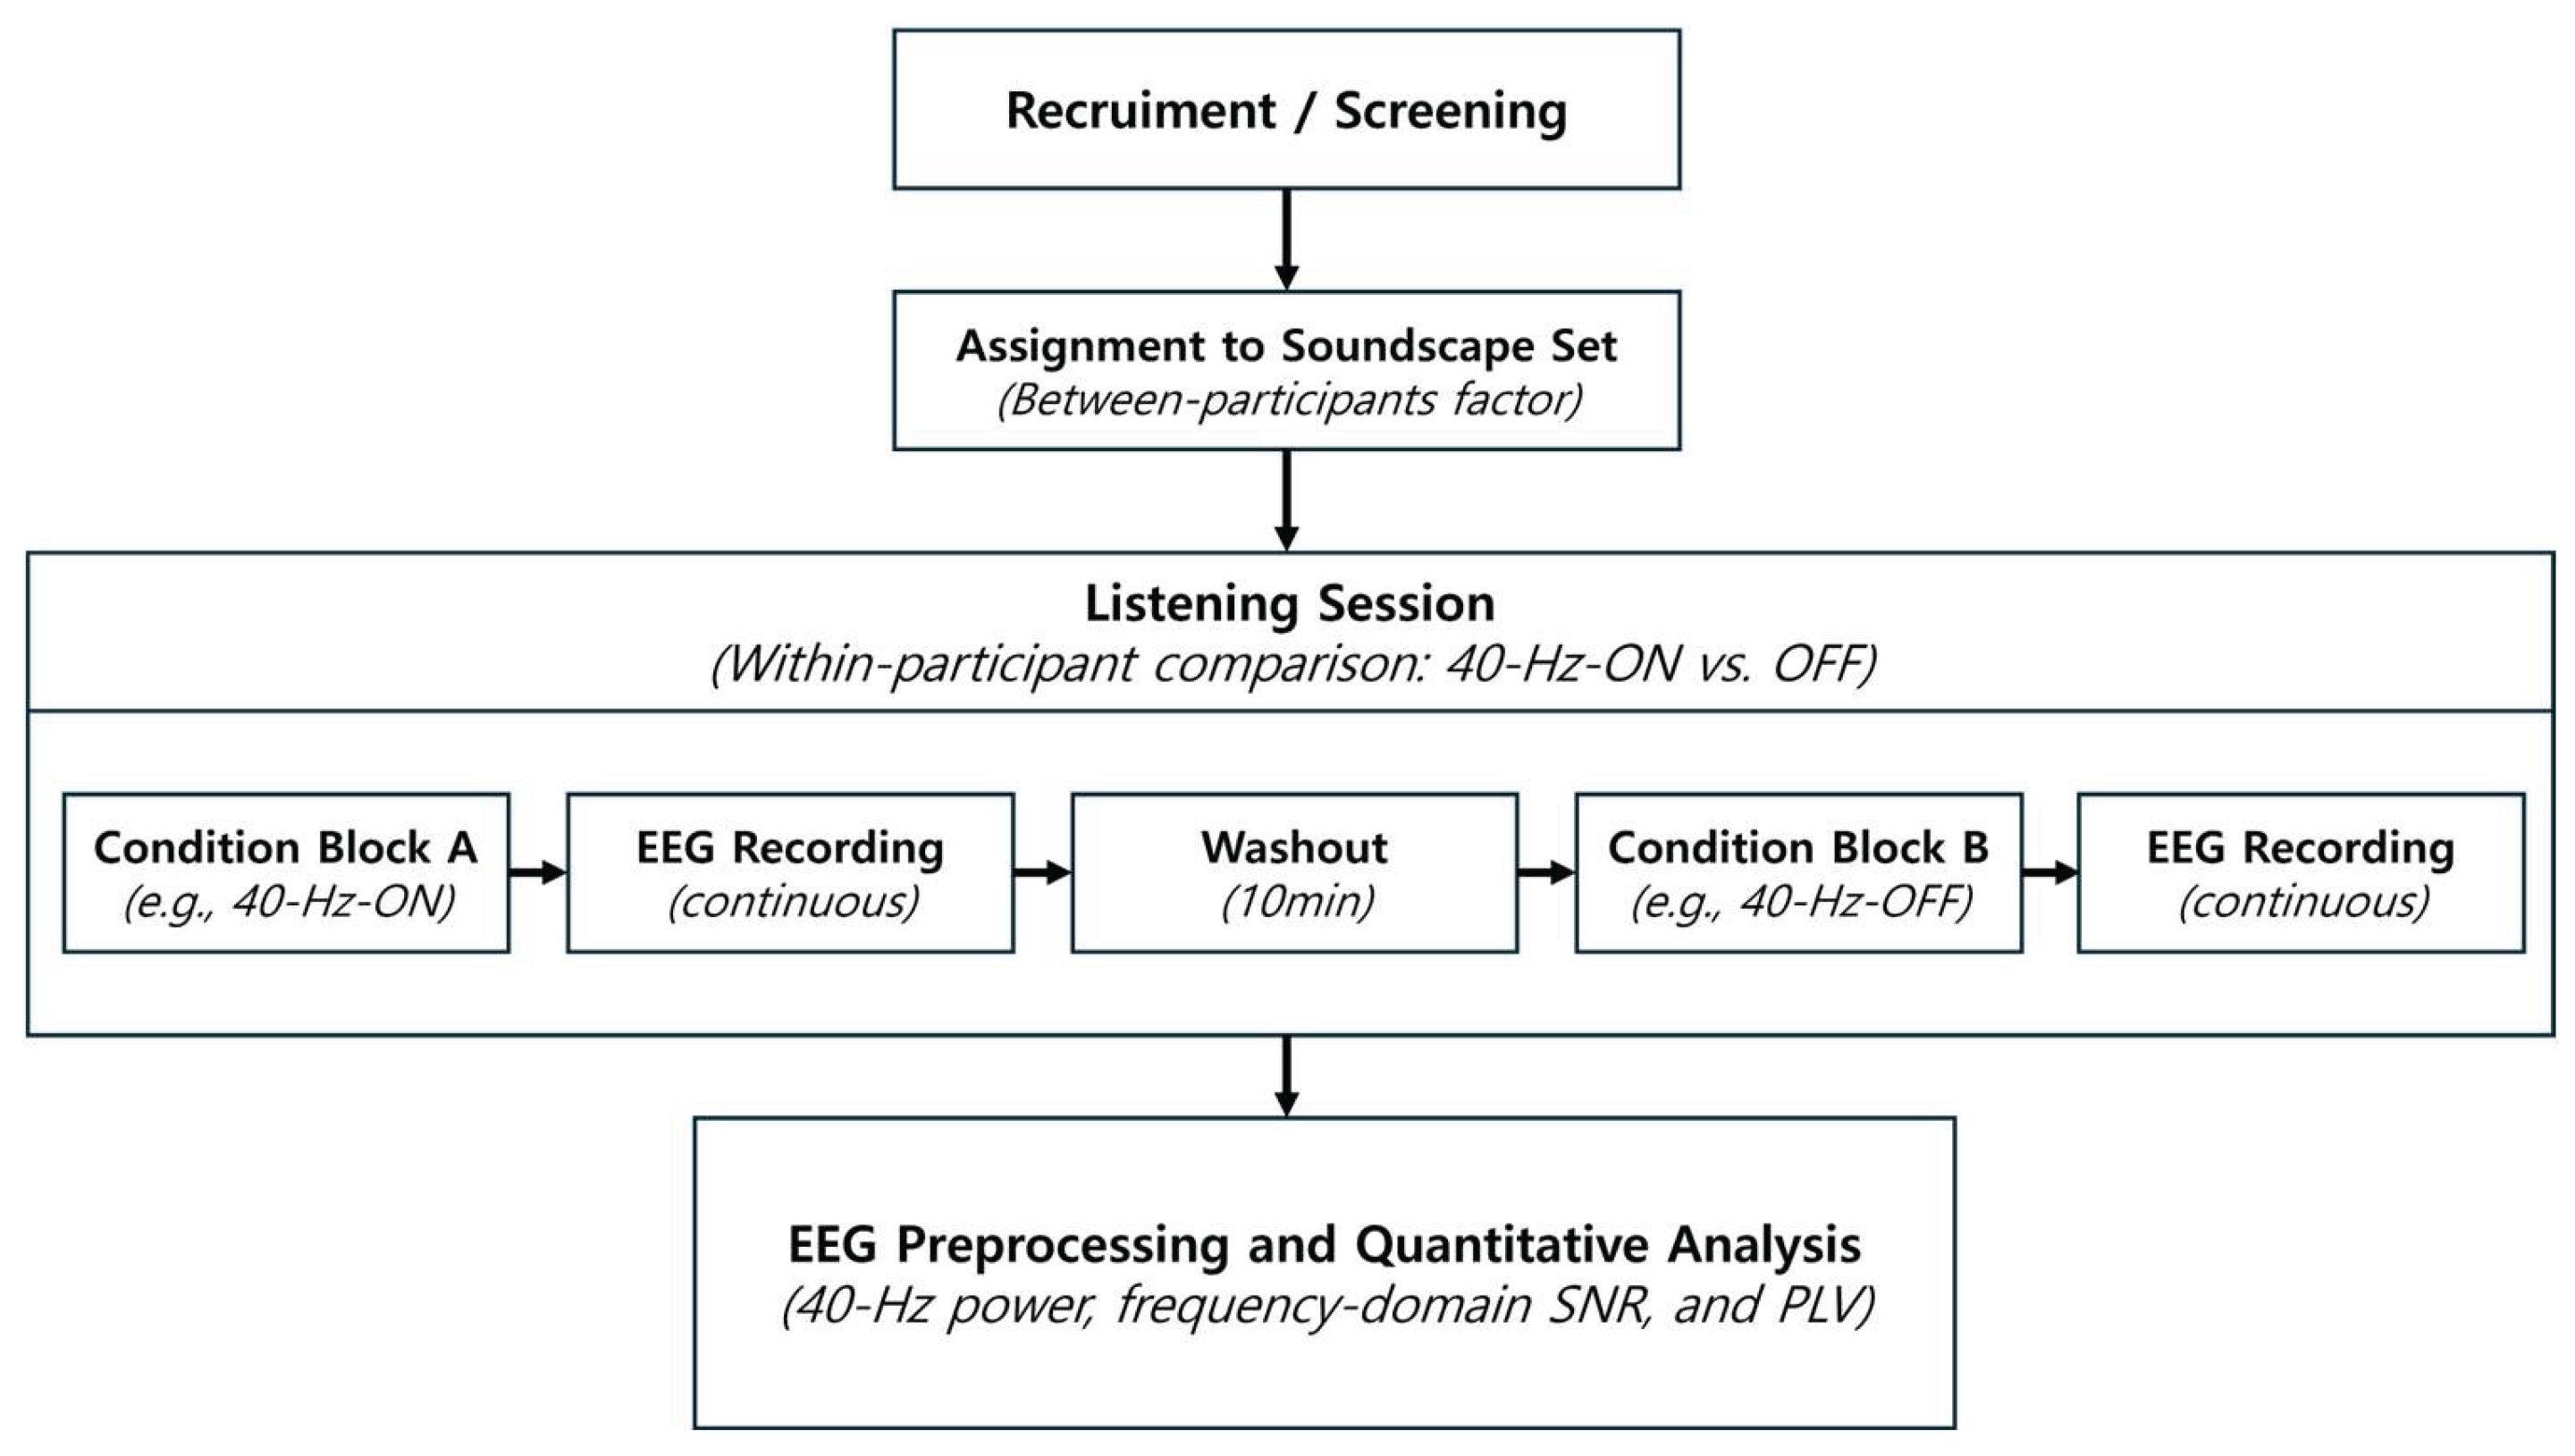
Figure 2.
Audio preprocessing and stimulus verification. (a) Example magnitude response of the steep high-pass filter (HPF; cutoff 78 Hz; slope 96 dB/oct) applied to the base soundscape prior to additive 40-Hz layering. (b) Representative spectrograms of the rendered stereo WAV stimuli after preprocessing and rendering: the 40-Hz OFF stimulus (left) contains the filtered soundscape only, whereas the 40-Hz ON stimulus (right) shows an additional narrowband 40-Hz line component superimposed on the same soundscape. (c) Representative waveform statistics from the rendered files, summarizing peak/RMS and loudness metrics (LUFS/LRA) and confirming post-export quality checks including absence of clipped samples and negligible DC offset.
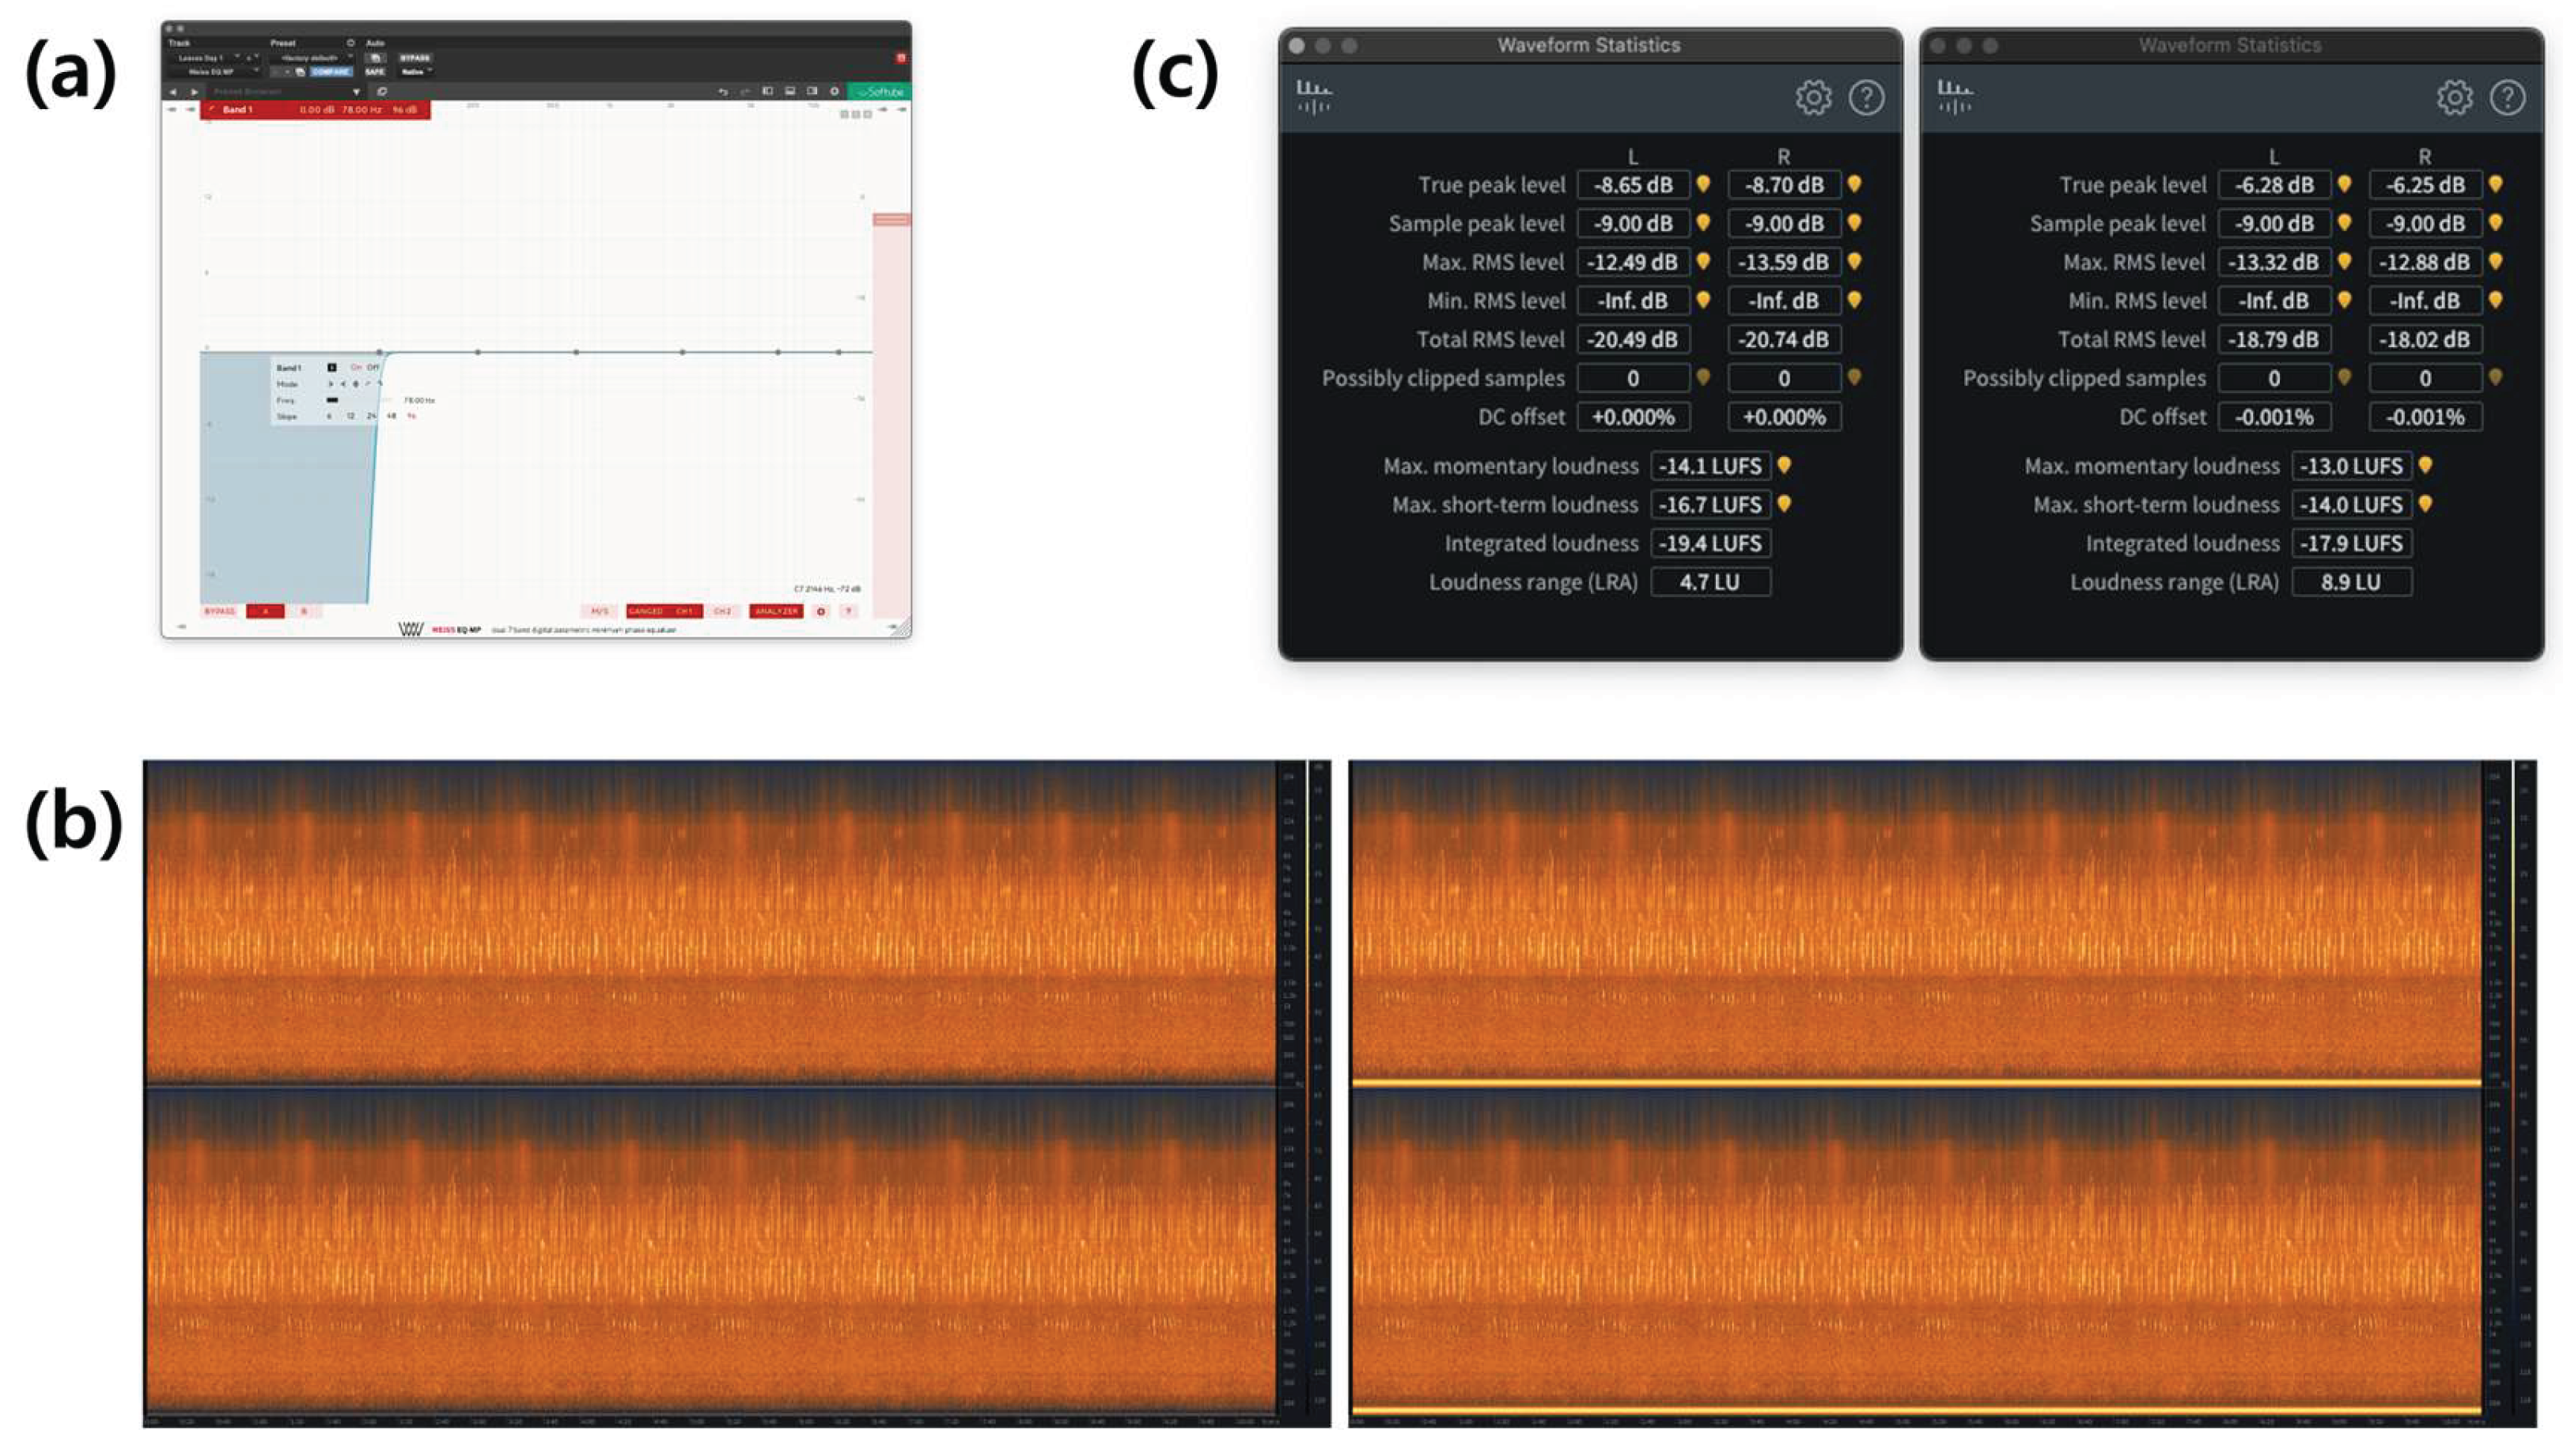
Figure 3.
40-Hz power comparison (40-Hz ON vs. 40-Hz OFF). Top: channel-wise mean 40-Hz power across electrodes. Middle: region-wise means (frontal, temporal, central, parietal–occipital). Bottom: grand-average 40-Hz power across all included electrodes. Asterisks (where shown) denote nominal, uncorrected two-sided p < 0.05 and are provided for exploratory reference only; no multiple-comparison correction was applied.
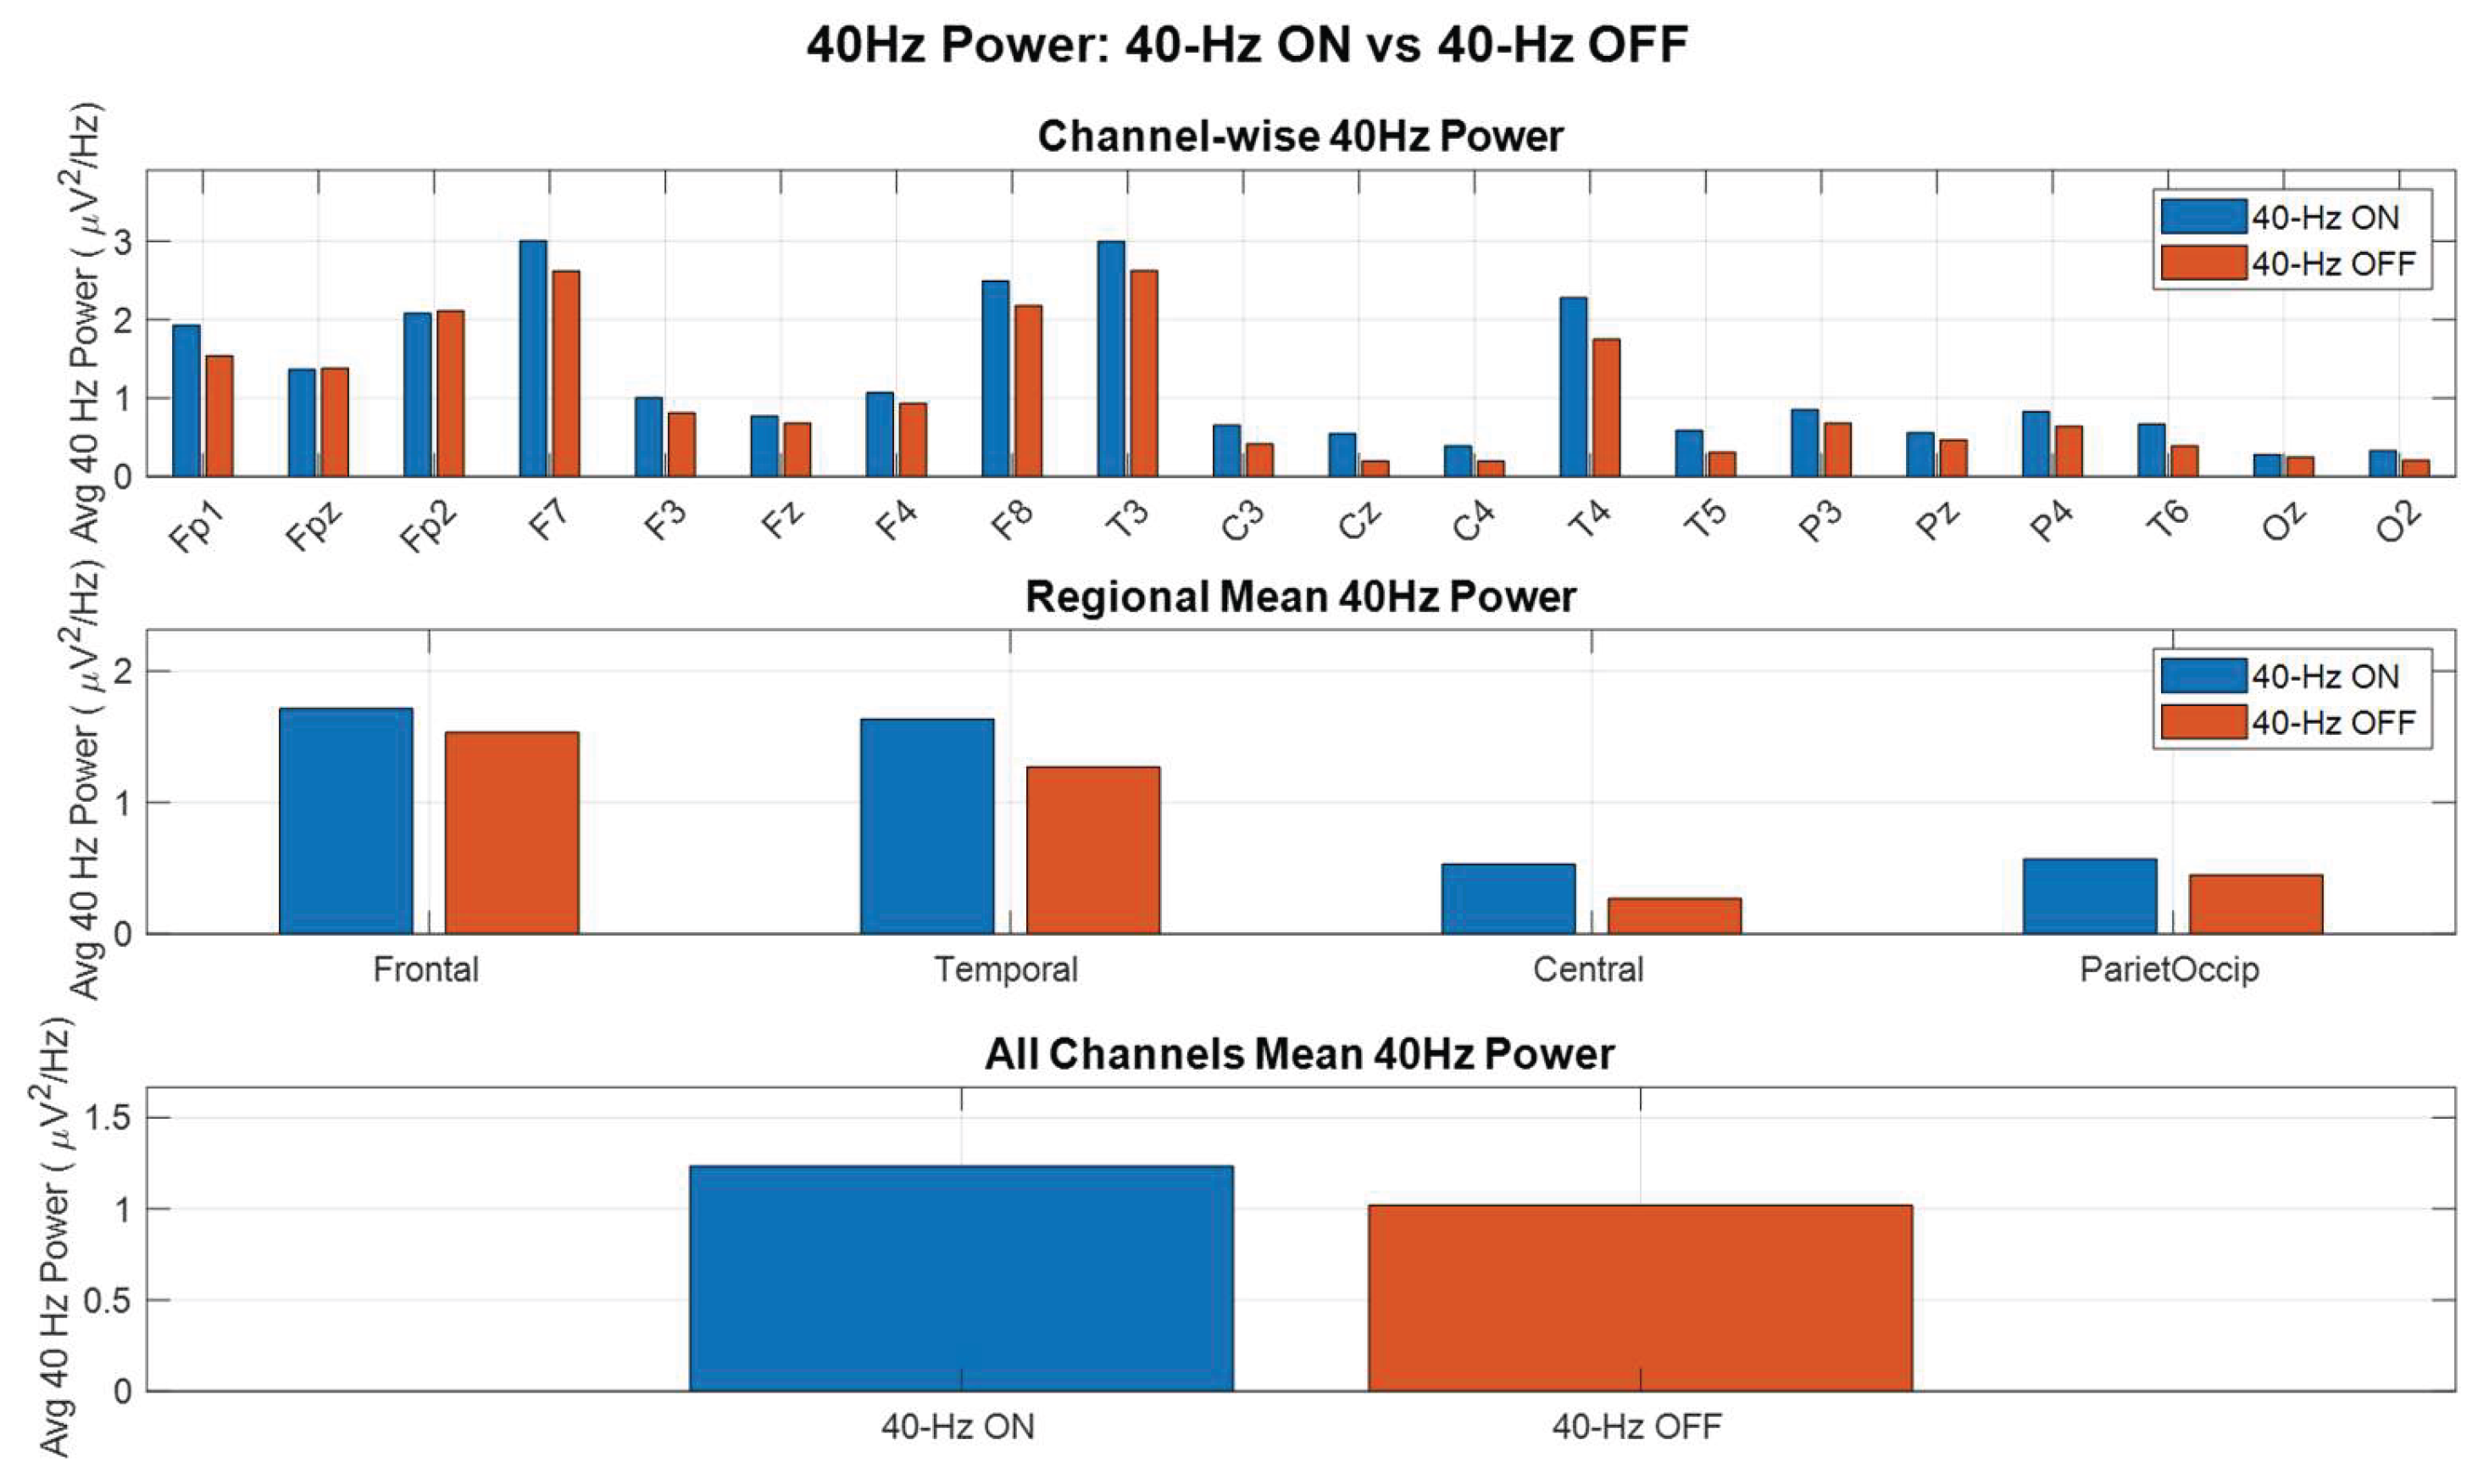
Figure 4.
Frequency-domain SNR spectra (30–50 Hz) for 40-Hz ON vs. 40-Hz OFF. Panels show electrode-wise SNR spectra over 30–50 Hz, comparing 40-Hz ON (soundscape + 40-Hz sine layering) against 40-Hz OFF (soundscape-only). Curves are displayed to illustrate spectral shape and the narrowband feature around 40 Hz. This figure is intended as a descriptive comparison; it is not a multiple-comparison–controlled significance map.
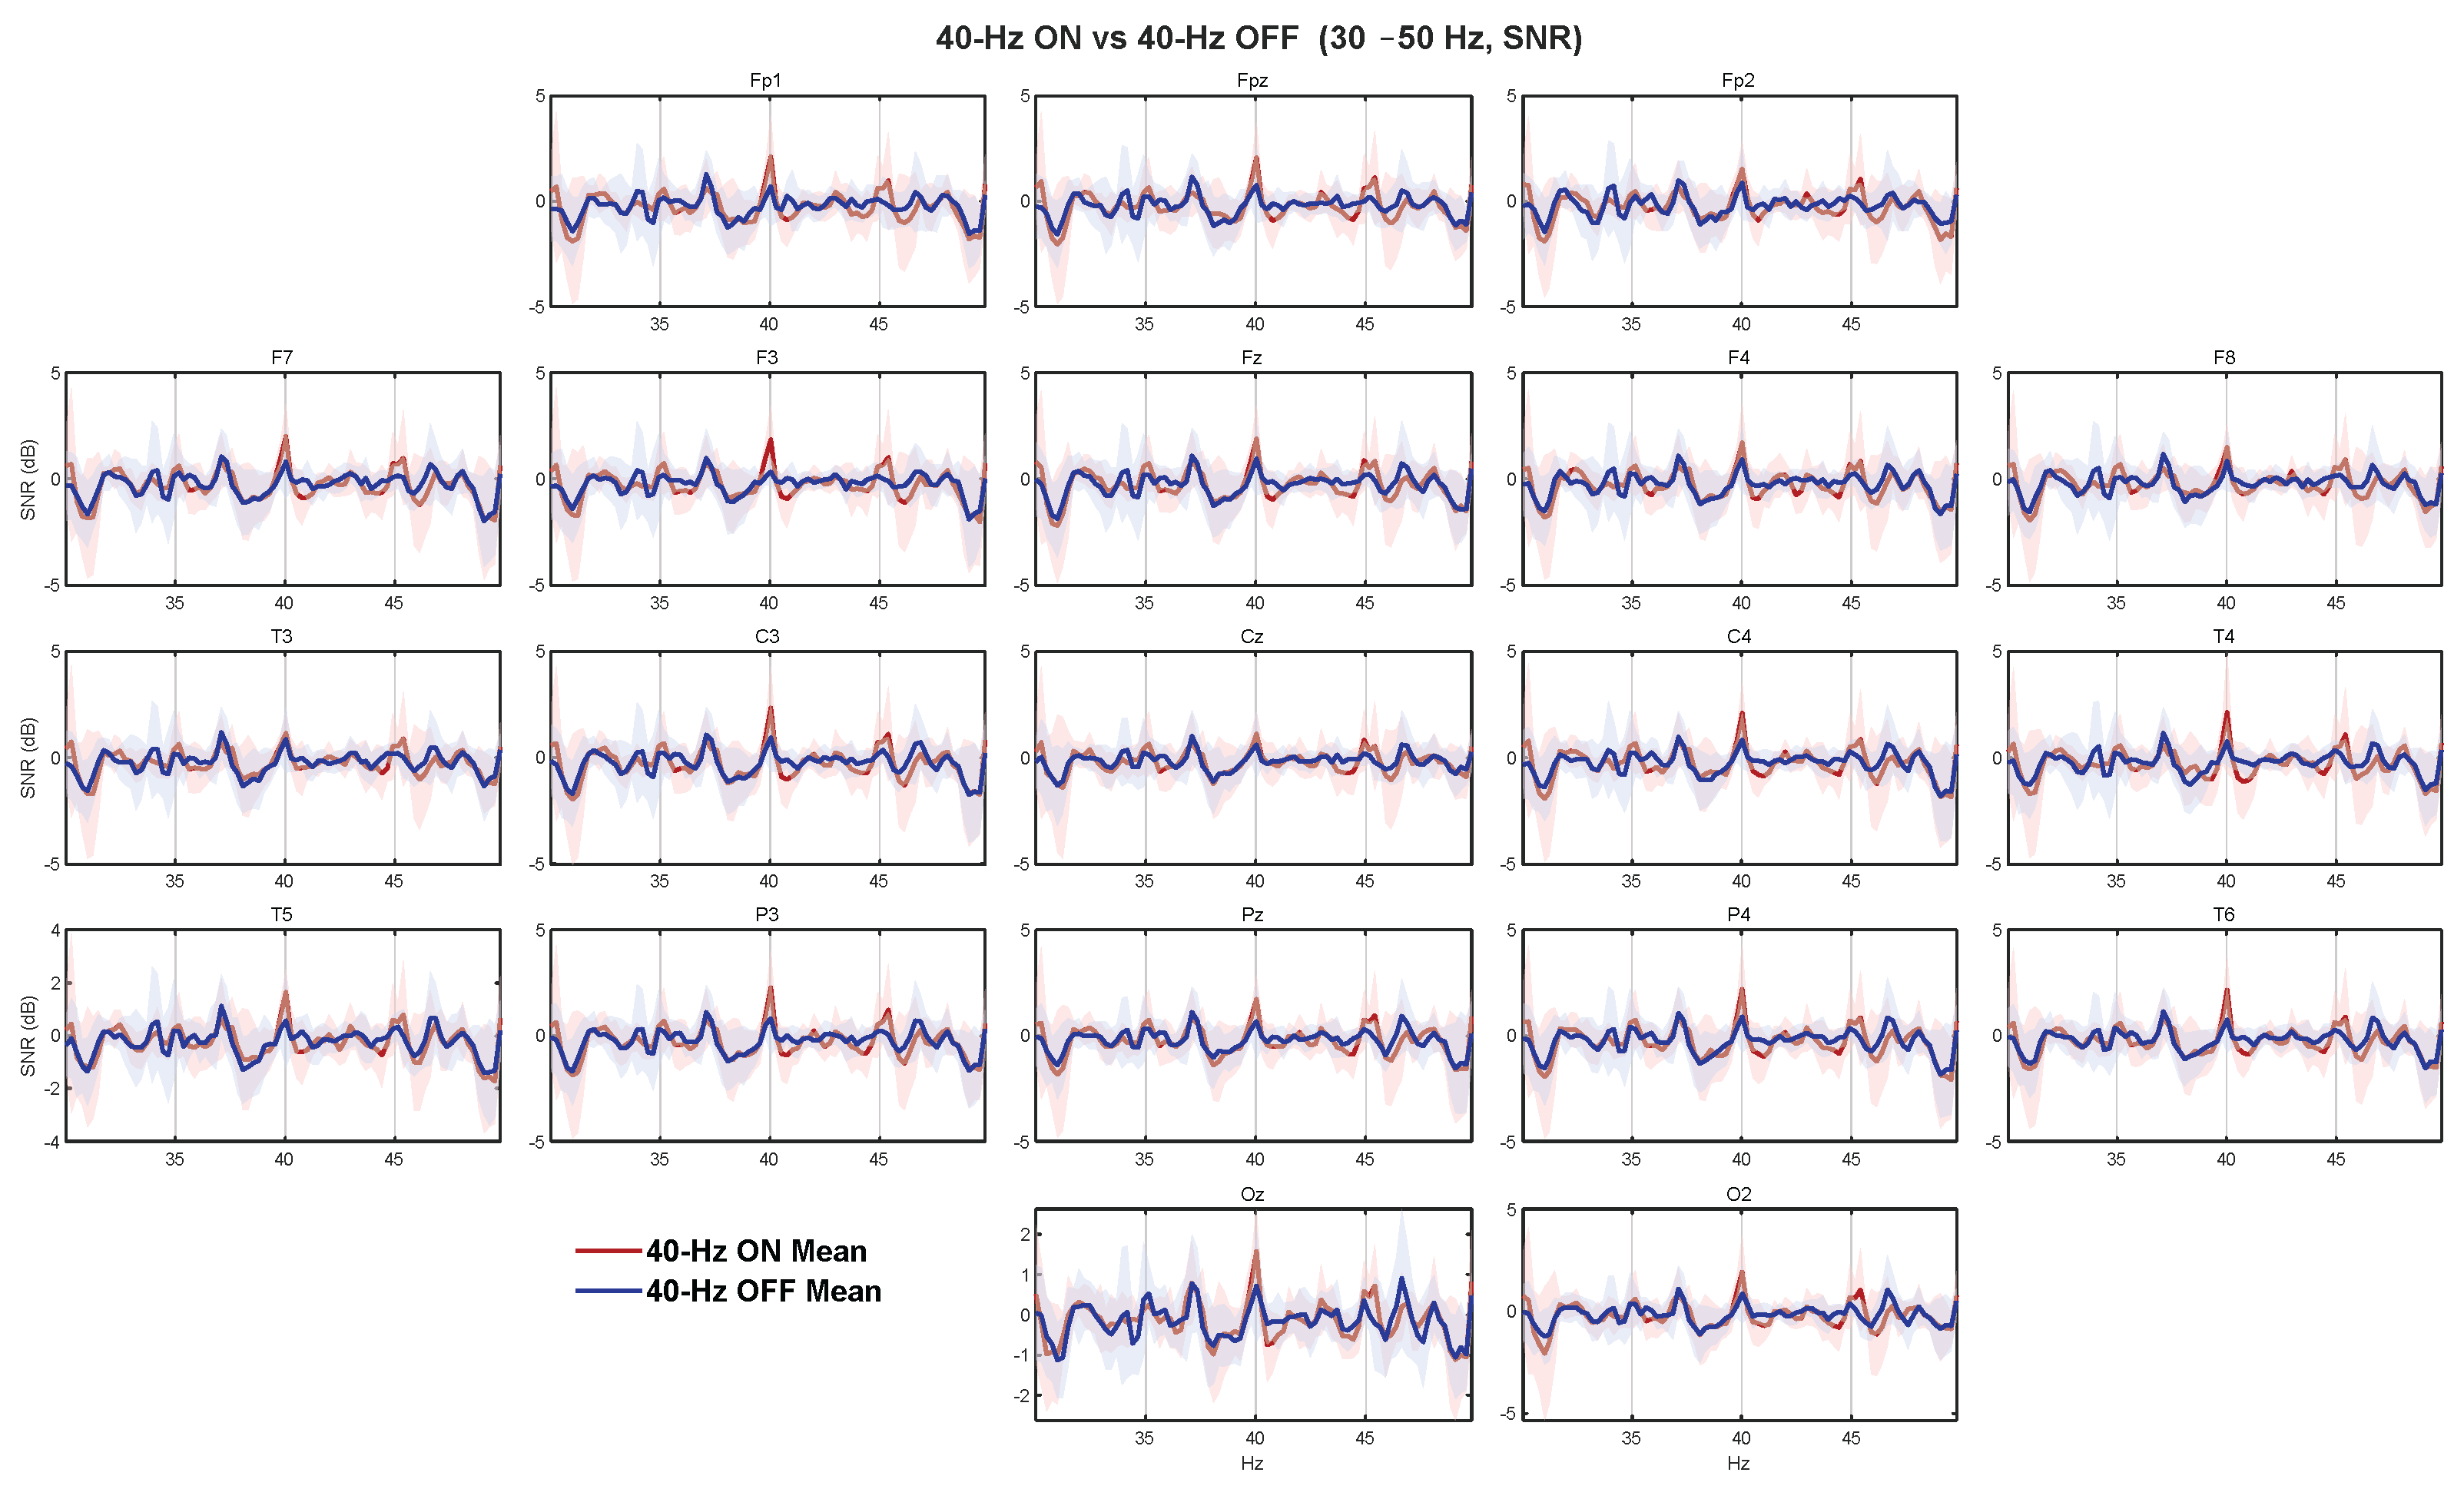
Figure 5.
Scalp topographies of 40-Hz power (40-Hz ON vs. 40-Hz OFF). Condition-wise scalp maps visualize the spatial distribution of 40-Hz power using identical color scales to enable direct comparison. The O1 electrode (left occipital) showed persistent noise and was excluded from channel-wise comparisons; the O1 location in the topography reflects interpolation from neighboring electrodes and should be interpreted cautiously.
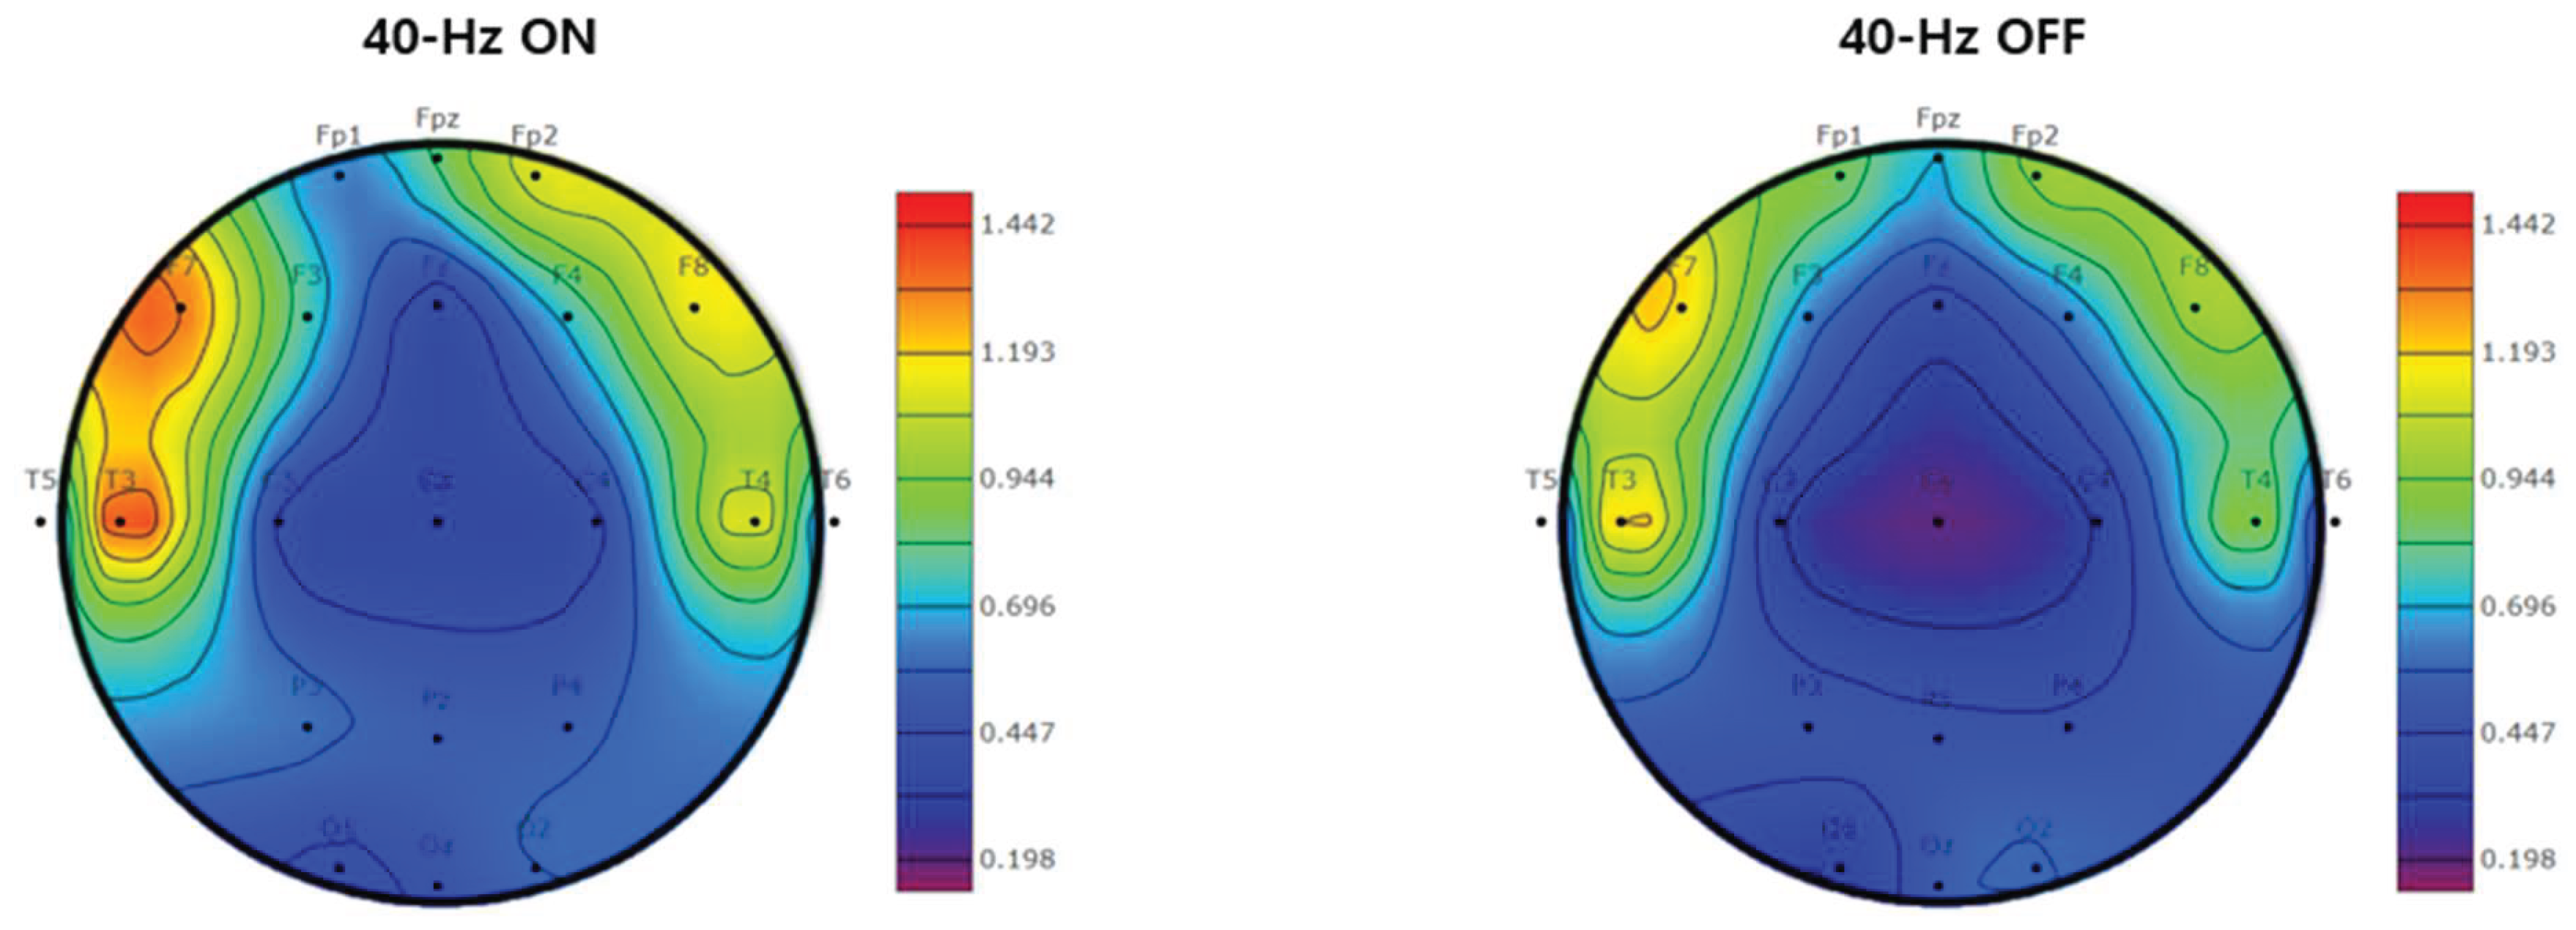
Figure 6.
PLV-based connectivity patterns in the 35–45 Hz band (40-Hz ON vs. 40-Hz OFF). PLV was computed for all unique channel pairs, excluding the O1 electrode due to persistent noise/artifacts (20 electrodes; 190 pairs). Network visualizations display the Top-20 edges ranked by the absolute magnitude of the condition difference (|ΔPLV|, where ΔPLV = PLV_{ON} − PLV_{OFF}) to improve readability; edges were selected by effect magnitude regardless of direction (ON>OFF or OFF>ON) and regardless of statistical significance. The left and middle panels show PLV values for the 40-Hz ON and OFF conditions, respectively, and the right panel shows the corresponding ΔPLV. Because connectivity was evaluated across 190 pairs and no multiple-comparison correction was applied, these plots should be interpreted as descriptive, hypothesis-generating depictions of where larger PLV differences concentrate, not as confirmatory evidence of statistically reliable connectivity effects.
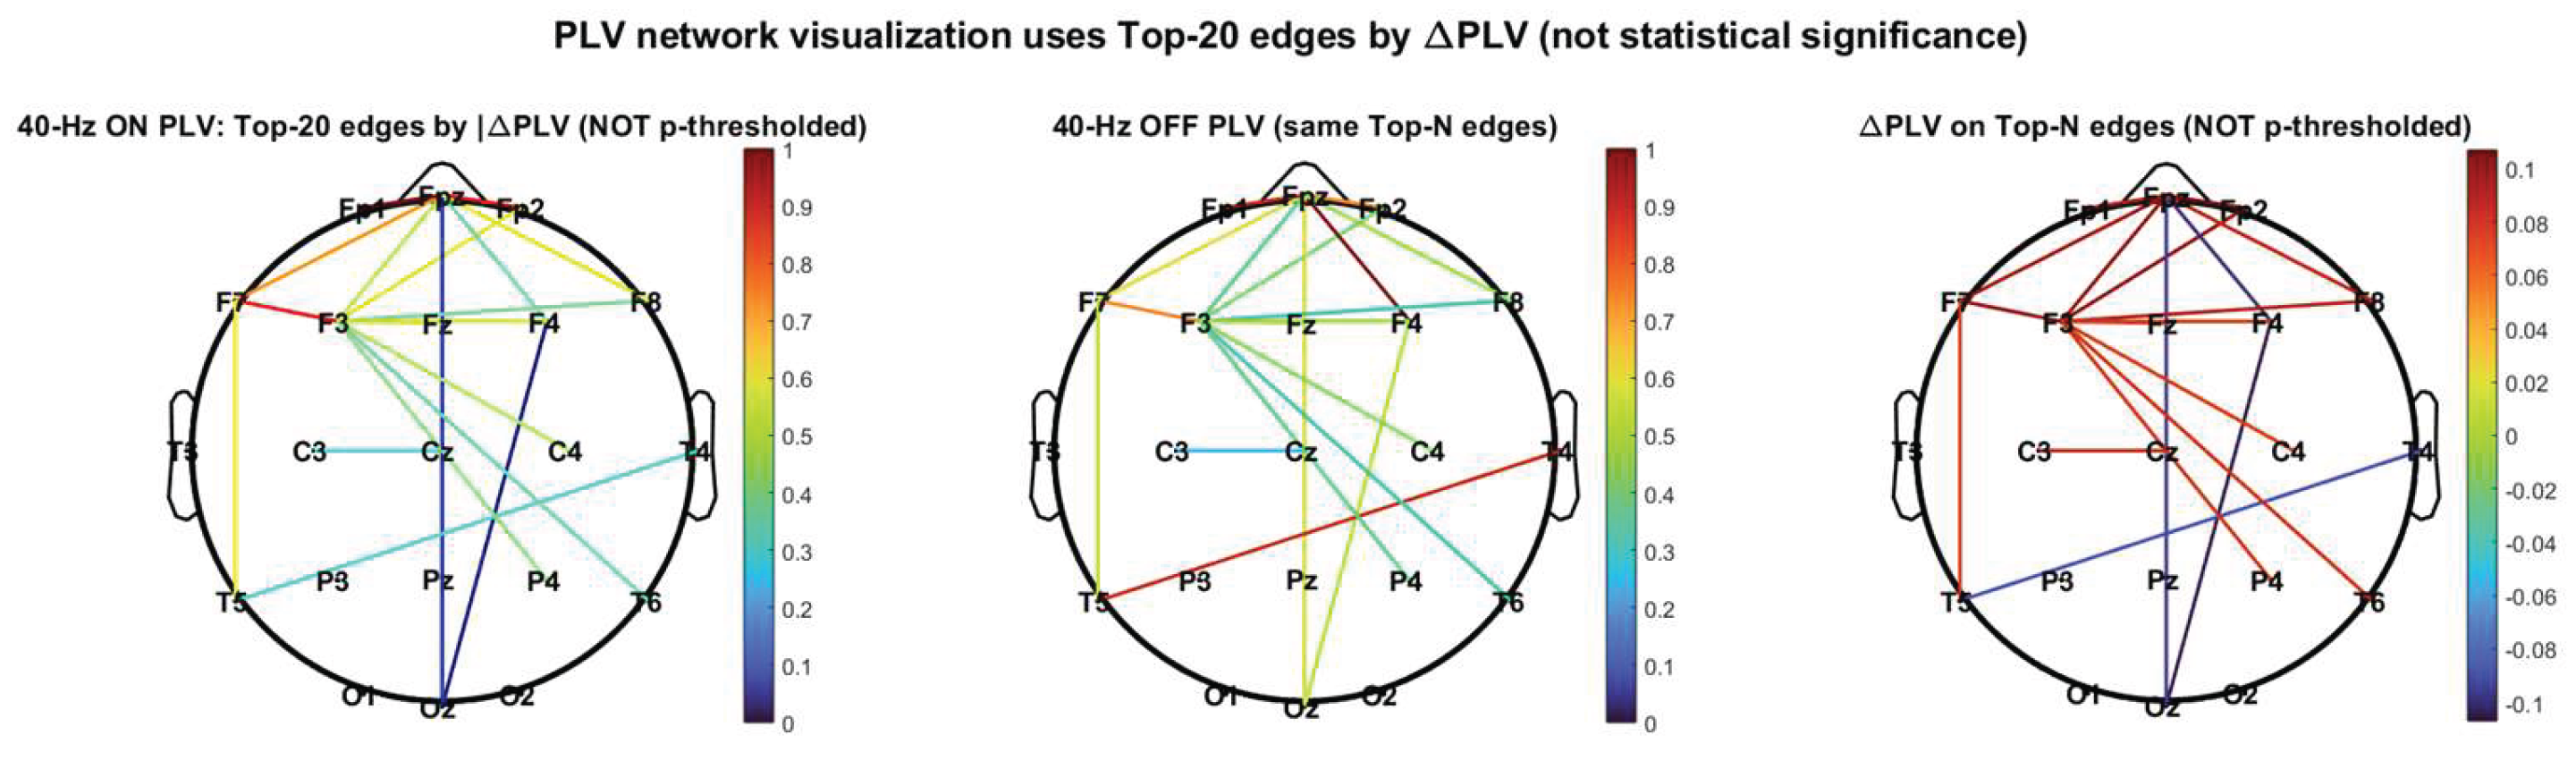
Figure 7.
Distribution of ΔPLV across all channel pairs. Histogram showing the distribution of edge-wise PLV differences (ΔPLV = PLV_{40-Hz ON} − PLV_{40-Hz OFF}) across all analyzed channel pairs (20 electrodes; 190 pairs). No statistical threshold was applied; the distribution is provided to contextualize the selection of edges visualized in Figure 6 and to illustrate the overall pattern of PLV changes between conditions.
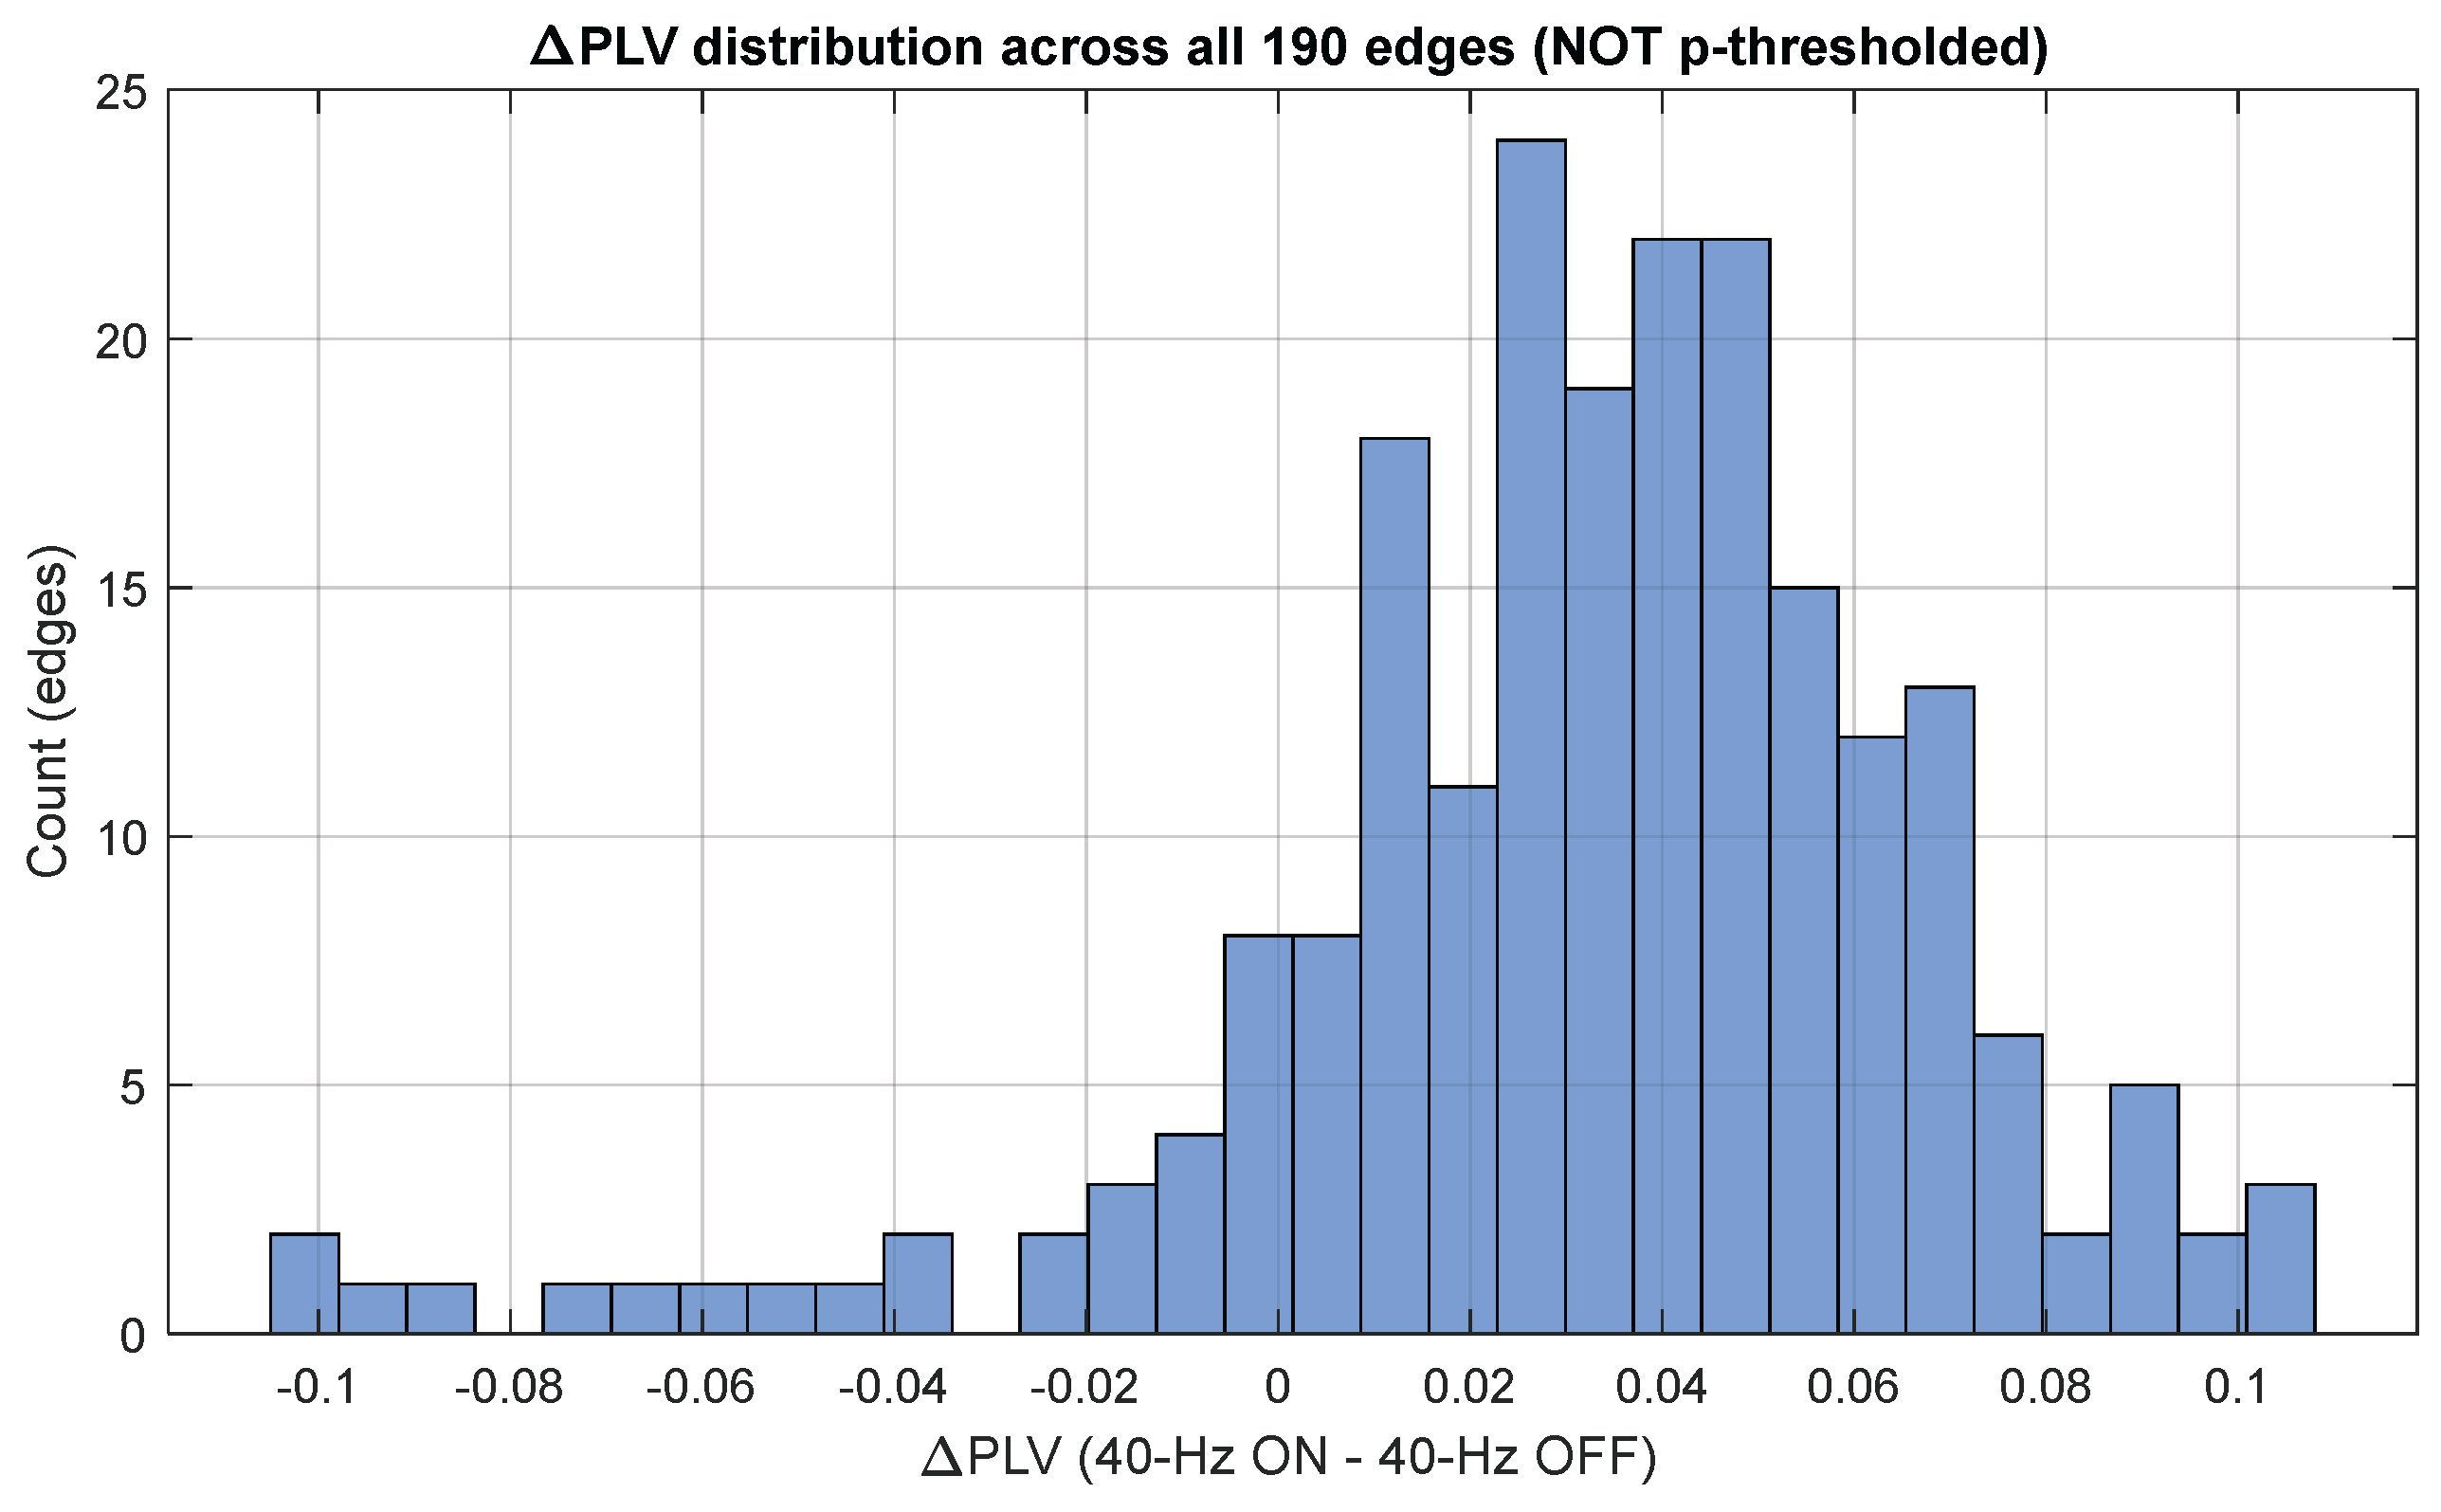
Table 2.
Participant characteristics, experimental allocation, and inclusion in quantitative EEG analyses. Eleven participants were enrolled. Soundscape set assignment (Waves vs. Forest) was a between-participants factor. Within each assigned set, participants completed both conditions (40-Hz OFF vs. ON) in a randomized and counterbalanced order (within-participant crossover). P01 and P04 were excluded from quantitative EEG analyses due to repeated drowsiness/sleep observed during listening blocks, indicating non-adherence to the wakefulness requirement. A′/B′ denote 40-Hz OFF; A/B denote 40-Hz ON.
| Participant | Gender | Age (years) | Assigned soundscape set | Condition 1 | Condition 2 | Included in EEG analysis | Exclusion reason |
| P01 | Male | 46 | Set A (Waves) | A′ | A | No | Drowsiness/sleep observed during listening block (protocol non-adherence) |
| P02 | Male | 45 | Set B (Forest) | B | B′ | Yes | — |
| P03 | Male | 77 | Set A (Waves) | A′ | A | Yes | — |
| P04 | Male | 77 | Set A (Waves) | A | A′ | No | Drowsiness/sleep observed during listening block (protocol non-adherence) |
| P05 | Female | 78 | Set A (Waves) | A′ | A | Yes | — |
| P06 | Female | 40 | Set A (Waves) | A | A′ | Yes | — |
| P07 | Female | 67 | Set B (Forest) | B′ | B | Yes | — |
| P08 | Male | 44 | Set B (Forest) | B′ | B | Yes | — |
| P09 | Male | 48 | Set A (Waves) | A | A′ | Yes | — |
| P10 | Female | 69 | Set B (Forest) | B′ | B | Yes | — |
| P11 | Male | 70 | Set B (Forest) | B | B′ | Yes | — |
Table 3.
Post-export stimulus verification and technical quality control for the final rendered audio files. Waveform statistics were extracted from the exported stereo WAV files to document integrated loudness (LUFS), true-peak level (dBTP; maximum across channels), clipping, DC offset, and loudness range (LRA). OFF indicates the soundscape-only control; ON indicates the corresponding soundscape with additive inclusion of a pure 40-Hz sine component (not AM). Loudness changes after layering were small (Waves: Δ +0.1 LUFS; Forest: Δ +0.3 LUFS, ON relative to OFF). All files showed 0 clipped samples and negligible DC offset.
| Stimulus group | Condition label | Integrated loudness (LUFS) | True peak (dBTP) | Clipped samples (count) | DC offset (%) | LRA (LU) | Δ LUFS (ON–OFF) |
|
40-Hz tone (standalone reference) |
Reference | -31.3 | -23.97 | 0 | +0.000 | 0.0 | — |
| Waves soundscape | 40-Hz OFF (A′) | -18.0 | -6.36 | 0 | -0.001 | 9.7 | — |
| Waves soundscape + 40 Hz | 40-Hz ON (A) | -17.9 | -6.28 | 0 | -0.001 | 8.9 | +0.1 |
| Forest soundscape | 40-Hz OFF (B′) | -19.7 | -8.57 | 0 | +0.000 | 5.1 | — |
| Forest soundscape + 40 Hz | 40-Hz ON (B) | -19.4 | -8.65 | 0 | +0.000 | 4.7 | +0.3 |
Table 4.
Channel- and region-level 40-Hz power (40-Hz ON vs. 40-Hz OFF). (a) Channel-wise 40-Hz power for 40-Hz ON versus 40-Hz OFF. P-values are two-sided and uncorrected, intended for exploratory, hypothesis-generating interpretation (no multiplicity control). The O1 electrode (left occipital) was excluded due to persistent noise; (b) Region-wise summaries (Frontal/Temporal/Central/Parietal–Occipital) of 40-Hz power for 40-Hz ON versus 40-Hz OFF. P-values are two-sided and uncorrected (no multiplicity control).
| (a) Channel-level (electrode-wise) | ||||
|---|---|---|---|---|
| Channel | 40-Hz ON | 40-Hz OFF | P-value (two-sided) |
|
| Fp1 | 1.284 | 0.988 | 0.055 | |
| Fpz | 0.945 | 0.816 | 0.098 | |
| Fp2 | 1.289 | 1.171 | 0.359 | |
| F7 | 1.614 | 1.415 | 0.301 | |
| F3 | 0.804 | 0.634 | 0.074 | |
| Fz | 0.406 | 0.367 | 1.000 | |
| F4 | 0.807 | 0.659 | 0.129 | |
| F8 | 1.431 | 1.241 | 0.359 | |
| T3 | 1.571 | 1.362 | 0.098 | |
| C3 | 0.431 | 0.286 | 0.301 | |
| Cz | 0.425 | 0.152 | 0.039 | |
| C4 | 0.423 | 0.290 | 0.039 | |
| T4 | 1.351 | 1.044 | 0.039 | |
| T5 | 0.356 | 0.203 | 0.301 | |
| P3 | 0.625 | 0.484 | 0.098 | |
| Pz | 0.550 | 0.452 | 0.301 | |
| P4 | 0.580 | 0.455 | 0.250 | |
| T6 | 0.469 | 0.297 | 0.039 | |
| Oz | 0.249 | 0.202 | 0.164 | |
| O2 | 0.509 | 0.389 | 0.496 | |
| (b) Region-level summaries | ||||
| Region | 40-Hz ON | 40-Hz OFF | P-value (two-sided) |
|
| Frontal | 1.073 | 0.911 | 0.055 | |
| Temporal | 0.937 | 0.726 | 0.039 | |
| Central | 0.426 | 0.242 | 0.098 | |
| Parietal–Occipital | 0.503 | 0.397 | 0.203 | |
| Grand average | 0.806 | 0.645 | 0.074 | |
Disclaimer/Publisher’s Note: The statements, opinions and data contained in all publications are solely those of the individual author(s) and contributor(s) and not of MDPI and/or the editor(s). MDPI and/or the editor(s) disclaim responsibility for any injury to people or property resulting from any ideas, methods, instructions or products referred to in the content. |
© 2026 by the authors. Licensee MDPI, Basel, Switzerland. This article is an open access article distributed under the terms and conditions of the Creative Commons Attribution (CC BY) license (http://creativecommons.org/licenses/by/4.0/).
Copyright: This open access article is published under a Creative Commons CC BY 4.0 license, which permit the free download, distribution, and reuse, provided that the author and preprint are cited in any reuse.


