
Submitted:
16 January 2026
Posted:
19 January 2026
You are already at the latest version
Abstract
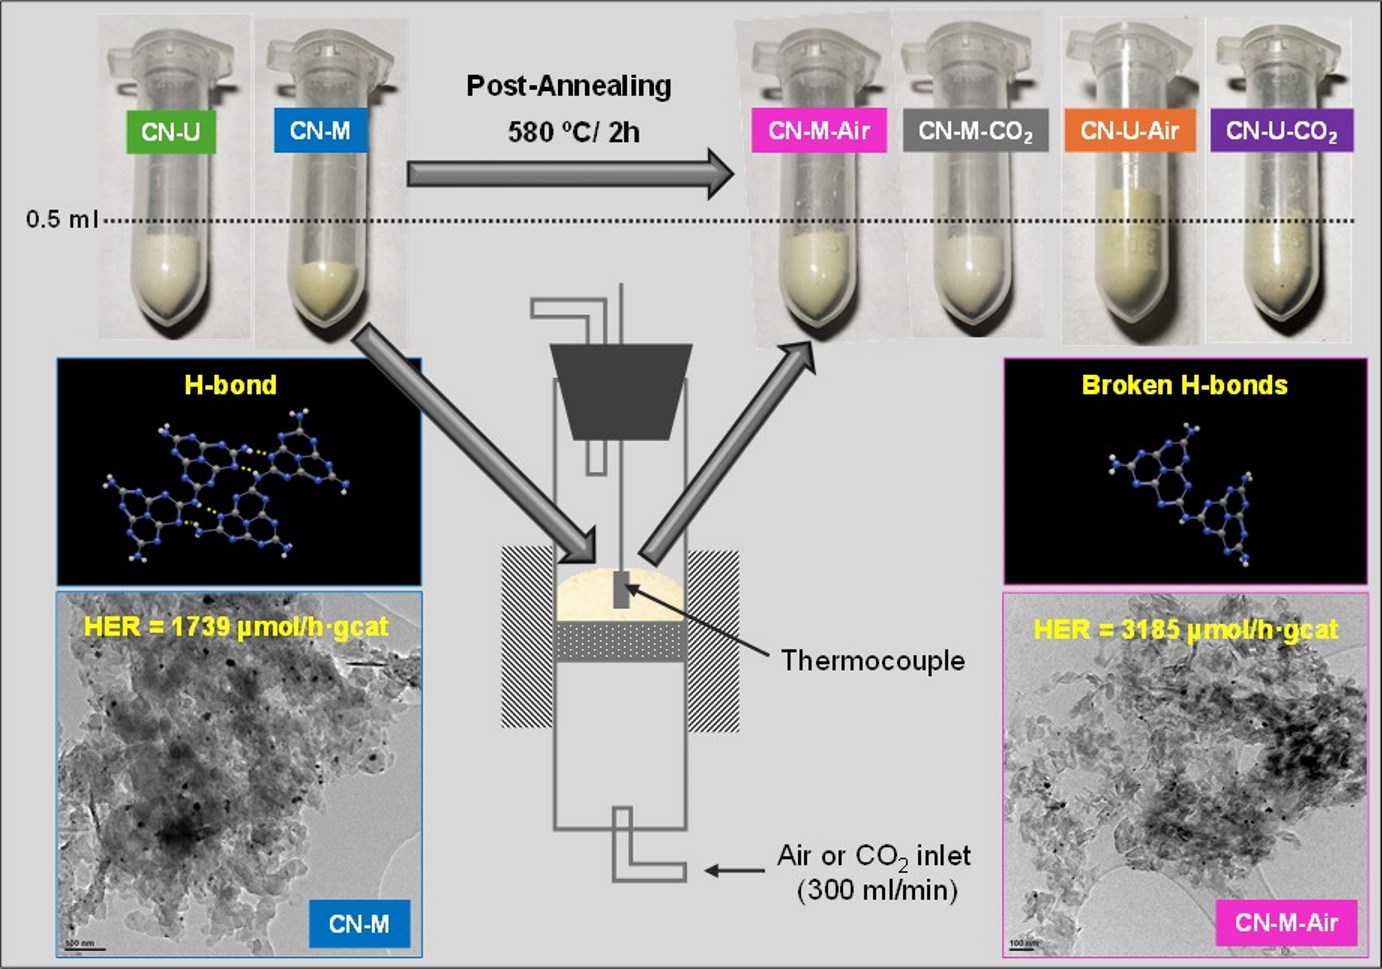
Post-annealing treatments constitute a simple and cost-effective strategy to tailor the structure and photocatalytic performance of polymeric carbon nitride (PCN). In this work, PCNs synthesized from melamine and urea were subjected to post-annealing at 580 °C under air and CO₂ atmospheres to elucidate the role of hydrogen bonding, as well as other structural modifications induced by oxidizing atmospheres, on photocatalytic water splitting. Comprehensive structural, chemical, and textural characterization (XRD, FTIR spectroscopy, XPS, SSNMR, HRTEM, BET, TGA, and UV–Vis DRS) reveals that post-annealing induces markedly different effects depending on the precursor. For melamine-derived PCN, the treatment selectively disrupts hydrogen bonds between melon strands without introducing nitrogen vacancies, amorphization, or framework shortening. This structural rearrangement increases surface area, reduces particle size, slightly widens the band gap, and enhances water–framework interactions, resulting in a twofold improvement in the hydrogen evolution rate (HER), reaching ~3300 µmol h⁻¹ g·cat⁻¹ under visible-light irradiation. In contrast, urea-derived PCN undergoes only minor structural modifications, including slight exfoliation and possible nitrogen deficiency, which do not translate into a measurable enhancement of photocatalytic activity. These results demonstrate that selective hydrogen-bond disruption is a key factor governing charge transport and photocatalytic efficiency in PCN. Importantly, the optimized melamine-derived PCN achieves HER values comparable to those of urea-derived PCN while maintaining a substantially higher synthesis yield, highlighting its potential for scalable solar hydrogen production.
Keywords:
urea
; melamine
; photocatalysis
; H2 evolution rate
; post-annealing
; H-bonds
1. Introduction
The urgent need to reduce greenhouse gas emissions and mitigate the effects of fossil fuel overconsumption has sparked intense research into sustainable energy solutions. Among these, photocatalytic water splitting for hydrogen (H₂) production stands out as a promising strategy to harness solar energy and generate clean fuel [1,2].
Polymeric carbon nitride (CN) has emerged as a promising photocatalyst due to its low cost, simple synthesis, chemical stability, and suitable bandgap for visible light absorption (in the range of 2.7 eV). Its unique electronic structure provides a strong thermodynamic driving force for various redox reactions, making it useful for applications like water splitting, CO₂ reduction, and pollutant degradation. However, despite its advantages, pristine CN faces significant challenges that hinder its photocatalytic performance, including limited light absorption, small surface area, fast electron-hole recombination, and low electrical conductivity. These limitations must be addressed to fully unlock its potential for sustainable energy and environmental applications [2,3,4,5].
The structure of polymeric carbon nitride (CN) is primarily based on strands of melon, composed of tri-s-triazine (heptazine) units, which are connected through covalent bonds along the Y-plane. These strands are connected by hydrogen bonds, which preserve the long-range atomic order within each layer, creating a two-dimensional layer structure. These layers are held together by van der Waals interactions along the Z-plane, allowing for the formation of a stable 3D network [6].
Modifying the structure of polymeric carbon nitride is one of the most studied approaches to improve the photocatalytic efficiency of the semiconductor [1,4,5,7,8]. Although many methods, such as copolymerization and heteroatom doping, have shown promising results, they often involve complex processes and high costs. Therefore, developing simple, scalable, and cost-effective approaches to fine-tune the structure and boost the photocatalytic performance of CN remains a key research focus.
Post-annealing treatments have proven to be a simple and economical method to enhance the photocatalytic efficiency of polymeric carbon nitride by inducing several structural changes:
(1) The incorporation of vacancies/defects [7,9], that has been shown to enhance photocatalytic activity. Nitrogen vacancies inhibit the radiative recombination of photoexcited charge [7], while carbon vacancies facilitated electron transfer from the CB due to a negatively shifted position [9]. Thus, depending on which element creates the vacancy, the properties of CN can differ significantly. Nitrogen vacancies result in a slightly narrowed bandgap and extended visible light absorption [7], whereas carbon vacancies cause a blue shift, decreasing absorption and increasing the bandgap [9].
(2) Oxygen doping can occur when the post-annealing treatment takes place under oxidizing atmospheres [3,9]. O-doping in the CN lattice has been reported to modify its intrinsic electronic and band structure, shifting the absorption edge to 498 nm and enhancing its visible-light photoactivity. This process can increases the surface area, broadens the material’s response to visible light, and improves the separation efficiency of photoinduced charge carriers [3,10].
(3) Amorphism, meaning a reduction in long-range atomic order, has been found to lower the bandgap to 1.90 eV by merely heating partially crystalline CN, which originally has a bandgap of 2.82 eV. As a result of this modification, amorphous CN demonstrated significantly higher hydrogen generation activity compared to CN, due to its extended light absorption range and suppressed radiative recombination [11].
(4) Reducing the particle size and/or creating holes within the layers [8,12,13,14,15] also can boost the photocatalytic efficiency by increasing the specific surface area, exposing more new edges, and providing additional catalytically active sites. Furthermore, the reduction in particle size leads to an increase in the band gap and a blue shift in absorption, due to the quantum confinement effect (QCE). As a result, the photogenerated electrons retain their strong reducing power, while the mobility of the generated holes improves, leading to enhanced oxidation efficiency.
The reduction in particle size can occur through three distinct processes, which are worth differentiating: (4.1) Shortening of melon strands along the Y-plane due to the breaking of covalent bonds, which provides the previously described advantages [15]. (4.2) Breaking of hydrogen bonds along the X-plane [8,14], which is more beneficial than the previous process due to the 7.9 eV potential barrier across the hydrogen-bonded regions, which makes the transport of charge carriers between the melon strands difficult. For this reason, the selective breaking of hydrogen bonds can substantially enhance photocatalytic activity by suppressing radiative electron-hole recombination. (4.3) Decrease in layer alignment along the Z-plane due to exfoliation processes [2,12,16]. As with hydrogen bonds, eliminating these interactions is highly beneficial due to the large 33.2 eV potential barrier between the layers, which prohibits the transport of charge carriers between them [8].
In this study, we focus on further enhancing the catalytic efficiency of these nitrides through a simple and cost-effective post-annealing treatment under two different atmospheres (air and CO₂) at 580 °C—a temperature previously identified as optimal for the selective disruption of hydrogen bonds in layered carbon nitride[8], without the use of any additives or salt intercalation. Furthermore, building upon our previous work [1], which established the optimal synthesis conditions for producing PCN from urea and melamine precursors, we evaluate how this post-treatment affects PCNs derived from these different precursors, which naturally yield materials with higher (melamine) or lower (urea) hydrogen-bond densities [17], while also assessing the influence of oxidizing atmospheres that have been shown to enhance the photocatalytic efficiency during PCN synthesis [1].
2. Materials and Methods
2.1. Photocatalyst Synthesis
2.1.1. CN-Precursors Synthesis
The polymeric carbon nitride (CN) synthesis was performed following the methodology established in our previous work [1]. Melamine (M) and urea (U) were chosen as precursors for CN synthesis via thermal polymerization. Approximately 20 g of each precursor were placed in a lidded crucible and calcined at 600 ºC for 2 hours in a horizontal furnace, with a heating rate of 5 ºC/min under a static air atmosphere (20 ml/min). The resulting powders were thoroughly washed with deionized water, followed by sequential treatments with HCl (1M) and NaOH (1M), and rinsed again with deionized water to eliminate unreacted species and potential surface contaminants. The final samples were labeled as CN-precursor (i.e., CN-M and CN-U).
2.1.2. Post-Annealing of CN-Precursors
The experimental setup for the post-annealing treatments, along with the temperature curves recorded by the thermocouple, is shown in Figure 1. A total of 400 mg of bulk CN was placed on a porous alumina support, positioned at the center of a vertical furnace, and heated to 580 °C at a rate of 5 °C/min under two oxidizing atmospheres: air and CO₂ (300 ml/min). After maintaining the target temperature for 2 hours, the samples were cooled to room temperature over 9 hours and 30 minutes. The resulting materials were labeled as CN-precursor-atmosphere (i.e., CN-M-Air, CN-M-CO₂, CN-U-Air, and CN-U-CO₂).
2.1.3. Co-Catalyst Deposition
Platinum (Pt) was deposited on the photocatalyst surface through the photoreduction of H₂PtCl₆. Stock solutions of deionized water and the precursor (e.g., Pt: H₂PtCl₆·(H₂O)₆) were prepared in advance, and a specific volume was added to achieve a metal loading of 3 wt.%. The photoreduction process was carried out in a 500 mL quartz-top Pyrex reactor, maintained at 25 ºC and atmospheric pressure. In a typical experiment, 29.1 mg of polymeric carbon nitride powder was ultrasonically dispersed in 150 mL of an aqueous solution containing 13 vol% triethanolamine (TEOA) as a sacrificial agent. The reactor was sealed and purged with N₂ gas for 30 minutes at a flow rate of 200 mL/min. Subsequently, the reactor was irradiated for 4 hours using a 300 W Xe lamp with λ > 320 nm. After the reaction, the resulting photocatalyst was filtered, rinsed with deionized water, and dried at 80 ºC overnight.
2.2. Photocatalyst Characterization
Ultimate analysis was conducted following the ASTM D 5373-02 standard method to determine the carbon (C), hydrogen (H), and nitrogen (N) content using a LECO CHN2000 instrument. Oxygen (O) content was directly measured with a LECO VTF-900 analyzer.
Thermogravimetric analysis (TGA) was performed using a TA Instruments SDT 2960 thermoanalyzer. To study thermal stability, approximately 4 mg of each sample was heated at 10 ºC/min up to 900 °C in Pt crucibles under a nitrogen atmosphere (100 mL/min).
The UV-VIS diffuse reflectance spectra (DRS) of the as-prepared photocatalysts were measured using a UV-VIS spectrophotometer (Shimadzu UV 2450). The Kubelka-Munk transformation and the Tauc equation were applied to obtain the apparent band gap [18].
The textural properties of the photocatalysts (i.e., BET surface area (SBET) and total pore volume (Vt), obtained from the volume adsorbed at p/p0 = 0.97) were derived from N2 adsorption isotherms at 77 K, measured using a Micromeritics ASAP 2420 apparatus. The samples were degassed under vacuum at 200 °C for 12 h prior to N2 adsorption to eliminate any moisture and condensed volatiles. The Barrett, Joyner, and Halenda (BJH) method was used to calculate the pore size distribution from the experimental isotherms, employing the Kelvin model of pore filling.
The crystal structure of the as-prepared photocatalysts was characterized by X-ray diffraction (XRD) on a Bruker D8 advance diffractometer with a Cu K⍺ radiation. The scanning rate was 1.2º·min-1 and the 2θ range was 5-70º.
The in-plane distance of the tri-s-triazine and s-triazine units, as well as the interlayer distance of the layer stack, were calculated using the Bragg’s law equation:
where dhkl represents the distance between 2 planes of the (hkl) Miller index (Å), θ corresponds to Bragg’s angle, n is the diffraction order, and λ stands for the wavelength of the incident beam (1.5406 Å). In addition, the crystallite size of tri-s-trizine and s-triazine based polymers and the average thickness of graphitic stacks of CN sheets were determined using the Debye–Scherrer equation:
where K is the Scherrer constant (0.9) and β is full width of crystallite peak at half maximum (FWHM).
The surface atomic composition and chemical states of the as-prepared photocatalysts were measured by X-ray photoelectron spectroscopy (XPS) using a SPECS spectrometer equipped with a Phoibos 100 hemispherical analyzer. The X-ray radiation source was a monochromatic Al Kα (1486.74 eV) with 100 W X-ray power and an anode voltage of 14.00 kV. The photo-excited electrons were analyzed in constant pass energy mode, with a pass energy of 50 eV for the survey spectra and 10 eV for the high-resolution core level spectra. CasaXPS software was used for data processing.
Fourier transform infrared (FTIR) spectra were recorded on a Bruker Vertex 70 FTIR spectrometer equipped with a deuterated triglycine sulfate (DTGS) detector and a Golden Gate diamond attenuated total reflectance (ATR) accessory. The spectra were collected over 64 scans at a resolution of 4 cm−1 in the 4000−500 cm−1 range.
Solid-state nuclear magnetic resonance (SSNMR) spectra were collected on a Bruker AVANCE III wide-bore NMR spectrometer at 400 MHz with a standard Bruker 4 mm CP-MAS probe. For 1D 1H-13C cross-polarization (CP)/magic angle spinning (MAS) experiments, the spectra of the samples were collected using a CP pulse, 2200 scans, and a spinning frequency of 10 kHz. For 1D 1H single pulse MAS experiment the spectra of the samples were collected using a 4 ms p/2-pulse, and 4 scans, with a spinning frequency of 12 kHz.
High-resolution transmission electron microscopy (HRTEM) was performed on a Tecnai F30 (FEI) at 200 kV.
2.3. Photocatalytic Activity Test
The photocatalytic H2 production experiments were conducted in the same reactor used for the photoreduction of the co-catalyst, as described earlier. Approximately 30 mg of photocatalyst powder was dispersed ultrasonically in 150 mL of an aqueous solution containing 13 vol% TEOA. The reactor was sealed and purged with N2 gas for 30 minutes at a flow rate of 200 mL/min. Following this, the N2 flow was reduced to 20 mL/min for an additional 30 minutes before turning on the light. The reactor was irradiated for 4 hours with a 300 W Xe lamp (λ > 320 nm). Hydrogen production was monitored every 15 minutes using an online Agilent 490 micro-GC with a thermal conductivity detector, 5 Å molecular sieve, and Ar as the carrier gas.
3. Results and Discussion
3.1. Characterization of the Photocatalyst
The solid yields obtained in the synthesis of the precursors, i.e., SYCN-M = 48 ± 1 wt.% and SYCN-U = 3 ± 1 wt.%, were similar to those described in our previous article [1] and by other authors [3]. The thermal treatments produced noticeable changes in the coloration and density of the precursors (i.e., CN-M and CN-U) that were visible to the naked eye (Figure 2). Regarding the solid yield (SY), the results were identical for both atmospheres when CN-M was used as a precursor (46–48 wt.%), and slightly different for CN-U, with a lower SY obtained in air compared to CO2 (34 vs. 49 wt.%). These results are in good agreement with the post-treatment (air, 540 ºC, 2h) previously carried out by our group on CN-M in a horizontal furnace using a ceramic crucible [3], highlighting that the different configurations studied (vertical furnace vs. horizontal furnace) do not produce a substantial difference in the post-annealing performance under air atmosphere. However, with the CO2 atmosphere, differences in the configuration are observed, with the solid yield being much lower in the vertical furnace (46 vs. 86 wt.%) [3]. This suggests a greater effect of the post-reaction, likely due to the increased contact between the gas and the solid.
3.1.1. Chemical Structure Characterization (Elemental Analysis, FTIR, XPS and NMR)
The results from the elemental analysis of the CN samples are shown in Table 1. The results show that the CHN content of all the samples was very similar, with C = 35.6 ± 0.1 wt.%, N = 61.5 ± 0.5 wt.%, and H = 1.61 ± 0.02 wt.%. Being oxygen the only element, whose concentration is more variable between samples, ranging from 1.1-1.7 wt.%. As expected, the samples synthesized from urea exhibited a larger amount of oxygen (1.3-1.6 wt.%) than those made from melamine (1.06 ± 0.02 wt.%) [1]. Previous studies have reported that CN exposure to oxidizing atmospheres (i.e. air and CO2) under certain thermal treatment can result in additional oxygen being incorporated within the samples [3,9]. However, under our thermal conditions only CN-U-Air presents a slight increase of oxygen concentration.
These results indicate the following calculated molecular formula: C3.0N4.4H1.6O0.1, which is very similar to what has been reported by other authors with similar procedures [19,20]. Clearly, the material produced correspond to Liebig’s melon [C3.0N4.5H1.5], whose hydrogen content can vary between 1.1 and 2.0 wt% [28,29,30] and the C/N atomic ratio is 0.67. We can evidently rule out the structure of a perfect g-C3N4 (C/N = 0.75) and that of a CN fully composed of s-triazine structures (C/N = 0.60) [1,24]. The slight increase of C/N atomic ratio from 0.67 in the pristine CN-U to 0.68 in the annealed CN-U-Air/CO2 samples could indicate a nitrogen-deficient material [7].
The FTIR spectra (Figure 3) of all CN samples displayed characteristic infrared vibrations corresponding to the tri-s-triazine unit fingerprint. The peaks at 800 cm⁻¹ and 890 cm⁻¹ are attributed to the out-of-plane bending vibrations of tri-s-triazine and N-H deformation, respectively [25]. The strong absorption bands at 1221 and 1307 cm⁻¹ are characteristic of C-NH-C bridges between cyameluric rings [23]. The vibrations associated with the cyameluric ring, and the terminal amines are observed at 1450 cm⁻¹ and 1625 cm⁻¹, respectively. Additionally, all the samples exhibited N-H stretching bands within the range of approximately 2850–3400 cm⁻¹. Peaks at 1730 cm-1 and 2158 cm-1, which can be attributed to oxygen-containing functionalities such as C=O and C-O, have not been detected in our CN polymers [3,26]. Indicating again that not very significant oxidation process has occurred.
Further observation on an enlarged view of the peak corresponding to the out-of-plane vending vibrations of tri-s-triazine units of CN samples (Figure A1) shows a slightly shifts to higher wavenumbers in the post-annealed CN samples. This phenomenon has been related with the decrease of electron cloud density due to a lower amount of hydrogen bonds in the CN [17].
The XPS survey spectra presented in Figure 4 shows that the main peaks correspond to C 1s (~285 eV) and N 1s (~400 eV). Additionally, all samples displayed a minor peak corresponding to O 1s, which appeared around 530 eV. The main difference between the spectra is the higher intensity of the oxygen peak observable in the CN-U-Air sample, in agreement with the elemental analysis results.
The C 1s signal (Figure A2) displayed two primary peaks: a smaller one at 284.8 eV and a larger one around 287.8 eV. The latter can be attributed to C=C (sp2) from adventitious carbon and to sp2-bonded carbon in N–C=N from the heterocyclic ring [10].
The N 1s signal (Figure 5) showed three distinct peaks: a dominant one at approximately 398.5 eV, attributed to sp2-hybridized pyridine nitrogen in C-N=C from the heterocyclic ring, followed by two smaller peaks at 399.5 eV, corresponding to the N–(C)3 tertiary nitrogen, and 400.8 eV, associated with the terminal amino groups C-NHx [19,27]. The precursors and the annealed samples have presented almost identical signals, demonstrating that the applied thermal treatment does not produce highly significant changes in the chemical structure of the PCNs (Figure 5).
The 13C CP/MAS SSNMR spectra (Figure A3) display two primary signals: the one between 150 ppm and 160 ppm is attributed to the CN3 units of heptazine, while the signal between 160 ppm and 170 ppm is assigned to amine-bearing carbons, CN2(NHx) [23,28,29]. Consistent with the XPS spectra, the peak shapes observed for the CN precursors and the annealed samples are nearly identical.
Figure 6 shows the 1H NMR spectra of the CN samples. The two characteristic signals corresponding to the amino groups (Ha, ca. 8–9 ppm) and residual water (Hw, ca. 3–4 ppm) are clearly observed.[29,30,31] The post-annealing treatment produces opposite effects on the residual water signal depending on the CN precursor. In the case of melamine-derived CN (CN-M), post-annealing causes a shift of the Hw peak from 3.6 ppm to 3.7 ppm for both CN-M-Air and CN-M-CO₂, indicating the formation of hydrogen bonds between water molecules and the CN framework.[30,32] In addition, the intensity of the Hw signal gradually increases from pristine CN-M to the post-annealed samples, with CN-M-CO₂ exhibiting the highest intensity, suggesting that a larger number of water molecules are strongly associated with the network through hydrogen bonding.
In contrast, post-annealing of urea-derived CN (CN-U) leads to a shift of the Hw signal from 3.9 ppm toward lower chemical shifts (~ 3.7 ppm). Moreover, under a CO₂ atmosphere, the peak intensity remains nearly unchanged, which suggests a reduced formation of hydrogen bonds between water molecules and the CN structure.[30,32]
Regarding the amino-group signal (Ha), the chemical shift remains essentially constant for all CN samples. However, a decrease in peak intensity is observed in some cases, particularly for CN-M-Air, indicating an enhanced proton exchange process between the amino groups and adsorbed water molecules.[30,33]
To semi-quantitatively evaluate the degree of polymerization, two indices have been calculated using the results from FTIR and NMR techniques. The results are presented in Table 2.
The HNHx/Hring index was calculated as the ratio between the intensity of the NHx band (1625 cm⁻¹) and that of the cyameluric ring region (1450 cm⁻¹) in the FTIR spectra.[1] This index showed very similar values for all PCNs studied, both before and after thermal treatment. The ACN2(NHx)/ACN3 index was also determined from the ratio of the areas of the CN2(NHx) (160-170 ppm) and CN3 (150-160 ppm) regions in the ¹³C CP/MAS SSNMR spectra (Figure A3). PCNs synthesized from melamine exhibited an ACN2(NHx)/ACN3 ratio of 2.0, slightly higher than that calculated for urea-derived PCNs (1.8–1.9), indicating a greater proportion of carbon species near peripheral –NHx groups[34], in good agreement with the literature.[1] In addition, comparison between PCNs obtained from the same precursor confirms once again that post-annealing does not lead to an increase in terminal –NHx groups.
Based on the results presented in this section, we conclude that the annealing treatments did not induce very significant changes in the chemical structure, apart from a slight oxidation in the CN-U-Air sample. Furthermore, FTIR, XPS, and NMR analyses, together with the calculated indices, confirm that annealed PCNs do not show any decrease in their degree of polymerization. However, the post-annealing treatment appears to induce noticeable changes in the hydrogen-bonding network, suggesting that a larger number of water molecules are strongly associated with the CN framework in the post-annealed CN-M samples, together with an enhanced proton exchange process between amino groups and adsorbed water molecules. This behavior may be attributed to the disruption of hydrogen bonds between melon chains, which renders the N–H bridges linking the tri-s-triazine units more accessible for hydrogen bonding with water molecules.
3.1.2. Structural and Textural Characterization (XRD, HRTEM and BET Area)
Figure 7 shows the XRD patterns of the synthesized CNs. Two typical diffraction peaks centered at ~ 13.0° and ~ 27.7° (2θ), ascribed to the (100) and (002) crystal planes, representing in-plane packing and interlayer periodic stacking, respectively.
Consistent with the work of Tyborski and Fina [35], our results indicate that the primary phase of the samples studied was composed of melon sheets. The XRD theoretical patterns of a melon structure proposed by Lotsch et al. [36] are shown with dotted lines.
Further observation of the enlarged view of the (100) peak in Figure A4 reveals the partial disappearance of the (100) crystal plane in the annealed samples, suggesting a decrease in the degree of order in the planar structure unit [37]. The weakening and broadening of the 13.1° peak have been associated with nitrogen vacancies [38] and the breaking of hydrogen bonds in the intralayer framework [8,17]. However, based on the previous observations, only the possibility of hydrogen bonding breaking seems likely.
In agreement with Lan et al., the CNs synthesized from urea show weaker intensities for the 13.1° peak compared to those made from melamine, indicating a lower amount of interlayer hydrogen bonds formed during the polymerization of urea in comparison to melamine [17]. Furthermore, regarding the annealing atmosphere, this decrease is more pronounced in air than in CO2.
On the other hand, the enlarged view of the (002) peak (Figure 8 and Figure A5) shows that the diffraction angles (2θ) of the (002) peaks for CN-M and CN-U appear at 27.79º and 27.73º, respectively, in good agreement with the results reported for other CNs synthesized up to 600 ºC [1,35,39]. The thermal treatments lead to a decrease in the intensity of the (002) peaks in all cases. Once again, this decrease is more pronounced with air atmosphere than with CO2. The signal intensity of the samples synthesized from melamine decreases more significantly compared to the precursor, as CN-M exhibits a much more intense peak than CN-U (Figure 7 and Figure A5). Additionally, a shift of the (002) peak to higher diffraction angles is observed (Figure A4), indicating that the thermal treatments cause a reduction in the interlayer distance of the resulting CNs [37]. This phenomenon could be due to the undulated layers gradually becoming planar during the process [12].
For a deeper understanding of the XRD data, some parameters were calculated (Table 2) via Bragg’s law (Eq. 1) and the Debye–Scherrer equation (Eq. 2).
In agreement with our previous work and studies by other researchers [1,40,41], the in-plane distances of the tri-s-triazine (dTSTZN) and s-triazine (dSTZN) units in the CN samples were approximately 6.9 and 5.0 Å, respectively. The stack thickness was greater for CN-M-atm samples (9.2-10 nm) compared to CN-U-atm samples (6.8-7.1 nm), consistent with literature reports [1,42,43]. The interlayer distance (dinterlayer) was similar across all samples, with the largest shift observed for the CN-M precursor under CO2 atmosphere, where dinterlayer changed from 3.21 (CN-M) to 3.19 (CN-M-CO2). As a result, CN-M-atm samples had more layers (29-31) than CN-U-atm samples (21-22) (Table 2).
The decrease in intensity of the (002) XRD peaks has been associated with various factors: (1) nitrogen vacancies [38], (2) lack of long-range order in atomic arrangements (amorphism) [11], (3) a lower number of aligned layers due to exfoliation processes [12,16], and/or (4) a smaller planar size resulting from reduced polymerization or hydrogen bonding [8,12,39,44]. However, based on the results obtained from the techniques discussed above, the shift of the (002) reflection toward higher diffraction angles, and the layer thickness values estimated using Scherrer’s equation (Table 2), amorphization can be ruled out for all CN samples, as well as exfoliation in the case of the annealed CN-M samples. Instead, the observed changes are more consistently attributed to a reduction in hydrogen bonding between Melon strands for these samples. In contrast, the CN-U samples, which did not show evidence of breaking the hydrogen bonds between the strands in the previous analyses; here, a slight decrease in the stacking thickness is observed for the annealed CN-U samples.
High-resolution transmission electron microscopy (HRTEM) images of the CN samples synthesized from melamine and urea are shown in Figure 9 and Figure 10. The black dots represent Pt nanoparticles (NPs). CN-M exhibits a sheet-like morphology with rolled edges [45], and the thermal treatment clearly reduced the particle size of the CN-M sheets (Figure 9). In contrast, CN-U samples display a two-dimensional, agglomerated, lamellar-like morphology [1]. For CNs synthesized from urea, no significant change in particle size due to heat treatment is observed. From the HRTEM images, it appears that the CNs have discotic components stacked in an approximately planar arrangement or polymeric units arranged with a relatively regular spacing, rather than a graphitic structure with stacked layers [46].
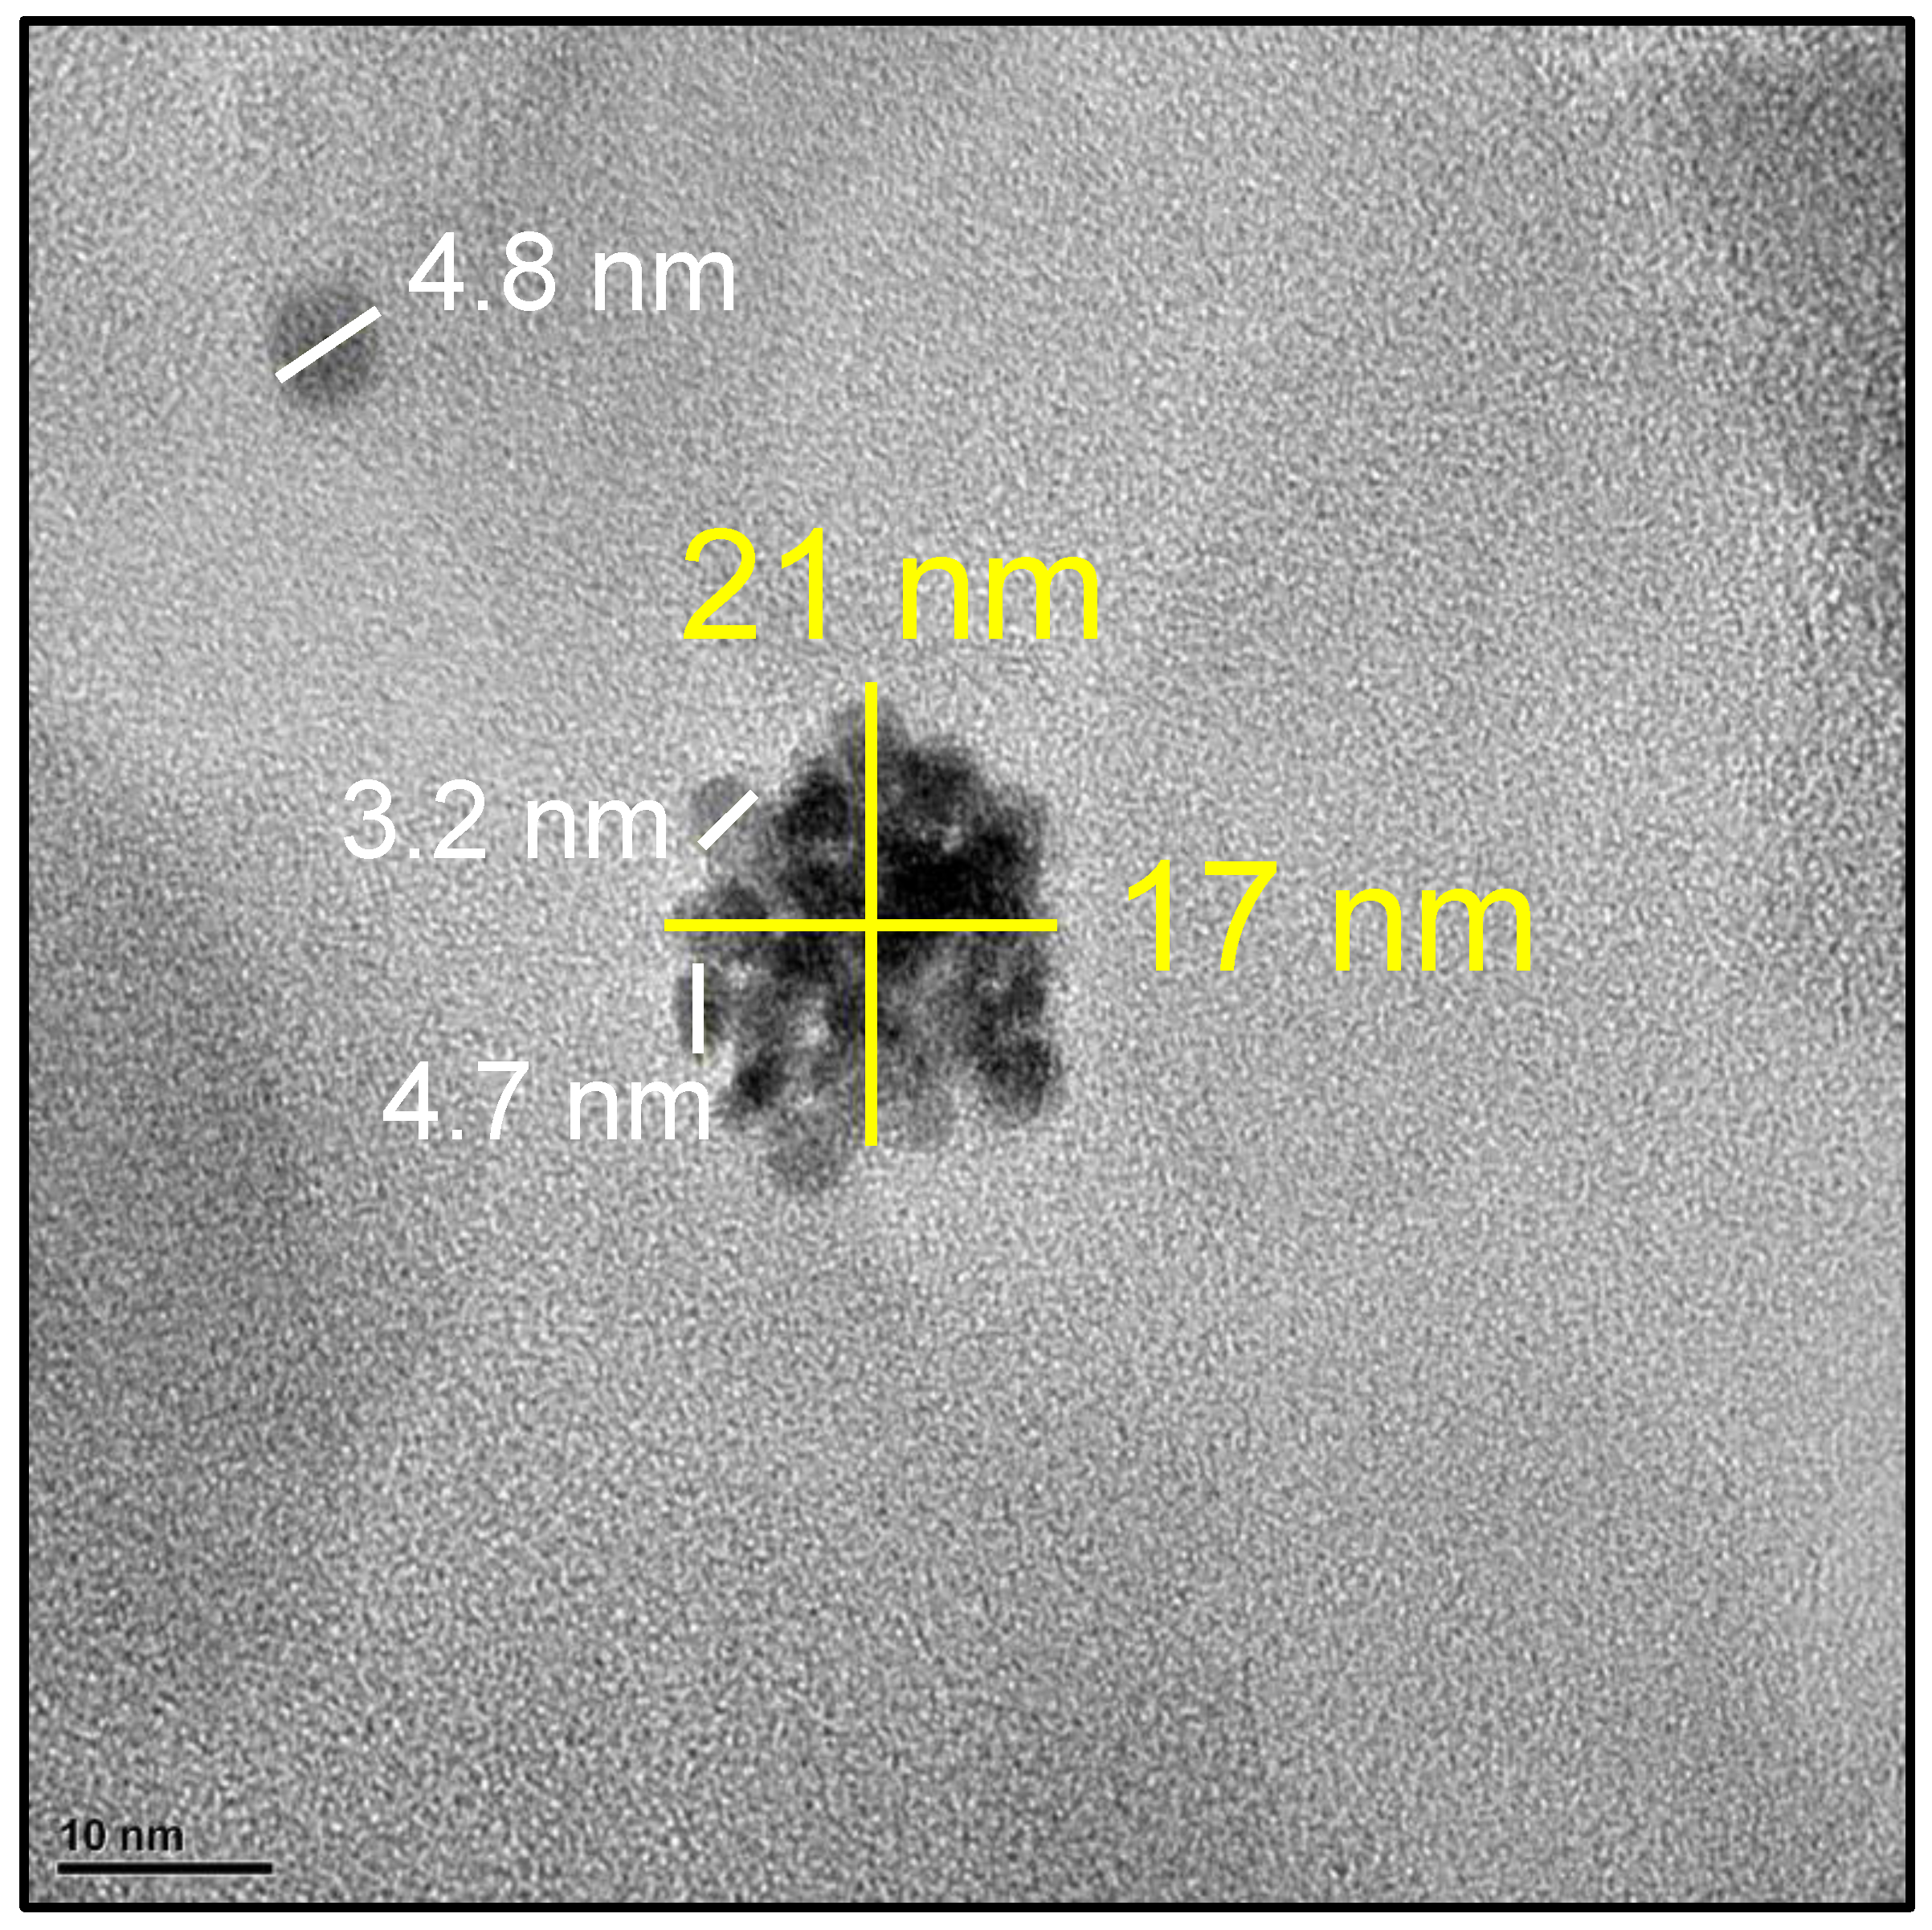
Figure 10 shows additional HRTEM images of the CNs taken at higher magnification. The arrows indicate areas where the smallest Pt NPs have been observed. Additional regions with small Pt NPs in CN-M-Air and CN-M-CO2 are shown in Figure A6 and Figure A7. Furthermore, Figure A8 presents a comparison of a small, isolated Pt NP (~ 5 nm) and a larger Pt NP (17 x 21 nm), which is composed of the aggregation of smaller nanoparticles (3 x 5 nm) over CN-U-Air.
It appears that the annealed samples (CN-M-Air, CN-M-CO2, and CN-U-CO2) exhibit some areas with very small and well-distributed Pt nanoparticles (≤ 2 nm), which were not found in the precursors (i.e., CN-M and CN-U). Kang et al. [8] reported that by breaking the hydrogen bonds, the Au NPs disperse more effectively and have smaller sizes. Recent studies have also demonstrated through DFT calculations that metal single atoms can be hosted in the pore cavities of polyheptazine imide (6.81 Å), leading to band gap narrowing and a significant improvement in photocatalytic OER performance.[5,47]
The insets in Figure 10 show histograms of the Pt NPs, along with the mean size and the number of particles analysed. These results indicate that the precursor used in the synthesis of CNs affects the size of the Pt NPs. CNs synthesized from melamine exhibit smaller sizes and better distribution. The histograms for CN-M and CN-U show a mode of 2-5 nm and 5-12 nm, respectively.
It seems that the annealing treatment in air reduces the size of the Pt NPs, shifting the mode to 1-3 nm for CN-M-Air and 3-6 nm for CN-U-Air. Regarding the annealing under CO2 atmosphere, there is no clear evidence of a change in the Pt NPs size based on the histograms obtained. However, areas with very small and well-distributed Pt NPs were also observed. This result aligns with the XRD data, where a greater change was observed when annealing occurred in air.
Figure 11 shows the N2 adsorption–desorption isotherms and the BJH pore-size distribution for all the prepared photocatalysts. The values for SBET, total pore volume, and peak pore size for the CN samples are provided in Table 3. All the samples displayed a type-IV adsorption–desorption isotherm, which is typical of mesoporous materials [45]. The BJH pore-size distribution was consistent across all samples, showing a narrow distribution centered around 3.5 nm and a wider range of pores between 10-100 nm, with peaks observed between 42 and 93 nm. However, the total pore volume was significantly influenced by the precursor used. Previous studies suggest that urea-derived samples tend to have higher SBET and pore volume compared to those derived from melamine [4,27,42,45]. This difference has been attributed to the oxygen content in the urea precursor, with the formation of CO2 during polymerization potentially hindering grain growth, thus increasing the surface area of the CN [45]. However, the urea precursor has also been reported to produce a greater degree of polymerization than melamine [1]. Therefore, it is likely that the inhibition of grain growth is due to the lower amount of hydrogen bonding within a layer.
The results from the present study (Table 3) show that our precursors (CN-M and CN-U) exhibited greater surface areas than CNs from other studies [4,45,48]. Additionally, it has been shown that all the thermal treatments tested increased the SBET and total pore volume; moreover, this increase was very similar for the two oxidizing atmospheres studied (i.e., air and CO2). However, when compared with the previous literature, it seems that our treatment has not been very effective in increasing the surface area [9,13].
The CN-M precursor experienced the greatest increase in surface area. The BET surface areas of CN-M-Air (48 m²/g) and CN-M-CO2 (58 m²/g) were approximately 2 times higher than that of CN-M (26 m²/g). Bao et al. [49] reported a similar increase in SBET (1.7 times) when CN-M was heated at 500 °C for 4 hours in a muffle furnace.
On the other hand, the BET surface areas of CN-U-Air (100 m²/g) and CN-U-CO2 (103 m²/g) were only about 1.4 times higher than that of CN-U (74 m²/g), but the highest surface values were achieved.
3.1.3. Thermal Stability (TGA)
The thermal stability of the as-prepared CN samples was assessed using thermogravimetric analysis (TGA). The DTG curves for all CN samples (Figure 12) displayed a distinct peak within the temperature range of 692 to 708 °C. The samples showed stability up to 600 °C (mass loss < 0.6 wt.%), indicating the robust structure of the tri-s-triazine-based units in the materials [51,52]. Consistent with our previous findings and those of other researchers [1,53], differences in thermal stability were observed depending on the precursor; melamine-derived nitrides exhibited greater thermal stability than those derived from urea. Furthermore, it appears that the thermal treatments in both air and CO2 atmospheres reduced the thermal stability of the CN-M precursor. However, for the CN-U precursor, only the CO2 treatment resulted in a decrease in thermal stability.
The reduction in thermal stability of the samples has been attributed to several factors: (1) a higher content of s-triazine units, as s-triazine-based structures have been shown to be less stable than tri-s-triazine-based polymers [54]; (2) the formation of surface defects [2]; (3) small particle size due to low polymerization or hydrogen bond breaking [15]; and/or (4) a reduced number of layers (exfoliation process) [55]. The differences observed between precursors can be attributed to the fewer layers in the CNs derived from urea. However, the variations seen between the CN-precursors and the annealed CNs are more likely related to a smaller particle size and/or surface defects.
3.1.4. UV-VIS Absorption Properties
The DRS spectra are presented in Figure 13, with the insets illustrating the different colors of the synthesized CN samples. The UV-VIS spectra (Figure 13a and Figure 13b) shows that all samples exhibit a peak absorption band at λ < 450 nm. This is attributed to π → π* electron transitions within the conjugated aromatic ring system of the tri-s-triazine and s-triazine units, which are crucial for the photocatalytic activity of the CNs [19,40]. No significant absorption tail was observed at longer wavelengths, suggesting an absence of n → π* transitions involving lone pairs on the nitrogen atoms at the edges of the heptazine and triazine rings, or a significant deformation in the layers [19,40,56]. The annealing treatment applied to CN-M resulted in a slight reduction in the precursor’s color, making it more whitish and leading to a decrease in absorption. In contrast, when the same treatment was applied to the CN-U precursor, color changes were observed only in the air-treated sample, which turned slightly more yellow, resulting in an increase in absorption. This change in color is entirely consistent with the oxidation observed in the previous analyses [10,11].
Determining the band structure of CN is a crucial task. The band gaps of photocatalysts designed for water splitting should range from 2 eV to 3.1 eV in order to overcome thermodynamic losses and overpotentials in the photocatalytic process, as well as to enable absorption in the visible range [54]. The band gaps of the polymeric carbon nitride samples were calculated using the Tauc-Plot (Figure 13c and Figure 13d). The direct band gap energies of all the photocatalysts were found to be between 2.92 and 3.04 eV. The band gaps calculated in this study align well with the values reported in the literature [27,42,48,53,57]. The annealing treatment performed on the melamine precursor (CN-M) resulted in a slight increase in the band gap. In contrast, the band gaps of CN-U-Air and CN-U-CO2 were identical to that of the precursor. Once again, it is noted that the changes induced in the melamine precursor were different than those in the urea precursor.
The increase in the band gap has been linked to two main factors: (1) a higher content of s-triazine units [1,54]; and/or (2) the Quantum Confinement Effect, due to a reduction in particle size in any direction (X, Y, Z). Lower polymeric CN and/or the reduced presence of H bonds in the plane, which cause smaller particle sizes in the X-Y plane, present larger band gaps [58,59,60]. Additionally, the reduced thickness of the stacked layers caused by exfoliation processes results in a blue shift in the wavelength [12,16]. Taking everything mentioned into account, it can be concluded that the decrease in particle size due to the breaking of H-bonds is the most plausible reason for the observed increase in the band gap in the CN-M-Air and CN-M-CO2 samples.
On the other hand, O-doping and the loss of long-range order in the atomic arrangements of CN samples have been reported to cause red shifts in wavelength, leading to shorter band gaps [10,11]. The O-doping generated in the CN-U-Air sample is too small to cause any modification of the band gap, consistent with the minor increase in the oxygen wt% observed in the elemental analysis.
3.2. Photocatalytic H2 Production Activity
The results of the photocatalytic analyses are shown in Figure 14. Between 3 and 4 replicates were made for all the CN samples. To evaluate the statistical power of the results, a two-tailed unpaired t-test was performed with the software GraphPad. The P values obtained from this test are shown at the top of Figure 14a. The photocatalytic H2 evolution of all CN photocatalysts for 4 hours is presented in Figure 14b. The error bars in the two graphs represent the standard deviation (SD) of the mean.
The results obtained for the precursors performance (CN-M and CN-U) are consistent with our previous work [1] and that of other authors. Thus Martin et al. [48] reported a HER value of 3300 µmol/h·gcat for a CN synthesized by urea. Also, Huang et al. [61] obtained HER values of 1805 µmol/h·gcat with nitrides synthesized from melamine in air atmospheres with 3 wt.% Pt and 10 vol% TEOA and incident light with λ ≥ 400 nm.
The photocatalytic efficiency of the CN-M precursor (1739 ± 151 µmol/h·gcat) has been improved by the two post-annealing treatments studied, obtaining average HER values of 3185 ± 649 µmol/h·gcat and 3361± 879 µmol/h·gcat for air and CO2 atmospheres, respectively. Which implies an improvement factor of ~ 2 (Table A1). These increases have proved to be significant, with P values of 0.0140 (CN-M vs CN-M-Air) and 0.0272 (CN-M vs CN-M-CO2). However, no differences were found between the atmospheres. These results are in very good agreement with our previous study, where a similar post-treatments (Air/CO2, 540 ºC, 2h) were done on CN-M in a horizontal furnace using a ceramic crucible, giving rise to a improvement factor of ~ 2 (Table A1) [3]. This result makes it clear that the different configurations studied (vertical furnace vs. horizontal furnace) do not produce a substantial difference in the post-annealing effectiveness.
Also others authors, i.e. Li et al. [13] and Luo et al. [62], have demonstrated that it is possible to improve the photocatalytic efficiency of nitrides synthesized from melamine through post-annealing treatments conducted in air by an improvement factor of 12 and 10. However, differences in the thermal treatment performed or the varying concentration of the co-catalyst studied make it difficult to directly compare their results with ours. Additionally, it should be noted that our precursors exhibit particularly good photocatalytic yields compared to the CN-bulks in the literature, as we have selected the best synthesis conditions obtained in our previous study [1].
On the contrary, these same post-annealing treatments performed on the CN-U precursor have not modified its photocatalytic efficiency. No significant difference was found between the HER values of CN-U (3364 ± 174 µmol/h·gcat), CN-U-Air (3338 ± 674 µmol/h·gcat) and CN-U-CO2 (3811 ± 641 µmol/h·gcat), being the P values 0.9827 (CN-U vs CN-U-Air) and 0.3085 (CN-U vs CN-U-CO2).
For the best of our knowledge, very few studies have evaluated how annealing post-treatments improve the photocatalytic efficiency of nitrides synthesized from urea. Mohamed et al. [63] evaluated the influence of post-annealing temperatures on fabrication carbon nitride thin film from urea on a FTO glass. The results show an improvement in the photocurrent density at annealing temperatures of 150 °C to 350 °C. However, above that temperature, the treatment was not beneficial. Furthermore, An et al. [64] reported that a post-annealing at 670 ºC, under inert atmosphere, can significantly improve the photocatalytic efficiency with respect to bulk urea’s PCN (improvement factor = 4). However, it should be noted that their PCN was synthesized at 550 ºC, compared to the 600 ºC we used, so our CN-U exhibits a much better HER, making it more difficult to improve its photoactivity. Additionally, our post-annealing was performed at a much lower temperature. Therefore, it seems consistent that no improvements are observed under our conditions.
The stability was also evaluated for one of the best photocatalysts synthesized, i.e., CN-M-Air, and the precursor for comparison (Figure 15). Stability was evaluated over 12 hours (three cycles). The results showed a rapid loss of the photocatalytic efficiency of the improved catalyst (CN-M-Air), reaching HER levels identical to the CN-M precursor in just 12 hours.
3.3. Correlation Between Structure Properties and the Photocatalytic Activity
Based on the comprehensive characterization results discussed in the preceding sections, it can be concluded that the post-annealing treatment (580 °C for 2 h under air or CO₂) induces markedly different effects depending on the precursor employed, melamine or urea. Melamine-derived polymeric carbon nitride (CN-M) undergoes a disruption of the hydrogen bonds connecting the melon strands, which allows a larger number of water molecules to become strongly associated with the CN framework in the post-annealed CN-M samples, as evidenced by the 1H NMR results. As a consequence, the annealed CN-M samples exhibit a reduced particle size (HRTEM), decreased thermal stability (TGA), an increased specific surface area (improvement factor ≈ 2, BET), and a slight widening of the band gap from 2.92 to 3.04 eV (UV–Vis). Importantly, these changes are achieved without inducing nitrogen vacancies, amorphization, or shortening of the melon strands, which could otherwise compromise the catalytic performance in the hydrogen evolution reaction (HER).
Accordingly, the enhancement in HER activity observed for the CN-M-Air and CN-M-CO₂ samples (improvement factor ≈ 2) is attributed to the disruption of hydrogen bonds between melon strands and the consequent increased availability of bridging –NH groups to interact with water molecules and facilitate their redox processes. This interpretation is in good agreement with previous reports.[8,17] In particular, Kang et al. demonstrated that the potential barrier across hydrogen-bonded regions (7.9 eV) is sufficiently high to severely hinder charge carrier transport between melon strands, indicating that hydrogen bonding adversely affects intralayer charge transport.[8]
In contrast, urea-derived polymeric carbon nitride (CN-U) does not show an increased association of water molecules with the CN framework, as indicated by the 1H NMR spectra. Nevertheless, minor structural modifications are observed upon post-annealing. Elemental analysis suggests the possible presence of nitrogen vacancies, while a slight oxygen doping in the CN-U-Air sample is confirmed by elemental analysis, XPS, and UV–Vis measurements. In addition, XRD results indicate a slight degree of exfoliation. These changes lead to a modest increase in specific surface area (improvement factor ≈ 1.4, BET) and a reduction in thermal stability (TGA). However, the structural modifications induced by post-annealing in urea-derived PCN are not sufficiently pronounced to produce a measurable enhancement in the hydrogen evolution rate. These findings are consistent with the intrinsically lower hydrogen-bond density in urea-derived PCNs compared to those derived from melamine, as previously reported.[17]
As can be seen for our results (CN-M vs CN-U) and the literature [4,17,27,42], the photocatalysts synthesized from urea are more efficient at H2 production from water splitting than those synthesized from melamine. However, as previously mentioned, the urea precursor has the major drawback that the yield of its synthesis is very low (SYCN-U = 3 ± 1 wt.%). In contrast, the yield of PCN from melamine is considerably high (SYCN-M = 48 ± 1 wt.%).
With this study, we have demonstrated that it is possible to match the photocatalytic hydrogen production between CN-M and CN-U by performing a simple annealing post-treatment of the CN-M sample under air or CO2 atmospheres (580 ºC/2h), which cause H-bond breaking within the melon strands. This is particularly noteworthy given that the overall yield of the synthesis of the photocatalysts CN-M-Air (23 wt.%) and CN-M-CO2 (22 wt.%) is still considerably higher than the yield of the synthesis of CN-U (3 wt.%). However, as we previously observed, the improvement in photocatalytic efficiency due to the post-treatment is lost in 12 hours. Further work will focus on stabilizing the hydrogen-bond-disrupted structure.
4. Conclusions
This work demonstrates that post-annealing treatment at 580 °C under air or CO₂ atmospheres induces markedly different structural and physicochemical effects in polymeric carbon nitride depending on the precursor used. For melamine-derived PCN (CN-M), post-annealing leads to the disruption of hydrogen bonds between melon strands without introducing nitrogen vacancies, amorphization, or shortening of the polymeric framework. This structural rearrangement increases the accessibility of bridging –NH groups, enhances the interaction with water molecules, and improves charge transport between layers. As a result, CN-M samples exhibit reduced particle size, increased surface area, slightly widened band gap, and significantly enhanced hydrogen evolution reaction (HER) activity (improvement factor ≈ 2).
In contrast, urea-derived PCN (CN-U) shows a much weaker response to post-annealing. Although minor structural changes such as slight exfoliation, O-doping, and possible nitrogen vacancies are observed, these modifications only lead to modest increases in surface area and reduced thermal stability, without a measurable improvement in HER performance.
The photocatalytic efficiency of the CN-M precursor achieved HER values similar to the more efficient, but low-yield, CN-U (≈ 3300 µmol/h·gcat). This demonstrates a viable method to obtain high-performance photocatalysts with a significantly higher overall synthesis yield (CN-M-Air at 23 wt.%, CN-M-CO2 at 22 wt.%) compared to the CN-U precursor (3 wt.%). However, the results showed that the improvement in catalytic efficiency is lost within 12 hours.
Data Availability Statement
All data supporting this study are included in the article and its supplementary information files.
Acknowledgments
This work was supported by Spanish National Research Council (CSIC). Project 202080E129. .
Appendix A

Table A1.
HER values for PCN photocatalysts, using Pt as cocatalyst and TEOA as the sacrificial electron donor.
Table A1.
HER values for PCN photocatalysts, using Pt as cocatalyst and TEOA as the sacrificial electron donor.
| Precursor | Gas | Furnace SP (°C) | Dwell (min) | Pt (wt.%) | TEOA (vol.%) | Indicent light (nm) | HER (μmol/h·g) |
Impr. factor |
Refs. |
|---|---|---|---|---|---|---|---|---|---|
| Melamine | - | - | - | 3 | 13 | λ > 320 | 1739 | - | This work |
| Air | 580 | 120 | 3 | 13 | λ > 320 | 3185 | 1.83 | This work | |
| CO2 | 580 | 120 | 3 | 13 | λ > 320 | 3361 | 1.93 | This work | |
| Air | 540 | 120 | 3 | 13 | λ > 320 | 4749 | 2.11 | Catal. Today (2024) [3] | |
| CO2 | 540 | 120 | 3 | 13 | λ > 320 | 3896 | 1.77 | Catal. Today (2024) [3] | |
| Air | 520 | 270 | 3 | 12 | λ > 400 | 1508 | 11.7 | Adv. Energy Mater. (2016) [13] | |
| St. Air | 550 | 120 | 1 | 10 | λ > 420 | ~750 | 10 | Appl. Catal. B-Environ. (2018) [62] | |
| Urea | - | - | - | 3 | 13 | λ ≥ 320 | 3364 | - | This work |
| Air | 580 | 120 | 3 | 13 | λ ≥ 320 | 3338 | 0.99 | This work | |
| CO2 | 580 | 120 | 3 | 13 | λ ≥ 320 | 3811 | 1.13 | This work | |
| N2 | 670 | 120 | 1.1 | 10 | λ > 420 | ~ 5000 | ~ 4 | Appl. Catal. B-Environ. (2022) [64] | |
| Dicyandiamide | Ar | 540 | 120 | 6 | 10 | λ ≥ 440 | ~ 150 | ~ 9 | Adv. Mater. (2016) [8] |
| Dicyandiamide | Ar | 620 | 120 | 3 | 10 | AM 1.5 λ ≥ 200 |
9.6 | 15.5 | Appl. Catal. B-Environ. (2018) [65] |
| Dicyandiamide | Air | 550 | 120 | 3 | 10 | λ > 400 | 2.0 | 12.5 | RSC Adv., (2020) [66] |
| Cyanamide | Air | 550 | 120 | 3 | 10 | visible light | 13.7 | 2.15 | Nanoscale, (2015) [67] |
Figure A1.
Enlargement of the ~ 800 cm-1 FTIR peak corresponding to the out-of-plane vending vibrations of tri-s-triazine units of PCN samples.
Figure A1.
Enlargement of the ~ 800 cm-1 FTIR peak corresponding to the out-of-plane vending vibrations of tri-s-triazine units of PCN samples.
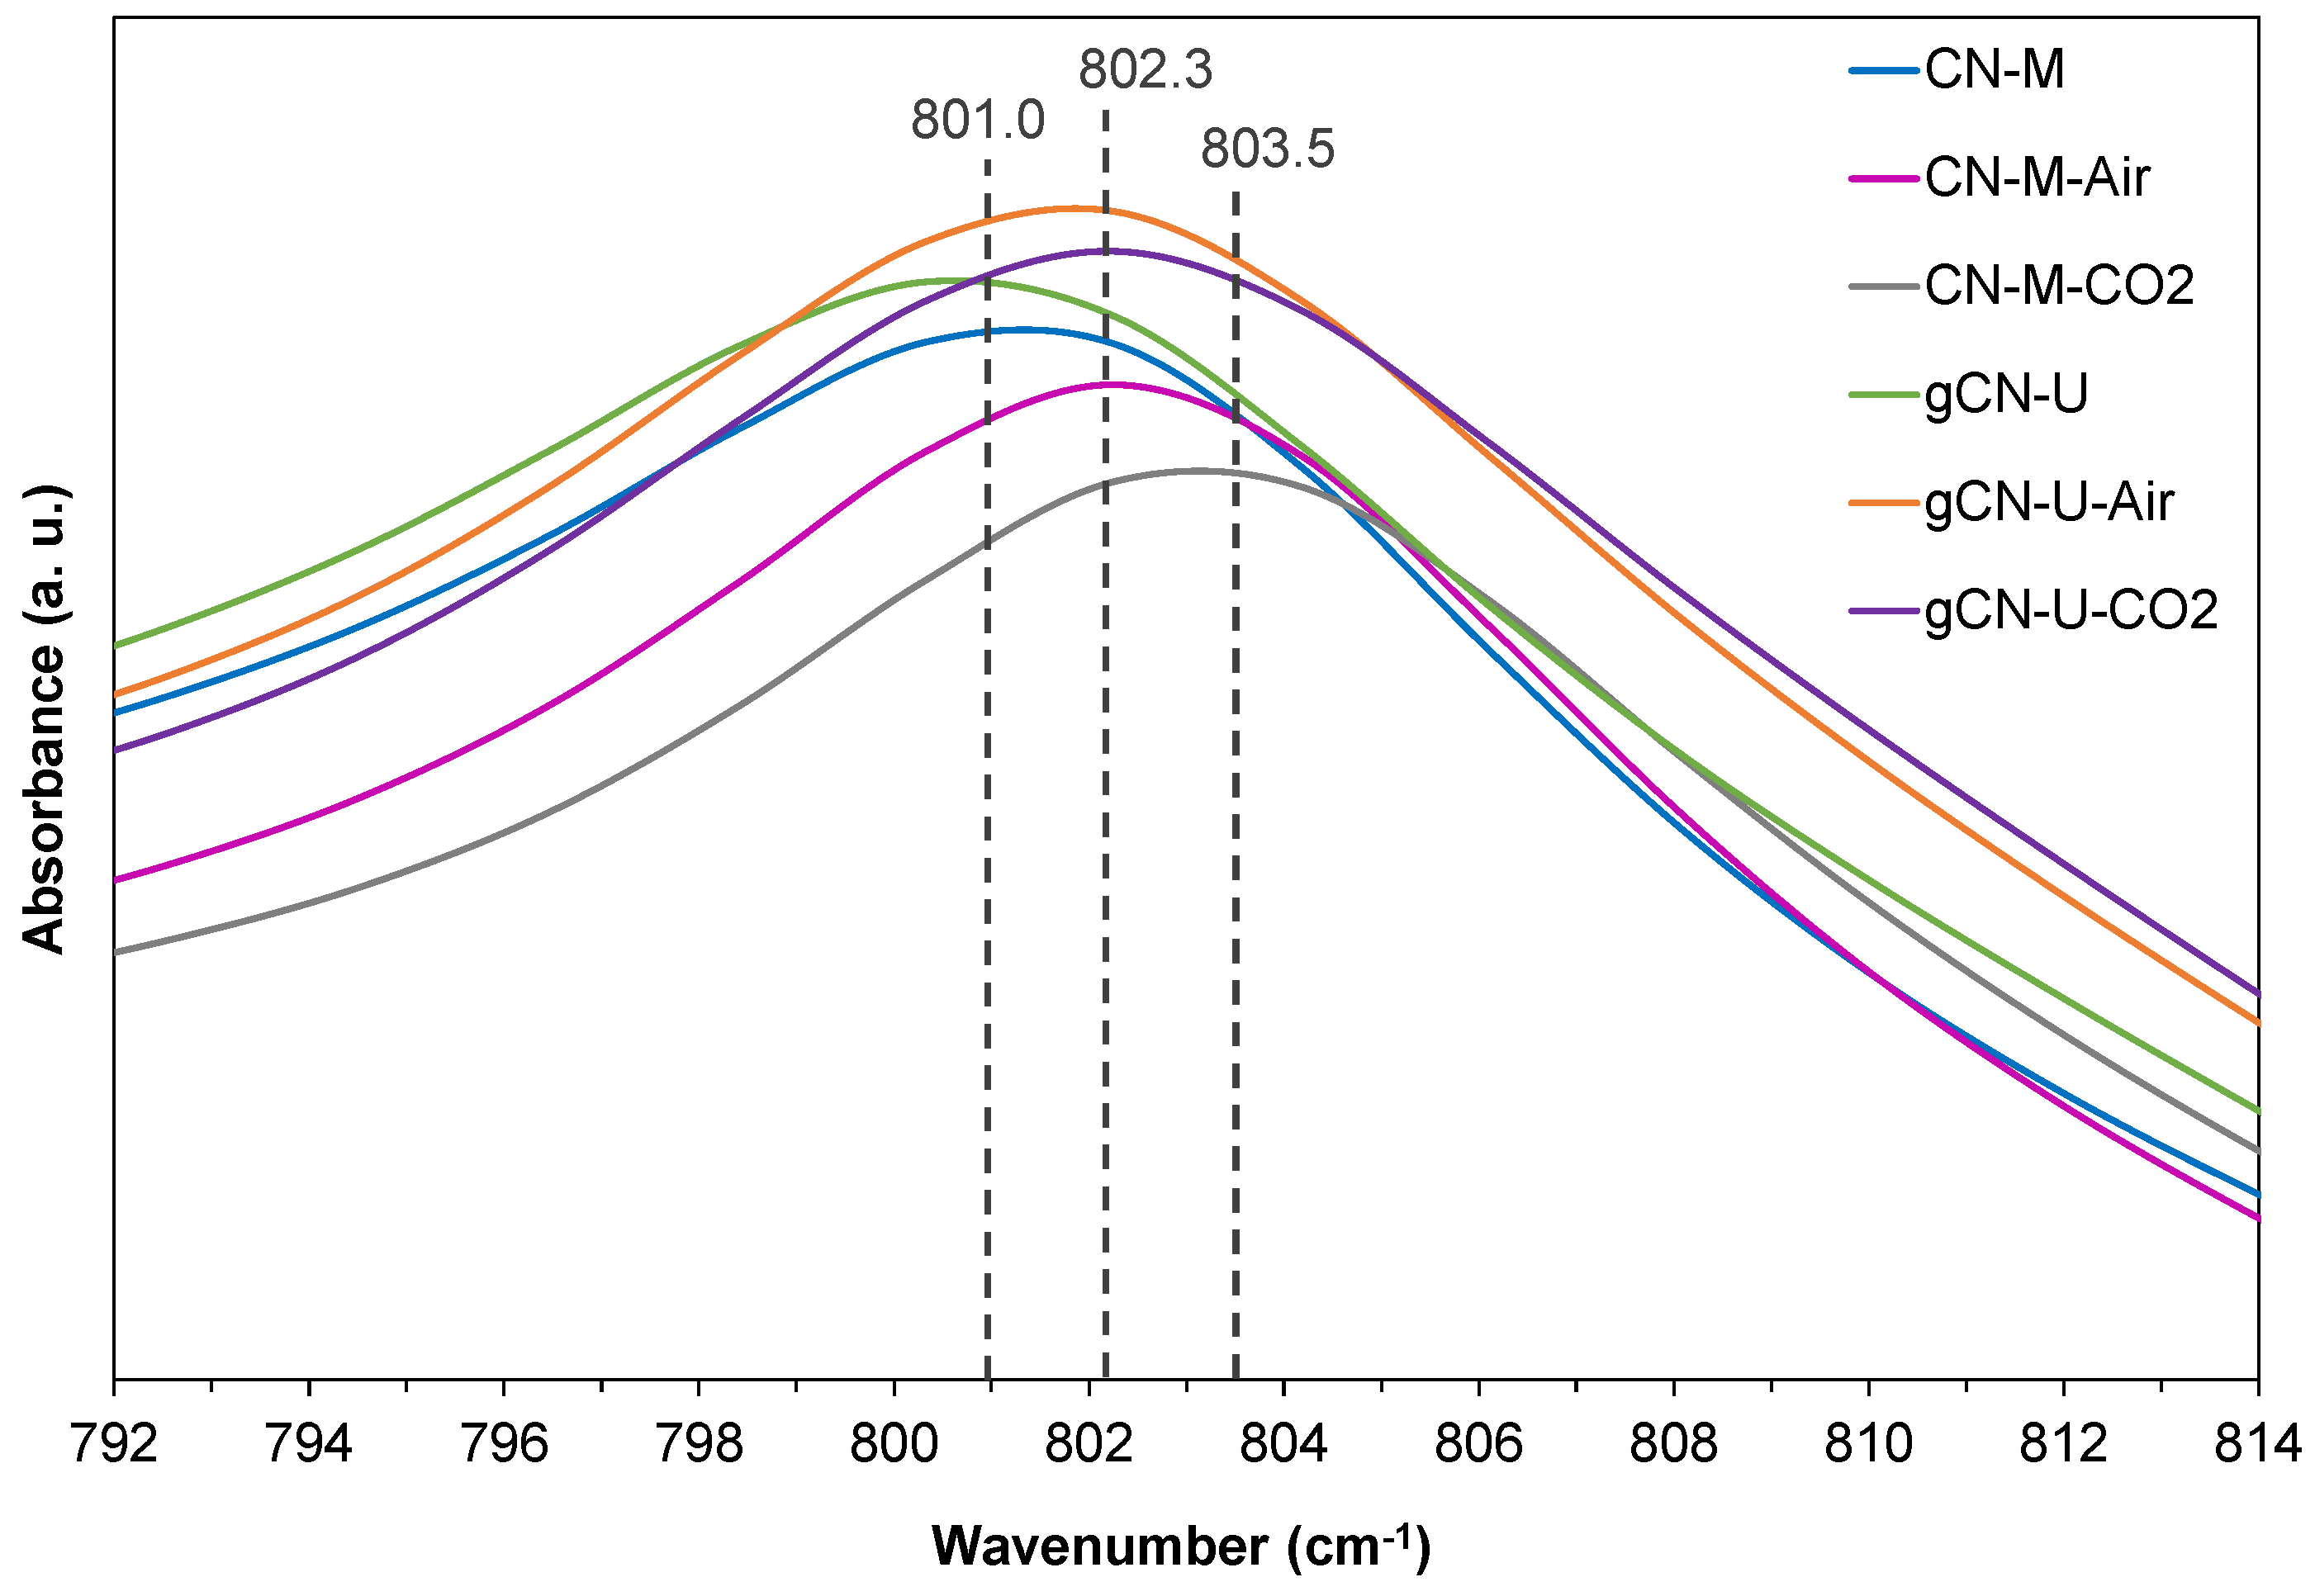
Figure A2.
XPS C 1s spectra of PCN samples.
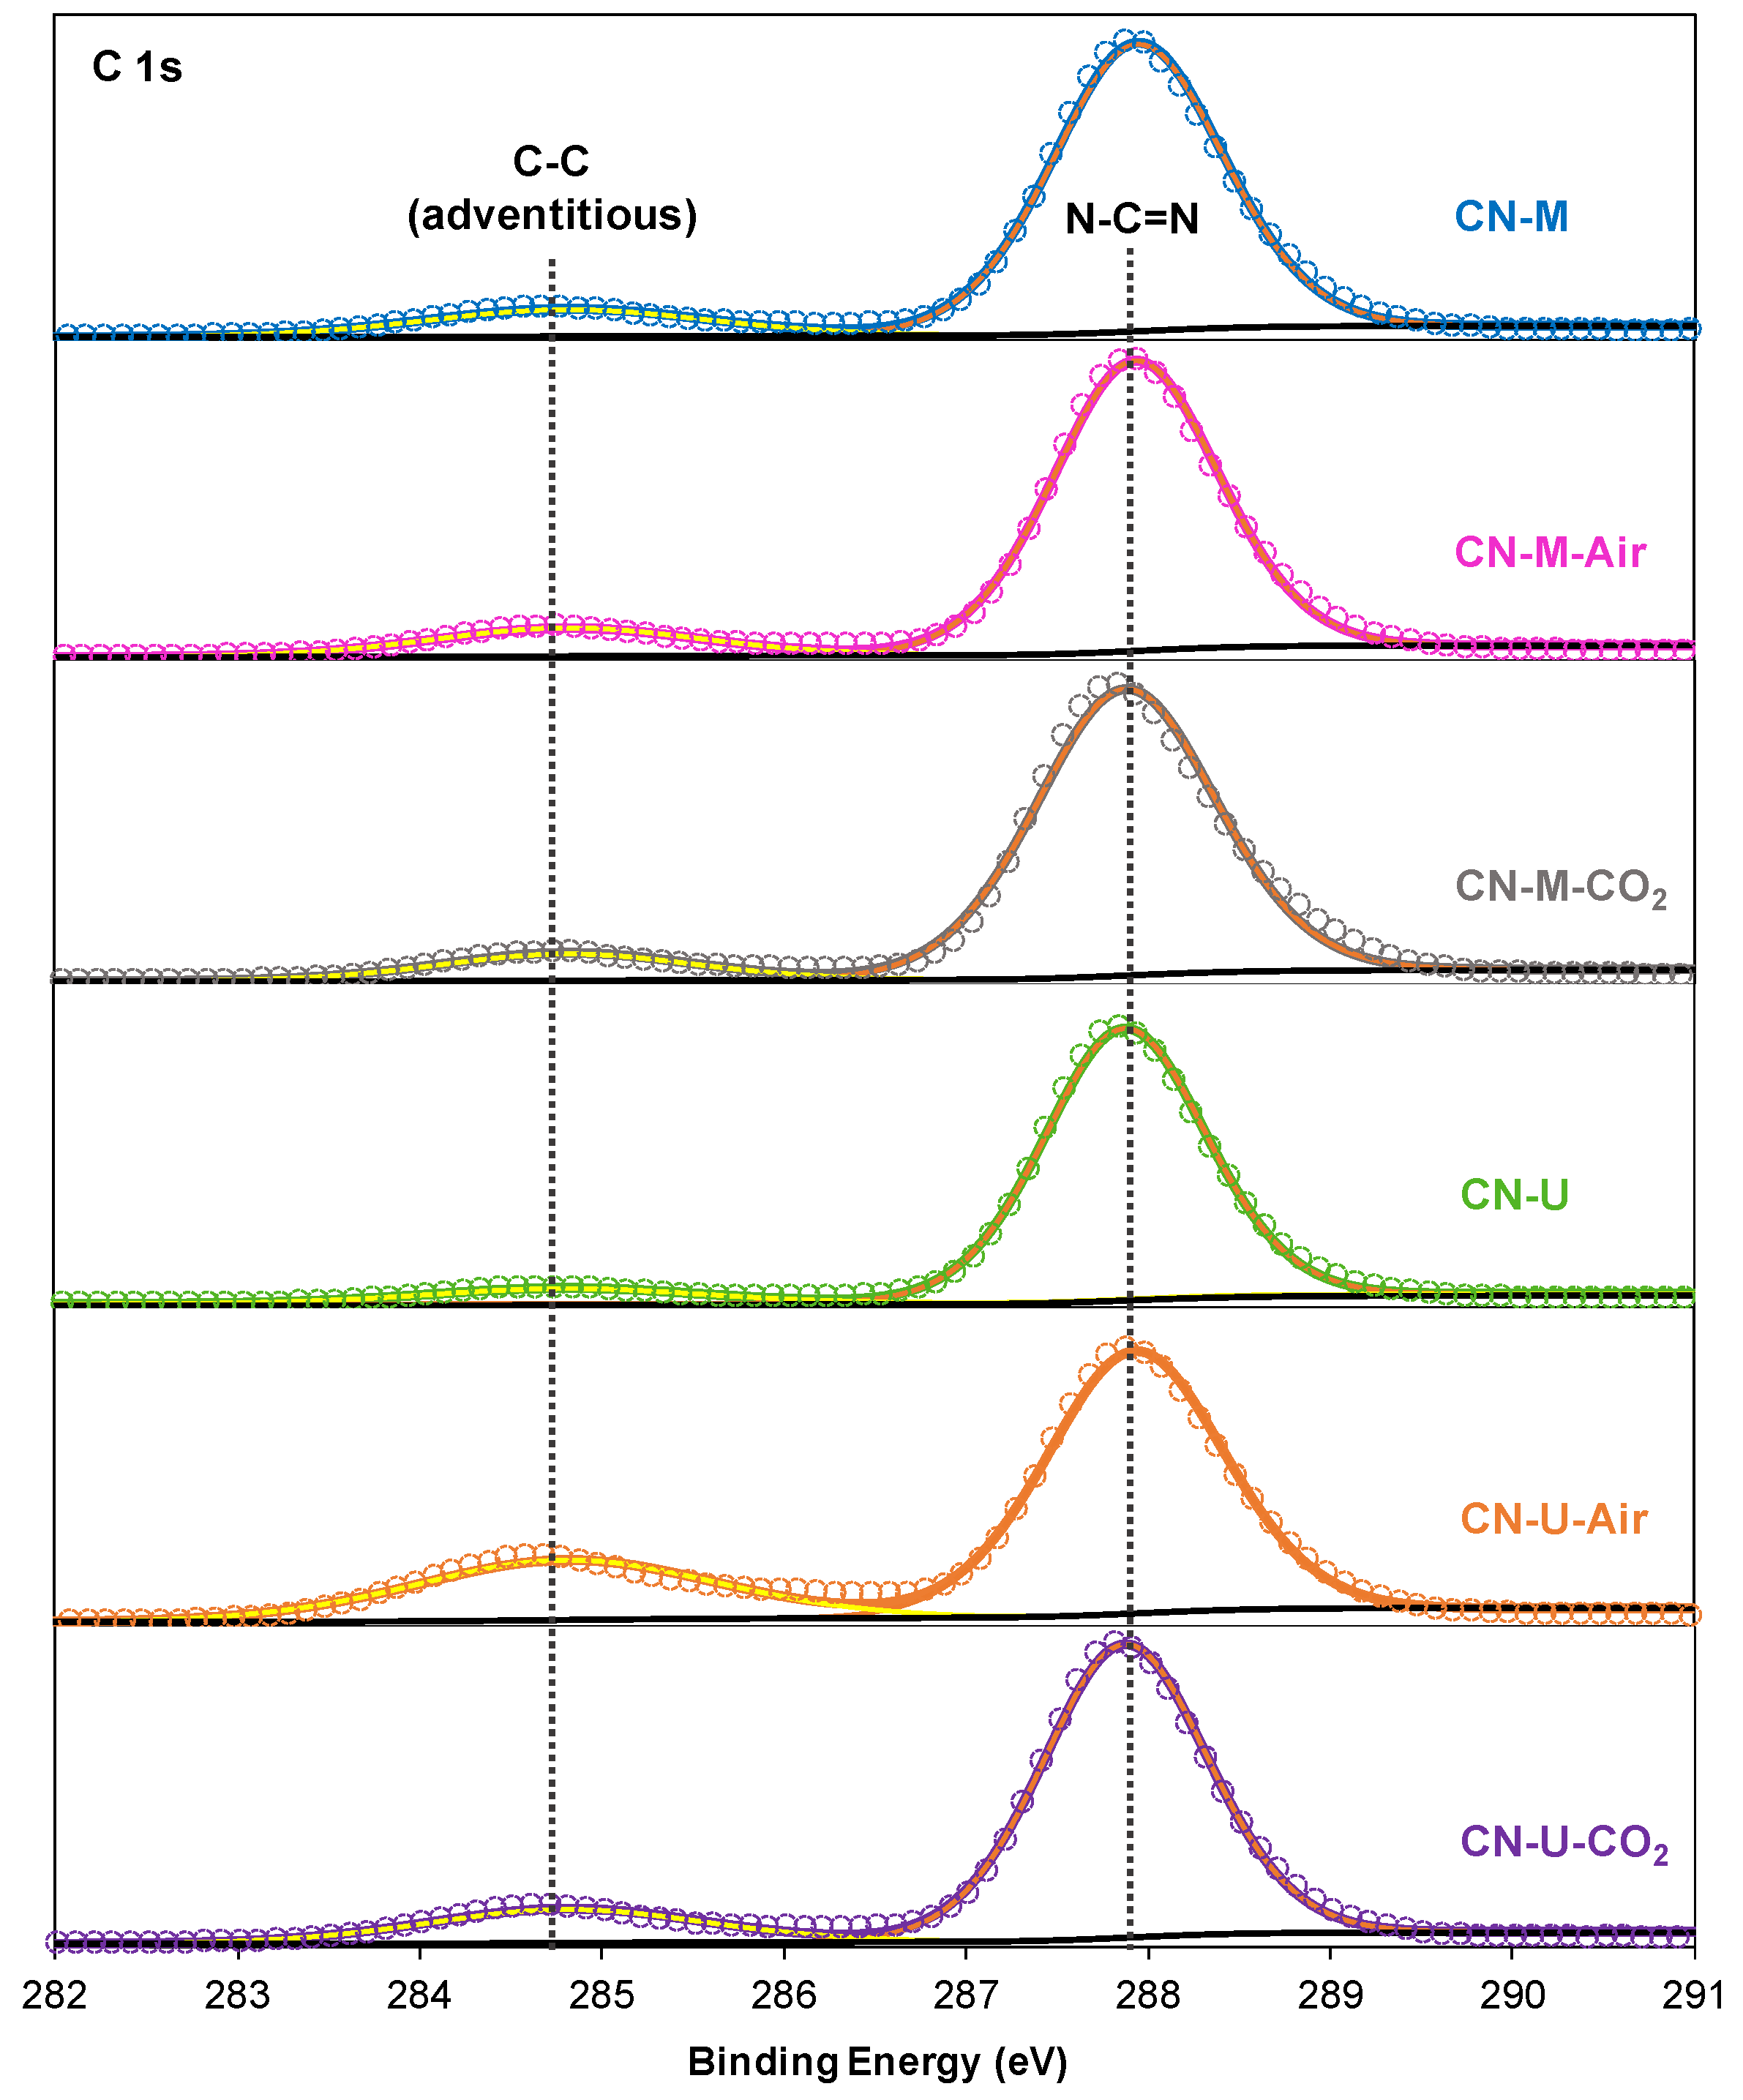
Figure A3.
13C CP/MAS SSNMR spectra of PCN samples.
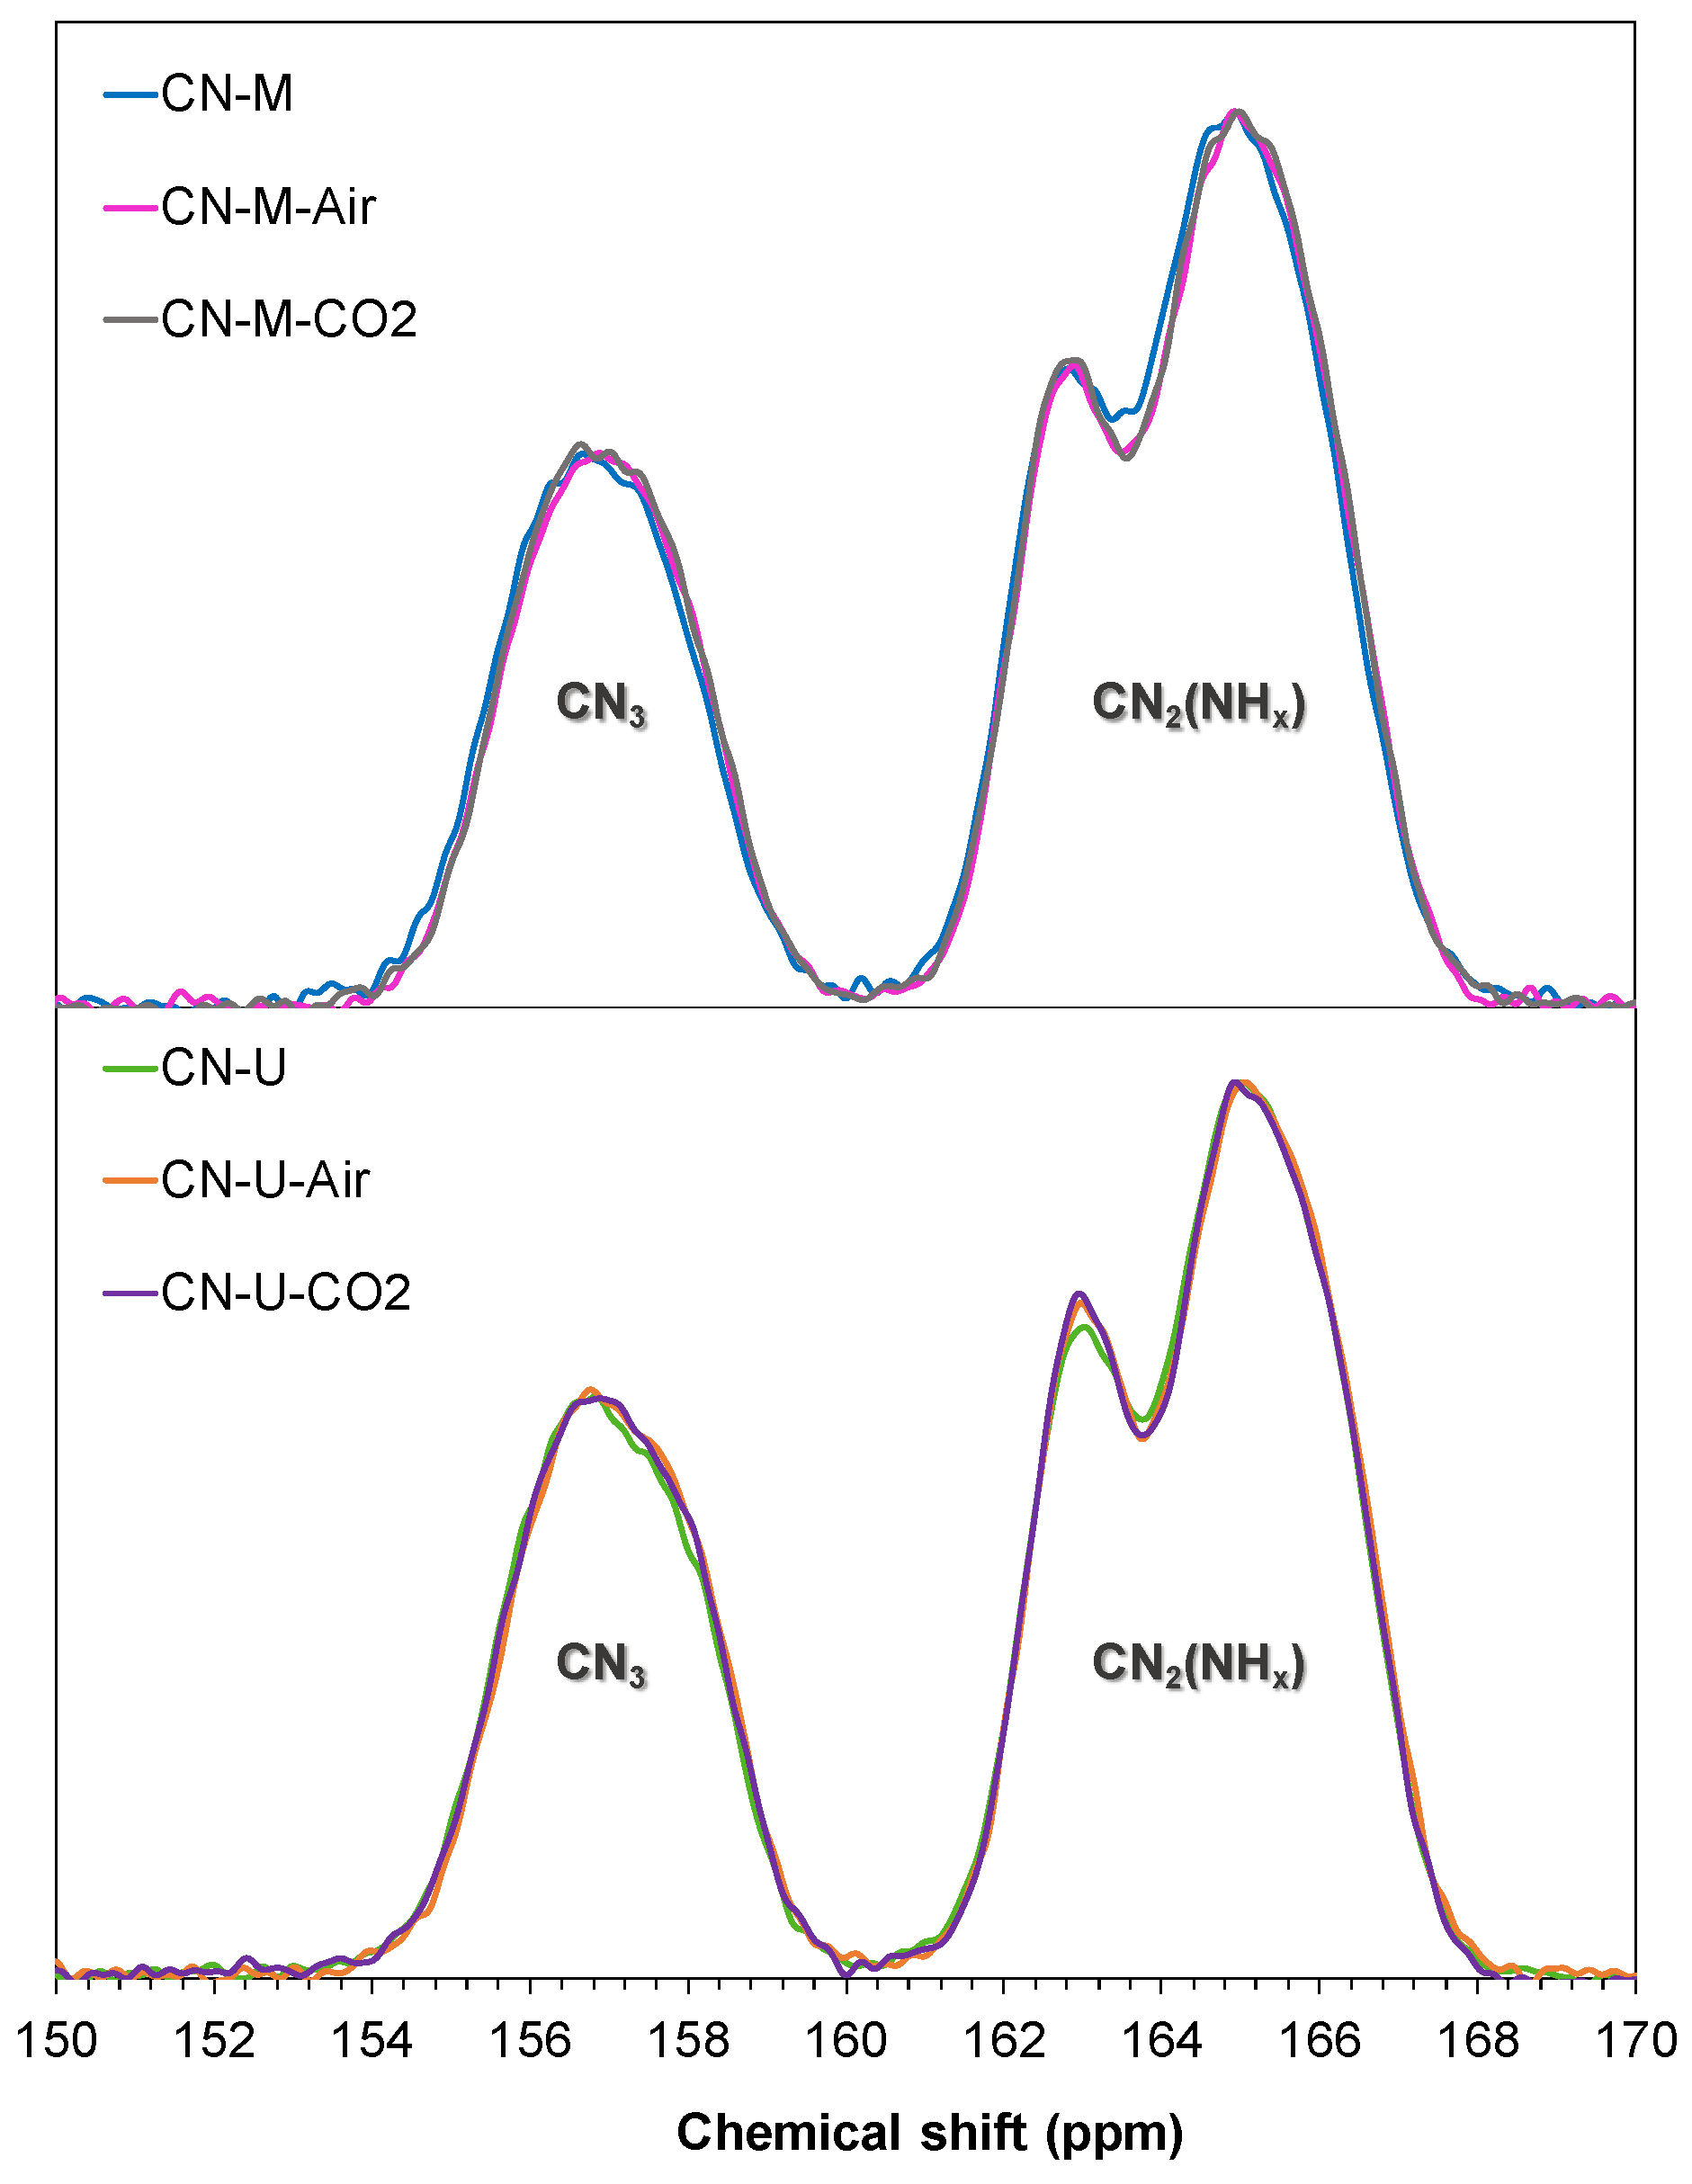
Figure A4.
Enlargement of the (100) XRD peak corresponding to the intralayer long-range atomic order of PCN samples.
Figure A4.
Enlargement of the (100) XRD peak corresponding to the intralayer long-range atomic order of PCN samples.
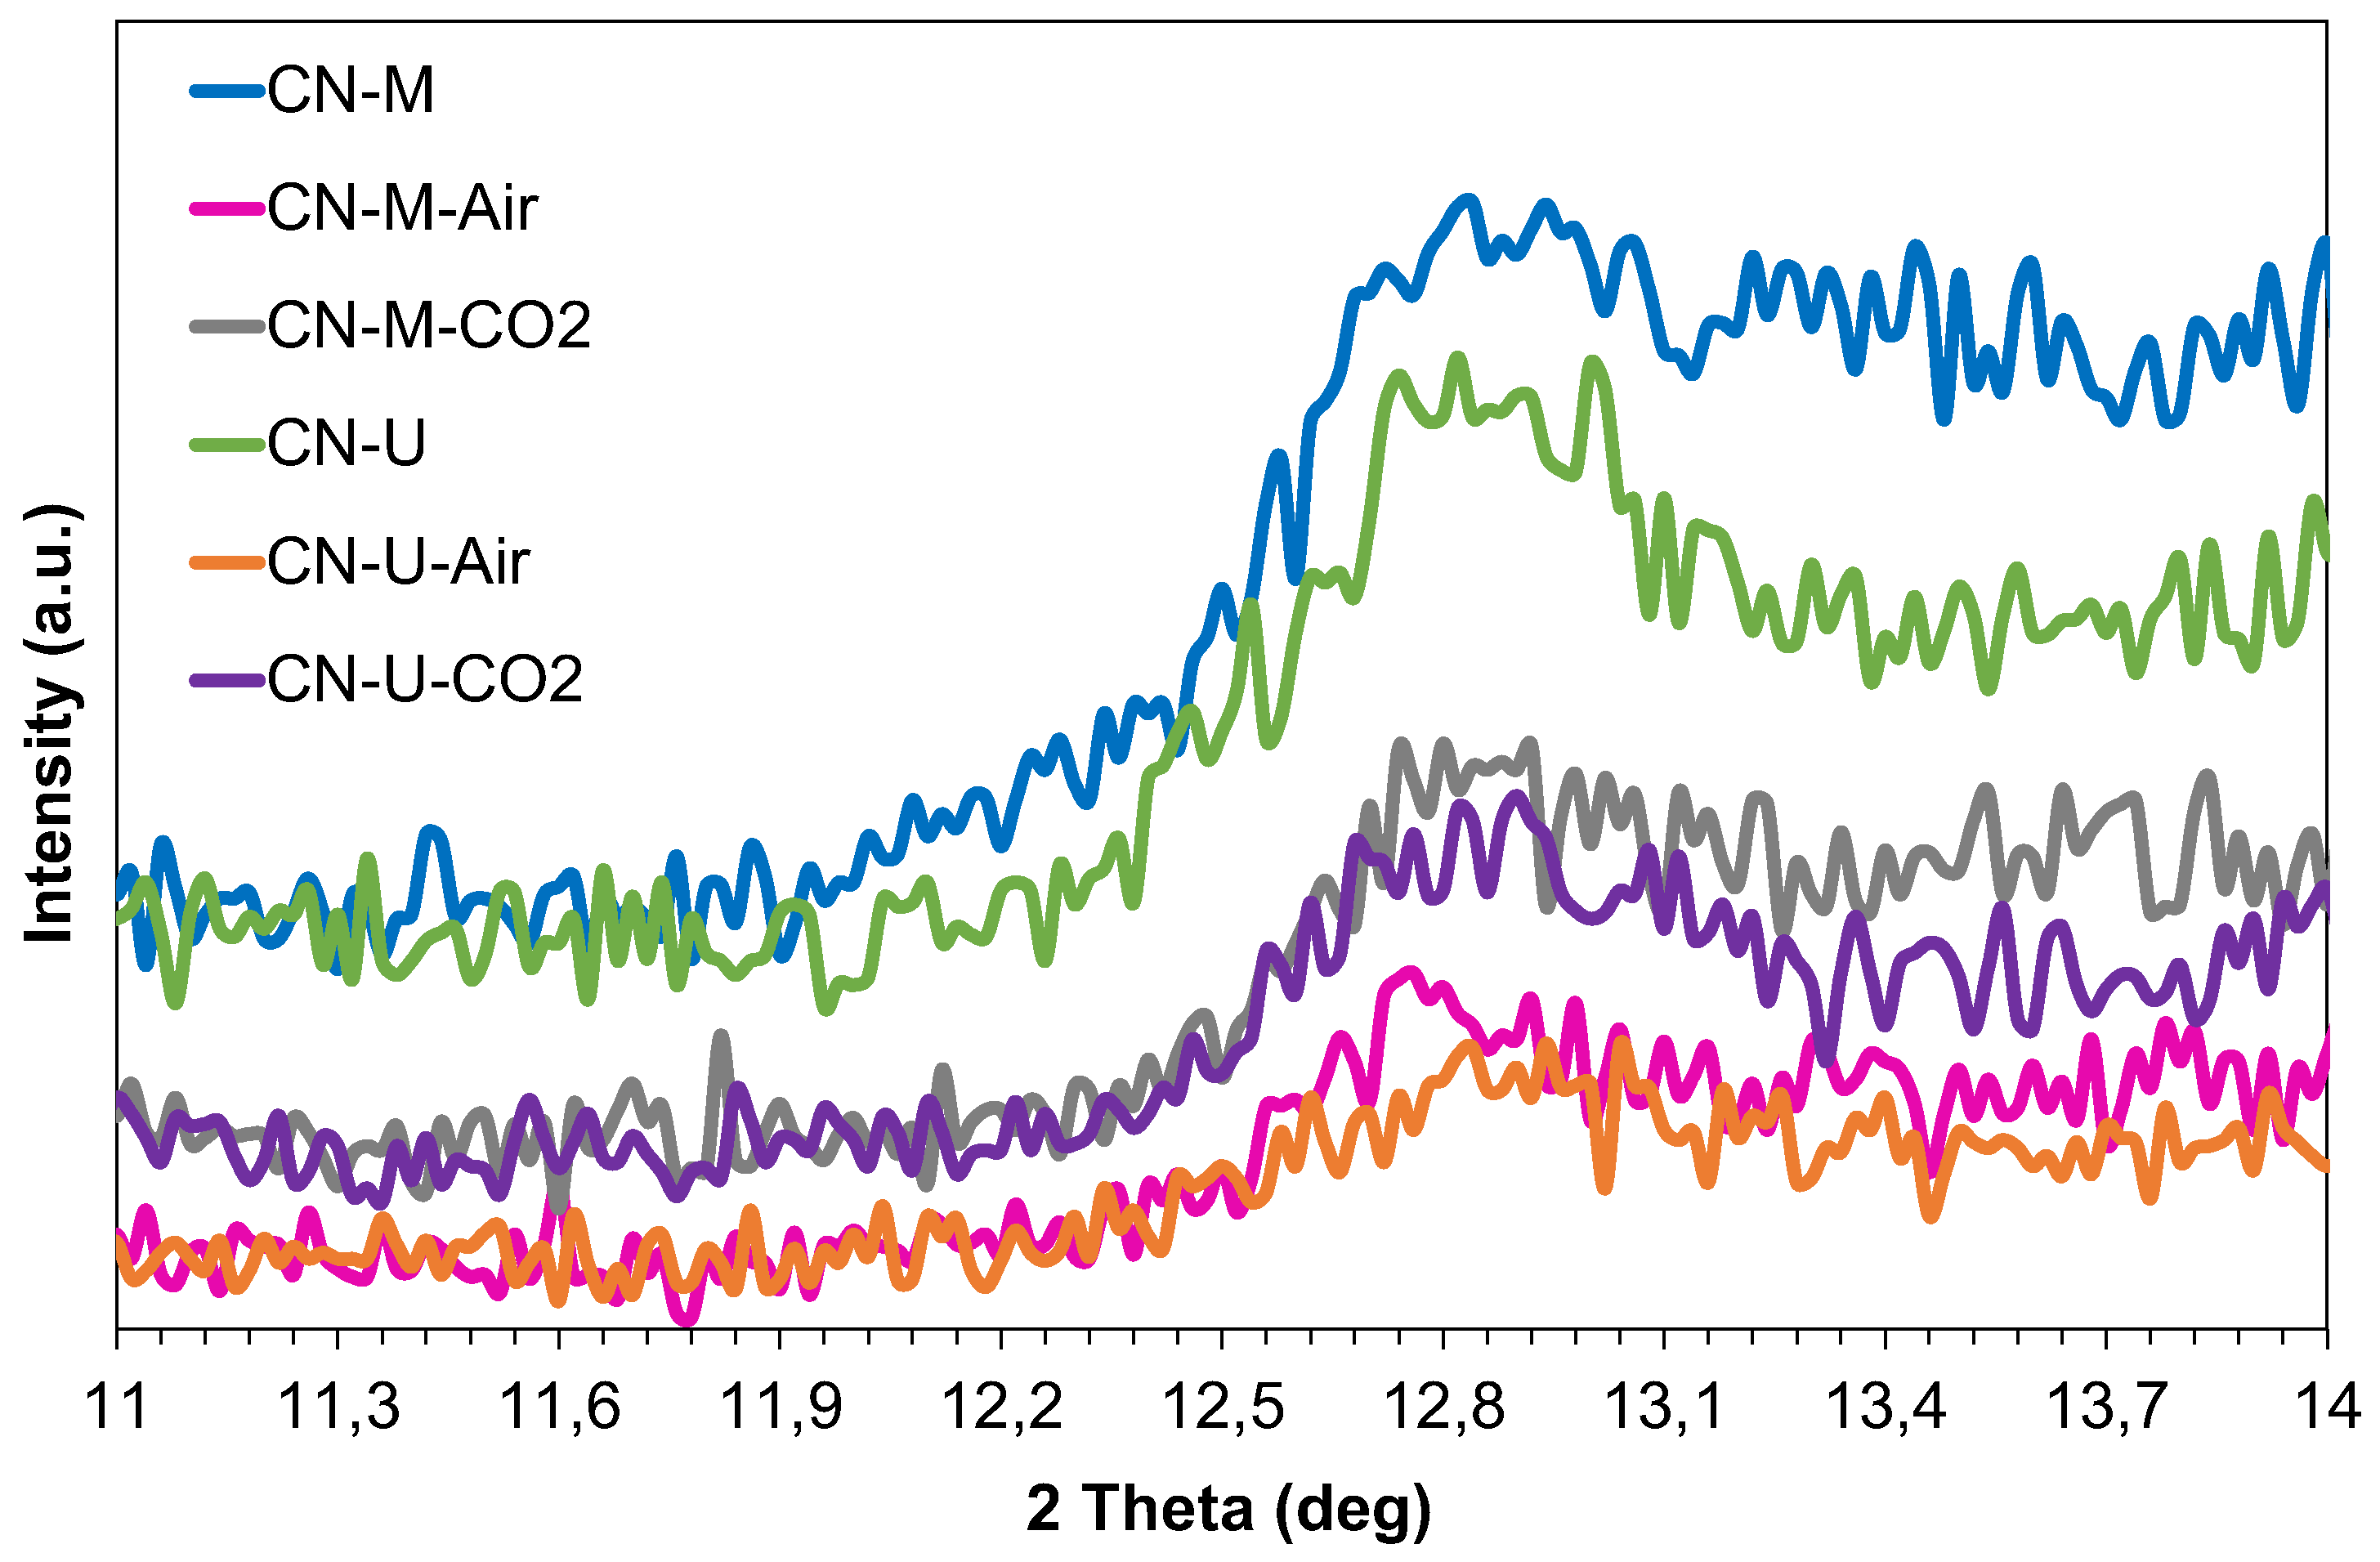
Figure A5.
Enlargement of the XRD peak corresponding to the interlayer stacking of π-conjugated aromatic systems (002) of all PCN samples.
Figure A5.
Enlargement of the XRD peak corresponding to the interlayer stacking of π-conjugated aromatic systems (002) of all PCN samples.
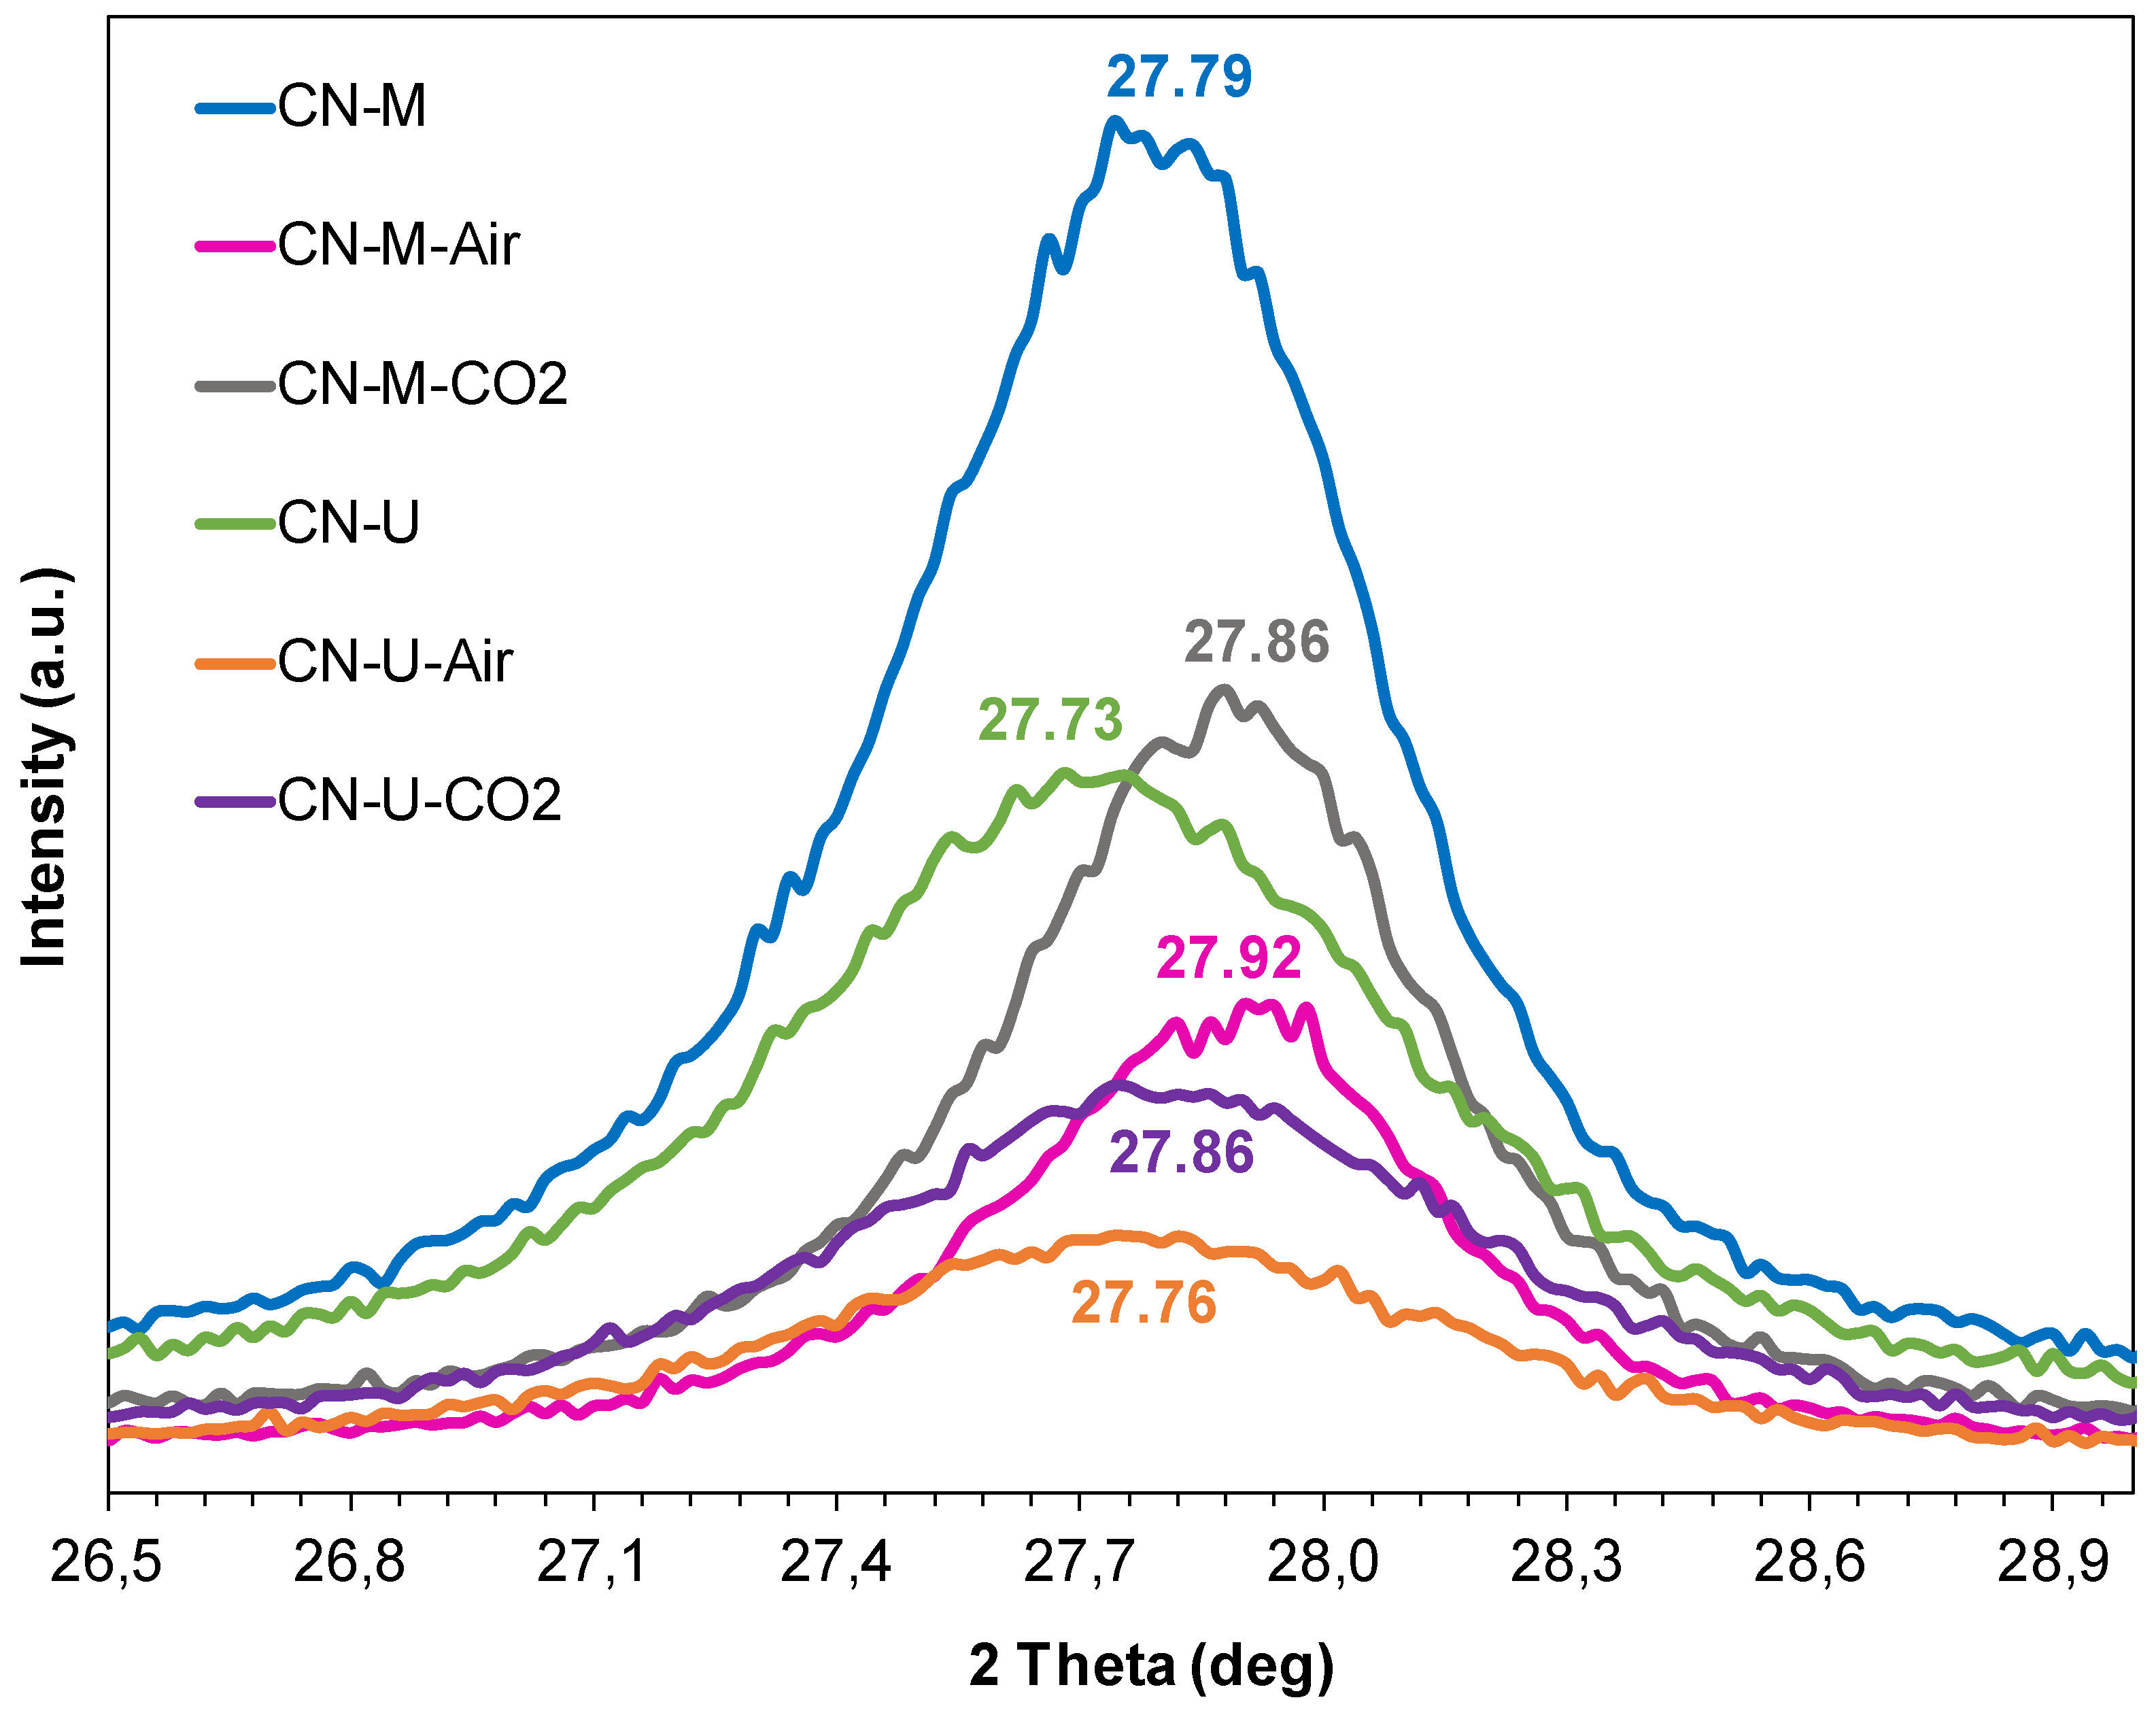
Figure A6.
HRTEM images of CN-M-Air. Areas of the smallest Pt NPs found (≤ 2 nm) are shown in the images.
Figure A6.
HRTEM images of CN-M-Air. Areas of the smallest Pt NPs found (≤ 2 nm) are shown in the images.
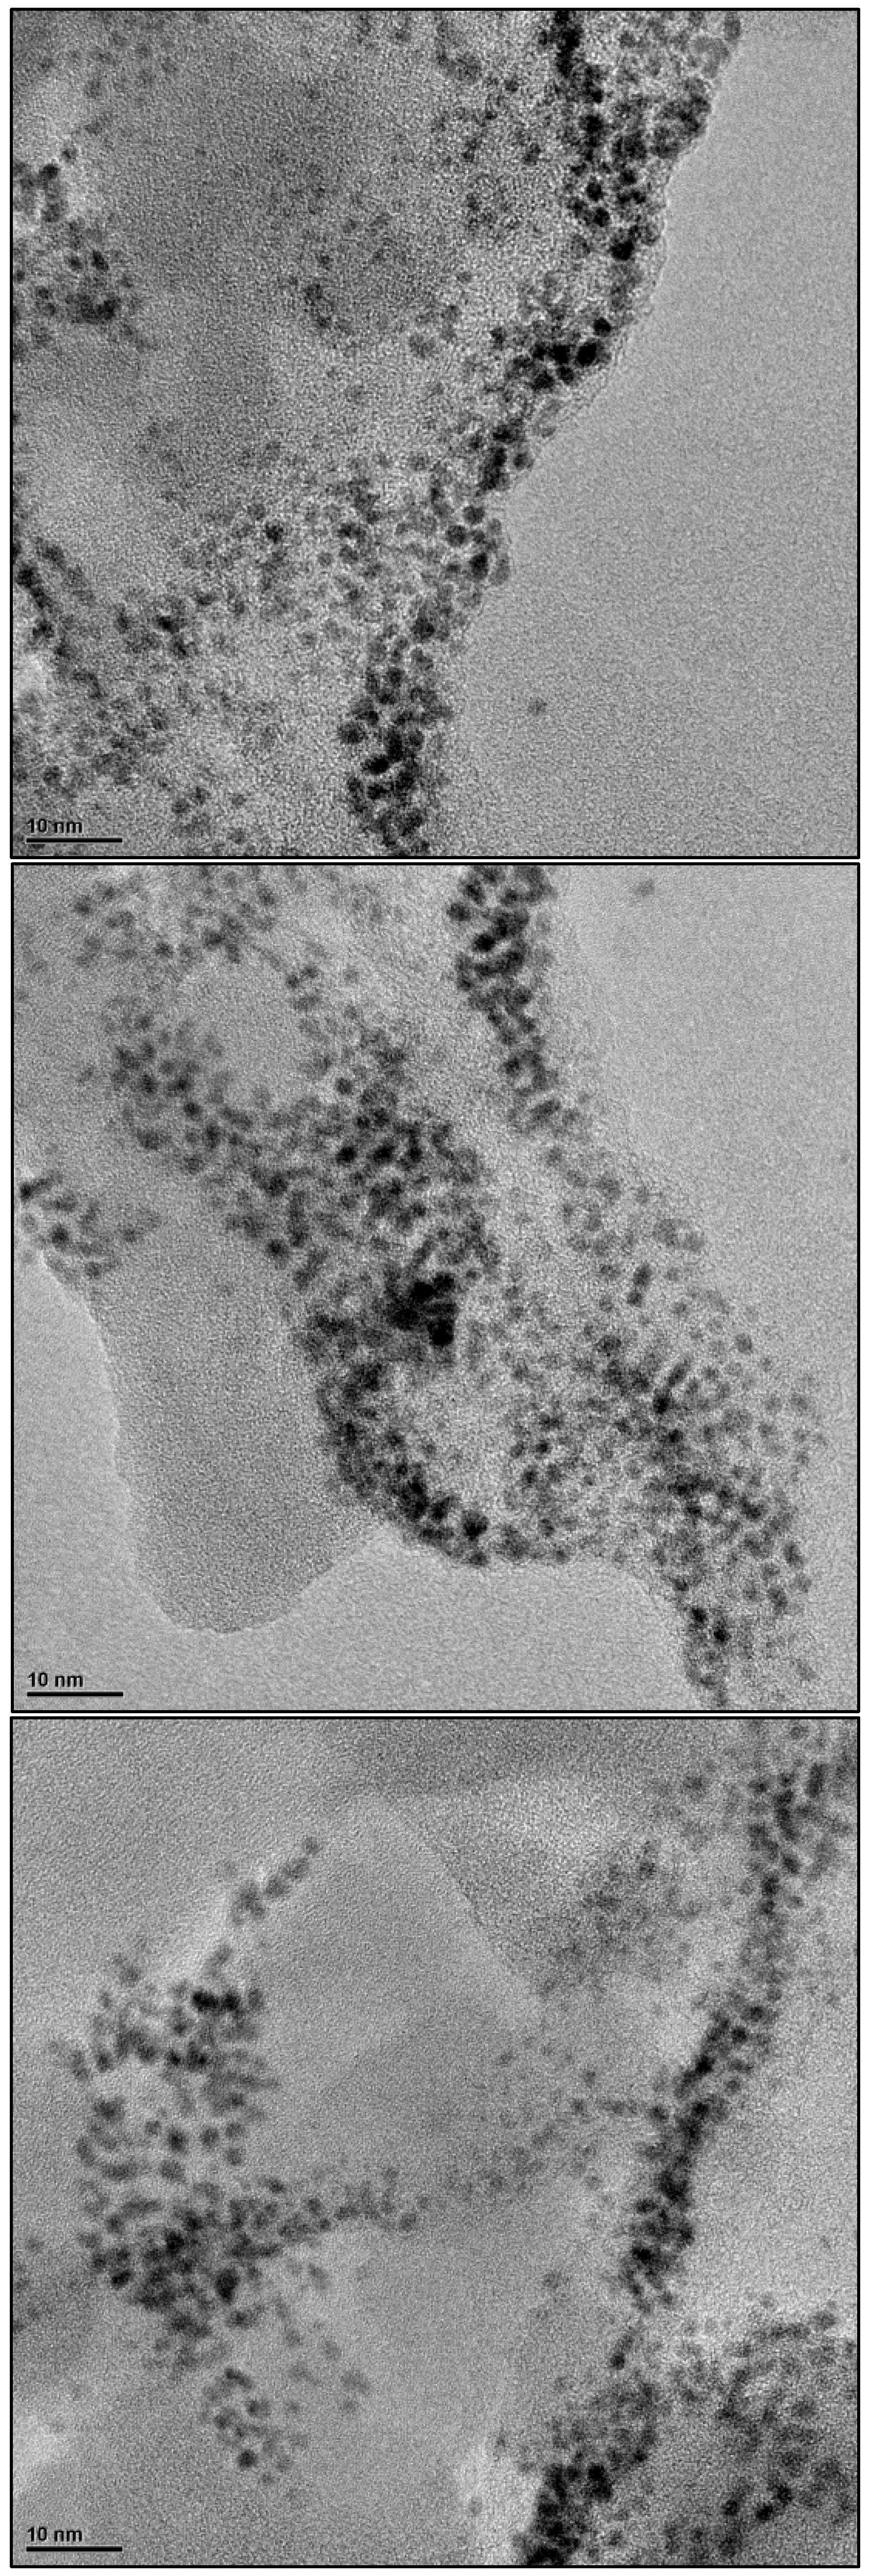
Figure A7.
HRTEM images of CN-M-CO2. Areas of the smallest Pt NPs found (≤ 2 nm) are shown in the images.
Figure A7.
HRTEM images of CN-M-CO2. Areas of the smallest Pt NPs found (≤ 2 nm) are shown in the images.
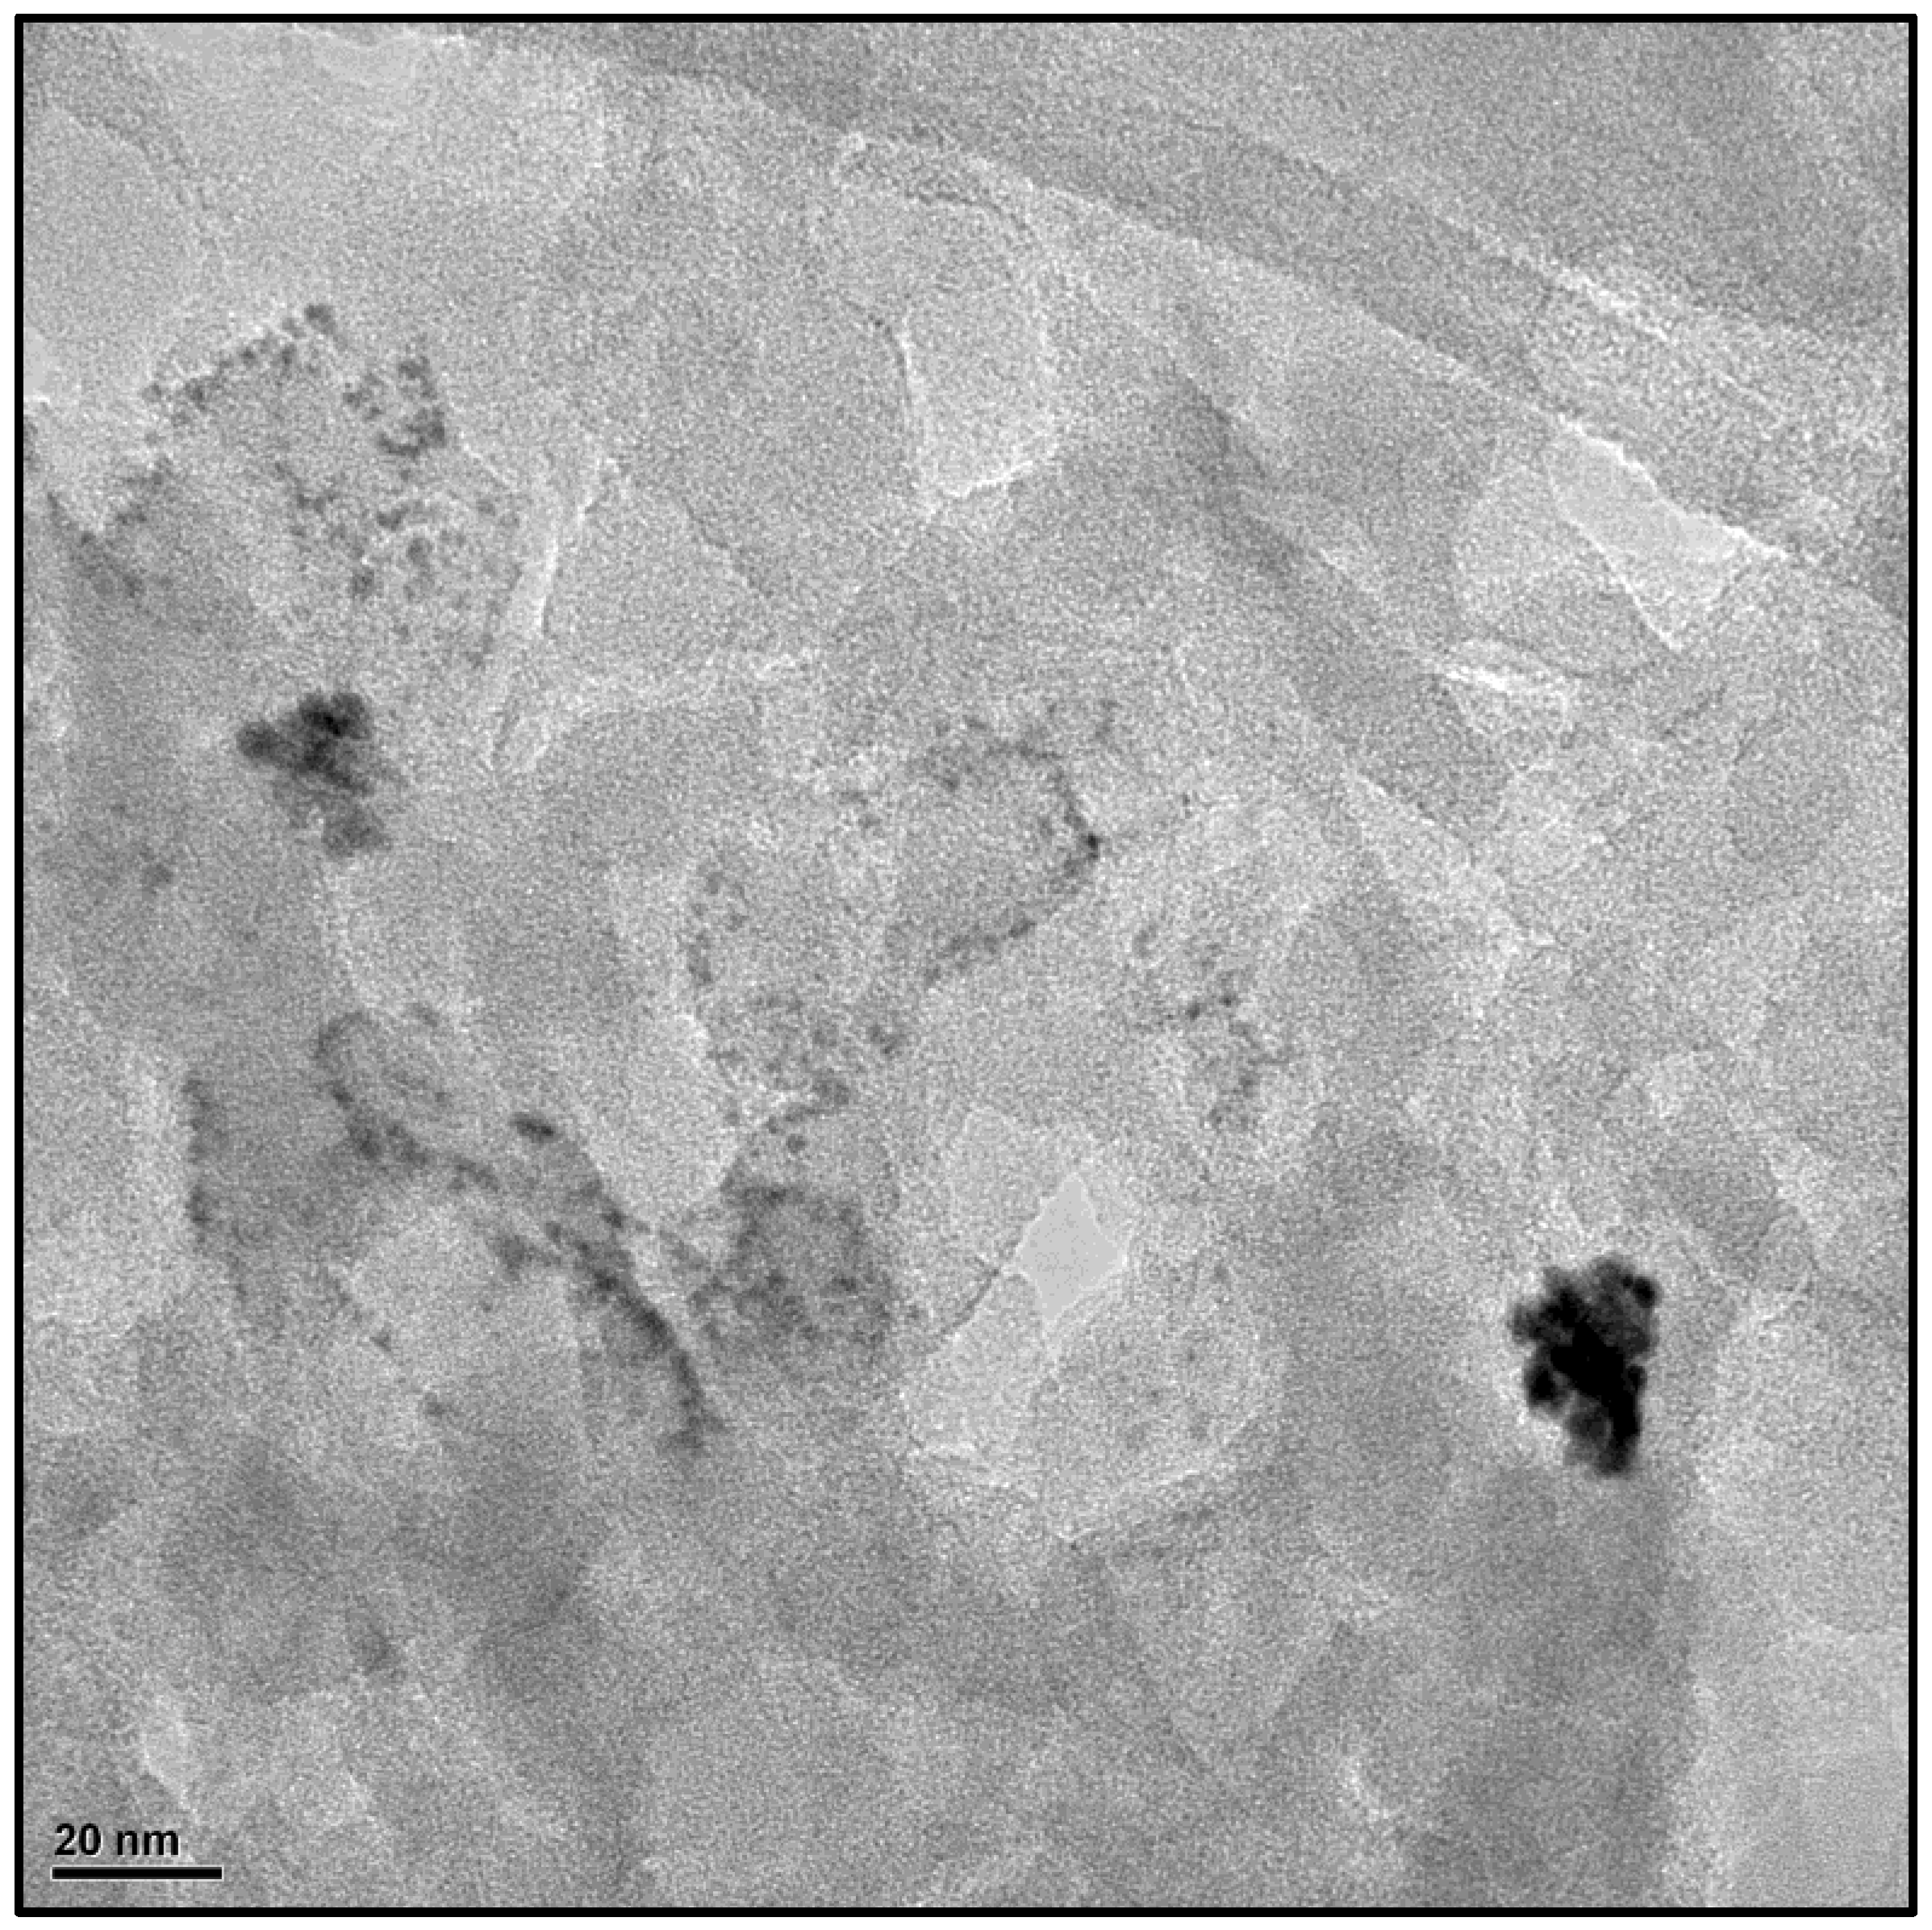
Figure A8.
HRTEM images of CN-U-Air. Comparison of an isolated Pt NPs (~ 5 nm) and a large Pt NPs (17 x 21 nm) composed of the aggregation of small nanoparticles (3 x 5 nm).
Figure A8.
HRTEM images of CN-U-Air. Comparison of an isolated Pt NPs (~ 5 nm) and a large Pt NPs (17 x 21 nm) composed of the aggregation of small nanoparticles (3 x 5 nm).
References
- Florentino-Madiedo, L.; Díaz-Faes, E.; Barriocanal, C. Relationship between gCN Structure and Photocatalytic Water Splitting Efficiency. Carbon 2022, 187, 462–476. [Google Scholar] [CrossRef]
- Baca, M.; Rychtowski, P.; Wróbel, R.; Mijowska, E.; Kaleńczuk, R.J.; Zielińska, B. Surface Properties Tuning of Exfoliated Graphitic Carbon Nitride for Multiple Photocatalytic Performance. Solar Energy 2020, 207, 528–538. [Google Scholar] [CrossRef]
- Vega, M.F.; Olivas, C.; Díaz-Faes, E.; Barriocanal, C. Evaluation of Water Splitting Efficiency of G-C3N4 Thermally Etched/Exfoliated under Air and CO2 Atmospheres. Catalysis Today 2024, 427, 114412. [Google Scholar] [CrossRef]
- Cheng, C.; Shi, J.; Wen, L.; Dong, C.-L.; Huang, Y.-C.; Zhang, Y.; Zong, S.; Diao, Z.; Shen, S.; Guo, L. Disordered Nitrogen-Defect-Rich Porous Carbon Nitride Photocatalyst for Highly Efficient H2 Evolution under Visible-Light Irradiation. Carbon 2021, 181, 193–203. [Google Scholar] [CrossRef]
- Doustkhah, E. The Effects of Bandgap and Porosity on Catalysis and Materials Characteristics of Layered Carbon Nitrides. Nanoscale 2025, 17, 8415–8435. [Google Scholar] [CrossRef]
- Wang, Z.; Hu, X.; Zou, G.; Huang, Z.; Tang, Z.; Liu, Q.; Hu, G.; Geng, D. Advances in Constructing Polymeric Carbon-Nitride-Based Nanocomposites and Their Applications in Energy Chemistry. Sustainable Energy Fuels 2019, 3, 611–655. [Google Scholar] [CrossRef]
- Niu, P.; Liu, G.; Cheng, H.-M. Nitrogen Vacancy-Promoted Photocatalytic Activity of Graphitic Carbon Nitride. J. Phys. Chem. C 2012, 116, 11013–11018. [Google Scholar] [CrossRef]
- Kang, Y.; Yang, Y.; Yin, L.-C.; Kang, X.; Wang, L.; Liu, G.; Cheng, H.-M. Selective Breaking of Hydrogen Bonds of Layered Carbon Nitride for Visible Light Photocatalysis. Advanced Materials 2016, 28, 6471–6477. [Google Scholar] [CrossRef]
- Li, Y.; Ho, W.; Lv, K.; Zhu, B.; Lee, S.C. Carbon Vacancy-Induced Enhancement of the Visible Light-Driven Photocatalytic Oxidation of NO over g-C3N4 Nanosheets. Applied Surface Science 2018, 430, 380–389. [Google Scholar] [CrossRef]
- Li, J.; Shen, B.; Hong, Z.; Lin, B.; Gao, B.; Chen, Y. A Facile Approach to Synthesize Novel Oxygen-Doped g-C3N4 with Superior Visible-Light Photoreactivity. Chem. Commun. 2012, 48, 12017–12019. [Google Scholar] [CrossRef]
- Kang, Y.; Yang, Y.; Yin, L.-C.; Kang, X.; Liu, G.; Cheng, H.-M. An Amorphous Carbon Nitride Photocatalyst with Greatly Extended Visible-Light-Responsive Range for Photocatalytic Hydrogen Generation. Advanced Materials 2015, 27, 4572–4577. [Google Scholar] [CrossRef] [PubMed]
- Papailias, I.; Todorova, N.; Giannakopoulou, T.; Ioannidis, N.; Boukos, N.; Athanasekou, C.P.; Dimotikali, D.; Trapalis, C. Chemical vs Thermal Exfoliation of G-C3N4 for NOx Removal under Visible Light Irradiation. Applied Catalysis B: Environmental 2018, 239, 16–26. [Google Scholar] [CrossRef]
- Li, Y.; Jin, R.; Xing, Y.; Li, J.; Song, S.; Liu, X.; Li, M.; Jin, R. Macroscopic Foam-Like Holey Ultrathin g-C3N4 Nanosheets for Drastic Improvement of Visible-Light Photocatalytic Activity. Advanced Energy Materials 2016, 6, 1601273. [Google Scholar] [CrossRef]
- Iqbal, W.; Qiu, B.; Zhu, Q.; Xing, M.; Zhang, J. Self-Modified Breaking Hydrogen Bonds to Highly Crystalline Graphitic Carbon Nitrides Nanosheets for Drastically Enhanced Hydrogen Production. Applied Catalysis B: Environmental 2018, 232, 306–313. [Google Scholar] [CrossRef]
- Li, Y.; He, R.; Han, P.; Hou, B.; Peng, S.; Ouyang, C. A New Concept: Volume Photocatalysis for Efficient H2 Generation __ Using Low Polymeric Carbon Nitride as an Example. Applied Catalysis B: Environmental 2020, 279, 119379. [Google Scholar] [CrossRef]
- Niu, P.; Zhang, L.; Liu, G.; Cheng, H.-M. Graphene-Like Carbon Nitride Nanosheets for Improved Photocatalytic Activities. Advanced Functional Materials 2012, 22, 4763–4770. [Google Scholar] [CrossRef]
- Lan, H.; Li, L.; An, X.; Liu, F.; Chen, C.; Liu, H.; Qu, J. Microstructure of Carbon Nitride Affecting Synergetic Photocatalytic Activity: Hydrogen Bonds vs. Structural Defects. Applied Catalysis B: Environmental 2017, 204, 49–57. [Google Scholar] [CrossRef]
- Murphy, A.B. Band-Gap Determination from Diffuse Reflectance Measurements of Semiconductor Films, and Application to Photoelectrochemical Water-Splitting. Solar Energy Materials and Solar Cells 2007, 91, 1326–1337. [Google Scholar] [CrossRef]
- Xu, J.; Fujitsuka, M.; Kim, S.; Wang, Z.; Majima, T. Unprecedented Effect of CO2 Calcination Atmosphere on Photocatalytic H2 Production Activity from Water Using G-C3N4 Synthesized from Triazole Polymerization. Applied Catalysis B: Environmental 2019, 241, 141–148. [Google Scholar] [CrossRef]
- Zhao, Z.; Ma, Y.; Fan, J.; Xue, Y.; Chang, H.; Masubuchi, Y.; Yin, S. Synthesis of Graphitic Carbon Nitride from Different Precursors by Fractional Thermal Polymerization Method and Their Visible Light Induced Photocatalytic Activities. Journal of Alloys and Compounds 2018, 735, 1297–1305. [Google Scholar] [CrossRef]
- Komatsu, T. The First Synthesis and Characterization of Cyameluric High Polymers. Macromolecular Chemistry and Physics 2001, 202, 19–25. [Google Scholar] [CrossRef]
- Lau, V.W.; Moudrakovski, I.; Botari, T.; Weinberger, S.; Mesch, M.B.; Duppel, V.; Senker, J.; Blum, V.; Lotsch, B.V. Rational Design of Carbon Nitride Photocatalysts by Identification of Cyanamide Defects as Catalytically Relevant Sites. Nature Communications 2016, 7, 12165. [Google Scholar] [CrossRef] [PubMed]
- Lotsch, B.V.; Döblinger, M.; Sehnert, J.; Seyfarth, L.; Senker, J.; Oeckler, O.; Schnick, W. Unmasking Melon by a Complementary Approach Employing Electron Diffraction, Solid-State NMR Spectroscopy, and Theoretical Calculations—Structural Characterization of a Carbon Nitride Polymer. Chemistry – A European Journal 2007, 13, 4969–4980. [Google Scholar] [CrossRef]
- Gao, J.; Zhou, Y.; Li, Z.; Yan, S.; Wang, N.; Zou, Z. High-Yield Synthesis of Millimetre-Long, Semiconducting Carbon Nitride Nanotubes with Intense Photoluminescence Emission and Reproducible Photoconductivity. Nanoscale 2012, 4, 3687–3692. [Google Scholar] [CrossRef] [PubMed]
- Monteiro, D.; Silva, M.; Silva, L. Assessment of Reaction Parameters in the Polymeric Carbon Nitride Thermal Synthesis and the Influence in Photocatalytic Hydrogen Production. Journal of the Brazilian Chemical Society 2020, 31. [Google Scholar] [CrossRef]
- Wang, X.L.; Fang, W.Q.; Wang, H.F.; Zhang, H.; Zhao, H.; Yao, Y.; Yang, H.G. Surface Hydrogen Bonding Can Enhance Photocatalytic H2 Evolution Efficiency. J. Mater. Chem. A 2013, 1, 14089–14096. [Google Scholar] [CrossRef]
- Zou, J.-P.; Wang, L.-C.; Luo, J.; Nie, Y.-C.; Xing, Q.-J.; Luo, X.-B.; Du, H.-M.; Luo, S.-L.; Suib, S.L. Synthesis and Efficient Visible Light Photocatalytic H2 Evolution of a Metal-Free g-C3N4/Graphene Quantum Dots Hybrid Photocatalyst. Applied Catalysis B: Environmental 2016, 193, 103–109. [Google Scholar] [CrossRef]
- Jürgens, B.; Irran, E.; Senker, J.; Kroll, P.; Müller, H.; Schnick, W. Melem (2,5,8-Triamino-Tri-s-Triazine), an Important Intermediate during Condensation of Melamine Rings to Graphitic Carbon Nitride: Synthesis, Structure Determination by X-Ray Powder Diffractometry, Solid-State NMR, and Theoretical Studies. J. Am. Chem. Soc. 2003, 125, 10288–10300. [Google Scholar] [CrossRef]
- Wang, R. Selective Hydrogen–Deuterium Exchange in Graphitic Carbon Nitrides: Probing the Active Sites for Photocatalytic Water Splitting by Solid-State NMR. Journal of materials chemistry A 2021, v. 9, 3985–3994. [Google Scholar] [CrossRef]
- Xu, C.-Q.; Xiao, Y.-H.; Yu, Y.-X.; Zhang, W.-D. The Role of Hydrogen Bonding on Enhancement of Photocatalytic Activity of the Acidified Graphitic Carbon Nitride for Hydrogen Evolution. Journal of Materials Science 2018, 53, 409–422. [Google Scholar] [CrossRef]
- Li, X.; Sergeyev, I.V.; Aussenac, F.; Masters, A.F.; Maschmeyer, T.; Hook, J.M. Dynamic Nuclear Polarization NMR Spectroscopy of Polymeric Carbon Nitride Photocatalysts: Insights into Structural Defects and Reactivity. Angewandte Chemie International Edition 2018, 57, 6848–6852. [Google Scholar] [CrossRef]
- Trébosc, J.; Wiench, J.W.; Huh, S.; Lin, V.S.-Y.; Pruski, M. Solid-State NMR Study of MCM-41-Type Mesoporous Silica Nanoparticles. J. Am. Chem. Soc. 2005, 127, 3057–3068. [Google Scholar] [CrossRef]
- Wang, X.L.; Fang, W.Q.; Wang, H.F.; Zhang, H.; Zhao, H.; Yao, Y.; Yang, H.G. Surface Hydrogen Bonding Can Enhance Photocatalytic H2 Evolution Efficiency. J. Mater. Chem. A 2013, 1, 14089–14096. [Google Scholar] [CrossRef]
- Chen, Z.; Vorobyeva, E.; Mitchell, S.; Fako, E.; López, N.; Collins, S.M.; Leary, R.K.; Midgley, P.A.; Hauert, R.; Pérez-Ramírez, J. Single-Atom Heterogeneous Catalysts Based on Distinct Carbon Nitride Scaffolds. National Science Review 2018, 5, 642–652. [Google Scholar] [CrossRef]
- Tyborski, T.; Merschjann, C.; Orthmann, S.; Yang, F.; Lux-Steiner, M.-C.; Schedel-Niedrig, T. Crystal Structure of Polymeric Carbon Nitride and the Determination of Its Process-Temperature-Induced Modifications. Journal of Physics: Condensed Matter 2013, 25, 395402. [Google Scholar] [CrossRef]
- Fina, F.; Callear, S.K.; Carins, G.M.; Irvine, J.T.S. Structural Investigation of Graphitic Carbon Nitride via XRD and Neutron Diffraction. Chem. Mater. 2015, 27, 2612–2618. [Google Scholar] [CrossRef]
- Li, B.; Si, Y.; Zhou, B.-X.; Fang, Q.; Li, Y.-Y.; Huang, W.-Q.; Hu, W.; Pan, A.; Fan, X.; Huang, G.-F. Doping-Induced Hydrogen-Bond Engineering in Polymeric Carbon Nitride To Significantly Boost the Photocatalytic H2 Evolution Performance. ACS Appl. Mater. Interfaces 2019, 11, 17341–17349. [Google Scholar] [CrossRef]
- Zhang, Y.; Zheng, P.; Li, S.; Guo, H.; Hu, X.; Fang, Y.; Duan, R.; Chen, Q. Synthesis of Nitrogen Vacancy-Riched Ultrathin Polymeric Carbon Nitride Nanosheets via Ethanol-Ethylene Glycol Ultrasonic Exfoliation and Photocatalytic Hydrogen Evolution Activity. Colloids and Surfaces A: Physicochemical and Engineering Aspects 2023, 676, 132113. [Google Scholar] [CrossRef]
- Dong, F.; Ou, M.; Jiang, Y.; Guo, S.; Wu, Z. Efficient and Durable Visible Light Photocatalytic Performance of Porous Carbon Nitride Nanosheets for Air Purification. Ind. Eng. Chem. Res. 2014, 53, 2318–2330. [Google Scholar] [CrossRef]
- Jiménez-Calvo, P.; Marchal, C.; Cottineau, T.; Caps, V.; Keller, V. Influence of the Gas Atmosphere during the Synthesis of G-C3N4 for Enhanced Photocatalytic H2 Production from Water on Au/g-C3N4 Composites. J. Mater. Chem. A 2019, 7, 14849–14863. [Google Scholar] [CrossRef]
- Tong, Z.; Yang, D.; Xiao, T.; Tian, Y.; Jiang, Z. Biomimetic Fabrication of G-C3N4/TiO2 Nanosheets with Enhanced Photocatalytic Activity toward Organic Pollutant Degradation. Chemical Engineering Journal 2015, 260, 117–125. [Google Scholar] [CrossRef]
- Oh, J.; Lee, J.M.; Yoo, Y.; Kim, J.; Hwang, S.-J.; Park, S. New Insight of the Photocatalytic Behaviors of Graphitic Carbon Nitrides for Hydrogen Evolution and Their Associations with Grain Size, Porosity, and Photophysical Properties. Applied Catalysis B: Environmental 2017, 218, 349–358. [Google Scholar] [CrossRef]
- Devthade, V.; Kulhari, D.; Umare, S.S. Role of Precursors on Photocatalytic Behavior of Graphitic Carbon Nitride. Materials Today: Proceedings 2018, 5, 9203–9210. [Google Scholar] [CrossRef]
- Zheng, Y.; Zhang, Z.; Li, C. A Comparison of Graphitic Carbon Nitrides Synthesized from Different Precursors through Pyrolysis. Journal of Photochemistry and Photobiology A: Chemistry 2017, 332, 32–44. [Google Scholar] [CrossRef]
- Martha, S.; Nashim, A.; Parida, K.M. Facile Synthesis of Highly Active G-C3N4 for Efficient Hydrogen Production under Visible Light. J. Mater. Chem. A 2013, 1, 7816–7824. [Google Scholar] [CrossRef]
- Miller, T.S.; Jorge, A.B.; Suter, T.M.; Sella, A.; Corà, F.; McMillan, P.F. Carbon Nitrides: Synthesis and Characterization of a New Class of Functional Materials. Phys. Chem. Chem. Phys. 2017, 19, 15613–15638. [Google Scholar] [CrossRef] [PubMed]
- Liu, S.; Diez-Cabanes, V.; Fan, D.; Peng, L.; Fang, Y.; Antonietti, M.; Maurin, G. Tailoring Metal-Ion-Doped Carbon Nitrides for Photocatalytic Oxygen Evolution Reaction. ACS Catal. 2024, 14, 2562–2571. [Google Scholar] [CrossRef]
- Martin, D.J.; Qiu, K.; Shevlin, S.A.; Handoko, A.D.; Chen, X.; Guo, Z.; Tang, J. Highly Efficient Photocatalytic H2 Evolution from Water Using Visible Light and Structure-Controlled Graphitic Carbon Nitride. Angewandte Chemie International Edition 2014, 53, 9240–9245. [Google Scholar] [CrossRef] [PubMed]
- Li, Y.; Wang, M.-Q.; Bao, S.-J.; Lu, S.; Xu, M.; Long, D.; Pu, S. Tuning and Thermal Exfoliation Graphene-like Carbon Nitride Nanosheets for Superior Photocatalytic Activity. Ceramics International 2016, 42, 18521–18528. [Google Scholar] [CrossRef]
- Kumar, A.; Raizada, P.; Hosseini-Bandegharaei, A.; Thakur, V.K.; Nguyen, V.-H.; Singh, P. C-, N-Vacancy Defect Engineered Polymeric Carbon Nitride towards Photocatalysis: Viewpoints and Challenges. J. Mater. Chem. A 2021, 9, 111–153. [Google Scholar] [CrossRef]
- Jiménez-Calvo, P.; Marchal, C.; Cottineau, T.; Caps, V.; Keller, V. Influence of the Gas Atmosphere during the Synthesis of G-C3N4 for Enhanced Photocatalytic H2 Production from Water on Au/g-C3N4 Composites. J. Mater. Chem. A 2019, 7, 14849–14863. [Google Scholar] [CrossRef]
- Chen, Y.; Wang, B.; Lin, S.; Zhang, Y.; Wang, X. Activation of n → Π* Transitions in Two-Dimensional Conjugated Polymers for Visible Light Photocatalysis. J. Phys. Chem. C 2014, 118, 29981–29989. [Google Scholar] [CrossRef]
- Zhang, W.; Zhang, Q.; Dong, F.; Zhao, Z. The Multiple Effects of Precursors on the Properties of Polymeric Carbon Nitride. International Journal of Photoenergy 2013, 2013, 685038. [Google Scholar] [CrossRef]
- Xu, Y.; Gao, S.-P. Band Gap of C3N4 in the GW Approximation. International Journal of Hydrogen Energy 2012, 37, 11072–11080. [Google Scholar] [CrossRef]
- Jia, J.; White, E.R.; Clancy, A.J.; Rubio, N.; Suter, T.; Miller, T.S.; McColl, K.; McMillan, P.F.; Brázdová, V.; Corà, F.; et al. Fast Exfoliation and Functionalisation of Two-Dimensional Crystalline Carbon Nitride by Framework Charging. Angewandte Chemie International Edition 2018, 57, 12656–12660. [Google Scholar] [CrossRef] [PubMed]
- Savateev, A.; Pronkin, S.; Epping, J.D.; Willinger, M.G.; Wolff, C.; Neher, D.; Antonietti, M.; Dontsova, D. Potassium Poly(Heptazine Imides) from Aminotetrazoles: Shifting Band Gaps of Carbon Nitride-like Materials for More Efficient Solar Hydrogen and Oxygen Evolution. ChemCatChem 2017, 9, 167–174. [Google Scholar] [CrossRef]
- Chidhambaram, N.; Ravichandran, K. Single Step Transformation of Urea into Metal-Free g-C3N4 Nanoflakes for Visible Light Photocatalytic Applications. Materials Letters 2017, 207, 44–48. [Google Scholar] [CrossRef]
- Li, Y.; Jiang, Z.; Dong, G.; Ho, W. Construction and Activity of an All-Organic Heterojunction Photocatalyst Based on Melem and Pyromellitic Dianhydride. ChemSusChem 2022, 15, e202200477. [Google Scholar] [CrossRef]
- Sun, S.; Liang, S. Recent Advances in Functional Mesoporous Graphitic Carbon Nitride (Mpg-C3N4) Polymers. Nanoscale 2017, 9, 10544–10578. [Google Scholar] [CrossRef] [PubMed]
- Xu, J.; Li, Y.; Peng, S.; Lu, G.; Li, S. Eosin Y-Sensitized Graphitic Carbon Nitride Fabricated by Heating Urea for Visible Light Photocatalytic Hydrogen Evolution: The Effect of the Pyrolysis Temperature of Urea. Phys. Chem. Chem. Phys. 2013, 15, 7657–7665. [Google Scholar] [CrossRef]
- Huang, S.; Ge, F.; Yan, J.; Li, H.; Zhu, X.; Xu, Y.; Xu, H.; Li, H. Synthesis of Carbon Nitride in Moist Environments: A Defect Engineering Strategy toward Superior Photocatalytic Hydrogen Evolution Reaction. Journal of Energy Chemistry 2021, 54, 403–413. [Google Scholar] [CrossRef]
- Luo, B.; Song, R.; Geng, J.; Jing, D.; Zhang, Y. Facile Preparation with High Yield of a 3D Porous Graphitic Carbon Nitride for Dramatically Enhanced Photocatalytic H2 Evolution under Visible Light. Applied Catalysis B: Environmental 2018, 238, 294–301. [Google Scholar] [CrossRef]
- Mohamed, N.A.; Safaei, J.; Ismail, A.F.; Jailani, M.F.A.M.; Khalid, M.N.; Noh, M.F.M.; Aadenan, A.; Nasir, S.N.S.; Sagu, J.S.; Teridi, M.A.M. The Influences of Post-Annealing Temperatures on Fabrication Graphitic Carbon Nitride, (g-C3N4) Thin Film. Applied Surface Science 2019, 489, 92–100. [Google Scholar] [CrossRef]
- An, S.; Guo, Y.; He, X.; Gao, P.; Hou, G.; Hou, J.; Song, C.; Guo, X. Intermediate-Induced Repolymerization for Constructing Self-Assembly Architecture: Red Crystalline Carbon Nitride Nanosheets for Notable Hydrogen Evolution. Applied Catalysis B: Environmental 2022, 310, 121323. [Google Scholar] [CrossRef]
- Iqbal, W.; Qiu, B.; Zhu, Q.; Xing, M.; Zhang, J. Self-Modified Breaking Hydrogen Bonds to Highly Crystalline Graphitic Carbon Nitrides Nanosheets for Drastically Enhanced Hydrogen Production. Applied Catalysis B: Environmental 2018, 232, 306–313. [Google Scholar] [CrossRef]
- Dong, G.; Wen, Y.; Fan, H.; Wang, C.; Cheng, Z.; Zhang, M.; Ma, J.; Zhang, S. Graphitic Carbon Nitride with Thermally-Induced Nitrogen Defects: An Efficient Process to Enhance Photocatalytic H2 Production Performance. RSC Adv. 2020, 10, 18632–18638. [Google Scholar] [CrossRef] [PubMed]
- Zheng, D.; Huang, C.; Wang, X. Post-Annealing Reinforced Hollow Carbon Nitride Nanospheres for Hydrogen Photosynthesis. Nanoscale 2015, 7, 465–470. [Google Scholar] [CrossRef] [PubMed]
Figure 1.
(a) Schematic diagram of the experimental setup. (b) Temperature curves of CN-M and CN-U thermal treatment under Air and CO2 atmospheres.
Figure 1.
(a) Schematic diagram of the experimental setup. (b) Temperature curves of CN-M and CN-U thermal treatment under Air and CO2 atmospheres.
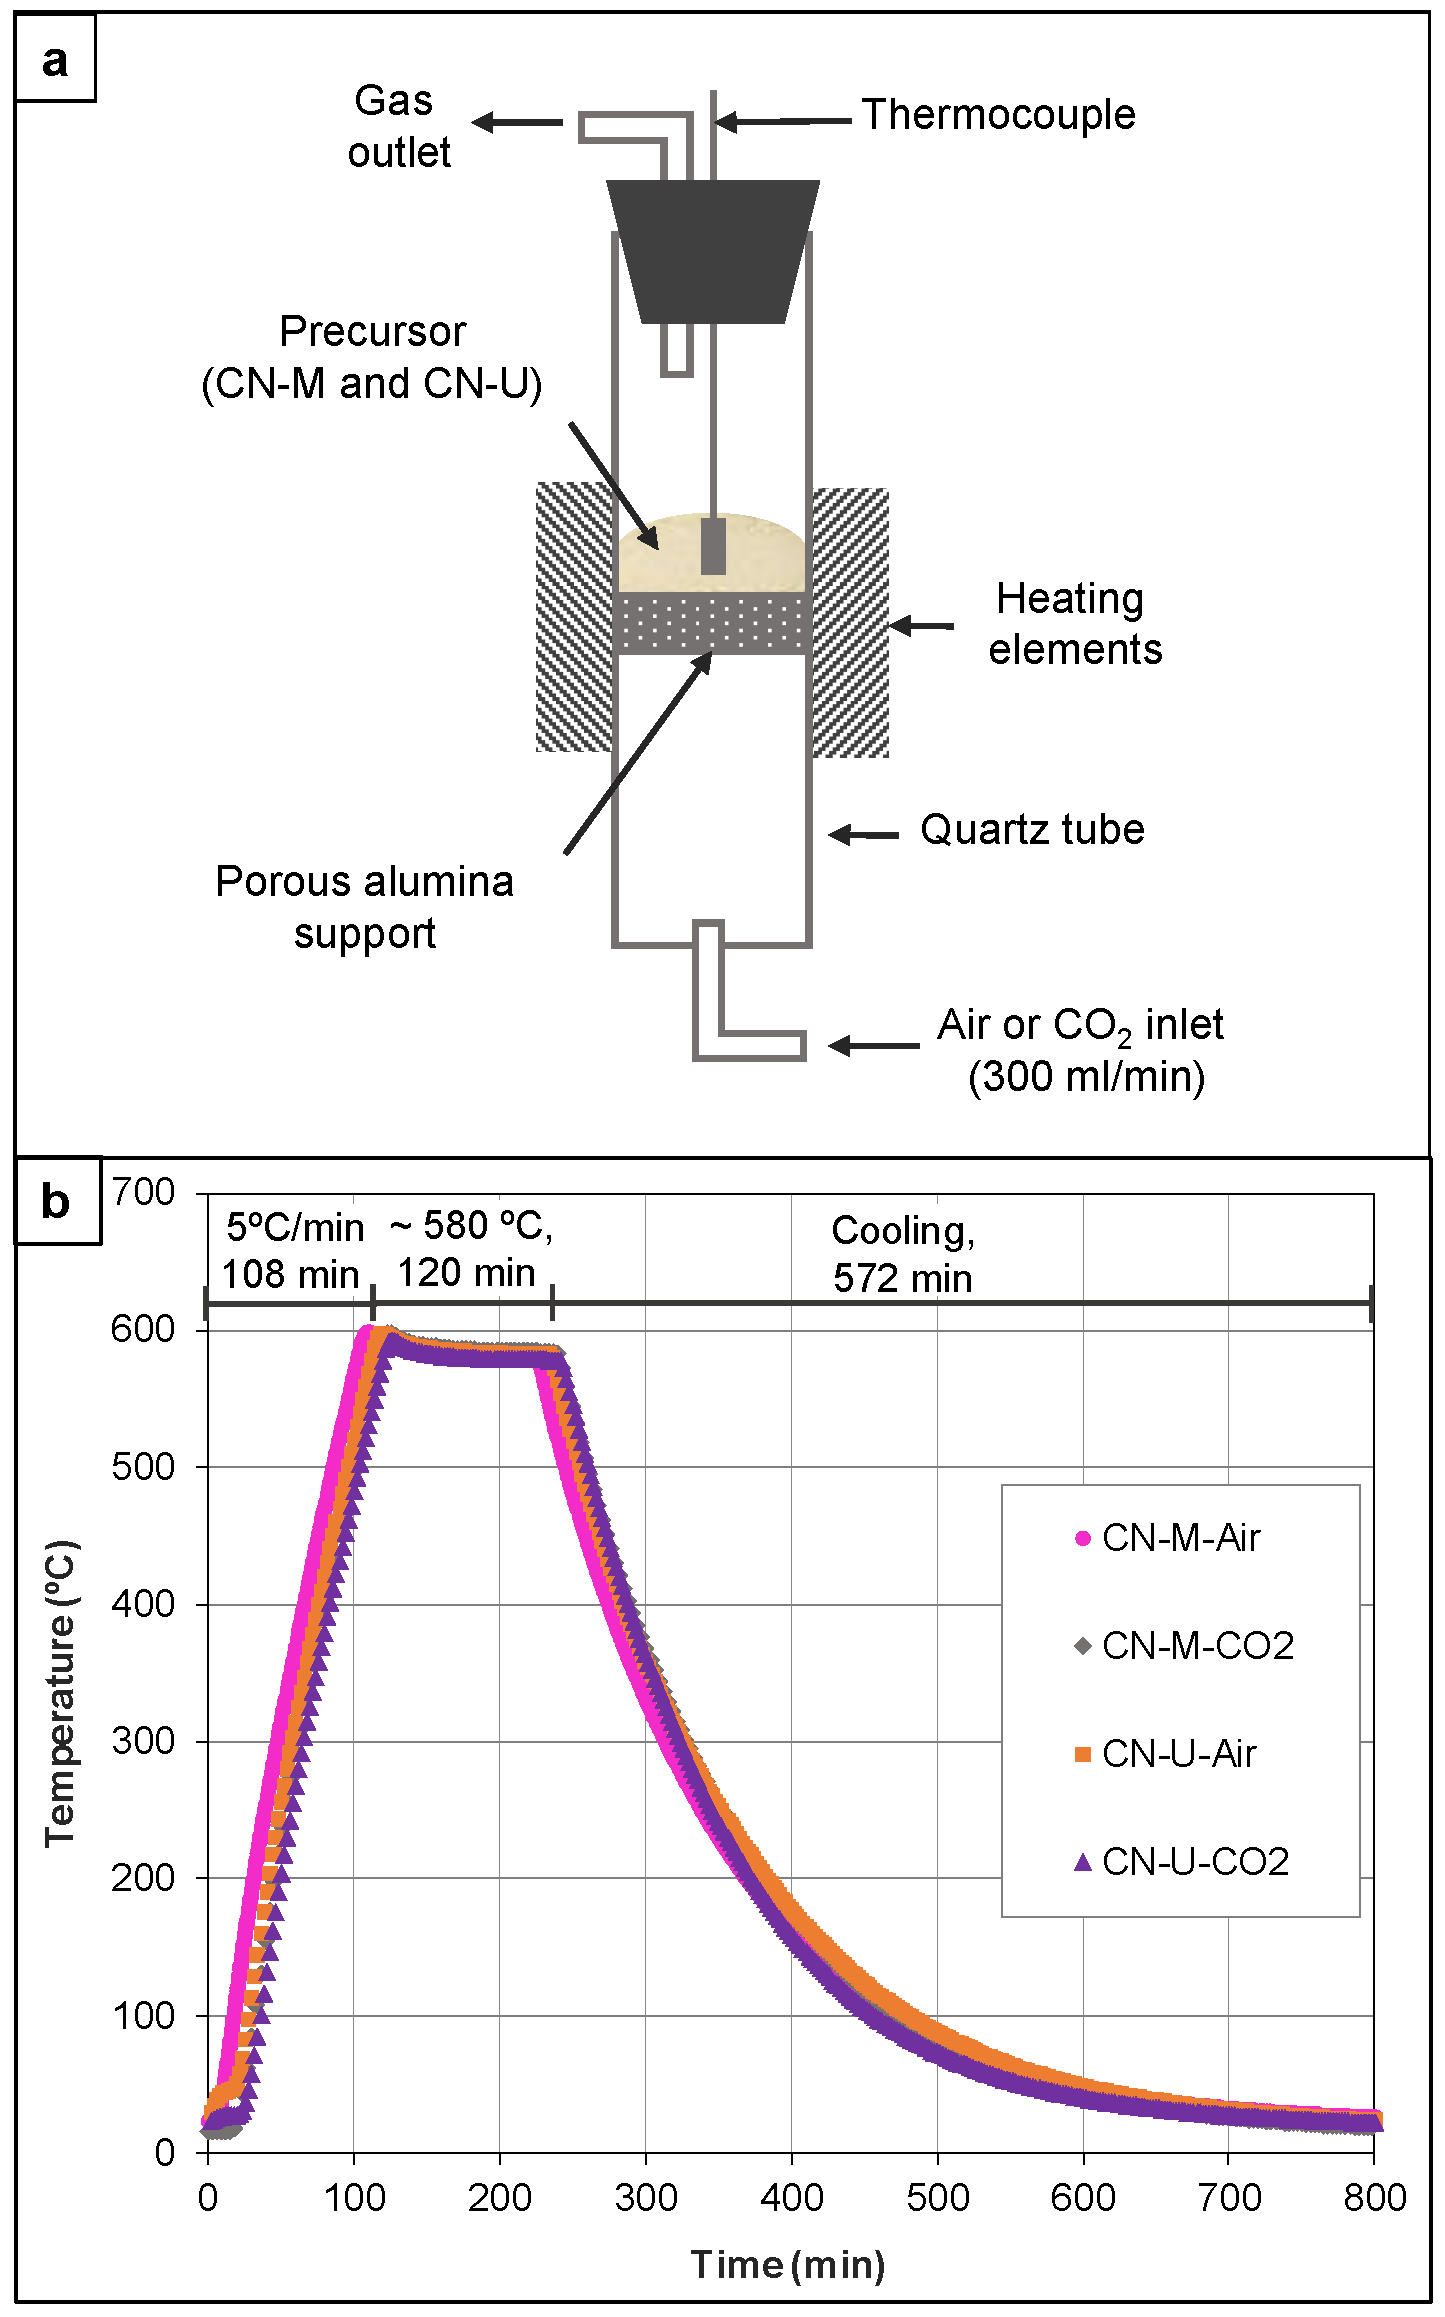
Figure 2.
Comparison of 100 mg of the CN samples and solid yields (SY).
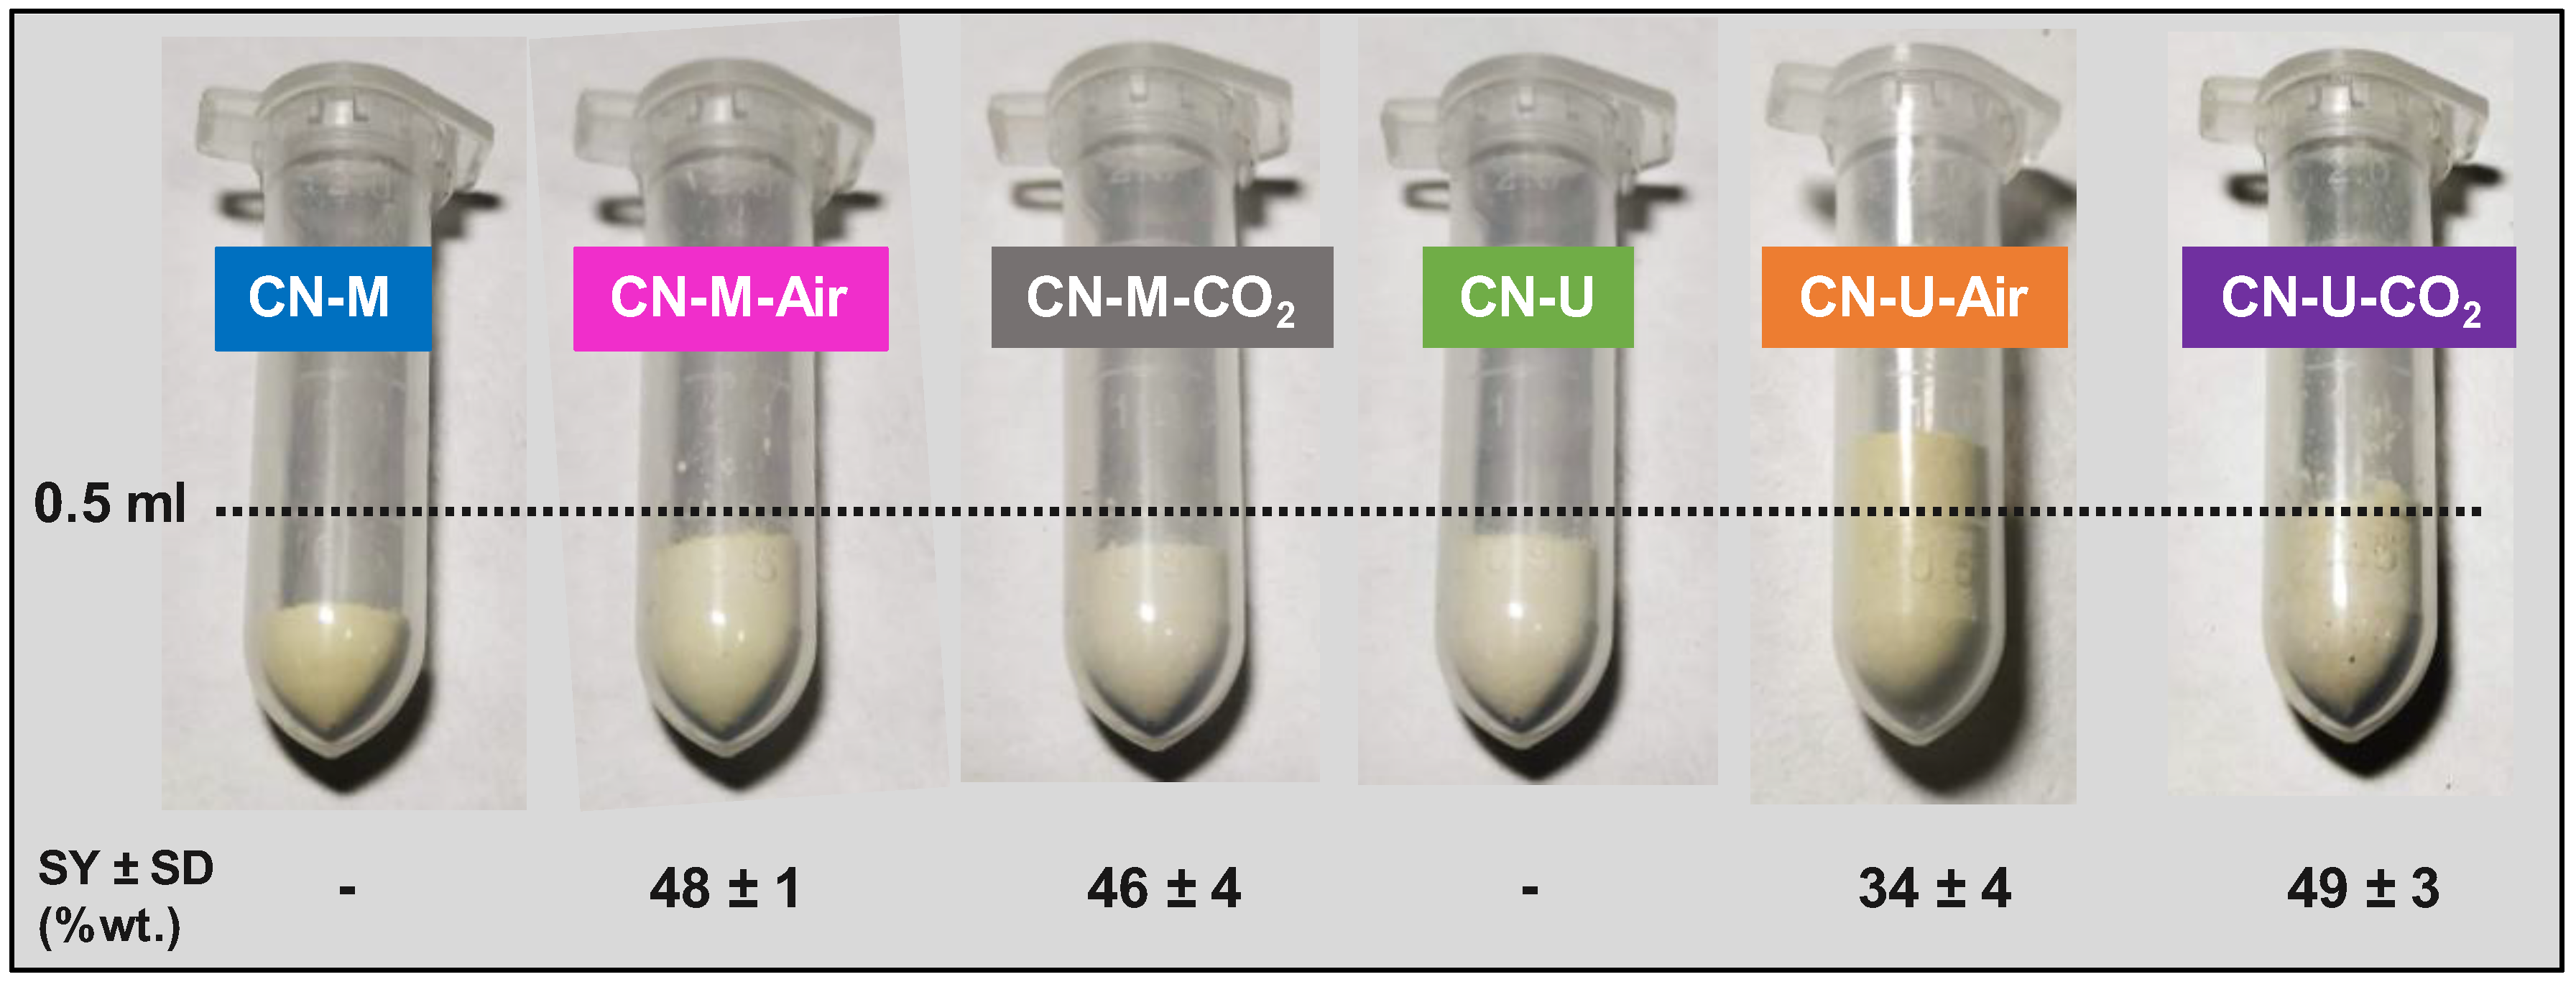
Figure 3.
FTIR spectra of CN samples.
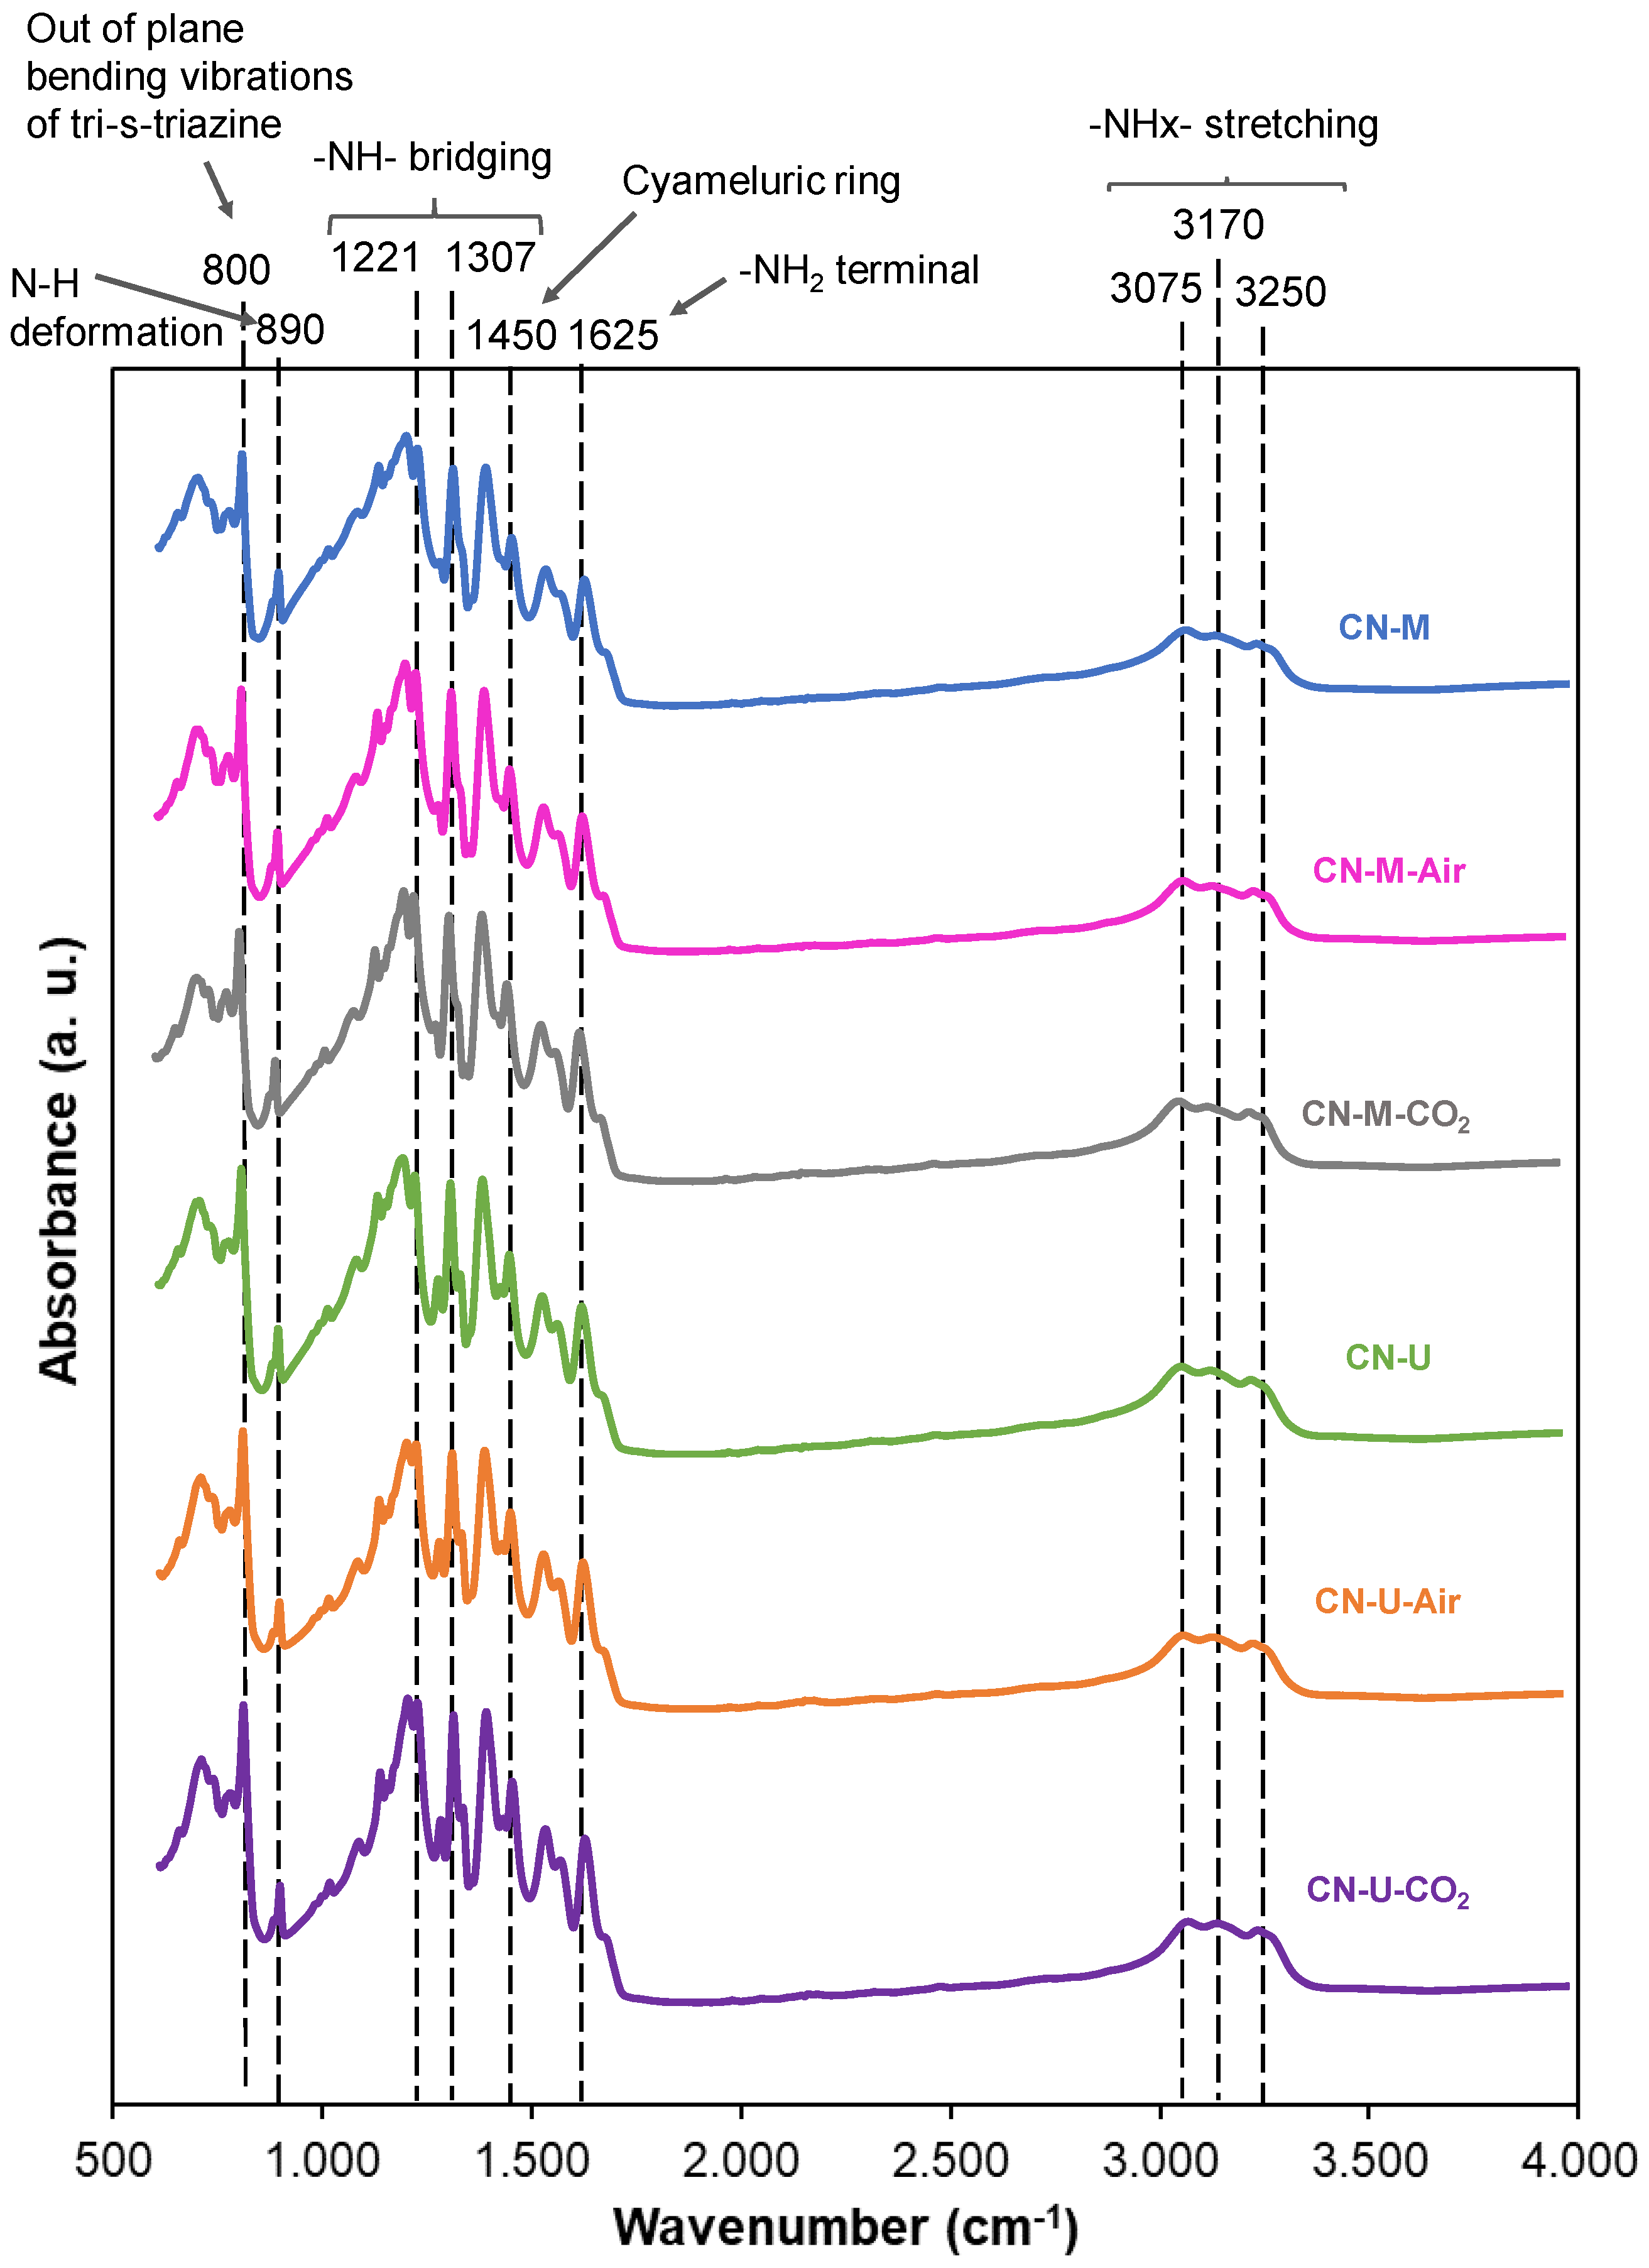
Figure 4.
XPS spectra of the CN samples.
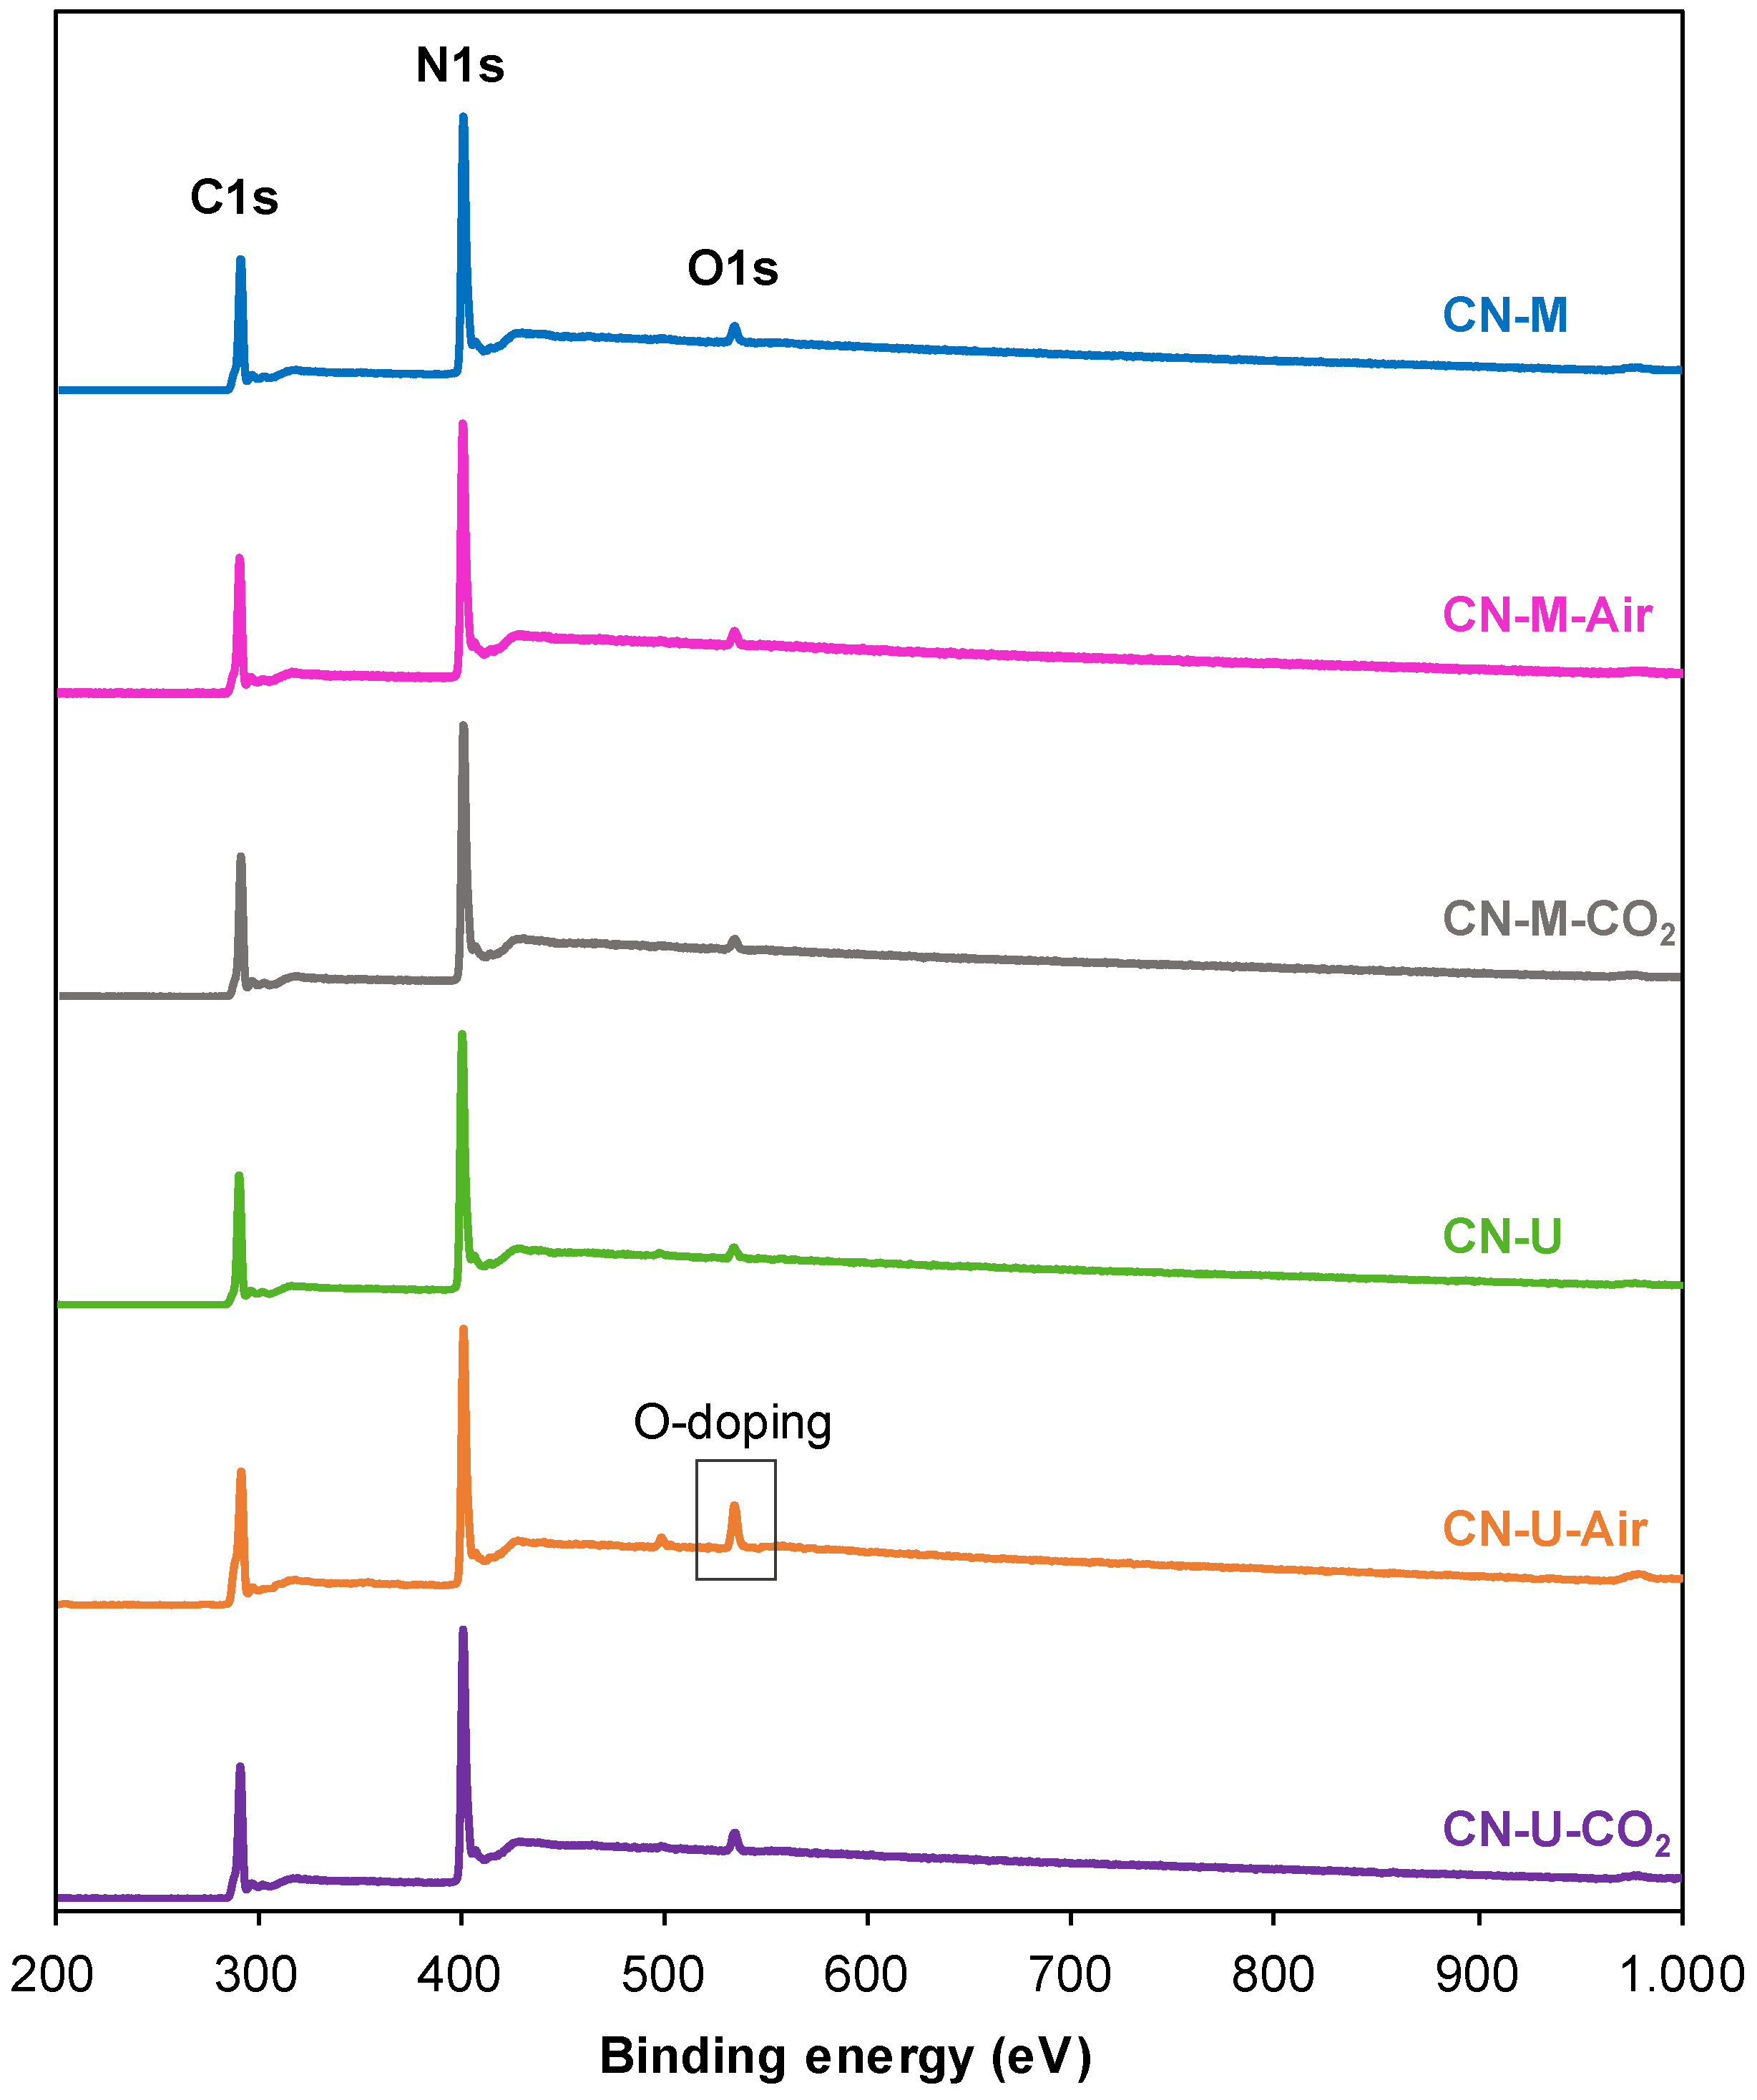
Figure 5.
Deconvolution of XPS N 1s spectra of CN samples.
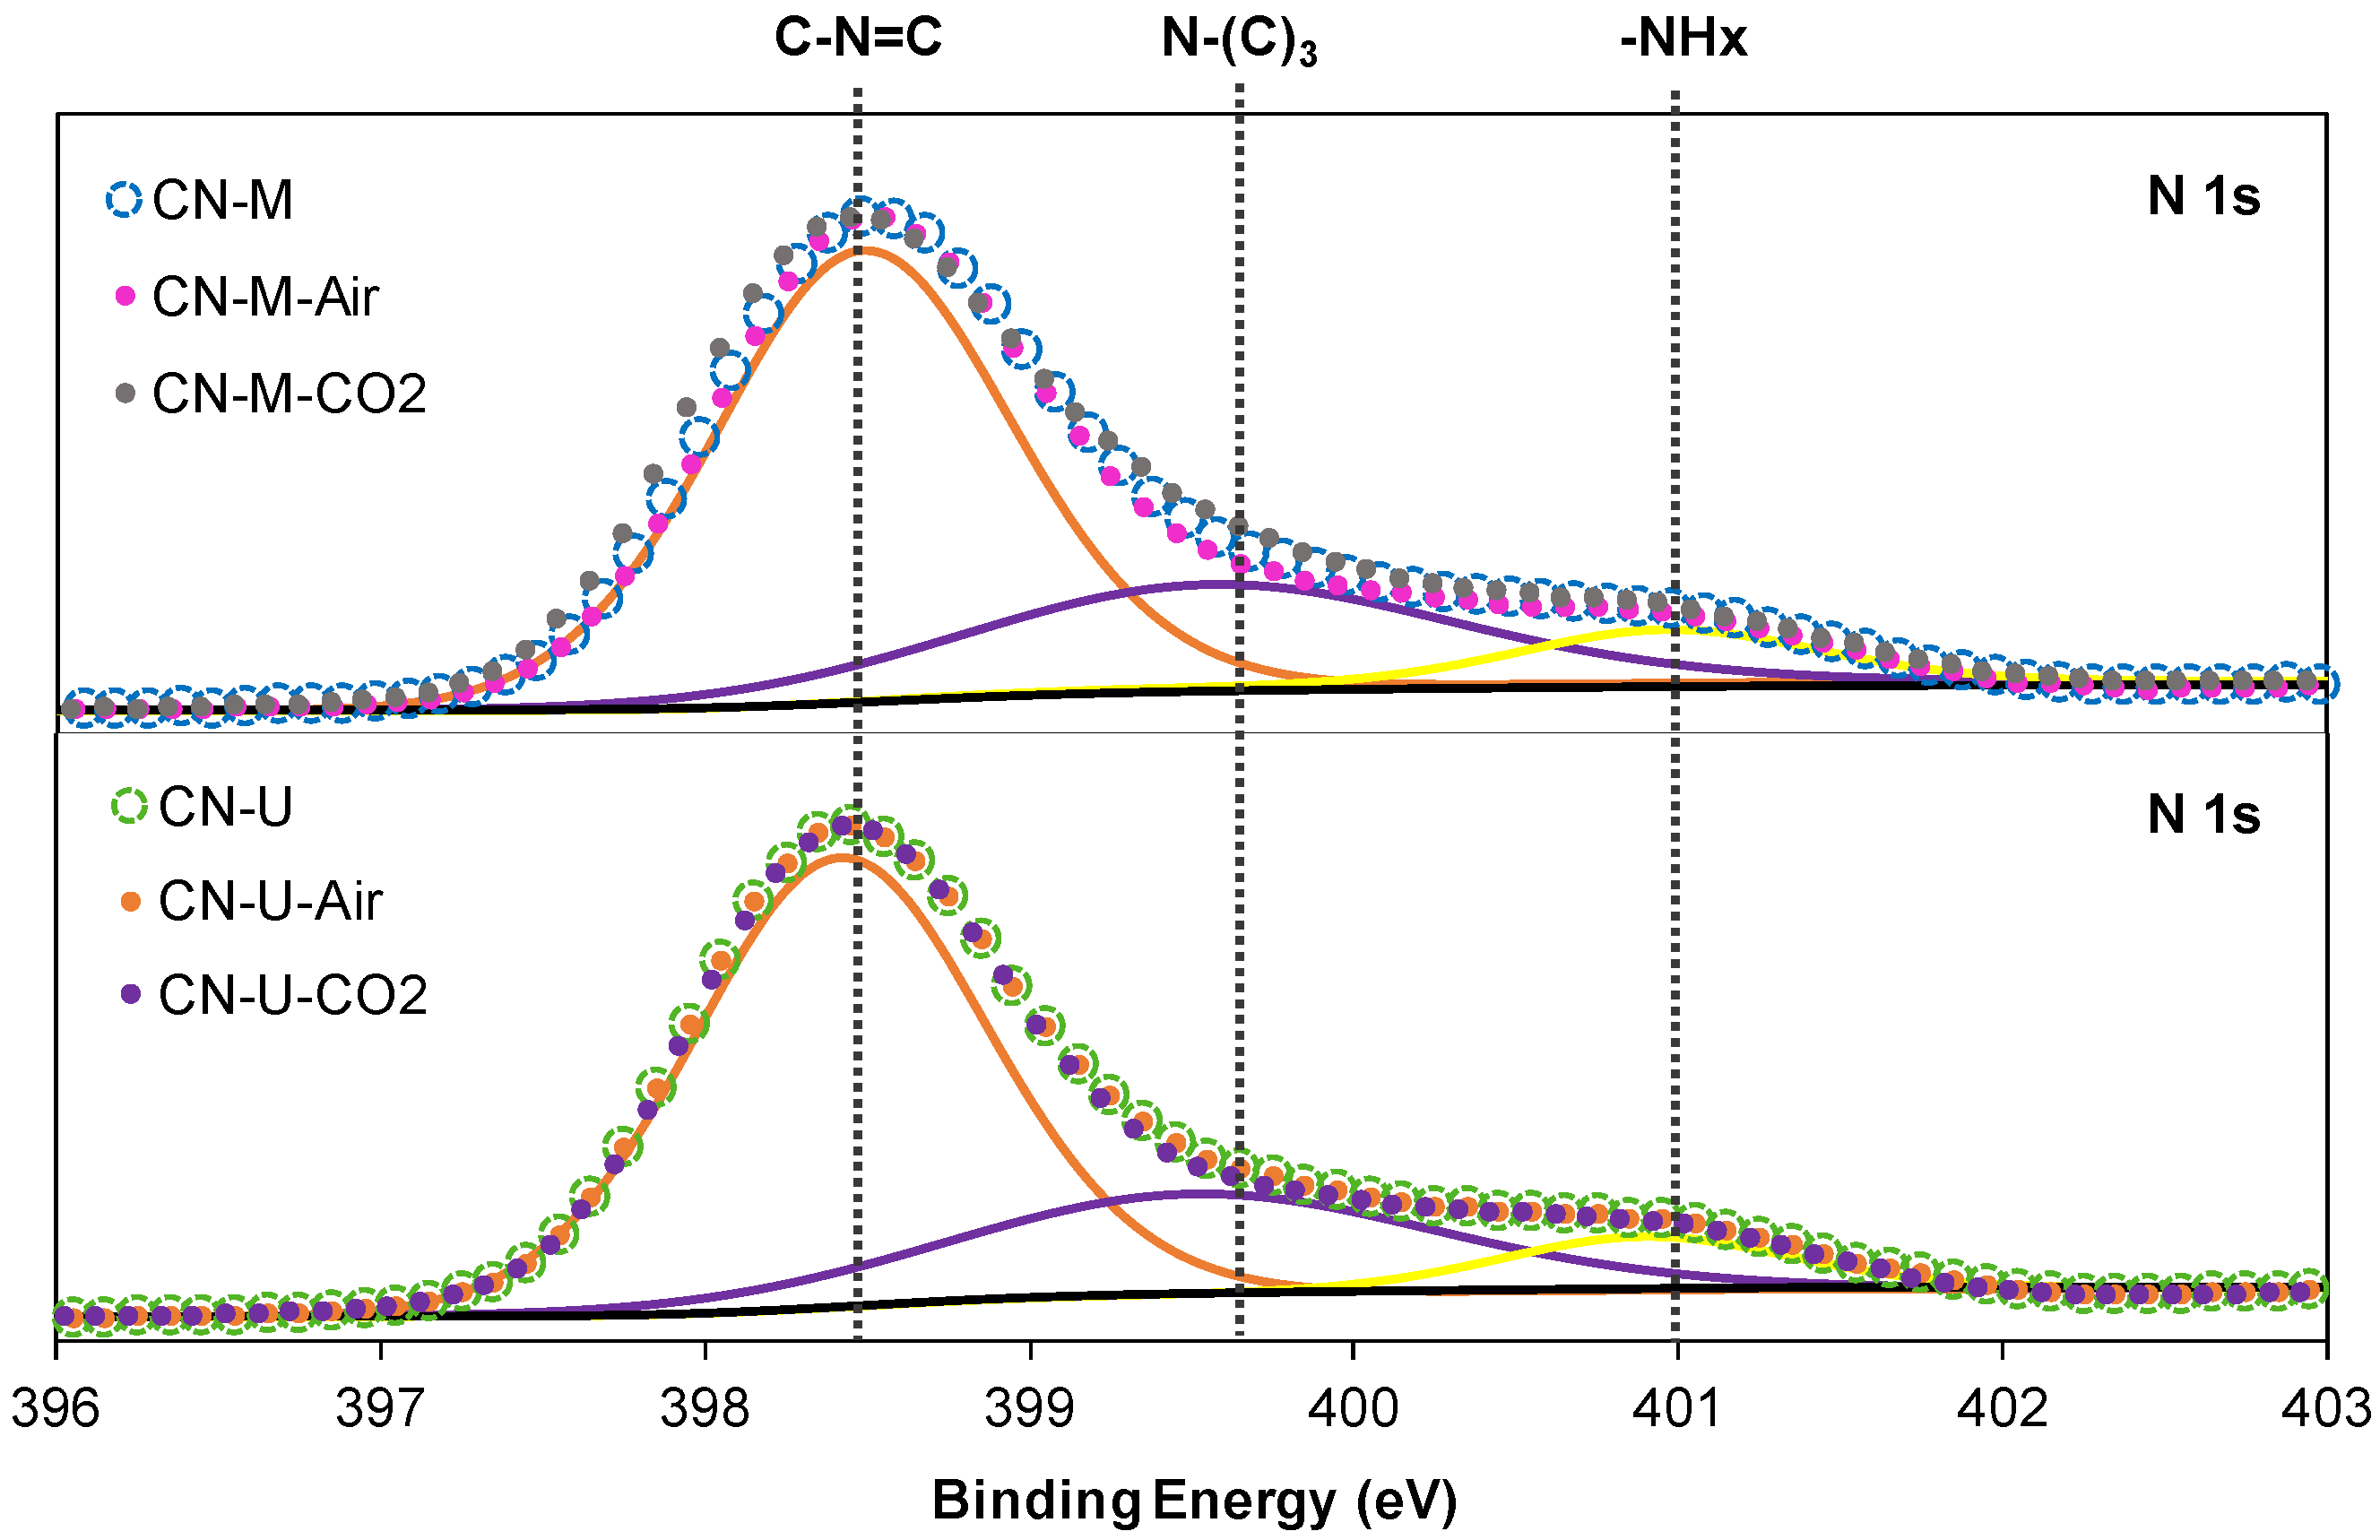
Figure 6.
1H solid-state MAS NMR spectra of CN samples.
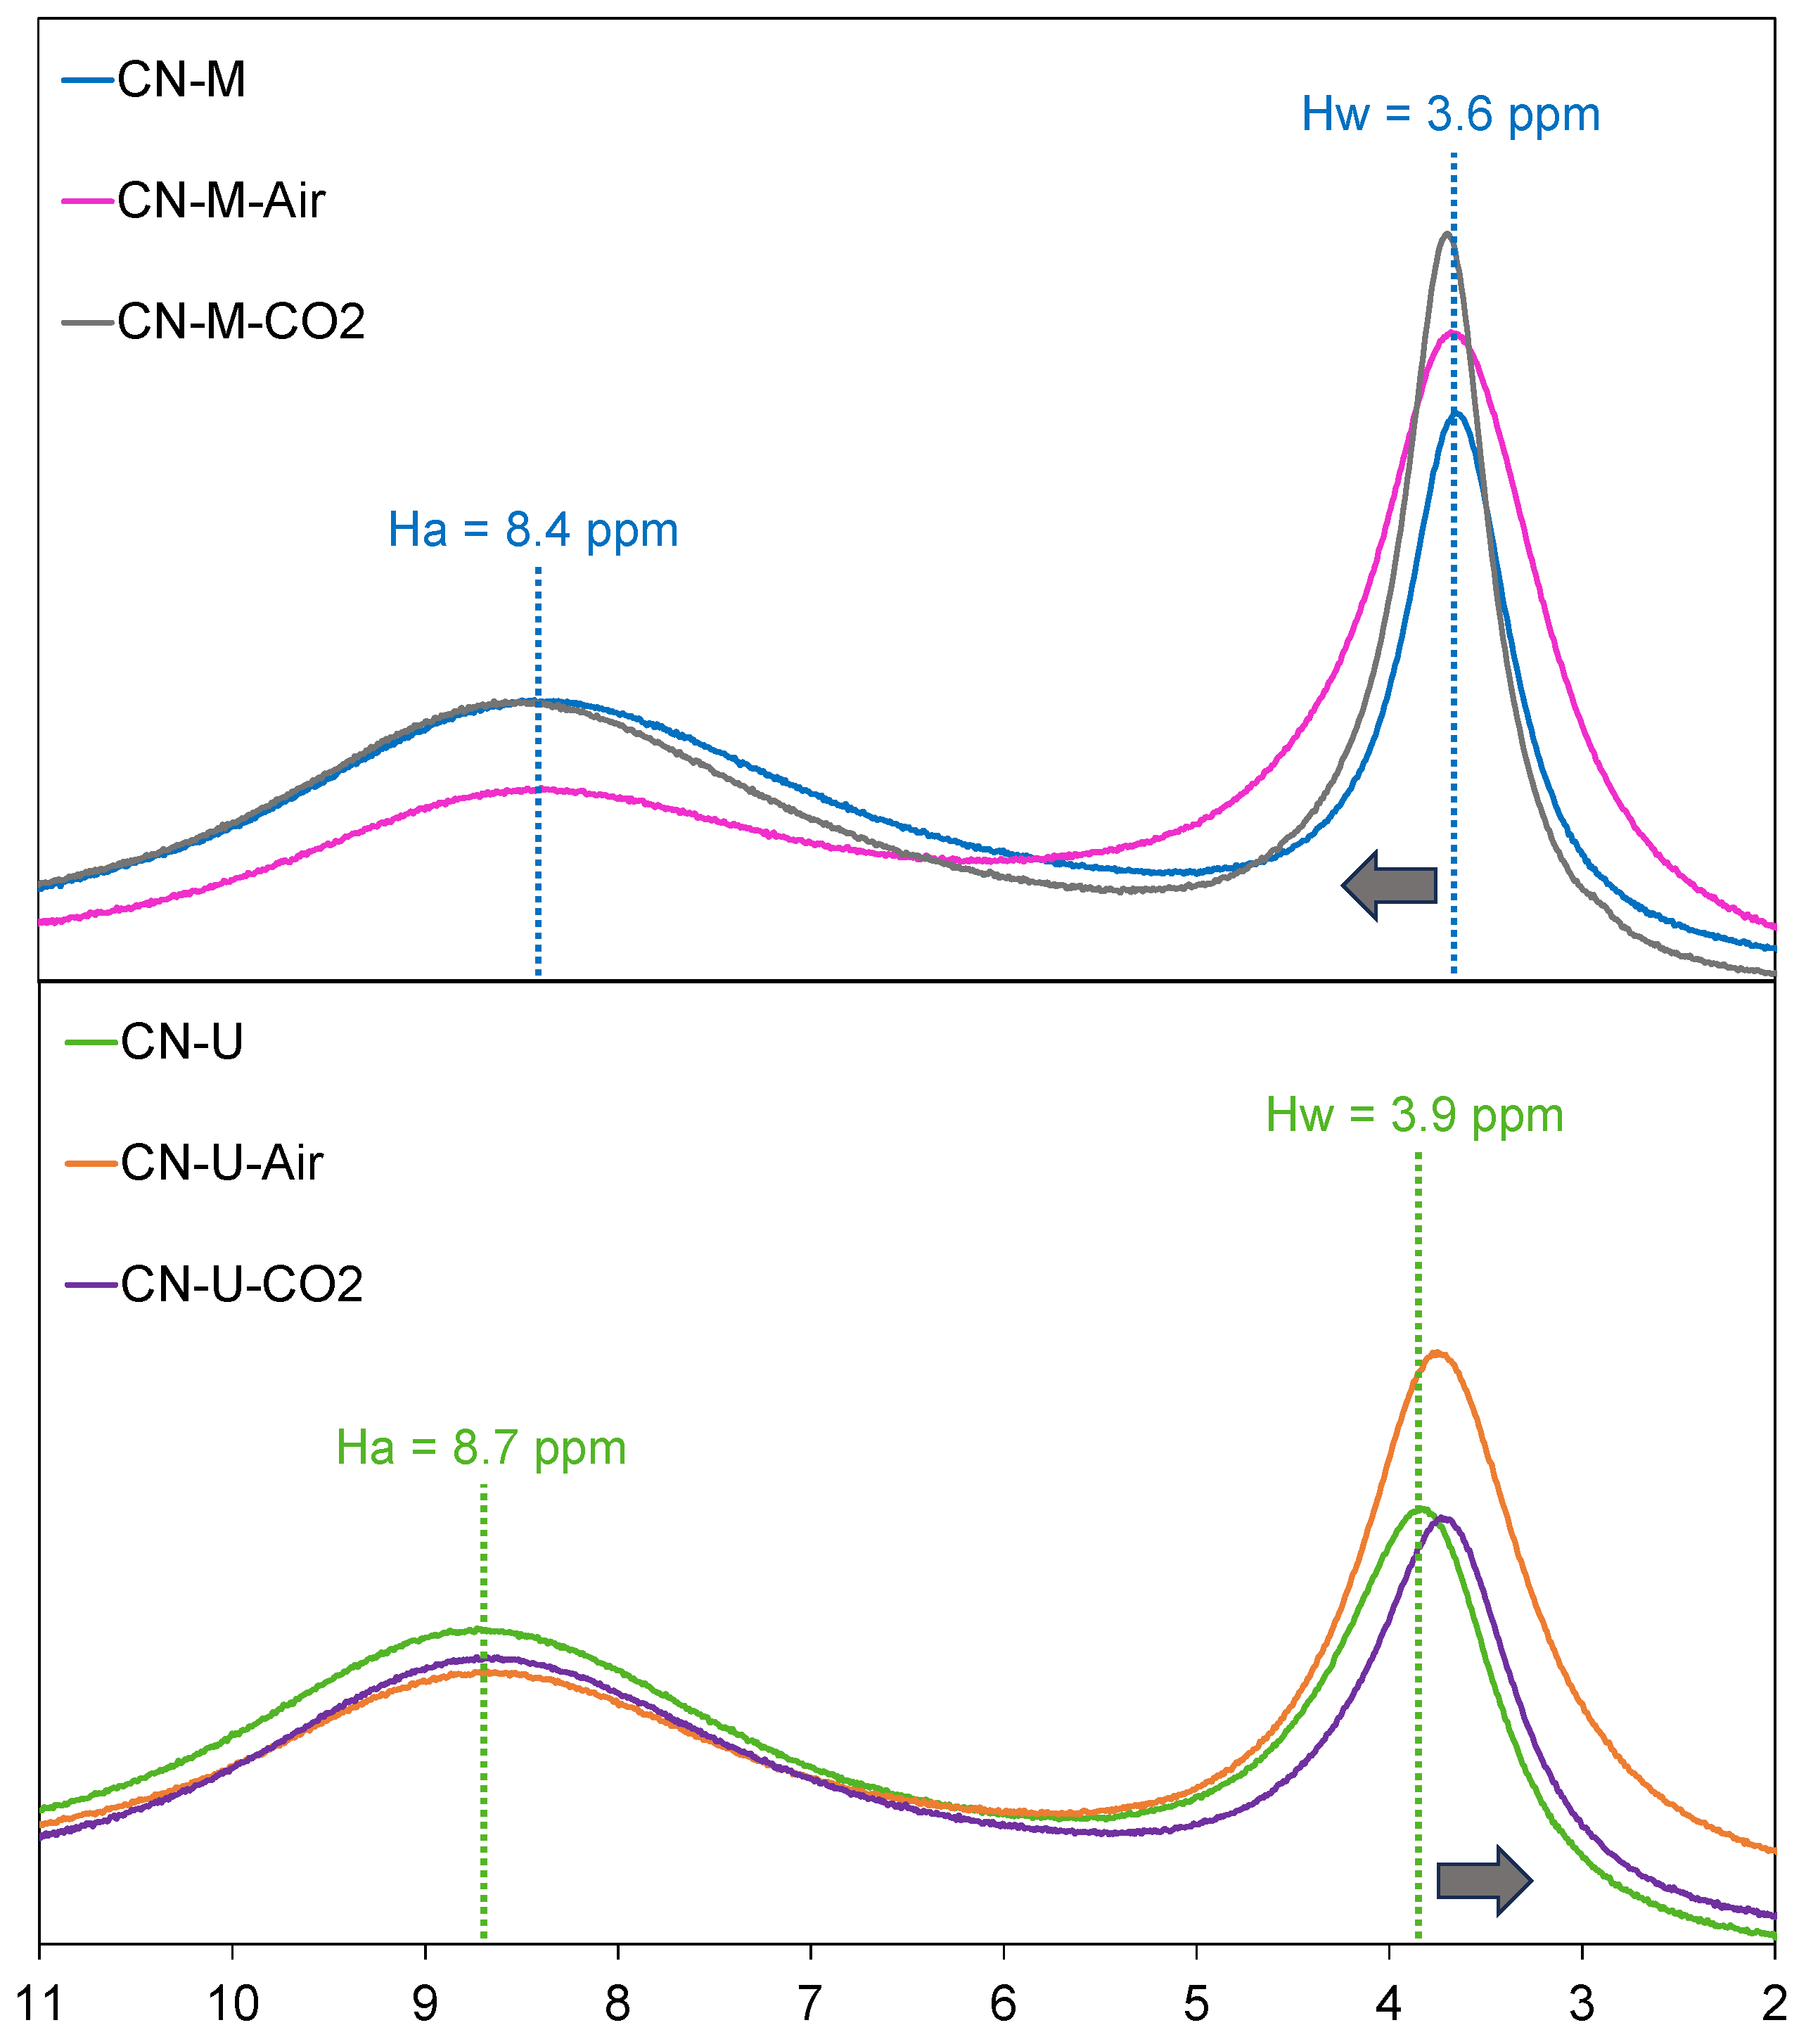
Figure 7.
XRD patterns of CN samples.
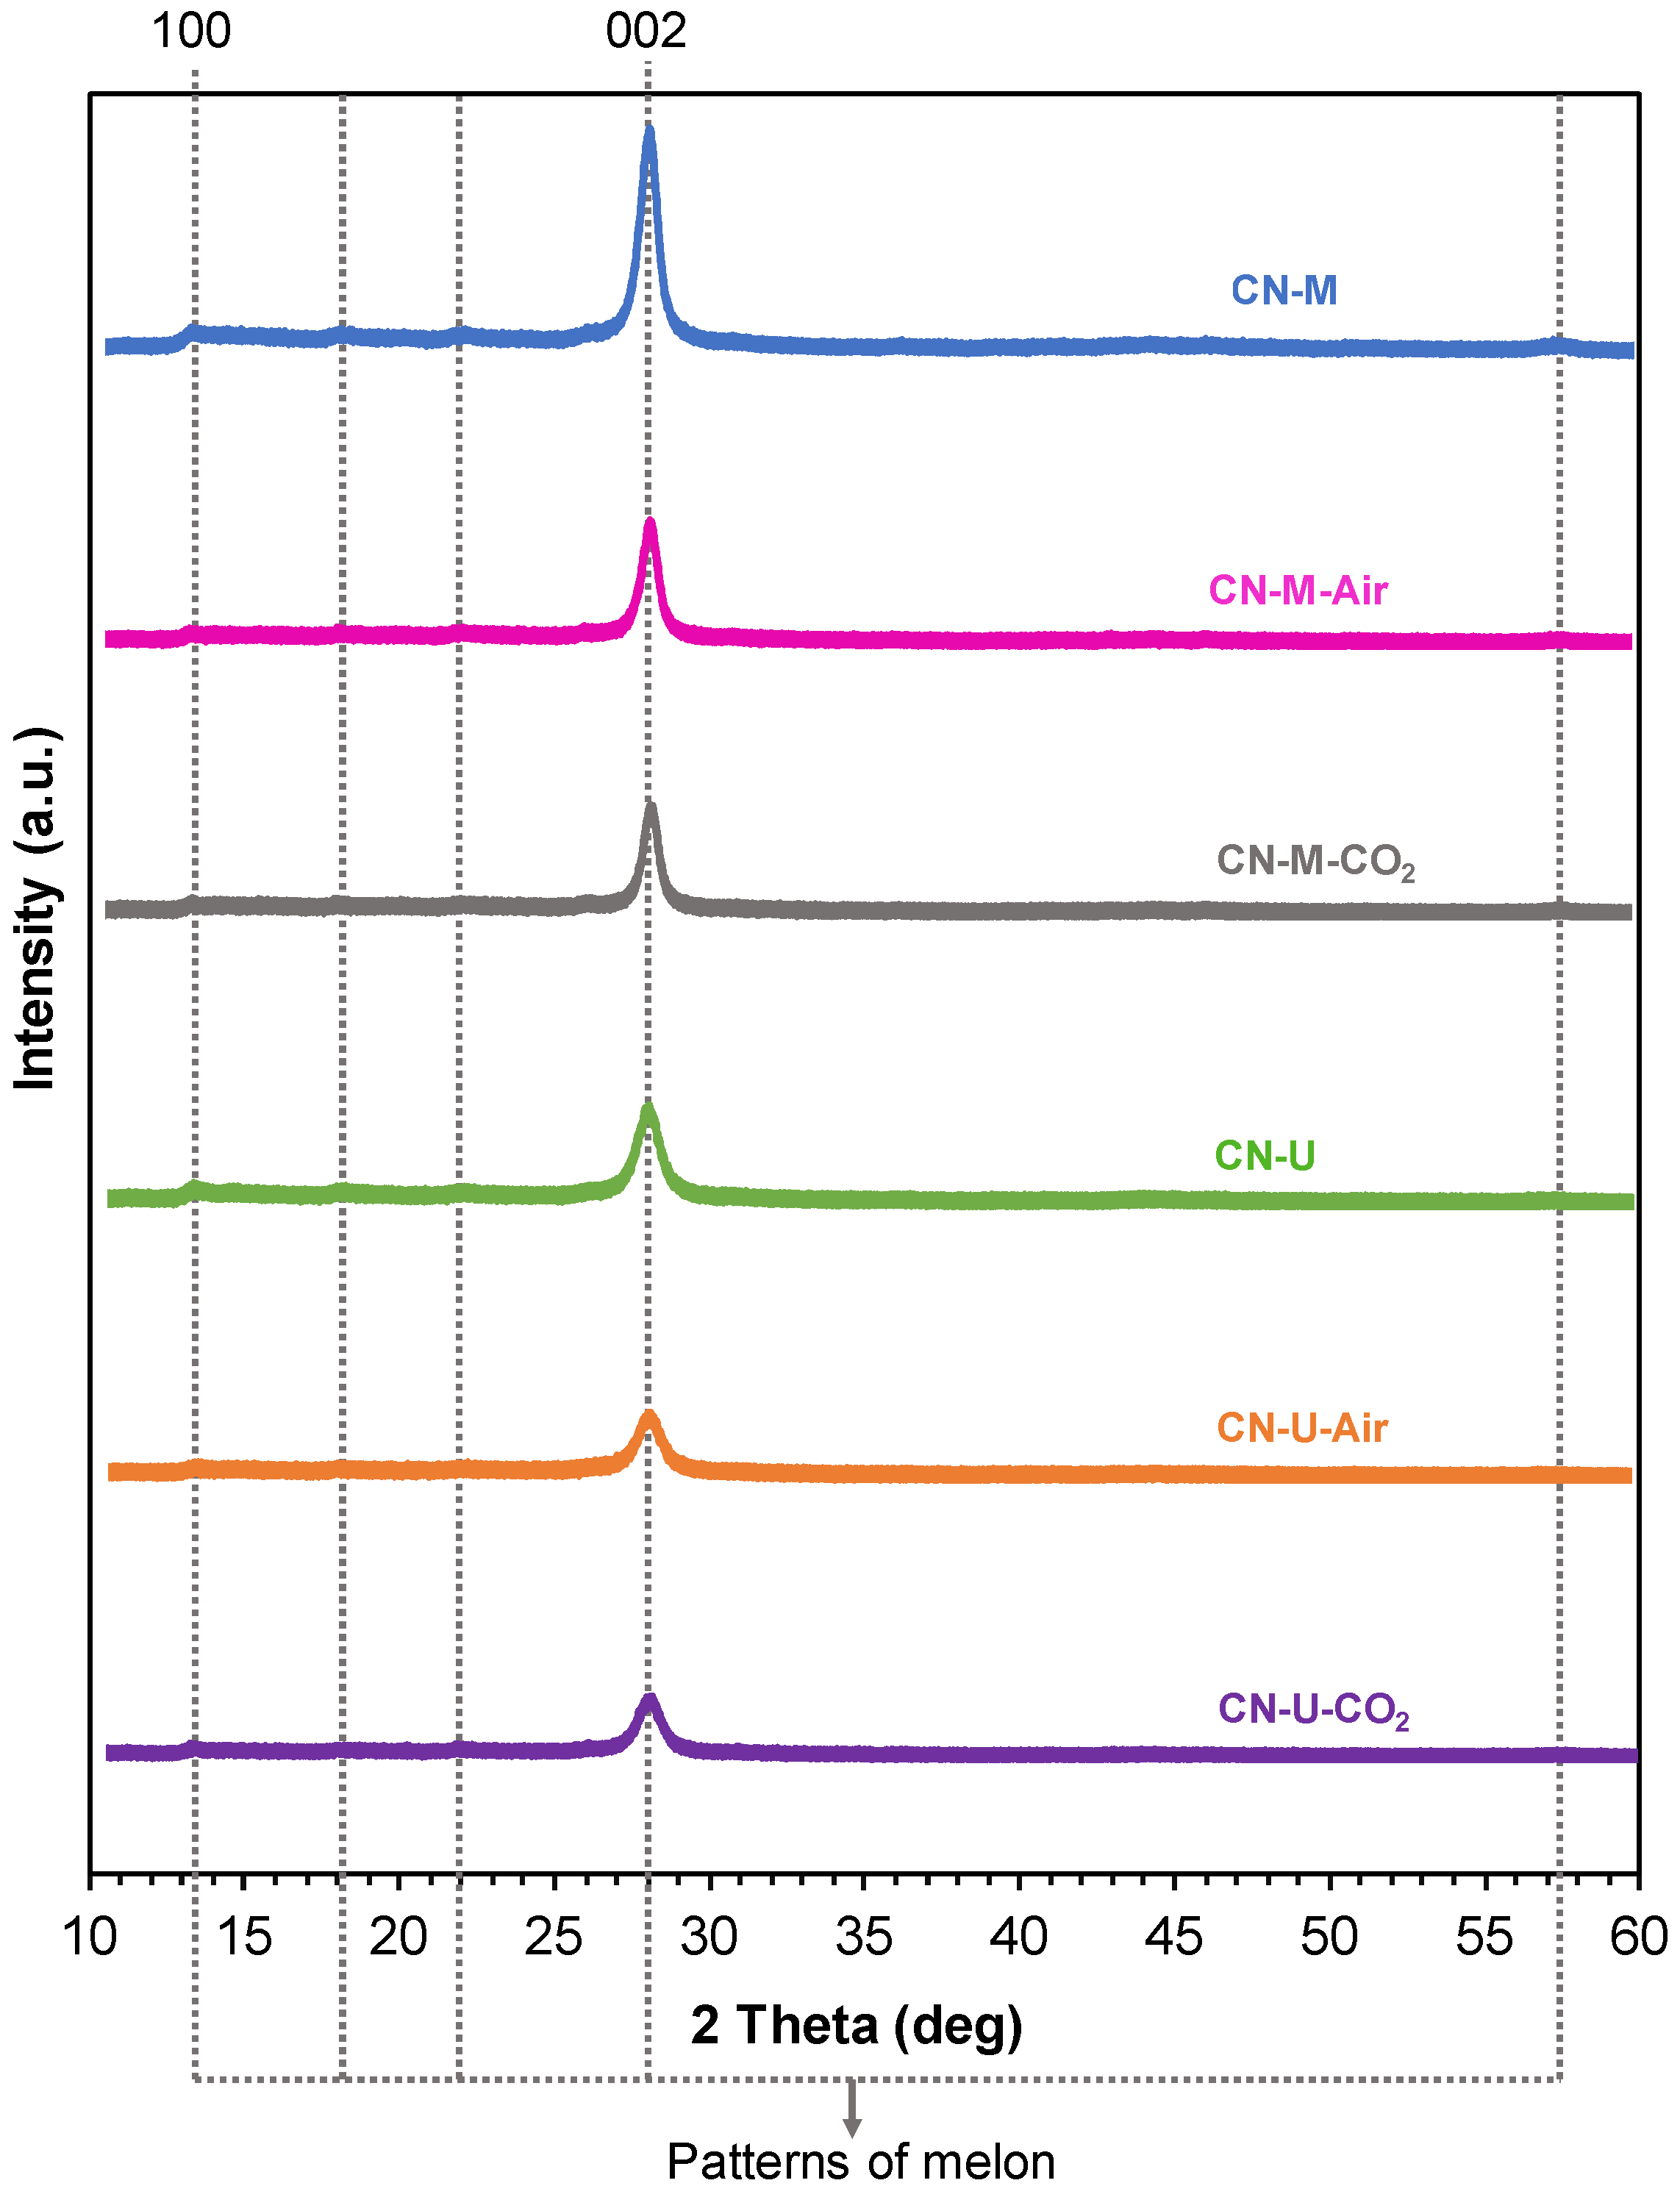
Figure 8.
Enlargement of the (002) XRD peak corresponding to the interlayer stacking of π-conjugated aromatic systems of: (a) CNs synthesized from melamine and (b) CNs synthesized from urea. Within the images the position (2θ) and the full width at half maximum (FWHM) of each peak is specified.
Figure 8.
Enlargement of the (002) XRD peak corresponding to the interlayer stacking of π-conjugated aromatic systems of: (a) CNs synthesized from melamine and (b) CNs synthesized from urea. Within the images the position (2θ) and the full width at half maximum (FWHM) of each peak is specified.
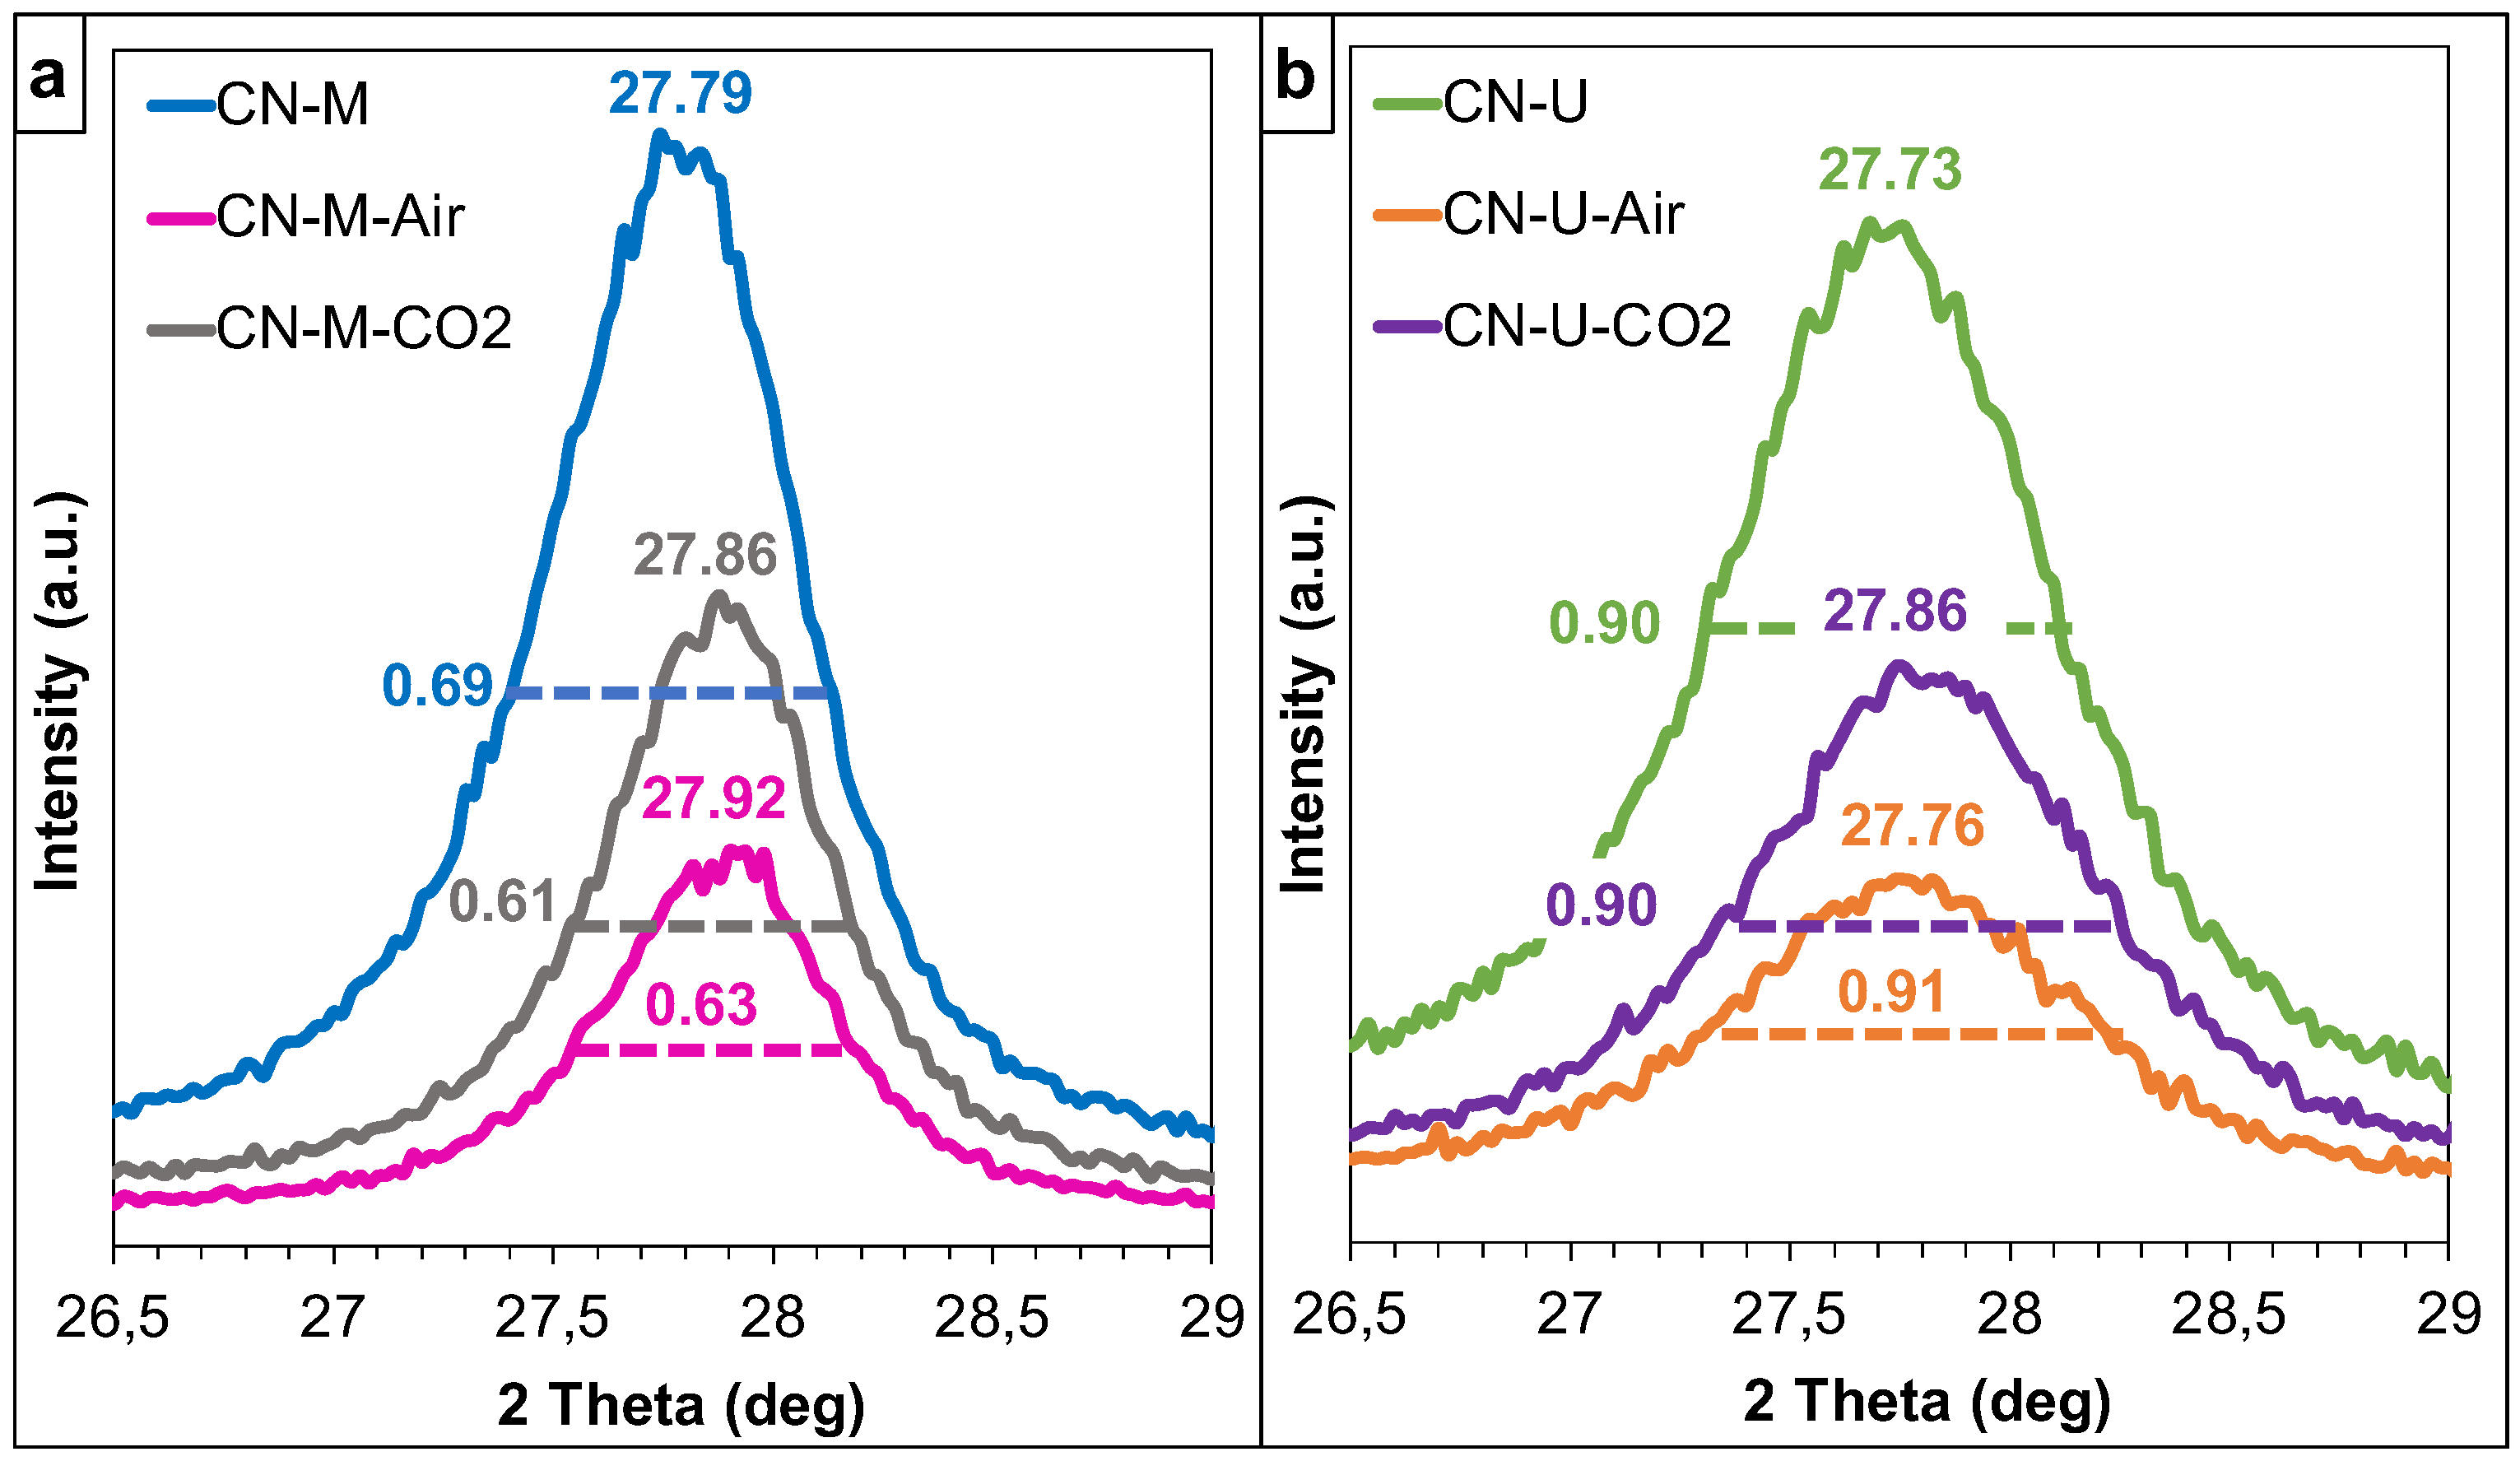
Figure 9.
HRTEM images of CNs samples.
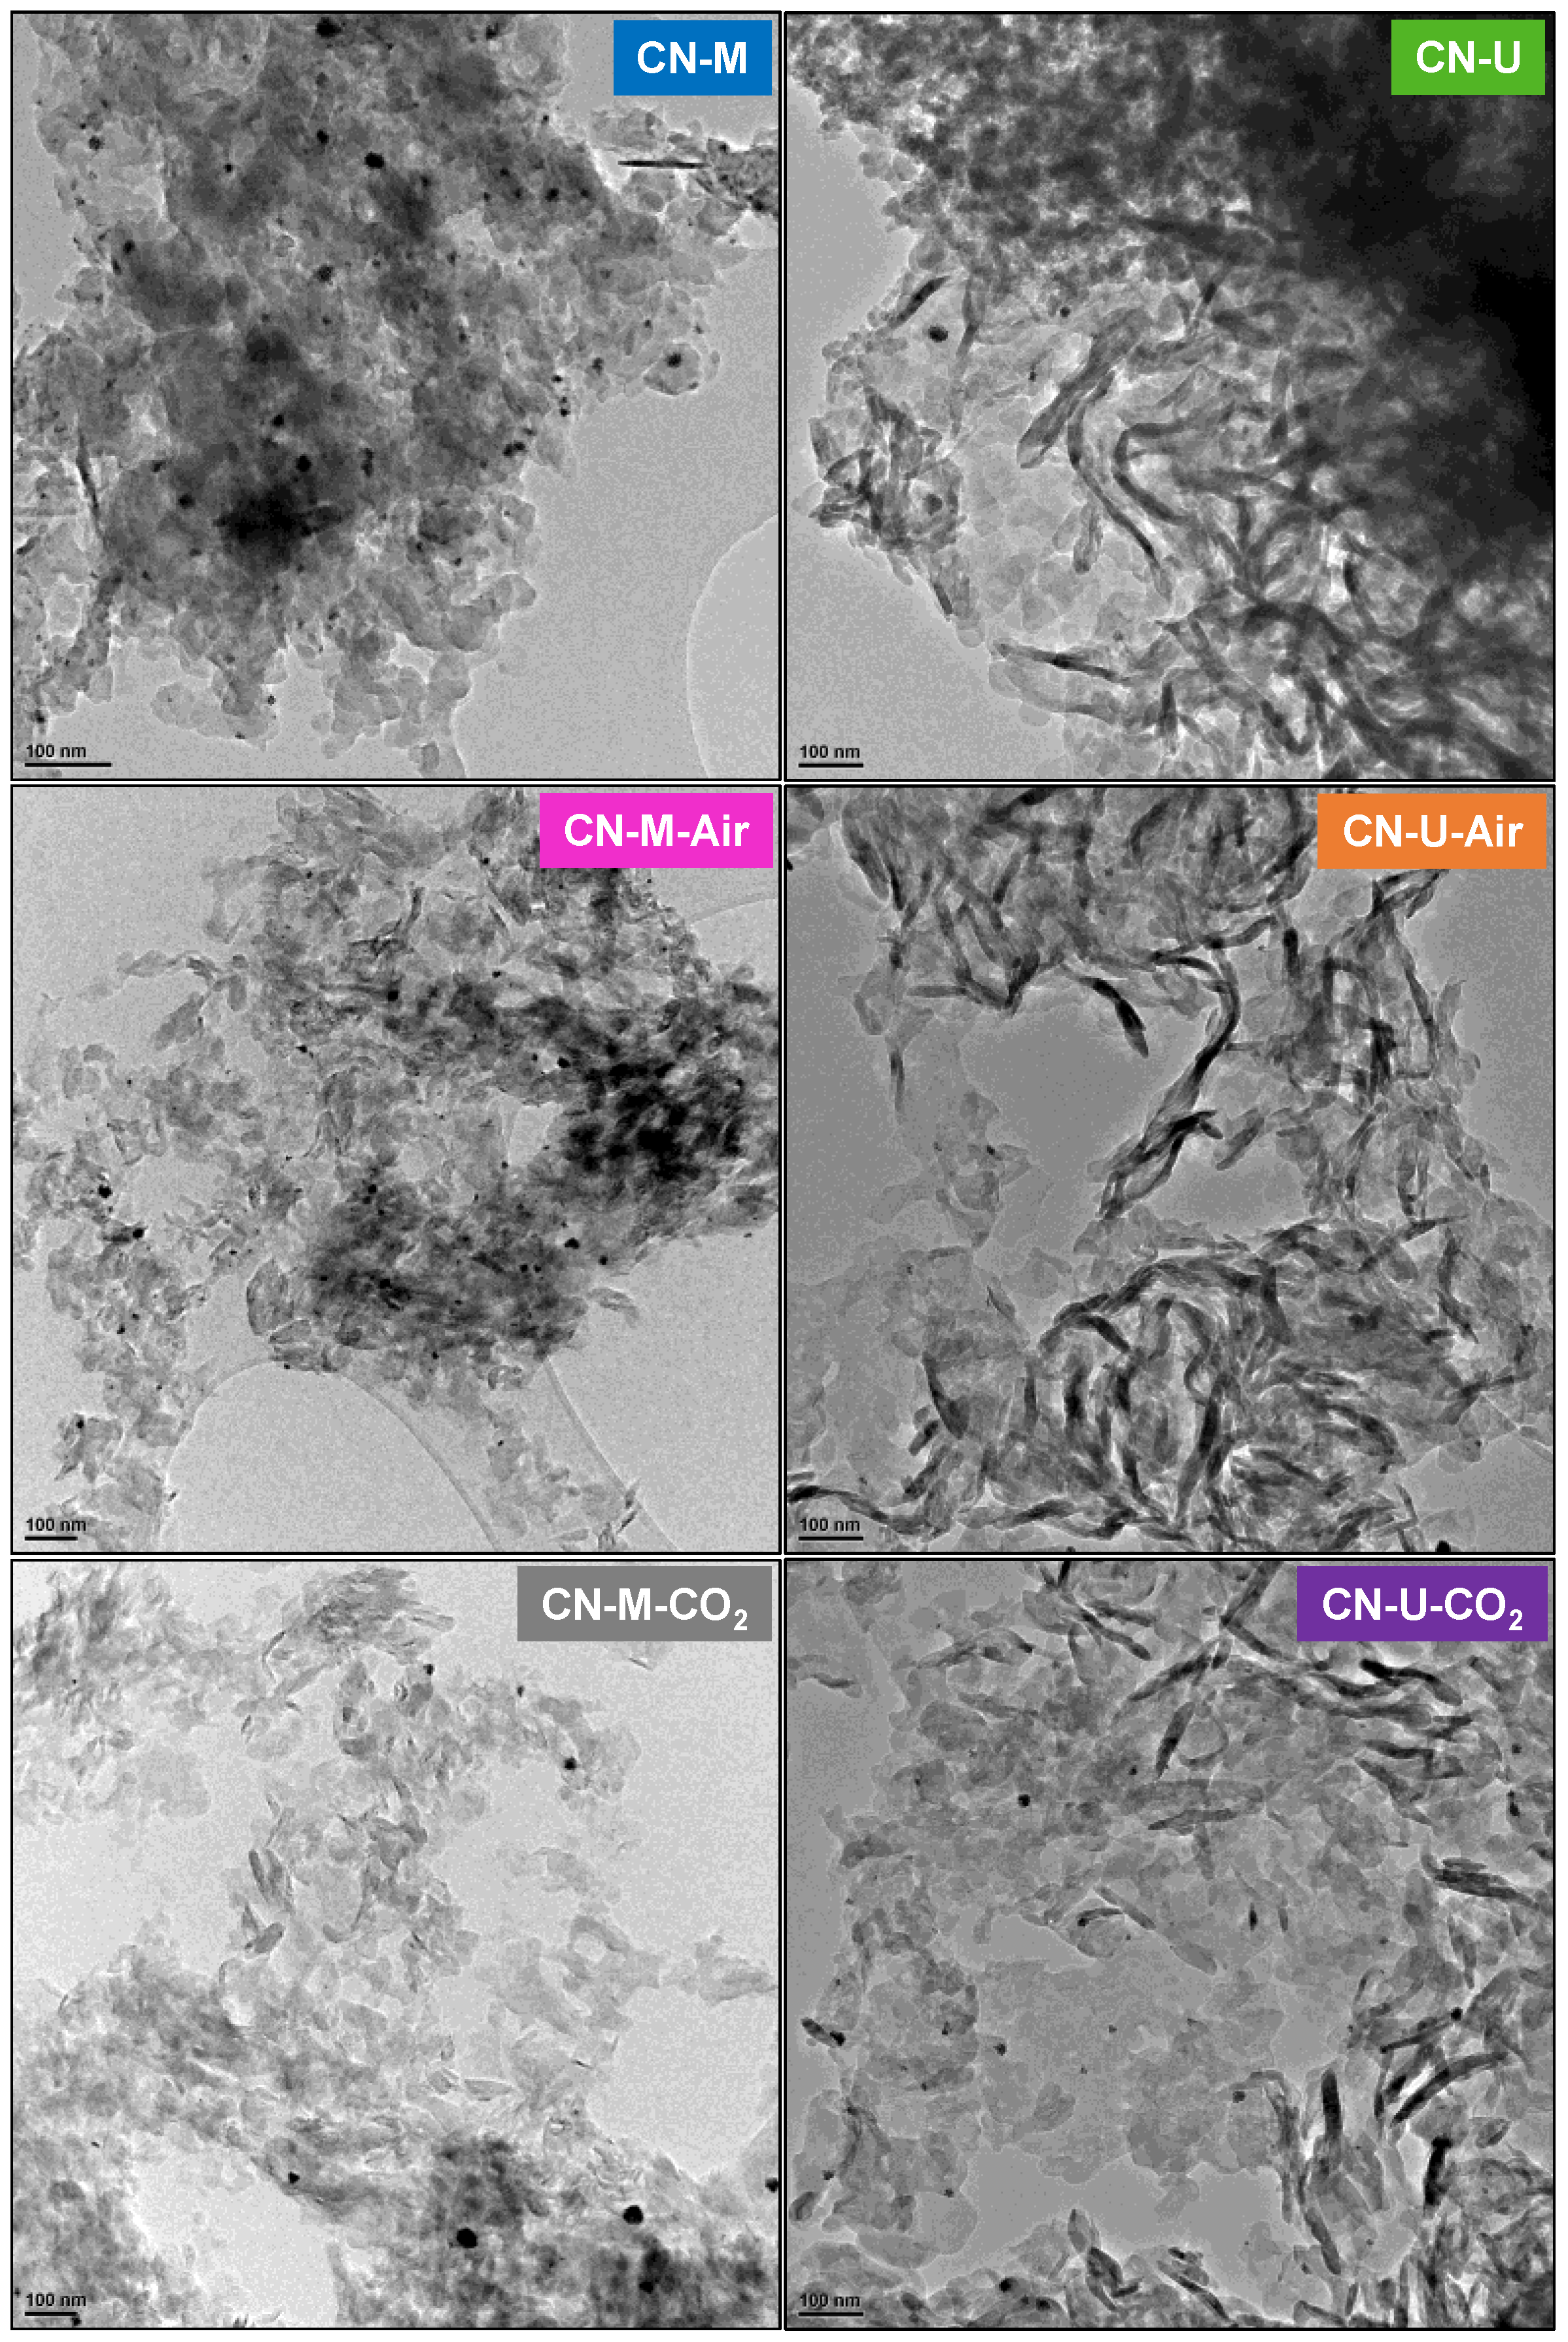
Figure 10.
HRTEM images of CNs. The arrows indicate the areas where the smallest Pt NPs have been found. Insets show the histograms of Pt NPs, the mean and the number of particles analyzed.
Figure 10.
HRTEM images of CNs. The arrows indicate the areas where the smallest Pt NPs have been found. Insets show the histograms of Pt NPs, the mean and the number of particles analyzed.
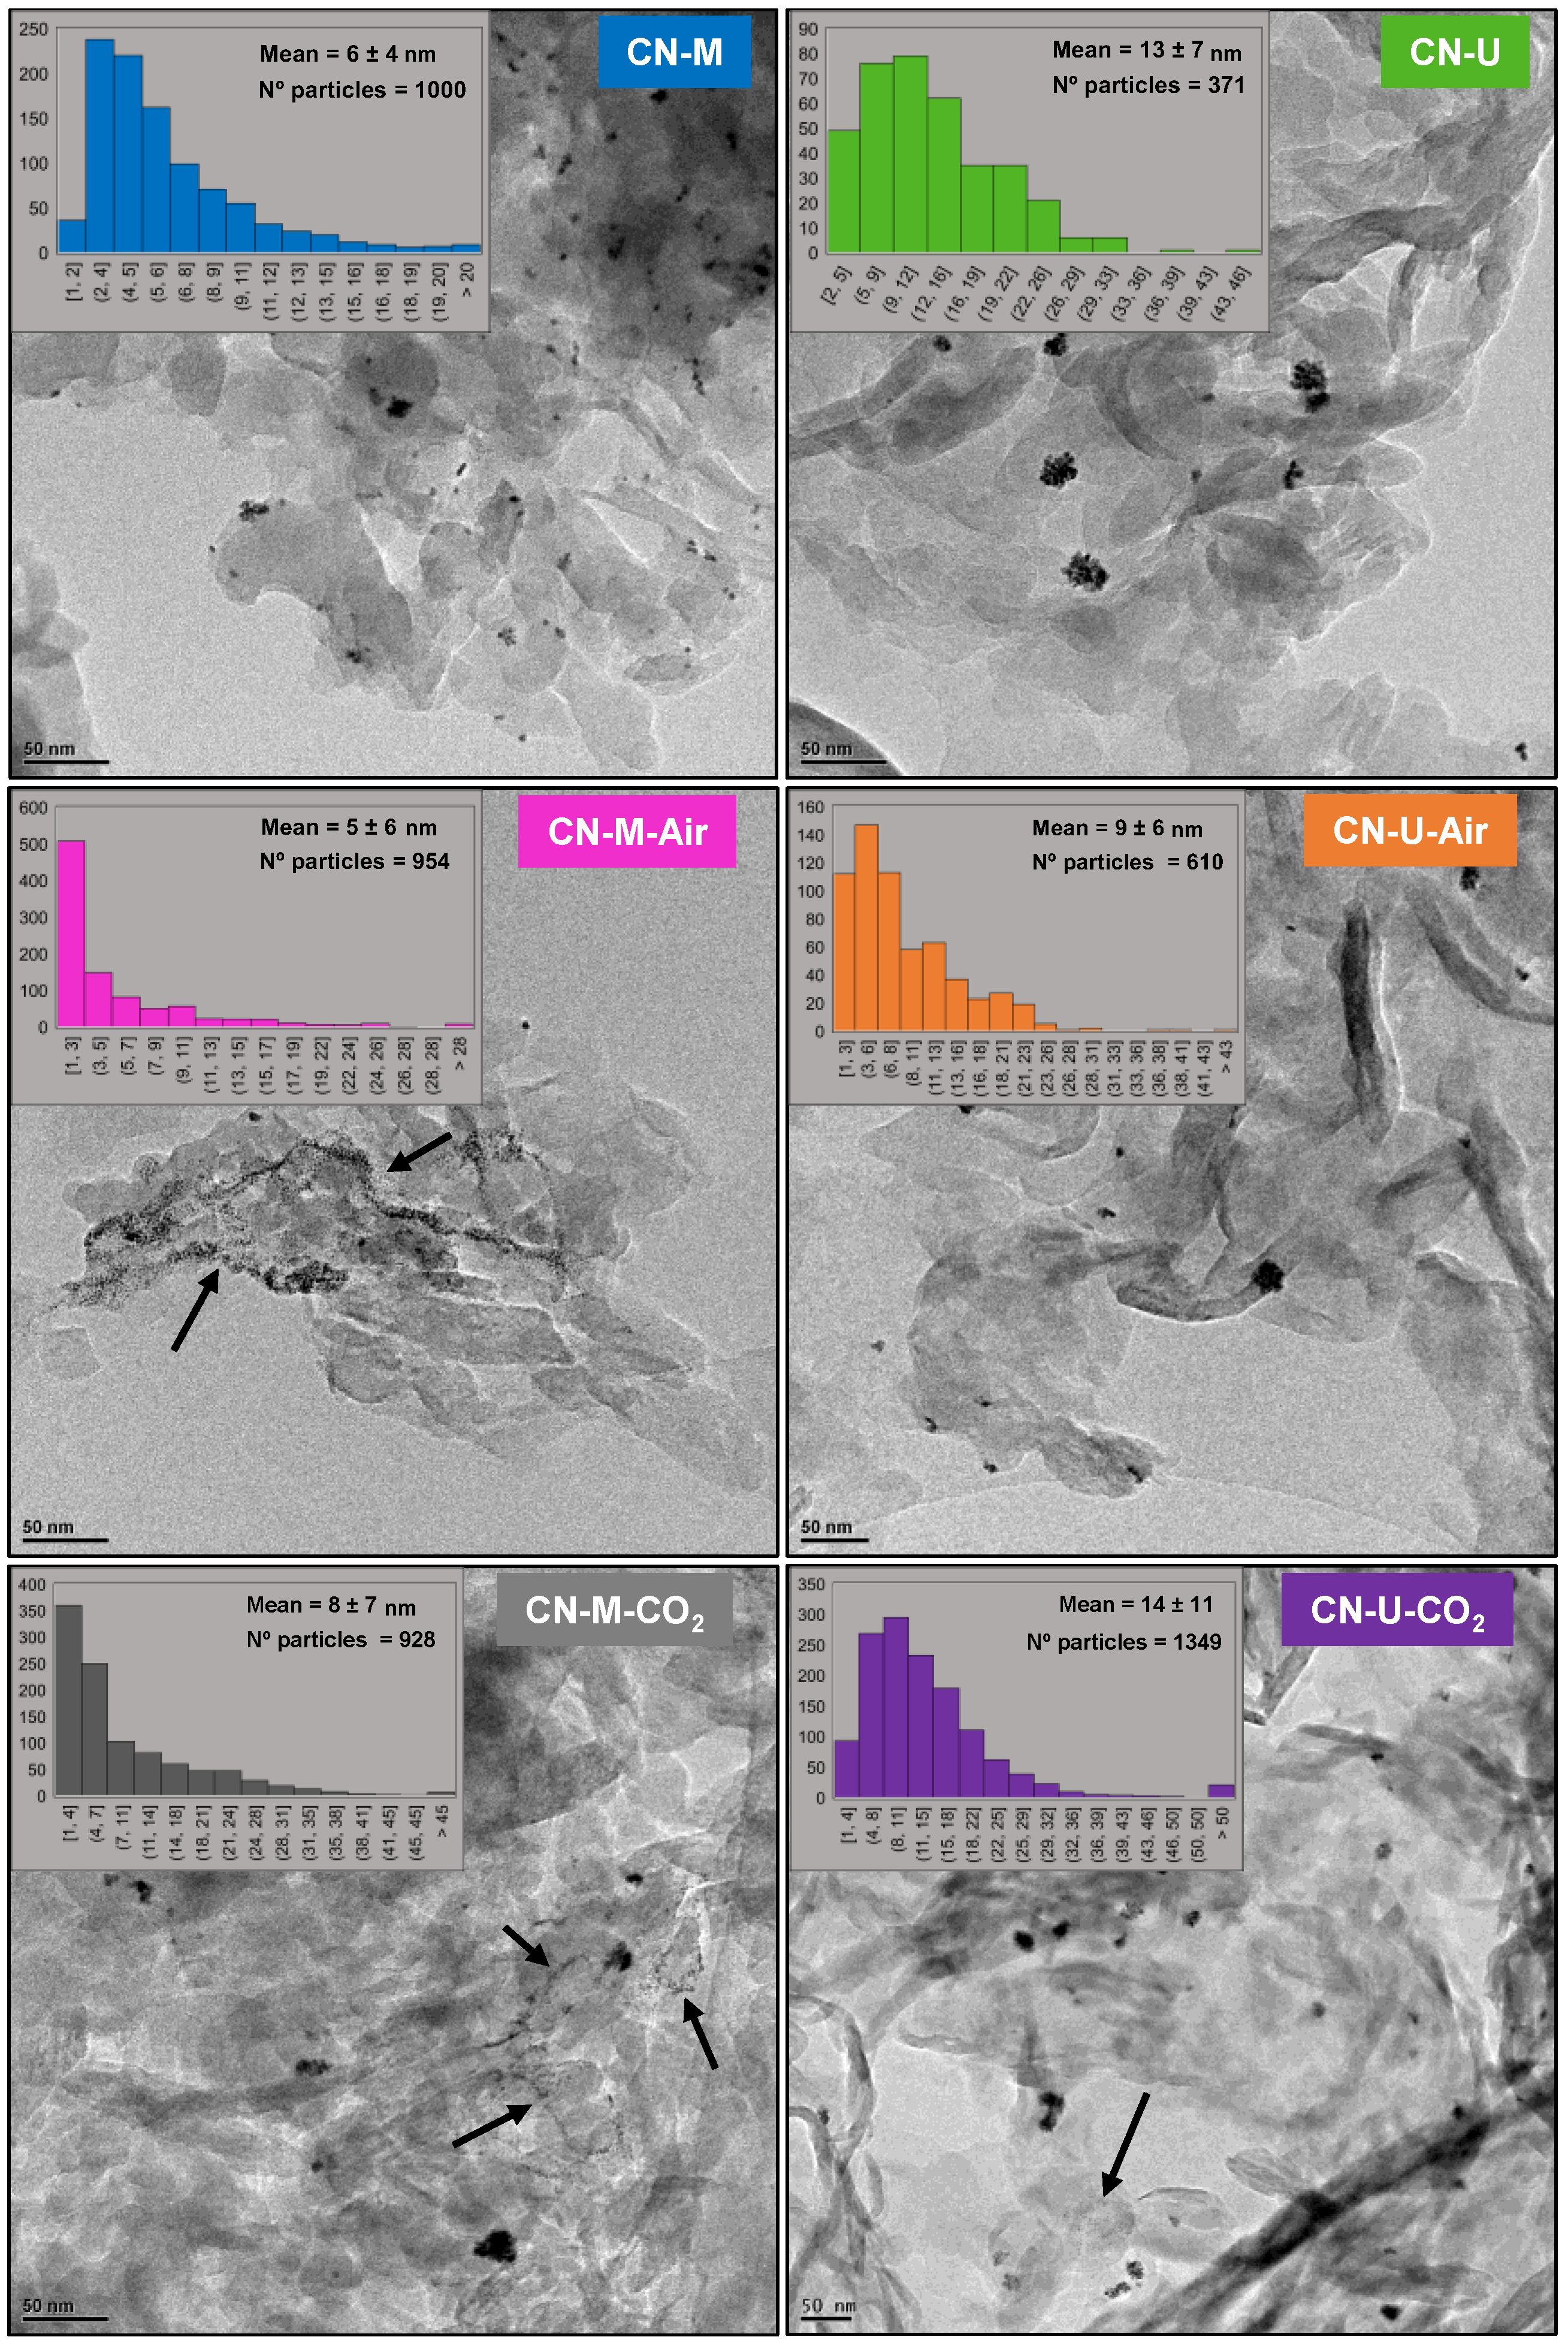
Figure 11.
N2-sorption isotherms and pore size distribution for the CN samples.
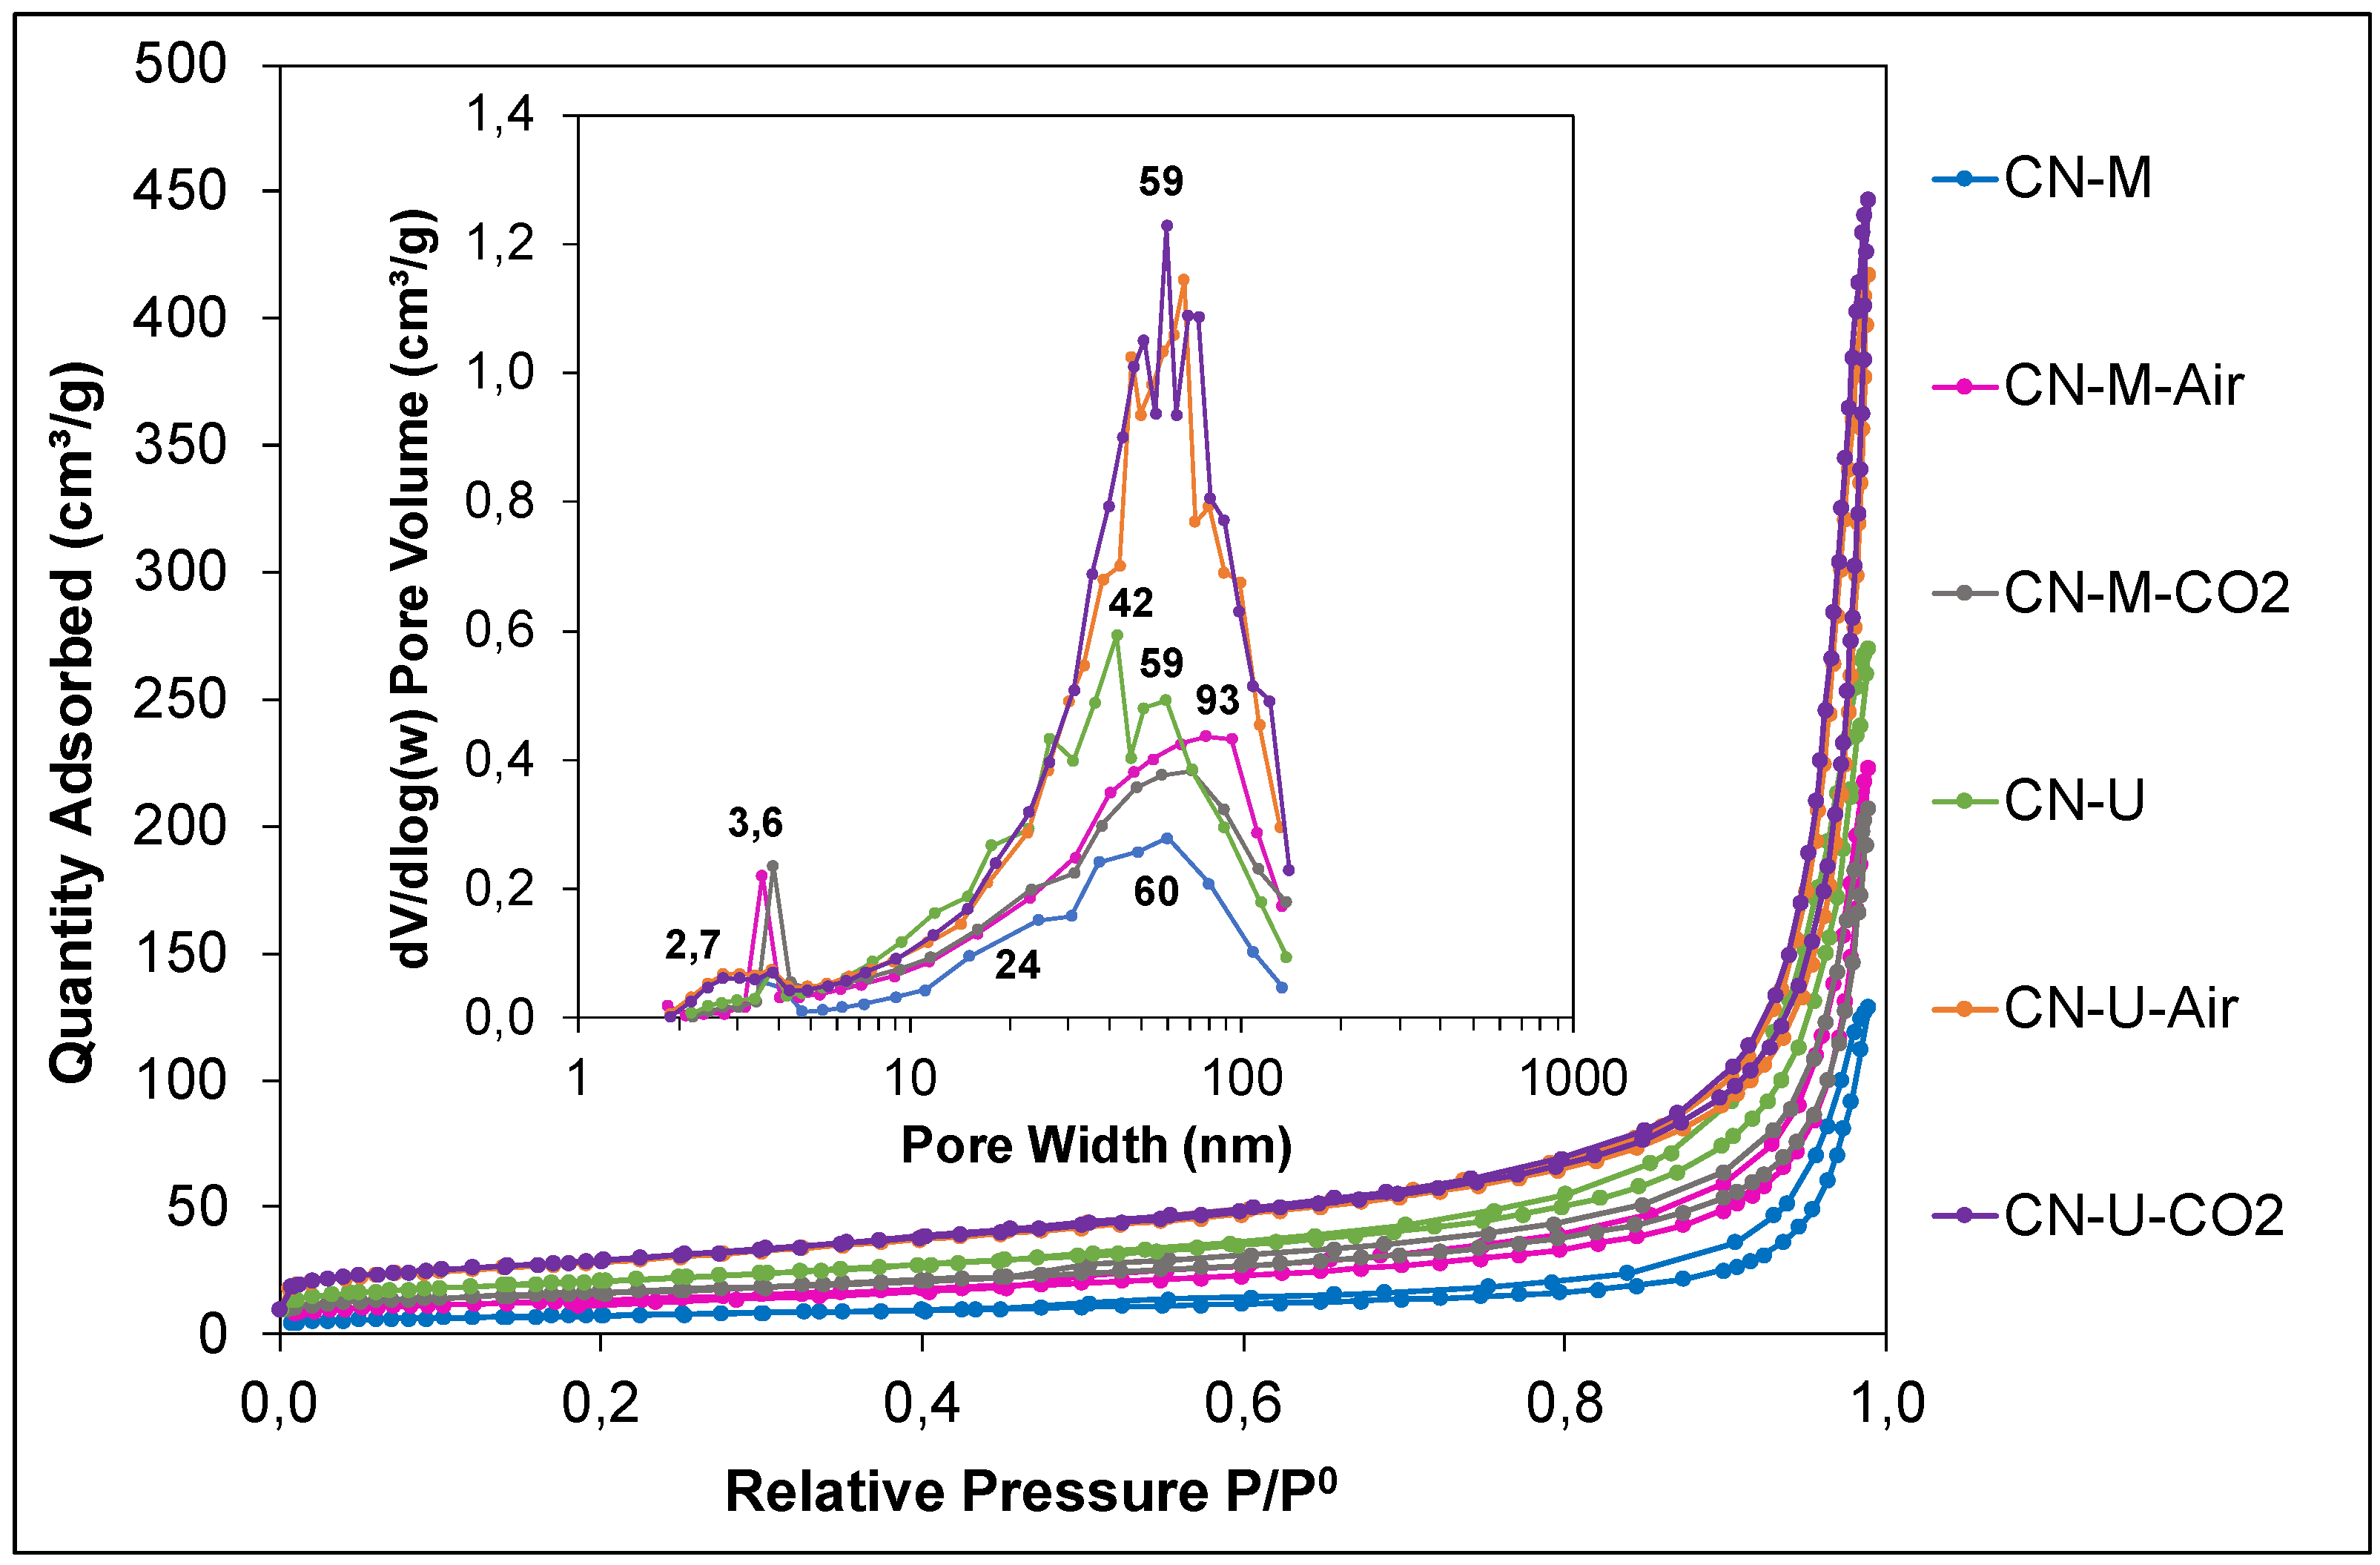
Figure 12.
DTG curves of the decomposition process of CN samples when heated at 10 ºC/min under N2 atmosphere (300 ml/min).
Figure 12.
DTG curves of the decomposition process of CN samples when heated at 10 ºC/min under N2 atmosphere (300 ml/min).
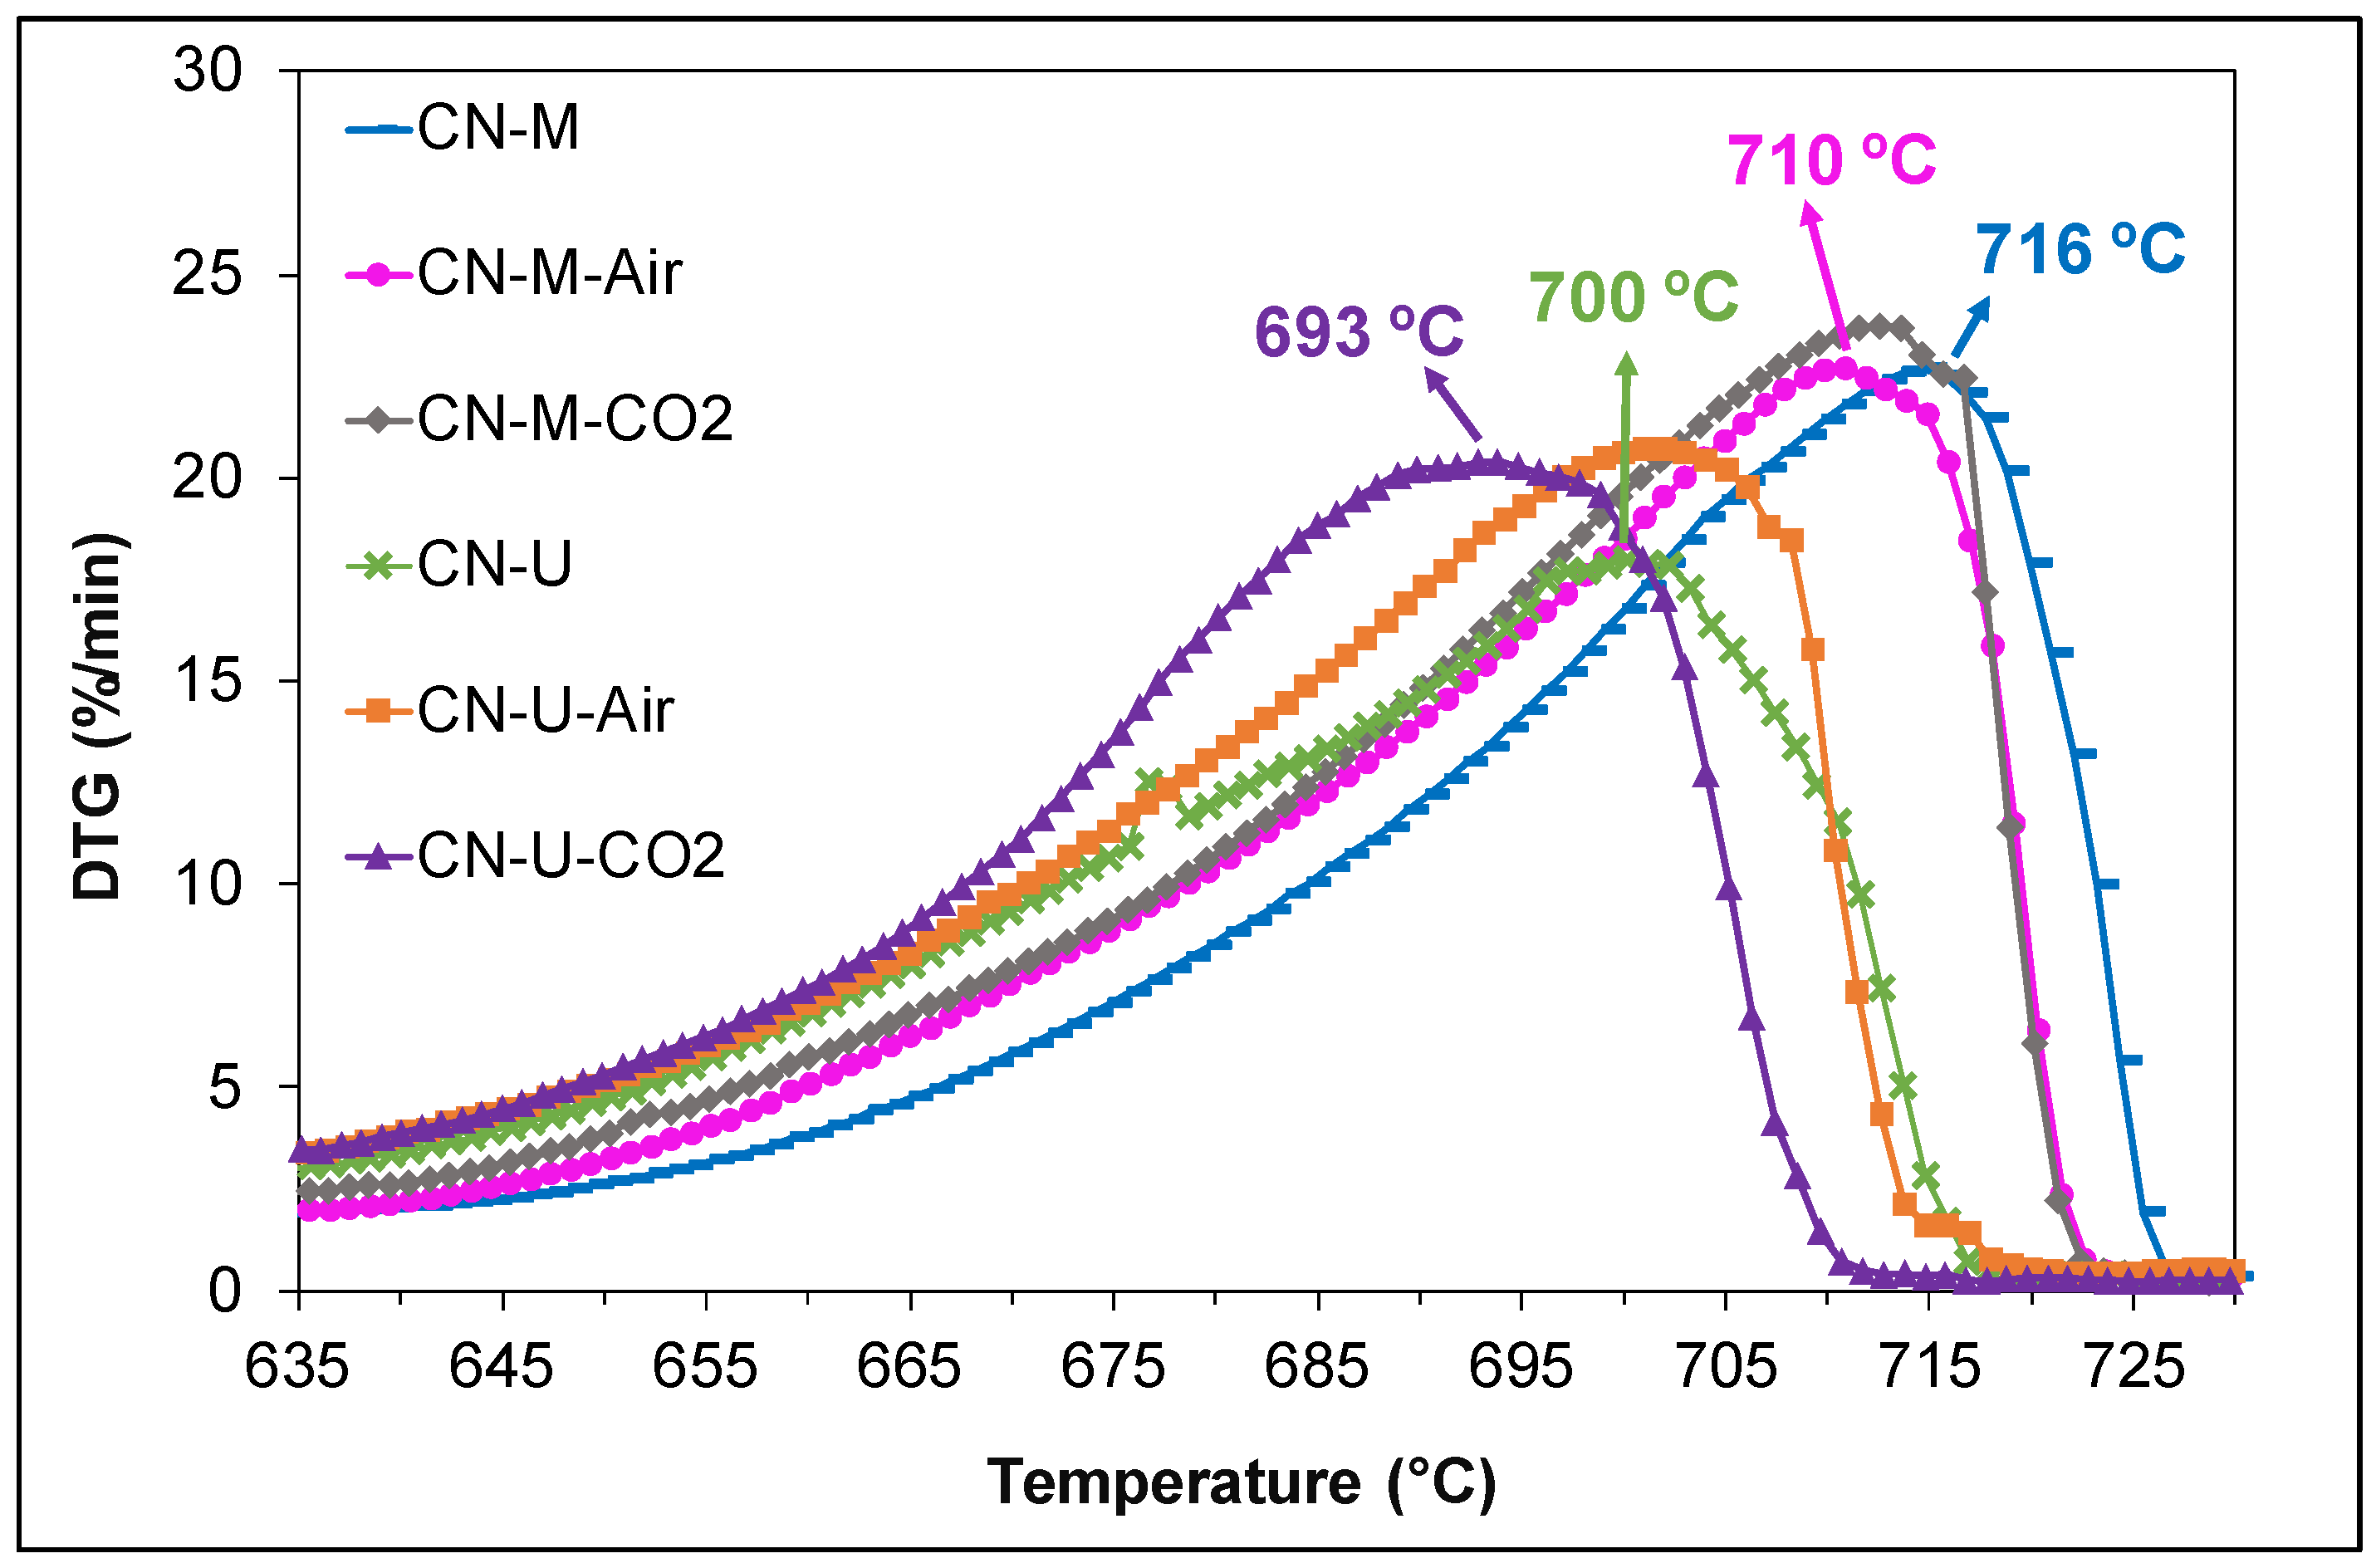
Figure 13.
UV-VIS diffuse reflectance spectra of CN-M-atm samples (a) and CN-U-atm samples (b). Insets show photographs of the photocatalysts. Kubelka-Munk plots of CN-M-atm samples (c) and CN-U-atm samples (d), showing fits to obtain the band gaps.
Figure 13.
UV-VIS diffuse reflectance spectra of CN-M-atm samples (a) and CN-U-atm samples (b). Insets show photographs of the photocatalysts. Kubelka-Munk plots of CN-M-atm samples (c) and CN-U-atm samples (d), showing fits to obtain the band gaps.
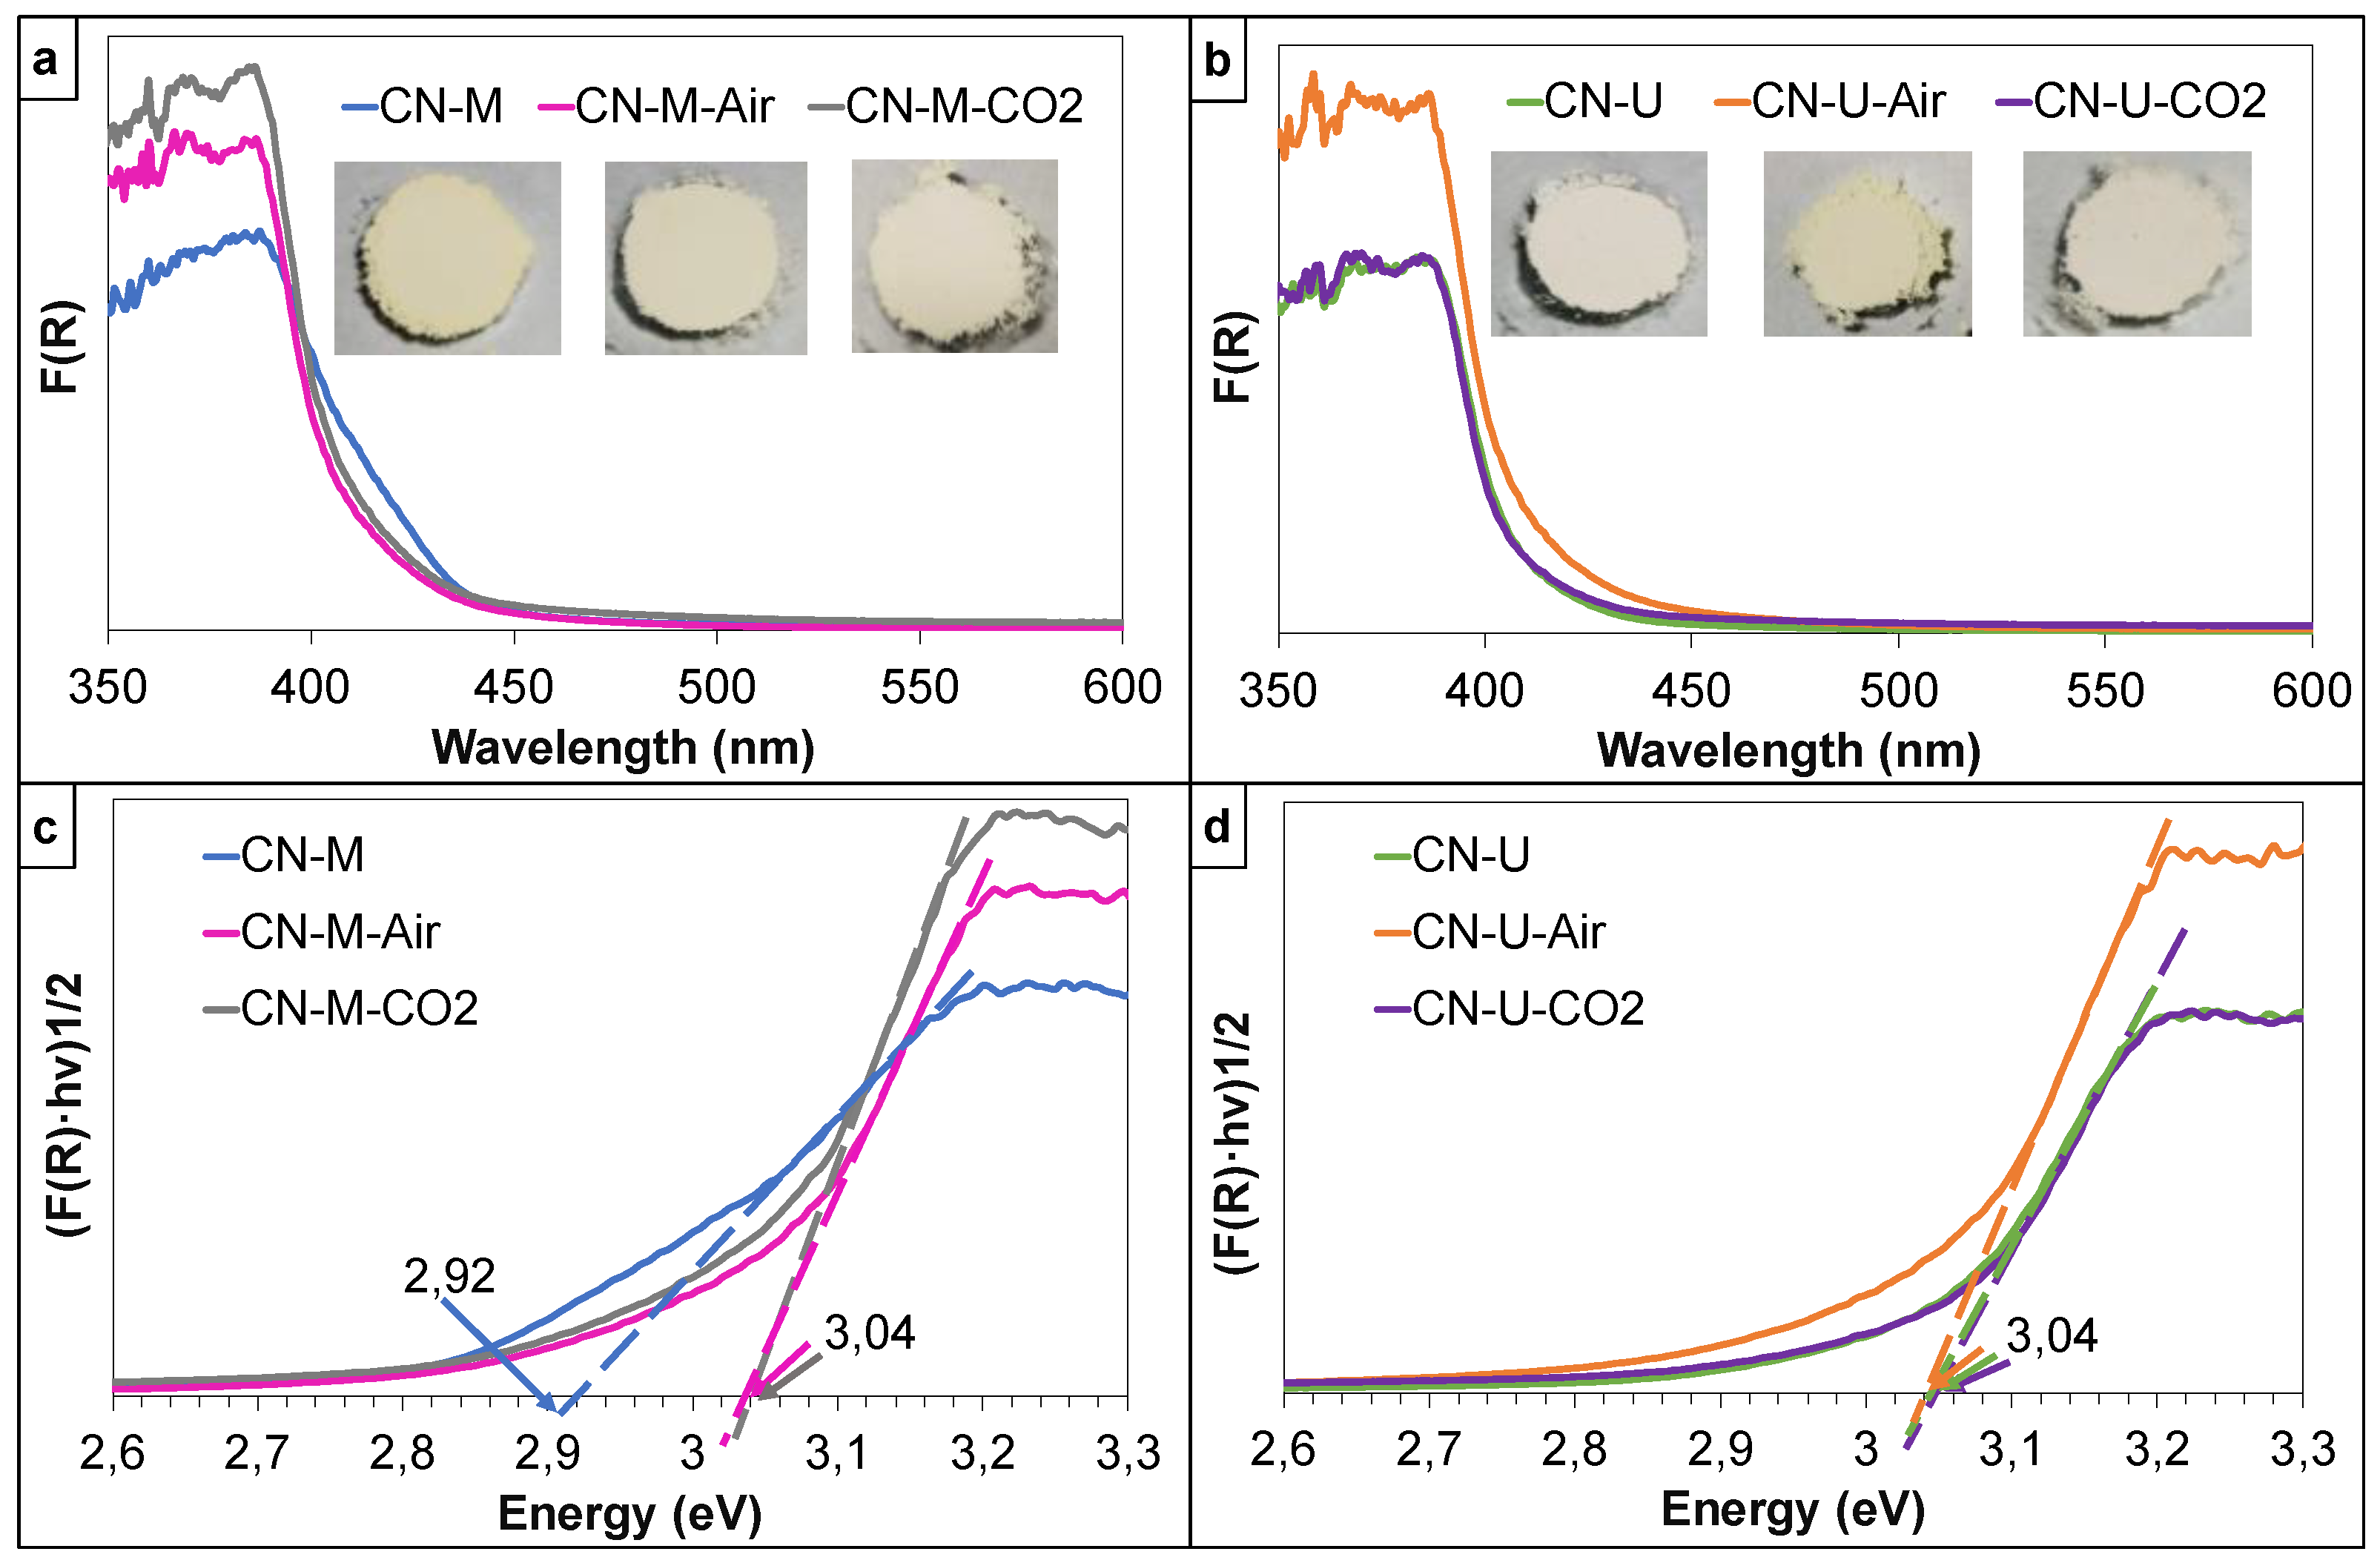
Figure 14.
Comparison of the H2 evolution rate of CN photocatalysts. The P values are indicated at the top of the graph (a). Photocatalytic H2 evolution of all CN photocatalysts for 4 hours (b).
Figure 14.
Comparison of the H2 evolution rate of CN photocatalysts. The P values are indicated at the top of the graph (a). Photocatalytic H2 evolution of all CN photocatalysts for 4 hours (b).
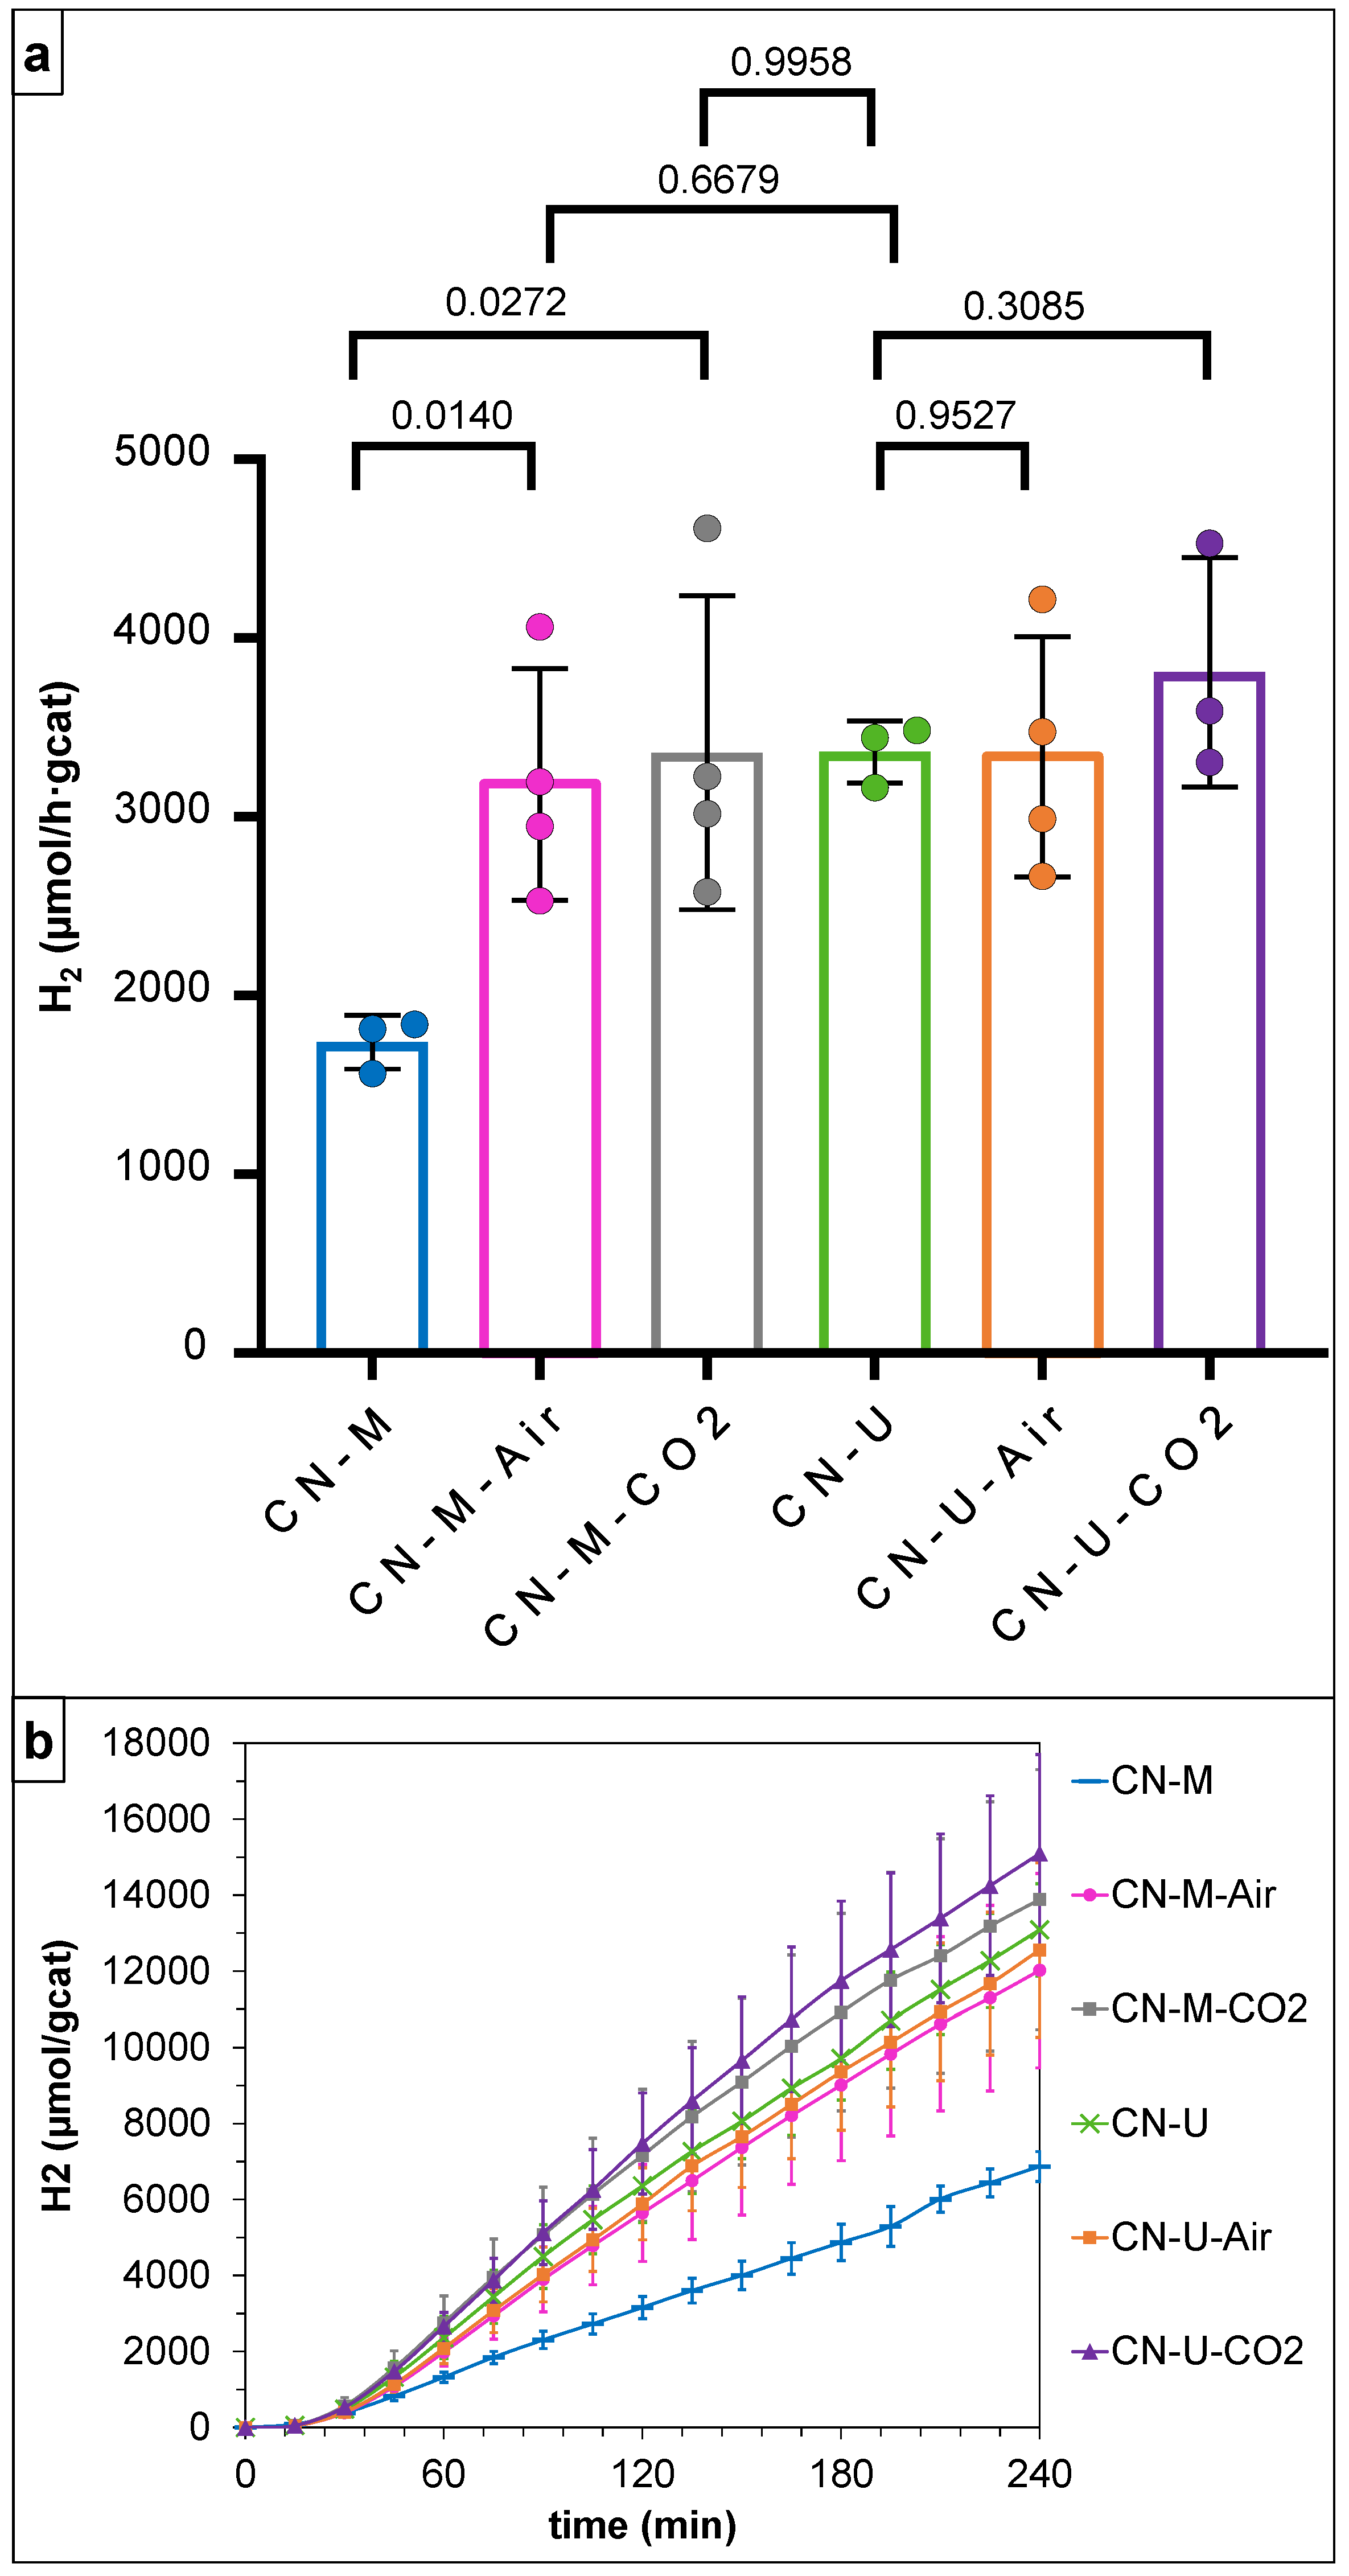
Figure 15.
Stability of CN-M and CN-M-Air for the photocatalytic H2 evolution for 12 h.
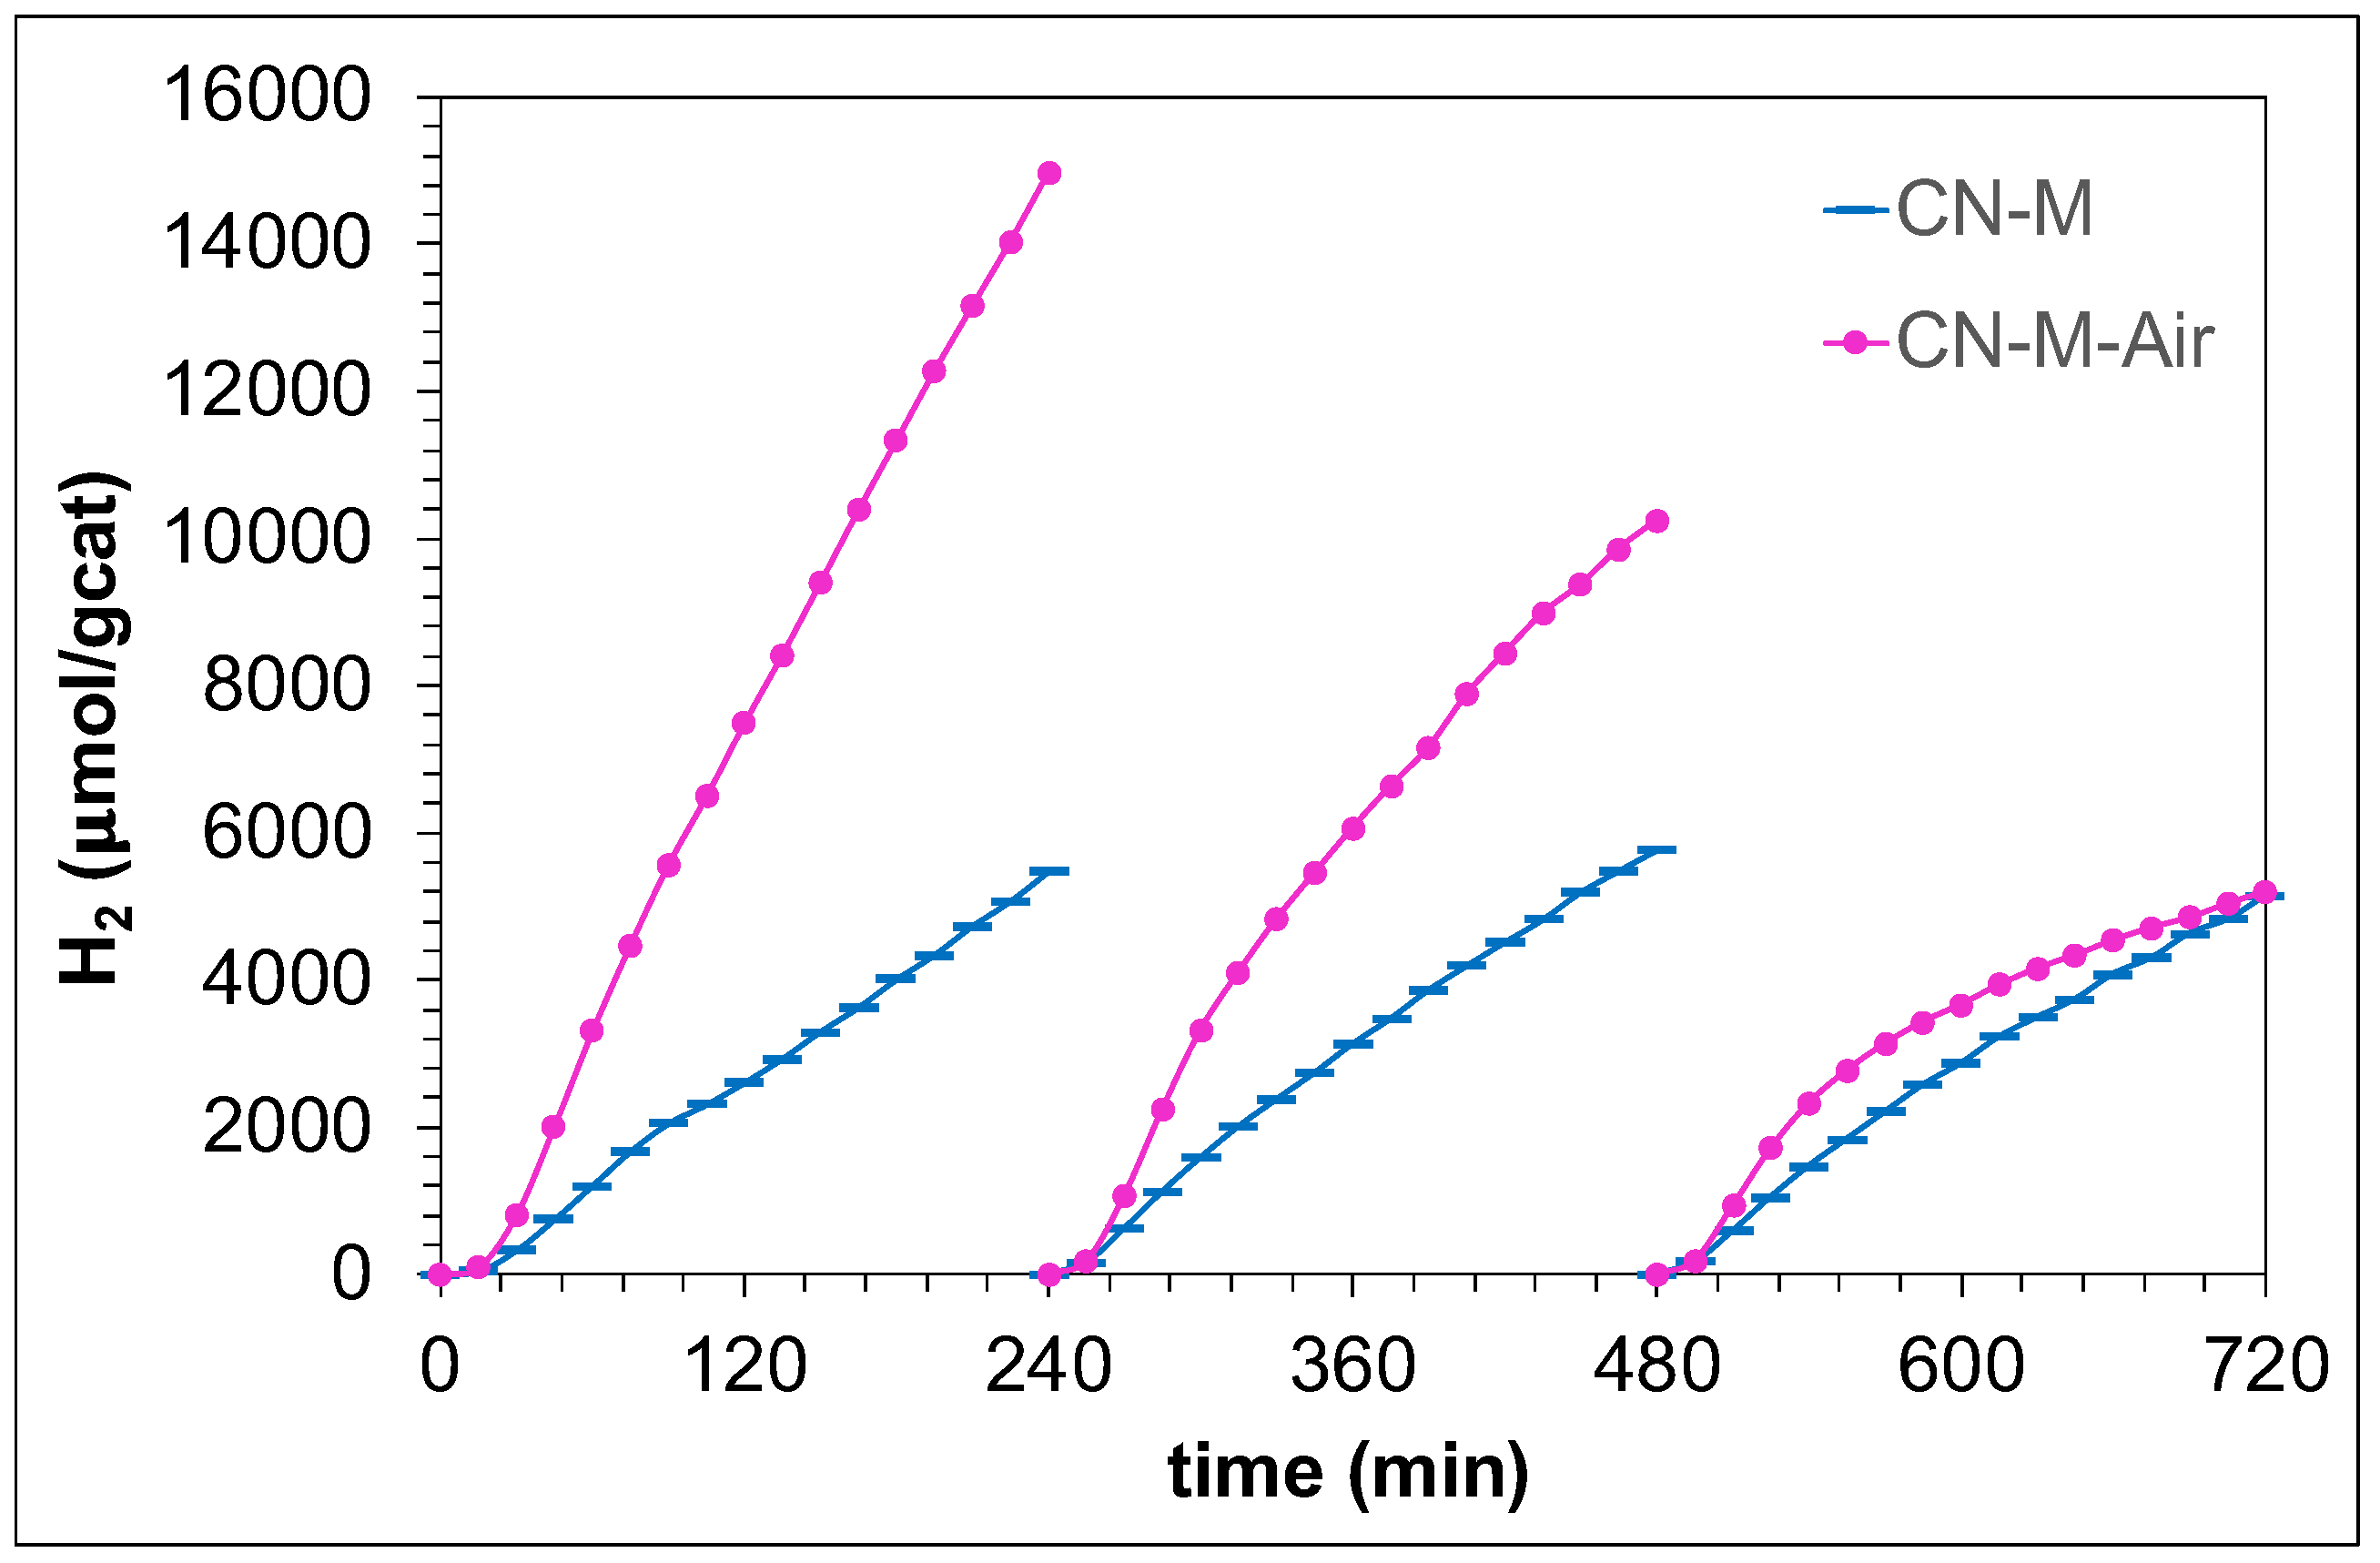
Table 1.
Elemental analysis and C/N atomic ratio.
| Sample | C (wt.%) | H (wt.%) |
N (wt.%) | O (wt.%) |
C/N (a. r.)a |
|---|---|---|---|---|---|
| CN-M | 35.7 | 1.6 | 62.2 | 1.1 | 0.67 |
| CN-M-Air | 35.7 | 1.6 | 61.8 | 1.1 | 0.67 |
| CN-M-CO2 | 35.7 | 1.6 | 61.8 | 1.1 | 0.67 |
| CN-U | 35.3 | 1.6 | 61.3 | 1.6 | 0.67 |
| CN-U-Air | 35.4 | 1.6 | 60.7 | 1.7 | 0.68 |
| CN-U-CO2 | 35.6 | 1.6 | 61.4 | 1.3 | 0.68 |
a Atomic ratio.
Table 2.
FTIR, XPS and NMR indices.
| Scheme | 2. ringa. | ACN2(NHx)/ ACN3 |
|---|---|---|
| CN-M | 80 | 2.0 |
| CN-M-Air | 77 | 2.0 |
| CN-M-CO2 | 78 | 2.0 |
| CN-U | 77 | 1.9 |
| CN-U-Air | 78 | 1.9 |
| CN-U-CO2 | 77 | 1.8 |
aHNH2/Hring index calculated with the height of the bands at 1625 cm-1 (HNH2) and 1450 cm-1 (Hring).
Table 2.
In-plane distance of the tri-s-triazine (dTSTZN) and s-triazine (dSTZN) units, the interlayer distance of the layer stack (dinterlayer), the average thickness of graphitic stacks and the number of layers of CN samples.
Table 2.
In-plane distance of the tri-s-triazine (dTSTZN) and s-triazine (dSTZN) units, the interlayer distance of the layer stack (dinterlayer), the average thickness of graphitic stacks and the number of layers of CN samples.
| Sample | dTSTZN (Å) | dSTZN (Å) | dinterlayer (Å) | Thickness of stacks (nm) | No. layers |
|---|---|---|---|---|---|
| CN-M | 6.89 | 5.01 | 3.21 | 9.2 | 29 |
| CN-M-Air | 6.92 | 5.05 | 3.20 | 9.7 | 30 |
| CN-M-CO2 | 6.93 | 5.02 | 3.19 | 10.0 | 31 |
| CN-U | 6.93 | 4.98 | 3.21 | 7.1 | 22 |
| CN-U-Air | 6.88 | 5.04 | 3.21 | 6.8 | 21 |
| CN-U-CO2 | 6.94 | 4.99 | 3.20 | 7.0 | 22 |
Table 3.
The SBET, total pore volume and peak pore size for the CN samples.
| Sample | SBET (m2/g) | Total pore volume (cm3/g) | Peak pore size (nm) |
|---|---|---|---|
| CN-M | 26.3 | 0.108 | 60 |
| CN-M-Air | 47.7 | 0.180 | 93 |
| CN-M-CO2 | 58.4 | 0.177 | 70 |
| CN-U | 74.2 | 0.266 | 42 |
| CN-U-Air | 100.3 | 0.299 | 67 |
| CN-U-CO2 | 102.5 | 0.316 | 59 |
Disclaimer/Publisher’s Note: The statements, opinions and data contained in all publications are solely those of the individual author(s) and contributor(s) and not of MDPI and/or the editor(s). MDPI and/or the editor(s) disclaim responsibility for any injury to people or property resulting from any ideas, methods, instructions or products referred to in the content. |
© 2026 by the authors. Licensee MDPI, Basel, Switzerland. This article is an open access article distributed under the terms and conditions of the Creative Commons Attribution (CC BY) license (http://creativecommons.org/licenses/by/4.0/).
Copyright: This open access article is published under a Creative Commons CC BY 4.0 license, which permit the free download, distribution, and reuse, provided that the author and preprint are cited in any reuse.


