
Submitted:
16 January 2026
Posted:
19 January 2026
You are already at the latest version
Abstract
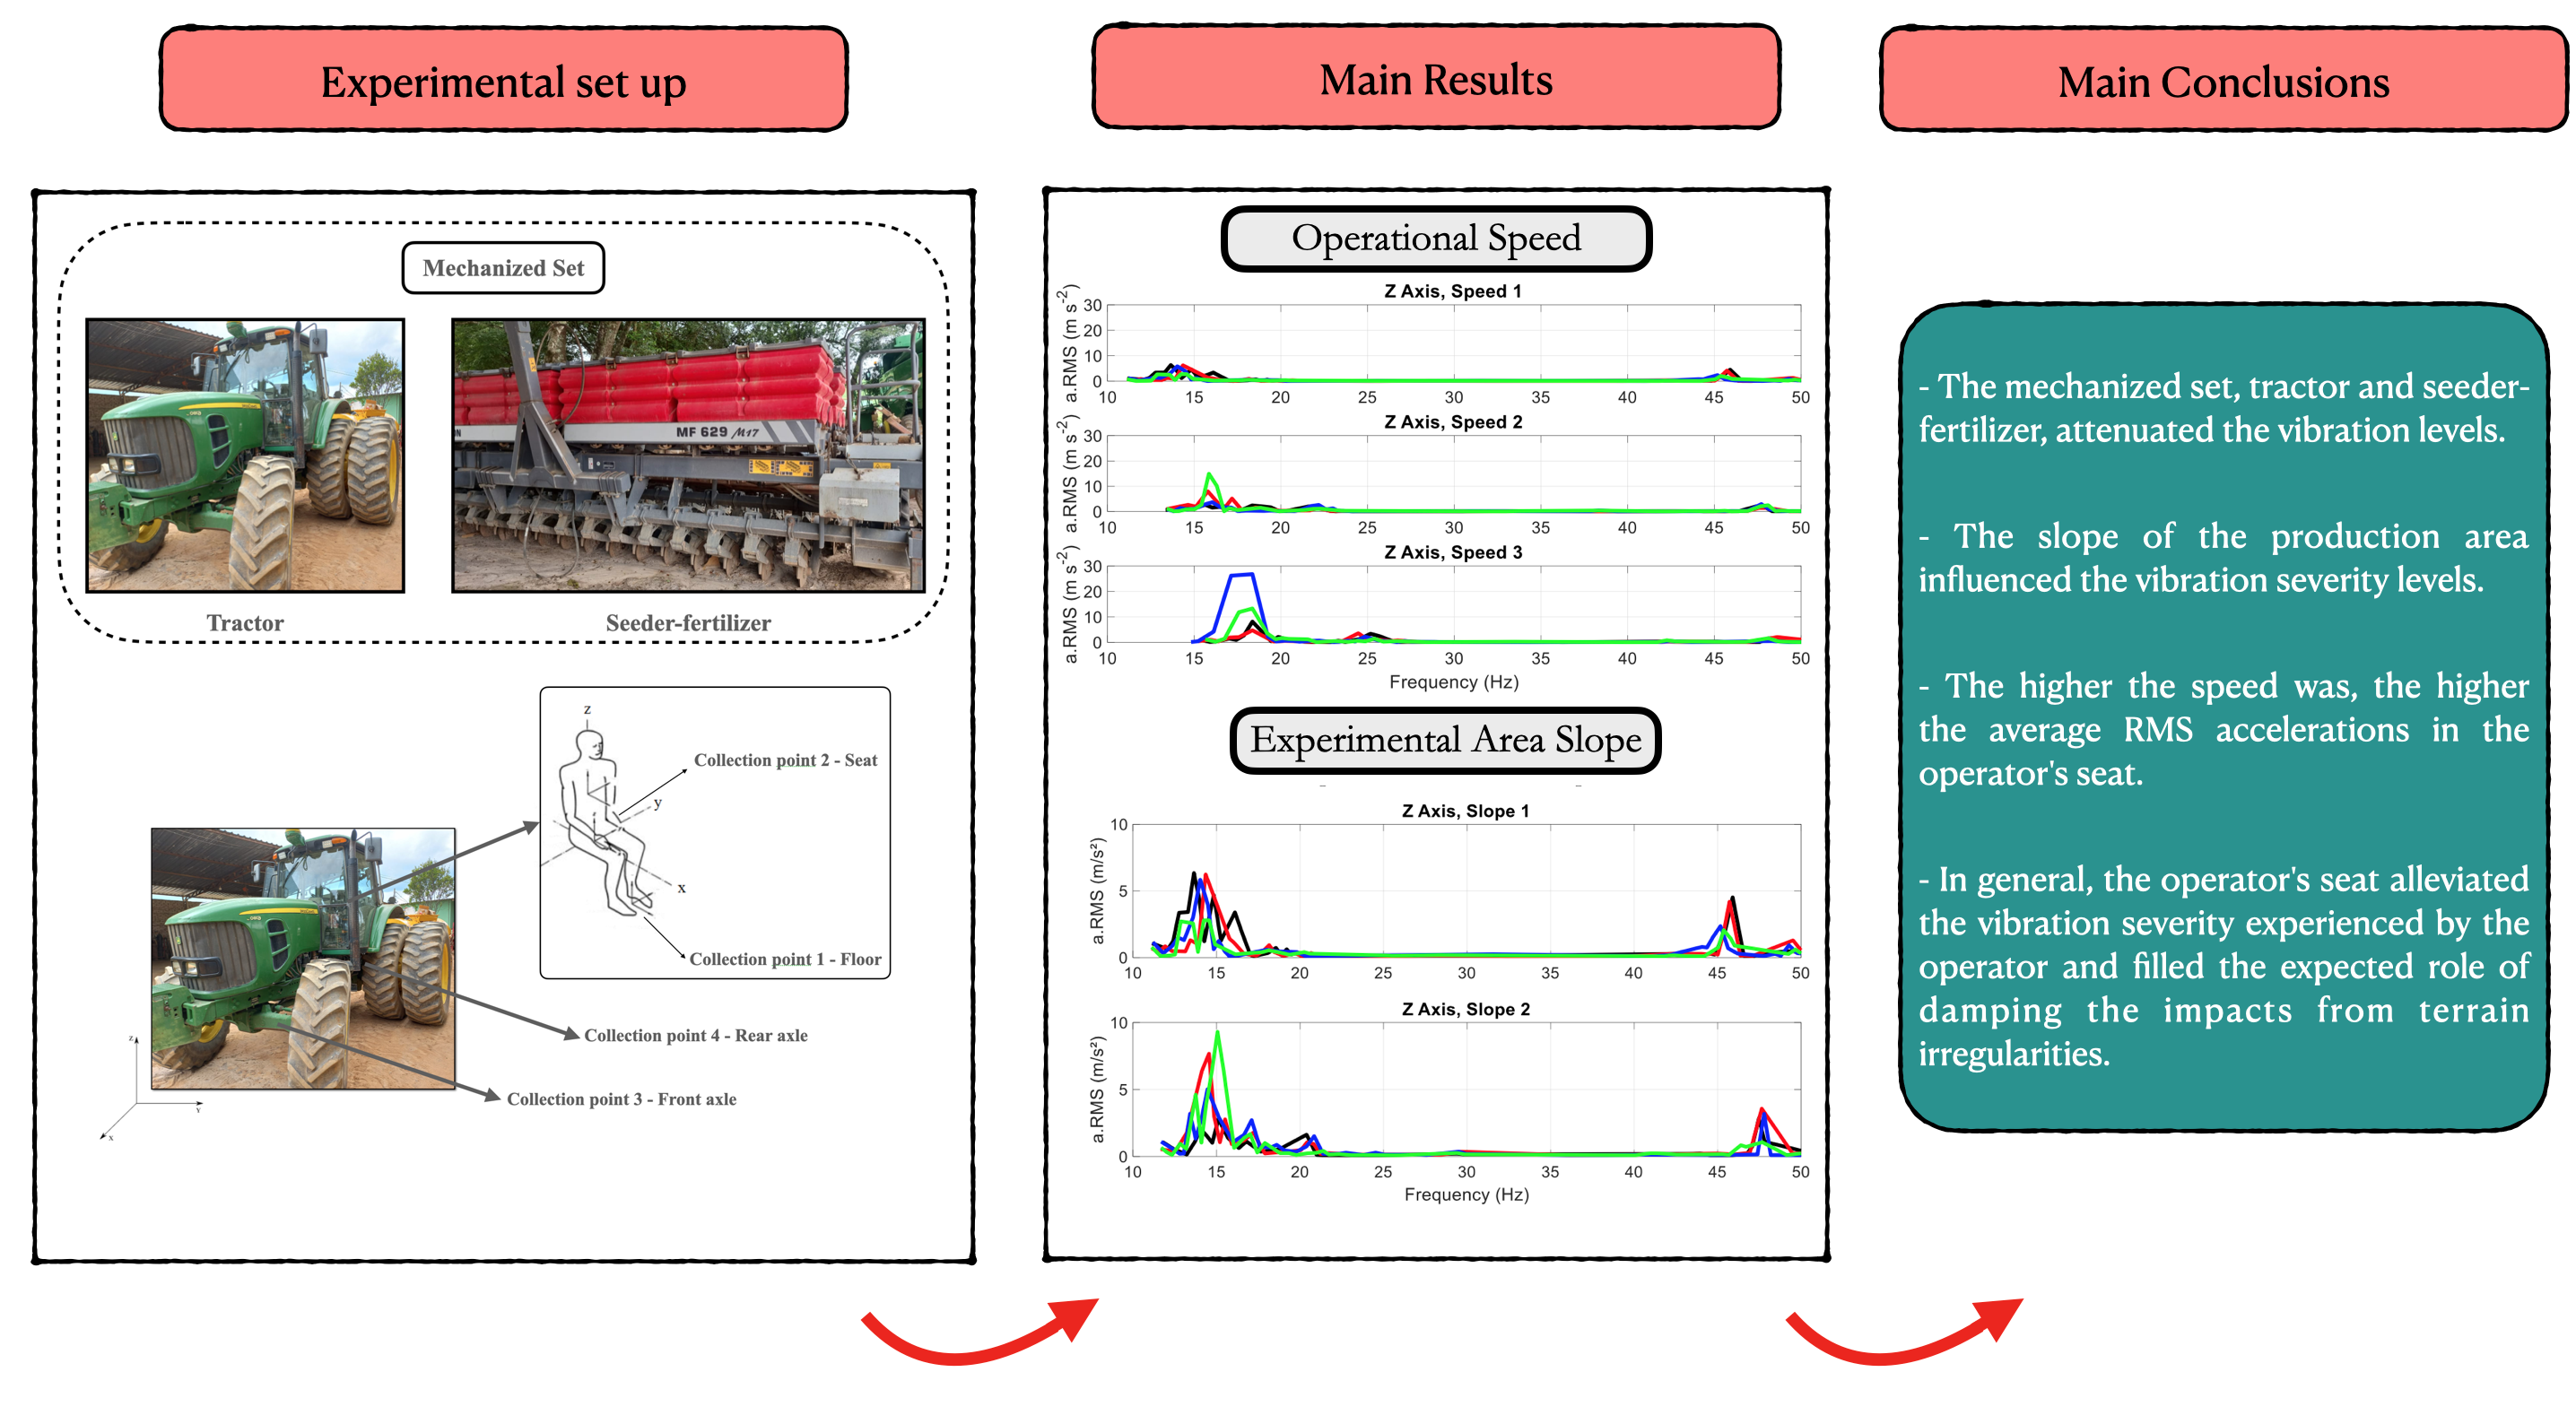
The mechanization of the agricultural sector exposes operators to vibrations generated by tractors, terrain inclination, and attached implements. An operator exposed to vibrations for long periods can develop health problems such as visual disturbances, fatigue, spinal injuries, and low back pain. In this way, the present research includes assessing severity of mechanical vibrations of an agricultural tractor with four-wheel drive in relation to a mechanized assembly composed by the same tractor operating coupled to the seeder fer- tilizer in the sowing operation. Vibrations were monitored at four data collection points: the front and rear axles of the tractor, the cabin floor, and the operator’s seat. The root mean square (RMS) acceleration values were compared with the limits defined in ISO 2631-1, and the operator’s seat was classified as “uncomfortable” and “very uncomforta- ble”. The vibration transmissibility between the rear axle and the cabin floor (T2) was greater than 1, indicating an increase of vibrations.
Keywords:
mechanical vibrations
; health and comfort
; seeder fertilizer
1. Introduction
The pursuit for increased productive efficiency in the agricultural sector causes the demand for new technologies to occur. Thus, the use of agricultural machinery becomes indispensable for the current production model [1], which aims to amplify the production of agricultural products. The use of agricultural mechanization services favors the improvement of productive efficiency in rural areas [2], and instead of replacing labor, it works complementing it and increasing the productivity of the sector [3]. It is estimated that the Brazilian agro-industrial sector was responsible for about 49% of all national exports in 2024, totaling US$164.4 billion [4]. In this context, the mechanization of the agricultural sector becomes essential for production intensification and consequent increase of competitiveness in the global scenario.
In order to intensify the advances of the rural sector, it is necessary to use equipment that allows achieving the objective. In this way, agricultural mechanization has as its pillar the use of tractors, which can be used as sources of energy and traction associated with other equipment such as seeders [5,6]. However, agricultural tractor operators are subject to vibrations generated by the engine, soil, high temperatures [7], inclination and use of implements. The vibrations caused by ground irregularities are transmitted to the tractor cab, due to the fact that many of these machines do not have suspension systems between axles and frames, making the damping limited to tires [8]. During the operation of the tractor engine, vibrations generated propagate through the machine structure and are transmitted to the operator [9] via contact surfaces such as seat and cab floor.
Exposure for long periods to vibrations generated by agricultural machinery can cause damage to the health of operators. The interaction of mechanical vibrations in the driver’s body can lead to injuries, fatigue, visual problems, lack of concentration and irritability [10]. [11] concluded, after their studies, that agricultural mechanization (use of self-powered machines) generates lower muscle loads related to other activities, but expose the tractor operator to full-body vibrations. Some studies also indicate that whole body vibrations (WBV) are related to degenerative musculoskeletal disorders (MSDs), mainly causing spinal injuries, intervertebral disc degeneration and low back pain [12,13,14]. Thus, promoting working conditions that are comfortable and safe helps with the productive effectiveness of operators [15].
Mechanical vibrations in rural machinery cannot be extinguished, but they can be reduced through some techniques in order to reduce the damage to the health of operators and preserve the mechanical components of the equipment. In this way, the cabin of agricultural machinery must attenuate the frequency and amplitude of vibrations generated to avoid spinal injuries [10]. [16] conducted studies on the use of a self-levelling system in the cab of a tractor to reduce the vibrations generated and observed that the system allowed the attenuation of vibrations in the direction of movement, in contrast, due to soil irregularities, use of a plough and slope, caused vibrational increase in the transverse and vertical direction. Another way to mitigate the vibrations generated is the relationship between operating speed and traction force used in activities [17], since the increase in working speed also causes an increase in vertical vibration in the tractor cab [18]. An additional factor that can contribute to the generation of vibrations in the operator’s space is the use of implements. [19] concluded that the use of a blade plough system has greater amplitude of vibration in the transverse direction when compared to the horizontal and vertical directions, therefore, the application of these elements must also be studied to minimize generated vibrations. Therefore, concerns about the working conditions that operators are subjected to in terms of safety and comfort are justified [20].
Due to the seriousness of the subject, this study was developed to evaluate the severity of mechanical vibrations of an agricultural tractor with four-wheel drive (4x4) in relation to a mechanized assembly composed by the same tractor associated with a fertilizer seeder in the sowing operation. In addition, a comparative analysis was performed between the mechanized assembly and the tractor alone. Four data collection points were considered, the front and rear axles of the tractor, floor of the operating cab and operator’s seat, to obtain the transmissibility of vibration between the axles and the floor, and floor and seat to verify that the severity of vibration to which the operator is exposed is consistent with the values acceptable by current standards for human-machine interaction.
2. Materials and Methods
The experiment was conducted in the city of São Vicente de Minas/MG, Brazil, which is located at latitude 21°42'S, longitude 44°26'W, has an average altitude of 972 m, and a CWb climate according to the Köppen classification. The soil of the experimental area is clayey tending to sandy-clay.
The vibration data of the tractor operation and, subsequently, of the operation of a mechanized set composed of the tractor coupled to the seeder fertilizer were collected. The mechanized set used in this experiment is presented in Figure 1, which was composed by a John Deere 6180J 4x4 tractor and Massey Ferguson MF 629 seeder fertilizer.
The mechanical vibration collecting points were the operator's seat, the floor of the operating cabin, and the front and rear axles of a John Deere 6180J 4x4 tractor. Uniaxial accelerometers were used; therefore, three accelerometers were used at each monitoring point to collect the vibration severity data of the X-, Y-, and Z-axes, which are called longitudinal, transverse, and vertical, respectively. In Figure 2 is illustrated the collections points considered in this work.
The positioning of the accelerometers followed the ISO 2631 standard [21] (Figure 3), which guides the methodologies for the measurement of mechanical vibrations. The reference is given by the operator's working position.
A National Instruments (NI) data acquisition system, with 3 modules with 4 inputs each, a microcomputer with LabView software, the necessary cabling to interconnect them, and MATLAB software for signal processing were used. NI 9234 modules, with a 50 ppm sampling rate accuracy, resolution of 12.5 ns, and frequency measurement range from 0 to 20 MHz, were used. The transducers were high-sensitivity PCB industrial accelerometers. Since the mass of these accelerometers are insignificant compared to the mass of the tractor, they were considered to not interfere with the dynamics of the system. A direct current transformer for alternating current fed by a battery powered the instrumentation used.
In terms of the frequency domain, the Nyquist sampling theorem was used for faithful reconstruction of a signal, establishing that the sampling frequency should be at least twice as high as the highest frequency of the signal, which in mathematical terms is fs ≥ 2fc, where fs is the sampling frequency and fc the highest frequency of the signal [22]. Therefore, considering that the frequencies of interest in this study are as high as 80 Hz, the sampling rate should be at least 160 Hz. In the experiment, the sampling rate used was 5 times the highest frequency to be analyzed; therefore, it was 400 Hz.
2.1. Signal Analysis
The frequency spectra of the dynamic behavior and the average root mean square (RMS) of the accelerations were determined from the data, and the transmissibility of vibration from the axles to the operator station floor and from the operator station floor to the operator’s seat were determined from these averages. The amplitudes at the characteristic frequencies of the system during operation were determined from the frequency spectrum. The RMS values were exposed in the time domain.
The signal path was given by the data captured by the accelerometers through the modules and the processing of the data by LabView software. These data were collected in the time domain, therefore, the Fast Fourier Transform (FFT) in MATLAB software was used to perform transformation to the frequency domain to extract the acceleration peaks. A low-pass filter with a Hamming window was used, and amplitudes below 0.1 m s-2 were not considered.
The averages RMS values of the accelerations were obtained according to [23]. The RMS value is a measure of both the central data tendency and the dispersion of the vibration. This statistical technique transmits the magnitude of the vibration that acts at the data collection points and is calculated according to Equation 1. The RMS value is related to the energy of the oscillatory movement and its potential to cause damage. It is of great importance in the evaluation of the vibration severity because it considers the history of the wave over time.
Where:
- aRMS is the RMS acceleration in m s-2;
- N is the number of occurrences of acceleration;
- a is the acceleration data in m s-2.
According to [21], the acceleration signal can be summed to a total value weighted from orthogonal coordinates. Equation 2 determines this value.
Where:
- awx, awy, awz are the effective values of the weighted accelerations relative to the orthogonal axes x, y, and z, respectively, in m s-2;
- kx, ky, kz are multiplicative factors.
In [21], the weighted mean that measures the effects of periodic vibration in seated people exposed to WBV in terms of health includes the following values for the multiplicative factors kx = 1.4, ky = 1.4 and kz = 1.
The objective in mechanical systems subjected to vibration is to minimize the vibrational load transmitted to the base [24], which in the case of agricultural machinery prevents strong vibration from reaching the operating cabin and, consequently, the operator. In this context, the vibration transmissibilities between the front and rear axles and the floor (T1 and T2, respectively) and between the floor and the seat (T3) were measured according to Equations 3, 4, and 5. The purpose of measuring transmissibility is to observe whether the accelerations that affect the operator are attenuated by the cabin or the seat.
Where:
- T1, T2, andT3 are the vibration transmissibilities;
- RMSseat is the RMS acceleration found in the operator’s seat in m s-2;
- RMSfloor is the RMS acceleration found in the floor of the operating cabin in m s-2;
- RMSfront is the RMS acceleration found in the front axle in m s-2;
- RMSrear is the RMS acceleration found in the rear axle in m s-2.
2.2. Variables Evaluated During Field Operations
To analyze the effect of the tractor’s forward speed and slope on the severity of vibration transmitted to the operator, these variables were considered in the execution of the experiment, in addition to the “machinery” variable, which distinguishes the tractor from the mechanized set.
Grain sowing was assumed to occur at a speed of 6 km h−1. Therefore, the speeds chosen for the experiment were 5, 6, and 7 km h-1, which corresponded to S1, S2, and S3, respectively. The slope of the experimental area was also considered. Figure 4 presents the area where the experiments were performed.
In Figure 3, D1 indicates a flat area, and D2 indicates an area with a slope of approximately 7.5°. Table 1 shows the experimental design, in which paths of 200 m were made. The distance was measured using the application Strava. The postprocessing of the data was performed in the software MATLAB, and the time factor was used to divide the distance of 200 m into four equal parts, representing 4 replicates of 50 m each, for each treatment considered.
2.3. Statistical Analysis of the Data
The following response variables were evaluated: vibration severity and vibration transmissibility at the operating station. For this purpose, an experiment was conducted according to a completely randomized design in a 2 x 3 x 2 factorial scheme with 4 replicates. The factors evaluated were slope (D1 and D2), speed (S1, S2, and S3), and machinery (tractor and tractor combined with seeder fertilizer).
The data were subjected to normality tests; data that met the normality requirements were subjected to analysis of variance at a significance level of 5% probability. The means of the qualitative factors were studied using the Tukey test at 5% probability. The means of the quantitative factors were studied through regression analysis, in which the models were selected based on the coefficient of determination, significance of the coefficients, and analysis of lack of fit. All statistical analyses were performed in the software R (R Development Core Team, 2012).
3. Results
The frequency spectrum in Figure 4 and Figure 5 represent the deconvolution of the speed and slope, respectively, in which all the repetitions considered for this scenario are presented. It can be observed that acceleration peaks occurred in the frequency ranges of 10-20 Hz, 20-30 Hz, and 40-50 Hz.
The frequencies associated with the acceleration peaks increase with increasing forward speed. Figure 5 shows that at speed S1, the incidence of the acceleration peaks for the repetitions occurs between 13 and 15 Hz, while at speed S2, the peaks occur between 15 and 17 Hz, and at speed S3, the peaks occur between 17 and 19 Hz.
In the deconvolution of the slope (Figure 6), the acceleration peaks that occur in the range of 10-20 Hz are concentrated between 15 and 17 Hz for slope D1 and between 16 and 19 Hz for slope D2. In the frequency range between 40-50 Hz, the acceleration peaks are concentrated at 46 Hz for slope D1 and at 48 Hz for slope D2.
Analysis of variance was performed to verify the effect between the interactions of the factors studied at each data collection point and at the aforementioned transmissibilities. Table 2 shows that there are significant differences between the results found for the vibration severity of the tractor operating without coupling and those of the tractor coupled to the seeder fertilizer.
The slope (D) and speed (S) factors analyzed separately mostly show differences in the data collection points, as well as in the transmissibility calculations. The interactions between D and S and between M and S in the operator's seat are significant. Since there are significant differences in the interaction between the machinery factor (M) and the speed factor (S), the former (qualitative) was evaluated by the means test, and the latter (quantitative) was evaluated by regression analysis.
The result of the means test (Table 3) reveals that for all speed levels, there are differences between the vibration severity for the tractor and that for the mechanized set composed of the tractor coupled to the seeder fertilizer. Additionally, the vibration severity is higher for the operation of the tractor without coupling.
For the range of RMS averages found for the tractor operating without the coupling, the ISO 2631-1 standard [21] (1997) classifies values between 1.02 and 1.40 m s-2 as “uncomfortable”. The same classification is given for the interval of the tractor operating coupled to the seeder fertilizer (values between 0.88 and 1.36 m s-2). According to European Directive 2002/44/EC, based on the average value found for the tractor without the coupling, the exposure limit is 7 hours and 36 minutes; in turn, considering the average value found for the tractor operating coupled to the seeder fertilizer, the exposure limit is 8 hours and 13 minutes.
The regression analyses for both the tractor (Figure 7a) and the tractor coupled to the seeder fertilizer (Figure 7b) show an increase in the RMS acceleration levels with increasing forward speed. Furthermore, regression analysis show that the RMS acceleration values are higher for the tractor not coupled to the seeder fertilizer (1.02 – 1.40 m s-2) than for the tractor operating coupled to the seeder fertilizer (0.88 – 1.36 m s-2).
For the data collection point referring to the operator's seat, Equations 5 and 6 represent the linear models that best fit the tractor operating scenarios without coupling and with coupling, respectively. They are graphically represented in Figure 7, and their coefficients of determination are 0.69 and 0.63.
Analysis was also performed by the means test for the slope factor, and Table 4 shows that there are differences between the slopes for speeds of 5 and 7 km h-1 in terms of vibration severity for the operation of the tractor coupled to the seeder fertilizer. It is observed that the highest means occur for the D2 slope and that there is an increase in the vibration severity with increasing speed.
The quadratic model that best fits the relationship between the speed and slope for both D1 (Figure 8a) and D2 (Figure 8b) was the quadratic model. Equations 7 and 8, with coefficients of determination of 0.54 and 0.70, govern the models determined for slopes D1 and D2, respectively.
An increase in speed leads to an increase in vibration severity for both D1 and D2. For the D1 slope, the highest average RMS value is 1.15 m s-2, at a speed of 7 km h-1. Analyzing D1 slope, according to the comfort standards of ISO 2631-1 [21], RMS value is considered "uncomfortable". For the D2 slope, the highest mean is 1.5 m s-2, at a speed of 7 km h-1, and this value is categorized as “very uncomfortable” according to ISO 2631-1 (1997) [21]. According to European Directive 2002/44/EC, the exposure limit for the average value of slope D1 is 9 hours, while the exposure limit for slope D2 is 7 hours and 36 minutes.
From the results of the analysis of variance for the vibration transmissibility (Table 5), the relationships between the machinery, slope, and speed factors were analyzed.
The analysis of the vibration transmissibility relationship between the speed factor and the machinery factor showed that the values for T1 and T3 were below 1 and that the values for T2 were mostly higher than 1. Table 6 shows that there are some differences between the RMS acceleration values for the tractor coupled to the seeder fertilizer and the tractor not coupled to it. For the T3 transmissibility, the coupling of the seeder fertilizer to the tractor significantly reduces the RMS acceleration levels for all forward speeds.
For the breakdown between the speed and slope (Table 7), there are significant differences in the average RMS acceleration when the seeder fertilizer is coupled to the tractor only for speeds of 6 and 7 km h-1 for T2 and for the speed of 7 km h-1 for T3.
4. Discussion
The use of a coupling on the tractor causes a decrease in acceleration, the studies by [25] corroborates the results obtained in the present study, especially in Table 2, because evaluated the vibration severity in a 197 cv tractor with and without a fertilizer spreader coupling, and they observed higher values of acceleration for the tractor operating without the use of the implement.
[26] conducted a study using the same ballast setting and the same scarification depth in a scarifier coupled to an 85 cv tractor. They found mean acceleration values of 5.5 m s-2 for a speed of 3.5 km h−1 and acceleration values of 6.5 m s-2 for a speed of 4.5 km h−1 at the measurement point, which was the operator’s seat. In the present study, lower acceleration values were observed at speeds of 5, 6, and 7 km h⁻¹.
The results for the regression analysis for the tractor, both coupled and uncoupled to the seeder fertilizer has similar behavior with the study by [27], in which the authors varied the forward speed of a 20 cv tractor and found mean RMS acceleration values of 0.31 m s-2 for the speed of 4 km h-1 , of 0.39 m s-2 for the speed of 5 km h−1 and 0.44 m s-2 for the speed of 6 km h−1 at a collection point at the center of gravity of the tractor. Furthermore, in the regression analysis, the RMS acceleration is higher for the tractor without coupled to the seeder fertilizer, as observed in study by [25]. Therefore, from this result, it can be inferred that coupling to the seeder fertilizer contributes to the attenuation of the vibration levels.
[28] conducted an experiment that evaluated the severity of vibration of a tractor operating coupled to a mowing implement both on paved roads and on rural roads. For the latter, for both cutting and not cutting grass, they found higher values of vibration severity for the unpaved road. However, there were no significant differences in vibration based on whether the mower deck was active or not. [29] conducted studies on whole body vibrations in tractors, using different surface conditions. As a result, they found that vibrations were greater on the rough track. These findings indicate that ground conditions can influence the RMS value, in the present study, was found accelerations higher when the slope increased, as can be observed in the results by [28] and [29].
[30] analyzed the vibration severity considering the tractor’s forward speed, as well as the inflation pressure of the tires and the type of tire (diagonal or radial). In this study, they concluded that for both diagonal and radial tires, the travel speed considerably influenced the vibration severity. The authors considered that tractor tires can absorb impacts at lower forward speeds; however, as the speed increases, the wheels are not able to perform this attenuation, and the vibration severity may even increase. Therefore, the higher RMS acceleration observed at increased speeds in the present study may be explained by capacity of tires absorb impacts only in lower speeds.
[31] evaluated the frequency ranges that affect the vibration transmissibility from evaluations inside and outside of the cabin of an 85 cv tractor coupled to a scarifier and considering different levels of ballast. The authors observed amplification in the range from 0 to 15 Hz for the all-metal ballast (AMB), from 0 to 19 Hz for the partmetal ballast (PMB), and from 71 to 76 Hz for the all-liquid ballast (ALB). The mass/power ratios for AMB, PMB, and ALB were 67.36, 58.56 and 66.72 kg k W-1, respectively. Likewise, [28] evaluated the vibration severity between the cabin floor and the operator's seat for a tractor coupled to a grass mowing implement. Transmissibility values between 1 and 2 in the frequency range between 2 and 4 Hz were found. The findings in this study are consistent with the results by [31] and [28], because can be observed an increase in transmissibility related to speed and slope.
The fact that the T2 transmissibility values result in values greater than 1 for all scenarios (in which the RMS acceleration is greater in the cabin floor than in the rear axle of the tractor) can be explained by the positioning of the rear axle in relation to the tractor operating station. Additionally, the double wheels should be considered, which provide a greater area of contact between the tires and the surface. This condition may favor the mitigation of external impacts on the rear axle.
5. Conclusions
Under the conditions in which the study was conducted, the following can be concluded:
- There was a difference in the vibration severity of the tractor operating with and without the coupling of the seeder fertilizer, in which the mechanized set attenuated the vibration levels. This fact was evidenced at all data collection points;
- The slope factor influenced the vibration severity levels, and slope D2 (slope area) presented a higher average RMS acceleration;
- The forward speed, both in the tractor scenario and in the mechanized set, on both slopes had a great influence on the vibration severity. The higher the speed was, the higher the average RMS accelerations in the operator's seat;
- In general, the operator's seat alleviated the vibration severity experienced by the operator and filled the expected role of damping the impacts from terrain irregularities, the travel of the tractor, and the machine components that generate vibration, among other factors.
Author Contributions
“Conceptualization, Maria T. R. Silva, Fábio L. Santos, Rafaella V. Pereira and Francisco Scinocca; validation, Maria T. R. Silva, Fábio L. Santos, Rafaella V. Pereira and Francisco Scinocca; formal analysis, Maria T. R. Silva, Fábio L. Santos and. Rafaella V. Pereira; investigation, Maria T. R. Silva and Fábio L. Santos; resources, Fábio L. Santos.; data curation, Maria T. R. Silva and Fábio L. Santos; writing—original draft preparation, Maria T. R. Silva, Fábio L. Santos, Rafaella V. Pereira and Francisco Scinocca writing—review and editing, Fábio L. Santos, Maria T. R. Silva and Rafaella V. Pereira. All authors have read and agreed to the published version of the manuscript.”.
Data Availability Statement
The original contributions presented in this study are included in the article/supplementary material. Further inquiries can be directed to the corresponding author(s).
Acknowledgments
The authors gratefully acknowledge the financial support provided by the Fundação de Amparo à Pesquisa do Estado de Minas Gerais (FAPEMIG) and the Conselho Nacional de Desenvolvimento Científico e Tecnológico (CNPq), which made this research possible.
Abbreviations
The following abbreviations are used in this manuscript:
| RMS | Root Mean Square |
| WBV | Whole Body Vibrations |
| MSD | Degenerative Musculoskeletal Disorders |
| NI | National Instruments |
| FFT | Fast Fourier Transform |
| AMB | All-Metal Ballast |
| PMB | Partmetal Ballast |
| ALB | All-Liquid Ballast |
References
- Ribas, R.L. Exposição humana à vibrações de corpo inteiro em um trator agrícola em operação de semeadura. Dissertation (Master’s Degree in Agricultural Engineering) – Federal University of Santa Maria, Santa Maria, Brazil, 2010.
- Lu, Q.; Du, X.; Qiu, H. Adoption patterns and productivity impacts of agricultural mechanization services. Agric. Econ. 2022. [CrossRef]
- Hamilton, S.F.; Richards, T.J.; Shafran, A.P.; Vasilak, K.N. Farm labor productivity and the impact of mechanization. Am. J. Agric. Econ. 2021. [CrossRef]
- Brazil. Ministry of Agricultural and Livestock. Brazilian agribusiness reaches historic milestone in global food security. Brasília: MAPA, 2025. Available online: https://www.gov.br/agricultura/en/news/brazilian-agribusiness-reaches-historic-milestone-inglobal-food-security (accessed online on 04 August 2025).
- Rozin, D.; Schlosser, J.F.; Werner, V.; Perin, G.F.; Santos, P.M. Conformidade dos comandos de operação de tratores agrícolas nacionais com a norma NBR ISO 4253. Rev. Bras. Eng. Agríc. Ambient. 2010, 14, 1014-1019. [CrossRef]
- Valle, S.S.; Kienzle, J. Agriculture 4.0 – agricultural robotics and automated equipment for sustainable crop production. Integr. Crop Manag. 2020, 24, 2020.
- Xu, R.L.; Li, S.N.; Guo, Z.J.; Liu, M.Z.; Ni Q.; Luo, Y.H. Research for Dynamic Comfort with the Tractor Seat Suspension. J. Agric. Mech. Res. 2016; 38(2), 240–243.
- Da Silva, A.C.; Furtado Junior, M.R.; Ribeiro, L.C.; Fernandes, H.C., Teixeira, R.R.D. Ruído e vibração no posto de operação de um trator agrícola em função da pressão dos pneus e velocidade operacional. Rev. Eng. Agric. 2017, 25, 454-458. [CrossRef]
- Cvetanovic, B.; Zlatkovic, D. Evaluation of whole-body vibration risk in agricultural tractor drivers. Bulg. J. Agric. Sci. 2013, 19, 1155- 1160.
- Sandi, J.; Paulo Testa, J.V.; Battistuzzi Martins, M.; Fiorese, D.A.; Pereira Lanças, K. Vibração ocorrente sobre o corpo inteiro do operador de trator agrícola em ensaio padronizado. Rev. Agric. Neotrop. 2018, 5, 54-60.
- Fethke, N.B.; Scahll, M.C.; Chen, H.; Branch, C.A.; Merlino, L.A. Biomechanical factors during common agricultural activities: Results of on-farm exposure assessments using direct measurement methods. J. Occup. Environ. Hyg. 2020, 17, 85-96. [CrossRef]
- Bovenzi, M.; Hulshof, C.T. An Updated Review of Epidemiologic Studies on the Relationship between Exposure to Whole-Body Vibration and Low Back Pain (1986–1997). Int. Arch. Occup. Env. Health 1999, 72, 351–365.
- Griffin, M.J. (Ed.) 14—Vascular Disorders Associated with Hand-Transmitted Vibration. In Handbook of Human Vibration; Academic Press: London, UK, 1990; 553–593, ISBN 978- 0-12-303040-5.
- De La Hoz-Torres, María L.; Aguilar, A.J.; Martínez-Aires, M.D.; Ruiz, D.P. A methodology for assessment of long-term exposure to whole-body vibrations in vehicle drivers to propose preventive safety measures. J. Saf. Res. 2021, 78, 47-58. [CrossRef]
- Benos, L.; Bechar, A.; Bochtis, D. Safety and ergonomics in humanrobot interactive agricultural operations. Biosyst. Eng. 2020, 200, 55-72. [CrossRef]
- Pochi, D.; Fornaciari, L.; Vassalini, G., Grilli, R.; Fanigliulo, R. Levels of Whole-Body Vibrations Transmitted to the Driver of a Tractor Equipped with Self-Levelling Cab during Soil Primary Tillage. AgriEngineering 2022, 4, 695-706. [CrossRef]
- Singh, A.; Nawayseh, N.; Doyon-Poulin, P.; Milosavljevic, S.; Dewangan, K.N.; Kumar, Y., Samuel, S. Comparative analysis of classical and ensemble models for predicting whole body vibration induced lumbar spine stress. A case study of agricultural tractor operators. Int. J. Ind. Ergon. 2025, 108, 103775. [CrossRef]
- Gao, Y.; Yang, Y.; Fu, S.; Feng, K.; Han, X.; Hu, Y.; Zhu, Q.; Wei, X. Analysis of Vibration Characteristics of Tractor–Rotary Cultivator Combination Based on Time Domain and Frequency Domain. Agriculture 2024, 14, 1139. [CrossRef]
- Singh, H.; Mehta, M. Evaluation and Analysis of Tractor Driver’s Seat Vibrations without Implements and with Implements during Tillage Process. YMER Digit. 2021, 20, 403-409. 2021. [CrossRef]
- Roth, C.W. Transmissibilidade da vibração e distribuição da pressão na interface assento-operador de tratores agrícolas em condições dinâmicas. 2010. Ph.D. Thesis, Federal University of Santa Maria, Santa Maria, Brazil, 2010.
- ISO 2631-1. Mechanical vibration and shock: evaluation of human exposure to whole-body vibration - Part I: general requirements. Switzerland: International Standard, 1997.
- Olshausen, B.A. Aliasing 1 Nyquist sampling theorem. 2000; 1-6.
- Harris, C.M.; Piersol, A.G. Harris’ shock and vibration handbook. 5th ed.; McGraw-Hill: New York, USA, 2002.
- Meirovitch, L. Fundamentals of vibrations; McGraw-Hill: Virgínia, USA, 2001.
- Andrade, P.A.M.; Paludo; V.; Sandi, J.; Martins, M.B.; Santos, J.E.G. Vibração e ruído em um trator agrícola submetido a diferentes superfícies de rolamento. In Proceedings of the International Congress of Applied Ergonomics, 2016.
- Pinho, M.S.; Schlosser, J.F.; Frantz, U.G.; Farias, M.S.; Uhry, D.; Ribas, R.L. Acelerações eficazes na interface assento-operador de um trator. Ciênc. Rural 2014, 44, 1797-1803. [CrossRef]
- Cuong, D.M.; Zhu, S.; Zhu, Y. Effects of tyre inflation pressure and forward speed on vibration of an unsuspended tractor. J. Terramech. 2013, 50, 185-198. [CrossRef]
- Adam, S.A.; Jalil, N.A.A. Vertical Suspension Seat Transmissibility and SEAT Values for Seated Person Exposed to Whole-body Vibration in Agricultural Tractor Preliminary Study. Procedia Eng. 2017, 170, 435-442.
- Barač, Ž.; Jurić, M.; Plaščak, I.; Jurić, T.; Marković, M. Assessing whole-body vibrations in an agricultural tractor based on selected operational parameters: a machine learning-based approach. AgriEngineering 2025, 7, 72.
- Leite, D.M; Fernandes, H.C.; Junior, M.R.F.; Feitosa, J.R.; Santos, D.W.F. Caracterização das vibrações do posto de operação de um trator agrícola em condição de tração. Braz. J. Anim. Environ. Res. 2020, 3, 3808-3821. [CrossRef]
- Pinho, M.S.; Schlosser, J.F.; Frantz, U.G.; Rodrigues, F.A.; Ferrer, P.S. Efetividade de um coxim de cabina do trator agrícola na atenuação das vibrações. Rev. Ciênc. Agron. 2014, 45, 461-468. [CrossRef]
Figure 1.
Mechanized set used in experiment in order to determine vibration severity along the machine.
Figure 1.
Mechanized set used in experiment in order to determine vibration severity along the machine.
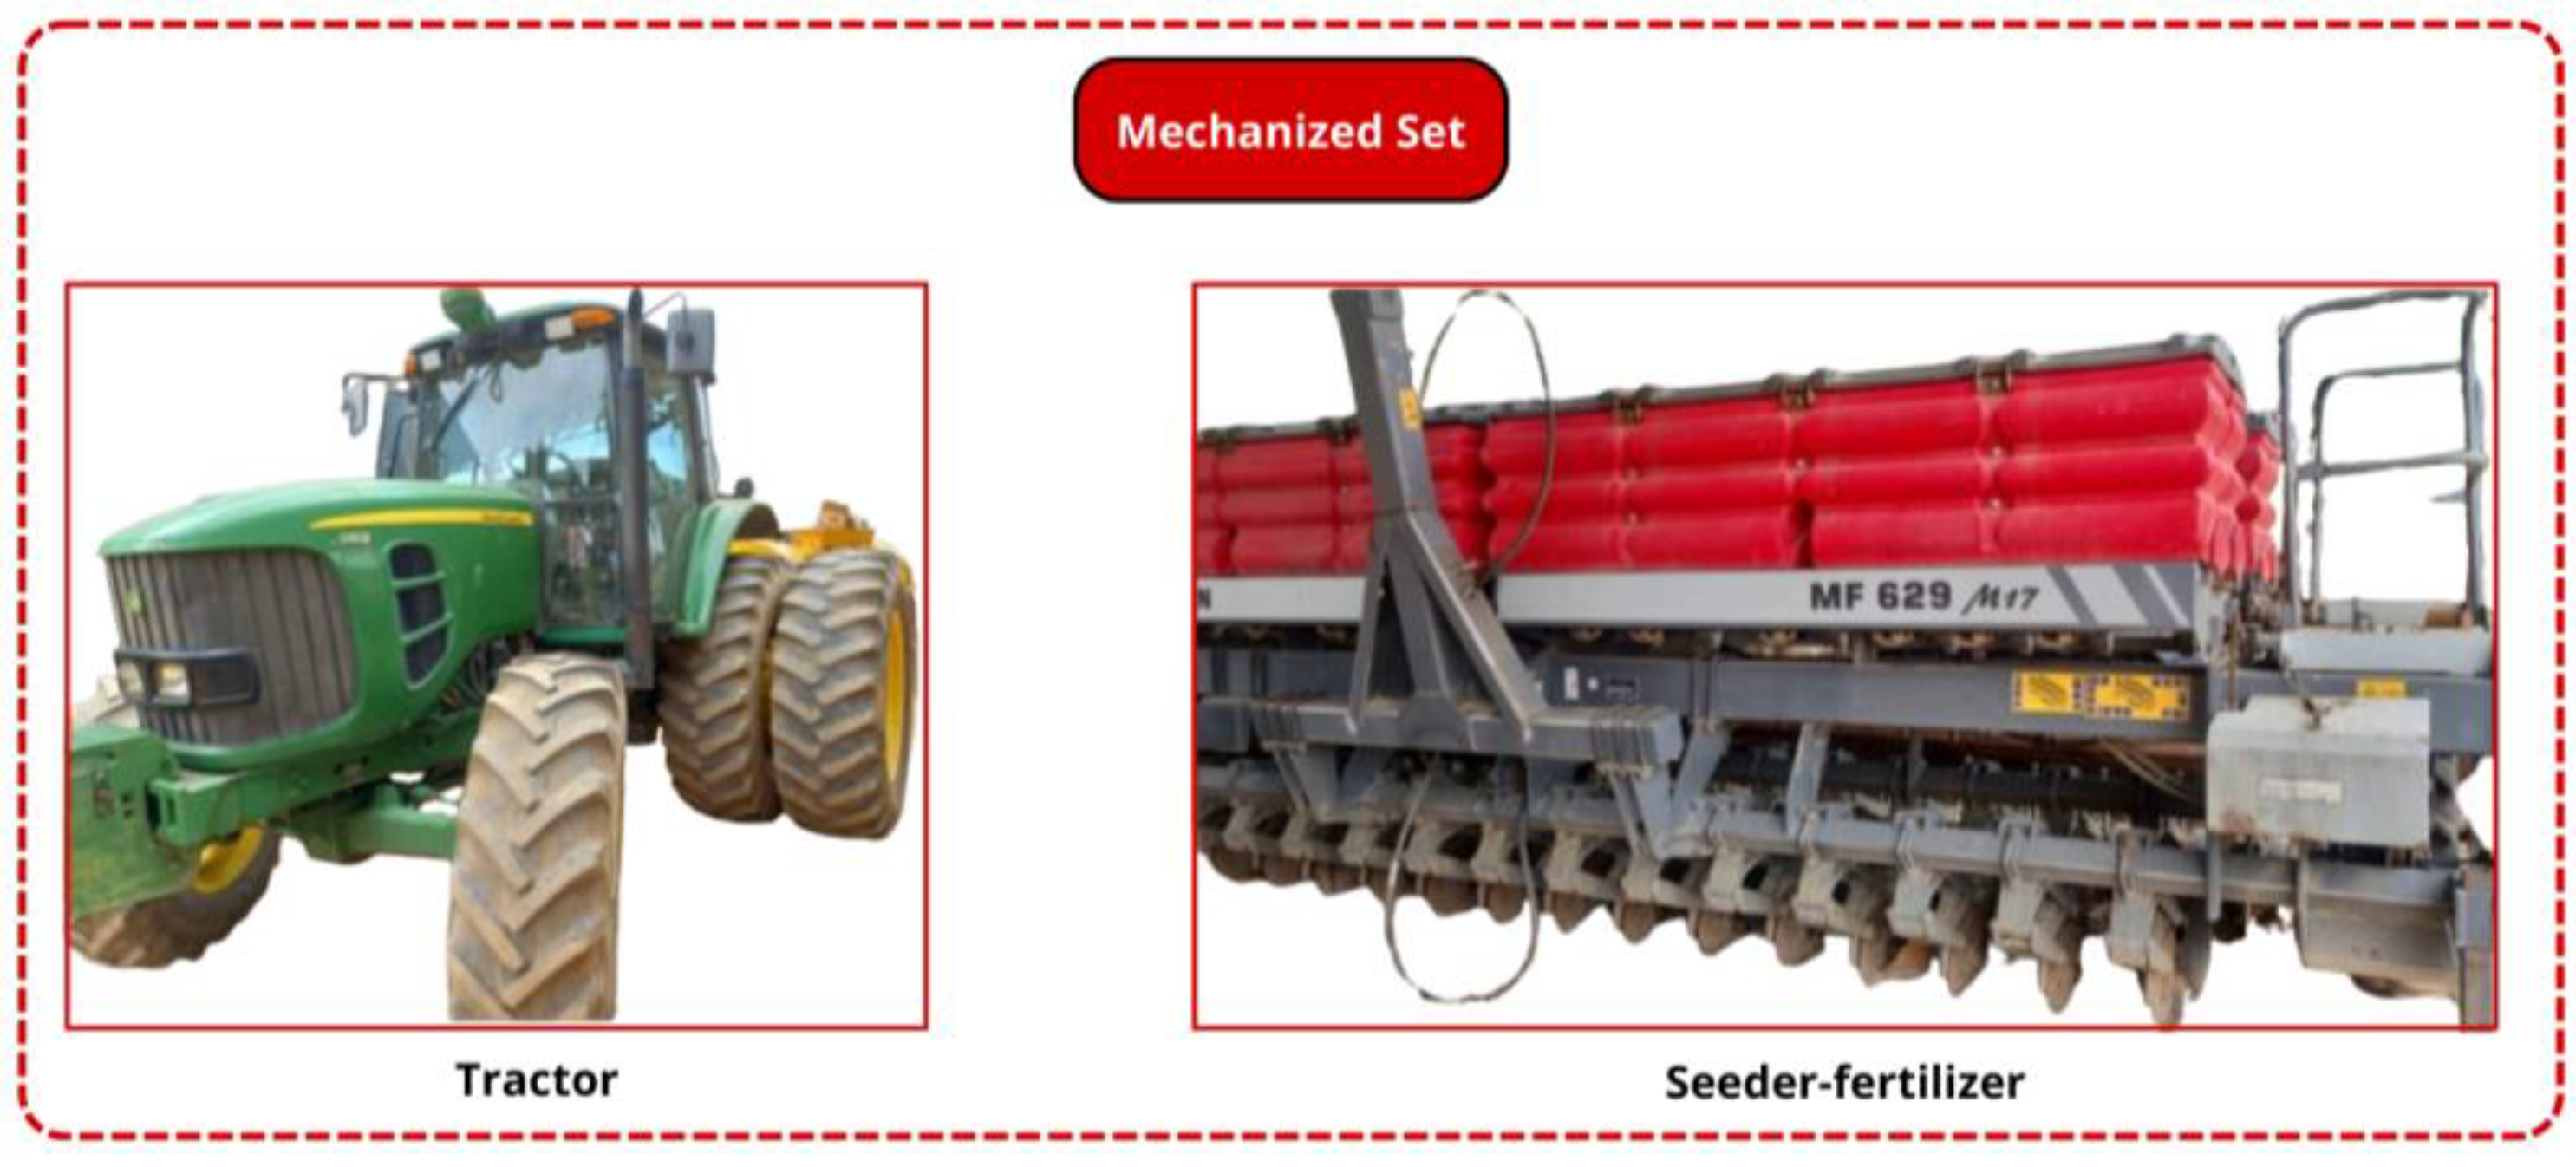
Figure 2.
Collection points of the acceleration on xyz axes (longitudinal, transverse, and vertical) in cabin (a) and outside the cabin (b).
Figure 2.
Collection points of the acceleration on xyz axes (longitudinal, transverse, and vertical) in cabin (a) and outside the cabin (b).
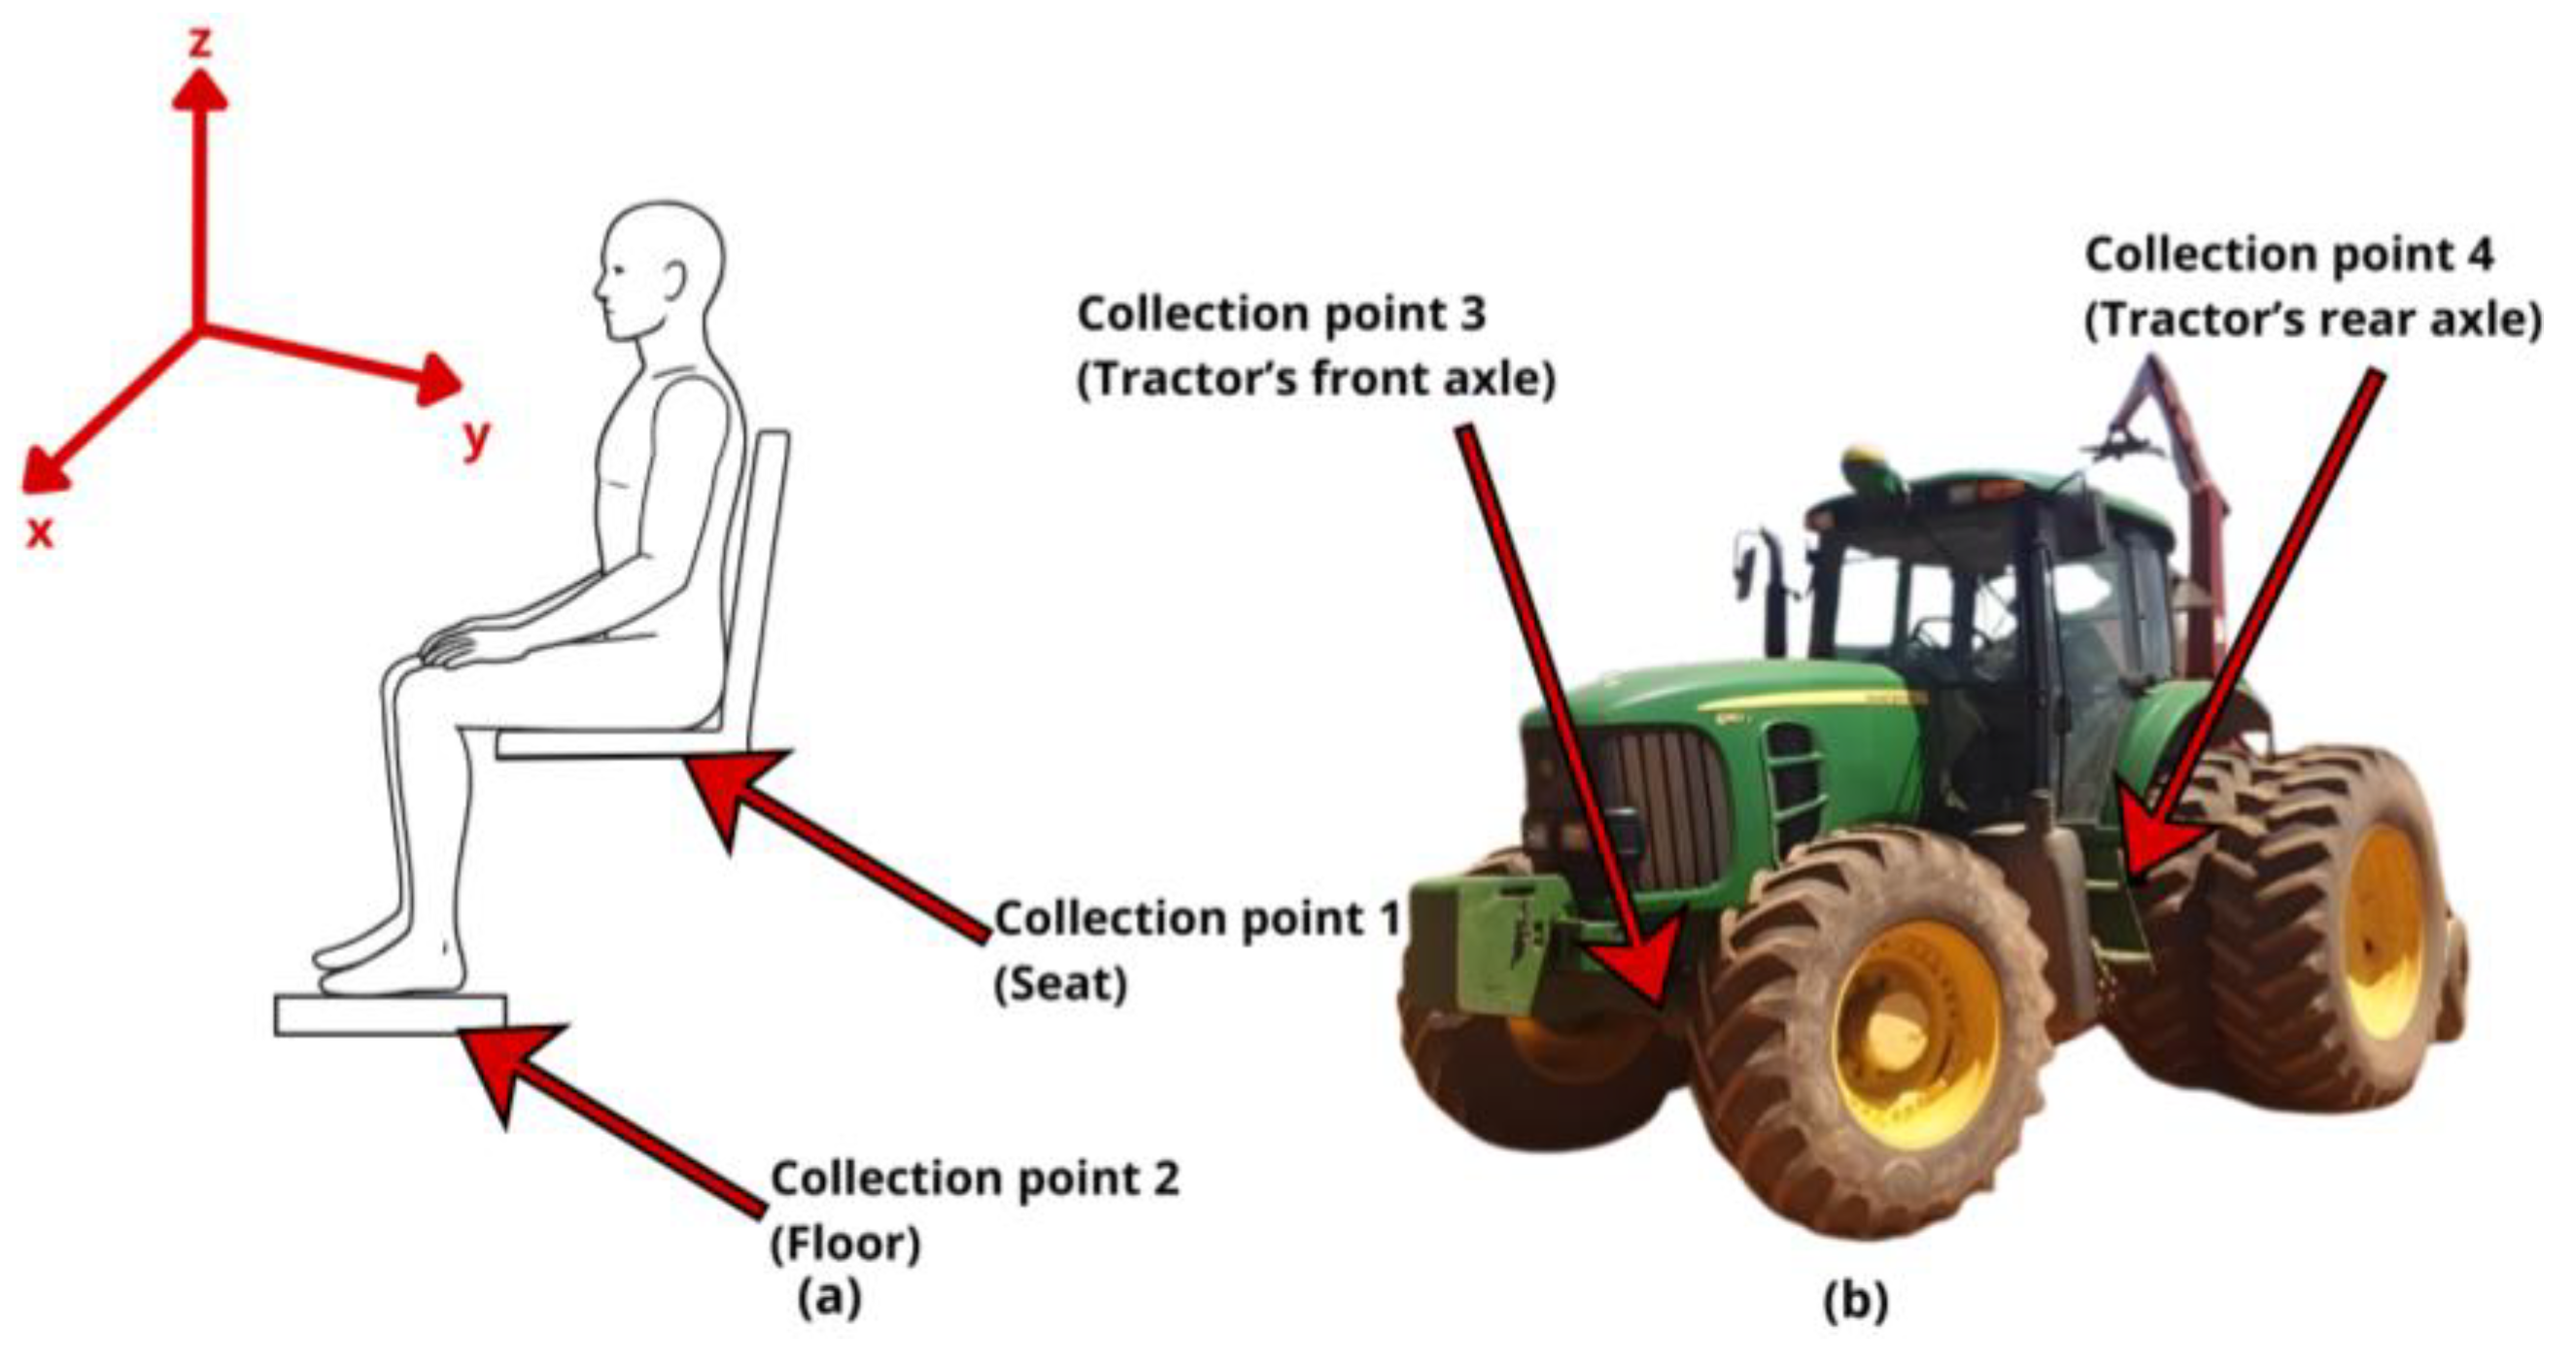
Figure 3.
Coordinate system [21].
Figure 3.
Coordinate system [21].
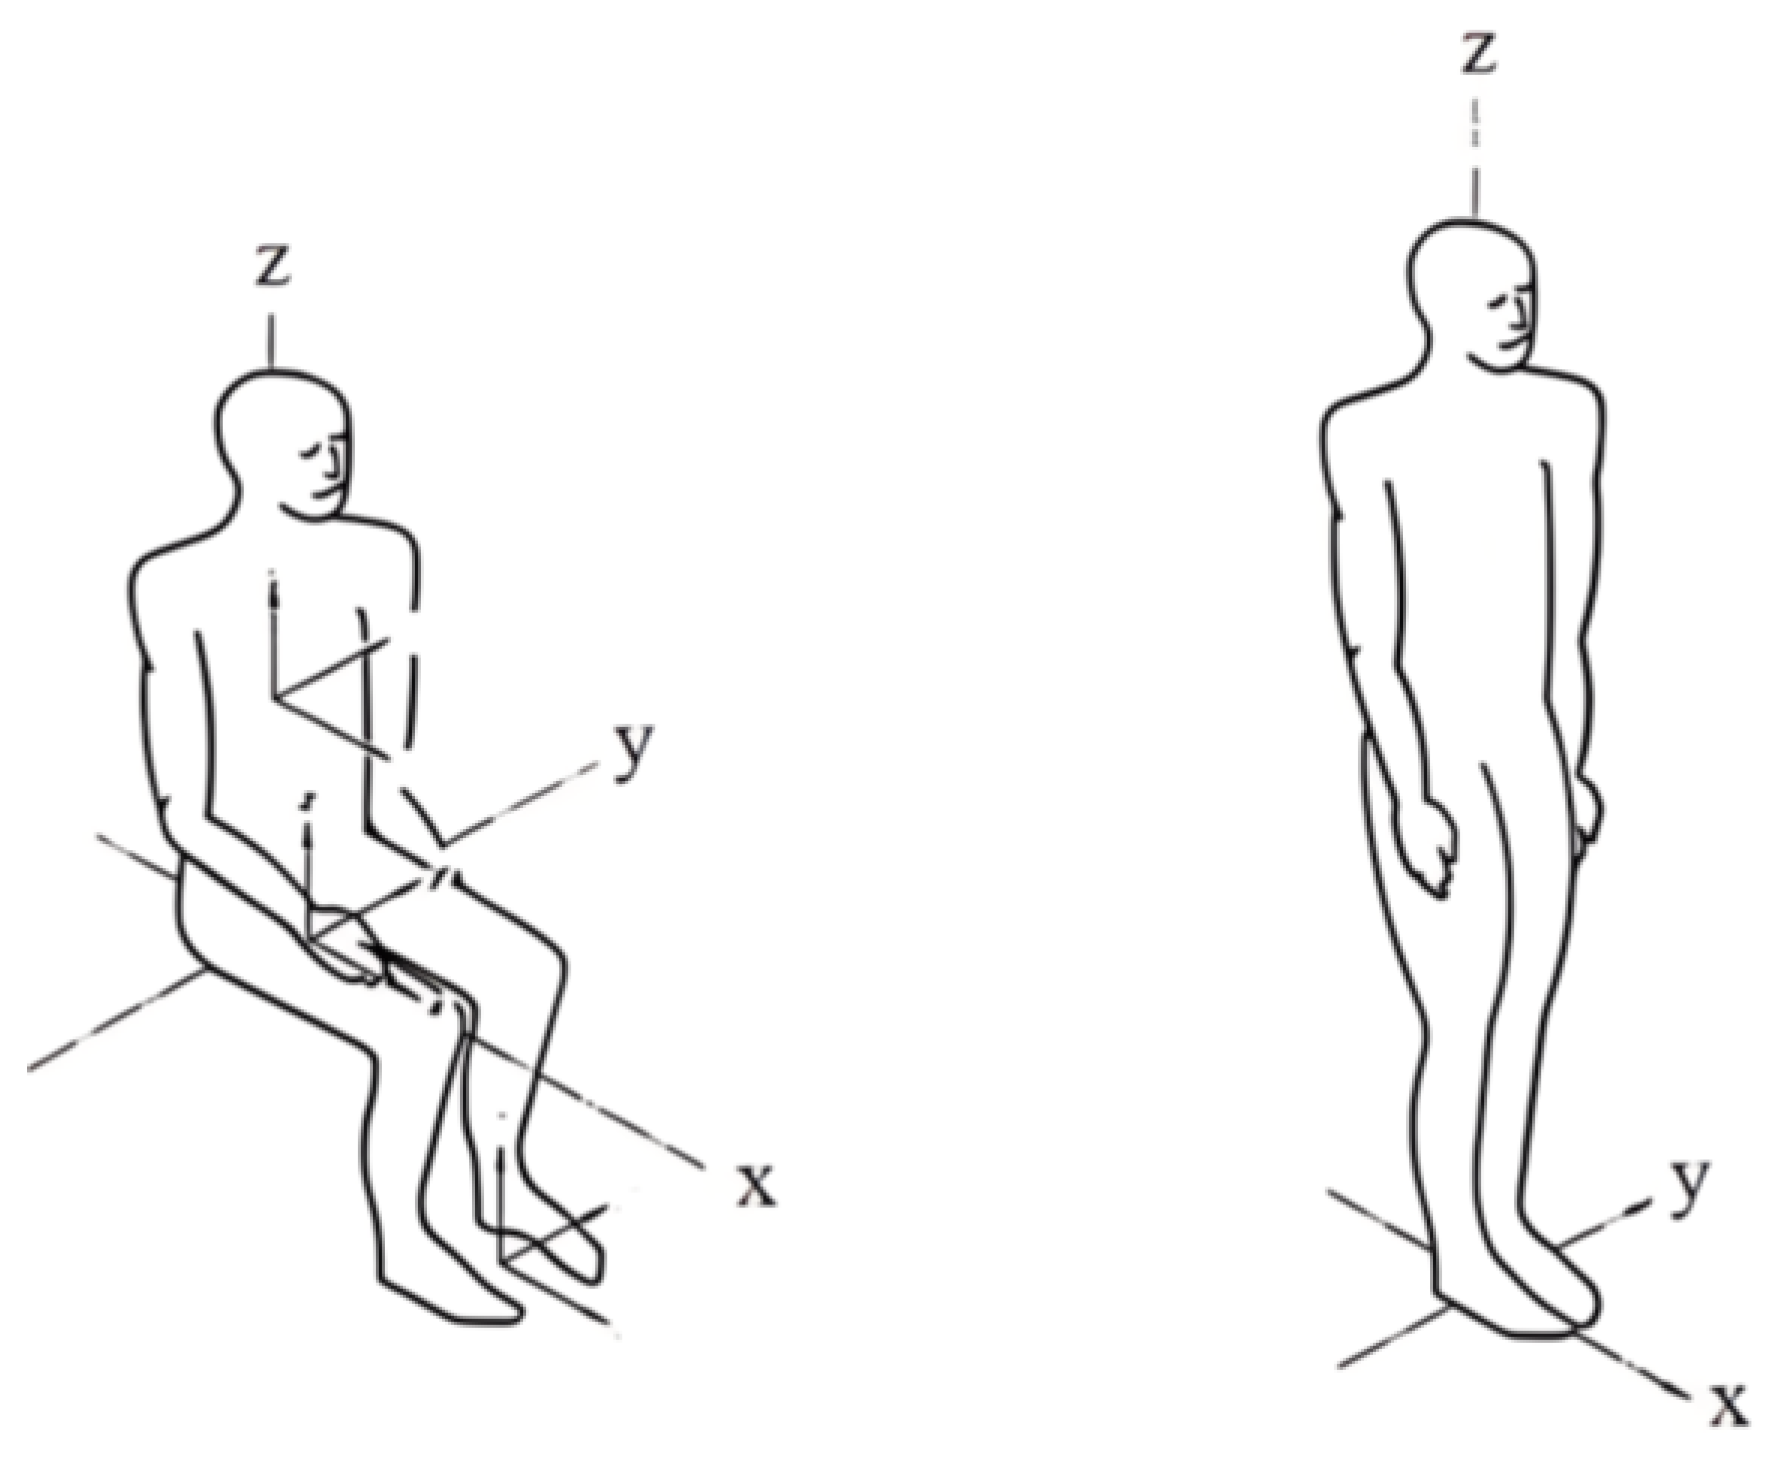
Figure 4.
Experimental area.
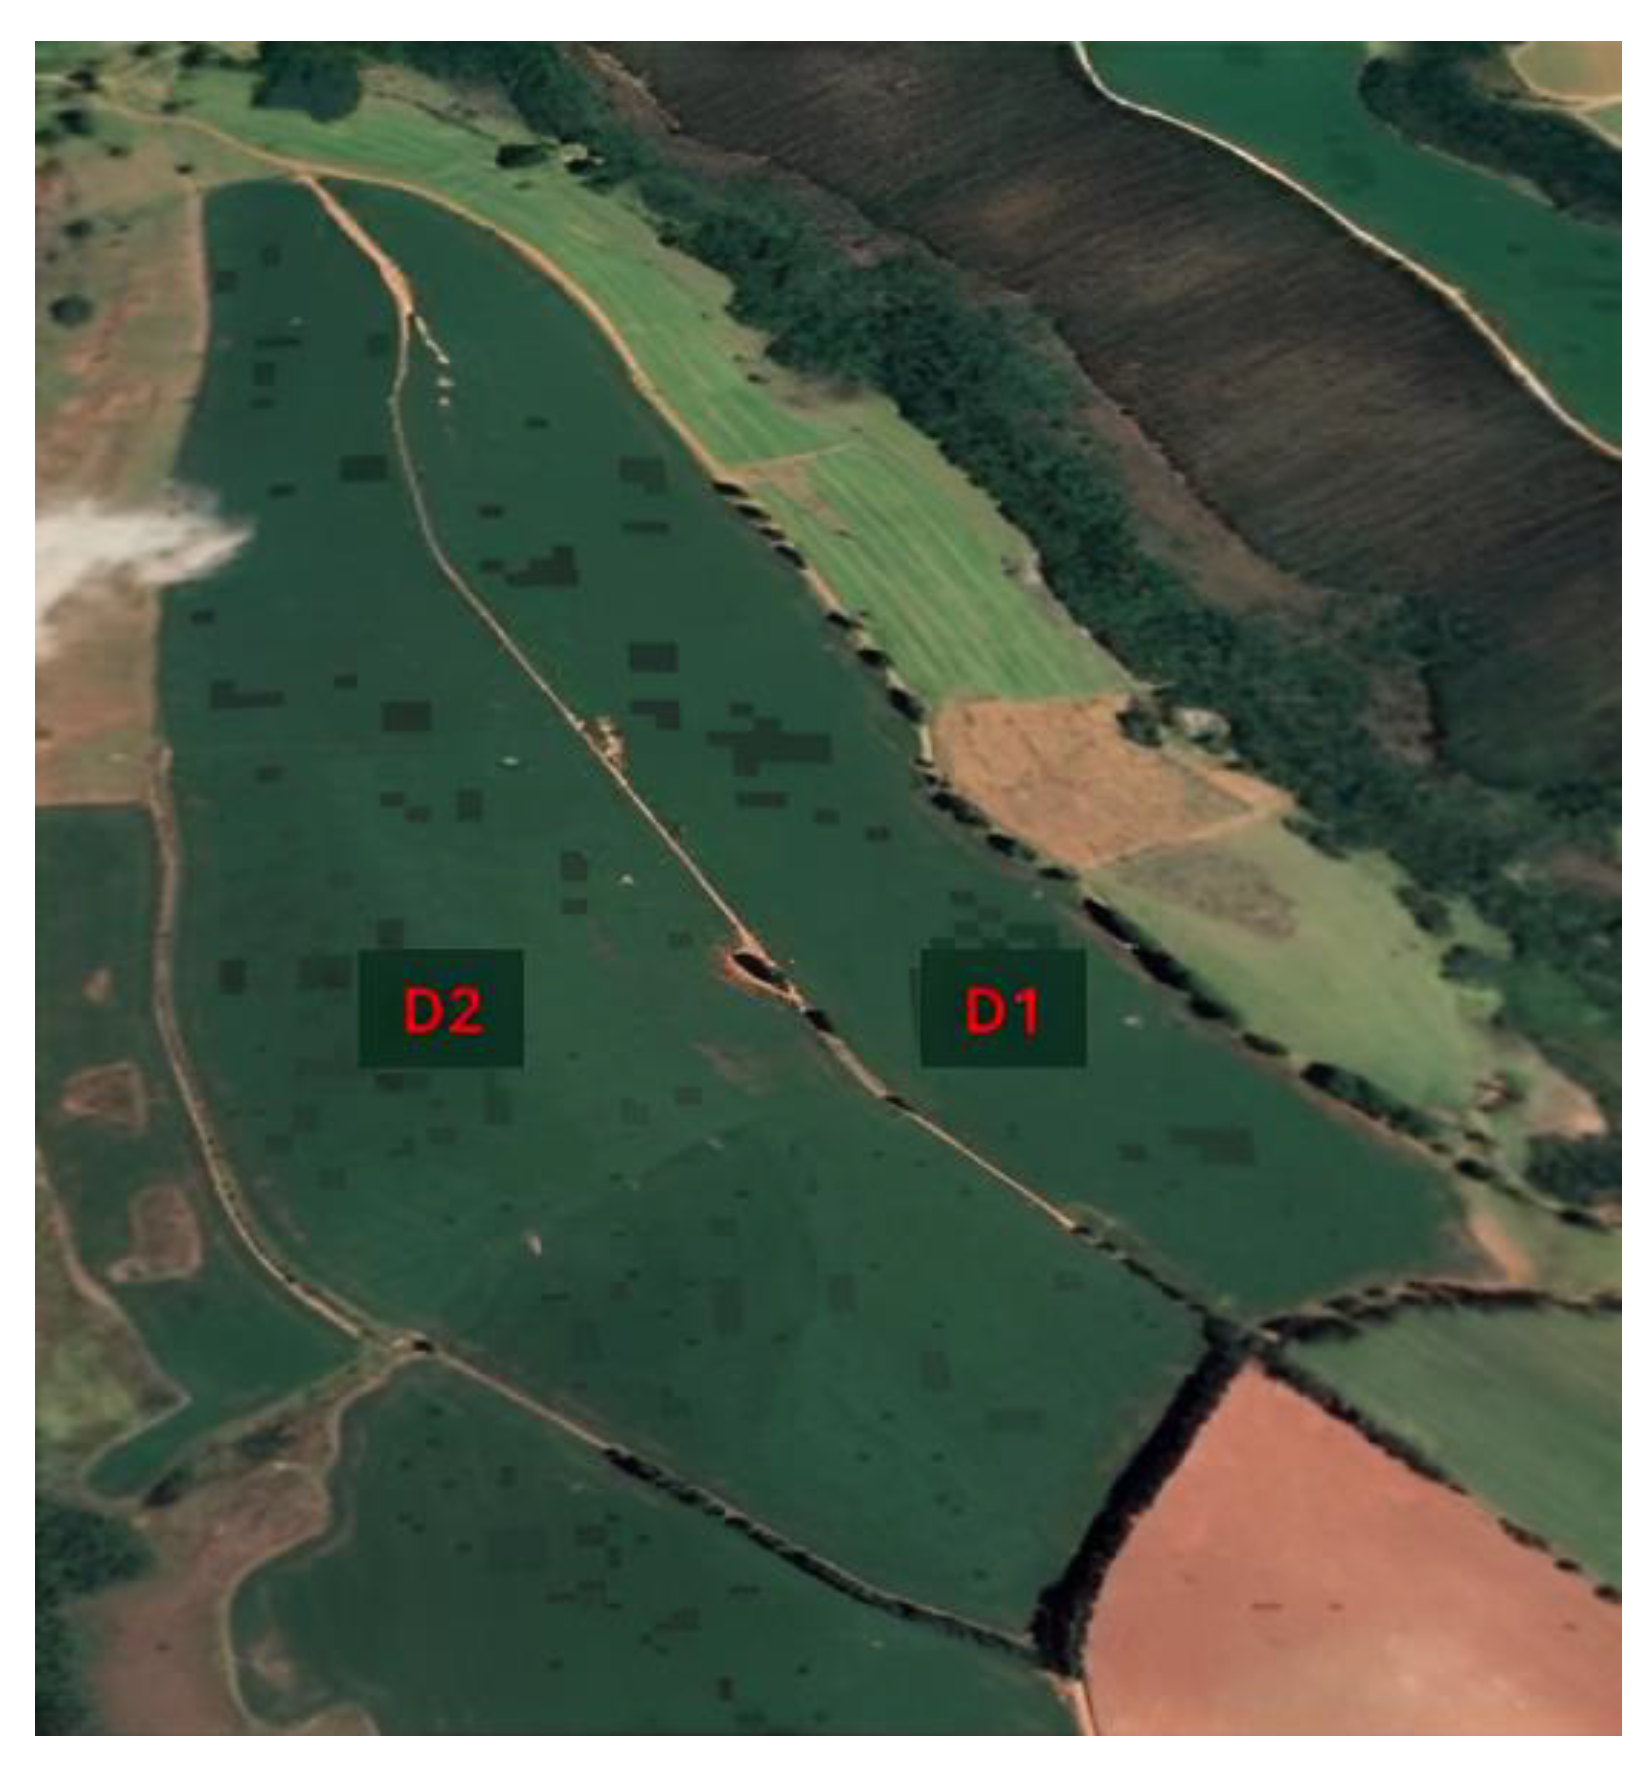
Figure 5.
Frequency spectra of the speed in the operator's seat (z axis) and detail of highest peaks between 10 and 20Hz.
Figure 5.
Frequency spectra of the speed in the operator's seat (z axis) and detail of highest peaks between 10 and 20Hz.
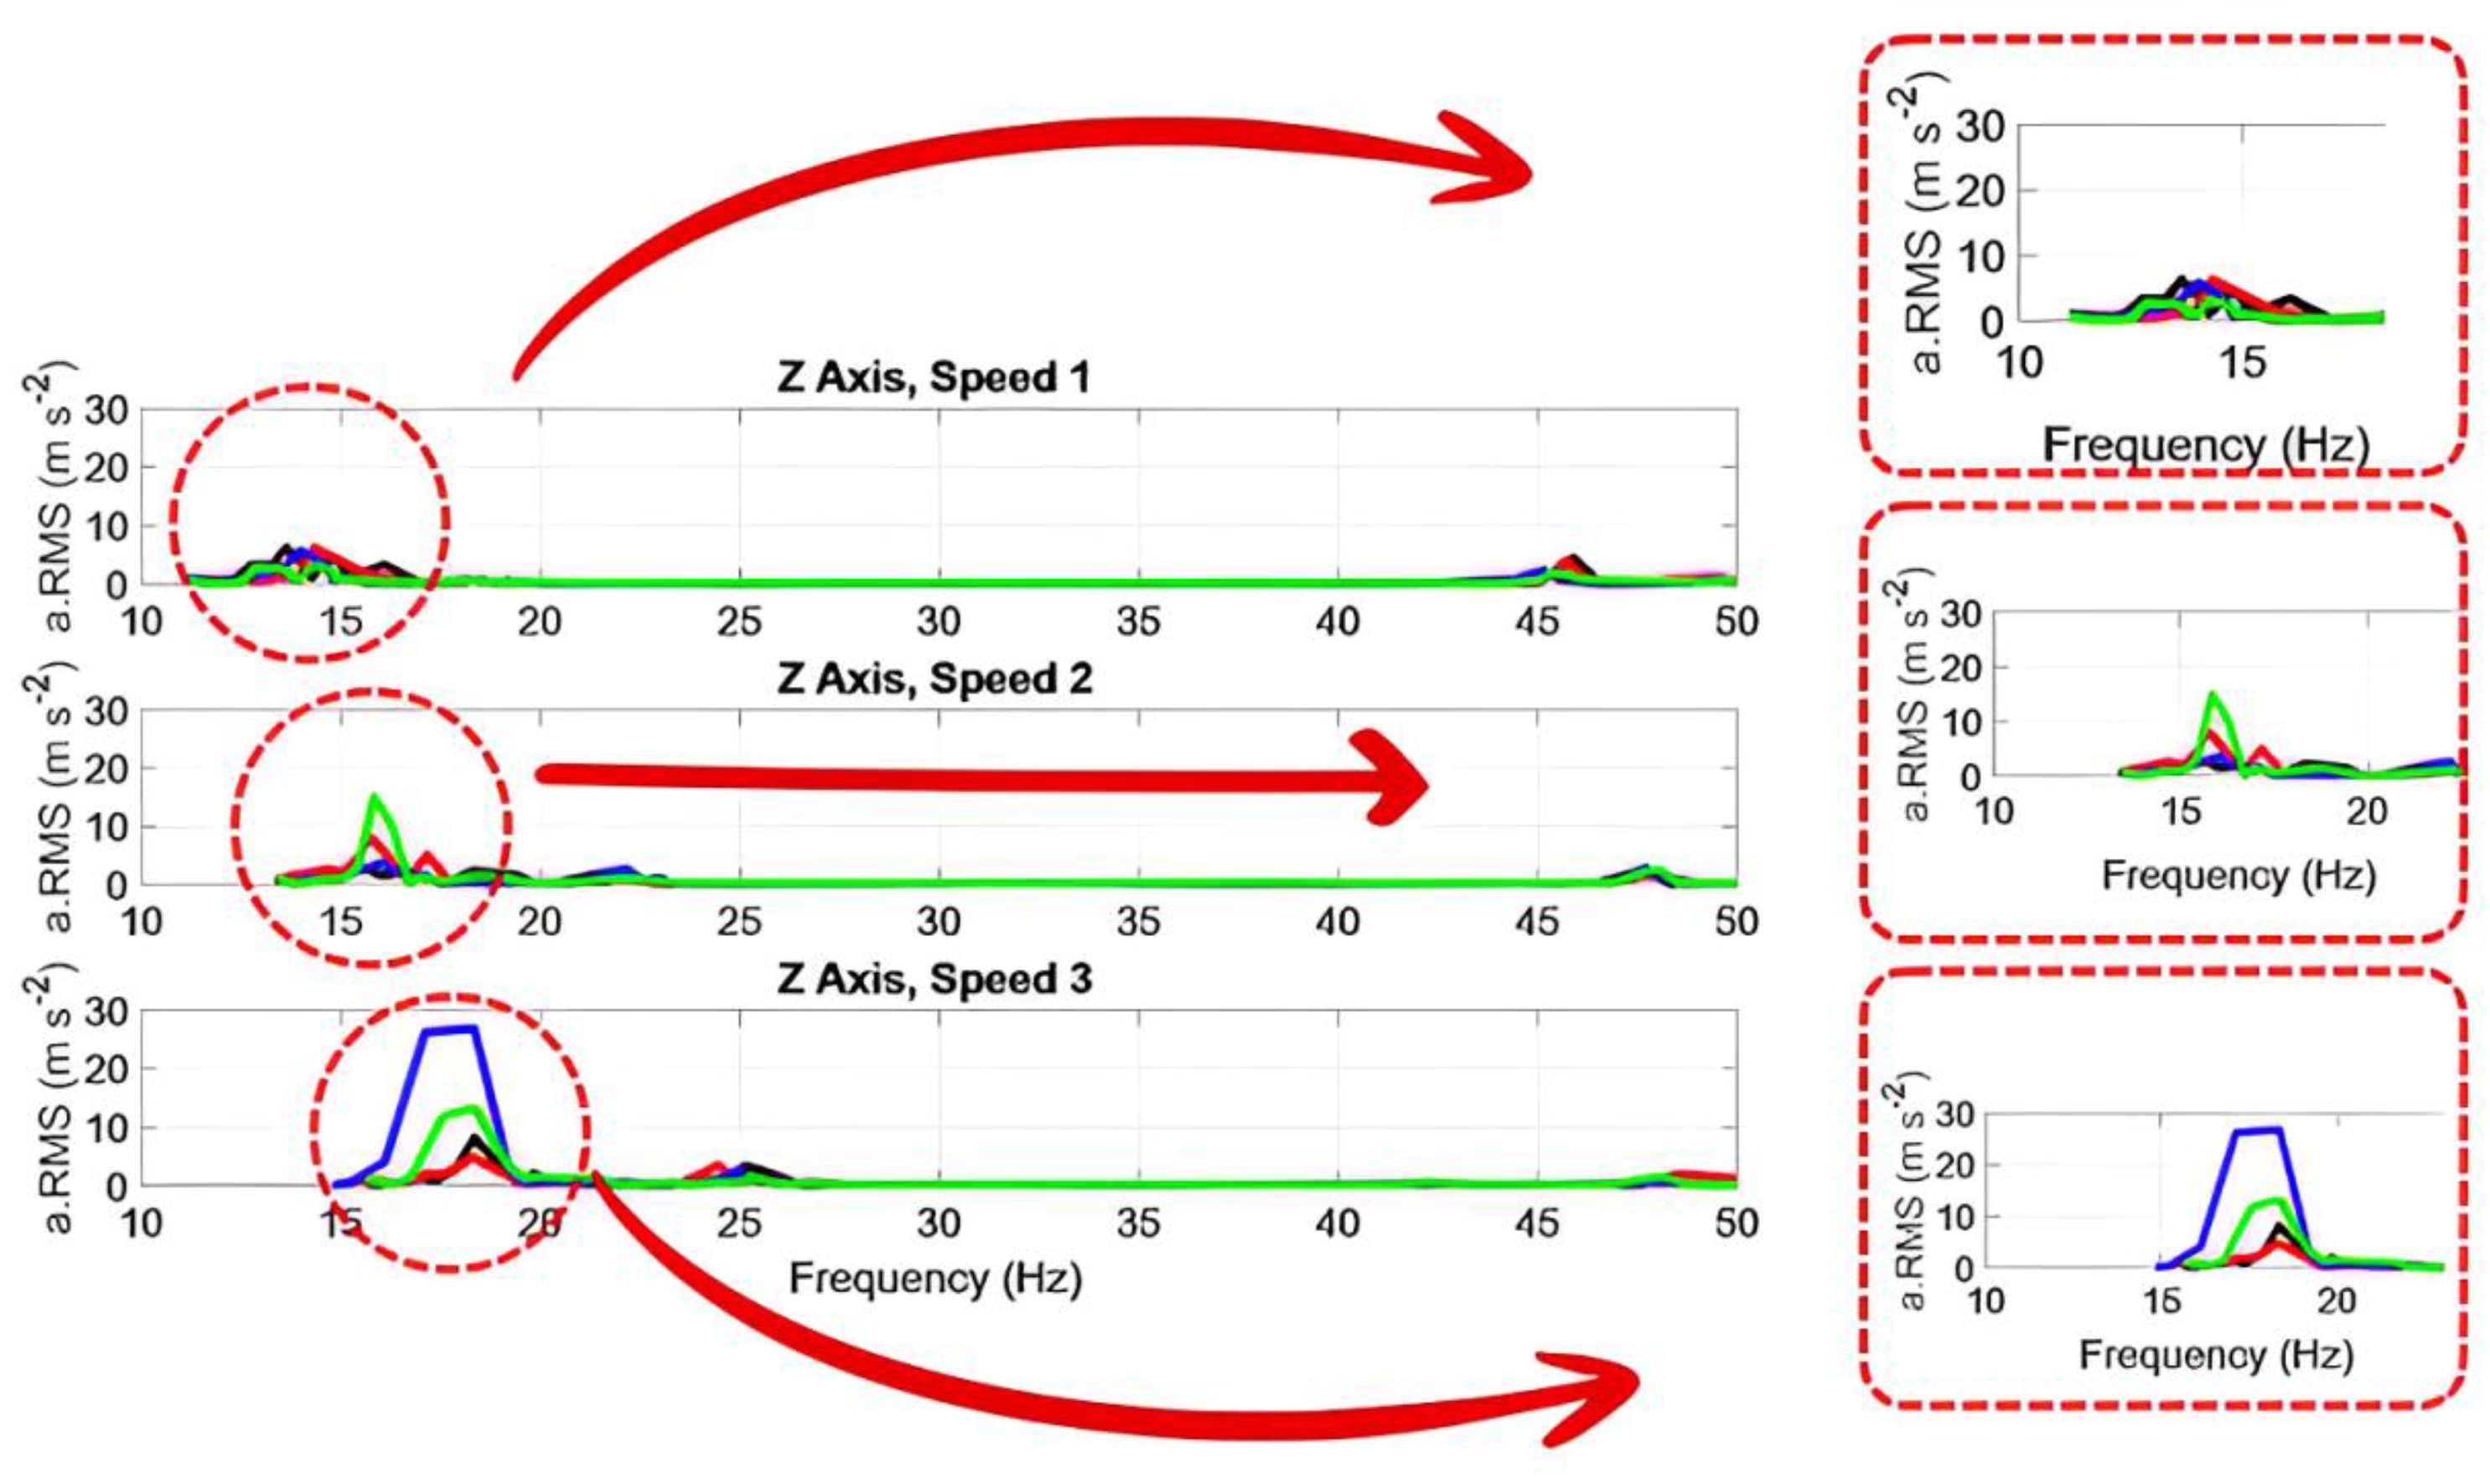
Figure 6.
Frequency spectra for the speed in the operator's seat (z axis) and detail of highest peaks between 10 and 20 Hz.
Figure 6.
Frequency spectra for the speed in the operator's seat (z axis) and detail of highest peaks between 10 and 20 Hz.
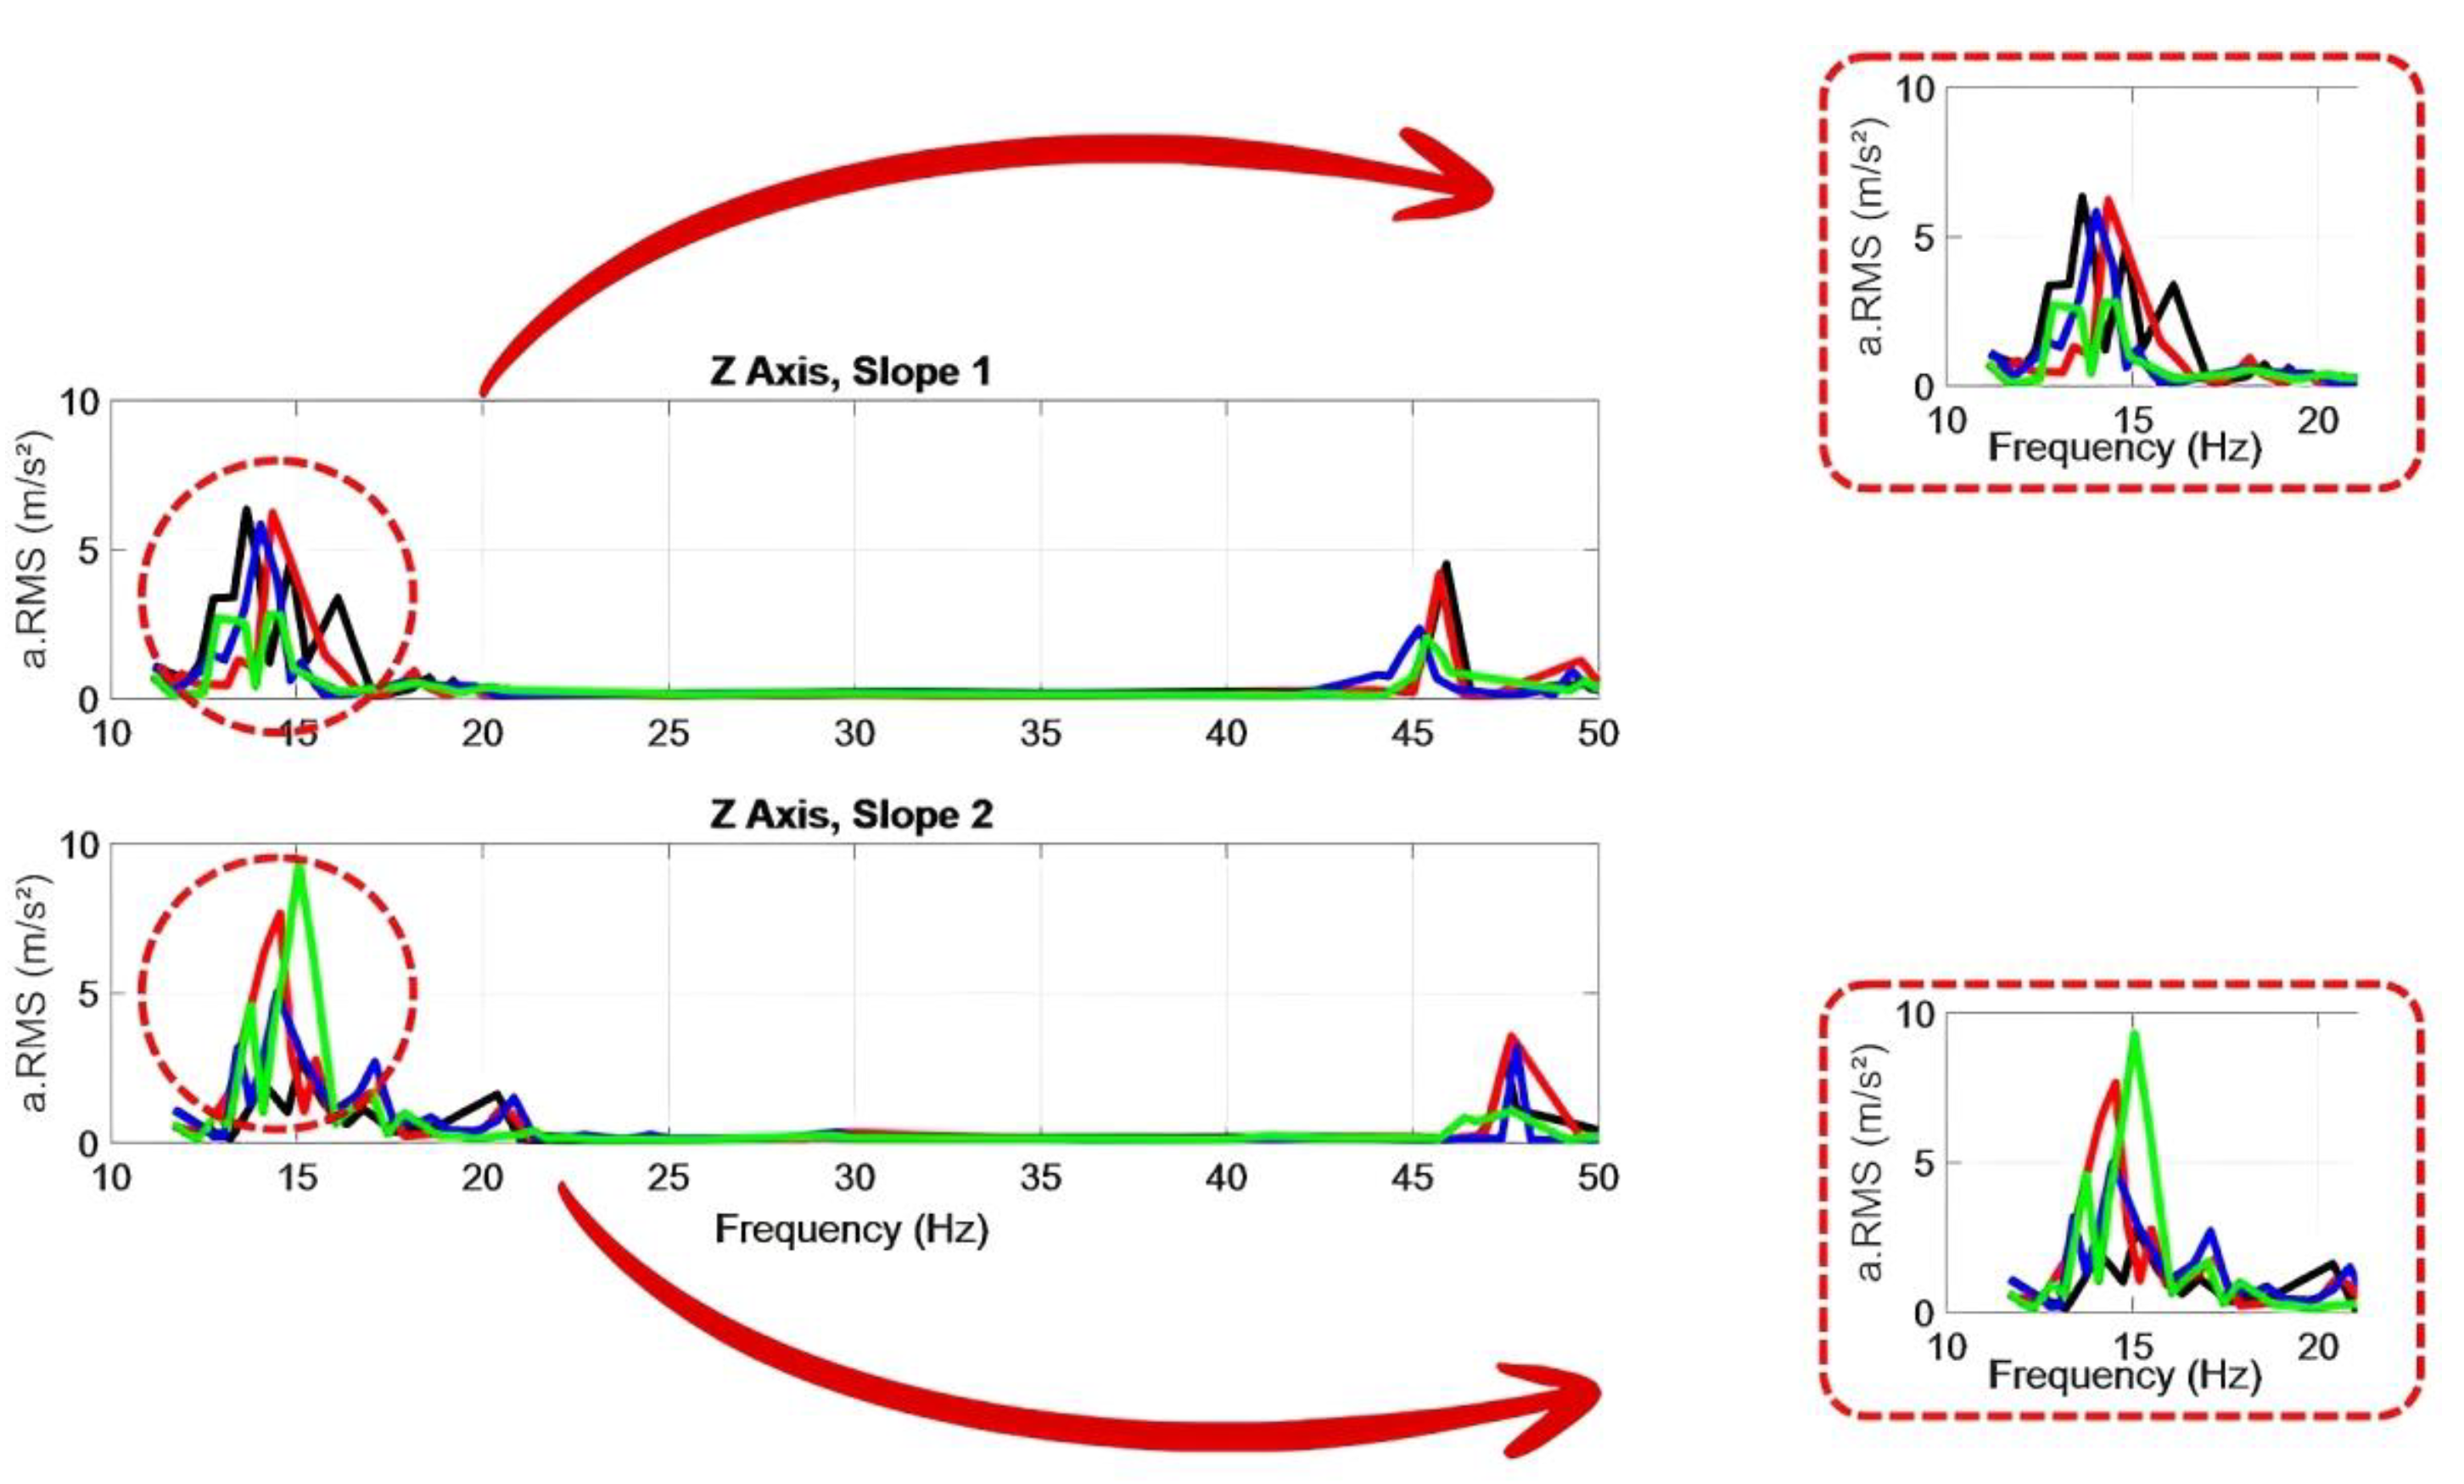
Figure 7.
Regression analysis of the speed factor for the operation of the tractor without (a) and with (b) coupling of the seeder fertilizer.
Figure 7.
Regression analysis of the speed factor for the operation of the tractor without (a) and with (b) coupling of the seeder fertilizer.
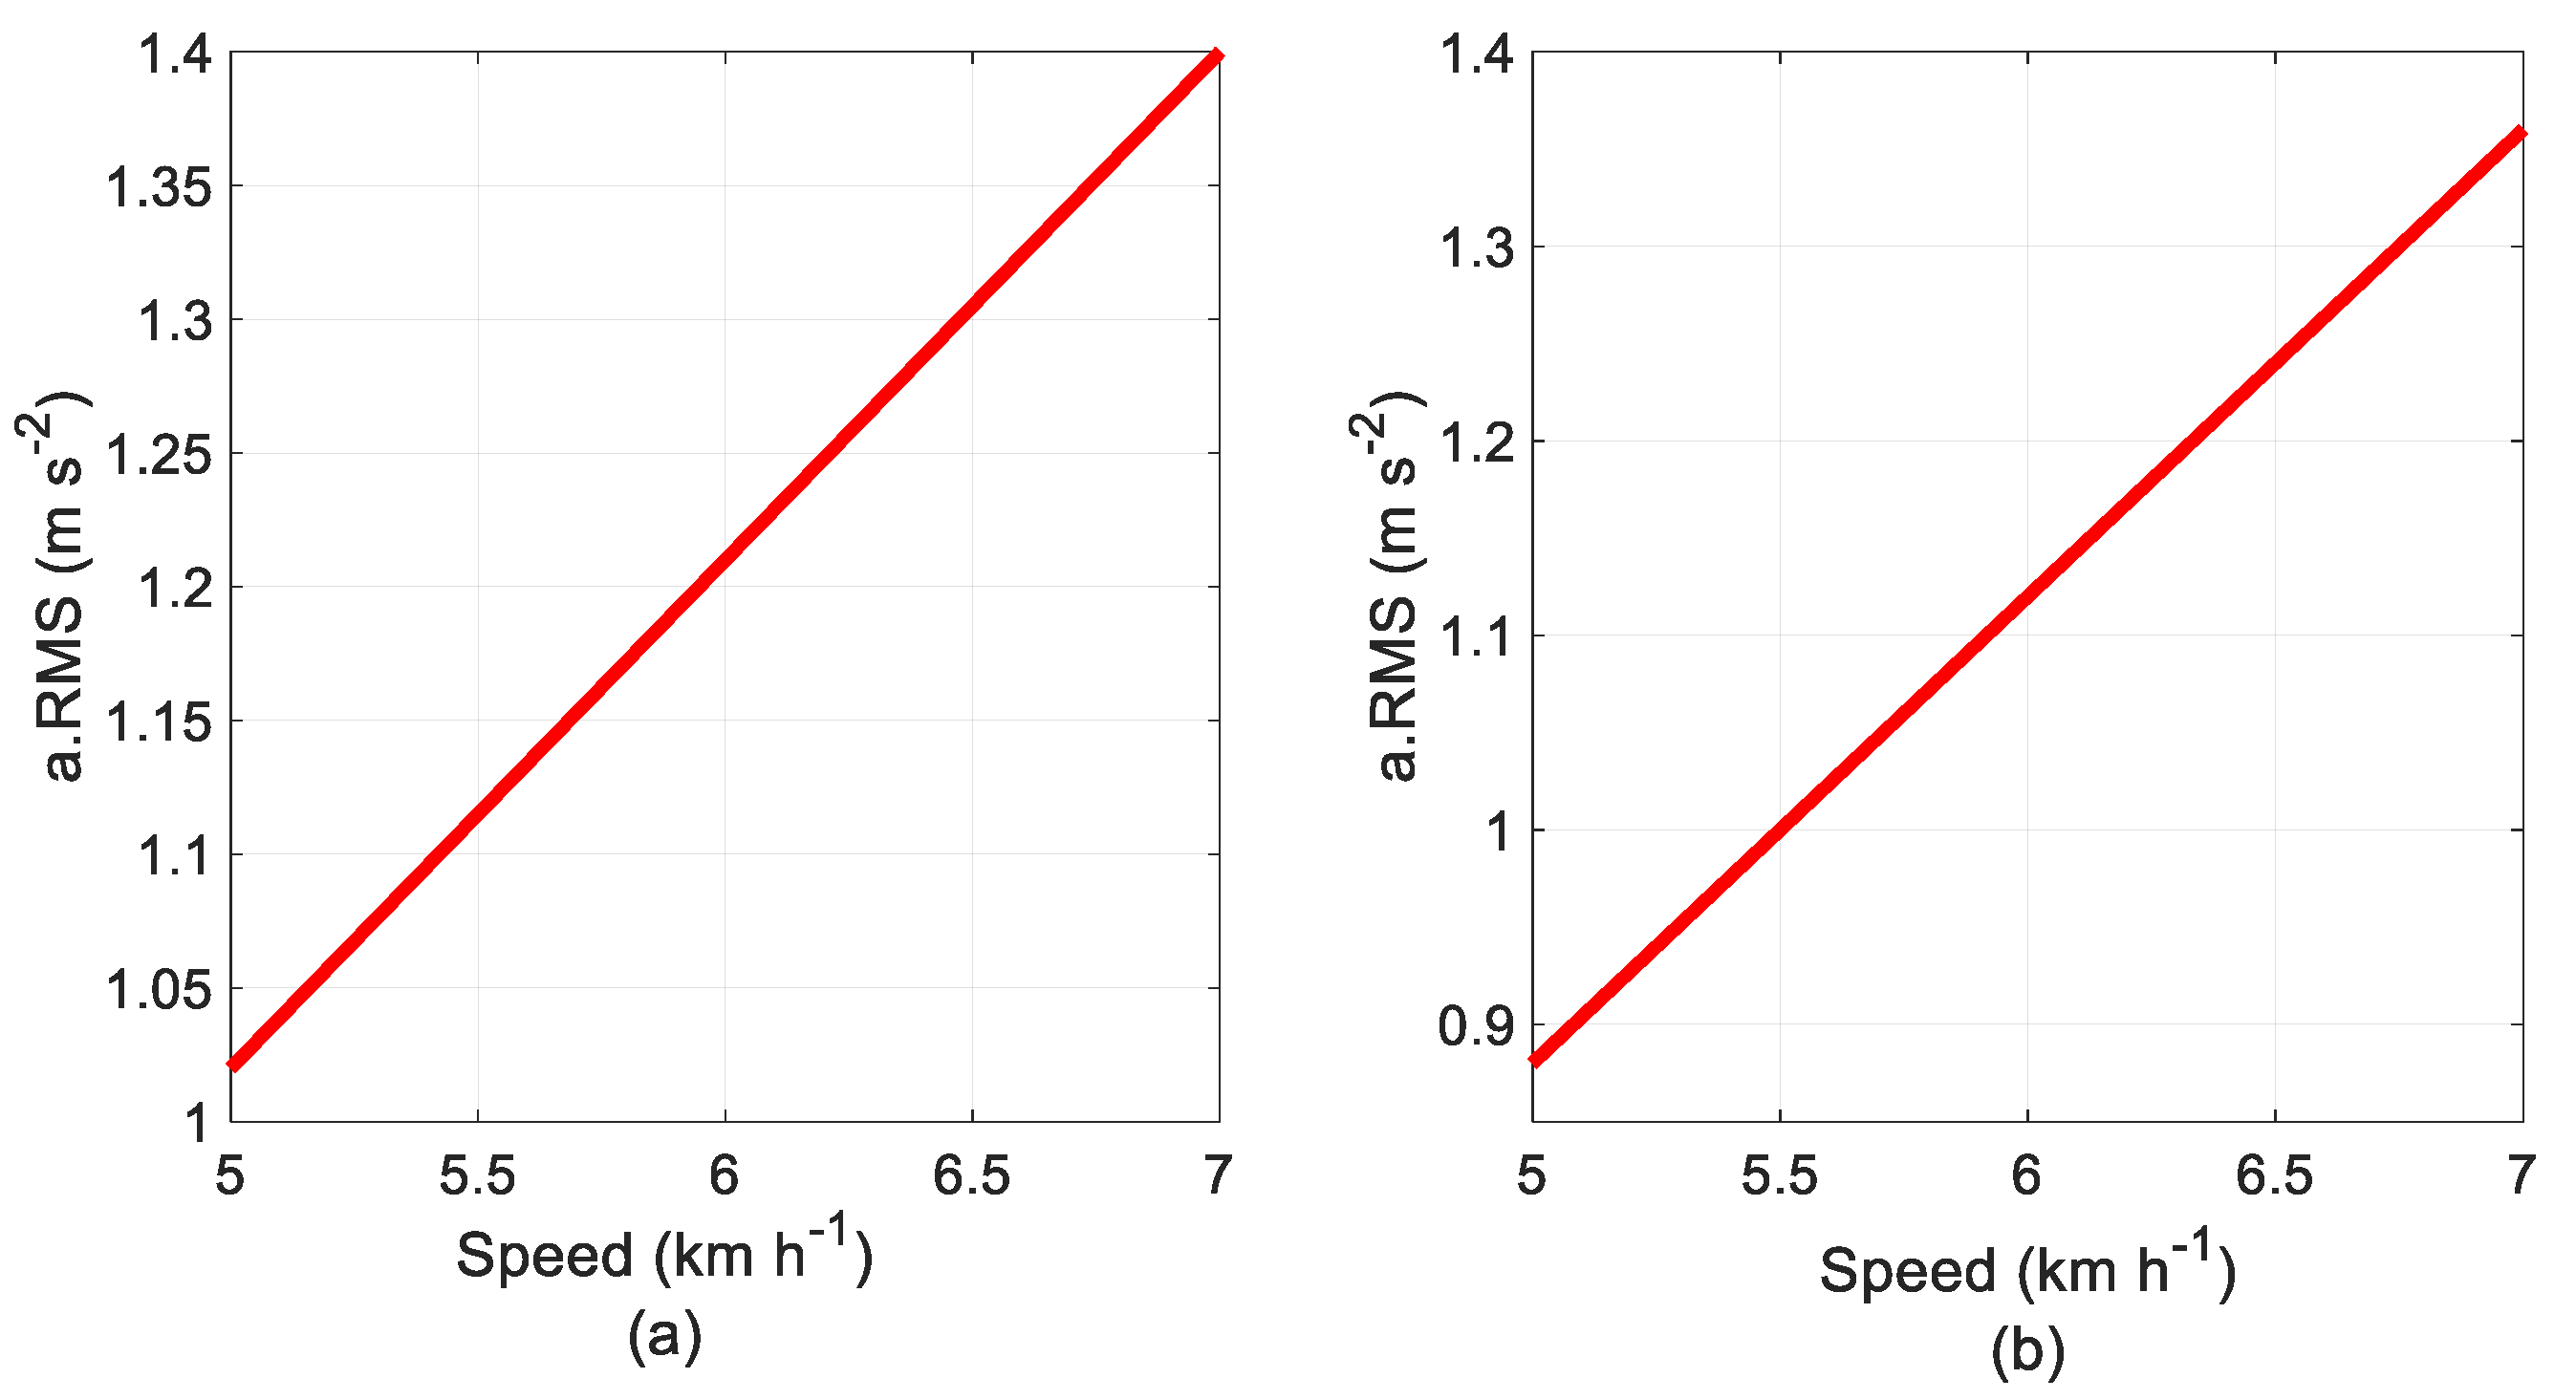
Figure 8.
Regression analysis of the speed factor for slopes D1 and D2.
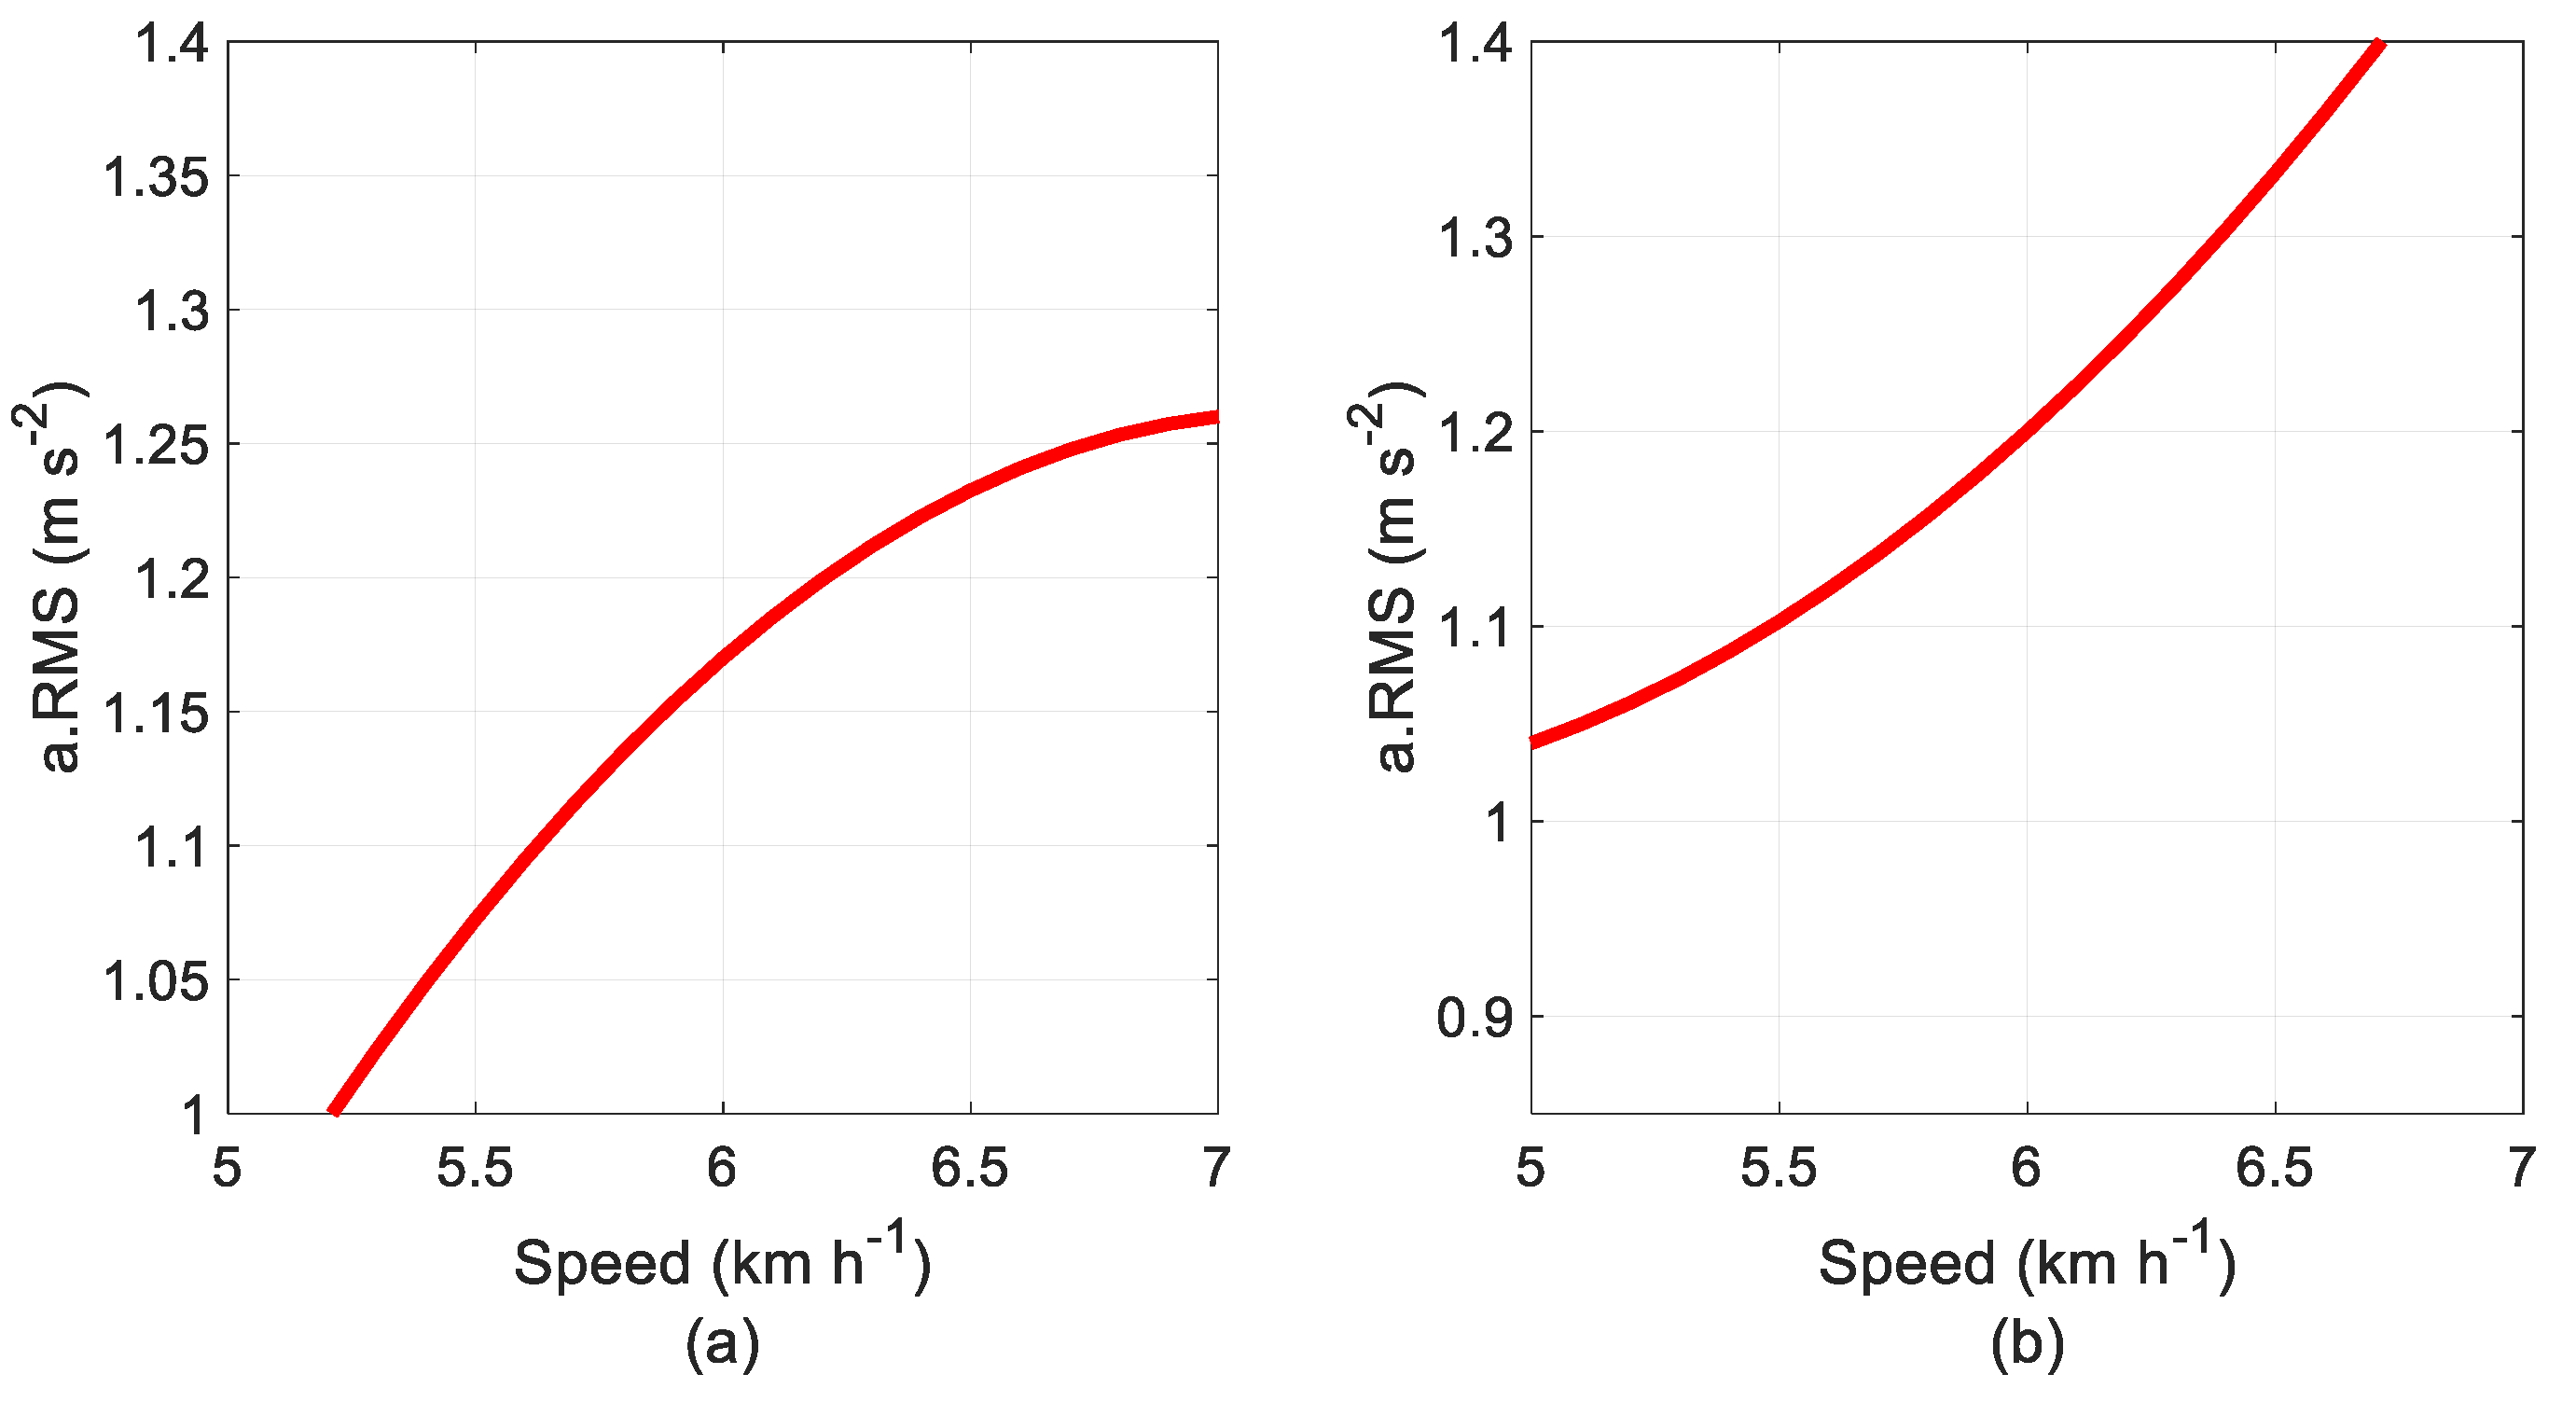

Table 1.
Variations in the paths, where “S” represents the speed, “D” represents the slope, “T” represents the path with the tractor without coupling, and “TS” represents the path of the tractor coupled to the seeder fertilizer.
Table 1.
Variations in the paths, where “S” represents the speed, “D” represents the slope, “T” represents the path with the tractor without coupling, and “TS” represents the path of the tractor coupled to the seeder fertilizer.
| S1 | S2 | S3 | |
|---|---|---|---|
| T-D1 | D1xS1 | D1xS2 | D1xS3 |
| T-D2 | D2xS1 | D2xS2 | D2xS3 |
| TS-D1 | D1xS1 | D1xS2 | D1xS3 |
| TS-D2 | D2xS1 | D2xS2 | D2xS3 |
Table 2.
Main results of the analysis of variance of the RMS acceleration determined in the rear axle, front axle, cabin floor, and operator’s seat.
Table 2.
Main results of the analysis of variance of the RMS acceleration determined in the rear axle, front axle, cabin floor, and operator’s seat.
| Front Axle | Rear Axle | Cabin Floor | Operator’s Seat | |
|---|---|---|---|---|
| M (Machinery) | F = 293.549 | 188.199 | F = 0.117 | F = 184.083 |
| p = 2e-16* | p = 2.68e-16* | p = 0.735 | p = 3.80e-16* | |
| D (Slope) | F = 53.507 | F = 9.934 | F = 42.255 | F = 123.813 |
| p = 9.26e-09* | p = 0.00316* | p = 1.18e-07* | p = 1.62e-13* | |
| S (Speed) | F = 15.903 | F = 19.417 | F = 71.828 | F = 215.028 |
| p = 9.59e-06* | p = 1.55e-06* | p = 1.23e-13* | p = 2e-16* | |
| D:S | F = 0.211 | F = 1.826 | F = 0.395 | F = 22.417 |
| p = 0.811 | p = 0.17492 | p = 0.676 | p = 3.71e-07 | |
| M:D | F = 2.368 | F = 54.833 | F = 0.820 | F = 0.097 |
| p = 0.132 | p = 7.01e-09* | p = 0.371 | p = 0.7568 | |
| M:S | F = 42.174 | F = 13.886 | F = 0.747 | F = 4.395 |
| p = 2.25e-10* | p = 2.97e-05* | p = 0.480 | p = 0.0192* |
* Significant at the 5% probability level.
Table 3.
Results of the analysis of the machinery factor at each level of the travel speed factor.
| Speed (km h-1) | Machinery | Floor (m s-2) |
|---|---|---|
| 5 | Tractor (T) | 1.02 a |
| Tractor-Seeder (TS) | 0.87 b | |
| 6 | Tractor (T) | 1.20 a |
| Tractor-Seeder (TS) | 1.04 b | |
| 7 | Tractor (T) | 1.40 a |
| Tractor-Seeder (TS) | 1.16 b |
Different letters at each speed indicate a significant difference according to the Tukey test at 5% probability.
Table 4.
Results of the analysis of the slope factor at each level of the travel speed factor.
| Speed (km h-1) | Slope | Floor (m s-2) |
|---|---|---|
| 5 | D1 | 0.88 b |
| D2 | 1.00 a | |
| 6 | D1 | 1.09 a |
| D2 | 1.14 a | |
| 7 | D1 | 1.15 b |
| D2 | 1.42 a |
Different letters at each speed indicate a significant difference according to the Tukey test at 5% probability.
Table 5.
Main results of the analysis of variance of the RMS accelerations for the transmissibilities.
Table 5.
Main results of the analysis of variance of the RMS accelerations for the transmissibilities.
| T1 | T2 | T3 | |
|---|---|---|---|
| M | F = 215.349 | F = 48.085 | F = 93.311 |
| p = 2e-16* | p = 3.02e-08* | p = 8.86e-12 | |
| D | F = 5.252 | F = 46.145 | F = 3.308 |
| p = 0.027549* | p = 4.69e-08* | p = 0.0768 | |
| S | F = 21.902 | F = 20.497 | F = 56.271 |
| p = 4.71e-07* | p = 9.16e-07* | p = 4.37e-12* | |
| D:S | F = 0.116 | F = 0.186 | F = 13.766 |
| p = 0.890733 | p = 0.83078 | p = 3.19e-05* | |
| M:D | F = 16.462 | F = 35.863 | F = 0.145 |
| p = 0.000238* | p = 5.90e-07* | p = 0.7056 | |
| M:S | F = 43.092 | F = 7.013 | F = 1.355 |
| p = 1.69e-10* | p = 0.00256* | p = 0.2702 |
* Significant at the 5% probability level.
Table 6.
Results of the analysis of the machinery factor at each level of the travel speed factor.
| Speed (km h-1) | Machinery | T1 | T2 | T3 |
|---|---|---|---|---|
| 5 | Tractor | 0.89 a | 1.25 a | 0.81 a |
| Tractor-Seeder | 0.56 b | 0.96 b | 0.71 b | |
| 6 | Tractor | 0.94 a | 1.35 a | 0.76 a |
| Tractor-Seeder | 0.71 b | 1.22 a | 0.69 b | |
| 7 | Tractor | 0.75 a | 1.21 a | 0.90 a |
| Tractor-Seeder | 0.72 a | 1.13 a | 0.79 b |
Different letters at each speed indicate a significant difference according to the Tukey test at 5% probability.
Table 7.
Breakdown of the slope (D) and speed (S) factors for transmissibilities T1, T2 and T3.
| Speed (km h-1) | Slope | T1 | T2 | T3 |
|---|---|---|---|---|
| 5 | D1 | 0.75 a | 1.02 a | 0.76 a |
| D2 | 0.71 a | 1.19 a | 0.77 a | |
| 6 | D1 | 0.84 a | 1.21 b | 0.75 a |
| D2 | 0.81 a | 1.37 a | 0.70 a | |
| 7 | D1 | 0.75 a | 1.10 b | 0.80 b |
| D2 | 0.72 a | 1.24 a | 0.88 a |
Different letters at each speed indicate a significant difference according to the Tukey test at 5% probability.
Disclaimer/Publisher’s Note: The statements, opinions and data contained in all publications are solely those of the individual author(s) and contributor(s) and not of MDPI and/or the editor(s). MDPI and/or the editor(s) disclaim responsibility for any injury to people or property resulting from any ideas, methods, instructions or products referred to in the content. |
© 2026 by the authors. Licensee MDPI, Basel, Switzerland. This article is an open access article distributed under the terms and conditions of the Creative Commons Attribution (CC BY) license.
Copyright: This open access article is published under a Creative Commons CC BY 4.0 license, which permit the free download, distribution, and reuse, provided that the author and preprint are cited in any reuse.


