
Submitted:
15 January 2026
Posted:
16 January 2026
You are already at the latest version
Abstract
Porous eco-materials—such as perlite, pumice composites, foamed concretes, and bio-derived cellular solids—are increasingly used in sustainable construction due to their low density, thermal insulation capacity, and reduced environmental impact. However, their mechanical characterization remains incomplete, particularly with respect to transverse shear behavior. Classical formulas for the shear correction factor ks, typically derived for homogeneous continua, are unsuitable for porous media exhibiting local density gradients, irregular pore morphologies, and spatially varying stiffness. This paper presents a generalized analytical–numerical methodology for evaluating the shear correction factor in a wide class of porous eco-materials. The approach is based on the strain-energy equivalence principle and uses a continuous stiffness model that reflects density-dependent elastic properties. A voxel-based microstructural representation is employed to validate the analytical predictions and to quantify the influence of heterogeneity on the shear stress distribution. Perlite is used as a representative case study, demonstrating how classical homogeneous formulas may produce errors exceeding 40%, while the proposed method provides significantly improved agreement with numerical benchmarks. The framework is applicable to a broad range of porous materials and offers a consistent basis for predicting transverse shear stiffness in lightweight fillers, thermal barriers, and fire-protective building components where shear deformation is critical.
Keywords:
porous materials
; perlite
; shear correction factor
; Timoshenko theory
; heterogeneous media
; lightweight eco-materials
; microstructure modelling
; strain-energy equivalence
1. Introduction
The growing demand for environmentally responsible construction materials has reshaped contemporary building technologies, motivating the development and adoption of lightweight, low-carbon, and resource-efficient alternatives to conventional mineral composites [1,2]. Among these innovations, porous eco-materials—such as expanded perlite, pumice–cement composites, foamed concretes, mycelium-based biocomposites, and other cellular solids of natural origin—have become an essential component of the sustainable construction landscape [3,4,5,6,7]. Their unique combination of low density, excellent thermal insulation [8], and reduced environmental footprint aligns directly with global decarbonization strategies and the principles of circular economy. For this reason, the present study highlights cutting-edge research aimed at transforming material engineering toward greener and more efficient solutions [9,10].
Despite their increasing use in structural and semi-structural applications, the mechanical characterization of porous eco-materials remains significantly underdeveloped [2,11]. In particular, their response to transverse shear—central to predicting deflections, ensuring serviceability, and assessing load-bearing capacity in beams, slabs, sandwich panels, and prefabricated insulation elements—continues to pose a methodological challenge [12,13]. Classical formulations of the shear correction factor , derived for homogeneous and prismatic continua [14,15], assume uniform stiffness distributions and do not capture the intrinsic heterogeneity of cellular and porous microstructures. As a result, applying such simplified formulas to highly inhomogeneous materials may lead to substantial errors in predicted shear stiffness, inaccurate modelling of deformation mechanisms, and unreliable structural performance assessments [16,17].
Porous media exhibit a rich variety of microstructural features [18] —nonuniform pore sizes, density gradients, irregular void geometries, anisotropic skeleton arrangements, and local necking phenomena—that strongly influence the distribution of transverse shear stresses [19,20]. These characteristics inherently violate the assumptions underlying classical Timoshenko beam and Mindlin plate theories, where the shear correction factor has traditionally been expressed in closed form for isotropic solids with rectangular or circular cross-sections [13,14,15,21]. The deviation from homogeneity is not merely a minor perturbation; instead, it represents a fundamental departure from the continuum hypothesis, causing the actual shear strain energy to differ substantially from that predicted by simplified models.
In the context of green construction technologies, accurate mechanical modelling is of particular importance. Many porous eco-materials are used in applications where shear deformation governs the overall behavior: thermal insulation panels subjected to in-plane racking [22,23], lightweight fillers in composite floor systems, fire-resistant claddings [24,25,26], or hollow and partially foamed prefabricated elements operating under combined bending and shear [27]. Recent studies emphasize the role of perlite in maintaining structural integrity under high-temperature conditions, suggesting its suitability for fire-resistant bituminous and cementitious composites [3]. Underestimating or overestimating the transverse shear stiffness may result in either overly conservative designs—which undermine the ecological and economic benefits of these materials—or unsafe structural assessments, especially in systems involving bending-dominated response [28].
Existing research has addressed parts of this challenge but remains fragmented [29]. Some studies adopt homogenization strategies, deriving effective stiffnesses based on averaged porosity or empirical density–modulus correlations [30,31,32,33]. Others employ full microstructural finite element models [34] to capture local stress concentrations and strain energy distributions [28,35,36]. Parallel to these mechanical approaches, data-driven techniques using machine learning and deep learning have recently emerged to estimate flow-related parameters and optimize geoengineering material properties, though they rarely address transverse shear mechanics directly. However, current approaches often lack a direct link to the shear correction factor formulation required by Timoshenko-type theories [12]. Moreover, there is still no widely accepted framework that connects microstructural heterogeneity with an equivalent macroscale shear correction factor that can be systematically applied in engineering analyses [37,38].
To address these limitations, the present paper proposes a generalized analytical–numerical methodology for evaluating the shear correction factor for a wide class of porous eco-materials. The approach extends the classical strain-energy equivalence principle [39] by introducing a spatially varying, density-dependent stiffness field that reflects the true mechanical heterogeneity of the medium. A voxel-based microstructural representation is employed to resolve local shear energy contributions, enabling a direct comparison between analytical predictions and numerical benchmarks. This dual-scale formulation not only enhances accuracy but also ensures that the method can be readily adapted to materials with arbitrary pore morphologies, including those produced through additive manufacturing or modern foaming technologies [40].
Perlite – a lightweight, naturally occurring material widely used in eco-insulation systems, lightweight mortars, and fire-resistant composites [1,41,42,43] – is selected as the representative case study [1,44,45]. Research indicates that while perlite significantly reduces density, its interaction with binders – such as polylactic acid or polypropylene – can be tuned to enhance specific mechanical performance. Moisture permeability, however, remains a critical factor in hygrothermal assessment. Its highly variable porosity and nonlinear relationship between density and elastic parameters make it an ideal material for evaluating the limitations of classical homogeneous formulas [46,47]. As will be demonstrated, standard expressions for may produce errors exceeding 70% or more [48] when applied to such materials, while the proposed methodology achieves substantially improved agreement with numerical simulations. These findings have practical implications for the design of sustainable structural components, where reliable shear stiffness predictions are essential for performance optimization [35,49].
Overall, this work contributes to the ongoing transformation of the construction industry toward low-impact, high-efficiency material solutions. What distinguishes the present work from existing approaches is the consistent integration of an analytical strain-energy formulation with a microstructure-resolved voxel model, enabling a direct quantification of how local density gradients and pore morphology influence the effective transverse shear stiffness. Unlike classical derivations, which rely on idealized assumptions of homogeneity [13,15,50], the proposed method explicitly accounts for spatial variations in stiffness and provides a shear correction factor that emerges naturally from the heterogeneous energy distribution. This dual-scale formulation allows for transparent identification of the mechanisms responsible for deviations from classical values and offers a unified procedure that can be applied to materials with arbitrary pore architectures. In the concluding part of this study, we demonstrate how the method bridges analytical theory and numerical simulation, showing excellent consistency between predicted and computed shear strain energies, and we present a clear interpretation of how microstructural features drive the observed discrepancies. The resulting framework not only yields accurate values but also provides practical guidelines for designers working with lightweight eco-materials, illustrating which microstructural characteristics most strongly govern shear behavior and how they can be optimized in advanced sustainable construction applications.
2. Materials and Methods
This section develops a generalized analytical–numerical methodology for evaluating the shear correction factor in heterogeneous porous eco-materials. The formulation begins with the classical strain–energy equivalence for homogeneous materials and then systematically extends it to cross-sections with spatially varying stiffness. A voxel-based discretization permits direct use of microstructural data and accommodates arbitrary pore morphologies.
2.1. Classical Definition of the Shear Correction Factor
In Timoshenko beam theory, the effective transverse shear stiffness is expressed as
where is the cross-sectional area, is the shear modulus, and is the shear correction factor (SCF) [51]. The SCF is defined via the equivalence between the real shear strain energy of the cross-section and the simplified energy assumed in Timoshenko theory.
The real shear energy for a shear force V is
while the Timoshenko model assumes
Introducing the normalized shear-stress function
the shear correction factor for a homogeneous material becomes
This expression applies only when the material is homogeneous and the modulus is constant. For a homogeneous rectangular cross-section of width and height , the exact shear-stress distribution under a shear force is
Substituting Eq. (6) into Eq. (2) and integrating over the height yields the exact real shear energy
Equating Eqs. (3) and (7) gives the classical shear correction factor for a homogeneous rectangular section:
This value serves as the reference baseline for all heterogeneous cases.
2.2. Geometric Shear-Stress Distribution
For an arbitrary prismatic cross-section subjected to a shear force , the exact shear-stress distribution obtained from sectional equilibrium is
where: is the material width at height , is the first moment of area, is the second moment of area.
The corresponding normalized form is
Equation (10) is purely geometric and remains valid for both homogeneous and heterogeneous materials. Material heterogeneity enters the formulation only through the energy integral.
2.3. Generalized Shear Correction Factor for Heterogeneous Materials
Porous eco-materials exhibit spatial variation of stiffness. The shear modulus becomes a function of position:
Substituting Eq. (4) into Eq. (2) yields the heterogeneous real shear energy:
Using the Timoshenko energy (3), the heterogeneous shear correction factor becomes
where is a reference modulus (e.g., matrix modulus, maximum local modulus, or the average modulus of the solid phase). Equation (13) reduces to the classical homogeneous expression (5) when everywhere.
2.4. Voxel-Based Representation of the Microstructure
Real porous materials cannot be described analytically; therefore, the cross-section is discretized into voxels with:
- material indicator
- local modulus
- pixel area
The geometric properties become:
The geometric shear form becomes
The heterogeneous energy integral (13) is approximated by
Hence the final discrete form of the shear correction factor is
Equation (21) is the core formula used in all subsequent numerical analyses.
2.5. Computational Procedure
The voxel-based algorithm proceeds as follows (see Figure 1).
The classical homogeneous value is expressed in Eq. (8). Comparing Eqs. (21) and (8) quantifies the influence of heterogeneity, porosity, and pore morphology.
3. Results
This section presents a quantitative assessment of the proposed analytical–numerical methodology for determining the shear correction factor in porous eco-materials. The discussion focuses on: (i) the density-dependent stiffness distribution in a perlite-based composite; (ii) the resulting shear stress and shear-energy fields obtained from the voxel-based analytical model; (iii) the deviation of the heterogeneous correction factor from the classical homogeneous value ; (iv) the sensitivity of to relative density and pore morphology. Perlite is used as the representative case study; however, the analysis is general and applicable to a broad class of porous materials.
3.1. Density-Dependent Stiffness Distribution
The first step of the evaluation involves generating a spatially varying stiffness field , derived from the experimentally calibrated density–modulus relationship. Figure 2 presents the resulting distribution for the representative perlite sample.
The plot highlights strong stiffness gradients, particularly between solid grains and highly porous regions. These variations directly influence the local shear energy and show that assuming constant stiffness for such materials is physically unjustified.
3.2. Shear Stress and Shear-Energy Distribution from the Voxel-Based Model
Using the geometric procedure described in Section 2, the normalized shear-stress form is computed row-by-row from Eq. (5), and the heterogeneous energy density is obtained from Eq. (6). Figure 3 illustrates the resulting shear-stress profile in the cross-section for a unit shear force .
To evaluate how heterogeneity affects energy storage, the local contribution to the shear energy is proportional to . Figure 4 shows the corresponding shear energy density
These results demonstrate that the global shear response is dominated by a subset of the microstructure exhibiting either low stiffness or geometric concentration of shear, confirming the need for an energy-based correction factor.
3.3. Generalized Shear Correction Factor vs Classical Homogeneous Value
For each microstructure considered, the heterogeneous shear correction factor is computed from Eq. (6). The classical homogeneous value obtained in Eq. (3) serves as a baseline corresponding to a beam with the same geometry but uniform modulus equal to . Table 1, Table 2, Table 3 and Table 4 summarizes the results for several density levels and corresponding microstructures (e.g., obtained by varying overall porosity while keeping geometry fixed, see Figure 5).
3.4. Effect of Material Heterogeneity and Relative Density on
To evaluate the robustness of the method, additional microstructures are generated for multiple density levels and pore architectures. Figure 6 summarizes the relationship between relative density / and the resulting shear correction factor.
The results typically reveal a monotonic approach of toward 5/6 as the material becomes denser. For highly porous microstructures, significantly exceeds 5/6, reflecting strong shear-stress nonuniformity and energy localization. As porosity decreases, the microstructure becomes more homogeneous, and the correction factor gradually converges to the classical value.
3.5. Sensitivity to Pore Morphology
To isolate the role of geometry, three idealized pore patterns are evaluated at comparable relative densities: (a) random irregular pores (representative of real perlite), (b) periodic circular voids, (c) and (d) periodic/shifted circular voids representing foaming. Figure 7 compares the shear energy distributions among these morphologies, and Table 5 collects the corresponding values of .
The reference numbers of pixels shown on Figure 7a-b are 10 501 for white and 14 509 for black. In all three regular patterns, this corresponds to 50 white circles with a radius of 8.18 px and 50 black circles with a radius of 9.61 px.
All patterns lead to the strongest energy localization and therefore the lowest k_s, while periodic circular morphologies exhibit the most uniform shear transfer, yielding higher correction factors. This clearly demonstrates that mainly porosity, not pore shape, is a key driver of transverse shear response in porous eco-materials.
4. Discussion
The results presented in Section 3 offer a comprehensive perspective on the transverse shear behavior of porous eco-materials and highlight the limitations of classical models when applied to heterogeneous microstructures. A central observation is that the heterogeneous shear correction factor obtained from Eq. (6) systematically deviates from the classical homogeneous value , with the discrepancy increasing as porosity and stiffness contrast grow. This is a direct manifestation of the fact that shear forces are transmitted preferentially through a sparse solid skeleton, while surrounding voids and weak zones contribute little to shear resistance.
The voxel-based energy maps reveal a pronounced localization of shear strain energy in narrow load paths and in regions of reduced stiffness. Only a subset of the microstructure contributes significantly to the global shear response, which explains why simplified homogeneous models misrepresent the effective stiffness. In particular, for low-density perlite microstructures, the present method predicts a shear correction factor substantially lower than 5/6, indicating that a naive application of the classical formula would overestimate the effective shear stiffness and underestimate deflections.
The sensitivity study with respect to pore morphology further clarifies the underlying mechanisms. Elongated voids and anisotropic pore clusters—typical of gravity-driven foaming or directional expansion—induce strong stiffness gradients and break the continuity of the solid skeleton, leading to elevated . In contrast, more isotropic, circular pores provide smoother stress paths and lower correction factors at the same relative density. This implies that density alone is insufficient to characterize shear behavior; microstructural shape descriptors are equally important. The proposed methodology naturally captures these effects because both density and morphology enter the formulation through the spatial field and the geometry of the voxelized cross-section.
An important outcome of this study is the emergence of a smooth and physically interpretable relationship between relative density and . As the material transitions from highly porous to nearly dense, the predicted correction factor gradually approaches 5/6, recovering the classical Timoshenko result in the dense limit. This provides a continuous bridge between the microstructure-resolved description and the homogeneous beam idealization and suggests that the proposed framework can serve as a basis for simplified design formulas linking to measurable morphological indicators.
Finally, although the current work relies exclusively on analytical energy arguments and voxel-based quadrature, the methodology remains fully compatible with more detailed numerical models, such as finite element simulations, should they be required in future studies. In its present form, however, the approach already delivers quantitatively meaningful correction factors and offers diagnostic insight into the role of microstructural heterogeneity. This combination of physical transparency and computational simplicity makes it attractive for engineering applications involving perlite-based composites and other porous eco-materials used in sustainable construction.
5. Conclusions
This study introduced a generalized analytical–numerical methodology for evaluating the shear correction factor in porous eco-materials, with particular emphasis on materials exhibiting pronounced microstructural heterogeneity such as perlite-based composites. The formulation builds on the strain-energy equivalence principle, extended to a spatially varying shear modulus field , and is implemented in a voxel-based framework that directly reflects microstructural features.
The analysis revealed that classical homogeneous formulas, such as the commonly used value for rectangular sections, may significantly misrepresent the transverse shear stiffness when applied to highly porous media. For low-density and irregular perlite microstructures, the heterogeneous correction factor is below 5/6, indicating that the effective shear stiffness is markedly lower than that predicted by homogeneous theory. Such discrepancies may lead to substantial inaccuracies in deformation predictions for beams, slabs, and composite elements incorporating porous eco-materials.
A key conclusion emerging from this work is the dominant role of microstructural features in shaping the global shear response. Pore elongation, anisotropic skeleton formation, and strong local stiffness gradients were shown to govern the spatial distribution of shear strain energy and, consequently, the magnitude of . These features, which cannot be captured by homogenized continuum approximations, must therefore be incorporated into any realistic mechanical characterization of lightweight sustainable materials.
Finally, the computed correction factors exhibit a smooth and physically intuitive dependence on relative density, forming a continuum that spans the transition from highly porous to nearly dense solids and converges to the classical value in the dense limit. This characteristic makes the proposed methodology broadly applicable and provides designers with a robust tool for predicting shear behavior across a wide range of eco-material architectures. Overall, the framework presented in this study enables more accurate modelling of transverse shear deformation and offers a clear pathway toward optimizing porous materials for advanced applications in sustainable construction.
Author Contributions
Conceptualization, T.Gar.; methodology, J.G. and T.Gar.; software, T.Gar.; validation, J.G. and T.Gaj.; formal analysis, J.G. and T.Gaj.; investigation, J.G. and T.Gaj; resources, T.Gaj.; data curation, J.G.; writing—original draft preparation, J.G. and T.Gar.; writing—review and editing, J.G. and T.Gaj; visualization, J.G. and T.Gaj.; supervision, T.Gar.; project administration, T.Gaj.; funding acquisition, T.Gar. All authors have read and agreed to the published version of the manuscript.
Funding
This research received no external funding.
Data Availability Statement
The data that support the findings of this study are available from the corresponding author upon reasonable request.
Conflicts of Interest
The authors declare no conflicts of interest.
Appendix A
Appendix A.1
This appendix provides a clear computational recipe for reproducing the heterogeneous shear correction factor defined in Eq. (6), without resorting to finite element simulations.
- A.1. Input
- 2D image IMG (grayscale, CT, or optical micrograph).
- Pixel size: , .
- Mapping from intensity to modulus: .
- Reference modulus: (G_ref).
- Material indicator (chi_ij, 1 = material, 0 = void).
- A.2. Compute Geometry
| A = 0 |
| num = 0 |
| for each row j: |
| y_j = y coordinate of row j |
| for each column i: |
| if chi_ij == 1: |
| A += dx * dy |
| num += y_j * dx * dy |
| y_bar = num / A |
| I = 0 |
| for each row j: |
| y_j = y coordinate of row j |
| for each column i: |
| if chi_ij == 1: |
| I += (y_j - y_bar)^2 * dx * dy |
- A.3. Compute Row Width and First Moment
| for each row j: |
| b_j = 0 |
| for each column i: |
| if chi_ij == 1: |
| b_j += dx |
| for each row j: |
| Q_j = 0 |
| for each row k >= j: |
| y_k = y coordinate of row k |
| row_width = 0 |
| for each column i: |
| if chi_ik == 1: |
| row_width += dx |
| Q_j += row_width * (y_k - y_bar) * dx * dy |
- A.4. Compute Shear Form Function
| for each row j: |
| if b_j > 0: |
| phi_j = Q_j / (I * b_j) |
| else: |
| phi_j = 0 |
- A.5. Compute Heterogeneous Shear Energy Term
| sum_phi2_over_G = 0 |
| for each row j: |
| for each column i: |
| if chi_ij == 1 and G_ij > 0: |
| sum_phi2_over_G += phi_j^2 * (1.0 / G_ij) * dx * dy |
- A.6. Compute Shear Correction Factor
Using Eq. (6):
| k_s = 1.0 / (G_ref * A * sum_phi2_over_G) |
- A.7. Comparison with Homogeneous Reference
To evaluate the influence of heterogeneity:
| k_ref = 5.0 / 6.0 # classical homogeneous value for a rectangular section |
| error = (k_s - k_ref) / k_ref * 100.0 # relative deviation in percent |
References
- Rashad, A.M. A synopsis about perlite as building material: A best practice guide for Civil Engineer. Constr. Build. Mater. 2016, 121, 338–353. [CrossRef]
- Orbulov, I.N.; Szlancsik, A.; Kemény, A.; Kincses, D. Low-Cost Light-Weight Composite Metal Foams for Transportation Applications. J. Mater. Eng. Perform. 2022, 31, 6954–6961. [CrossRef]
- Abed, A.T.; Éva, L. A comprehensive study of perlite in building materials: Balancing sustainability and performance. J. Therm. Anal. Calorim. 2025, 150, 10627–10643. [CrossRef]
- Cojocaru, A.; Isopescu, D.N.; Maxineasa, S.G. Perlite concrete: A review. IOP Conf. Ser. Mater. Sci. Eng. 2023, 1283.
- Topçu, I.B.; Işıkdağ, B. Effect of expanded perlite aggregate on the properties of lightweight concrete. J. Mater. Process. Technol. 2008, 198, 134–138.
- Dzięcioł, J.; Szlachetka, O. Waste or raw material? Perlite concrete as part of a sustainable materials management process in the construction sector. Sustainability 2024, 16, 6818. [CrossRef]
- Singh, M.; Garg, M. Perlite-based building materials: A review of current applications. Constr. Build. Mater. 1991, 5, 75–81.
- Qiao, Y.; Bian, X.; Ke, H.; Zhao, Z.; Zhang, X.; Zhang, X.; Zhao, Y.; Bai, C.; Zhang, L.; Zheng, T.; et al. Phenolic-based porous composite with embedded short carbon fiber/hollow spheres for mechanical properties and thermostability. Compos. Commun. 2025, 55, 102305. [CrossRef]
- Ciminli, A.T.; Bulut, H.A. A new approach for lightweight polymer concrete production: Determination of the influence of resin and perlite types on the mechanical performance of polymer concrete. Constr. Build. Mater. 2025, 490, 142608. [CrossRef]
- Koukouzas, N.K.; Dunham, A.C.; Scott, P.W. Suitability of Greek perlite for industrial applications. Trans. Inst. Min. Metall. B 2000, 109, 105–111.
- da Silva, M.T.Q.S.; Perretto, F.; do Rocio Cardoso, M.; Mazer, W. Porosity: Some characterization techniques. Mater. Today Proc. 2023. [CrossRef]
- Staszak, N.; Szymczak-Graczyk, A.; Garbowski, T. Elastic analysis of three-layer concrete slab based on numerical homogenization with an analytical shear correction factor. Appl. Sci. 2022, 12, 9918. [CrossRef]
- Kączkowski, Z. Płyty: Obliczenia Statyczne; Arkady: Warsaw, Poland, 2000.
- Timoshenko, S.; Woinowsky-Krieger, S. Teoria Płyt i Powłok; Arkady: Warsaw, Poland, 1962.
- Donnell, L.H. Beams, Plates and Shells; McGraw-Hill: New York, NY, USA, 1976.
- Garbowski, T.; Pawlak, T.G.; Szymczak-Graczyk, A. Efficient load-bearing capacity assessment of a degraded concrete manhole using sectional homogenization. Materials 2024, 17, 5883. [CrossRef]
- Pawlak, T.; Szymczak-Graczyk, A.; Garbowski, T. Three-layer repair coating system for manholes, pump stations and tanks in aggressive sulfate environment. Civ. Environ. Eng. Rep. 2025, 35, 1–19. [CrossRef]
- Taherishargh, M.; Belova, I.V.; Murch, G.E.; Fiedler, T. The effect of particle shape on mechanical properties of perlite/metal syntactic foam. J. Alloys Compd. 2017, 693. [CrossRef]
- Burriesci, N.; Arcoraci, C.; Antonucci, P.L.; Polizzotti, G. Physico-chemical characterization of perlite of various origins. Mater. Lett. 1985, 3, 103–110.
- Alexa-Stratulat, S.M.; Taranu, G.; Toma, A.M.; Olteanu, I.; Pastia, C.; Bunea, G.; et al. Effect of expanded perlite aggregates and temperature on the strength and dynamic elastic properties of cement mortar. Constr. Build. Mater. 2024, 438, 137229. [CrossRef]
- Carrera, E.; Giunta, G.; Petrolo, M. Beam Structures: Classical and Advanced Theories; John Wiley & Sons: Chichester, UK, 2011. [CrossRef]
- Jia, G.; Li, Z.; Liu, P.; Jing, Q. Preparation and characterization of aerogel/expanded perlite composite as building thermal insulation material. J. Non-Cryst. Solids 2018, 482, 192–202.
- Celik, S.; Family, R.; Menguc, M.P. Analysis of perlite and pumice based building insulation materials. J. Build. Eng. 2016, 6, 105–111. [CrossRef]
- Thanaraj, D.P.; Arulraj, P.; Al-Jabri, K. Investigation on structural and thermal performance of reinforced concrete beams exposed to standard fire. J. Build. Eng. 2020, 32, 101764. [CrossRef]
- Fletcher, I.; Welch, S.; Torero, J.; Carvel, R.; Usmani, A. Behaviour of concrete structures in fire. Therm. Sci. 2007, 11, 37–52. [CrossRef]
- Li, Z.; Zhou, X.; Shen, B. Fiber-cement extrudates with perlite subjected to high temperatures. J. Mater. Civ. Eng. 2004, 16, 221–229. [CrossRef]
- Ariyaratne, I.E.; Ariyanayagam, A.; Mahendran, M. Bushfire-resistant lightweight masonry blocks with expanded perlite aggregate. Fire 2022, 5, 132. [CrossRef]
- Szymczak-Graczyk, A. Rectangular plates of a trapezoidal cross-section subjected to thermal load. IOP Conf. Ser. Mater. Sci. Eng. 2019, 603, 032095. [CrossRef]
- Lim, T.-K.; Kim, J.-H. Thermo-elastic effects on shear correction factors for functionally graded beam. Compos. Part B Eng. 2017, 123, 262–270. [CrossRef]
- Babu, K.P.; Mohite, P.M.; Upadhyay, C.S. Development of an RVE and its stiffness predictions based on mathematical homogenization theory for short fibre composites. Int. J. Solids Struct. 2018, 130–131. [CrossRef]
- Erdem, T.K.; Meral, C.; Tokyay, M.; Erdoğan, T.Y. Use of perlite as a pozzolanic addition in producing blended cements. Cem. Concr. Compos. 2007, 29, 13–21.
- Sengul, O.; Azizi, S.; Karaosmanoglu, F.; Tasdemir, M.A. Effect of expanded perlite on the mechanical properties and thermal conductivity of lightweight concrete. Energy Build. 2011, 43, 671–676.
- Demirboğa, R.; Örüng, I.; Gül, R. Effects of expanded perlite aggregate and mineral admixtures on the compressive strength of low-density concretes. Cem. Concr. Res. 2001. [CrossRef]
- Anoukou, K.; Brenner, R.; Hong, F.; Pellerin, M.; Danas, K. Random distribution of polydisperse ellipsoidal inclusions and homogenization estimates for porous elastic materials. Comput. Struct. 2018, 210. [CrossRef]
- Ksit, B.; Szymczak-Graczyk, A.; Pilch, R. Numerical simulation of the impact of water vapour and moisture blockers in energy diagnostics of ventilated partitions. Materials 2022, 15, 8257. [CrossRef]
- Chen, K.; Qin, H.; Ren, Z. Establishment of the microstructure of porous materials and its relationship with effective mechanical properties. Sci. Rep. 2023, 13, 18064. [CrossRef]
- Dzięcioł, J.; Sas, W. Perspective on the application of machine learning algorithms for flow parameter estimation in recycled concrete aggregate. Materials 2023, 16, 1500.
- Zhang, W.; Gu, X.; Tang, L.; Yin, Y.; Liu, D.; Zhang, Y. Application of machine learning, deep learning and optimization algorithms in geoengineering and geoscience: Comprehensive review and future challenge. Gondwana Res. 2022, 109, 1–17.
- Isaksson, P.; Krusper, A.; Gradin, P.A. Shear correction factors for corrugated core structures. Compos. Struct. 2007, 80, 123–130.
- Szymczak-Graczyk, A.; Korentz, J.; Garbowski, T. Digital twin model for predicting hygrothermal performance of building materials from moisture permeability tests. Materials 2025, 18, 4360. [CrossRef]
- Jedidi, M.; Benjeddou, O.; Soussi, C. Effect of expanded perlite aggregate dosage on properties of lightweight concrete. Jordan J. Civ. Eng. 2015, 9, 278–291. [CrossRef]
- Mattausch, H.I.; Laske, S.; Cirar, K.; Flachberger, H.; Holzer, C. Fundamental investigations of reinforcement of expanded perlite in polypropylene. In New Developments in Polymer Composites Research; Nova Science Publishers: New York, NY, USA, 2013; 213–226.
- Sayadi, A.; Neitzert, T.R.; Clifton, G.C. Influence of poly-lactic acid on the properties of perlite concrete. Constr. Build. Mater. 2018, 189. [CrossRef]
- Al-Jadiri, R.S.F.; Al-Wahab Ali, M.A.; Frayyeh, Q.J. Study of some mechanical and thermal properties of reinforced perlite concrete. Key Eng. Mater. 2022, 924, 233–242.
- Khanna, P.; Mukulam, A.M.; Teja, K.V.; Meena, T. Study on durability properties of perlite incorporated concrete. Int. J. Civ. Eng. Technol. 2018, 9, 1545–1553.
- Villasmil, W.; Fischer, L.J.; Worlitschek, J. A review and evaluation of thermal insulation materials and methods for thermal energy storage systems. Renew. Sustain. Energy Rev. 2019, 103, 71–84.
- Ayfari, F.; Hesami, S. Development and evaluation of high-temperature resistant bituminous composites: Performance of expanded perlite and PTFE in asphalt mixtures. Case Stud. Constr. Mater. 2024, 21, e03955. [CrossRef]
- Hadavinia, H.; Gordnian, K.; Karwatzki, J.; Aboutorabi, A. Deriving shear correction factor for thick laminated plates using the energy equivalence method. Struct. Integr. Durab. 2006, 2, 197–206.
- Szymczak-Graczyk, A.; Gajewska, G.; Laks, I.; Kostrzewski, W. Influence of variable moisture conditions on the thermal conductivity of selected insulation materials used in passive buildings. Energies 2022, 15, 2626. [CrossRef]
- Gitman, I.M.; Askes, H.; Sluys, L.J. Representative volume: Existence and size determination. Eng. Fract. Mech. 2007, 74. [CrossRef]
- Garbowski, T., Graczyk, J. Shear correction factor in corrugated board layered plates. Polish Paper Review 2025, 81(12), 686-690. [CrossRef]
Figure 1.
Flowchart of pixel-based method.
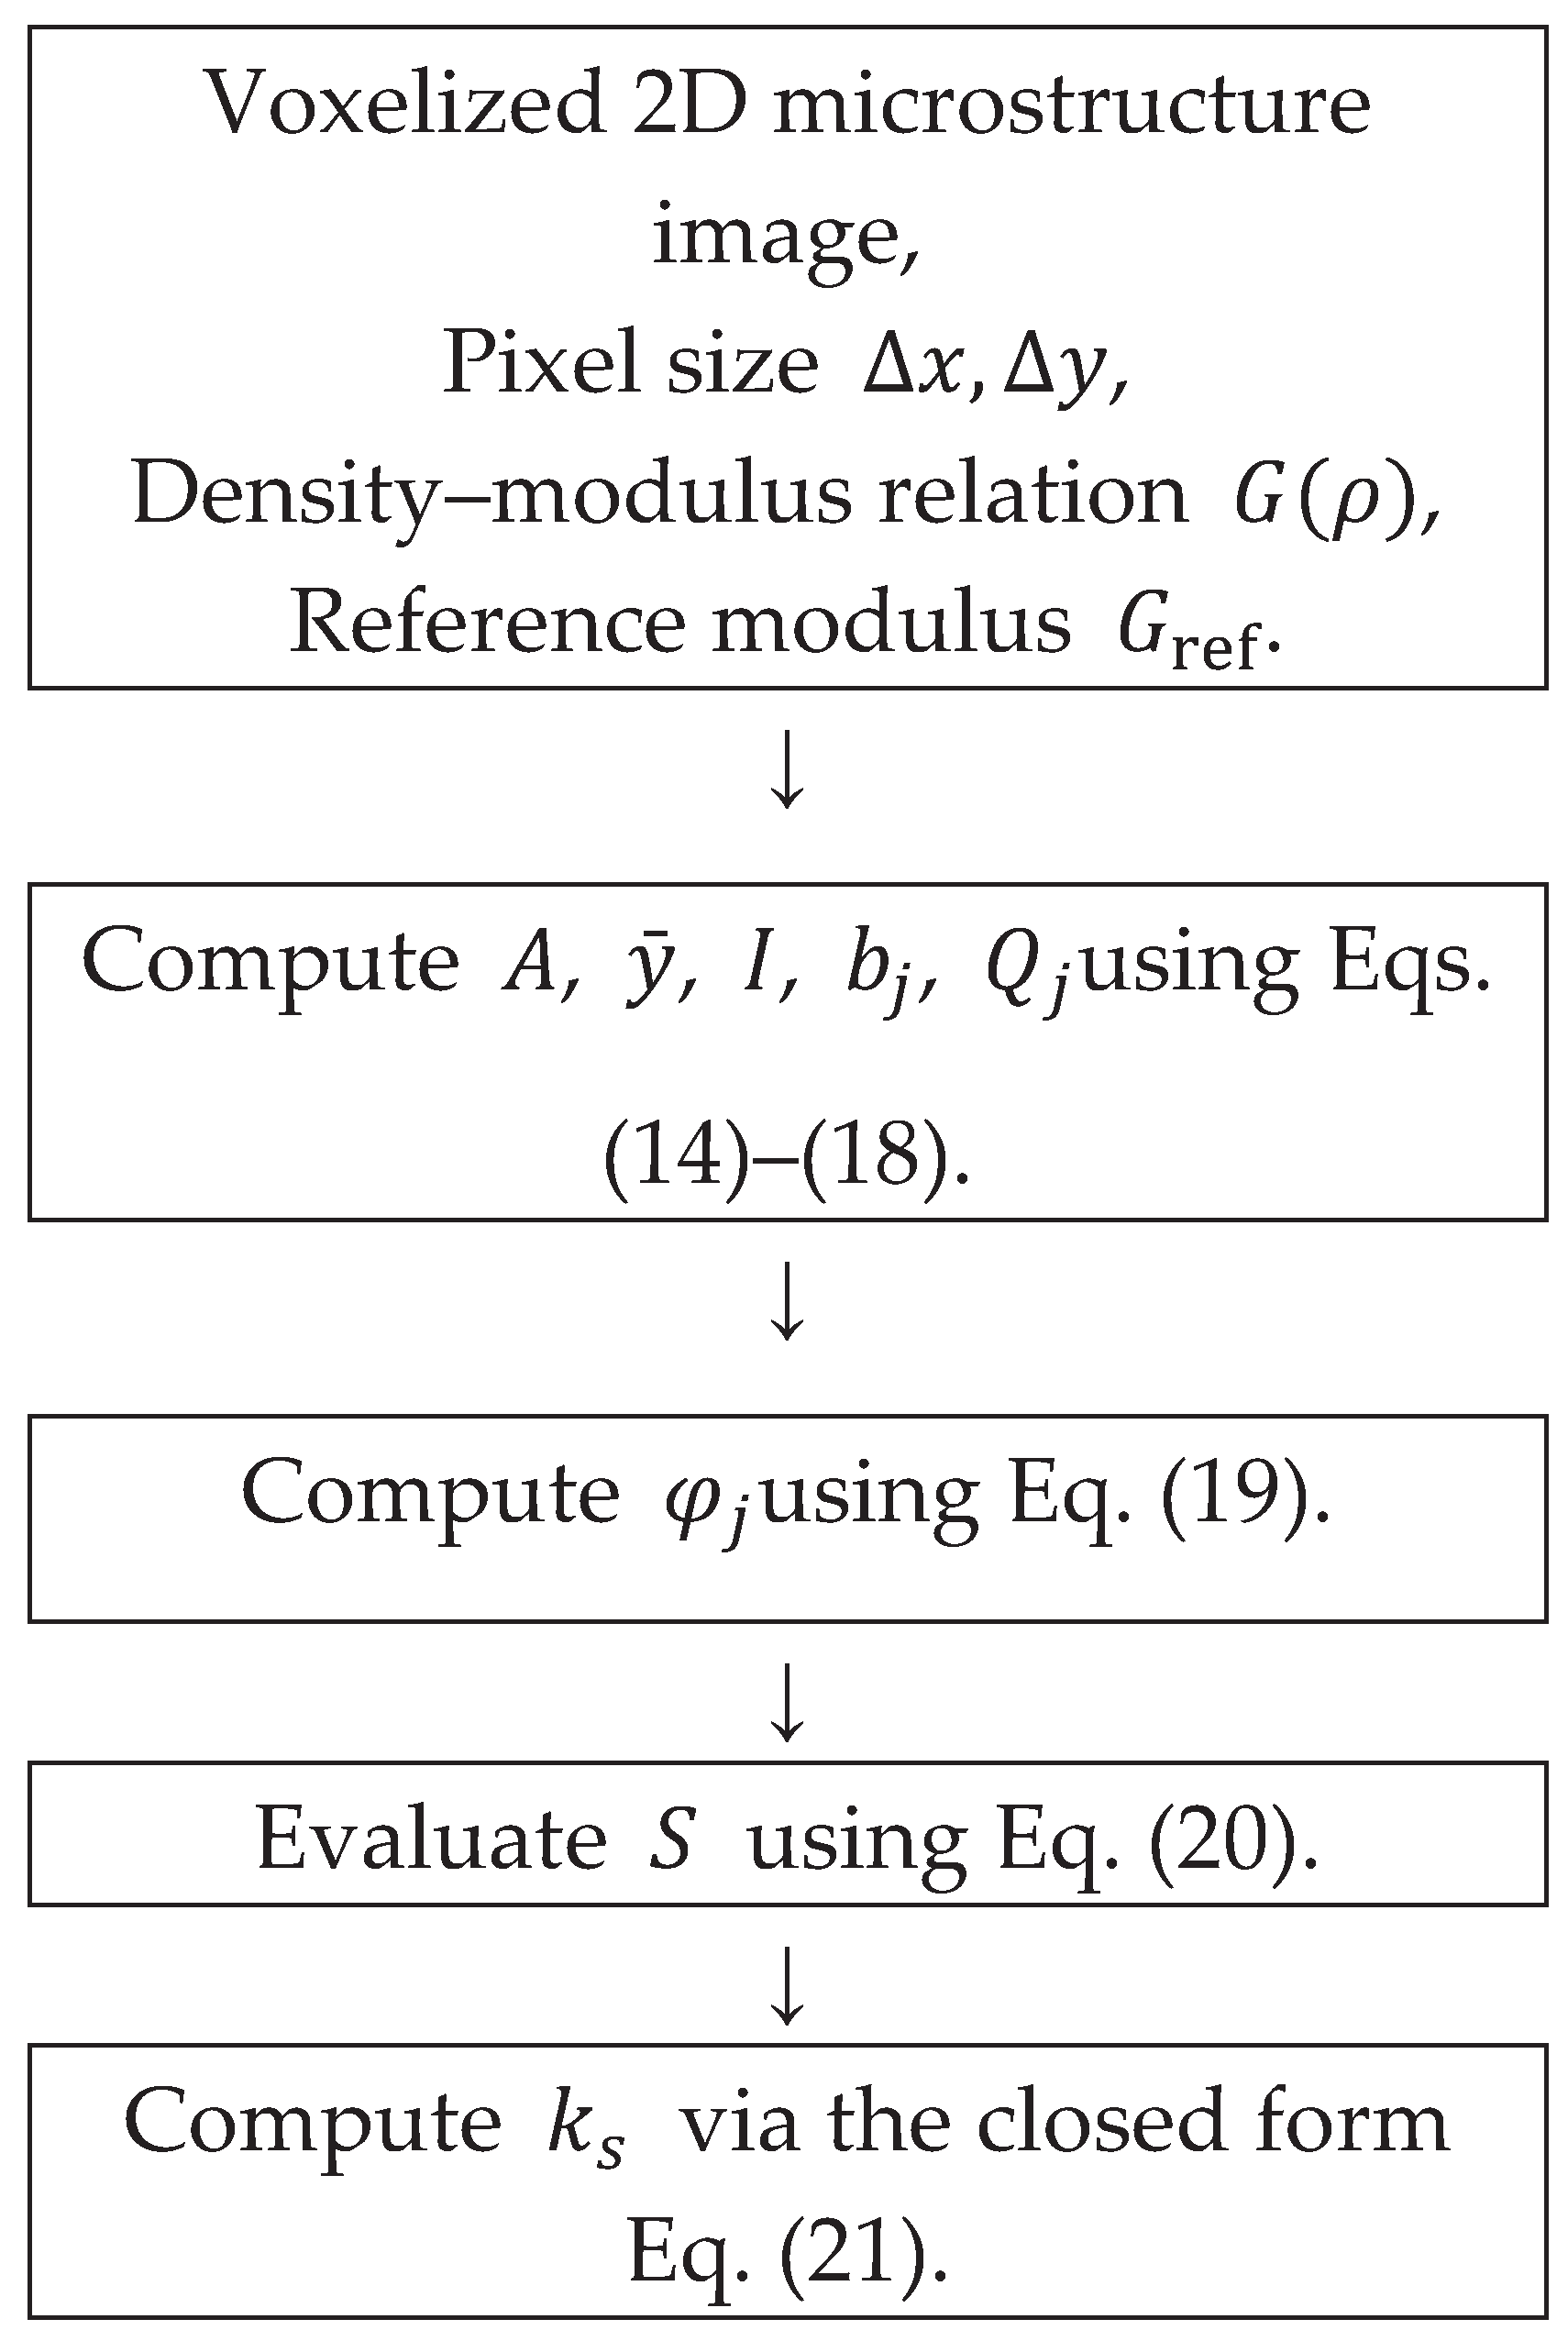
Figure 2.
Spatial distribution of density and shear modulus [MPa] in the perlite microstructure.
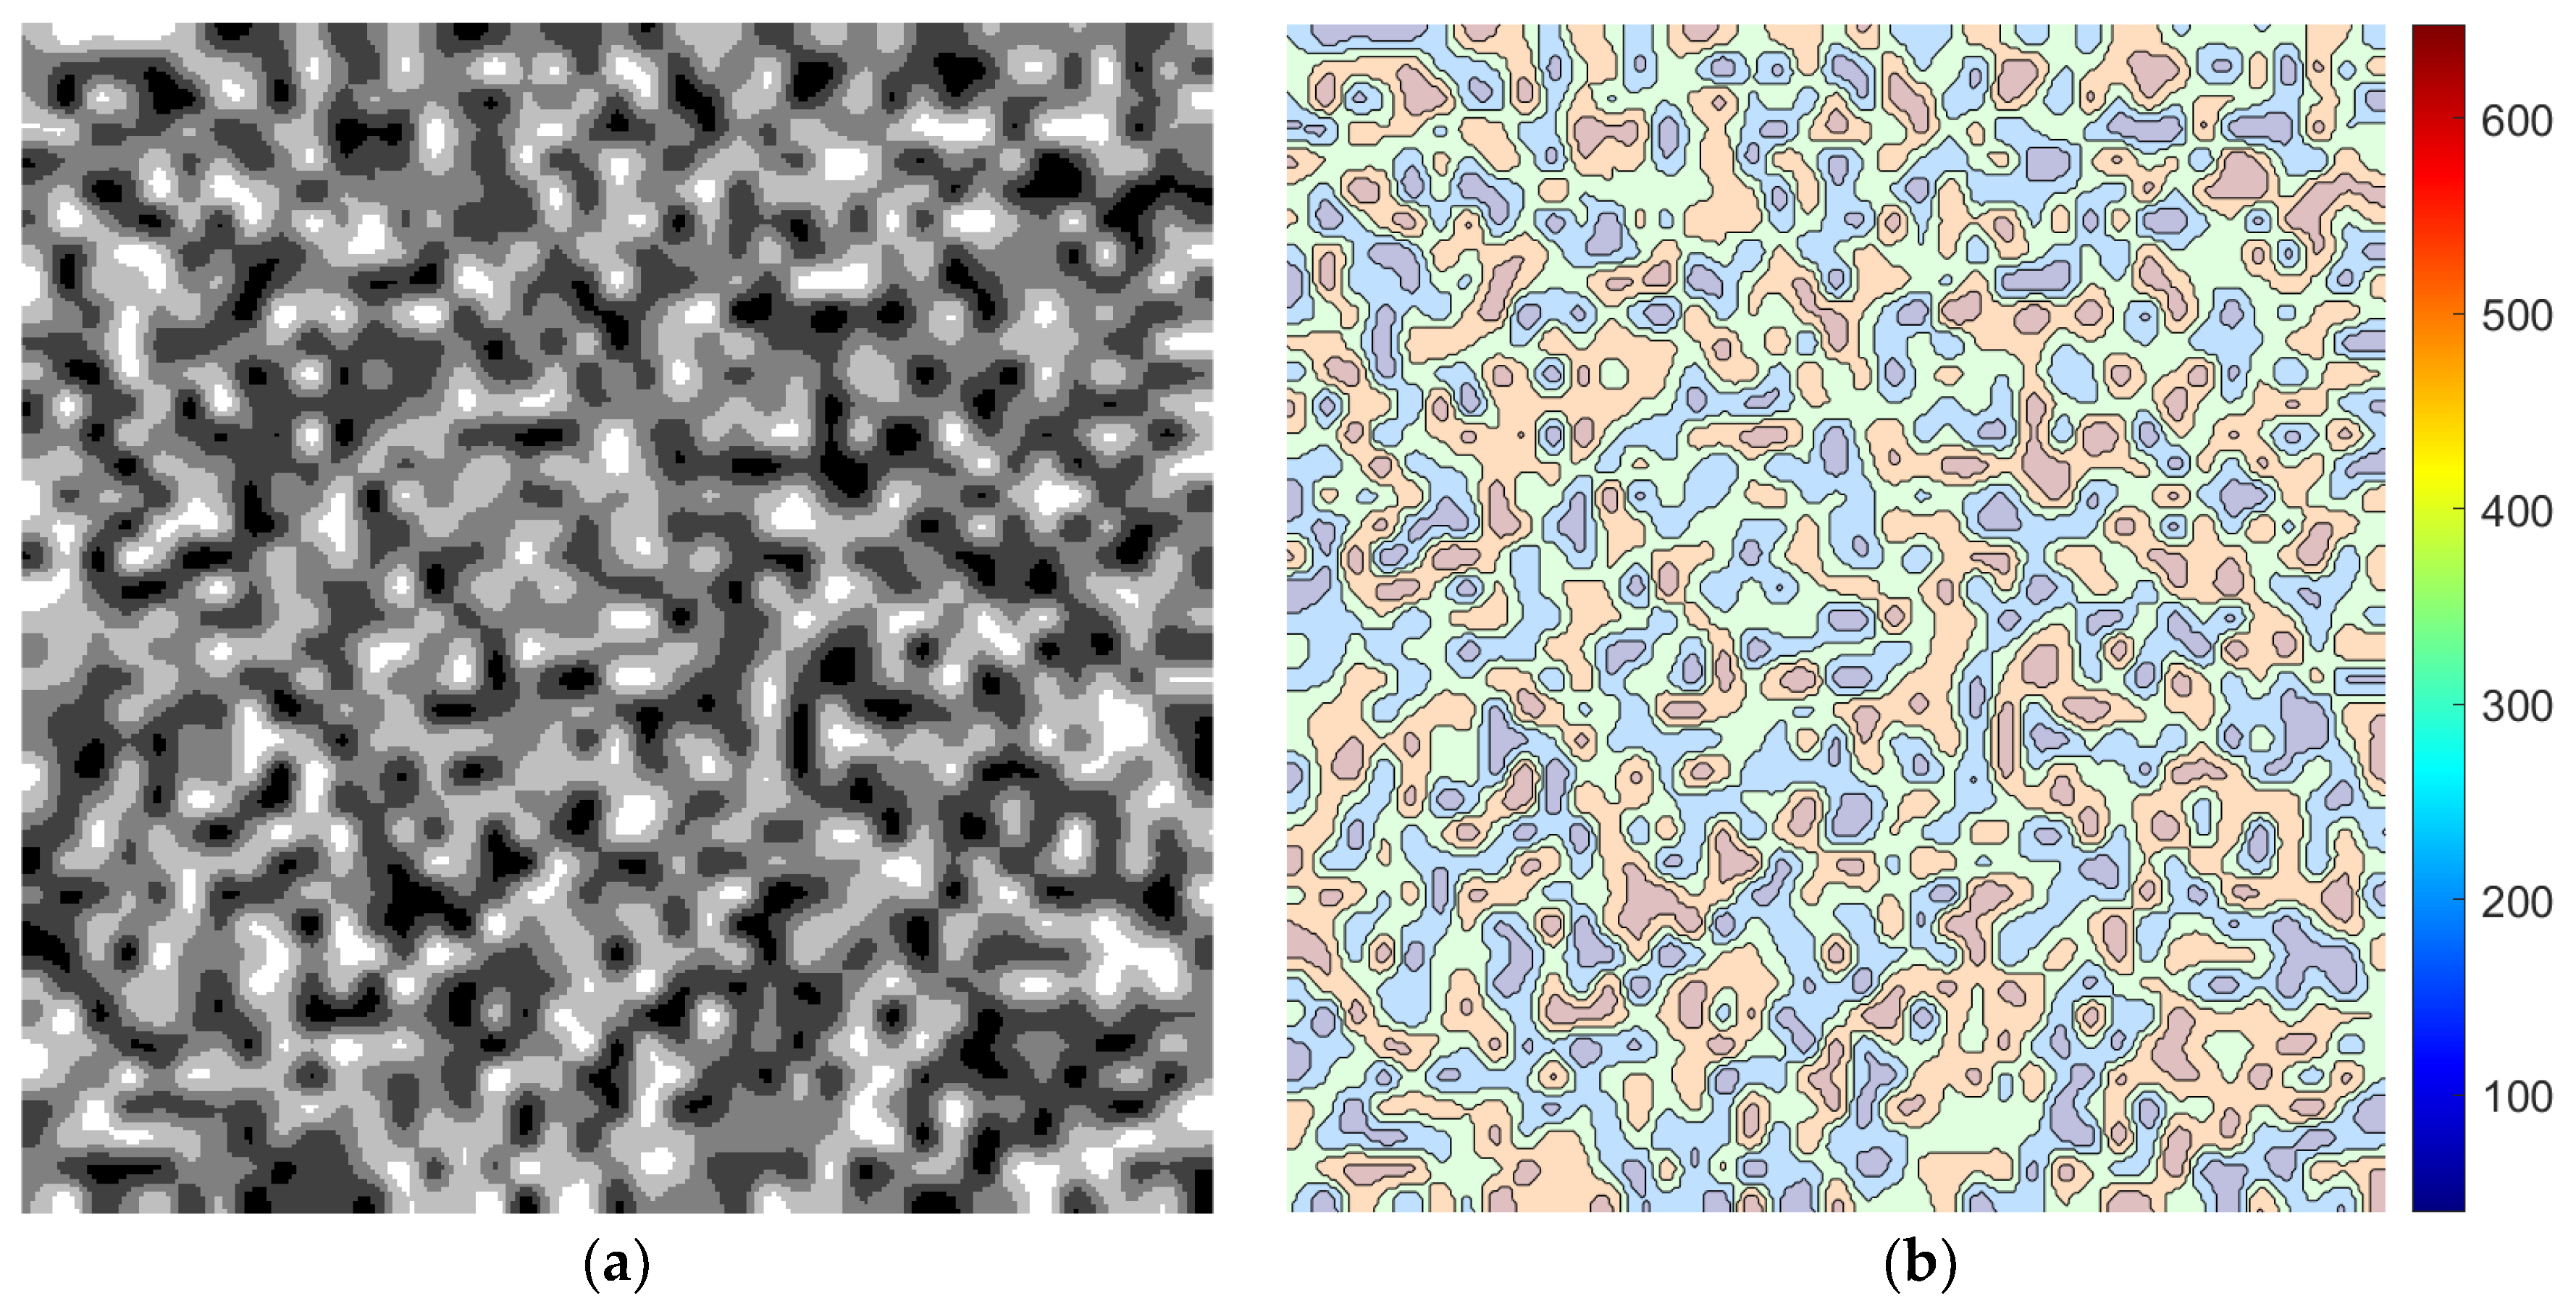
Figure 3.
Geometric shear-stress distribution obtained from the voxel-based analytical model for a unit shear force.
Figure 3.
Geometric shear-stress distribution obtained from the voxel-based analytical model for a unit shear force.
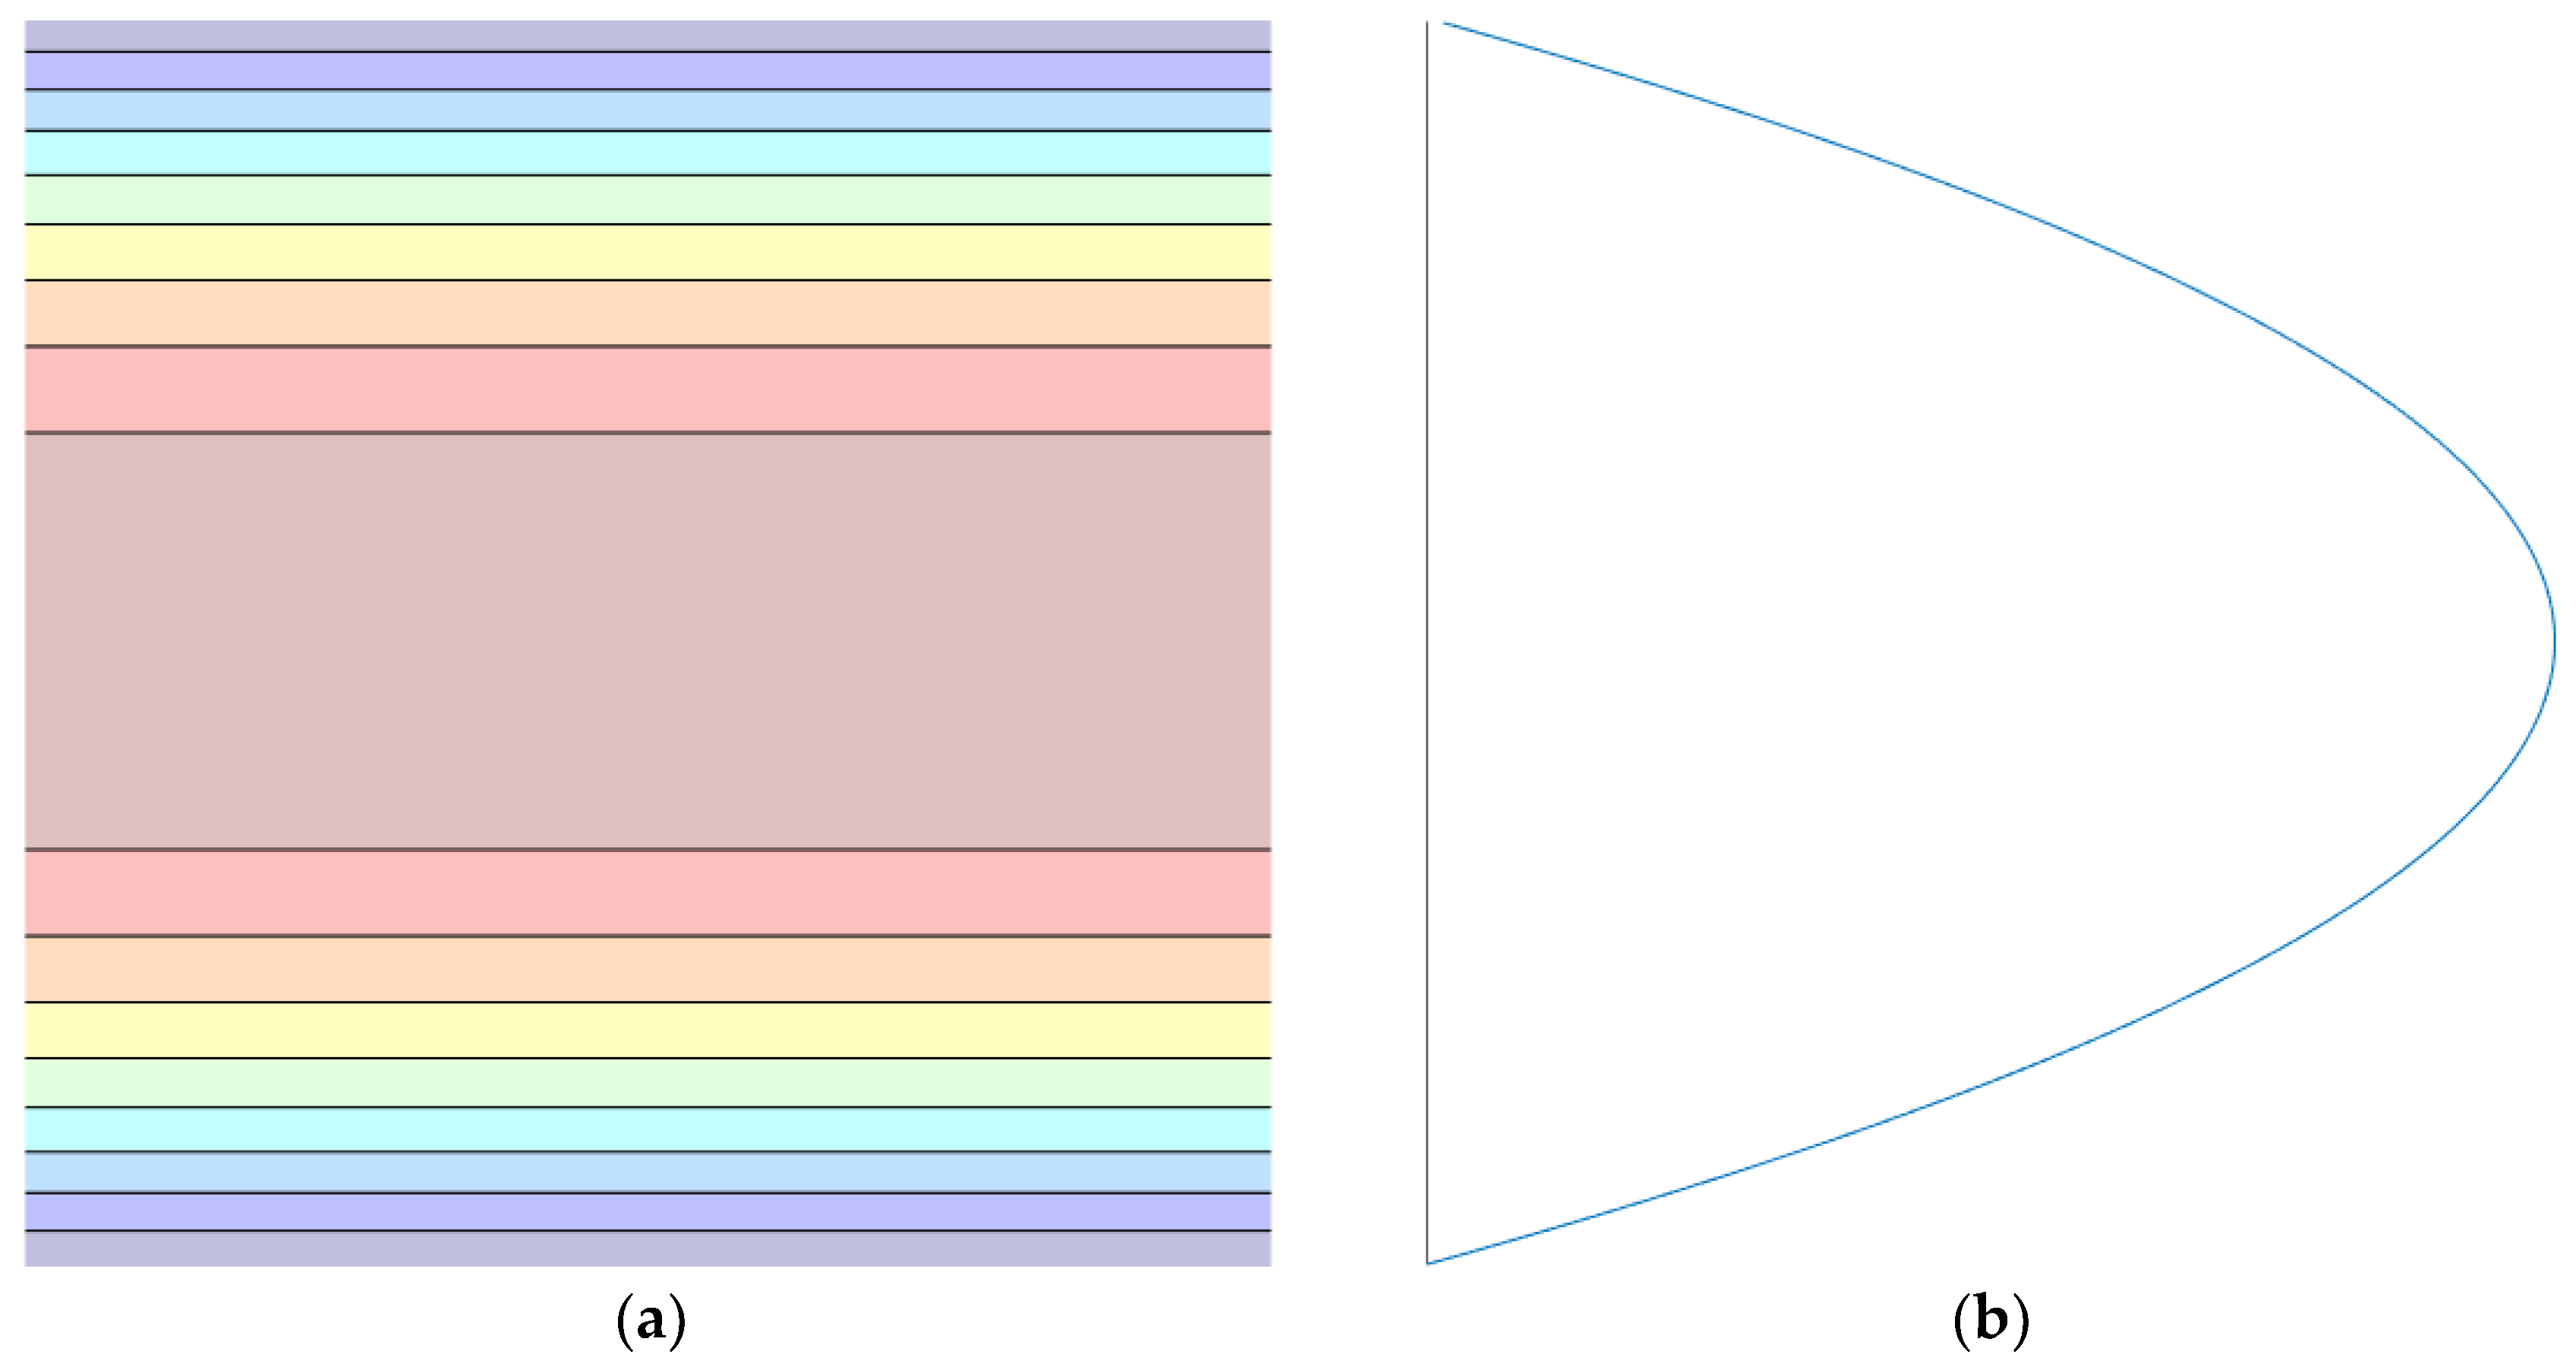
Figure 4.
Normalized transverse shear energy density in the voxelized microstructure,.
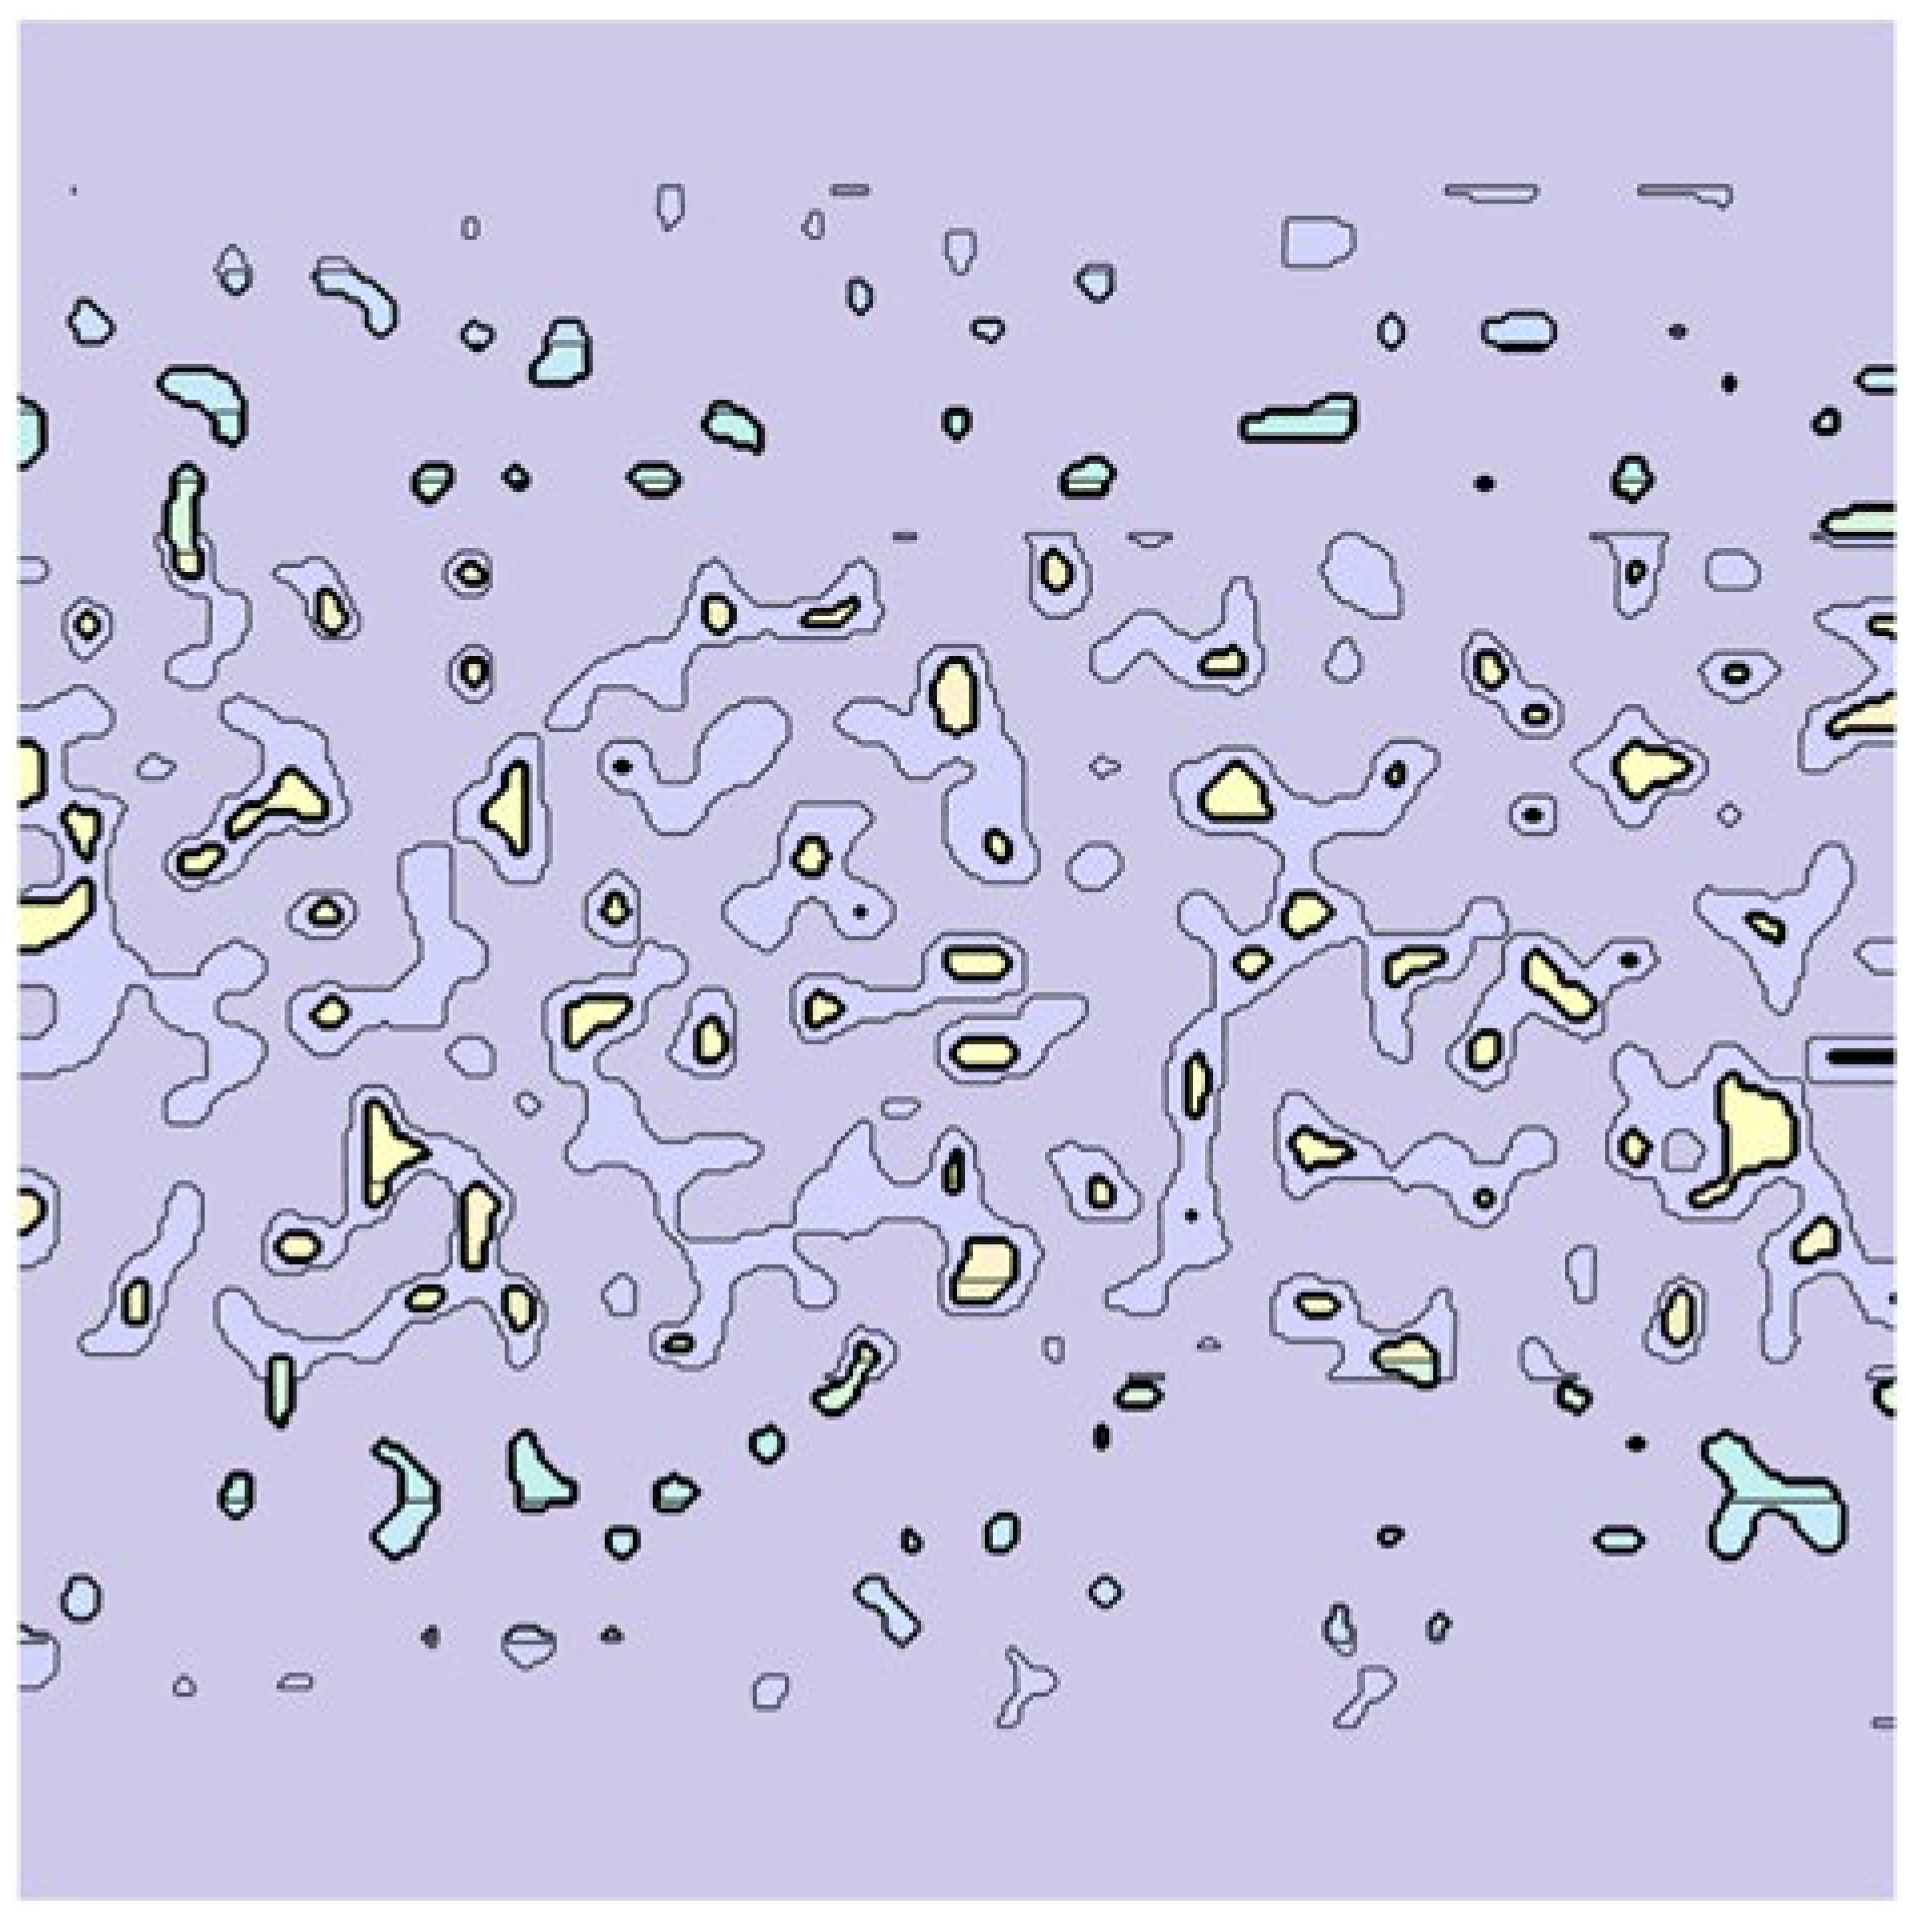
Figure 5.
Patterns: (a) pattern1 (27x27 [pixels]) – 3 levels; (b) pattern1 (27x27 [pixels]) - 5levels; (c) pattern2 (27x27 [pixels]) – 3 levels, (d) pattern2 (27x27 [pixels]) - 5levels; (e) pattern3 (270x270 [pixels]) – 3 levels, (f) pattern3 (270x270 [pixels]) - 5levels.
Figure 5.
Patterns: (a) pattern1 (27x27 [pixels]) – 3 levels; (b) pattern1 (27x27 [pixels]) - 5levels; (c) pattern2 (27x27 [pixels]) – 3 levels, (d) pattern2 (27x27 [pixels]) - 5levels; (e) pattern3 (270x270 [pixels]) – 3 levels, (f) pattern3 (270x270 [pixels]) - 5levels.
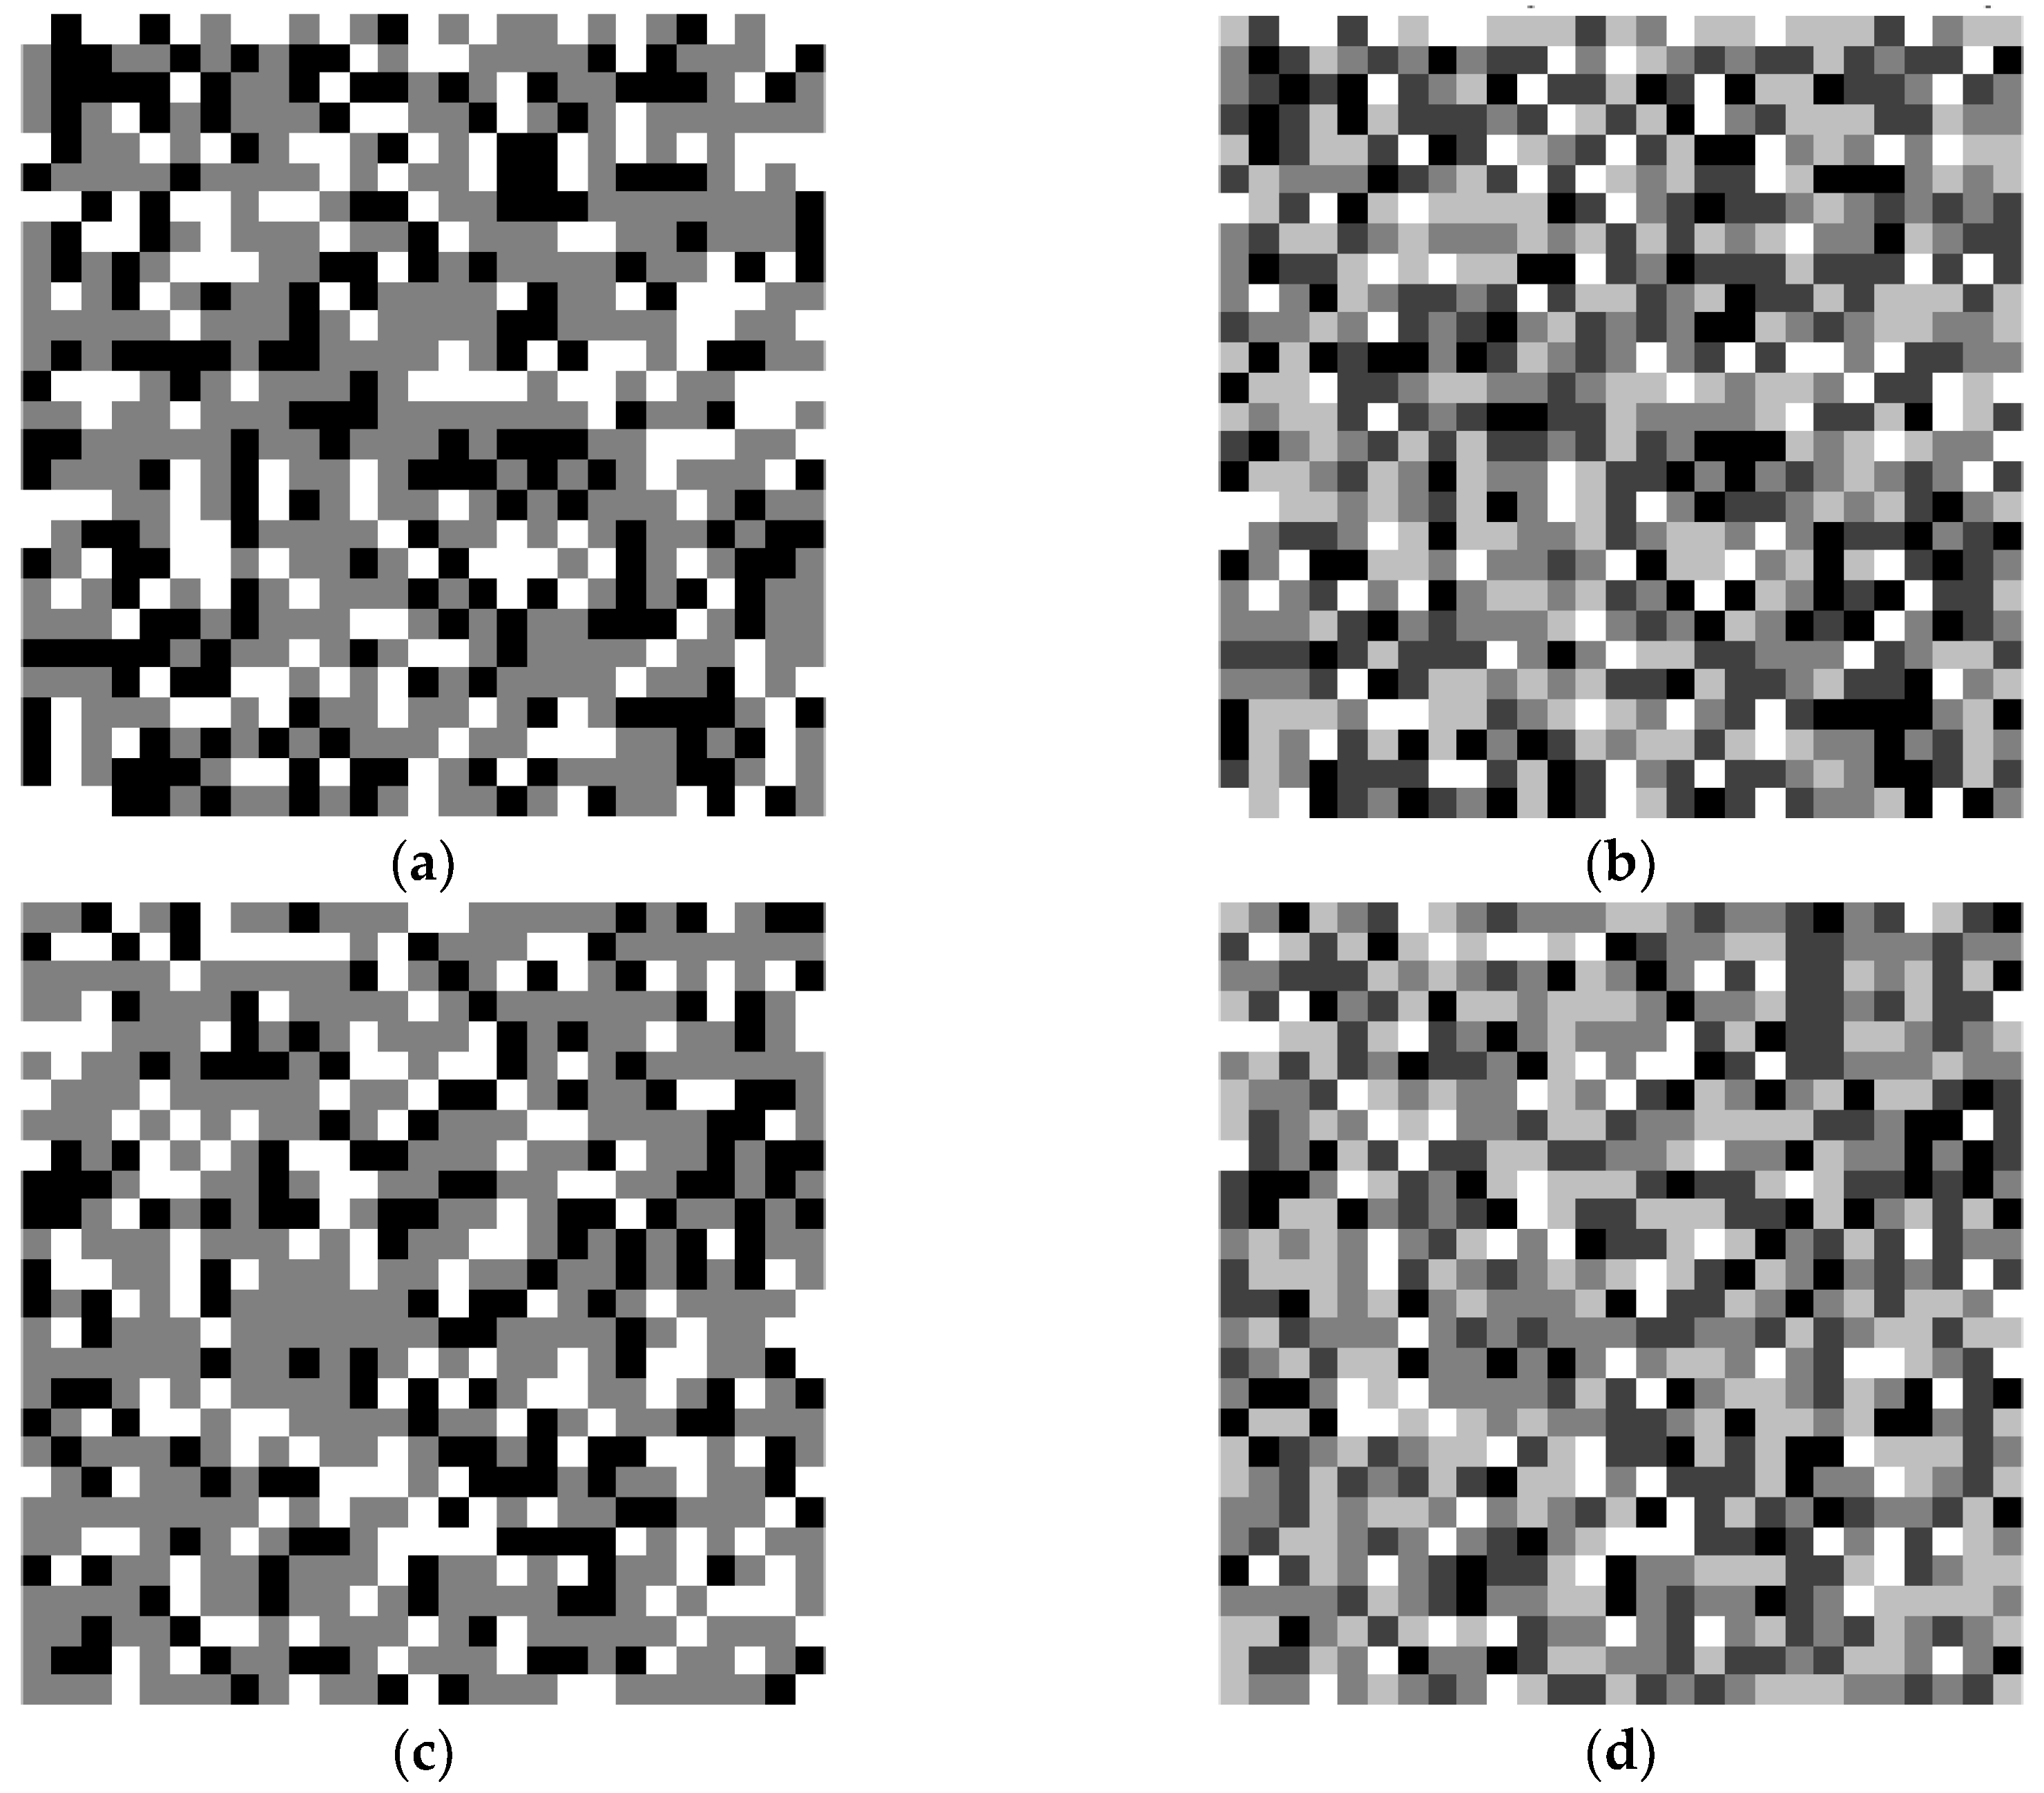
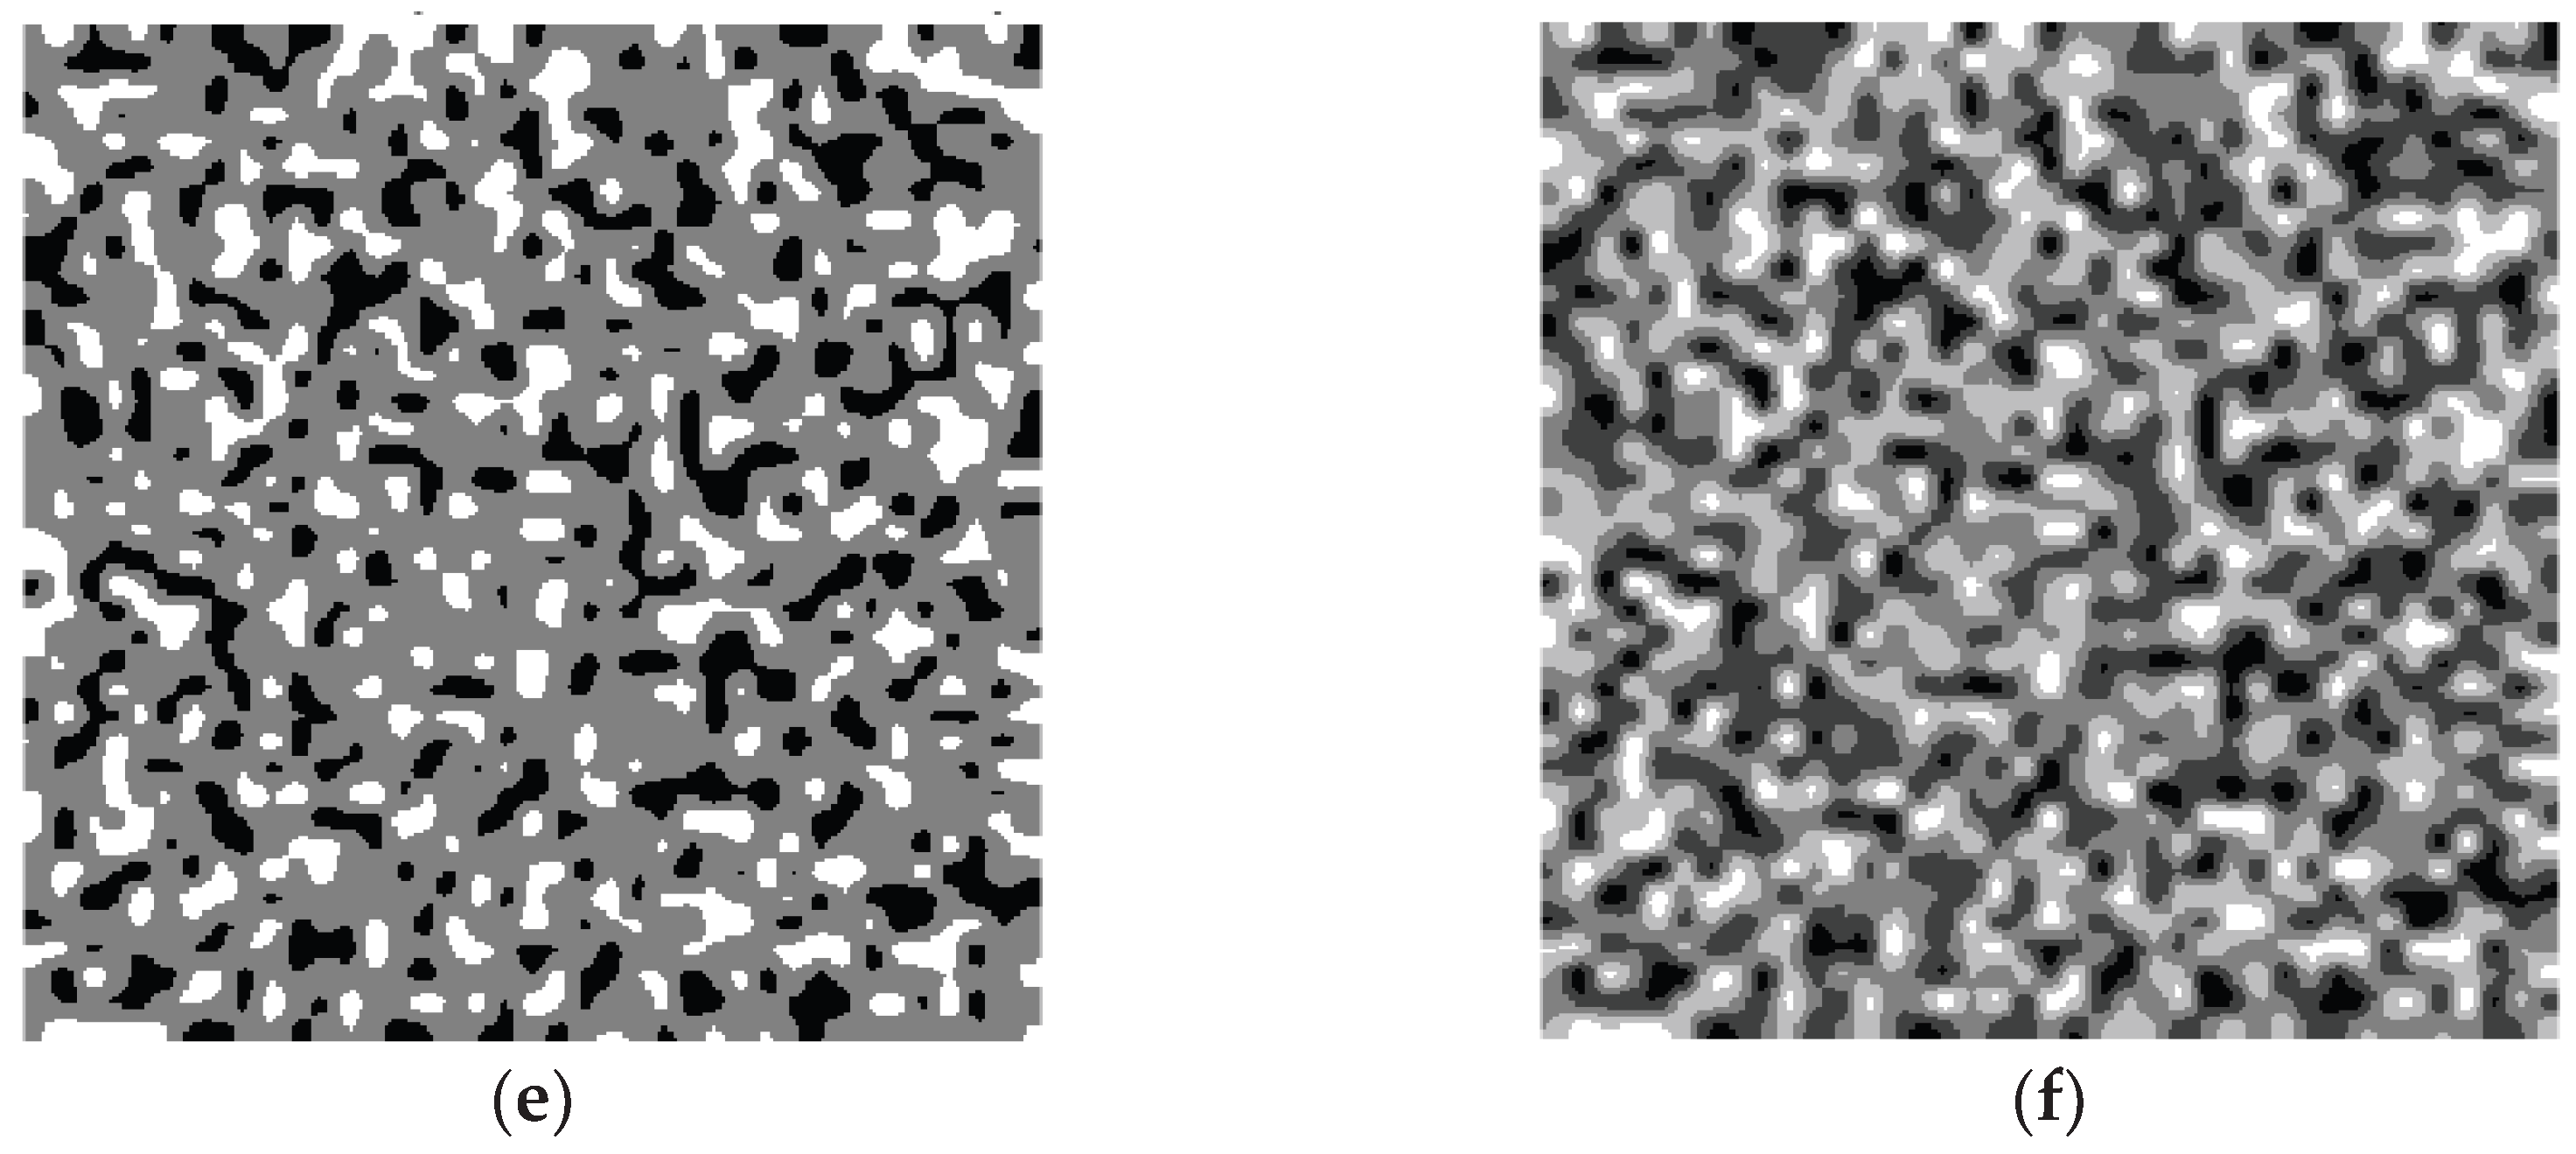
Figure 6.
Influence of relative density on the heterogeneous shear correction factor ; the horizontal line marks the classical homogeneous reference .
Figure 6.
Influence of relative density on the heterogeneous shear correction factor ; the horizontal line marks the classical homogeneous reference .
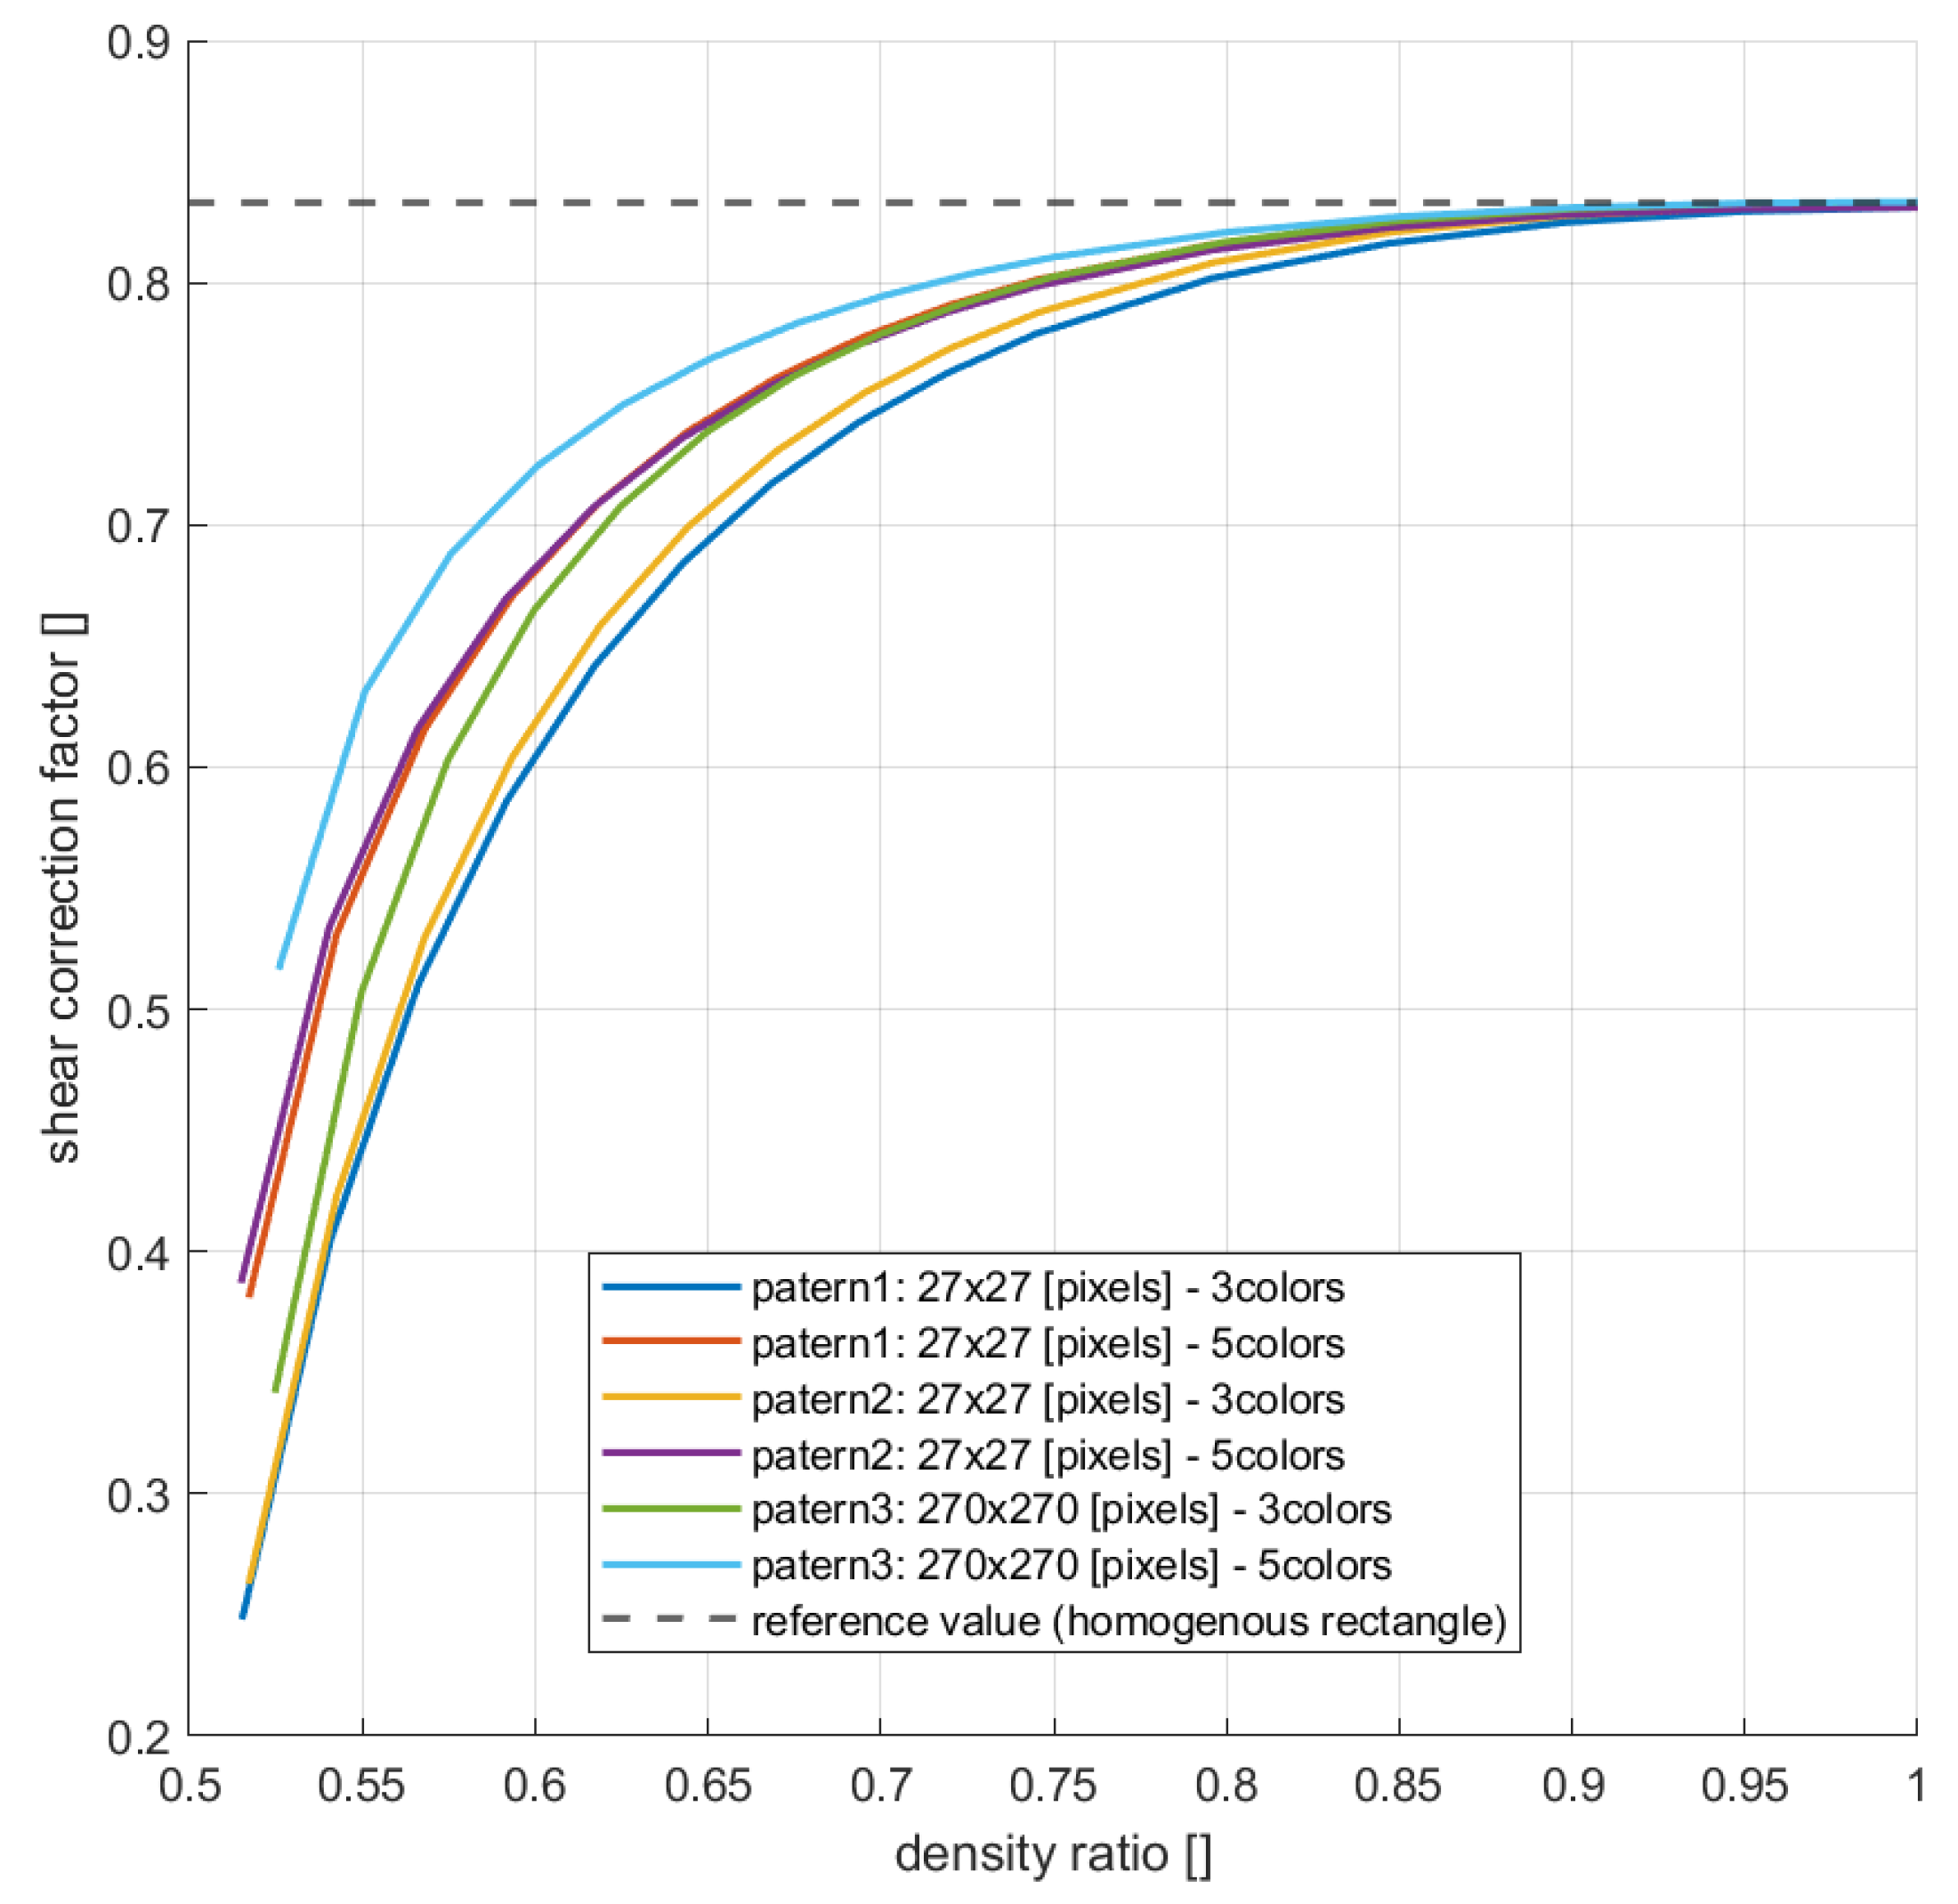
Figure 7.
Effect of pore morphology (random, circular-shifted, circular-rows, circular-columns) on shear energy localization in perlite-like microstructures.
Figure 7.
Effect of pore morphology (random, circular-shifted, circular-rows, circular-columns) on shear energy localization in perlite-like microstructures.
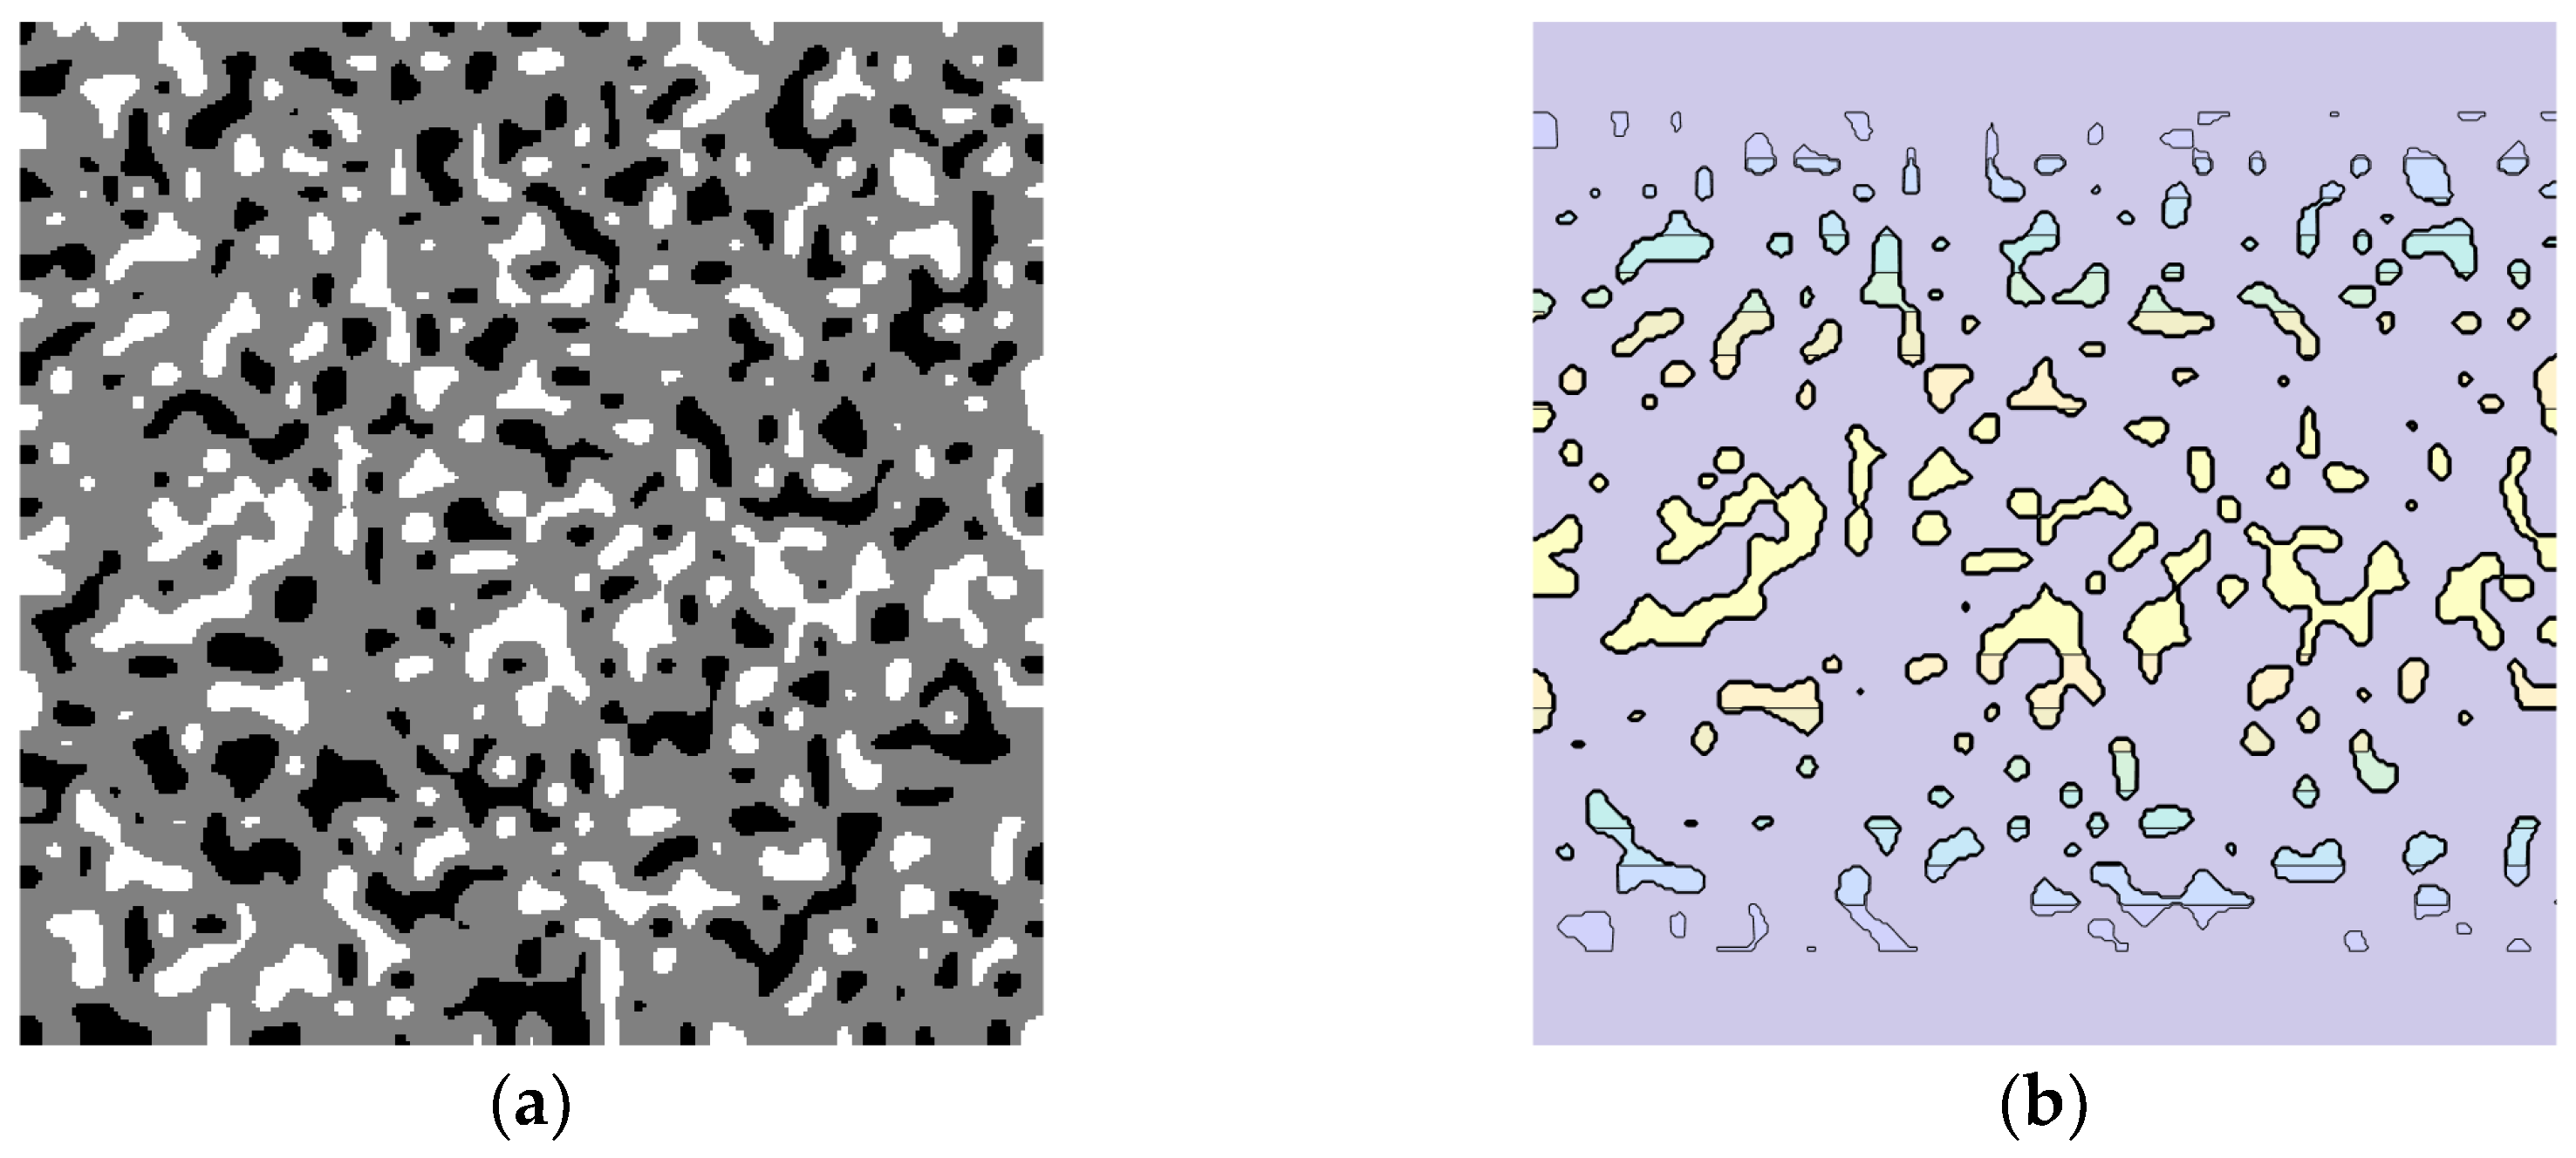
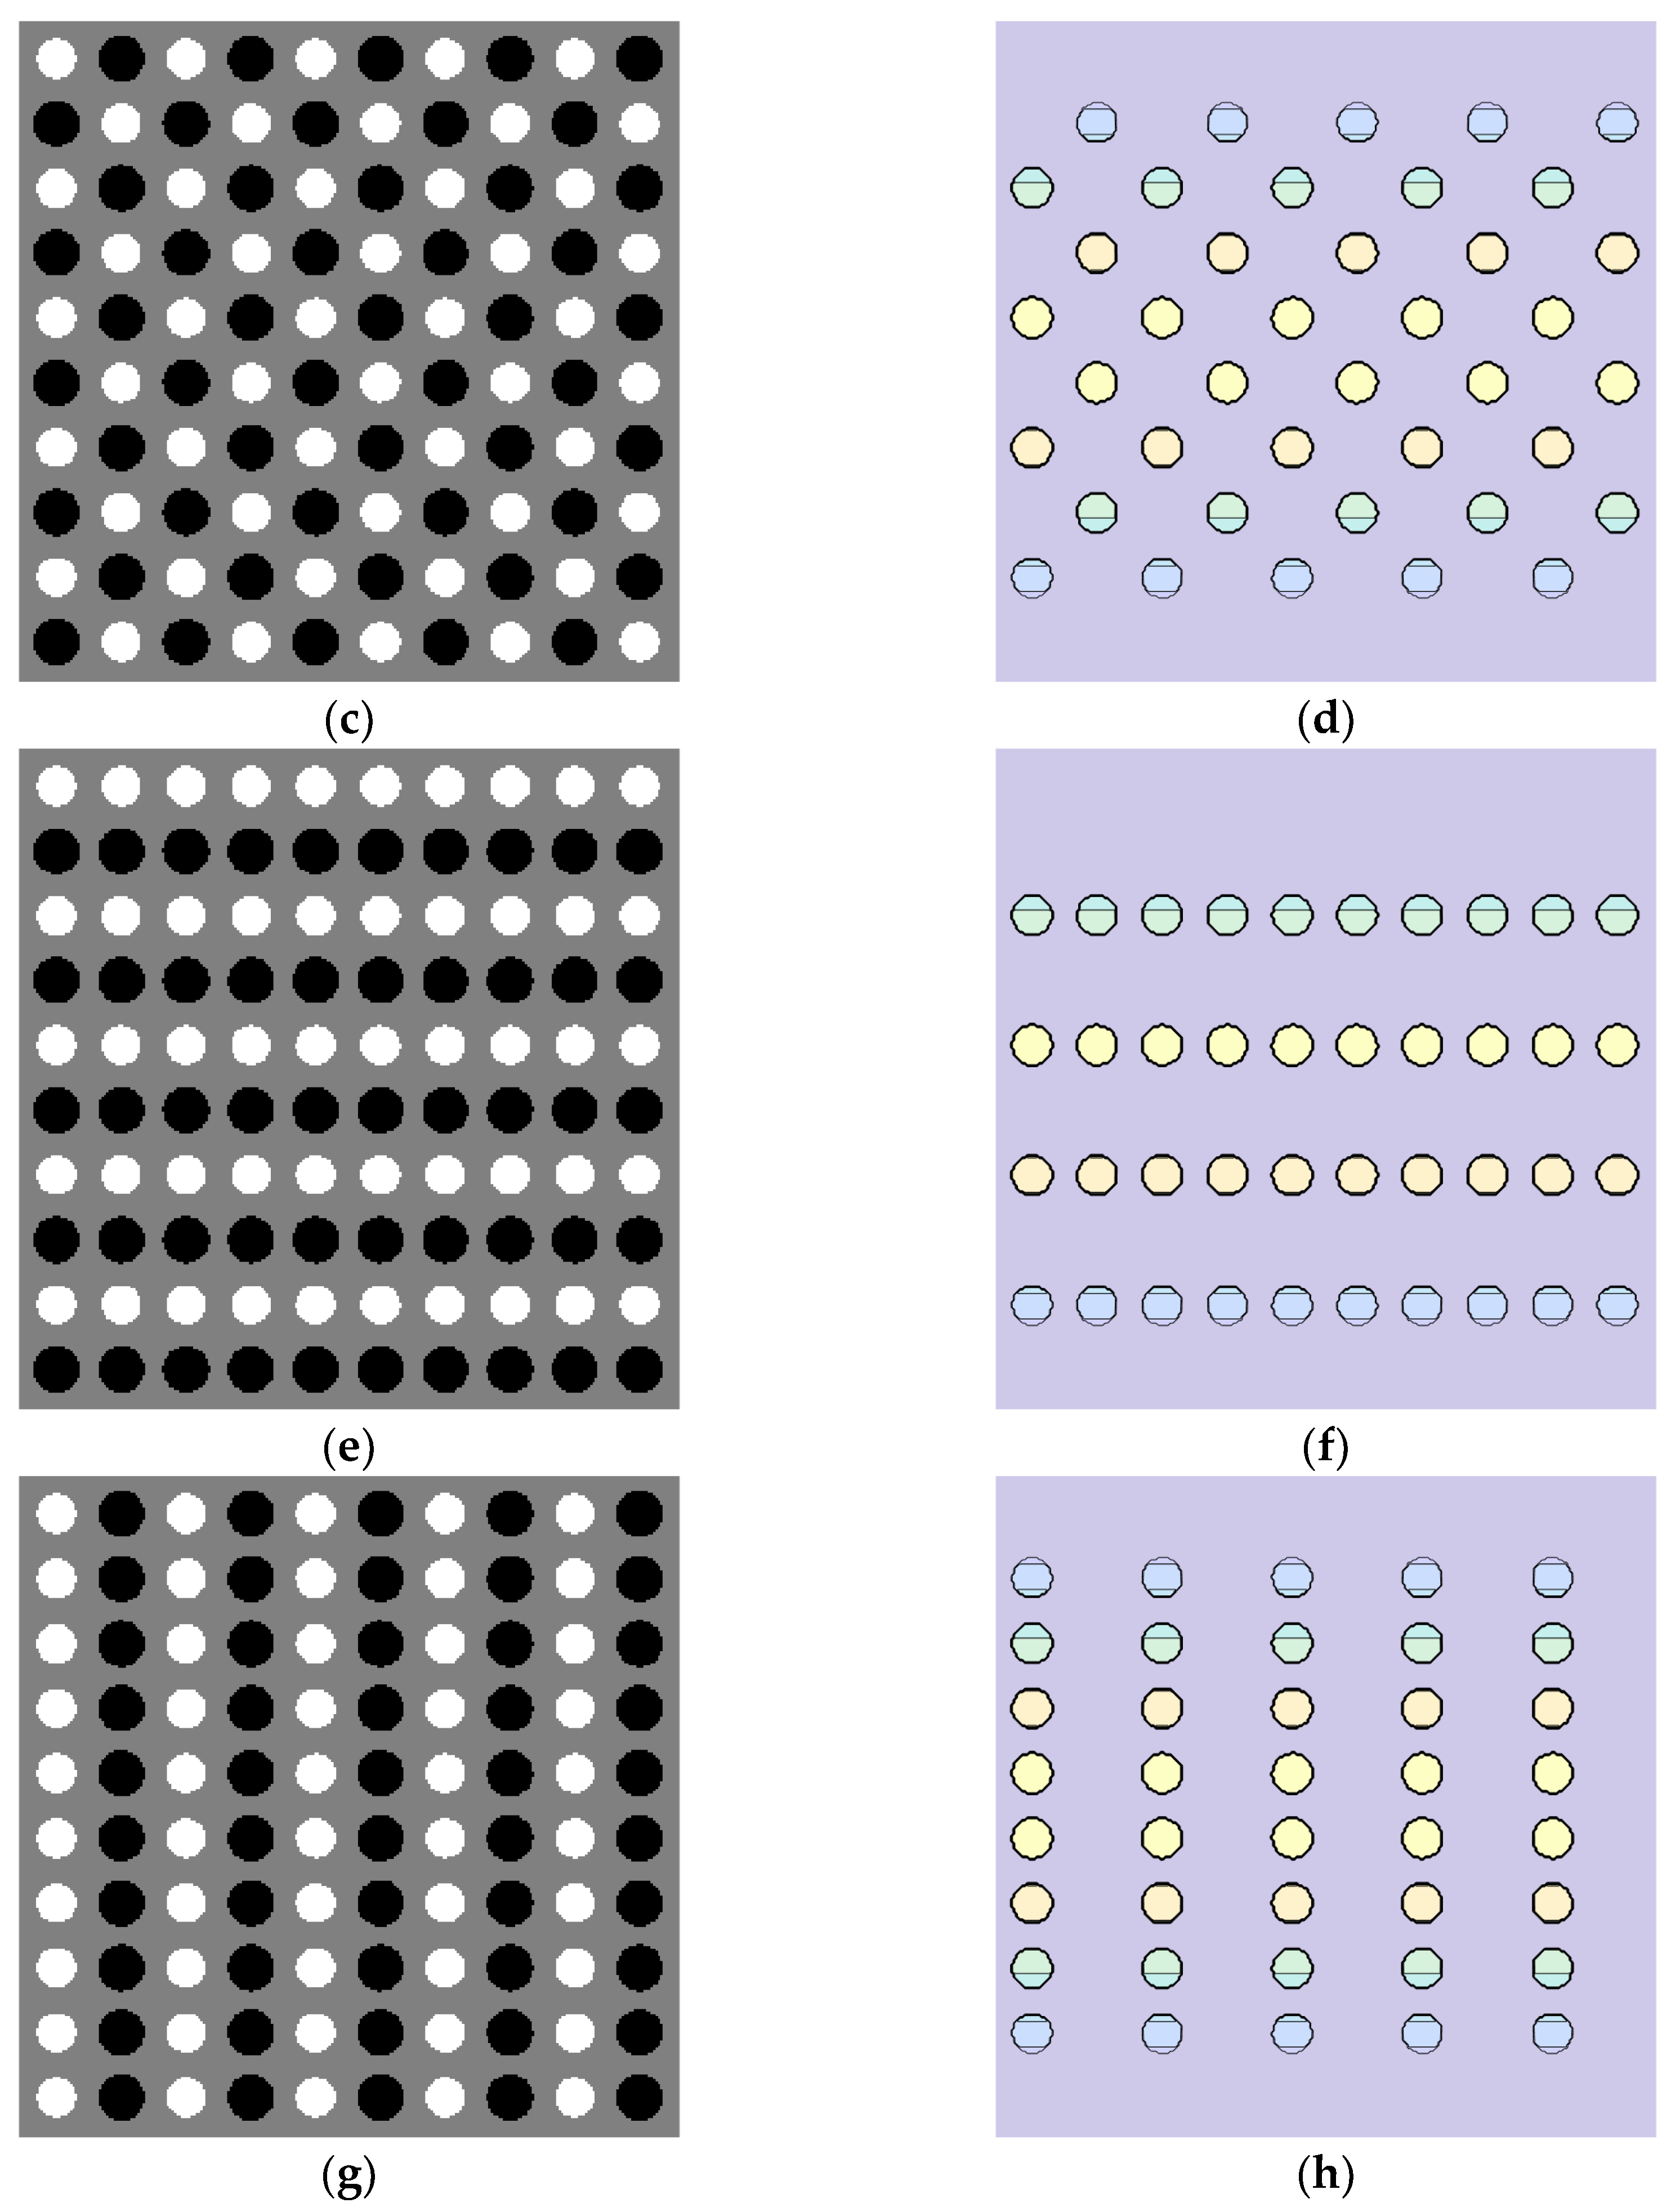

Table 1.
Shear correction factor of heterogeneous perlite sections compared with the classical homogeneous value. Pattern1 – 3 levels.
Table 1.
Shear correction factor of heterogeneous perlite sections compared with the classical homogeneous value. Pattern1 – 3 levels.
| [-] | [-] | [-] |
|---|---|---|
| 0.5152 | 0.2481 | 0.2978 |
| 0.5407 | 0.4044 | 0.4853 |
| 0.5663 | 0.5104 | 0.6125 |
| 0.5918 | 0.5860 | 0.7032 |
| 0.6173 | 0.6419 | 0.7703 |
| 0.6428 | 0.6842 | 0.8211 |
| 0.6683 | 0.7169 | 0.8603 |
| 0.6938 | 0.7425 | 0.8911 |
| 0.7193 | 0.7628 | 0.9153 |
| 0.7449 | 0.7788 | 0.9346 |
| 0.7959 | 0.8018 | 0.9622 |
| 0.8469 | 0.8162 | 0.9795 |
| 0.8979 | 0.8248 | 0.9898 |
| 0.9490 | 0.8294 | 0.9953 |
| 1.0000 | 0.8311 | 0.9973 |
Table 2.
Shear correction factor of heterogeneous perlite sections compared with the classical homogeneous value. Pattern1 – 5 levels.
Table 2.
Shear correction factor of heterogeneous perlite sections compared with the classical homogeneous value. Pattern1 – 5 levels.
| [-] | [-] | [-] |
|---|---|---|
| 0.5172 | 0.3810 | 0.4572 |
| 0.5426 | 0.5311 | 0.6373 |
| 0.5680 | 0.6155 | 0.7386 |
| 0.5934 | 0.6707 | 0.8048 |
| 0.6188 | 0.7097 | 0.8516 |
| 0.6442 | 0.7386 | 0.8863 |
| 0.6697 | 0.7606 | 0.9127 |
| 0.6951 | 0.7777 | 0.9332 |
| 0.7205 | 0.7910 | 0.9492 |
| 0.7459 | 0.8014 | 0.9617 |
| 0.7967 | 0.8160 | 0.9792 |
| 0.8475 | 0.8247 | 0.9897 |
| 0.8984 | 0.8294 | 0.9952 |
| 0.9492 | 0.8312 | 0.9975 |
| 1.0000 | 0.8311 | 0.9973 |
Table 3.
Shear correction factor of heterogeneous perlite sections compared with the classical homogeneous value. Pattern3 – 3 levels.
Table 3.
Shear correction factor of heterogeneous perlite sections compared with the classical homogeneous value. Pattern3 – 3 levels.
| [-] | [-] | [-] |
|---|---|---|
| 0.5247 | 0.3418 | 0.4101 |
| 0.5497 | 0.5069 | 0.6082 |
| 0.5747 | 0.6029 | 0.7235 |
| 0.5998 | 0.6649 | 0.7979 |
| 0.6248 | 0.7077 | 0.8492 |
| 0.6498 | 0.7385 | 0.8862 |
| 0.6748 | 0.7613 | 0.9136 |
| 0.6998 | 0.7787 | 0.9344 |
| 0.7248 | 0.7920 | 0.9504 |
| 0.7498 | 0.8024 | 0.9629 |
| 0.7999 | 0.8168 | 0.9802 |
| 0.8499 | 0.8255 | 0.9906 |
| 0.8999 | 0.8304 | 0.9965 |
| 0.9500 | 0.8328 | 0.9994 |
| 1.0000 | 0.8333 | 1.0000 |
Table 4.
Shear correction factor of heterogeneous perlite sections compared with the classical homogeneous value. Pattern3 – 5 levels.
Table 4.
Shear correction factor of heterogeneous perlite sections compared with the classical homogeneous value. Pattern3 – 5 levels.
| [-] | [-] | [-] |
|---|---|---|
| 0,5258 | 0,5165 | 0,6198 |
| 0,5508 | 0,6311 | 0,7574 |
| 0,5757 | 0,6883 | 0,8259 |
| 0,6007 | 0,7244 | 0,8692 |
| 0,6256 | 0,7498 | 0,8997 |
| 0,6506 | 0,7686 | 0,9224 |
| 0,6755 | 0,7831 | 0,9398 |
| 0,7005 | 0,7945 | 0,9534 |
| 0,7255 | 0,8035 | 0,9642 |
| 0,7504 | 0,8106 | 0,9727 |
| 0,8003 | 0,8209 | 0,9850 |
| 0,8503 | 0,8272 | 0,9927 |
| 0,9002 | 0,8310 | 0,9972 |
| 0,9501 | 0,8328 | 0,9994 |
| 1,0000 | 0,8333 | 1,0000 |
Table 5.
Shear correction factor of heterogeneous perlite sections compared with the classical homogeneous value. Pattern3 – 5 levels.
Table 5.
Shear correction factor of heterogeneous perlite sections compared with the classical homogeneous value. Pattern3 – 5 levels.
| Morphology type | Relative density , |
Standard deviation of |
(heterogeneous) | deviation from (%) |
|---|---|---|---|---|
| Perlite | 0.5505 | 2.1918e+08 | 0.35326 | 57.61 |
| Shifted | 0.5505 | 2.1934e+08 | 0.34971 | 58.03 |
| Rows | 0.5505 | 2.1934e+08 | 0.34971 | 58.03 |
| Columns | 0.5505 | 2.1934e+08 | 0.34971 | 58.03 |
Disclaimer/Publisher’s Note: The statements, opinions and data contained in all publications are solely those of the individual author(s) and contributor(s) and not of MDPI and/or the editor(s). MDPI and/or the editor(s) disclaim responsibility for any injury to people or property resulting from any ideas, methods, instructions or products referred to in the content. |
© 2026 by the authors. Licensee MDPI, Basel, Switzerland. This article is an open access article distributed under the terms and conditions of the Creative Commons Attribution (CC BY) license (http://creativecommons.org/licenses/by/4.0/).
Copyright: This open access article is published under a Creative Commons CC BY 4.0 license, which permit the free download, distribution, and reuse, provided that the author and preprint are cited in any reuse.


