
Submitted:
15 January 2026
Posted:
16 January 2026
You are already at the latest version
Abstract
Climate change poses significant risks to New Zealand’s coastal agriculture through both slow-onset hazards (e.g., gradual sea-level–induced groundwater rise) and sudden-onset hazards (e.g., increasing frequency and severity of storms). These physical changes threaten the productivity and economic viability of coastal farms. However, few studies assess their combined economic impacts in a manner that supports land-use planning. This paper presents a conceptual framework to examine the implications of interacting slow- and sudden-onset climate hazards for New Zealand dairy farms, informed by real-world consultation with subject-matter experts to support feasibility analysis. We draw conclusions that illustrate the monetary impacts on farms associated with potential absorptive, adaptive, and transformational responses. The findings highlight the critical role of timing as environmental conditions deteriorate under climate change, as well as the need for policy frameworks that recognize and monetize the contribution of ecosystem services provided by coastal vegetation habitats to social, cultural, and environmental wellbeing. Incorporating these values into present-day financial decision-making is essential for supporting climate-related financial risk reduction and long-term land-use planning. Without such frameworks, the most beneficial land-use transitions are unlikely to be affordable or sustainable in New Zealand, especially towards year 2100.
Keywords:
sea level rise
; rising groundwater
; agricultural adaptation
; climate change adaptation
; pastoral agriculture
; economic modelling
; scenario analysis
1. Introduction
Global climate change poses significant threats from sea-level rise and extreme weather events, such as flooding and droughts (Bandh et al., 2021; Wahl et al., 2015). These phenomena have the potential to damage infrastructure and displace millions of people worldwide (Nicholls and Cazenave, 2010). Challenges may be felt especially in coastal lowlands where both sea level rise and extreme oceanic and terrestrial weather events can coincide to intensify impacts (Nicholls et al. 2007; Hennessey et al. 2007). The rate of global mean sea level rise is accelerating, increasing from approximately 2.1 mm/year in 1993 to around 4.5 mm/year in 2023 (estimated) (from Hamlington et al. 2024) and will rise to 60 cm to 1 m or more by 2100 (IPCC, 2022; Pfeffer et al., 2008; Lowe et al., 2009). Currently, around 10 per cent of the world’s population are located in low-lying coastal areas and will rise up to one billion by 2050 (IPCC, 2022). The consequences of climate change systematically affect human assets and economic models, impacting livelihoods and economic stability on a global scale (Carleton and Hsiang, 2016). Research indicates that real Gross Domestic Product (GDP) is projected to decline globally as a result of extreme weather events, drought, and rising sea levels (Bilal and Känzig, 2024). However, the extent of future sea level rise, the resulting impacts on low-elevation coastal zones and the capacity for global societies to adapt remains uncertain (Nicholls and Cazenave, 2010). Additionally, knowledge of the consequences of sea-level rise and associated groundwater table rise on local economies is a significant research gap (Bosserelle et al. 2022; Habel et al., 2024; Manda et al., 2019).
While the threats from climate change to low-lying activities like farming are well recognised (Ministry for Primary Industries 2019; Craig et al. 2023), current research primarily focuses on the effect of, and adaptation to, rapid onset hazards such as intensified storm surges and flooding. By comparison, the effect of persistent slow-onset climate change-driven hazards, such as rising groundwater and its associated impacts on land use, remains understudied but could be far not been adequate (UNFCCC, 2012). In practice, most attention to climate change -driven rises in groundwater have tended to focus on its desirability as a means to buffer water shortages and protect cultures in groundwater dependents areas (e.g., Caretta et al. 2022; Amanambu et al. 2020). However, rises in sea level are likely to also generate negative impacts from higher groundwater. In lowlands, rising groundwater has the capacity to worsen the impact of sudden onset hazards like flooding (Bosserelle et al. 2022). Rising groundwater may also impact water quality including by contributing to salinity through saline intrusion of aquifers (Kumar 2012; Dao et al. 2024). Thus, increasingly shallow groundwater may threaten agriculture, necessitating structural adjustments, including potentially adjusting production practices, establishing new infrastructure and or relocating activities (Karri et al. 2026; Gaffney et al. 2026). Actions require planning and action at a collective level to facilitate the transformation of food and agricultural production systems (Cobourn 2023).
In this paper, we use New Zealand – an island nation in Oceania which is highly dependent on export income from farming – as a case study to illustrate how climate change-driven sea-level rise may affect low-lying coastal farming by the year 2100. These lowland coastal areas are often naturally prone to waterlogging and flooding but have been made agriculturally productive through drainage of wetlands, channelisation of watercourses and stop-banking of floodplains (Gaffney et al. 2026). The study integrates the consequences of both slow-onset hazards (groundwater rise) and sudden-onset events (intensified flooding and storm surge) resulting from climate change as they, along with gradual land subsidence, challenge the water management capacity of existing infrastructure. These physical impacts are translated into economic terms, to consider their implications for land use planning.
Our exploration is based on a conceptual model of a stylised coastal dairy farm confronted by change and the implications for profitability of alternative farm level responses. The responses explored were informed by consultations with subject-matter experts, with costs based on averages from case studies. Costs reflect the general absence of farm subsidies in New Zealand, and the lack of large urban populations and industrial production that could fund major infrastructural solutions such as, barrage gates.
2. Materials and Methods
2.1. Define a Stylized New Zealand Based, Low-Lying, Coastal, Dairy Farm as a Case Study
In New Zealand, coastline where land subsidence is occurring at rates >2 mm/year, vertical land movement makes a significant contribution to relative sea level rise projections for all scenarios out to 2150 (Naish et al. 2024 b). Additionally, reclaimed drained coastal peatland soils are expected to subside at rates of ~8 ± 4.5 mm/y (Turner, 2004). Such subsidence is expected to exacerbate existing sudden onset hazards such as flooding and coastal erosion, while raising the risk of slow-onset hazards such as shallow groundwater emergence and the salinization of wetlands and aquifers (Bosserelle and Hughes, 2024; Bosserelle et al., 2022; Gornitz, 1991; Naish et al., 2024 a; Rouse et al., 2017). Regional councils have response options for this situation (see Appendix B).
Here, we focus on the implications of sea level rise for lowlands farming in New Zealand. Dairy farming is a major industry in fertile lowlands and flood plains that are prone to waterlogging and flooding. We conceptualise a stylised dairy farm (is founded on norms or average traits, scale, type and geophysical settings around New Zealand) within a managed drainage area facing climate change-driven rises in groundwater and intensification of flooding. Additionally, debt levels and management approaches vary, influencing the capacity of farms to absorb climate change-induced shocks over time.
We draw on published information on production values and the costs of responses to generate a high-level illustration of the nature of hazard impacts on pasture production over time and the implications for land use. We consider the change in situation from today through to 2100 (75 years) and explore the implications over time.
For our stylised farm we assume:
- A rain-fed (i.e. non-irrigated) pastoral dairy farm at the national average size of 162 hectares (Statistica 2025 a), with the national average stock rate of 2.76 dairy cows/ha (Statistica 2025 b). An average operating profit of NZD$3300/ha. This is based on average national operating profits reported over the previous seven years (see Dairy NZ 2025).
- A farm located in an area already at risk of periodic river flooding and where the local/ regional council already operates some form of flood protection (e.g., stop banks) or drainage system from which people benefit
- Generally flat land such that the distance from groundwater to the surface of the land is similar across the farm.
- A farm operating on land that initially responds well to drainage interventions. Our cost and operating profit assumptions are based on this.
2.2. Consider Slow Onset Threats – Rising Groundwater
Rising sea levels along the coasts are expected to drive groundwater upwards (Cox et al. 2023). The extent to which sea level rises are reflected in rising ground water is uncertain, as it depends on the relative head and flux of freshwater and the presence of surface drainage (Morgan 2024). Ideally, models would be available to quantify groundwater rise by evaluating the interaction between sea level rise and the local hydrological system. In the absence of this, a conservative assumption (known as the Hydrostatic Rise approach) is commonly used, where the rate of groundwater rise is assumed to be equal to sea level rise (Maliva 2021). For simplicity we draw on work by Hamlington et al. (2024) that estimates sea-level rise in the order of 4.5 mm per year, and assume a groundwater rises the same rate. While the true rate of rise may be higher or lower, the logic of change remains the same.
For the purpose of illustration, we consider implications assuming explore the following scenarios:
- Groundwater starting at 1m (GW1) below the ground surface of coastal land and rising at 4.5 mm per year to sit at around 0.7 metres from the surface by year 2100, without intervention.
- Groundwater starting at 0.7m below the ground surface of the coastal land rising at 4.5 mm per year, to sit around 0.4 metres from the surface by year 2100, without intervention.
Potential Impact on Operational Profits
The effect of rising groundwater on pasture production will depend on a variety of factors including antecedent soil moisture conditions. Under dry conditions (e.g., drought), shallow groundwater can enable improved pasture production growth. However, under wet conditions, shallow groundwater can cause or exacerbate waterlogging, harming pasture production directly as well as exacerbating soil quality issues such as pugging and soil compaction. Studies by Frisk et al. (2022) confirm that yields of perennial ryegrass typically decline as a result of waterlogging. Perennial ryegrass is the most widely sown grass in New Zealand, and a feed crop commonly used in dairy farming (DairyNZ 2024 b). Reasonably therefore, we expect that pasture productivity will decline as water tables become shallower, until conditions are unsuitable for ryegrass production. This is conceptualised as a general decline in earnings over time as waterlogging increases (the general downward trend presented in Figure 1). To estimate the effect of rising groundwater on our farm, we draw on Snow et al. (2025) who mathematically express the relationship between dry matter production for perennial rye grass (Appendix C).
2.3. Consider Sudden Onset Threats – River Flooding
With increases in sea levels and associated rises in groundwater, the risk of storm surge and river flooding can be expected to increase (Befus et al., 2020; Bosserelle et al., 2022; Nicholls et al., 1999). For the purpose of illustration, we consider how matters might play out if productivity falls because sea level rise-driven increases in flood risk over time.
We draw on Paulik et al. (2021) who report the impact of severe river flooding on farms in the Bay of Plenty Region. We could apply average annual losses to illustrate the risks of flooding over time (e.g., ESCAP 2019; EQC 2023; FEMA Undated). However, we instead present the case where a severe flood hits the farm every 10 years to illustrate how climate change leads to spikes in costs – or dips in operating profits. At a conceptual level, layering these periodic drops in income atop revenues that steadily decline due to waterlogging results in farm financial performance resembling a ‘ratcheting’ downward trend over time (e.g., Figure 1). We assume regular local level flooding in between these severe events.
Drawing on Paulik et al. (2021), we assume a 10-year flooding farm-level cost of NZD $70,000 per event, which includes the transfer of livestock for off-farm grazing during recovery. The intensity of the flooding is expected to increase as climate change progresses (Gibson et al. 2025; Pittock et al. 2001). While any year could be selected, we assume flooding to commence in year 9 to allow us to understand potential profitability over time (including that before flooding-based hardship sets in).
Based on the Clausius–Clapeyron relationship (Hack 2008), we assume that for every 1°C increase in temperature, the atmosphere can hold about 7 per cent more water vapor, potentially leading to a similar increase in the intensity of extreme rainfall events (e.g., Liu et al. 2019, Martinkova et al. 2020) and increasing costs accordingly. This scenario is indicative only, as actual changes in flood frequency, severity and costs will differ depending on local hydrology and climatology and the specific level and circumstances of the flooding impact. Therefore, as with all our assumptions, these values are for illustrative purposes only.
2.4. Consider Adaptation Actions
At a basic level, it is possible that farmers may not respond to rising groundwater and intensified flood threats. Continuing without change – doing nothing – provides a baseline against which changes in practice can be compared. However, in practice, most farmers can be expected to respond to threats using micro- or macro-level changes to their practices. FAO (2018) distinguish three broad approaches for agricultural response:
- Approaches that enhance the absorptive capacity of systems to manage negative events using predetermined coping responses in order to preserve and restore essential structures and functions. Actions under this approach enable farming systems to cope with the impacts of a shock in the short run.
- Approaches that enhance the adaptive capacity of systems to adjust or modify so they can moderate harm and or benefit from opportunities, in order to continue functioning without major qualitative changes. Actions under this approach enable farming systems to better cope with climate change over the medium run through incremental change.
- Approaches that fundamentally change systems (transformational capacity). Actions under this approach involve long-term structural or systematic change, such as developing new production systems or investing in institutional change.
Within these approaches, there are a wide number of responses that farmers might adopt. Because we do not know the condition of a farm to begin, or which action farmers might choose, we take a “what if” approach to assess the implications of climate change on lowland farming. We present a sample of adaptation actions that variously contribute to farming absorptive, adaptive or transformational capacity and assess them using a cost-benefit framework. The actions we consider are as follows.
2.4.1. Absorptive Capacity Responses
Responses that can mitigate the effects of flooding and waterlogging under the absorptive capacity of a dairy farm system include use of standoff pads or well-drained/higher elevation paddocks to avoid grazing waterlogged paddocks and ‘wintering-off’ of livestock (see below). In instances where waterlogged paddocks are grazed either through mismanagement or lack of alternatives, damaged pasture and soil can be rehabilitated via resting, mechanical remediation or reseeding and renovation, depending on the severity of the damage. We focus on wintering-off for the purposes of this study.
Wintering-Off
Wintering-off involves removing the stock from the dairy farm when they are not milking. Most New Zealand dairy farms aim to have all cows calving within an 8-week period in early spring, milked from spring to late summer or autumn, and then ‘dried off’ (non-lactating phase) in late autumn or early winter. This leaves a period of about 2.5 months in the wetter winter period when the farm can be de-stocked to reduce treading damage and rest the pasture. This response presumes that farmers have or can lease land elsewhere to hold their cattle during winter and early spring. This option also incurs costs to transport cattle on and off farm, and additional feed costs to sustain them during a period of low pasture productivity. Wintering-off does not mitigate progressive water logging of soil but can help to maintain productivity as pasture rests.
Paulik et al. (2021) surveyed farmers in the Bay of Plenty to understand costs incurred to transport graze stock elsewhere after flooding (Table 2). As this assessment related to flooding, costs were also estimated for veterinary fees as well as supplementary feed following a flood. We exclude veterinary costs but draw on the transport and off farm grazing costs, updating them to 2024 values to generate illustrative costs per head of NZD$61 to transport stock off-site and NZD $91 to graze them off-site per four months. For obvious reasons, we assume that wintering-off avoids harm to livestock that would ordinarily occur during flooding, reducing associated costs.
2.4.2. Adaptive Capacity Responses
‘Holding the line’ through drainage
Flood control and pumped drainage in New Zealand is often provided as a public service. From a climate hazard perspective, this action mitigates/ reduces flood risk. It may also have some benefits related to drainage from waterlogging, albeit limit. We consider the value of flood control and drainage to manage flood costs to our stylized farm. Here we envisage holding the line through higher levels of drainage service. Typically, drainage management structures such as stop banks and associated drainage systems, flood ways and spillways work together as part of a coordinated system that is managed by councils as public assets with operational costs charged back to those landowners that benefit from the infrastructure via council rates. With strict land consenting regulations, farmers operating in flood managed/ drainage areas can have comparatively limited options to add significant structures beyond the public infrastructure already provided by council, except by installing feeder ditches or subsurface drains flowing to the main drains operated by councils (Morris et al., 2016; Vlotman et al., 2007; Wilby and Keenan, 2012).
We present the case where farmers do not establish their own stop banks, drains and pumps to drain land, but rather lobby for higher levels of service from councils, resulting in higher farm costs via additional targeted rates. The scale of rates for Council drainage services is determined based on the land size, proportion of land affected by drainage need (e.g., the area of land requiring pump services) and the class category (Appendix F).
We explore the impact of council drainage services where: (i) farms upgrade from no/Class B services to Land Class A services (ii) farms upgrade to Land Class A services and pumping of 25 per cent of land yearly and (iii) farms upgrade to Land Class A services and pumping of 25 per cent of land, with land pumped increasing by 15 per cent more every 25 years.
Because there can be substantial variation in land class within a farm, not all land may require drainage (or has Class B drainage) in the first instance. However:
- Over time, sea level rise exacerbates fluvial flood risk, so land may require higher drainage services (Class A drainage) to prevent overflow.
- Ongoing sea level rise can potentially increase river stage such that Class A does not prevent overflow, so pumping is required as well. In such cases, we assume pump services are required for 25 per cent of land every year to help recover from regular flooding.
Establishing drainage ditches
Ditches can drain excess water from soil and lower the water table. In this exploration, we consider the use of drainage ditches as a means to mitigate waterlogging from rising groundwater Depending on the farm, trenching may be undertaken using contractors or by the farmers themselves. When established by farmers, the costs of ditches principally relate to labour, although diggers and the transportation of materials will incur fuel costs and potentially equipment hire, as well. In addition, the land area occupied by ditches reduces by the amount the land that would otherwise be used for grazing.
In practice, fencing and periodic mechanical clearance is recommended for drainage ditches in dairy pastures in New Zealand with edges vegetated to minimize erosion and overland transport of nutrients and pathogens to waterways (Dairy NZ 2015). We assume a 1.5-metre-deep x 1 meter wide at base ditch with 2.12 m for fencing and 2.12 m2 per meter length of vegetation on each side of the ditch to minimize the risk of collapse. To estimate the magnitude of costs for drainage, we draw on:
- Research conducted on farms to manage diffuse pollution (Matthews et al. 2024) which applies to a generic earth excavation value of NZD $10/m3 inclusive for earth moving, equipment transport and labor.
- The Waikato River Authority’s estimates fencing at NZD $9.20 per meter for 3-wire electric fencing in the Waikato in 2022 (Waikato River Authority 2022) and adjust for inflation to assume a cost of $10 per meter. We assume fencing is established on both sides of the drainage ditch and lasts 20 years (this is a general assumption as in some areas fencing may only be needed on one side of paddocks some areas may need on both sides).
- Data from Waikato River Authority (2022) indicates fence installation costs (e.g., labor, land preparation, transportation etc.) to be in the order of NZD $5,815.38/km in 2022. We update these costs to 2024 values (Appendix G) although values will vary according to landscape, any pre-existing access to equipment and availability of ‘free’ labor (e.g., farmer labor) (Appendix G).
We assume that drainage ditches are permanent infrastructure so there is no lifespan of the ditches. However, ditches require regular mechanical clearance (e.g., of sediment or weeds) to retain effectiveness (Dairy NZ 2015). We assume that 10 per cent of ditches are re-excavated every three years.
Establishing water tolerant pasture
We explore the implications of converting pasture from ryegrass to water-tolerant tall fescue grass in the areas that are impacted by high groundwater table. This is because tall fescue grass is considered more tolerant of wet soils than perennial ryegrass (and consequently more productive in wet seasons, as well) (Dairy NZ 2024 a; Milne et al. 1997 citing Kerrisk and Thomson 1990 and Easton et al. 1994; Dairy Australia: Braun and Patton 2024). We consider the use of tall fescue in three cases, where:
- Tall fescue is planted as part of standard pasture renewal today
- Tall fescue is planted as part of standard pasture renewal in 20 years’ time
- Ryegrass is actively removed and replaced at cost by tall fescue.
The use of water tolerant grass such as tall fescue is assumed to have no mitigation impact on flood risk.
In their experiments, Braun and Patton (2024) identify greater differences in roots and shoots under water logging conditions for perennial rye grass than for tall fescue, while Nguyen (2022) found waterlogging had smaller impacts on the root growth of tall fescue compared to cocksfoot.
No information was found on the quantified impact of progressive waterlogging on tall fescue that would allow comparison with waterlogging impacts on perennial ryegrass. That said, it can reasonably be assumed that even a more water-tolerant tall fescue grass has growth limits when facing waterlogging (see for example, Nguyen, 2022; Mui et al., 2021).
For the purpose of exploration, we consider the possible impact of shallow groundwater on tall fescue if losses from waterlogging were five per cent lower than might be expected for perennial ryegrass. In practice, the impacts of waterlogging are variable, so this assumption is only illustrative, and more research is required on this topic. We explore the impact of introducing tall fescue as part of standard replenishment of pasture (i.e., at no additional costs) today or later in the future, and if pasture was overhauled (replaced at cost). The use of water-tolerant grasses such as tall fescue can impact profitability, the operational profitability of tall fescue is estimated (Appendix I).
Retiring part of the land to restore wetland vegetation
Ongoing groundwater rise would reasonably be expected to saturate grassland and, unimpeded, could lead to land eventually transforming to a form of wetland. In these cases, farmers could maintain production in the areas least affected, while retiring more threatened land for development into wetlands. Those (wet)lands would remain exposed to flooding and increasingly shallow groundwater. Wetlands development provides the opportunity for farmers to support ecosystem services (such as development of biodiversity, enhanced coastal protection) or benefit from cropping of wetlands vegetation via activities such as paludiculture (Garrett 2023). The type of wetlands emerging as a result of rising groundwater will depend on a variety of factors such as distance to the coast, land slope, inundation level, salinity level, etc. Wetlands might be freshwater in nature (e.g., swamp or marsh) or brackish (e.g., saltmarsh, mangroves, or seagrass meadow). We consider a restored coastal wetland to explore implications.
In our exploration, we assume that conversion of land to wetlands takes the form of conversion to salt marsh or mangroves and occurs progressively over the years. We assume 15 per cent of land is converted to begin with, increasing by a further 15 per cent every 20 years:
- Today 15% of land is converted
- Yr 20 30% of land is converted
- Yr 40 45% of land is converted
- Yr 60 60% of land is converted.
We also explore the implications of converting land over time to mangroves together with introducing water-tolerant grass (tall fescue).
The costs to establish or restore wetlands from pasture around New Zealand vary according to site, type of wetland developed and the purpose of the wetland (e.g., to restore natural ecosystems or processes in an area compared to, say, constructing artificial wetlands to absorb farm runoff etc.). In New Zealand, work by Johnson (2012) indicated that costs to restore woody, wetland, and other vegetation species in ephemeral wetlands in the southern North Island using voluntary labour for planting and weed management were around NZD $4,000/ha in 2012. More recently:
- Consultations conducted by NIWA to assess the costs of wetlands construction in New Zealand (see Matthews et al. 2024) reveal that landscaping (vegetating) for constructed wetlands for farm management purposes to be around NZD$48,000 /ha (personal communication), while
- Saltmarsh restoration in the Bay of Plenty is reported to be between NZD $20,000 and NZD $190,000/ha, with an average cost of NZD $30,000/ha, not including the cost of the land (Bulmer et al. 2025 citing Bay of Plenty Regional Council as a personal communication). These costs are indicative pricing estimated via common approach of planting (e.g., average speed of planting), labor conditions (e.g., if the planting is a volunteer labor based, the hourly rates are generated by New Zealand minimum wage). Therefore, these costs are also useful guidance for other non-tidal species.
- Bayraktarov et al. (2016) estimated average cost of mangrove restoration to be in the value of USD$52,000/ha.
To determine establishment costs for salt marsh restoration, we draw on the estimates by Matthews et al. (2024 – NZD$48,000/ha) and Bulmer et al. (2024 – NZD$30,000/ha) to assume indicative establishment costs for salt marsh restoration today to be NZD $40 000/ ha. To determine establishment cost for mangrove restoration, we convert values estimates from Bayraktarov et al. (2016), to present day New Zealand dollar values.
Recognising that wetlands will require maintenance in the early days to ensure that they do not become invaded by weeds, we draw on work by Johnson (2012) which reveals the annual maintenance costs of wetlands to be around 4 per cent of establishment costs. We assume annual maintenance costs of 4 per cent total establishment cost per year for the first five years after establishment.
We assume all of the necessary site adaptation to foster wetlands establishment has been implemented and so the associated costs (e.g., cost of tidal reconnection and appropriate inundation management) are excluded from our model (as these costs vary depending on different level of impacted conditions).
Potential benefits of restored non-tidal or coastal wetland
The New Zealand emissions trading scheme (ETS) trades carbon emission for offsets at a current carbon sequestration price of NZD $64 per tonne (International Carbon Action Partnership 2025). Coastal blue carbon habitats (saltmarsh, mangroves, and seagrass) can sequester carbon within their habitats. To estimate the potential cumulated carbon sequestration rates of wetlands, we assume:
- Cumulative carbon sequestration rates of 0.64 tC/ha/y for restored saltmarsh and 0.89 tC/ha/y for mangrove (Bulmer et al., 2024).
- tonnes of CO2 stored in the wetland can generate 1 tonne of accumulated carbon (Parker et al. 2024; Brasell 1996).
The resulting value of carbon sequestration from wetlands is then approximately NZD $202 /ha/y for saltmarsh and NZD $209 /ha/y for mangrove (2024 values). We assume that costs to restore non-tidal (teal) freshwater wetlands would be similar but C sequestration rates somewhat lower (Malerba et al. 2022).
Other than carbon sequestration, wetlands are associated with a wide range of other ecosystem benefits including, for example, coastal protection, soil erosion control, wild fish and other natural aquatic biomass provision services, retention and break down of nutrients, and habitat maintenance, and spiritual, artistic, and symbolic services (Xu et al., 2020; Foundation for Sustainable Development 2021). Internationally, reported values for these different components of ecosystems services across the world can be found in datasets such as the Ecosystem Services Valuation Database (https://www.esvd.net/) or The Economics of Ecosystems and Biodiversity database (https://www.es-partnership.org/esvd/esvd-download/original-teeb-database/). However, studies that have been tailored to specifically assess the economic value of wetlands in New Zealand are relatively scarce. Department of Conservation (2007) and Kirkland (1988) reported the economic values of Whangamarino Wetland vary between NZD $60,000 and NZD $55 million, depending on the service conferred (Table 6). Patterson et al. (2013) estimated the gross use-value delivered by 166 000 ha of wetland ecosystems to be NZD $8,720 million (2012 terms) – or around NZD $52,530/ ha. These values are high compared to average international values estimated for wetlands (see Sinclair Stewart et al. Forthcoming).
For illustrative purposes, we consider the carbon sequestration value of wetlands and also include wetlands biomass as food production in supporting biodiversity ecosystem services to exemplify the broader benefits of wetlands. For saltmarsh, the value of wetlands biomass as food production is assumed to be worth in the order of NZD $3,076 /ha/year and for mangroves, NZD $7,134 /ha/year (2024 values; Sinclair-Steward et al. Forthcoming). Recognising that these values only reflect a proportion of the ecosystem services provided by wetlands, implies a somewhat conservative assessment of wetlands values.
Recognising that the biodiversity value of wetlands increase as they mature, we draw on Yang et al. (2024) for formulae on the relationship between restored saltmarsh growth and species richness, and for growth curves of temperate mangrove in Australia, as proxies for mangrove maturity and biodiversity.
2.4.3. Transformative Capacity Responses
An option to ease financial pressure and reap up-front benefits from current land value might be to sell or lease out some land, while retaining conventional practices on remaining pasture.
Sale of land for lifestyle blocks
Conversion of rural agricultural land to ‘lifestyle blocks’ (small rural holdings primarily used for residential and recreational purposes) has increased rapidly over the last 25 years around New Zealand (Xie et al., 2025). As in other developed countries around the world, this has been driven by the demand for lifestyle living (clean air, privacy, peace and quiet, open space, and an enhanced quality of life) and the financial gains from rural subdivision. Commonly varying from 1—20 ha with an average size of 5 ha, their number has increased more than 7-fold in New Zealand in the last 25 years (Xie et al. 2025).
Land near the coast can attract a premium price, while flood risk and elevated water tables may render this land less favourable, resulting in planning and regulatory challenges and reduced value. We therefore assume that only a portion of farmland might be sold off (e.g., the land with desirable locations) and explore implications of a sale of 15 per cent per cent of the land. The mean price of bare life-style blocks in 2024 was NZ$ 287,082/ha (David Shaw, REINZ, personal communication 25 August 2025), but we assume this would include additional fencing, accessways and subdivision costs. REINZ (2024 a) observes a mean sale price for dairy farmland in 2024 of approximately NZD $48,325/ ha. We draw on Dairy NZ (2024 c) to apply a value of NZD$ 42,628/ha which is the decadal average of sales values for dairy land since 2013-2014.
Lease of land for photovoltaic power
Solar photovoltaic (PV) systems are of increasing interest as a means to support farming land use in New Zealand (Vaughn et al. 2023; Brent et al. 2024). Land use for this purpose in New Zealand could theoretically take the form of a direct replacement of land use or involve targeting both energy production and farming together (‘agrivoltaics’ – see Brent et al. 2024 for example). Theoretically over 80 per cent of agricultural land in New Zealand – around 10 million hectares – should be ‘fairly suitable’ or ‘good’ for agrivoltaics land use (MacKenzie et al. 2024).
To maintain comparability with land conversion to wetlands, we assume that lease of land for PV power in our exploration occurs progressively over the years. We assume 15 per cent of land is converted to begin with, increasing by a further 15 per cent every 20 years:
- Today 15% of land is converted
- Yr 20 30% of land is converted
- Yr 40 45% of land is converted
- Yr 60 60% of land is converted.
A recent assessment of farm-level adoption of agrivoltaic production (Brent et al. 2023; Vaughan et al. 2023) considered the case of a 235 hectares of flat land dairy farm in New Zealand with a total of 860 cows, where 2 ha could be converted to an agrivoltaics production system. It was observed that the PV equipment could be elevated to enable cattle to continue to move across land, allowing grazing and power production to occur simultaneously (‘solar grazing’), albeit at a lower level of grazing (as equipment takes up some of the space). The power generated by the 2 ha of equipment could theoretically offset the costs of PV establishment and reduce grazing by supplementing the power supply (e.g., to support the milking shed). Based on a farm-level estimate of costs and benefits, it was estimated that:
- An agrivoltaic system would be expected to lower financial returns to the dairy farmer compared to conventional farming, and consequently
- Due to the relatively high return to farmers of dairy farming, agrivoltaic approaches are likely to be better suited to non-productive dairy areas or might better suit the installation of panels on shed roofs, rather than agrivoltaics production per se (Brent et al. 2023; Vaughan et al. 2023).
On the other hand, with the prospect of increased flooding and/or waterlogging from rising groundwater, the value proposition for photovoltaic solar energy production might well rise. In practice, the form of agrivoltaics systems will vary from site to site, according to the type of equipment used, the intensity of placement (space between equipment) and lay of the land.
In comparison to farm-level adoption of agrivoltaics, Miller (2020) considers the scope for utility-level PV power production. Miller (2020) focusses on high producing exotic grassland, low producing grassland and depleted grassland for suitability for utility-scale PV systems. He observes that the financial and economic efficiency of utility-scale production would in practice be influenced by access to the broader electrical power grid/ distribution system.
The alternative to the incorporation of PV systems to farming might be for farmers to lease land for PV power generation. Miller (2020) suggests that the capital costs for utility-scale solar systems in New Zealand are decreasing and are ‘now close to a point where rate of return becomes acceptable to consider building such a plant’ (Miller 2020, p. 1).
Reported solar leasing rates for farms in New Zealand have previously been between NZD$2,000 to $6,500/ha per year (Rennie 2022; New Zealand Dairy Exporter 2023), anecdotally as far as NZD$8,000/ha per year (Anon 2023). New Zealand Dairy Exporter (2023) indicates that properties within 5 km of a power substation suitable for distributing the solar power are likely to be easier to develop than those further away. This makes them more attractive to a developer and likely to command a higher lease price (New Zealand Dairy Exporter 2023). For the purpose of this study, we explore the implications of leasing 10 per cent of the land to solar power at a price of NZD$4,000/ ha.
Reflecting the information provided we explore 13 responses which comprise either singular actions or combinations of actions. In relation to FAO’s absorptive, adaptive or transformational strategies for agriculture, we explore the responses under four scenarios (Appendix D).
2.5. Estimate Economic Impacts
We assess the nature of economic effects on the farm over time with and without change. We estimate the gross values (earnings) of the farm by considering the potential earnings with different responses, less the financial costs of operating those responses. Assessment of values such as costs are estimated and presented in New Zealand dollars and in 2024 values. To compare the relative value of different responses, we calculate the net present value (NPV)of options over time (Appendix E).
Because the impacts of different responses in the face of rising groundwater and flood threats occur over different periods of time, we account for the value of time by using discount rates. Simply put, positive discount rates emphasise values (benefits or costs) associated with an action today compared to those in the future. High discount rates diminish the value of costs or benefits occurring in the future. Low rates, by contrast, assign greater weight to future well-being. The Treasury (2025) recommends public sector investments be subject to a discount rate of 2 per cent for the first 30 years, 1.5 per cent for years 31 to 100, and 1 per cent for years 101 onwards. Alternatively, private discount rates can be approximated using lending rates for private investments. Nationally, private sector loan rates vary, starting from around 4 or 5 per cent (ASB 2025; ANZ 2025)., depending on the value and type of financing undertaken.
For the purpose of our exploration, we apply a discount rate of 5 per cent to farm earnings. We conduct a sensitivity analysis using the national public sector discount rate of 1.5 per cent.
3. Results
We first describe the impact of rising groundwater and increasing flood threat on values to the farm over time without response. We then compare the gross values that might be achieved with different responses. Then we consider the net present values of different responses.
3.1. Gross Values Without Change in Management
Without change in farm management, climate change threatens farm productivity by raising groundwater and increasing the incidence of water logging that can depress pasture production over time. Compounding this, regular and increasingly intense flooding from climate change can incur costs and depress productivity causing dips in earnings. In our example, this appears figuratively as a downward ratcheting trend in earnings. In Figure 2 with deeper groundwater, the effect of increasingly intense regular (10 yearly) sudden onset flooding events is visibly prominent in causing gradual reductions in farm profitability, generating a ’ratchet’ effect. The non-discounted earnings curve is highest, as discounting depresses the value of earnings over time (presenting as lower solid and dashed curves). The higher private discount rate causes the decline to fall more rapidly. Nevertheless, while the impact of climate change (especially from rising groundwater) means that earnings fall steadily over time, the farm continues to earn profits by 2100 (albeit narrowly).
With shallower groundwater, waterlogging resulting from increasingly shallow groundwater depresses profitability more rapidly, compounding the cost of flooding and having an increasingly more powerful influence on farm productivity (Figure 3). Together, climate changed-inducted increases in flood severity and shallow groundwater result in lower earnings over time than when groundwater is deeper. The farm faces losses before the end of the century. With discounting, future losses are diminished so the farm continues to face losses before the end of the century, but at a diminished rate.
3.2. Gross Values with Change
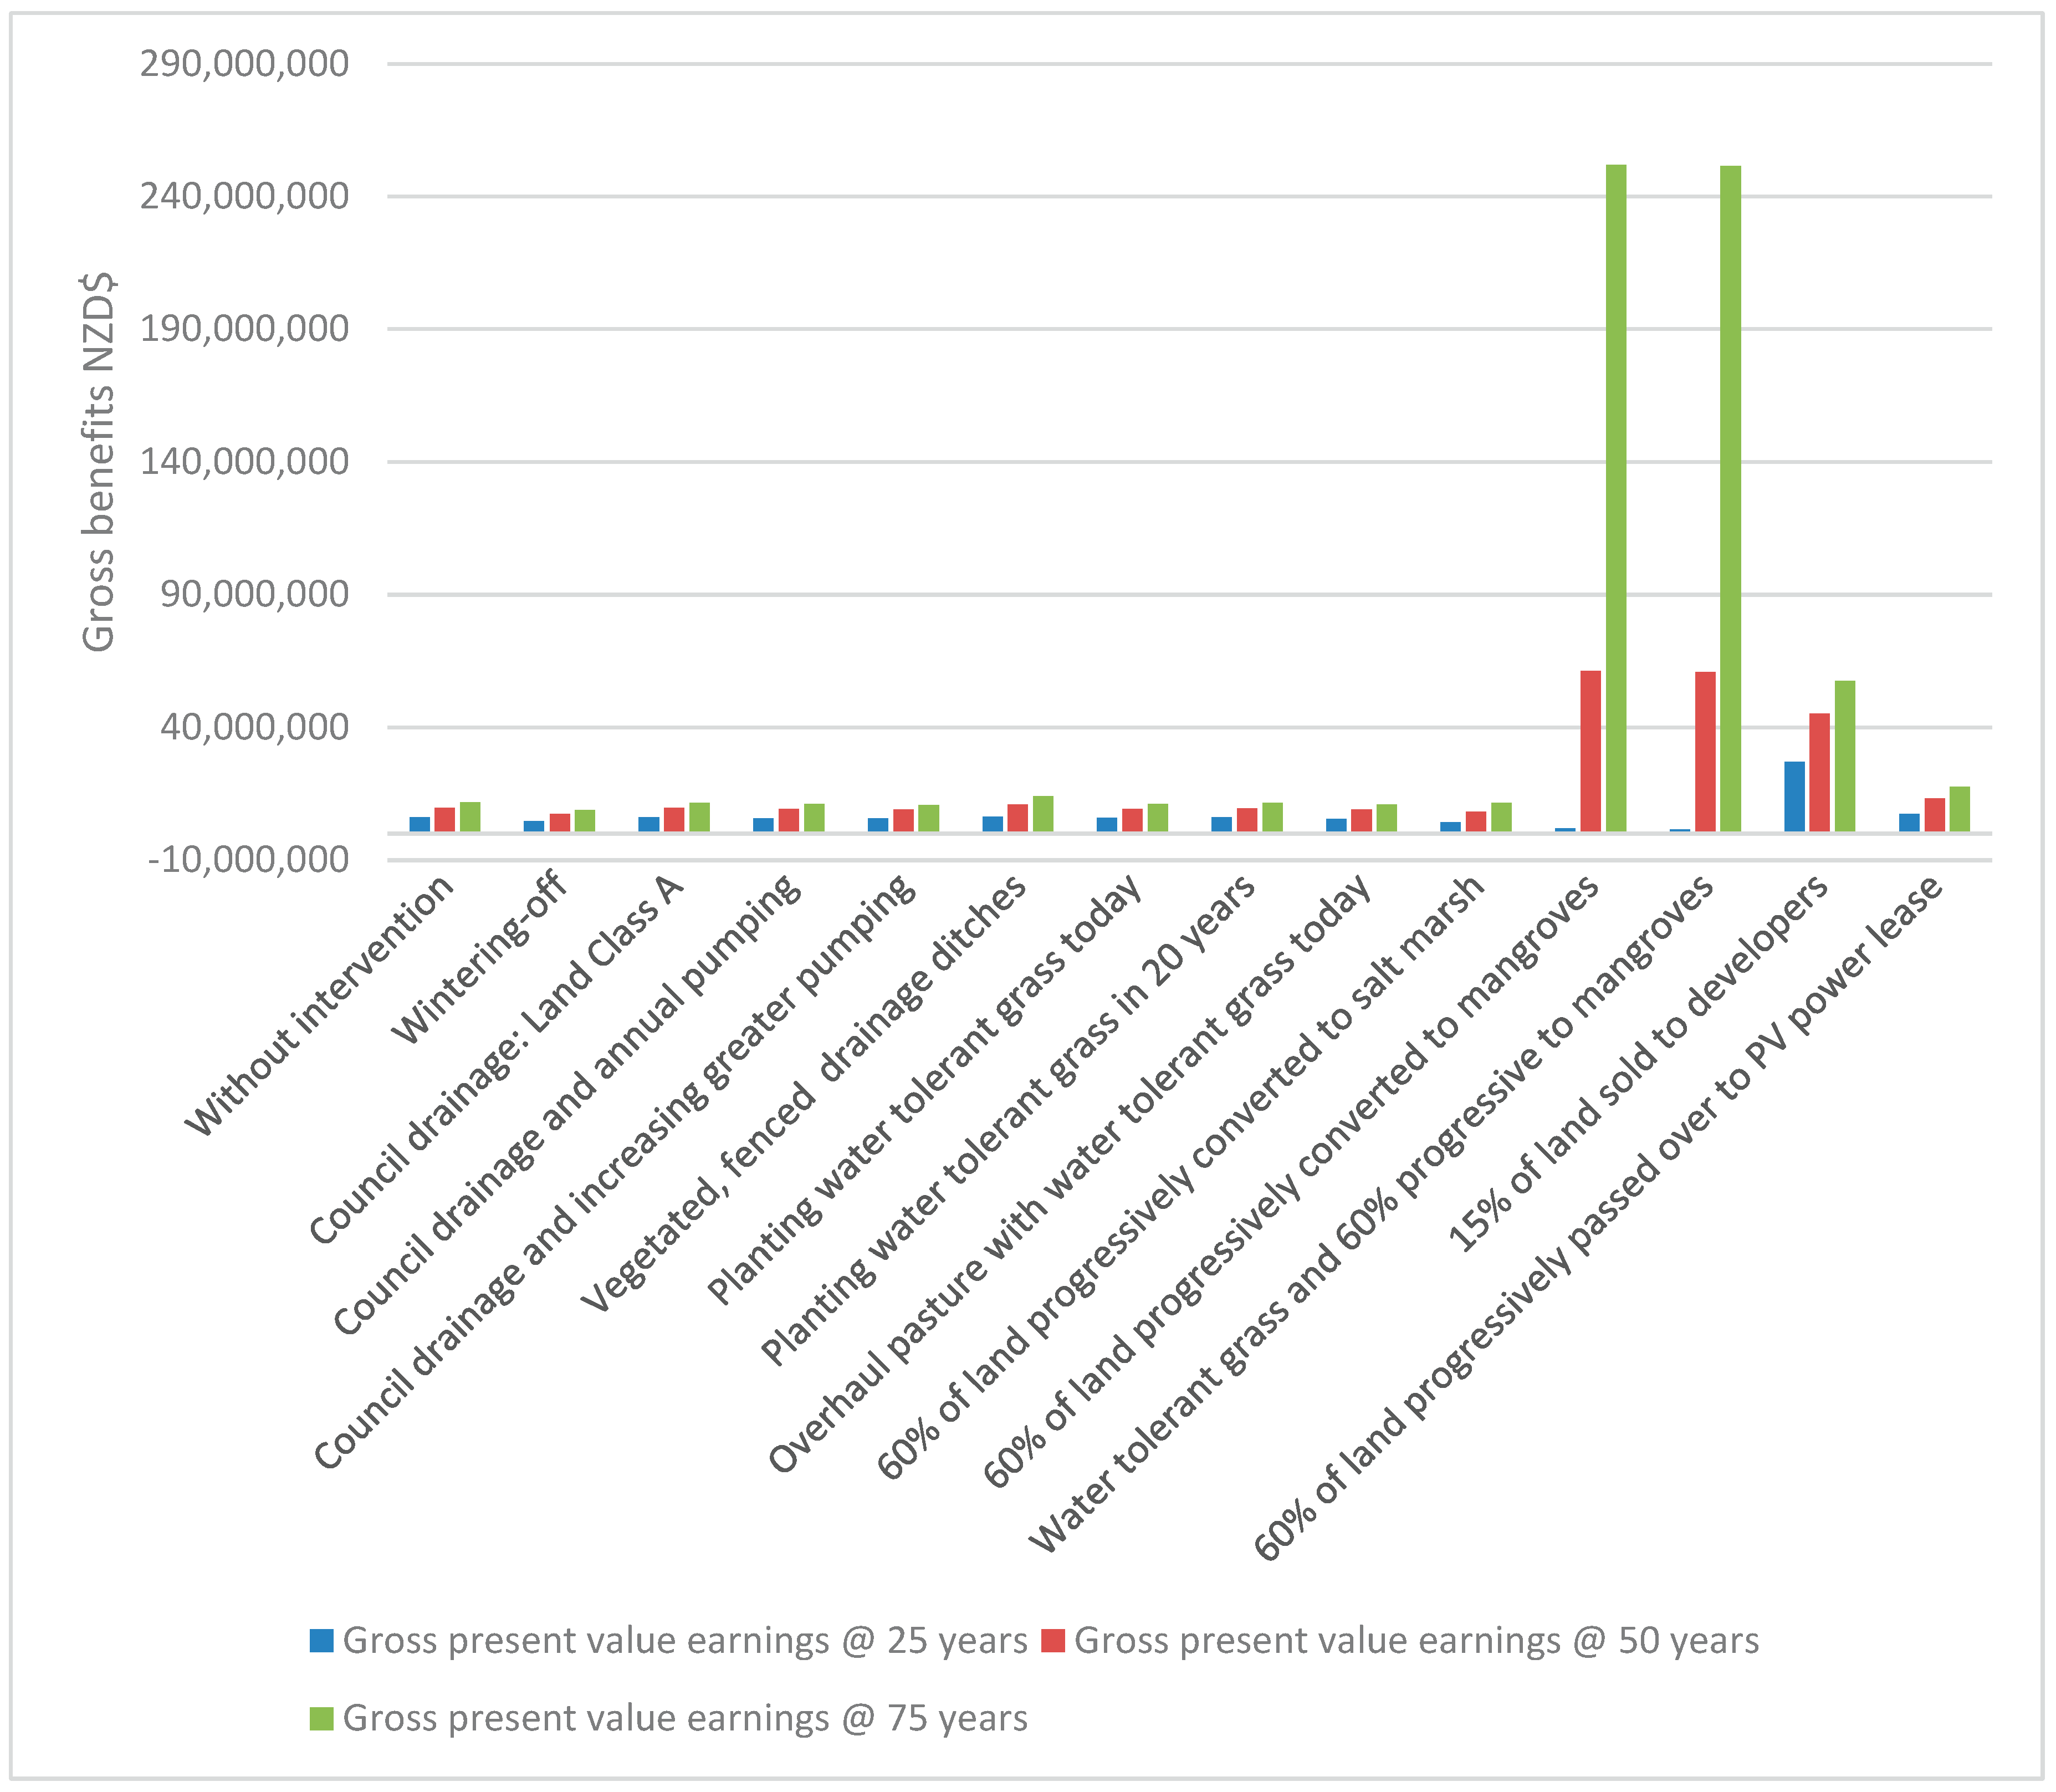
Regardless of groundwater levels or discounting, responses that include some form of land conversion to mangroves generate the highest gross benefits. The highest performer in terms of gross benefits is conversion of progressively more land to mangroves, followed by progressively converting land to mangroves in tandem with the introduction of water tolerant pasture (Figure 4 and Figure 5 displaying results where ground water commences at 700 mm from the surface – see annex for more information; Tables 9 and 10).
The strong performance of the mangrove-related responses is explained by the comparatively high value of environmental services associated with mangroves. This compares starkly with the performance of converting 10 per cent of land to salt marsh – this response performs either worst or at least very poorly compared to other responses, even compared to doing nothing. This is explained by the relatively high cost of land conversion and the relatively low value of environmental services assumed for salt marsh. Upgrading council services to include improved flood protection and progressively higher levels of pumping overtime also performs poorly. This might be explained by the fact that improved flood protection reduces the costs of flooding but does not mitigate increasing waterlogging of pasture on which farm profitability relies. Also performing poorly compared to other options are the introduction of drainage ditches – where the cost of establishment and ongoing maintenance take time to recover – and wintering off – which offers no impact on waterlogging and only occasional and partial respite from flood costs.

Table 9.
Gross benefits (discounted).
|
GW=1000 DR=5% |
GW=700 DR=5% |
GW=1000 DR=1.5% |
GW=700 DR=1.5% |
||
| 1 | Without intervention | 5,717,885 | 2,953,884 | 11,772,004 | 4,756,297 |
| 2 | Wintering off | 4,362,463 | 1,598,462 | 8,748,402 | 1,732,695 |
| 3 | Council upgrades from none/Class B to Land Class A | 5,608,498 | 2,844,497 | 11,566,366 | 4,550,659 |
| 4 | Council upgrades and pumping | 5,368,375 | 2,604,374 | 11,029,015 | 4,013,308 |
| 5 | Council upgrades and increasing extents of pumping | 5,318,944 | 2,554,943 | 10,779,651 | 3,763,944 |
| 6 | Vegetated, fenced drainage ditches …? | 6,232,614 | 3,833,860 | 13,977,163 | 8,609,193 |
| 7 | Water tolerant grass planted today as part of standard pasture renewal | 5,427,662 | 2,802,650 | 11,172,048 | 4,509,017 |
| 8 | Water tolerant grass planted in 20 years’ time as part of standard pasture renewal | 5,618,528 | 2,914,876 | 11,421,582 | 4,654,534 |
| 9 | Replacing pasture with water tolerant grass at cost | 5,148,212 | 2,523,198 | 10,892,598 | 4,229,567 |
| 10 | Progressive conversion to salt marsh | 4,465,110 | 2,376,144 | 11,460,710 | 6,882,212 |
| 11 | Progressive conversion to mangroves | 38,316,957 | 36,227,992 | 251,988,764 | 247,410,267 |
| 12 | Progressive conversion to mangroves plus water tolerant grass | 38,052,304 | 36,068,387 | 251,511,343 | 247,163,038 |
| 13 | Sale of land to developers | 26,079,681 | 23,730,280 | 57,491,499 | 51,528,148 |
| 14 | Lease of land for PV power | 7,494,274 | 5,405,309 | 17,640,932 | 13,062,435 |
Table 9.
Ranking responses by gross discounted benefits.
| GW=1000 DR=5 |
GW=700 DR=5 |
GW=1000 DR=1.5 |
GW=700 DR=1.5 |
||
| 1 | Without intervention | 6 | 6 | 6 | 7 |
| 2 | Wintering off | 14 | 14 | 14 | 14 |
| 3 | Council upgrades from none/Class B to Land Class A | 8 | 8 | 7 | 9 |
| 4 | Council upgrades and pumping | 10 | 10 | 11 | 12 |
| 5 | Council upgrades and increasing extents of pumping | 11 | 11 | 13 | 13 |
| 6 | Vegetated, fenced drainage ditches …? | 5 | 5 | 5 | 5 |
| 7 | Water tolerant grass planted today as part of standard pasture renewal | 9 | 9 | 10 | 10 |
| 8 | Water tolerant grass planted in 20 years’ time as part of standard pasture renewal | 7 | 7 | 9 | 8 |
| 9 | Replacing pasture with water tolerant grass at cost | 12 | 12 | 12 | 11 |
| 10 | Progressive conversion to salt marsh | 13 | 13 | 8 | 6 |
| 11 | Progressive conversion to mangroves | 1 | 1 | 1 | 1 |
| 12 | Progressive conversion to mangroves plus water tolerant grass | 2 | 2 | 2 | 2 |
| 13 | Sale of land to developers | 3 | 3 | 3 | 3 |
| 14 | Lease of land for PV power | 4 | 4 | 4 | 4 |
3.2. Net Benefits of Change
The net benefits of responses – the NPV – are calculated by comparing discounted impacts of response to discounted farm performance if no response was undertaken – and then subtracting their costs. Discounting is influential here because it diminishes the value of benefits or costs occurring in the future. Benefits that take time to accrue into the future diminish more rapidly with a high discount rate but diminish more slowly with a lower discount rate. The result is that wetland-related actions that take time to generate mature benefits perform better economically with the higher private discount rate as benefits diminish less.
While discount rates influence benefits, they also reduce the economic value associated with costs. This means that the economic performance of options that might otherwise be poor (due to, say, high upfront or ongoing costs) are estimated to be better with higher discount rates. For example, in this exploration, the NPVs of wintering off, improved services from councils and planting water-tolerant grass today are estimated to be negative over time on account of the relatively low savings achieved compared to earnings without action. The higher discount rate 'burns off' the losses faster than the lower discount rate. As a result, these options fare better economically with a high discount rate, although they still result in losses relative to the status quo.
Overall, mangrove-related actions are estimated to offer the highest NPVs, followed by the transformation of land from agriculture to lifestyle blocks and or PV power (Appendix H -Table 11). These latter actions benefit from immediate up-front benefits. The weakest performing responses were estimated to be wintering off (which offers relatively low benefits to groundwater threats), conversion to salt marsh (which has relatively low environmental benefits for the upfront costs) and actively overhauling pasture (replanting at cost, rather than as part of standard pasture renewal. This has sizeable upfront costs which are difficult to recoup). The ranking of responses remains largely the same as the ranks for gross benefits (Appendix H- Table 12).
4. Discussion
Not adapting to climate change implies a steady decline in farm profits over time as increased flood risk and rising groundwater hamper operations. In our exploration, sudden onset decadal flooding is an important influence on farming when groundwater is deeper (1000 mm from the surface.), creating noticeable economic shocks to the farm (Rakkasagi et al., 2025). However, as sea level rise pushes groundwater closer to the surface, the slow onset hazard of waterlogging can begin to bite. With both hazards, farming might still make some level of operating profit by 2100 even if no changes are made. However, profits are noticeably lower, especially where groundwater is shallow and a private discount rate applies. Our exploration indicates that the economic performance of a farm could improve if changes are made. In this work, responses that include some degree of mangrove restoration generate potentially high potential benefits. Compared to other responses, mangrove-related responses in our exploration consistently offer the highest potential net benefits to our farm, regardless of groundwater levels or discount rates. Combining some mangrove conversion with water tolerant grass generally offers the highest net benefits. Nevertheless, the majority of the benefits associated with mangrove-related options would not accrue to the farmer/landowner unless they can be monetised.
The positive performance of mangrove-related response in this exploration reflects the potential ecosystem service value we associated with mangroves. However, this does not mean that mangrove related responses are necessarily practical for New Zealand. First, although saltmarshes occur in suitable habitats throughout New Zealand, mangroves only grow in the northern half of the North Island of New Zealand (Bulmer et al. 2024). Secondly, rapid mangrove expansion in many New Zealand estuaries has been driven by increased deposition of fine sediments from anthropogenic land-management practices. This expansion has led to reduced views of open water and obstruction of recreational access, thereby contributing to negative public perceptions of mangroves—despite their well-established ecological value (Horstman et al., 2018). In contrast, salt marsh has significantly declined in extent (due in part to mangrove expansion and coastal squeeze) and provides a lower-growing and more diverse ecosystem. Consequently, its restoration is generally perceived more positively and is actively underway in some areas around New Zealand (e.g. Purandare et al. 2024). However, achieving suitable conditions for its establishment can be challenging (Bakker 2012; Purandere et al. 2024) and may require special management such as tidal control structures (Rankin et al., 2023).
Thirdly, the economic performance of responses that include mangroves or other wetlands depends on the value that is assumed for the environmental services they provide. While we adopted a comparatively modest ecosystem service value for mangroves (NZD$7,134/ha for mangrove food production to support biodiversity), the value could have been different. Sinclair-Stewart et al. (Forthcoming) indicate that, depending on the specific ecosystem service considered, the global average value of ecosystem function of mangroves could be as low as NZD$3/ha (in that case, for the role of mangroves in regulating water flows). If this value was used, the economic performance of mangrove-related responses would fall extensively, and the rank of these options would be very low. As well, our assumed ecosystem value for the role of salt marsh in food production to support biodiversity was low (taken from Sinclair-Stewart et al. Forthcoming; Walker 2010). Not surprisingly, this resulted in the relatively poor economic performance of the salt marsh-related response. These points underscore the ongoing importance of assessing, recognising and confirming the economic value of alternative ecosystem service values for New Zealand’s wetlands.
Furthermore, the economic value assumed for mangroves in our framework reflected impacts that are commonly public in nature – that is, they accrue to wider society rather than specifically to the farmer. As a result, the incentive for farmers to consider investing in ecosystem-based responses to climate change threats may be small because the benefits they provide are currently perceived as externalities of their farm businesses so they cannot reap most of the benefits of their efforts. Unless the farmer can monetise the (public) benefits of mangrove restoration (e.g. via subsidy payments, cost-sharing or ecosystem service markets), our farmer might more logically sell of land for development, as the boost on income today results in the highest NPV outside of mangrove restoration options.
The protection and restoration of wetlands across New Zealand has been an area of considerable interest in recent years (see, for example Ministry for the Environment 2021; Department of Conservation Undated; Forest and Bird 2023; Wetlands Trust Undated; New Zealand Landcare Trust 2024). If New Zealand envisages a future that benefits from healthy wetland ecosystems and the services they provide, there needs to be a means for farmers to reap the benefits of their investments. This is because our exploration indicates that using The Treasury discount rate for public investments (1.5 per cent) could result in economic (primary public) benefit for our farm six times higher than could have been reaped with a higher, private discount rate. This could be used towards dialogue for cost sharing with farmers.
Potentially, cost-sharing for wetlands restoration might be introduced to subsidise farmer investments in wetlands in the public interest. Cost sharing might theoretically begin by extending existing trading systems in New Zealand. Presently, wetland ecosystems do not form part of New Zealand’s emissions trading scheme (ETS). Including wetlands could enable farmers to recoup the costs of wetland establishment or protection via their carbon sequestration functions. The real value of wetlands such as mangroves – and the real potential in cost sharing for their establishment and protection – may thus be in benefits conferred outside of conventional trading systems in New Zealand altogether.
An alternative strategy might be to consider subsidised loans that more closely reflect the social discount rate of public investments, or to support the development of markets where commercial wetlands products could be generated. Garrett (2023) considers opportunities for paludiculture in the Waikato region of New Zealand, such as the development and sale of wetland crops for bioenergy, water filtration and or for crafting, but these are unlikely to be economically viable under current conditions. Viable responses need to be suitable to specific farm-level situations and for different waterlogging conditions with different farming traditions, and the adaptation practices would also need to be integrated specifically. With limited time and resources, these details are excluded in this research.
In addition to mangrove-related responses, our exploration highlights the potential value of other transformative responses. Following mangrove-related responses, actions involving transforming some land over to use for PV power or development were the next economically valuable options (Wang & Qian 2024). In practice, challenges may exist for such transformative options. First, transformation of productive land for land development would require the handover of prime land which is most desirable. This would imply that remaining land is less productive and profitability for remaining farmland would be lower, potentially harming the future of the farm. Second consenting requirements for new land use could be demanding. While this is not a challenge for farmers who sell their land, it could be time consuming and demanding on developers and buyers, impacting the viability of this option. For example, there may be objections to changes in land use, such as possible resistance to the aesthetic/environmental amenity impact of land used for PV power (Rennie 2022; Brent et al. 2024). It may also be difficult to resume farming later, if farmers wished to do so at the end of their lease (e.g., Rennie 2022).
In any event, conversion of land to some alternative uses may only offer short-term financial relief. Transfer of land for development may offer income in the short term but it will have only a specific window of opportunity (Sairinen et al. 2010). While areas of high groundwater are not good for farming, they are also unlikely to be appealing to developers without significant earthworks operations which would increase costs and could exacerbate downstream flooding risks. Landowners would need to pre-empt critical water table levels in order to benefit from sales. The same higher, less at-risk land that farmers are mostly likely to wish to retain is likely to be the same land they may be most able to sell. In selling off – or even leasing out – most productive land to other users, farmers will be left with lesser productive land for ongoing farm operations. As a result, their ability to generate profits over time might actually decline faster with this response. It should be recognised that timing will also matter for other responses. For example, planting of water tolerant grasses may buy time for farmers but continually rising water tables are likely to mean that even water tolerant pasture has a finite window of use.
5. Limitations of This Study
Our framework and story are based on a stylised New Zealand temperate farmland situation. Farm operations and responses are simplified to present general cases. However, variations across farms will affect the size of the window for adaptation. For example, for farms located on coastal lowlands with minimal slope (e.g., θ <= 0.5%) (Ketabchi et al., 2016), the window for maintaining farming systems in the face of increasing risk of flooding and shallow groundwater will shrink faster than for others. Potentially, responses to threats such as cut-and-carry systems and water-tolerant grasses will be less viable in these areas in the short to medium term and farmers will have fewer choices. In addition, our assumptions are that our archetypical farm is all relatively flat and prone to sea level rise and thus all the land is at some risk of flooding. In the real world, this land may not be permitted for house development because of the flooding risk and the structural risks due to building in waterlogged soils. Costs to build foundations in these conditions would be higher and insurance more expensive and/or difficult to find. Furthermore, low-cost housing is unlikely to be provide optimal financial returns. Development in these low-lying lands is likely to favour the less at-risk, higher elevation, more productive land.
This study identifies the depth of groundwater as a critical factor in how long farmers have to plan ahead. Where groundwater is presently deeper than 2 metres, farmers have a larger window of adaptation opportunity than where groundwater is shallow. With a rise in groundwater of 4.5 mm per year, land with groundwater starting 2 m from the surface could remain relatively unaffected for decades. As a result, time remains for farmers to contemplate future responses such as drainage or implementing cut-and-carry.
By comparison, farms with already shallow groundwater have fewer years to adjust practices. They will be increasingly vulnerable to intensifying flooding as well as groundwater rise. Their ability to recover from the flood events with increasingly moist soils is likely to become increasingly difficult.
While these simplifications exist, our framework could be extended to accommodate farm system absorptive and adaptive capacity by coupling it to a farm systems model and running simulations on a daily timestep.
We apply functions generated by Snow et al. (2025) to estimate the magnitude of possible losses to pasture from incremental waterlogging. In practice, the quantity of harvestable dry matter affected will be subject to specific soil and groundwater characteristics, and farm management such as drainage, fertiliser usage and the grazing regime. Our estimates of loss are therefore illustrative.
Potentially of importance, we do not include the impacts of climate change on salinisation of soil in this exploration. As sea level rises, it is likely that soil will be exposed to greater groundwater salinity. Ryegrass pasture production would decline more rapidly with rising water tables than calculated by Snow et al. (2025) if sea level rise causes soil salinisation (Water New Zealand 2024; Parliamentary Commissioner for the Environment 2015). We do not include salinisation of soils in our exploration except to acknowledge that any windows for change in adaptation would contract more rapidly once salinisation takes effect.
Our exploration assumes there are not catastrophic failures in existing stopbanks and drainage systems that drastically change the viability of farming. We also assume a static ongoing sea level rise rate of 4.5 mm/year, with no future acceleration or abrupt rises (e.g. an abrupt ice shelf collapse scenario). This may not be the case given the increased rates observed over recent decades and the potential for acceleration as a result of tipping points and cascading effects not accounted for in sea level rise models (Wunderling et al., 2024). The projections to 2100 should therefore be viewed as an exploration of the method rather than a realistic scenario.
To tease out the broader story of possible adaptation implications, some of our assumptions are simplistic. For example, we assess the value of drainage, and of drainage plus pumping, on the assumption that they both maintain production levels in the face of climate change. In practice, these options would have variable impacts on the farm. (A farmer would not need to consider the drainage and pumping option if the council drainage scheme alone prevented flooding.) However, these assumptions are used to enable us to consider wider implications.
Finally, our exploration of responses that involve wetlands development did not include the cost to reconnect inundated land with the coast. If no human interventions are involved (e.g., set up drainage management system to enforce the reconnection), the potential time frame of the natural reconnection process is also not included. In this research, we made reasonable assumptions that the reconnection, salinity level, water level, and other environmental conditions will be suitable for coastal wetland to establish, noting that the associated human intervention cost varies depending on specific characteristics and may not be feasible is some situations.
6. Conclusion
Farming the lowlands of New Zealand will be impacted by climate change through rising groundwater and increasing intensity of flooding. A variety of possible responses exist to adapt to these slow- and sudden-onset threats, but the extent to which they will be valuable will depend on the unique conditions of farms, not least the present extent of shallow groundwater and the severity of flood risk. As the productivity of coastal lowlands become increasingly compromised by climate change, the need to consider alternative uses of lowlands – and cost sharing arrangements to enable them – will become critical.
Our exploration also highlights the role of sudden- compared to slow-onset threats in the profile of risk to farmers. Farmers may be less able to focus on production between flood events and increasingly focus on chronic waterlogging as rising groundwater impedes flood recovery. In a world dominated by flood reports (New Zealand Herald 2019; New Zealand Herald 2023 b; Quinn 2023; Weekes et al. 2015) and the fear of worsened floods (Ministry for the Environment 2010), climate change will bring slow-onset threats such as groundwater rise into stark focus in New Zealand’s lowlands and highlight the need for long term planning.
Author Contributions
PH: Conceptualization, methodology, economic modelling, project management, writing – original draft, writing – review & editing. ZQ: Conceptualization, methodology, economic modelling, writing – original draft, writing – review & editing. CT: Conceptualization, funding acquisition, methodology, writing – review & editing. ZE: Conceptualization, methodology, writing – review & editing. CR: Conceptualization, writing – review & editing.
Funding
This work was funded by the Ministry of Business, Innovation & Employment in Future Coast Aotearoa, grant number C01X2107.
Data Availability Statement
Data is available by request.
Acknowledgments
We acknowledge Ross Monaghan, Val Snow and Mike Dodd (Bioeconomy Science Institute), Prof Alan Brent (Victoria University of Wellington) and Jackson Efford and Santiago Bermeo (Bay of Plenty Regional Council) whose helpful and informative discussions enabled us to develop our framework.
Conflicts of Interest
The authors declare that they have no known competing financial interests or personal relationships that could have appeared to influence the work reported in this paper.
Appendix A
Appendix A.1
Table A1.
Scenario 1 – gross and net benefits of responses. Present value benefits when groundwater today is 1000 mm from the surface; 5% discount rate.
Table A1.
Scenario 1 – gross and net benefits of responses. Present value benefits when groundwater today is 1000 mm from the surface; 5% discount rate.
| Gross present value earnings @ 75 years | Ranks gross benefits | NPV @75 years | NPV rank @ 75 years | ||
|---|---|---|---|---|---|
| 1. | Without intervention | 5,717,885 | 6 | ||
| 2. | Wintering off | 4,362,463 | 14 | -1,355,422 | 13 |
| 3. | Council upgrades from none/Class B to Land Class A | 5,608,498 | 8 | -109,387 | 7 |
| 4. | Council upgrades and pumping | 5,368,375 | 10 | -349,510 | 9 |
| 5. | Council upgrades and increasing extents of pumping | 5,318,944 | 11 | -349,510 | 9 |
| 6. | Vegetated, fenced drainage ditches | 6,232,614 | 5 | 514,729 | 5 |
| 7. | Water tolerant grass planted today as part of standard pasture renewal | 5,427,662 | 9 | -290,223 | 8 |
| 8. | Water tolerant grass planted in 20 years’ time as part of standard pasture renewal | 5,618,528 | 7 | -99,357 | 6 |
| 9. | Replacing pasture with water tolerant grass at cost | 5,148,212 | 12 | -569,673 | 11 |
| 10. | Progressive conversion to salt marsh | 4,465,110 | 13 | -1,252,775 | 12 |
| 11. | Progressive conversion to mangroves | 38,316,957 | 1 | 32,599,072 | 1 |
| 12. | Progressive conversion to mangroves plus water tolerant grass | 38,052,304 | 2 | 32,334,419 | 2 |
| 13. | Sale of land to developers | 28,915,651 | 3 | 23,197,766 | 3 |
| 14. | Lease of land for PV power | 7,494,274 | 4 | 1,776,389 | 4 |
Table A2.
Scenario 2 – gross and net benefits of responses. Present value benefits when groundwater today is 700 mm from the surface; 5% discount rate.
Table A2.
Scenario 2 – gross and net benefits of responses. Present value benefits when groundwater today is 700 mm from the surface; 5% discount rate.
| Gross present value earnings @ 75 years | Ranks gross benefits | NPV @75 years | NPV rank @ 75 years | ||
|---|---|---|---|---|---|
| 1. | Without intervention | 2,953,884 | 6 | ||
| 2. | Wintering off | 1,598,462 | 14 | -1,355,422 | 13 |
| 3. | Council upgrades from none/Class B to Land Class A | 2,844,497 | 8 | -109,387 | 7 |
| 4. | Council upgrades and pumping | 2,604,374 | 10 | -349,510 | 9 |
| 5. | Council upgrades and increasing extents of pumping | 2,554,943 | 11 | -349,510 | 9 |
| 6. | Vegetated, fenced drainage ditches | 3,833,860 | 5 | 879,976 | 5 |
| 7. | Water tolerant grass planted today as part of standard pasture renewal | 2,802,650 | 9 | -151,234 | 8 |
| 8. | Water tolerant grass planted in 20 years’ time as part of standard pasture renewal | 2,914,876 | 7 | -39,008 | 6 |
| 9. | Replacing pasture with water tolerant grass at cost | 2,523,198 | 12 | -430,686 | 11 |
| 10. | Progressive conversion to salt marsh | 2,376,144 | 13 | -577,740 | 12 |
| 11. | Progressive conversion to mangroves | 36,227,992 | 1 | 33,274,108 | 1 |
| 12. | Progressive conversion to mangroves plus water tolerant grass | 36,068,387 | 2 | 33,114,503 | 2 |
| 13. | Sale of land to developers | 26,566,250 | 3 | 23,612,366 | 3 |
| 14. | Lease of land for PV power | 5,405,309 | 4 | 2,451,425 | 4 |
Table A3.
Scenario 3 – gross and net benefits of responses. Present value benefits when groundwater today is 1000 mm from the surface; 1.5% discount rate.
Table A3.
Scenario 3 – gross and net benefits of responses. Present value benefits when groundwater today is 1000 mm from the surface; 1.5% discount rate.
| Gross present value earnings @ 75 years | Ranks gross benefits | NPV @75 years | NPV rank @ 75 years | ||
|---|---|---|---|---|---|
| 1. | Without intervention | 11,772,004 | 6 | ||
| 2. | Wintering off | 8,748,402 | 14 | -3,023,602 | 13 |
| 3. | Council upgrades from none/Class B to Land Class A | 11,566,366 | 7 | -205,638 | 6 |
| 4. | Council upgrades and pumping | 11,029,015 | 11 | -742,989 | 10 |
| 5. | Council upgrades and increasing extents of pumping | 10,779,651 | 13 | -742,989 | 10 |
| 6. | Vegetated, fenced drainage ditches | 13,977,163 | 5 | 2,205,159 | 5 |
| 7. | Water tolerant grass planted today as part of standard pasture renewal | 11,172,048 | 10 | -599,956 | 9 |
| 8. | Water tolerant grass planted in 20 years’ time as part of standard pasture renewal | 11,421,582 | 9 | -350,421 | 8 |
| 9. | Replacing pasture with water tolerant grass at cost | 10,892,598 | 12 | -879,406 | 12 |
| 10. | Progressive conversion to salt marsh | 11,460,710 | 8 | -311,294 | 7 |
| 11. | Progressive conversion to mangroves | 251,988,764 | 1 | 240,216,760 | 1 |
| 12. | Progressive conversion to mangroves plus water tolerant grass | 251,511,343 | 2 | 239,739,339 | 2 |
| 13. | Sale of land to developers | 63,837,880 | 3 | 52,065,876 | 3 |
| 14. | Lease of land for PV power | 17,640,932 | 4 | 5,868,928 | 4 |
Table A4.
Scenario 4 – gross and net benefits of responses. Present value benefits when groundwater today is 700 mm from the surface; 1.5% discount rate.
Table A4.
Scenario 4 – gross and net benefits of responses. Present value benefits when groundwater today is 700 mm from the surface; 1.5% discount rate.
| Gross present value earnings @ 75 years | Ranks gross benefits | NPV @75 years | NPV rank @ 75 years | ||
|---|---|---|---|---|---|
| 1. | Without intervention | 4,756,297 | 7 | ||
| 2. | Wintering off | 1,732,695 | 14 | -3,023,602 | 13 |
| 3. | Council upgrades from none/Class B to Land Class A | 4,550,659 | 9 | -205,638 | 8 |
| 4. | Council upgrades and pumping | 4,013,308 | 12 | -742,989 | 11 |
| 5. | Council upgrades and increasing extents of pumping | 3,763,944 | 13 | -992,353 | 12 |
| 6. | Vegetated, fenced drainage ditches | 8,609,193 | 5 | 3,852,896 | 5 |
| 7. | Water tolerant grass planted today as part of standard pasture renewal | 4,509,017 | 10 | -247,280 | 9 |
| 8. | Water tolerant grass planted in 20 years’ time as part of standard pasture renewal | 4,654,534 | 8 | -101,763 | 7 |
| 9. | Replacing pasture with water tolerant grass at cost | 4,229,567 | 11 | -526,730 | 10 |
| 10. | Progressive conversion to salt marsh | 6,882,212 | 6 | 2,125,916 | 6 |
| 11. | Progressive conversion to mangroves | 247,410,267 | 1 | 242,653,970 | 1 |
| 12. | Progressive conversion to mangroves plus water tolerant grass | 247,163,038 | 2 | 242,406,741 | 2 |
| 13. | Sale of land to developers | 57,874,529 | 3 | 53,118,232 | 3 |
| 14. | Lease of land for PV power | 13,062,435 | 4 | 8,306,138 | 4 |
Figure A1.
Gross benefits with groundwater at 1000mm; discount rate at 5%.
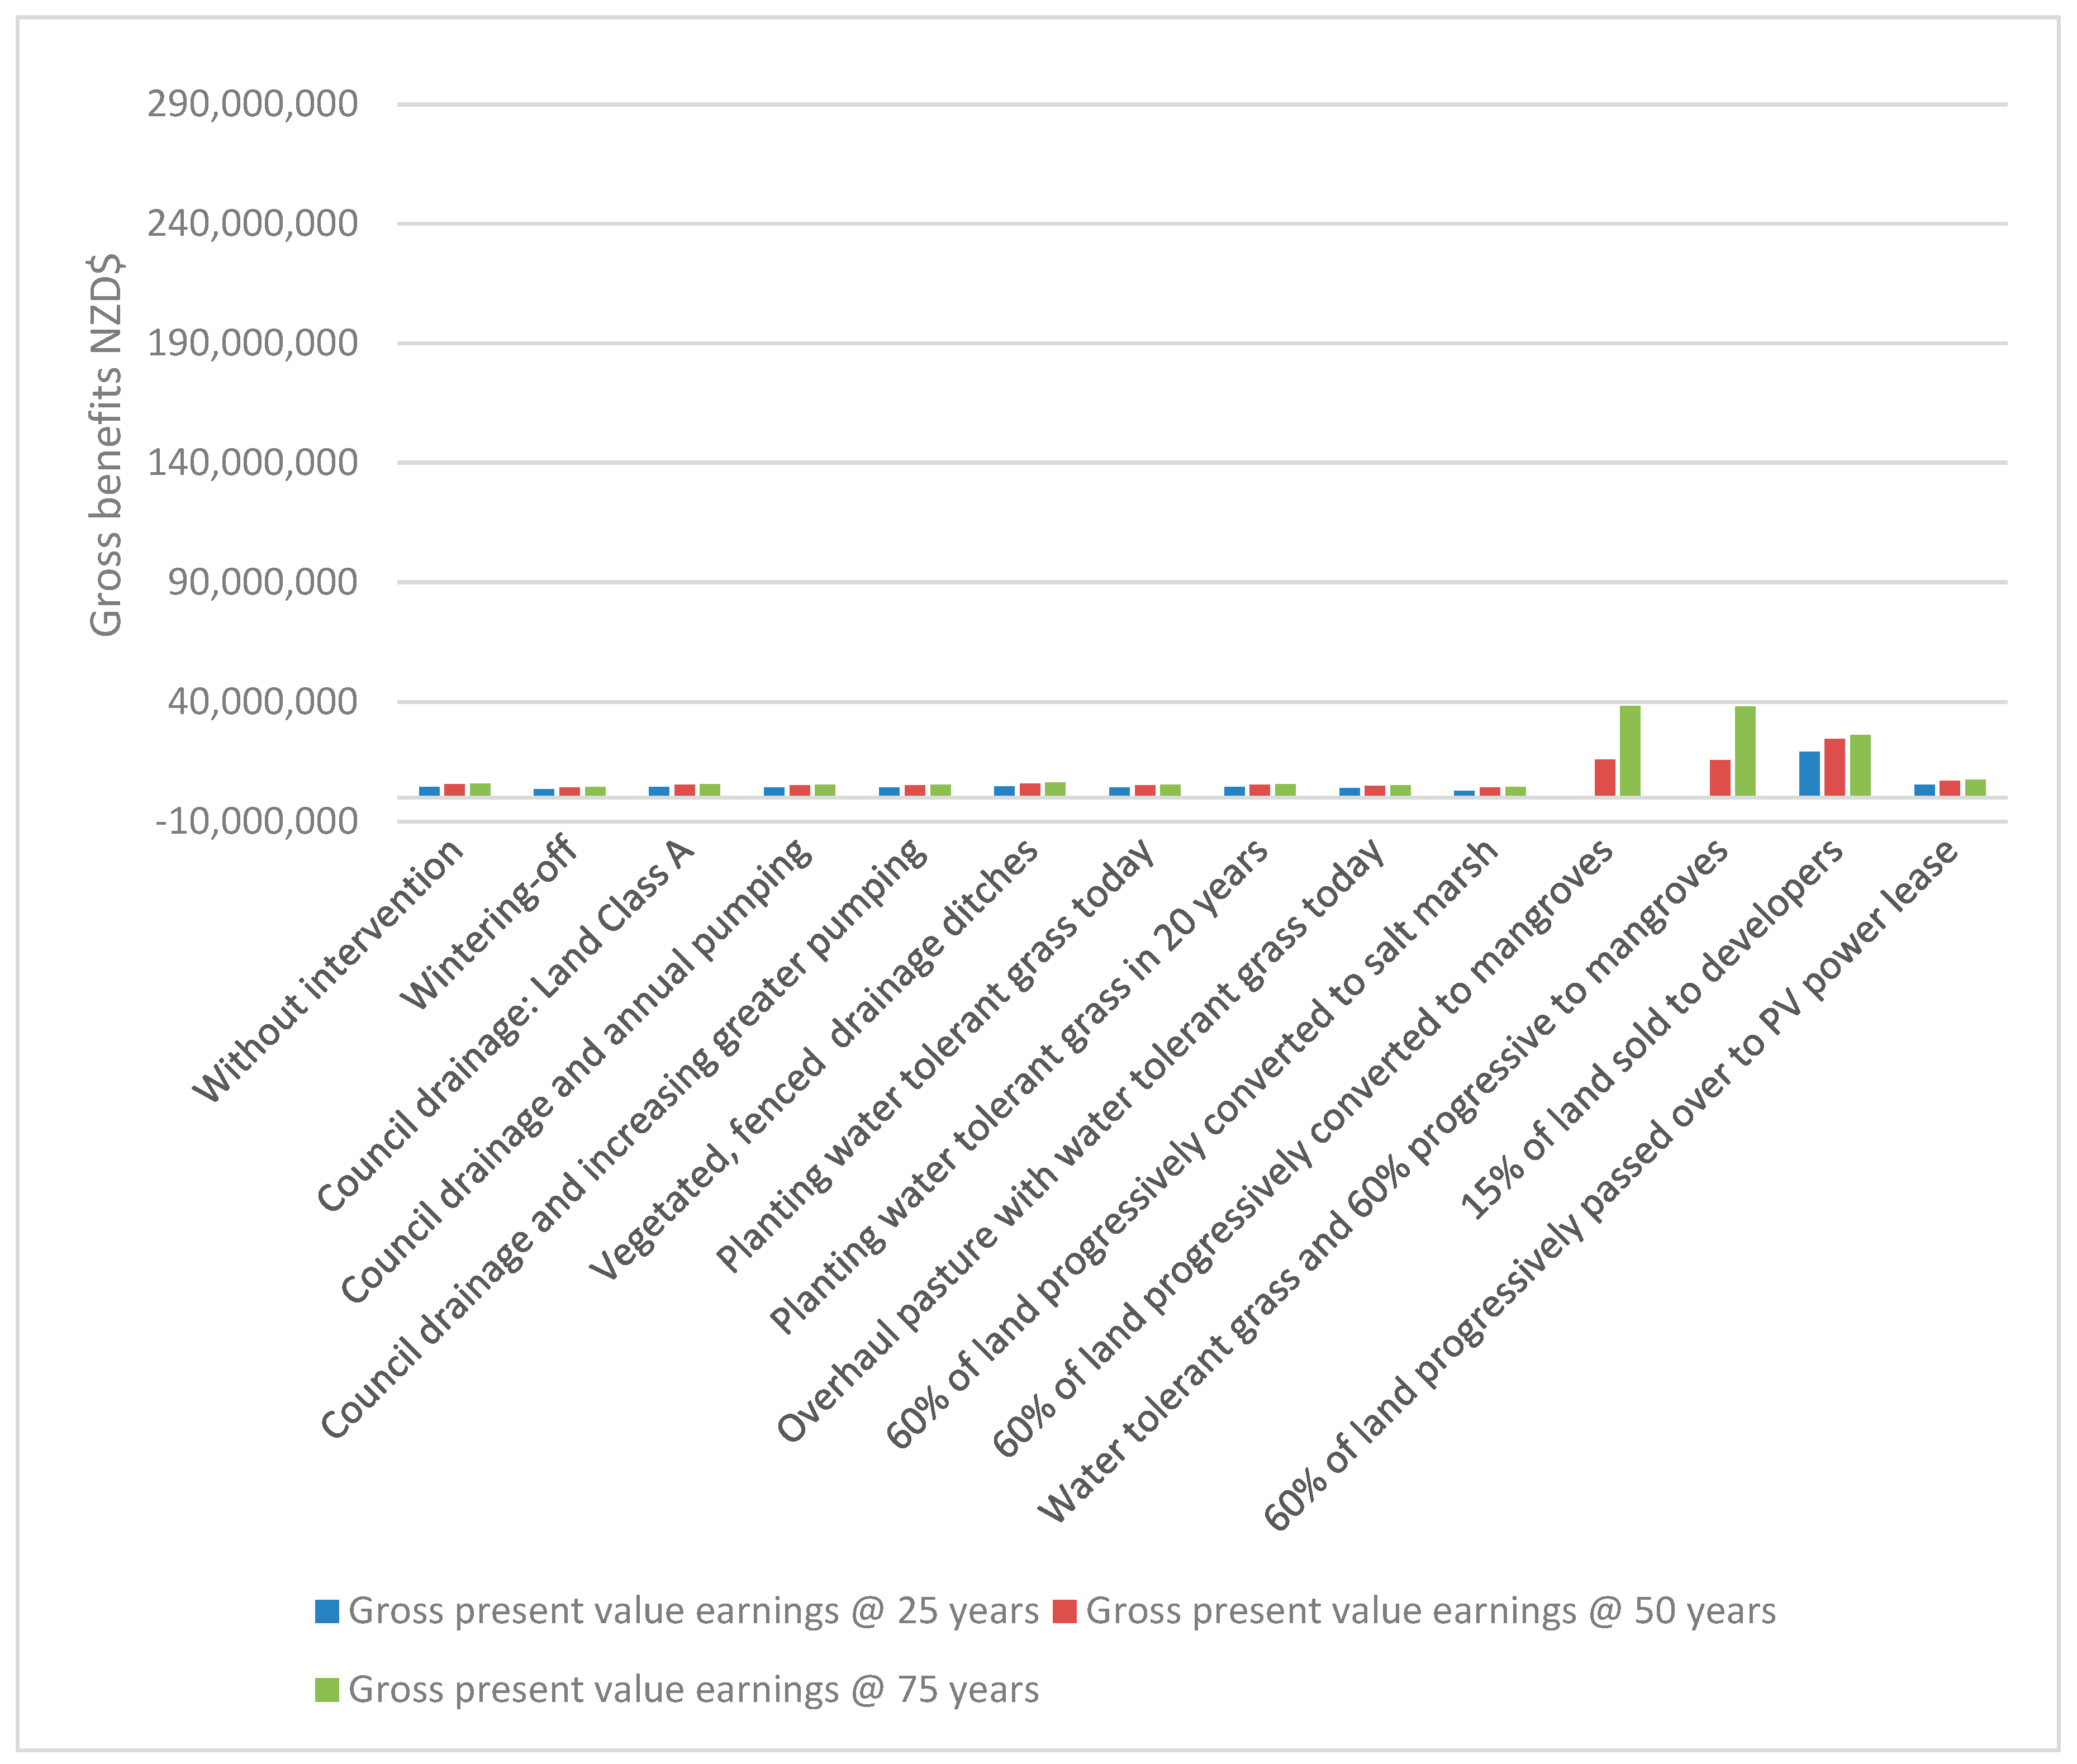
Figure A2.
Gross benefits with groundwater at 1000mm; discount rate at 1.5%.
Appendix B. Examples of Responses to Climate Change and Sea Level Rise
Local councils and planners are often confronted by the complexity of adaptation without adequate access to guiding information or data on local vulnerabilities and potential impacts (Mimura et al. 2014). As land becomes increasingly threatened, farmers in New Zealand’s lowlands will need to find ways to cope with changes in land quality and consider adaptation strategies to manage the accompanying potential losses. Table 1 provides an example of climate change response options.
Table B1.
Examples of responses to climate change and sea level rise.
| Hazard | General impact to farm | Examples of responses |
|---|---|---|
| Rising water tables, seawater intrusion | Increasing waterlogging of soil over time, reducing pasture productivity. Potential soil salinisation. | Drainage ditches, tile drains, pumps, salt-tolerant species, land conversion, raised pasture beds, seasonal cut and carry pasture production systems, controlled water table systems, alternative land use. |
| Greater storm surges | Periodic intense saturation of land, including saltwater, affecting pasture and damaging infrastructure. | Higher stop banks, pumps, coastal barriers, relocation of vulnerable infrastructure, salt-tolerant species, improved early warning systems. |
| Flooding | Periodic inundation from rainfall or swollen rivers, reducing productivity and damaging farm assets. | Higher stop banks, pumps, floodplain zoning, elevated buildings/infrastructure, pasture rotation, flood-compatible land use. |
Appendix C. Dry Matter Production for Perennial Rye Grass and the Distance of Groundwater from the Land Surface Equation
To estimate the effect of rising groundwater on our farm, we draw on Snow et al. (2025) who mathematically express the relationship between dry matter production for perennial rye grass and the distance of groundwater from the land surface as:
Where:
E is annual average grazeable pasture production,
harv is the annual harvestable DM (kg DM /ha /year),
ε is a small (0.1 kg DM /ha /year) correction factor constant to avoid negative values,
Pm is the site-soil annual pasture harvestable (kg DM /ha /year) without a water table restriction,
α is a curvature parameter,
wt0 is the water table depth above which there is no harvestable pasture (mm), and
WT is the mean annual water table depth (mm).
Snow et al. (2025) provide parameter values for a wide range of pastures across New Zealand. For illustration, we apply the values of water logging for recent soils in the Waikato to estimate pasture dry matter production on our farm over time. We assume production ceases when wt0 is reached (that is, when the water table reaches a depth that prevents harvestable pasture). We use proportional declines in dry matter yield arising from waterlogging to infer potential increases in feed costs required to maintain farm production, and the consequent reduction in operational profits that arise.
Appendix D. Scenarios and Responses Explored
Reflecting the information provided we explore 13 responses which comprise either singular actions or combinations of actions. In relation to FAO’s absorptive, adaptive or transformational strategies for agriculture, these are presented in Table 7. We explore the responses under four scenarios:
Scenario 1: Groundwater today is 1000 mm from the surface; discount rate is 5 per cent.
Scenario 2: Groundwater today is 700 mm from the surface; discount rate is 5 per cent.
Scenario 3: Groundwater today is 1000 mm from the surface; discount rate is 1.5 per cent.
Scenario 4: Groundwater today is 700 mm from the surface; discount rate is 1.5 per cent.
Table D1.
Responses explored. What if …?
| Response | Absorptive, adaptive or transformative actions | |
|---|---|---|
| No action | Absorptive | |
| farmers maintain production by wintering-off livestock for 4 months every year? | Absorptive | |
| farmers hold the line by upgrading the Council level of flood control and drainage service from none to Land Class A? | Adaptive | |
| farmers hold the line by upgrading the Council level of flood control and drainage service and paying to pump of 15% more land each 25 years? | Adaptive | |
| farmers could hold the line through Council upgrades level of service alone, pumping of 25% of land each year and increasing pumped area by 15% more every 25 years …? | Adaptive | |
| farmers hold the line through 1 km of vegetated, fenced drainage ditches? | Adaptive | |
| farmers plant water tolerant grass as part of standard pasture renewal today to cope with future rising groundwater? | Adaptive | |
| Farmers overhaul (replant at cost) existing pasture and plant water tolerant grass …? | Adaptive | |
| farmers plant water tolerant grass in 20 years’ time as part of standard pasture renewal? | Adaptive | |
| 15% of highest water table/most flood-prone land is converted to saltmarsh every 25 yrs and farming elsewhere continues unchanged? | Transformative | |
| 15% of highest water table/most flood-prone land is converted to mangrove every 25 yrs and farming elsewhere continues unchanged? | Transformative | |
| 15% of highest water table/most flood-prone land is converted to wetlands every 25 yrs and water tolerant grass is planted as well? | Transformative | |
| 15% of prime land is sold to developers and farming elsewhere continues unchanged? | Transformative | |
| 15% of highest water table/most flood-prone land is leased for PV power at $4k/ha every 25 yrs and farming elsewhere continues unchanged? | Transformative |
Table D2 summarises the expected impact of alternative responses in harm from increasing flood threats and rising groundwater.
Table D2.
Impact of responses on hazards.
| Impact of flood hazard | Impact on groundwater rise hazard (waterlogging | Other impacts | Assumption related to operating profits | |
|---|---|---|---|---|
| Adaptation 1: Wintering off | reduced losses (stock protected) | no change | basic operating profit remains but waterlogged pasture losses remain | |
| Adaptation 2: Council upgrades from none/Class B to Land Class A | no flooding now | no change | basic operating profit remains but waterlogged pasture losses remain | |
| Adaptation 3: Council upgrades and pumping | no flooding now | no change | basic operating profit remains but waterlogged pasture losses remain | |
| Adaptation 4: Council upgrades and progressively higher pumping | no flooding now | no change | basic operating profit remains but waterlogged pasture losses remain | |
| Adaptation 5: Vegetated, fenced drainage ditches | no change | no waterlogging | basic operating profits remains at same level as Year 1 | |
| Adaptation 6: Water tolerant grass today | no change | reduced waterlogging | productivity reduced by less preferred pasture but mitigated by lower waterlogging losses | |
| Adaptation 7: Water tolerant grass in 20 years' time | no change | reduced waterlogging | productivity reduced by less preferred pasture but mitigated by lower waterlogging losses | |
| Adaptation 8: Water tolerant grass replanted at cost | no change | reduced waterlogging | productivity reduced by less preferred pasture but mitigated by lower waterlogging losses | |
| Adaptation 9: Convert some land to salt marsh over time | no change | no change | environmental benefits | basic operating profit/ha remains the same as without action |
| Adaptation 10: Convert some land to mangroves over time | no change | no change | environmental benefits | basic operating profit/ha remains the same as without action |
| Adaptation 11: Convert some land to mangroves over time + water tolerant grass | no change | no waterlogging | environmental benefits | productivity in remaining farm reduced by less preferred pasture but mitigated by lower waterlogging losses |
| Adaptation 12: Sell some land to developers | no change | no change | basic operating profit/ha for remaining farm remains the same as without action | |
| Adaptation 13: Lease some land for PV power | no change | no change | basic operating profit/ha for remaining farm remains the same as without action |
Appendix E. Net Present Value Equation
To compare the relative value of different responses, we calculate the net present value (NPV)of options over time. The NPV compares earnings without action to earnings with action and is calculated as:
Where:
Bt is the gross economic benefit in year t,
Ct is the sum of economic costs (including capital costs, operating maintenance costs, and negative terminal values) in year t,
n is the project life, and
r is the economic discount rate. (See ADB 2017 for information).
Appendix F. The Land Class Categories
The land class categories we use are:
Land drainage Class A – Gravity drainage services for land within the drainage catchment that is located in a floodplain.
Land pumping drainage Class A – Pumped drainage services for land within the drainage catchment that is located in a floodplain.
Farmland drainage Class B – drainage services where land is within the drainage catchment but not in a flood plain (see for example, Auckland Council, Undated).
We use these drainage classes as proxies for various levels of drainage needed to mitigate/ prevent flooding. Theoretically, all land within catchments can be exposed to pluvial flooding. However, land on floodplains can also be exposed to fluvial flooding. We consequently assume that Class A drainage offers a higher level of drainage service than under Class B. We also assume that payment for drainage involving pump services implies a higher level of service than where pumping does not occur. We draw on published rates from Western Bay of Plenty District Council as examples of the magnitude of costs faced by farmers (Table 3) although these will differ from region to region.
Table F1.
Examples of levels of service for council drainage and associated rates charges. Source: Western Bay of Plenty District Council (2025).
Table F1.
Examples of levels of service for council drainage and associated rates charges. Source: Western Bay of Plenty District Council (2025).
| Level of service | Annual drainage cost | Annual pumping cost | |
|---|---|---|---|
| Higher ↕ Lower |
Land Class A drainage and Land Class A pumping | NZD $68.17/ha | NZD $289.43/ha pumped* |
| Land Class A drainage | NZD $68.17/ha | ||
| Land Class B drainage | NZD $42.26/ha | ||
| Normal | [not targeted] | [not targeted] | |
* Not all of a farm may require pumping. ** The Western Bay of Plenty neighbours the study location.
Appendix G. Assumed Cost to Install Fencing of Drainage Ditches
Table G1.
Assumed cost to install fencing of drainage ditches. Source: Amended from Waikato River Authority. (2022).
Table G1.
Assumed cost to install fencing of drainage ditches. Source: Amended from Waikato River Authority. (2022).
| Item | Cost NZD$ | Total cost per 1000 metres of watercourse | Comment |
|---|---|---|---|
| 3-wire electric fence | 10/m | 10000 | |
| Digger | 180.95/hour | 2533.3 |
$166.75 per hour, adjusted for inflation Assumes 1 day (7 hours) per side of the river - a total of 2 days |
| Transportation | 399.34 | 399.34 | $368, adjusted for inflation |
| Labour | 74.88/hour for contractor; 131.03/hour for driver | 2,882.74 |
$69 per hour for contractor, plus $120.75 per hour for driver, adjusted for inflation Assumes 1 day (7 hours) per side of the river - a total of 2 days |
| TOTAL (2022 values) | 5,815.38 | ||
| TOTAL (2024 values) | 6,221.44 | adjusted for inflation. |
Appendix H. Net Present Values of Responses
Table H1.
NPV of responses NZD$ (discounted).
| GW=1000 DR=5% |
GW=700 DR=5% |
GW=1000 DR=1.5% |
GW=700 DR=1.5% |
||
|---|---|---|---|---|---|
| Wintering off | -1,355,422 | -1,355,422 | -3,023,602 | -3,023,602 | |
| Council upgrades from none/Class B to Land Class A | -109,387 | -109,387 | -205,638 | -205,638 | |
| Council upgrades and pumping | -349,510 | -349,510 | -742,989 | -742,989 | |
| Council upgrades and increasing extents of pumping | -349,510 | -349,510 | -742,989 | -992,353 | |
| Vegetated, fenced drainage ditches …? | 514,729 | 879,976 | 2,205,159 | 3,852,896 | |
| Water tolerant grass planted today as part of standard pasture renewal | -290,223 | -151,234 | -599,956 | -247,280 | |
| Water tolerant grass planted in 20 years’ time as part of standard pasture renewal | -99,357 | -39,008 | -350,421 | -101,763 | |
| Replacing pasture with water tolerant grass at cost | -569,673 | -430,686 | -879,406 | -526,730 | |
| Progressive conversion to salt marsh | -1,252,775 | -577,740 | -311,294 | 2,125,916 | |
| Progressive conversion to mangroves | 32,599,072 | 33,274,108 | 240,216,760 | 242,653,970 | |
| Progressive conversion to mangroves plus water tolerant grass | 32,334,419 | 33,114,503 | 239,739,339 | 242,406,741 | |
| Sale of land to developers | 20,361,796 | 20,776,396 | 45,719,495 | 46,771,851 | |
| Lease of land for PV power | 1,776,389 | 2,451,425 | 5,868,928 | 8,306,138 |
Table H2.
Rank of response by NPV.
| GW=1000 DR=5 |
GW=700 DR=5 |
GW=1000 DR=1.5 |
GW=700 DR=1/5 |
||
|---|---|---|---|---|---|
| Wintering off | 13 | 13 | 13 | 13 | |
| Council upgrades from none/Class B to Land Class A | 7 | 7 | 6 | 8 | |
| Council upgrades and pumping | 9 | 9 | 10 | 11 | |
| Council upgrades and increasing extents of pumping | 9 | 9 | 10 | 12 | |
| Vegetated, fenced drainage ditches …? | 5 | 5 | 5 | 5 | |
| Water tolerant grass planted today as part of standard pasture renewal | 8 | 8 | 9 | 9 | |
| Water tolerant grass planted in 20 years’ time as part of standard pasture renewal | 6 | 6 | 8 | 7 | |
| Replacing pasture with water tolerant grass at cost | 11 | 11 | 12 | 10 | |
| Progressive conversion to salt marsh | 12 | 12 | 7 | 6 | |
| Progressive conversion to mangroves | 1 | 1 | 1 | 1 | |
| Progressive conversion to mangroves plus water tolerant grass | 2 | 2 | 2 | 2 | |
| Sale of land to developers | 3 | 3 | 3 | 3 | |
| Lease of land for PV power | 4 | 4 | 4 | 4 |
Appendix I. Water-Tolerant Grasses Species - Tall Fescue (Festuca Arundinacea)
The use of water-tolerant grasses such as tall fescue can impact profitability. In their experiments on dairy farmlets in New Zealand, Lee et al. (2017) found that using tall fescue (Festuca arundinacea) resulted in lower animal production and operating profit compared to perennial ryegrass (Table 5). They considered this to be likely due to the reduced yield and nutritional value of tall fescue during spring and an associated decline in daily milk solids production. The estimations from Lee et al. (2017) indicate a potential reduction in operating profit in the order of 5-10 per cent for monocultures of tall fescue compared to perennial rye grass monoculture. We assume a reduction of 5 per cent of operating profitability for the purpose of illustration.
Table I1.
Differences in operational profitability (NZD$) for perennial ryegrass and tall fescue grass. Source: Lee et al. (2017).
Table I1.
Differences in operational profitability (NZD$) for perennial ryegrass and tall fescue grass. Source: Lee et al. (2017).
| Operating profit NZD$ | Perennial ryegrass monoculture | Fall fescue monoculture | Reduction in profit with tall fescue % |
|---|---|---|---|
| At milk price $4.10/kg MS | 707 | 643 | - 9.95 |
| At milk price $6.40/kg MS | 3,781 | 3,611 | - 4.71 |
| At milk price $8.50/kg MS | 6,588 | 6,321 | - 4.22 |
| 1 | Based on a 1988 value of USD$ 15,230,769 p.a. converted to 1988 New Zealand dollars (USD$:NZD in 1988 was approximately 1:1.4333 (https://www.poundsterlinglive.com/bank-of-england-spot/historical-spot-exchange-rates/usd/USD-to-NZD-1988. Accessed 8 September 2025) and then converted to present values using the Reserve Bank of New Zealand inflation calculator (https://www.rbnz.govt.nz/monetary-policy/about-monetary-policy/inflation-calculator). |
References
- Asian Development Bank (2017) Guidelines for the economic analysis of projects. Mandaluyong City, Philippines. Available online at: https://www.adb.org/sites/default/files/institutional-document/32256/economic-analysis-projects.pdf. Accessed 21 August 2025.
- Amanambu, A., Obarein, A., Mossa, J., Li, L., Ayeni, S., Balogun, O., Oyebamiji, A. and Ochege, F. (2020) Groundwater system and climate change: Present status and future considerations. Journal of Hydrology, Volume 589, October 2020, 125163. [CrossRef]
- Anon (2023) The whole story. Available online at: https://www.thewholestory.co.nz/wp-content/uploads/2023/03/Solar-farming-final.pdf. Accessed 22 July 2025.
- ANZ Bank (2025) Agribusiness rates, fees and agreements. Available online at: https://www.anz.co.nz/rates-fees-agreements/agri/. Accessed 29 July 2025.
- ASB Bank (2025) Business and rural loan interest rates and fees. Available online at: https://www.asb.co.nz/business-loans/interest-rates-fees.html. Accessed 29 July 2025.
- Auckland Council (Undated) Map of Te Arai Drainage District land classification – Rodney drainage districts land classification. Available online at: https://www.aucklandcouncil.govt.nz/property-rates-valuations/Documents/map-rodney-drainage-districts-land-classification.pdf. Accessed 14 February 2025.
- Bakker, J.P. (2012) Restoration of salt marshes. Restoration ecology: the new frontier, 248-262.
- Bandh, S. A., Shafi, S., Peerzada, M., Rehman, T., Bashir, S., Wani, S. A., and Dar, R. (2021) Multidimensional analysis of global climate change: a review. Environmental Science and Pollution Research, 28(20), 24872-24888. [CrossRef]
- Bayraktarov E., Saunders M.I., Abdullah, S., Mills, M., Beher, J., Possingham, H.P., Mumby, P.J., Lovelock, C.E. (2016) The cost and feasibility of marine coastal restoration. Ecological Applications 26:1055–1074. [CrossRef]
- Befus, K., Barnard, P. L., Hoover, D. J., Finzi Hart, J., and Voss, C. I. (2020) Increasing threat of coastal groundwater hazards from sea-level rise in California. Nature Climate Change, 10(10), 946-952. [CrossRef]
- Bilal, A., and Känzig, D. R. (2024) The Macroeconomic Impact of Climate Change: Global vs. Local Temperature.
- Bosserelle, A. L., and Hughes, M. W. (2024) Practitioner perspectives on sea-level rise impacts on shallow groundwater: Implications for infrastructure asset management and climate adaptation. Urban Climate, 58, 102195. [CrossRef]
- Bosserelle, A. L., Morgan, L. K., and Hughes, M. W. (2022) Groundwater rise and associated flooding in coastal settlements due to sea-level rise: a review of processes and methods. Earth's Future, 10(7), e2021EF002580. [CrossRef]
- Brasell, R. (1996) New Zealand's Net Carbon Dioxide Emission Stabilisation Target. Agenda. Vol. 3, No. 3 (1996), pp. 329-340 (12 pages). ANU. Available online at: https://www.jstor.org/stable/43199385. Accessed 27 March 2025. [CrossRef]
- Braun, R. and Patton. A. (2024) Growth responses to waterlogging stress among cool-season grass species. Grass and Forage Science. Short Communication. Accessed 3 September 2025. [CrossRef]
- Brent, A. and Iorns, C. (2024) Solar farms can eat up farmland—but ‘agrivoltaics’ could mean the best of both worlds. Using agricultural land for both renewable electricity generation and farming can bring economic benefits for farmers. 10 June. Available online at: https://www.wgtn.ac.nz/news/2024/06/solar-farms-can-eat-up-farmlandbut-agrivoltaics-could-mean-the-best-of-both-worlds. Accessed 22 July 2025.
- Brent, A., Vaughan, A., Fitzgerald, M., Wright, E. and Kueppers, J. (2023) Agrivoltaics: Integrating Solar Energy Generation with Livestock Farming in the Canterbury Region of Aotearoa New Zealand. 2023 International Conference on Sustainable Technology and Engineering (i-COSTE) | 979-8-3503-2971-1/23/$31.00 ©2023 IEEE |. [CrossRef]
- Bulmer, R. H., Stewart-Sinclair, P. J., Lam-Gordillo, O., Mangan, S., Schwendenmann, L., and Lundquist, C. J. (2024) Blue carbon habitats in Aotearoa New Zealand—opportunities for conservation, restoration, and carbon sequestration. Restoration ecology, 32(7), e14225. [CrossRef]
- Caretta, M.A., A. Mukherji, M. Arfanuzzaman, R.A. Betts, A. Gelfan, Y. Hirabayashi, T.K. Lissner, J. Liu, E. Lopez Gunn, R. Morgan, S. Mwanga, and S. Supratid (2022) Water. In: Climate Change 2022: Impacts, Adaptation and Vulnerability. Contribution of Working Group II to the Sixth Assessment Report of the Intergovernmental Panel on Climate Change [H.-O. Pörtner, D.C. Roberts, M. Tignor, E.S. Poloczanska, K. Mintenbeck, A. Alegría, M. Craig, S. Langsdorf, S. Löschke, V. Möller, A. Okem, B. Rama (eds.)]. Cambridge University Press, Cambridge, UK and New York, NY, USA, pp. 551–712. [CrossRef]
- Carleton, T. A., and Hsiang, S. M. (2016). Social and economic impacts of climate. Science, 353(6304), aad9837.
- Cobourn K (2023) Climate change adaptation policies to foster resilience in agriculture: Analysis and stocktake based on UNFCCC reporting documents. OECD Food, Agriculture and Fisheries Papers.
- Cox, S.C., Ettema, M.H.J., Chambers, L.A., Easterbrook-Clarke, L.H. and Stevenson, N.I. (2023) Dunedin groundwater monitoring, spatial observations and forecast conditions under sea-level rise. Lower Hutt, N.Z.: GNS Science. GNS Science report 2023/43. 111 p.;. [CrossRef]
- Craig, H., Wild, A., and Paulik, R. (2023) Dairy farming exposure and impacts from coastal flooding and sea level rise in Aotearoa-New Zealand. International Journal of Disaster Risk Reduction, 98, 104079. [CrossRef]
- Dairy Australia (2025) Pasture Options. Available online at: https://www.dairyaustralia.com.au/feeding-and-farm-systems/pastures/pasture-options. Accessed 1 September 2025.
- DairyNZ (2024 a) Tall fescue. Available online at: https://www.dairynz.co.nz/feed/pasture-species/tall-fescue/. Accessed 3 April 2025.
- DairyNZ (2024 b) Ryegrass. Available online at: https://www.dairynz.co.nz/feed/pasture-species/ryegrass/#:~:text=Production%20of%20perennial%20ryegrass%2Dbased,ryegrass%20pastures%20can%20last%20indefinitely. Accessed 17 December 2024.
- DairyNZ (2024 c) New Zealand Dairy Statistics. Available online. Accessed 8 September 2025.
- DairyNZ (2015) Waterway Technote: Drains. Available online at: https://www.dairynz.co.nz/media/ztbb3v40/drains-waterway-technote.pdf. Accessed 10 March 2025.
- DairyNZ (2025) Farm economics. Available online at: https://connect.dairynz.co.nz/EconTracker/. Accessed 22 July 2025.
- Dao, P., Heuzard, A., Le, T., Zhao, J., Yin, R., Shang, C. and Fan, C. (2024) The impacts of climate change on groundwater quality: A review. Science of The Total Environment. Volume 912, 20 February 2024, 169241. [CrossRef]
- Department of Conservation, (2007) The economic values of Whangamarino Wetland. May. Available online at: https://www.doc.govt.nz/documents/conservation/threats-and-impacts/benefits-of-conservation/economic-values-whangamarino-wetland.pdf. Accessed 2 July 2025.
- Department of Conservation (Undated) Wetlands protection guide. Available online at: https://www.doc.govt.nz/nature/habitats/wetlands/wetlands-protection/. Accessed 21 August 2025.
- Easton, H., and Fitzgerald, R. (1994) Tall fescue in Australia and New Zealand, New Zealand Journal of Agricultural Research, 37:3, 405-417. [CrossRef]
- EQC (2023) Natural Hazard Risk Tolerance Literature Review. A companion document to Toka Tū Ake EQC’s Risk Tolerance Methodology July.
- ESCAP (2019) The Disaster RiskScape across Asia-Pacific. Pathways for Resilience, Inclusion and Development. Asia Pacific Report 2019. Available online at: https://www.unescap.org/sites/default/d8files/APDR%202019%20Annexes_0.pdf. Accessed 27 March 2025.
- Food and Agriculture Organization (2018) The future of food and agriculture – Alternative pathways to 2050. Food and Agriculture Organization of the United Nations. Rome. Available online at: https://openknowledge.fao.org/server/api/core/bitstreams/e51e0cf0-4ece-428c-8227-ff6c51b06b16/content. Accessed 22 April 2025.
- Federal Emergency Management Agency (Undated) Expected annual loss. Available online at: https://hazards.fema.gov/nri/expected-annual-loss. Accessed 27 March 2025.
- Forest and Bird (2023) Bring back wetlands.30 May. Available online at: https://www.forestandbird.org.nz/resources/bring-back-wetlands. Accessed 21 August 2025.
- Foundation for Sustainable Development (2021) Ecosystem Services Valuation Database. Available online at: https://www.esvd.net/. Accessed 3 April 2025.
- Frisk, C. A., Xistris-Songpanya, G., Osborne, M., Biswas, Y., Melzer, R., and Yearsley, J. M. (2022). Phenotypic variation from waterlogging in multiple perennial ryegrass varieties under climate change conditions. Frontiers in Plant Science, 13, 954478. [CrossRef]
- Gaffney, P. P., Tang, Q., Wang, J., Zhang, C., Xu, X., Zhang, R., ... & Ratcliffe, J. L. (2026). Ecohydrological resilience to short-term warming in a high-altitude peatland under different water table levels. Environmental Impact Assessment Review, 116, 108065. [CrossRef]
- Garrett, L. (2023) Potential for paludiculture in New Zealand. Considerations for the Lower Waikato. Report prepared for NIWA: Future Coasts Aotearoa May.
- Gibson, P, Lewis, H., Campbell, I., Rampal, N., Fauchereau, N., and Harrington, L. (2025) Downscaled Climate Projections of Tropical and Ex-Tropical Cyclones Over the Southwest Pacific. Journal of Geophysical Research: Atmospheres. No. 130. e2025JD043833. [CrossRef]
- Gornitz, V. (1991). Global coastal hazards from future sea level rise. Palaeogeography, Palaeoclimatology, Palaeoecology, 89(4), 379-398. [CrossRef]
- Habel, S., Fletcher, C. H., Barbee, M. M., & Fornace, K. L. (2024) Hidden threat: the influence of sea-level rise on coastal groundwater and the convergence of impacts on municipal infrastructure. Annual Review of Marine Science, 16(1), 81-103. [CrossRef]
- Hack, K. (2008) Chapter II.6 - Hot isostatic pressing of Al–Ni alloys. In The SGTE Casebook. Thermodynamics At Work. Second Edition. Woodhead Publishing.
- Hamlington B., Bellas-Manley A., Willis J., Fournier, S., Vinogradova, N., Nerem, R., Piecuch, C., Thompson, P. and Kopp, R. (2024) The rate of global sea level rise doubled during the past three decades. Commun Earth Environ 5:601. [CrossRef]
- Hennessy, K., Fitzharris, B., Bates, B. C., Harvey, N., Howden, S., Hughes, L., Salinger, J., and Warrick, R. A. (2007) Australia and New Zealand. In Impacts, Adaptation and Vulnerability: Working Group II Contribution to the Fourth Assessment Report of the Intergovernmental Panel on Climate Change (pp. 507-540). Cambridge University Press.
- Horstman, E.M., Lundquist, C.J., Bryan, K.R., Bulmer, R.H., Mullarney, J.C., Stokes, D.J. (2018) The Dynamics of Expanding Mangroves in New Zealand. In: Makowski, C., Finkl, C. (eds) Threats to Mangrove Forests. Coastal Research Library, vol 25. Springer, Cham. International Carbon Action Partnership (2025) New Zealand Emissions Trading Scheme. Available online at: https://icapcarbonaction.com/system/files/ets_pdfs/icap-etsmap-factsheet-48.pdf. Accessed 27 March 2025. [CrossRef]
- Intergovernmental Panel on Climate Change (2022) Climate Change 2022: Impacts, Adaptation and Vulnerability. Contribution of Working Group II to the Sixth Assessment Report of the Intergovernmental Panel on Climate Change [H.-O. Pörtner, D.C. Roberts, M. Tignor, E.S. Poloczanska, K. Mintenbeck, A. Alegría, M. Craig, S. Langsdorf, S. Löschke, V. Möller, A. Okem, B. Rama (eds.)]. Cambridge University Press. Cambridge University Press, Cambridge, UK and New York, NY, USA, 3056 pp.. [CrossRef]
- Johnson, B. A. (2012) Ecological restoration of the Wairio Wetland, Lake Wairarapa: Water table relationships and cost-benefit analysis of restoration strategies. MSc thesis Te Herenga Waka-Victoria University of Wellington.
- Karri, R. R., Ravindran, G., Pingili, V., Mubarak, N. M., Ruslan, K. N., & Tan, Y. H. (2026). Integrating the Food-Energy-Water Nexus: Strategies for climate change mitigation with SDG alignment. Environmental Impact Assessment Review, 116, 108070. [CrossRef]
- Kerrisk, J. and Thomson, N. (1990) Effect of intensity and frequency of defoliation on growth of ryegrass, tall fescue and phalaris. Proceedings of the New Zealand Grassland Association 51: 135-138. [CrossRef]
- Ketabchi, H., Mahmoodzadeh, D., Ataie-Ashtiani, B., and Simmons, C. T. (2016) Sea-level rise impacts on seawater intrusion in coastal aquifers: Review and integration. Journal of Hydrology, 535, 235-255. [CrossRef]
- Kirkland, W.T. (1988) Preserving the Whangamarino wetland: an application of the contingent valuation method. Massey University, NZ.
- Kumar, C. (2012) Climate Change and Its Impact on Groundwater Resources. RESEARCH INVENTY: International Journal of Engineering and Science. ISSN: 2278-4721, Vol. 1, Issue 5 (October 2012), PP 43-60. October.
- Lee, J., Clark, D., Clark, C., Waugh, C., Roach, C., Minnée, E., Glassey, C., Woodward, S., Woodfield, D. and Chapman, D. (2017) A comparison of perennial ryegrass- and tall fescue-based swards with or without a cropping component for dairy production: Animal production, herbage characteristics and financial performance from a 3-year farmlet trial. Grass Forage Sci. pp. 1–15. [CrossRef]
- Liu, M., Vecchi, G., Smith, J. and Knutson, T. (2019) Causes of large projected increases in hurricane precipitation rates with global warming. Climate and Atmospheric Science. Vol. 2. Article number: 38. Available online at: https://www.nature.com/articles/s41612-019-0095-3#:~:text=The%20Clausius%2DClapeyron%20relation%20indicates,degree%20Celsius%20increase%20in%20temperature. ACCESSED 27 March 2025. [CrossRef]
- Lowe, J., Howard, T., Pardaens, A., Tinker, J., Holt, J., Wakelin, S., Milne, G., Leake, J., Wolf, J., Horsburgh, K., Reeder, T., Jenkins, G., Ridley, J., Dye, S. and Bradley, S. (2009) UK Climate Projections science report: Marine and coastal projections.
- MacKenzie, D., Brent, A. Hinkley, J. and Burmester, D. (2024) AgriPV Systems: Potential Opportunities for Aotearoa–New Zealand. A GIS Suitability Analysis. Paper presented to the AgriVoltaics World Conference 2022, Piacenza, Italy. [CrossRef]
- Malerba, M.E., Friess, D.A., Peacock, M., Grinham, A., Taillardat, P., Rosentreter, J.A., Webb, J., Iram, N., Al-Haj, A.N., Macreadie, P.I. (2022) Methane and nitrous oxide emissions complicate the climate benefits of teal and blue carbon wetlands. One Earth 5, 1336-1341. [CrossRef]
- Maliva R (2021) Sea Level Rise and Groundwater. In: Climate Change and Groundwater: Planning and Adaptations for a Changing and Uncertain Future. Springer International Publishing, Cham, pp 113–153.
- Manda, A. K., and Klein, W. A. (2019) Adaptation strategies to address rising water tables in coastal environments under future climate and sea-level rise scenarios. In Coastal zone management (pp. 403-409). Elsevier.
- Martinkova, M. and Kysely, J. (2020) Overview of Observed Clausius-Clapeyron Scaling of Extreme Precipitation in Midlatitudes. Atmosphere. Vol. 11. No. 8. 86. [CrossRef]
- Matthews, Y., Holland, P., Matheson, F., Craggs, R. and Tanner, C. (2024) Evaluating the Cost-Effectiveness of Green Infrastructure for Mitigating Diffuse Agricultural Contaminant Losses. Land. Vol. 13. No. 6. 748; [CrossRef]
- McCarthy, D. (2023) Salt marsh a carbon sink opportunity. 16 March. RNZ. Available one at: https://www.rnz.co.nz/news/ldr/486092/salt-marsh-a-carbon-sink-opportunity. Accessed 21 August 2025.
- Miller, A. (2020) Economics of Utility-Scale Solar in Aotearoa New Zealand: Forecasting Transmission and Distribution Network Connected 1 MW to 200 MW Utility-Scale Photovoltaic Solar to 2060. Prepared for the Ministry of Business, Innovation and Employment. May.
- Milne, G. and Fraser, T. (1990) Establishment of 1600 hectares in dryland species around Oamaru/ Timaru. Proceedings of the New Zealand Grassland Association 52: 133-137. [CrossRef]
- Mimura, N., Pulwarty, R., Duc, D., Elshinnawy, I., Redsteer, M., Huang, H., Nkem, J. and Sanchez Rodriguez, R. (2014) Adaptation planning and implementation. In: Climate Change 2014: Impacts, Adaptation, and Vulnerability. Part A: Global and Sectoral Aspects. Contribution of Working Group II to the Fifth Assessment Report of the Intergovernmental Panel on Climate Change [Field, C.B., V.R. Barros, D.J. Dokken, K.J. Mach, M.D. Mastrandrea, T.E. Bilir, M. Chatterjee, K.L. Ebi, Y.O. Estrada, R.C. Genova, B. Girma, E.S. Kissel, A.N. Levy, S. MacCracken, P.R. Mastrandrea and L.L. White (eds.)]. Cambridge University Press, Cambridge, United Kingdom and New York, NY, USA, pp. 869-898.
- Ministry for Primary Industries (2019) Climate Issues Facing Farmers Sustainable Land Management and Climate Change Research Programme. Prepared for the Ministry for Primary Industries. ISBN No: 978-1-98-859440-8 (online) April.
- Ministry for the Environment (2020 b) National Policy Statement for Freshwater Management. New Zealand.
- Ministry for the Environment (2020 a) Resource Management (National Environmental Standards for Freshwater) Regulations 2020. New Zealand.
- Ministry for the Environment (2010) Part One: Climate change impacts on flooding. Available online at: https://environment.govt.nz/publications/preparing-for-future-flooding-a-guide-for-local-government-in-new-zealand/part-one-climate-change-impacts-on-flooding/. Accessed 13 May 2024.
- Ministry for the Environment (2021) Managing our wetlands A discussion document on proposed changes to the wetland regulations. New Zealand.
- Morgan, L. (2024) Sea-level rise impacts on groundwater: exploring some misconceptions with simple analytic solutions. Hydrogeology Journal (2024) 32:1287–1294 . [CrossRef]
- Morris, J., Beedell, J., and Hess, T. (2016) Mobilising flood risk management services from rural land: principles and practice. Journal of Flood Risk Management, 9(1), 50-68. [CrossRef]
- Mui NT, Zhou M, Parsons D and Smith, RW (2021) Aerenchyma formation in adventitious roots of tall fescue and cocksfoot under waterlogged condition. Agronomy 11, 2487. [CrossRef]
- Naish, T., Lawrence, J., Levy, R., Bell, R., van Uitregt, V. B., Hayward, B., Priestley, R., Renwick, J., and Boston, J. (2024 a) A Sea Change is Needed For Adapting to Sea-Level Rise in Aotearoa New Zealand. Policy Quarterly, 20(4), 83-93. [CrossRef]
- Naish, T., Levy, R., Hamling, J., Hreinsdottir, S., Kumar, P., Garner, G., Kopp, R., Golledge, N., Bell, R., Paulik, R., Lawrence, J., Denys, P., Gillies, T., Bengtson, S., Howell, A., Clark, K., King, D., Litchfield, N. and Newnham, R. (2024 b) The Significance of Interseismic Vertical Land Movement at Convergent Plate Boundaries in Probabilistic Sea-Level Projections for AR6 Scenarios: The New Zealand Case. Earth’s Future 12:e2023EF004165. [CrossRef]
- New Zealand Diary Exporter (2023) Solar leasing: Making money while the sun shines. July/August. Available online at: https://dairyexporter.co.nz/solar-leasing-making-money-while-the-sun-shines/#:~:text=Under%20a%20lease%20agreement%20the,to%20take%20the%20extra%20load. Accessed 22 July 2025.
- New Zealand Herald (2019) Elderly woman dies in flood waters on West Coast. 27 March. Available online at: https://www.nzherald.co.nz/nz/elderly-woman-dies-in-flood-waters-on-west-coast/3DM2IEDN7EYE6SRRGOHKCHXJUA/. Accessed 17 February 2025.
- New Zealand Herald (2023 b) Auckland flood victims: The four people killed in extreme and unprecedented weather event. 31 Jan. Available online at: https://www.nzherald.co.nz/nz/faces-of-the-flood-four-killed-across-auckland-and-waikato-in-extreme-and-unprecedented-weather-event/Z7VR72Z3YJAILCOAVOG4B72DXQ/. Accessed 17 February 2025.
- New Zealand Landcare Trust (2024) Fonterra announces $250,000 in grants for wetland restoration. Available online at: Fonterra announces $250,000 in grants for wetland restoration - NZ Landcare Trust https://landcare.org.nz/fonterra-announces-250000-in-grants-for-wetland-restoration/. Accessed 21 August 2025.
- Nguyen, T. M. (2022) Morphological responses of cocksfoot (Dactylis glomerata L.) and tall fescue (Lolium arundinaceum Schreb.) to waterlogging stress. University Of Tasmania. Thesis.
- Nicholls, R. J., and Cazenave, A. (2010) Sea-level rise and its impact on coastal zones. Science, 328(5985), 1517-1520. [CrossRef]
- Nicholls, R. J., Hoozemans, F. M., and Marchand, M. (1999) Increasing flood risk and wetland losses due to global sea-level rise: regional and global analyses. Global Environmental Change, 9, S69-S87. [CrossRef]
- Nicholls, R., Wong, P., Burkett, V., Codignotto, J., Hay, J., McLean, R., Ragoonaden, S. and Woodroffe, C. (2007) Coastal systems and low-lying areas. Climate Change 2007: Impacts, Adaptation and Vulnerability. Contribution of Working Group II to the Fourth Assessment Report of the Intergovernmental Panel on Climate Change. Parry, M., Canziani, O., Palutikof, J., van der Linden, P. and Hanson, C. (Eds.) Cambridge University Press, Cambridge, UK. pp. 315-356.
- Parker, K. and Mainelli, M. (2024) What happens if we ‘burn all the carbon’? carbon reserves, carbon budgets, and policy options for governments. Royal Society of Chemistry. Environ. Sci.: Atmos. Vol. 4. pp. 435-454. [CrossRef]
- Parliamentary Commissioner for the Environment (2015) Preparing New Zealand for rising seas: Certainty and Uncertainty. November. Available online at: https://pce.parliament.nz/media/fgwje5fb/preparing-nz-for-rising-seas-web-small.pdf. Accessed 18 November 2024.
- Patterson, M. and Cole, A. (2013) ‘Total economic value’ of New Zealand’s land-based ecosystems and their services. In Dymond J. (Ed.) Ecosystem services in New Zealand – conditions and trends. Manaaki Whenua Press, Lincoln, New Zealand.
- Paulik, R., Crowley, K., Cradock-Henry, N., Wilson, T. and McSporran, A. (2021) Flood Impacts on Dairy Farms in the Bay of Plenty Region, New Zealand. Climate. Vol. 9. No. 30. [CrossRef]
- Pfeffer W. T., Harper J. T. and O’Neel S. (2008) Kinematic constraints on glacier contributions to 21st-century sea-level rise. Science 321, 1340. [CrossRef]
- Pittock, B. and Wratt, D. (2001) Chapter 12. Australia and New Zealand. IPCC. Available online at: https://www.ipcc.ch/site/assets/uploads/2018/03/wg2TARchap12.pdf. Accessed 27 March 2025.
- Purandare, J., de Sousa de Saboya, R., Bayraktarov, E., Boström-Einarsson, L., Carnell, P.E., Eger, A.M., Le Port, A., Macreadie, P.I., Reeves, S.E., van Kampen, P. (2024) Database for marine and coastal restoration projects in Australia and New Zealand. Ecological Management & Restoration 25, 14-20. [CrossRef]
- Rakkasagi, S., & Goyal, M. K. (2025). Protecting wetlands for future generations: A comprehensive approach to the water-climate-society nexus in South Asia. Environmental Impact Assessment Review, 115, 107988. [CrossRef]
- Rankin, C., Gaston, T., Sadat-Noori, M., Glamore, W., Morton, J., Chalmers, A. (2023) Innovative tidal control successfully promotes saltmarsh restoration. Restoration Ecology 31, e13774. [CrossRef]
- Real Estate Institute of New Zealand (2024 a) Dairy and Arable Farms Drive Growth as Farm Sales Rise Across New Zealand. Available online at: https://www.reinz.co.nz/Web/Web/News/News-Articles/Market-updates/Oct_2024_rural_data_Dairy_and_Arable_Farms_Drive_Growth_as_Farm_Sales_Rise_Across_New_Zealand.aspx. 25 November. Accessed 22 April 2025.
- Rennie, R. (2022) Light and shade of signing on with solar. Technology. Farmers Weekly. 29 September. Available online at: https://www.farmersweekly.co.nz/technology/light-and-shade-of-signing-on-with-solar/#:~:text=Most%20projects%20aim%20to%20lease%20land%2C%20at,keen%20to%20get%20projects%20over%20the%20line. Accessed 22 July 2025.
- Quinn, R. (2023) More than 3000 injury claims from this year's storms – ACC data. RNZ. 9 April. Available online at: https://www.rnz.co.nz/news/national/487589/more-than-3000-injury-claims-from-this-year-s-storms-acc-data. Accessed 17 February 2025.
- Rouse, H., Bell, R., Lundquist, C., Blackett, P., Hicks, D. M., and King, D. N. (2017) Coastal adaptation to climate change in Aotearoa-New Zealand. New Zealand Journal of Marine and Freshwater Research, 51(2), 183-222. [CrossRef]
- Sairinen, R., Barrow, C., & Karjalainen, T. P. (2010). Environmental conflict mediation and social impact assessment: Approaches for enhanced environmental governance?. Environmental impact assessment review, 30(5), 289-292. [CrossRef]
- Stewart-Sinclair, P., Qu, Z., Lam-Gordillo, O. and Bulmer, R. (submitted) Beyond Blue Carbon: Valuing Ecosystem Services of Coastal Wetlands in Aotearoa New Zealand. New Zealand Journal of Marine and Freshwater Research (2025).
- Snow, V., Dodd, M. and Nichols, S. (2025) Impact of waterlogging on harvestable pasture. Report to NIWA. Unpublished data, available by request.
- Statistica (2025 a) Average area of dairy farms in New Zealand from 2013 to 2024 (in hectares). Available online at: https://www.statista.com/statistics/1102345/new-zealand-dairy-farm-size/#:~:text=In%20the%202024%20dairy%20season,effective%20hectares%20in%20New%20Zealand. Accessed 12 March 2025.
- Statistica (2025 b) Average number of cows per hectare in New Zealand from 2013 to 2024. Available online at: https://www.statista.com/statistics/1416424/new-zealand-average-number-of-cows-per-hectare/#:~:text=In%202024%2C%20the%20average%20stocking,cows%20per%20hectare%20was%202.82. Accessed 14 February 2025.
- The Treasury (2025) Discount Rates, New Zealand Government, Wellington. Available online at: https://www.treasury.govt.nz/information-and-services/public-sector-leadership/guidance/reporting-financial/discount-rates. Accessed 27 March 2025.
- Turner, E.R. (2004) Coastal wetland subsidence arising from local hydrologic manipulations. Estuaries 27, 265-272.
- United Nations Framework Convention on Climate Change. (2012) Slow onset events. Technical paper. FCCC/ TP/2012/7. Available at: https://unfccc.int/resource/docs/2012/tp/07.pdf. Accessed 22 April 2025.
- Vaughan, A., Brent, A., Fitzgerald, M. and Kueppers, J. (2023) Agrivoltaics: Integrating Solar Energy Generation with Livestock Farming in Canterbury. Prepared for Our Land and Water Rural Professionals Fund 2023. June. Available online at https://ourlandandwater.nz/wp-content/uploads/2023/08/Agrivoltaics_Report_OLW-RPF23.pdf. Accessed 22 July 2025.
- Vlotman, W. F., Wong, T., and Schultz, B. (2007) Integration of drainage, water quality and flood management in rural, urban and lowland areas. Irrigation and Drainage: The journal of the International Commission on Irrigation and Drainage, 56(S1), S161-S177. [CrossRef]
- Wahl, T., Jain, S., Bender, J., Meyers, S. D., and Luther, M. E. (2015) Increasing risk of compound flooding from storm surge and rainfall for major US cities. Nature Climate Change, 5(12), 1093-1097. [CrossRef]
- Waikato River Authority (2022) Standard costs and assumptions. Available online at: https://waikatoriver.org.nz/wp-content/uploads/2022/07/Standard-Costs-and-Assumptions-July-2022.pdf. Accessed 3 April 2025.
- Wang, Y., & Qian, Y. (2024). Driving factors to agriculture total factor productivity and its contribution to just energy transition. Environmental Impact Assessment Review, 105, 107369. [CrossRef]
- Water New Zealand (2024) Rising sea levels could affect freshwater. Available online at: https://www.waternz.org.nz/Story?Action=View&Story_id=81#:~:text=%22This%20is%20where%20we%20in,rises%20we'll%20start%20to. Accessed 18 December 2024.
- Walker, G. (2010). Environmental justice, impact assessment and the politics of knowledge: The implications of assessing the social distribution of environmental outcomes. Environmental impact assessment review, 30(5), 312-318. [CrossRef]
- Weekes, J., and Ryan, S. (2015) Floods shut down Wellington, one dead. New Zealand Herald. 14 May. Available online at: https://www.nzherald.co.nz/nz/floods-shut-down-wellington-one-dead/U2NLENPALUNI7P3RZ7UAGJNWHQ/.
- Western Bay of Plenty District Council. (2025) “Property and Rates Search website.” Available online at: https://www.westernbay.govt.nz/property-rates-and-building/property-and-rates-search. Access 25 February 2025.
- Wetlands Trust (Undated) Restore Wetlands. Available online at: https://www.wetlandtrust.org.nz/restore-wetlands/. Accessed 21 August 2025.
- Wilby, R. L., and Keenan, R. (2012) Adapting to flood risk under climate change. Progress in Physical Geography, 36(3), 348-378. [CrossRef]
- Wunderling, N., von der Heydt, A.S., Aksenov, Y., Barker, S., Bastiaansen, R., Brovkin, V., Brunetti, M., Couplet, V., Kleinen, T., Lear, C.H., Lohmann, J., Roman-Cuesta, R.M., Sinet, S., Swingedouw, D., Winkelmann, R., Anand, P., Barichivich, J., Bathiany, S., Baudena, M., Bruun, J.T., Chiessi, C.M., Coxall, H.K., Docquier, D., Donges, J.F., Falkena, S.K.J., Klose, A.K., Obura, D., Rocha, J., Rynders, S., Steinert, N.J., Willeit, M. (2024) Climate tipping point interactions and cascades: a review. Earth Syst. Dynam. 15, 41-74. [CrossRef]
- Xie, H., Pearson, D., McLaren, S.J. and Horne, D. (2025) Expansion of Lifestyle Blocks in Peri-Urban New Zealand: A Review of the Implications for Environmental Management and Landscape Design. Land 14(7), 1447. [CrossRef]
- Xu, X., Chen, M., Yang, G., Jiang, B., and Zhang, J. (2020) Wetland ecosystem services research: A critical review. Global Ecology and Conservation, 22, e01027. [CrossRef]
- Yang, W., Tanner, C., Holland, P., and Qu, Z. (2024) Dynamic Economic Valuation of coastal wetland restoration: A nature-based solution for climate and biodiversity. Environmental Challenges . [CrossRef]
Figure 1.
Regular flooding creates a ratcheting effect on declining earnings. Dips in earnings represent losses from floods.
Figure 1.
Regular flooding creates a ratcheting effect on declining earnings. Dips in earnings represent losses from floods.
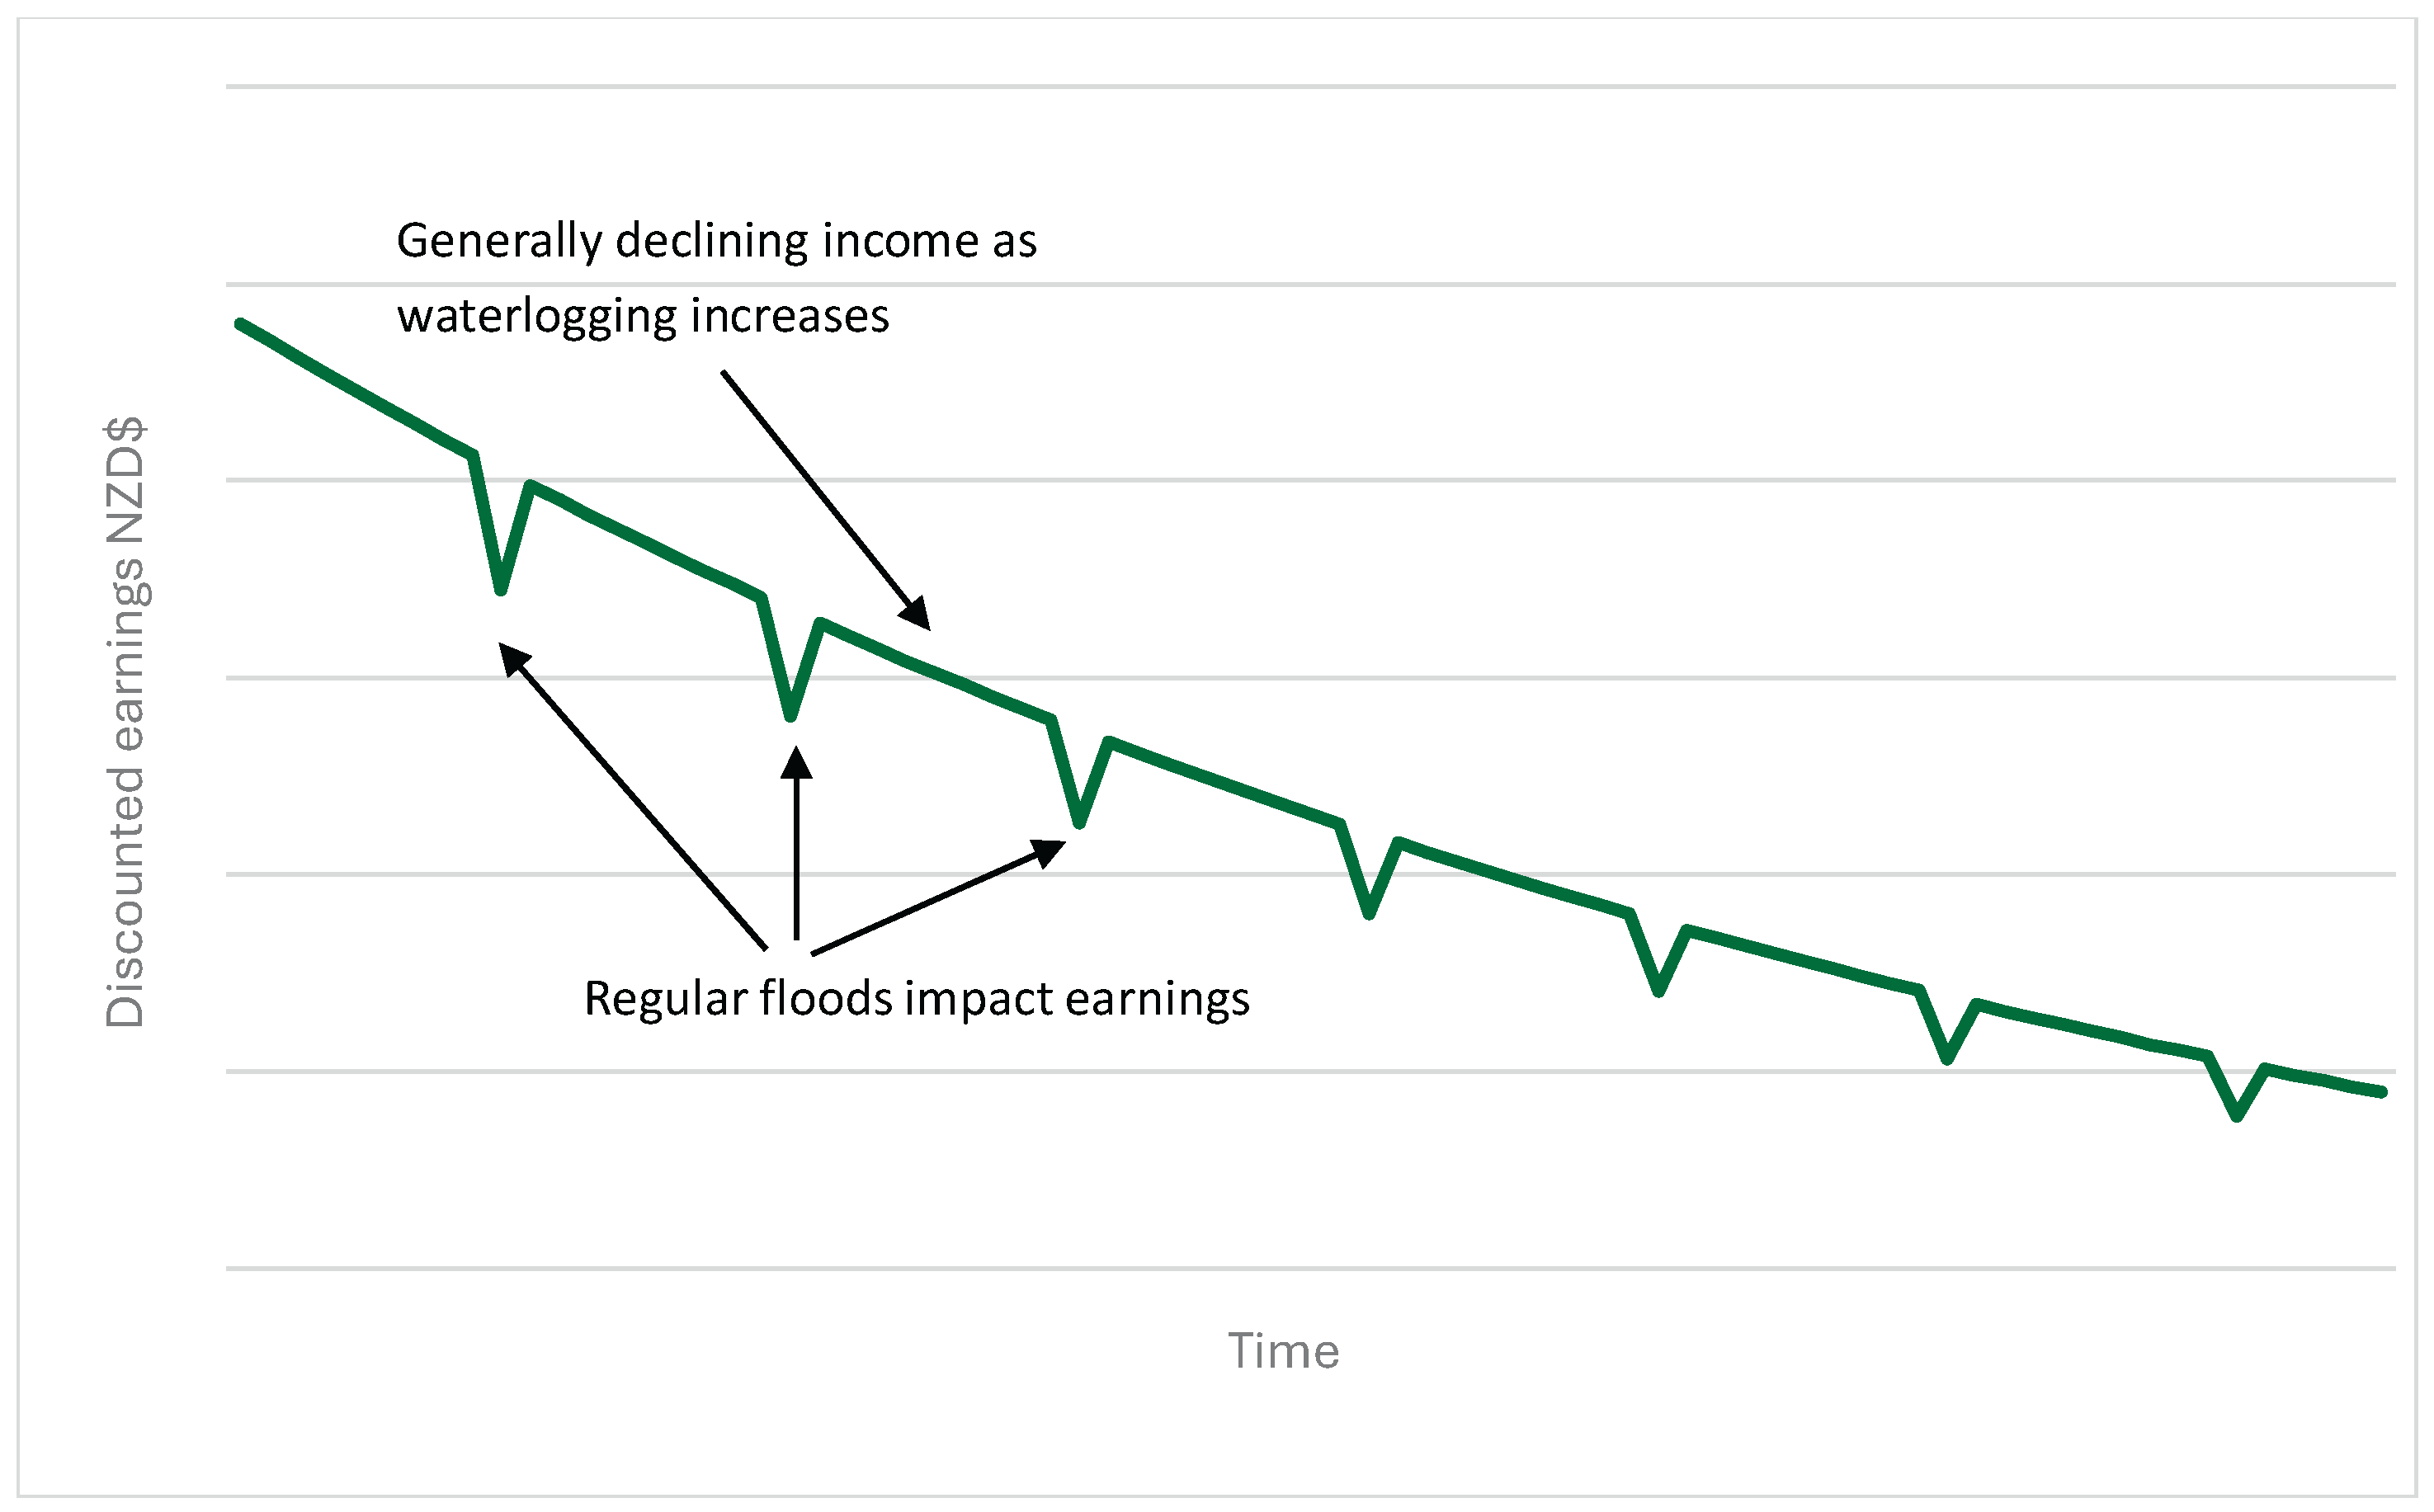
Figure 2.
Values without change – groundwater starts 1000 mm from the surface.
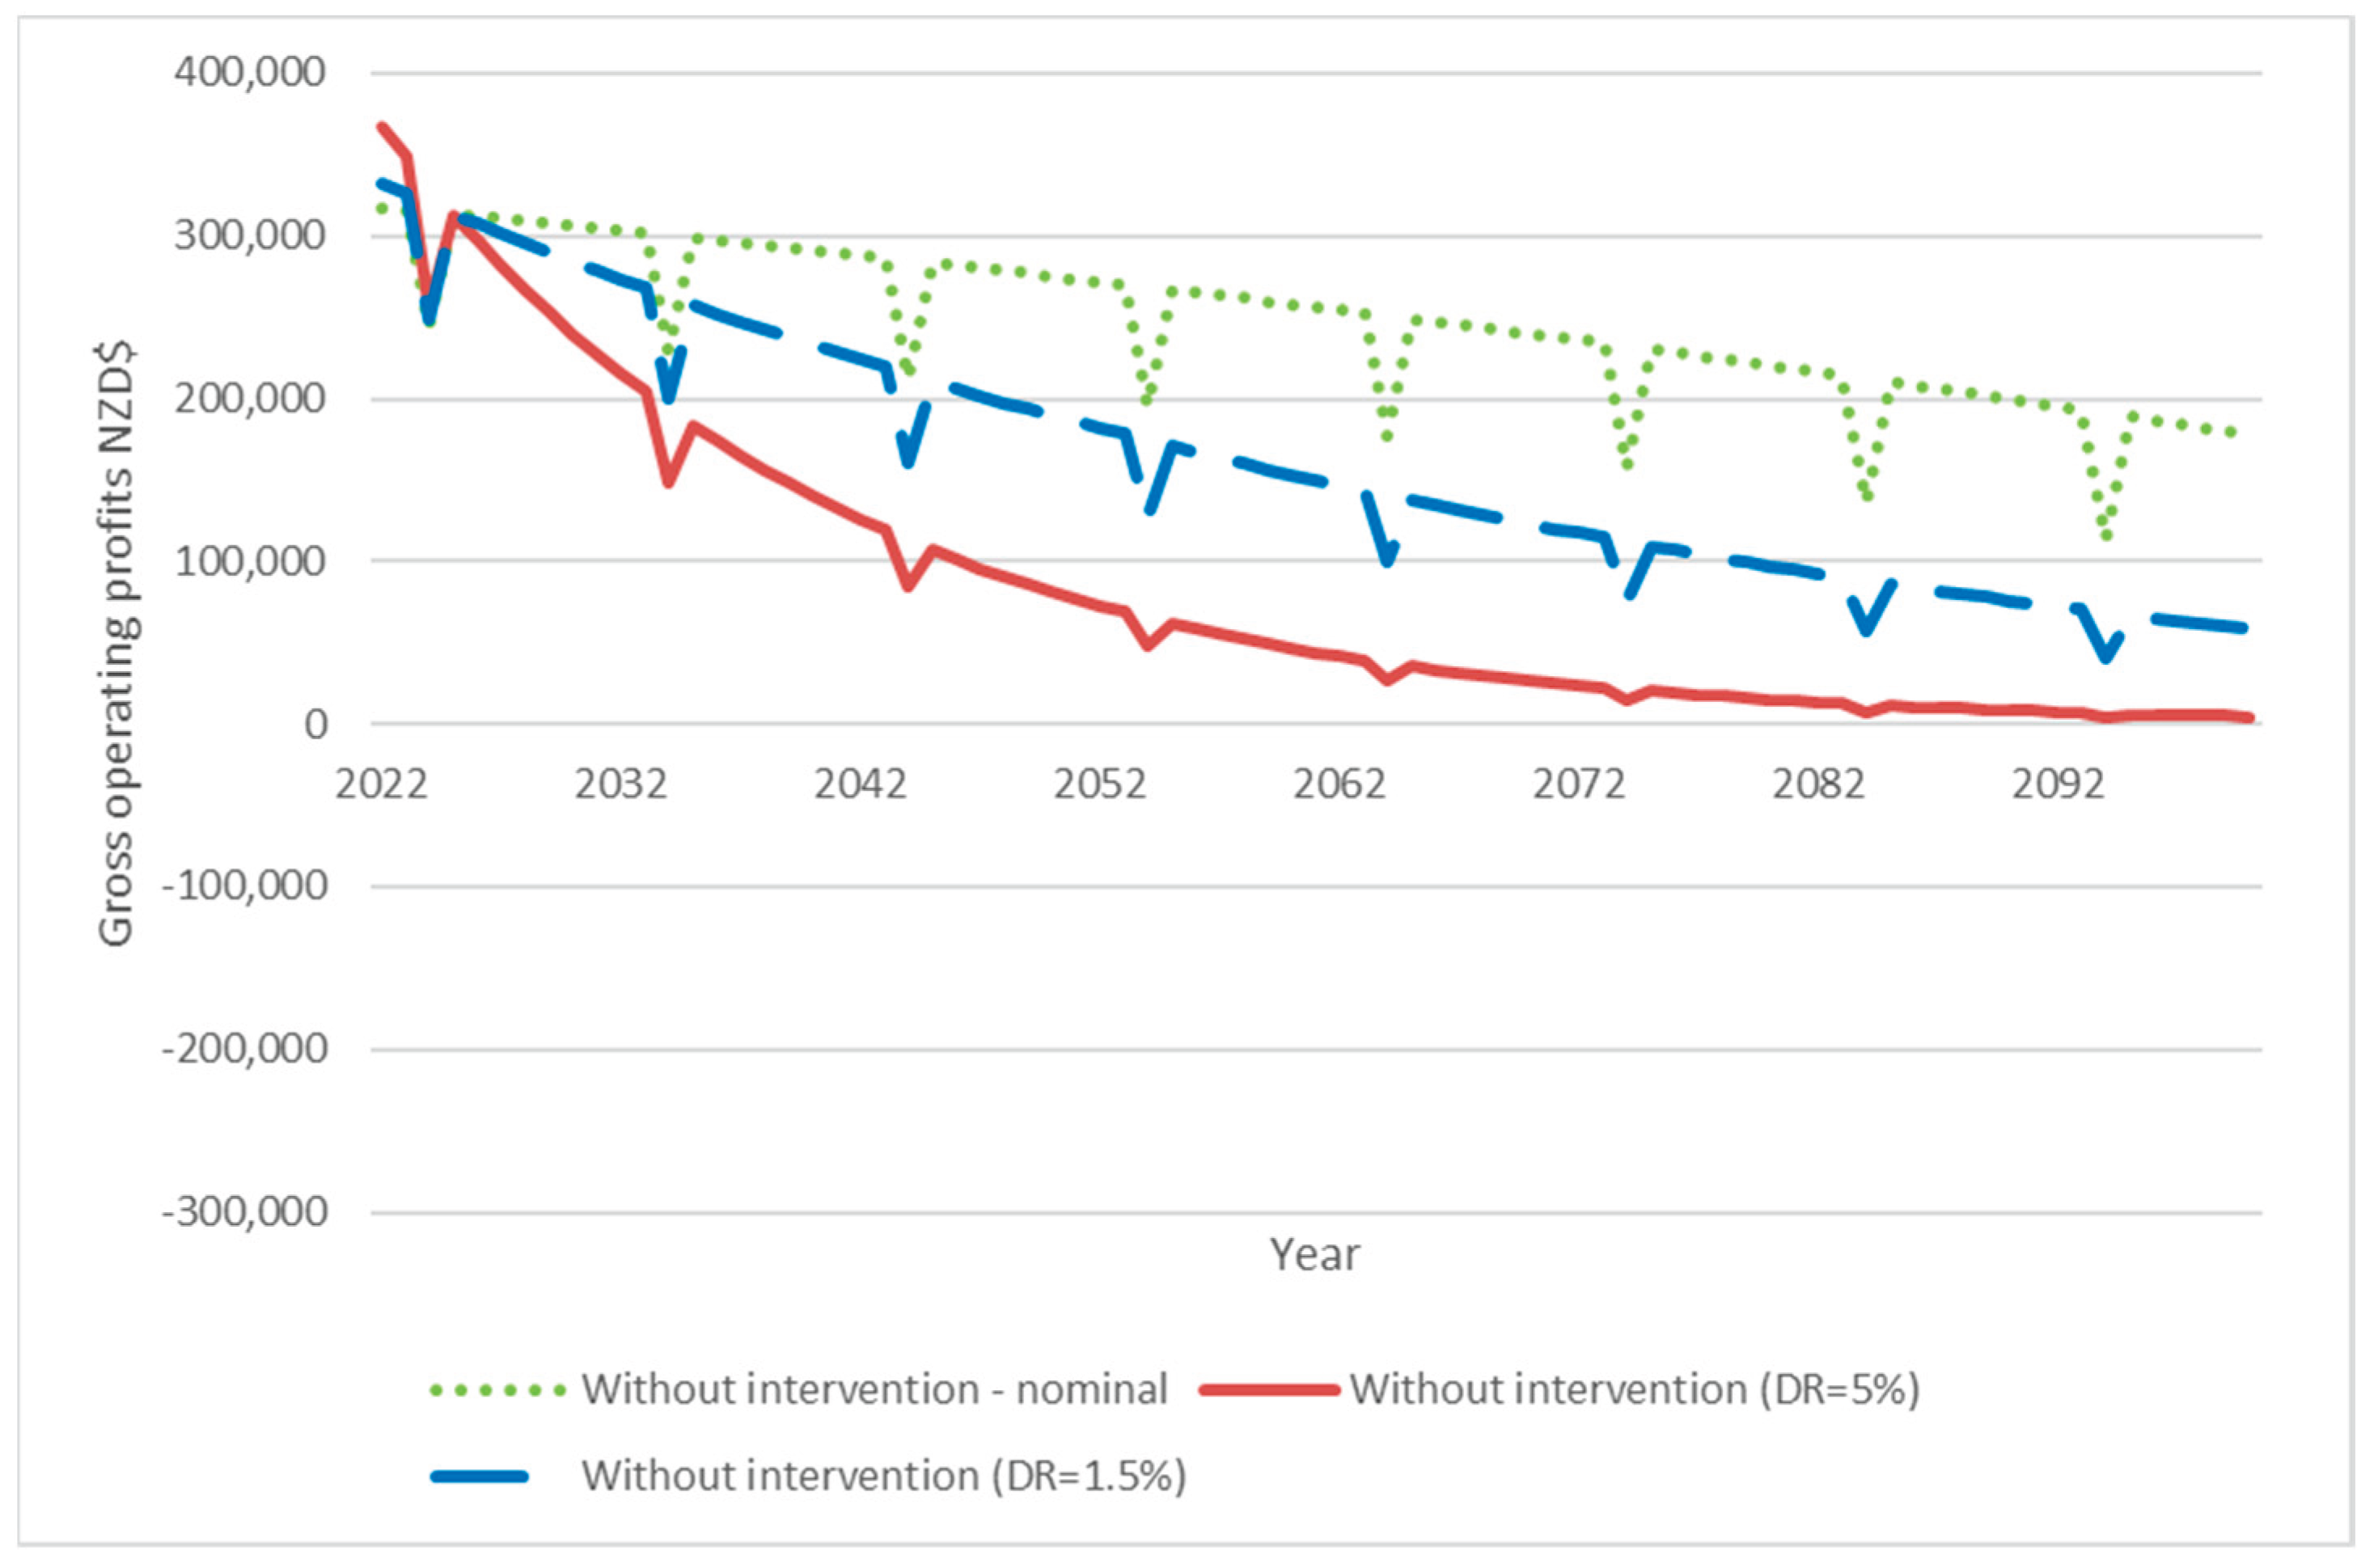
Figure 3.
Values without change - groundwater starts 700 mm from the surface.
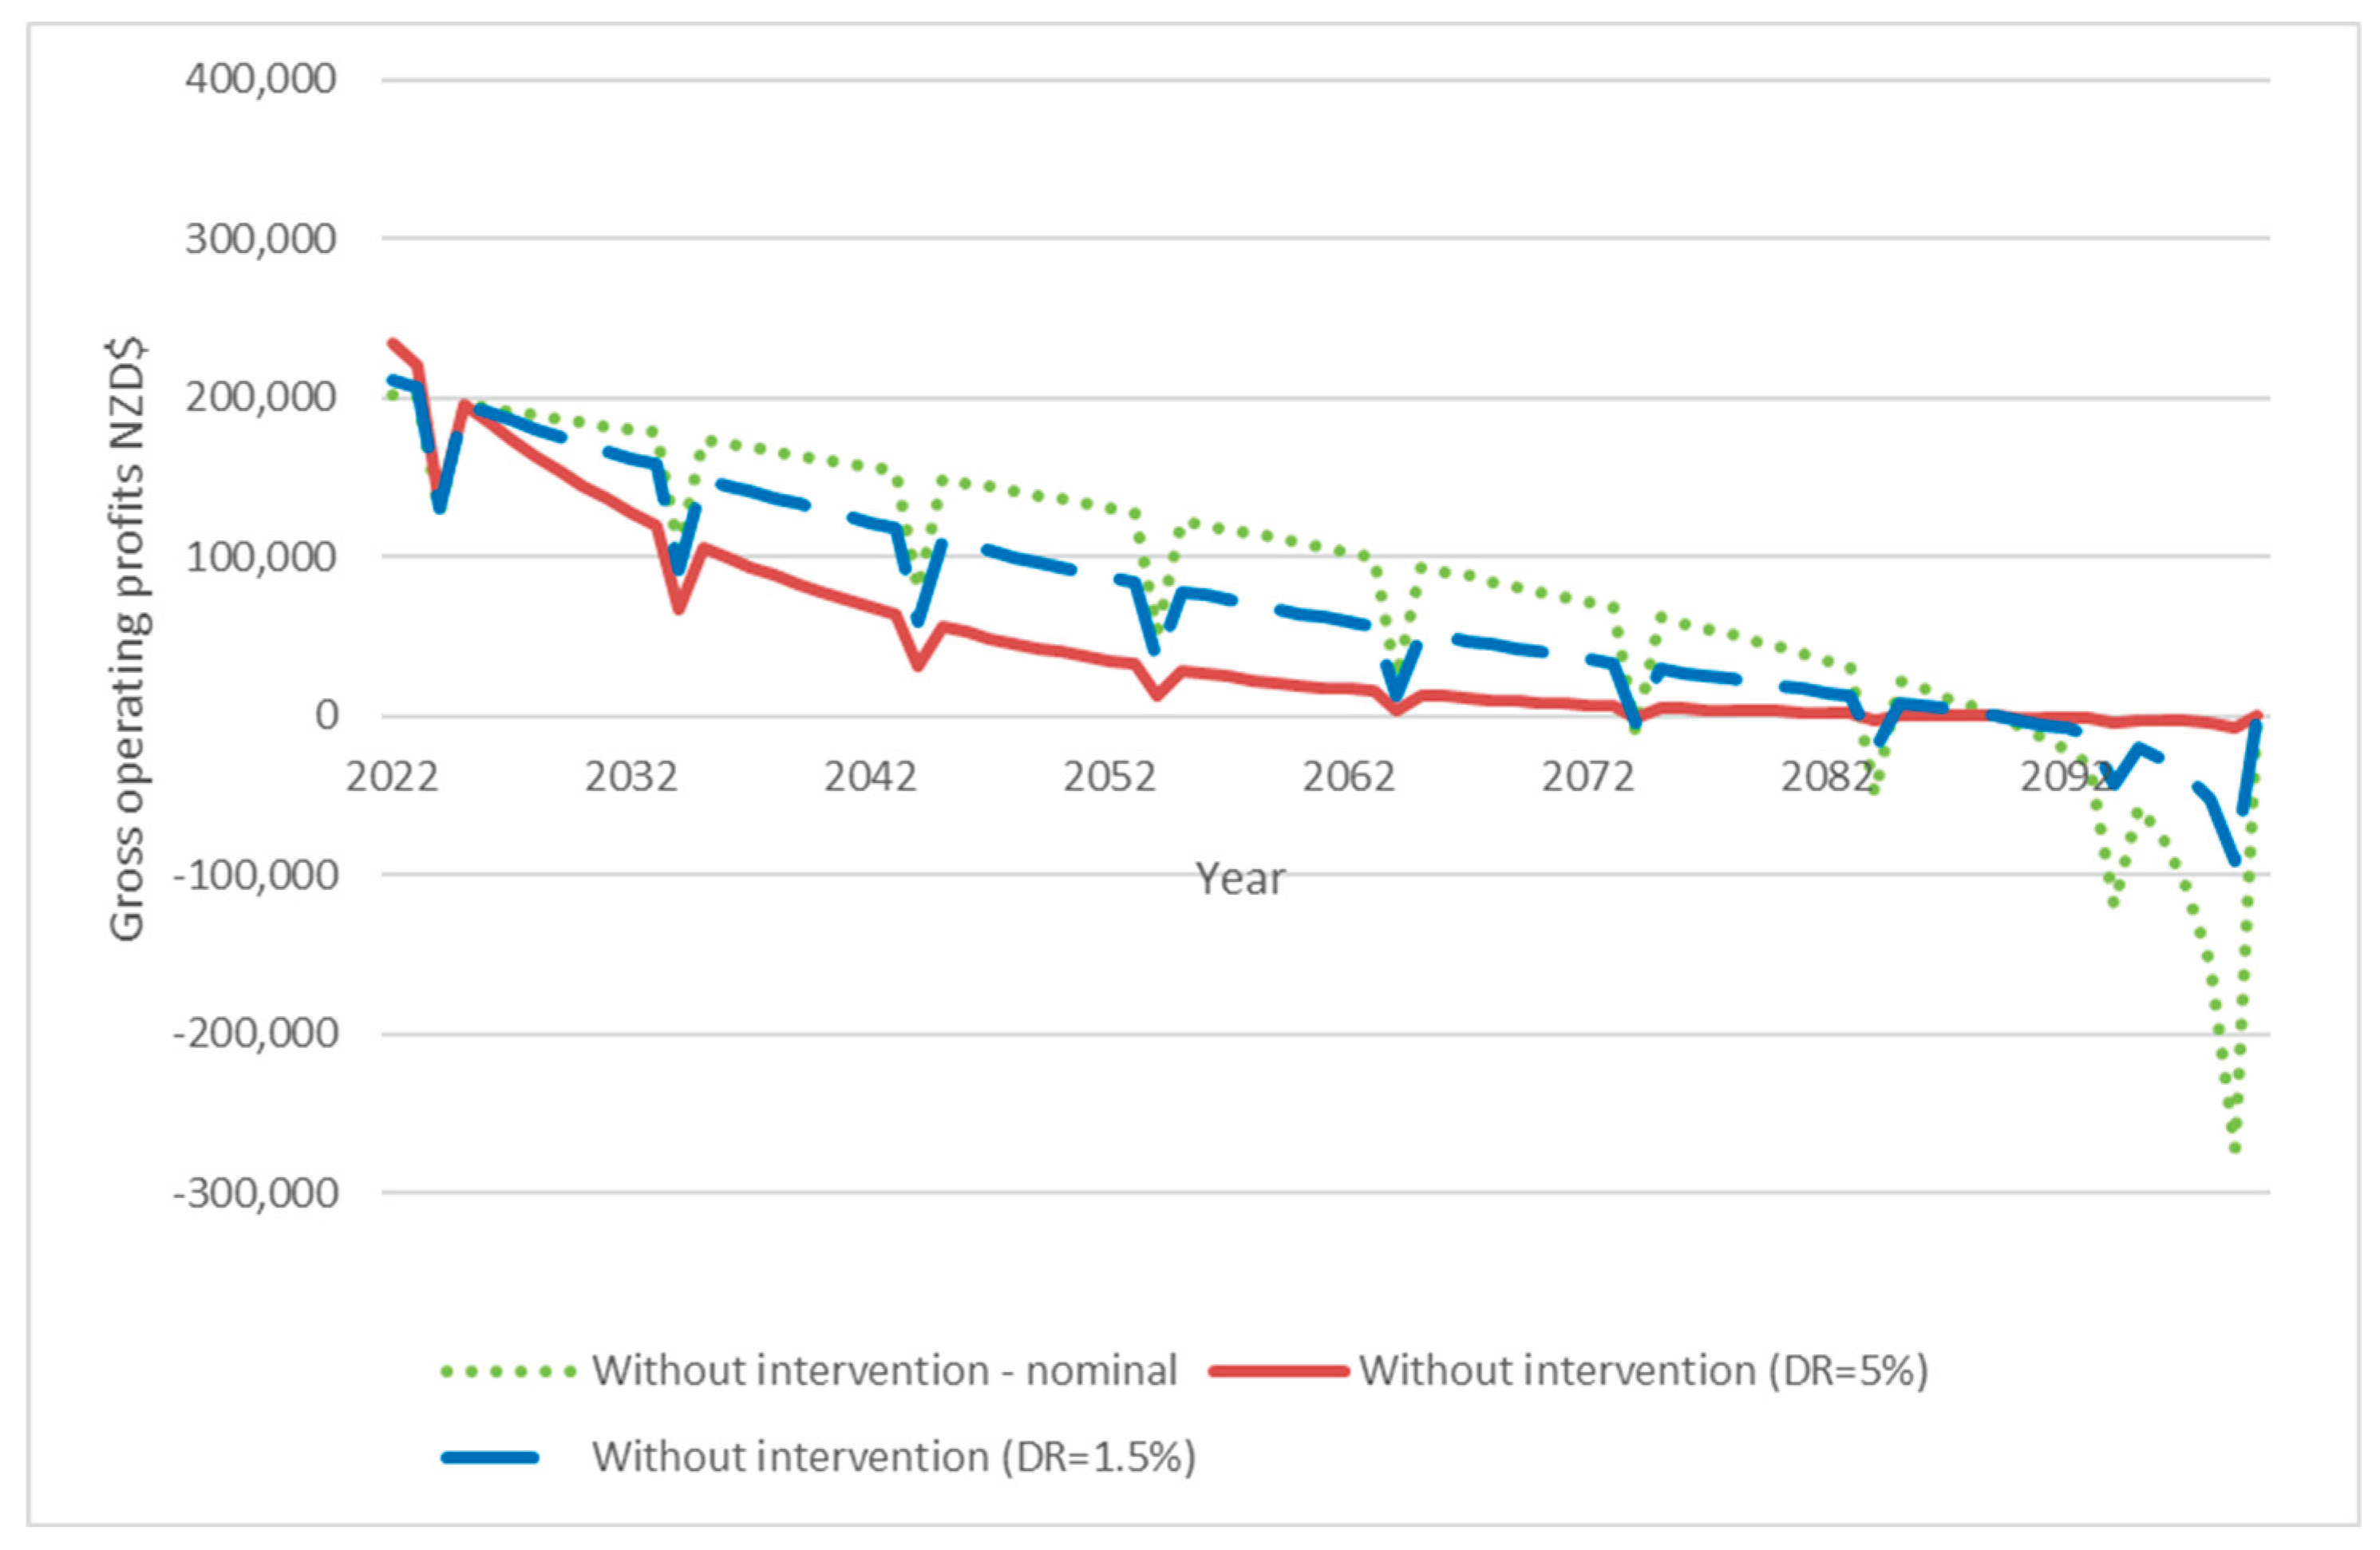
Figure 4.
Gross benefits groundwater at 700mm; discount rate at 5%.
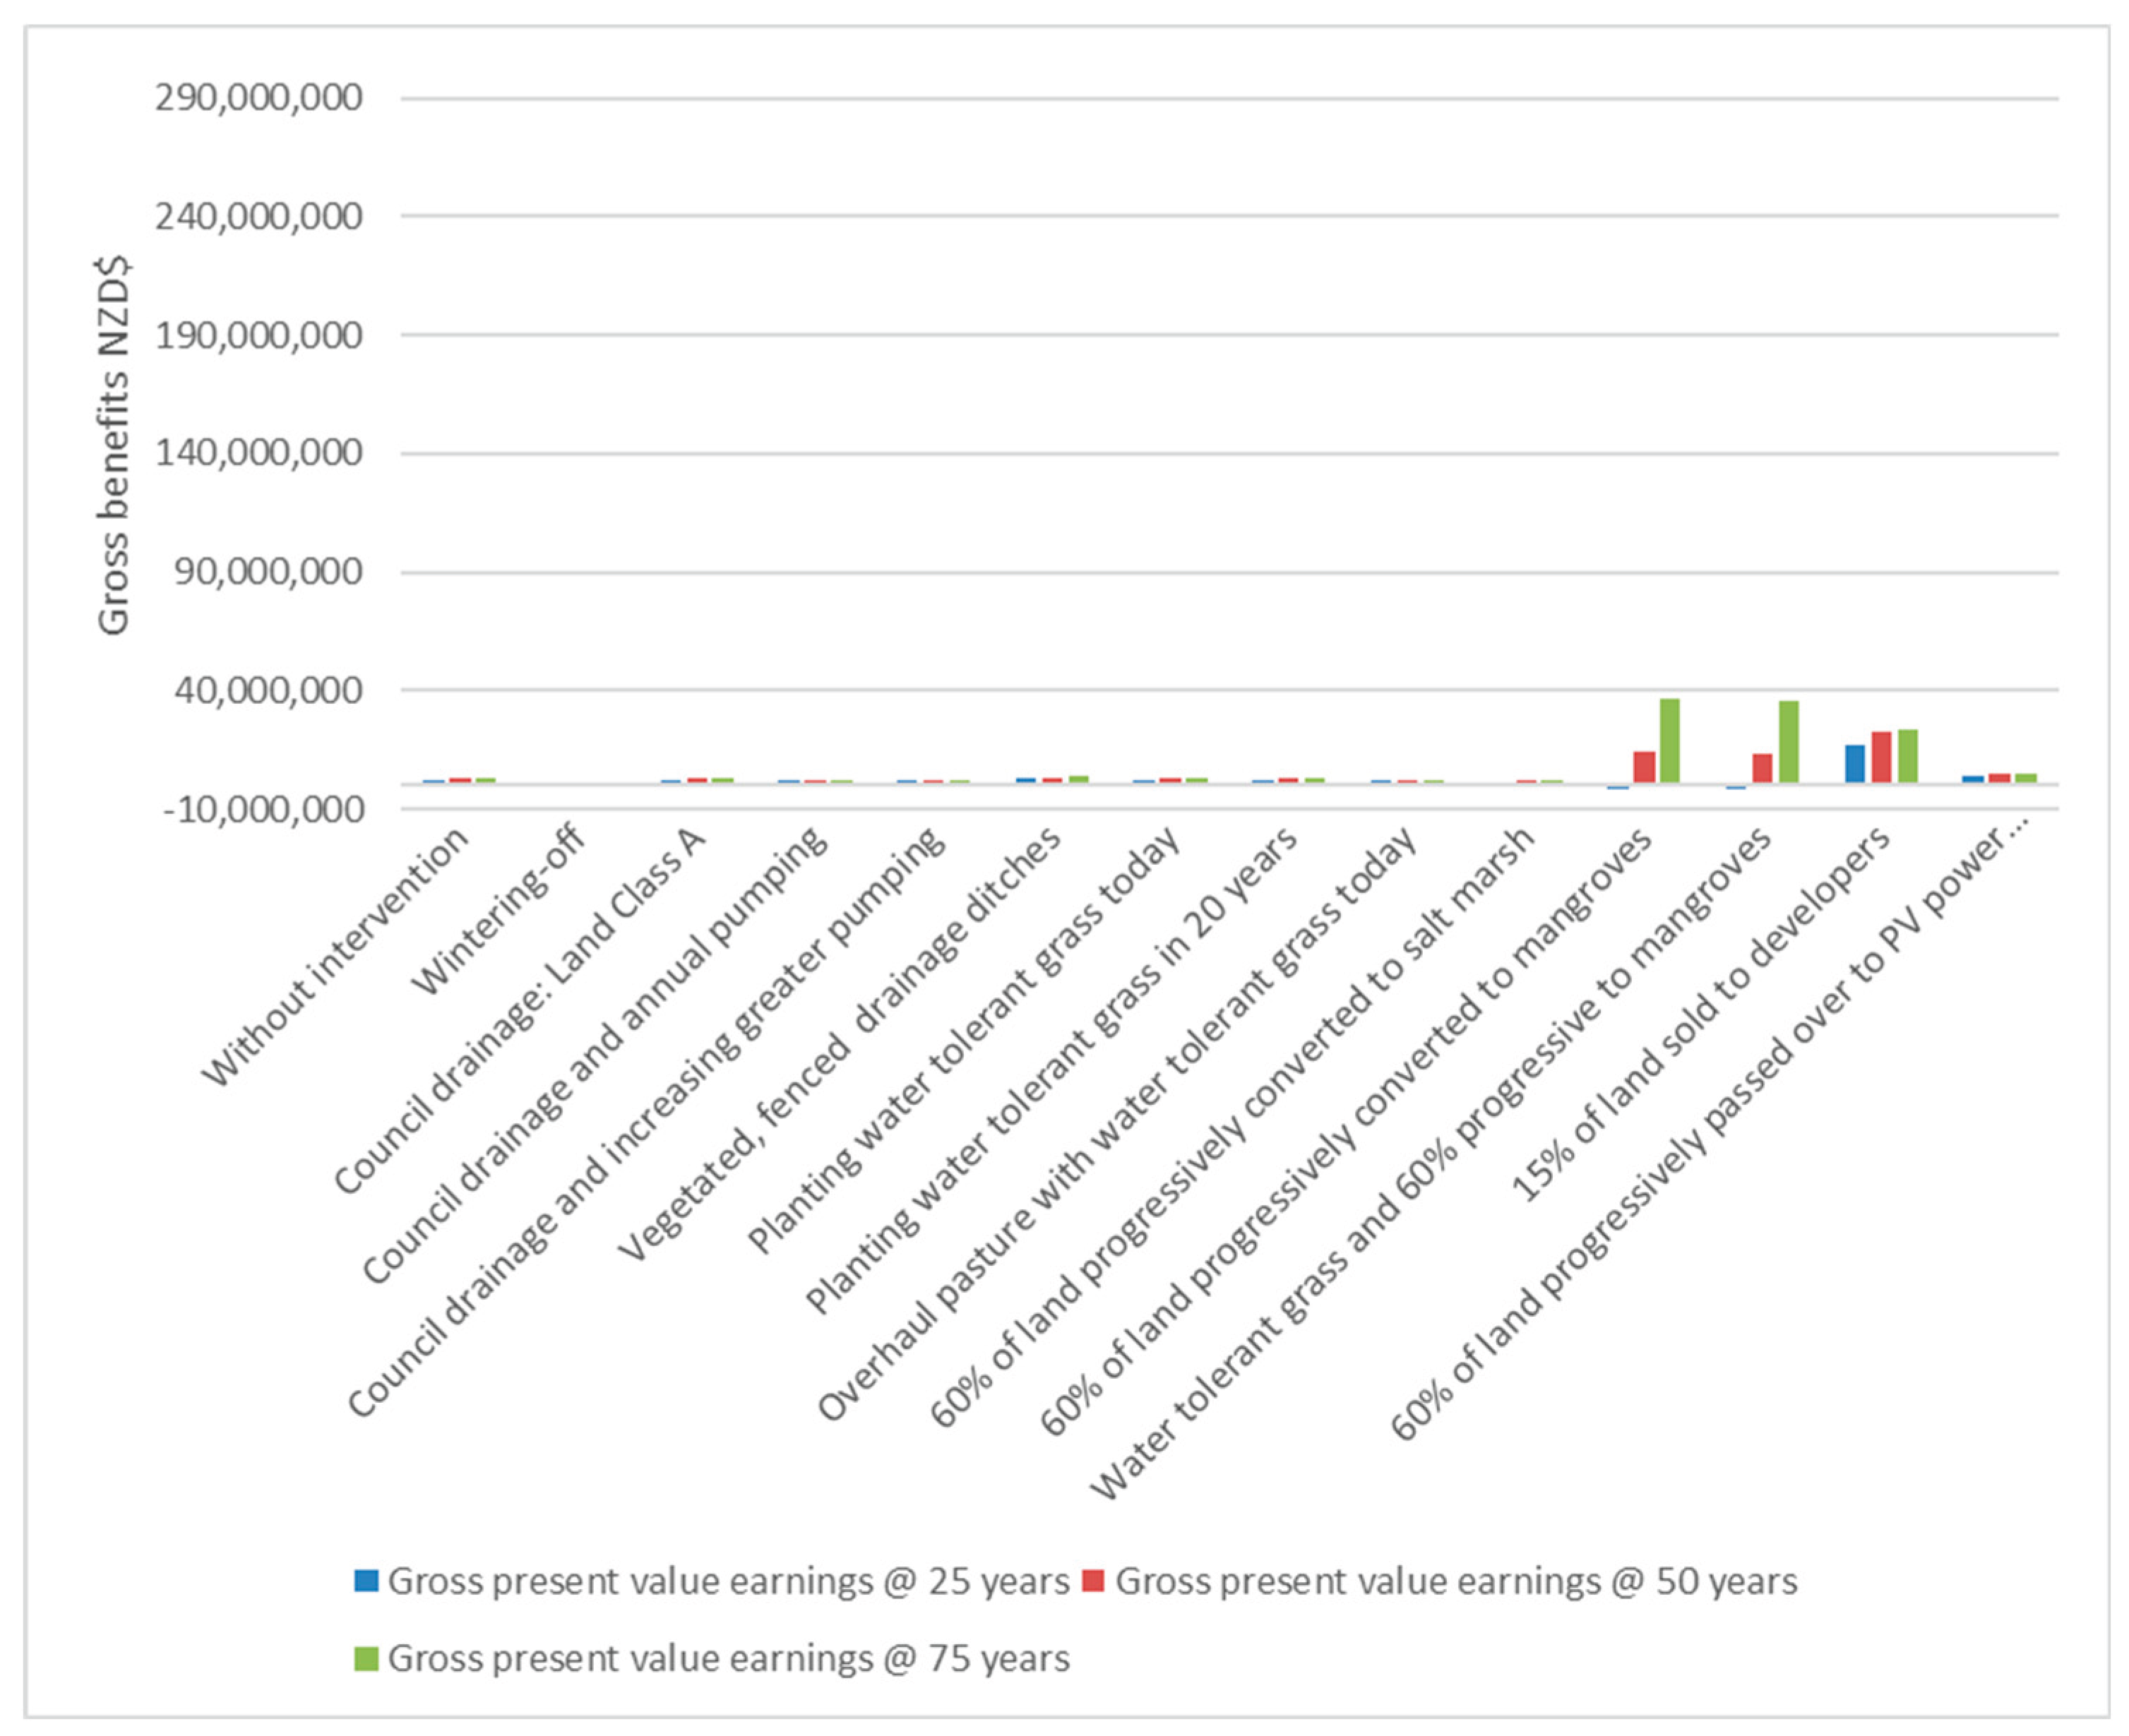
Figure 5.
Gross benefits with groundwater at 700mm; discount rate at 1.5%.
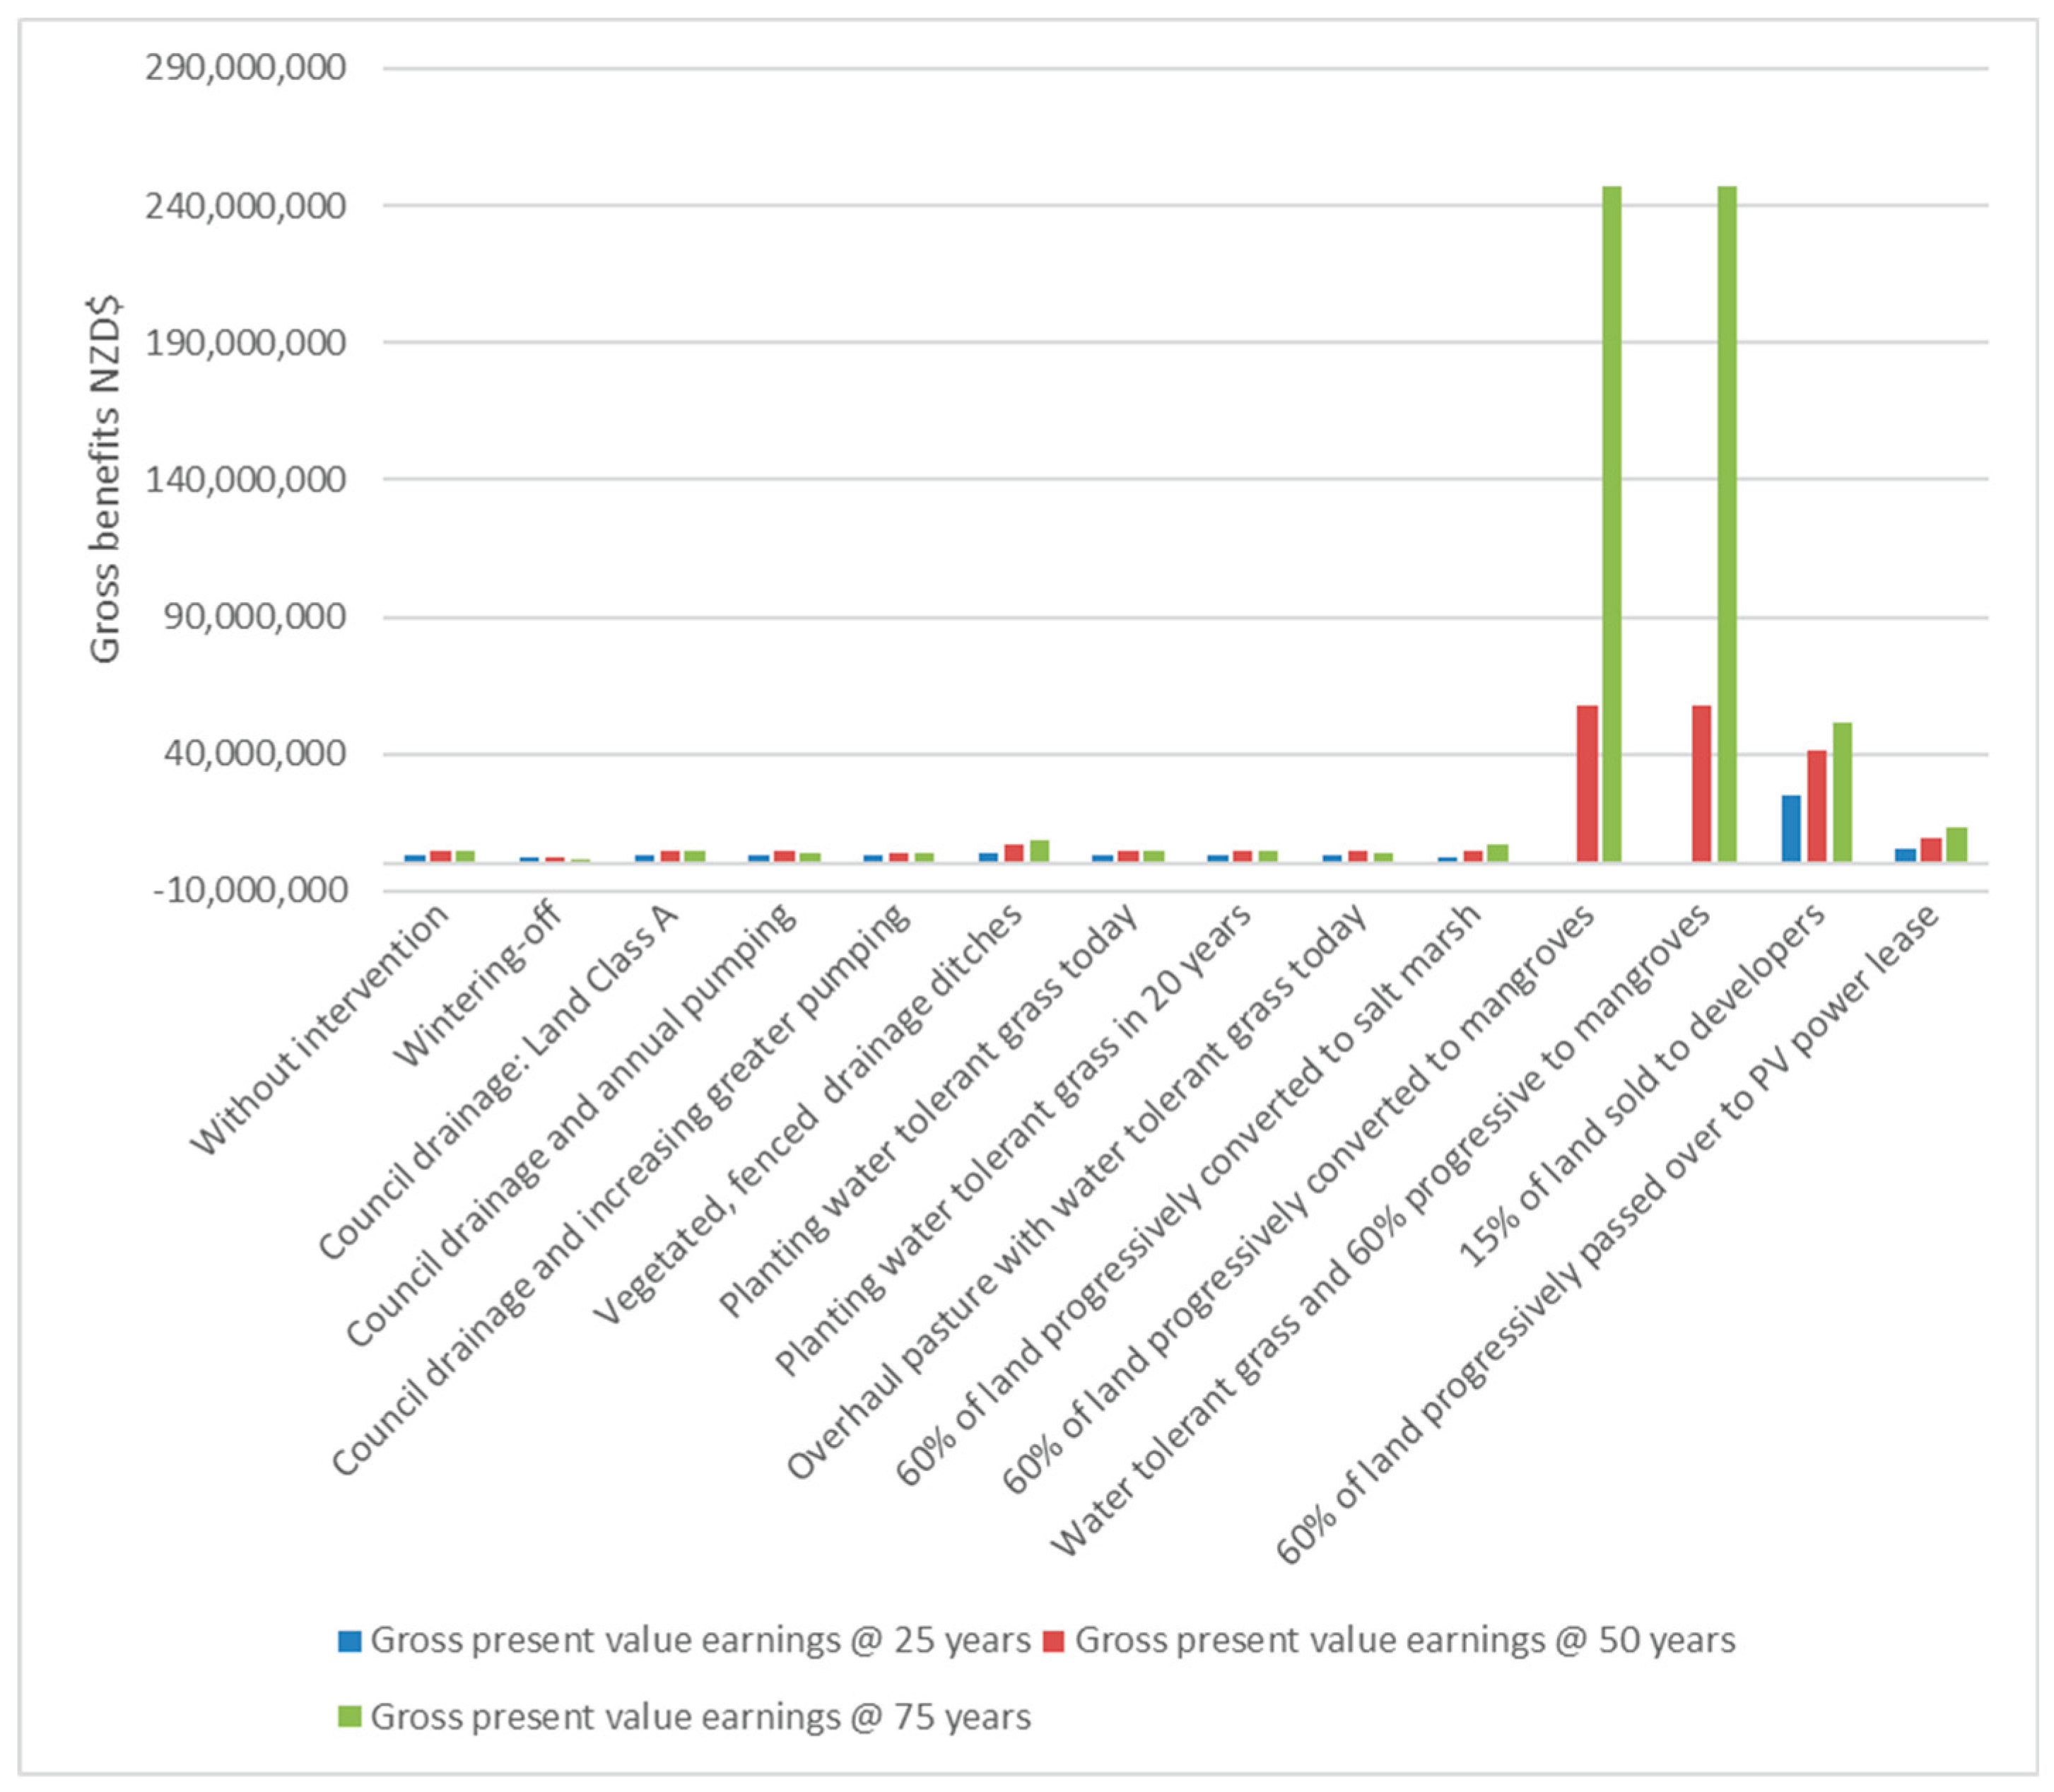
Table 2.
Off-site grazing costs NZD$. Source: Paulik et al. (2021).
| Stock size | Transport costs | Grazing off-farm costs |
| 114-642 | 6,000–60,000 | 9,000–112,000 |
Table 6.
Economic values of Whangamarino Wetland. Source: Department of Conservation (2007); Kirkland (1988). Costs and values are estimated and presented in New Zealand dollars in 2024 values.
Table 6.
Economic values of Whangamarino Wetland. Source: Department of Conservation (2007); Kirkland (1988). Costs and values are estimated and presented in New Zealand dollars in 2024 values.
| Service | Reported economic estimate | Source |
| Replacement cost for flood management | NZD$16,000,000 | Department of Conservation (2007) |
| Gamebird hunting | NZD$60,000 p.a. | Department of Conservation (2007) |
| Existence/intrinsic value | NZD$55,291,671 p.a.1 | Kirkland (1988) |
Disclaimer/Publisher’s Note: The statements, opinions and data contained in all publications are solely those of the individual author(s) and contributor(s) and not of MDPI and/or the editor(s). MDPI and/or the editor(s) disclaim responsibility for any injury to people or property resulting from any ideas, methods, instructions or products referred to in the content. |
© 2026 by the authors. Licensee MDPI, Basel, Switzerland. This article is an open access article distributed under the terms and conditions of the Creative Commons Attribution (CC BY) license (http://creativecommons.org/licenses/by/4.0/).
Copyright: This open access article is published under a Creative Commons CC BY 4.0 license, which permit the free download, distribution, and reuse, provided that the author and preprint are cited in any reuse.


