
Submitted:
14 January 2026
Posted:
16 January 2026
You are already at the latest version
Abstract
PIEZO1 are Ca2+-permeable mechanogated channels that play a crucial role in numerous fundamental cellular responses. Ca2+ influx via PIEZO1 could control the activity of various Ca2+-dependent molecules within the cells, thus activating Ca2+-dependent signaling processes and reactions. Previously we have demonstrated Ca2+-mediated coupling between PIEZO1 and KCa channels in the plasma membrane of transformed mouse fibroblasts, where Ca2+ influx through PIEZO1 stimulates the activity of functionally co-localized KCa channels. Importantly, the selective PIEZO1 activator, Yoda1, inhibited transformed fibroblast migration, induced F-actin assembly and stress fiber formation. However, the impact of PIEZO1-KCa channel coupling to the observed effects remains unknown. Here, we performed the molecular identification of KCa channels in transformed mouse fibroblasts. Importantly, TRAM-34, a specific KCa3.1 channel blocker, abrogated the effect of Yoda1 on F-actin organization and fibroblast motility. We could conclude that KCa3.1 channels in the plasma membrane are primary downstream effectors and critical contributors to the decrease in transformed fibroblast migration and F-actin assembly caused by selective PIEZO1 activation.
Keywords:
PIEZO1
; mechanogated ion channels
; Ca2+-activated potassium channels
; KCa3.1 channels
; cell migration
1. Introduction
Mechanosensitive ion channels (MSCs) are present in a wide variety of cells and tissues, where they play a key role in mechanotransduction, a fundamental physiological process that converts extracellular mechanical stimuli into intracellular signals. MSCs are the only mechanosensory molecules within the cells that are capable of providing the fastest (less than 1 ms) responses to external mechanical forces. Among MSCs, PIEZO1 channels, as Ca2+-permeable mechanogated channels, are in a central focus of attention. The key role of PIEZO1 channels in physiological processes both in health and disease has been confirmed in a large number of studies that were summarized in numerous reviews [1,2,3,4]. To date, it has been shown that the activity of various molecules depends on the influx of Ca2+ via PIEZO1, and this results in a significant impact on intracellular and membrane Ca2+-dependent processes [5,6,7,8]. In particular, PIEZO1 could control the activity of Ca2+-activated ion channels, forming mechanogated channel complexes in the plasma membrane [9]. The presence of such complexes is thought to be a universal property of the cells of different origins. However, the question about how these complexes could control and determine PIEZO1-dependent reactions remains uncertain.
Previously, using low-noise single-channel patch-clamp recordings, we have identified functional complexes of PIEZO1 and Ca2+-activated potassium (KCa) channels in the plasma membrane of transformed mouse 3T3B-SV40 fibroblasts [10]. Also, we have reported that Yoda1, the selective chemical PIEZO1 activator, induced F-actin assembly and suppressed fibroblast migration [11]. Thus, it was of specific interest to elucidate if PIEZO1-coupled KCa activity contributes to Yoda1-mediated alterations of cell migration and F-actin organization. In the present study we used 3T3B-SV40 cells as an experimental model to identify the molecular correlates of KCa channels that are coupled with PIEZO1 using a selective inhibitor analysis. Importantly, we determined the crucial impact of KCa activity on migration suppression and F-actin assembly caused by selective activation of PIEZO1 in 3T3B-SV40 cells.
2. Results and Discussion
In our previous study we demonstrated the presence of functional complexes of PIEZO1 and KCa channels in the plasma membrane of transformed mouse 3T3B-SV40 fibroblasts [10,11]. Particularly, plasma membrane stretch-induced Ca2+ influx via PIEZO1 resulted in the stimulation of functionally co-localized KCa channel activity. Here, we aimed at identification of a particular KCa channel that is activated by a PIEZO1-mediated Ca2+ entry. Based on single-channel conductance (about 9 pS, [10]) measured under quasi-physiological ionic conditions (Na-based extracellular solution, e.g. Ringer’s), the molecular correlates of KCa channels in 3T3B-SV40 cells could potentially be from the small conductance (SK1-3, or KCa2.1, 2.2 and 2.3) KCa channel family or, alternatively, KCa channels of intermediate conductance (IK, [12]), also known as KCa3.1 or Gardos channels.
Importantly, SK and IK channels could be easily distinguished from each other due to their sensitivity to specific pharmacological blockers, such as apamin and TRAM-34 [13], respectively. Taking this KCa channel pharmacological property as a useful tool for channel identification, we aimed to determine the specific PIEZO1 partner in the plasma membrane of transformed mouse fibroblasts. Particularly, in the case of 3T3B-SV40 cells, no block of KCa channels by apamin would undoubtedly indicate their molecular identity as KCa3.1 channels. The concentration range of apamin blocking concentration varies from picomoles to tenths of nanomoles, depending on the specific SK channel subtype and/or SK channel subunit combination [13]. To reliably block all possible SK channel correlates, we performed the electrophysiological experiments in cell-attached configuration (registration of ion currents from the membrane fragment of the intact cell) to probe if PIEZO1-KCa coupling remains in the presence of an extremely high concentration (200 nM) of apamin in the patch pipette. As in the previous study [10], we used the application of “negative” pressure (suction, ΔP < 0) to evoke mechanogated PIEZO1 currents and monitored if PIEZO1 activation stimulates coupled KCa channel activity in the presence of an SK blocker. One of the significant experimental drawbacks is that (in the case of PIEZO1-KCa coupling in the plasma membrane fragment) we are limited in the use of selective agonist, Yoda1, to stimulate PIEZO1 in cell-attached experiments. Particularly, the inclusion of Yoda1 in the patch pipette would result in uncontrolled PIEZO1 activity, that, if PIEZO1-KCa coupling is present in the membrane fragment, would lead to the channel interference thus complicating the determination of whether PIEZO1 are indeed coupled with KCa channels. At the same time, the controllable application and the removal of “negative” pressure allow us to correctly determine if the channel coupling is indeed present in the particular experiment (see below).
Importantly, in n=7 independent experiments (about 30%, from n=23) with 200 nM apamin in the patch pipette, we observed the channel coupling phenomenon (Figure 1a), which indicates that the KCa channels are not blocked by apamin and, thus, could not belong to the SK channel family. The mean single-channel conductance of coupled KCa channels in the presence of apamin is 8.7±1.0 pS (n=7) that coincided with KCa conductance that was reported previously under control conditions [10]. Note that KCa channels remain active for >20 s after removal of mechanical stimuli (followed by deactivation of PIEZO1), which indicates that effective local [Ca2+]i increase via PIEZO1 is sufficient to induce KCa currents that persist within the seconds after PIEZO1 closure. In other patches (n=16) the stretch-activated PIEZO1 channels were either observed alone (without KCa channel activity) or no channel activity was recorded in response to stretch. This is almost similar to the statistical data reported earlier in cell-attached patches on 3T3B-SV40 cells [10]. Taken together, our results indicated that KCa3.1 channels are the only suitable candidates for molecular correlates of KCa channels coupled to PIEZO1 in the plasma membrane of transformed mouse 3T3B-SV40 fibroblasts. Further, in line with this, we revealed the presence of KCa3.1 mRNA (gene KCNN4) in the cell lysates (Figure 1b). Consistently, immunofluorescent staining with specific antibodies confirmed the expression of KCa3.1 channels in the 3T3B-SV40 cells (Figure 1c). Interestingly, the analysis of immunofluorescent images allows one to detect the significant differences in the IK staining pattern between the cells: several cells show almost no or very low staining intensity. Potentially, the phenomenon could be explained by a number of factors, including the heterogeneity of transformed 3T3B-SV40 cell population, by the differences in cell cycle stage, a known regulator of potassium channel expression, (including KCa3.1 channels [14,15]), or by KCa3.1 channel trafficking processes [16]. It should be noted that the presence (or absence) of KCa3.1 channels in the plasma membrane could be an efficient regulator of PIEZO1-KCa3.1 channel functional interplay in cellular processes and reactions [9].
To confirm the presence of functional KCa3.1 channels in the plasma membrane of 3T3B-SV40 cells we performed whole-cell patch-clamp experiments with selective KCa3.1 channel blocker, TRAM-34. We used a cytosol-like (pipette) solution containing high concentration of intracellular free Ca2+ (1 μM or pCa6) for reliable activation of KCa3.1 currents. The application of TRAM-34 resulted in the decrease of whole-cell currents in 3T3B-SV40 cells (in n=4 independent experiments), which indicate the presence of KCa3.1 channels in the plasma membrane (Figure S1).
To summarize the first part of the study, we have identified KCa3.1 channels as molecular correlates of KCa channels, whose activity is controlled by local Ca2+ entry via PIEZO1 using selective inhibitory analysis supported by the experimental evidence obtained using molecular biology techniques. It was shown that different members of the KCa family can act as the Ca2+-activated molecular partner of PIEZO1 in various cells. For example, coupled activation of PIEZO1 and KCa channels of big conductance (BK) has been recorded in renal intercalated cells in the cortical collecting duct, vascular smooth muscle cells, and atrial fibroblasts of patients with sinus rhythm [17,18,19]. We have previously shown that in human endometrial mesenchymal stem cells there is a coupling between PIEZO1 and BK channels, while the activity of other KCa channels did not depend on PIEZO1 activation, despite their greater sensitivity to intracellular Ca2+ compared to BK [20].
The experimental model that we used in the study, that is simian virus (SV)-transformed mouse fibroblasts, imply that PIEZO1-KCa3.1 coupling could potentially be a result of viral transformation, that caused changes in gene expression profiles [21], including ion channels. However, in our previously published paper we report on the observation of PIEZO1- KCa coupling in pseudo-normal BALB/3T3 fibroblasts, but its abundance was significantly lower compared to transformed 3T3B-SV40 cells [22]. Also, as PIEZO1-KCa3.1 coupling was demonstrated in other cell types, this channel interplay in the plasma membrane is unlikely due to the specific transformation of the fibroblasts with the virus. The coupling of PIEZO1-KCa3.1 channels in red blood cells (RBC) has been the most studied, as their functioning is crucial for erythrocyte physiology [23]. Similar PIEZO-KCa3.1 coupling was also detected in A431 human epidermoid carcinoma cells [5]. However, it should be emphasized that functional complexes with different representatives of the KCa family can also be simultaneously found in cells: both PIEZO1-BK and PIEZO1-KCa3.1 channels are present in U87-MG glioblastoma cells [24]. However, despite the identification of PIEZO1 molecular partners from the KCa family, the role of such functional complexes in cellular reactions of different cell types remains unclear and requires further study.
In our next series of experiments, we aimed to identify if coupled KCa3.1 activity has the impact on previously reported effects induced by selective PIEZO1 activation. In particular, we performed the analysis of 3T3B-SV40 cell migration in the presence of a specific KCa3.1 blocker, TRAM-34, together with Yoda1, a selective PIEZO1 activator. The use of Yoda1 to stimulate PIEZO1 is the only relevant ability for the analysis of the impact of PIEZO1 activation on cell migration, which was previously used in our study to reveal the inhibition of the motility of 3T3B-SV40 cells [11]. It was recently shown that Yoda1 induces the conformational changes in PIEZO1 channels that are similar to those induced by membrane stretch [25]. Importantly, when TRAM-34 and Yoda1 were applied together, we observed the absence of the inhibitory effect on 3T3B-SV40 migration caused by Yoda1 alone (Figure 2). At the same time, the application of SK channel blocker apamin (200 nM) together with Yoda1 had not prevented Yoda1-induced inhibition of cell migration (Figure S3). It should be noted that whole-cell patch-clamp recordings on 3T3B-SV40 cells (Figure S1) allows one to notice that the outward currents do not fully disappear after the application of KCa3.1 channel blocker, TRAM-34. This implies the presence of other ionic currents, and among them the possibility of SK channel activity could not be excluded. Thus, we are not claiming that 3T3B-SV40 transformed fibroblasts do not express SK channels at all. However, if they do express functional SK channels, then their activity is not functionally coupled with PIEZO1, as application of apamin had no effect on Yoda1-induced suppression of cell migration (Figure S3). These results, together with single-channel patch-clamp analysis (no effect on channel coupling in the presence of apamin in the patch pipette, Figure 1A), further confirm the molecular identity of KCa3.1 channels as well as their functional coupling with PIEZO1 in the plasma membrane of 3T3B-SV40 cells.
Previously, we have reported that selective PIEZO1 activator Yoda1 induced F-actin assembly and stress fiber formation in transformed fibroblasts, and this effect (at least partly) seems to underlie migration suppression [11]. The same effect on F-actin was observed in Madin-Darby canine kidney (MDCK) cells, where activation of PIEZO1 by Yoda1 stimulated the formation of thick F-actin fibers [26]. Also, in macrophages, a positive feedback loop was demonstrated between PIEZO1 and the cytoskeleton: treatment with Yoda1 induced F-actin assembly, promoting the inflammatory activation of macrophages [27].
Further, we aimed to elucidate if the application of TRAM-34 together with Yoda1 had any effect on F-actin organization, and we demonstrated that TRAM-34 prevented F-actin assembly induced by Yoda1 (Figure 3). Thus, the restoration of migratory characteristics of 3T3B-SV40 by TRAM-34 addition to Yoda1-containing medium was due to the prevention of F-actin assembly and stress fiber formation. Interestingly, TRAM-34 alone had no significant effect on cell migration, indicating little or no participation of KCa3.1 channels in transformed fibroblast motility under normal conditions (without selective PIEZO1 activator, Figure S4). The application of selective KCa3.1 blockers was previously shown to affect fibroblast responses that were stimulated by various stimuli, including pro-fibrotic chemokines and growth factors [28]. At the same time, there are contradictory data obtained on pancreatic cancer cells, where the use of the TRAM-34 stimulated cell migration [29]. It should be noted that the effect of KCa3.1 blockers could be dependent on a particular state of the cells. As a relevant example, in human fibrocytes KCa3.1 inhibition only had the effect on the migration when the cells were freshly isolated or had been detached from the surface (‘‘rounded’’) and, at the same time, no effect was observed when the cells were adherent (elongated shape, [30]. Thus, the role of KCa3.1 channels in cell reactions and the effect of channel inhibition could be rather different, depending on the particular cell type and its state, on type of stimuli and/or cell-specific signaling pathways in which KCa3.1 channels are integrated.
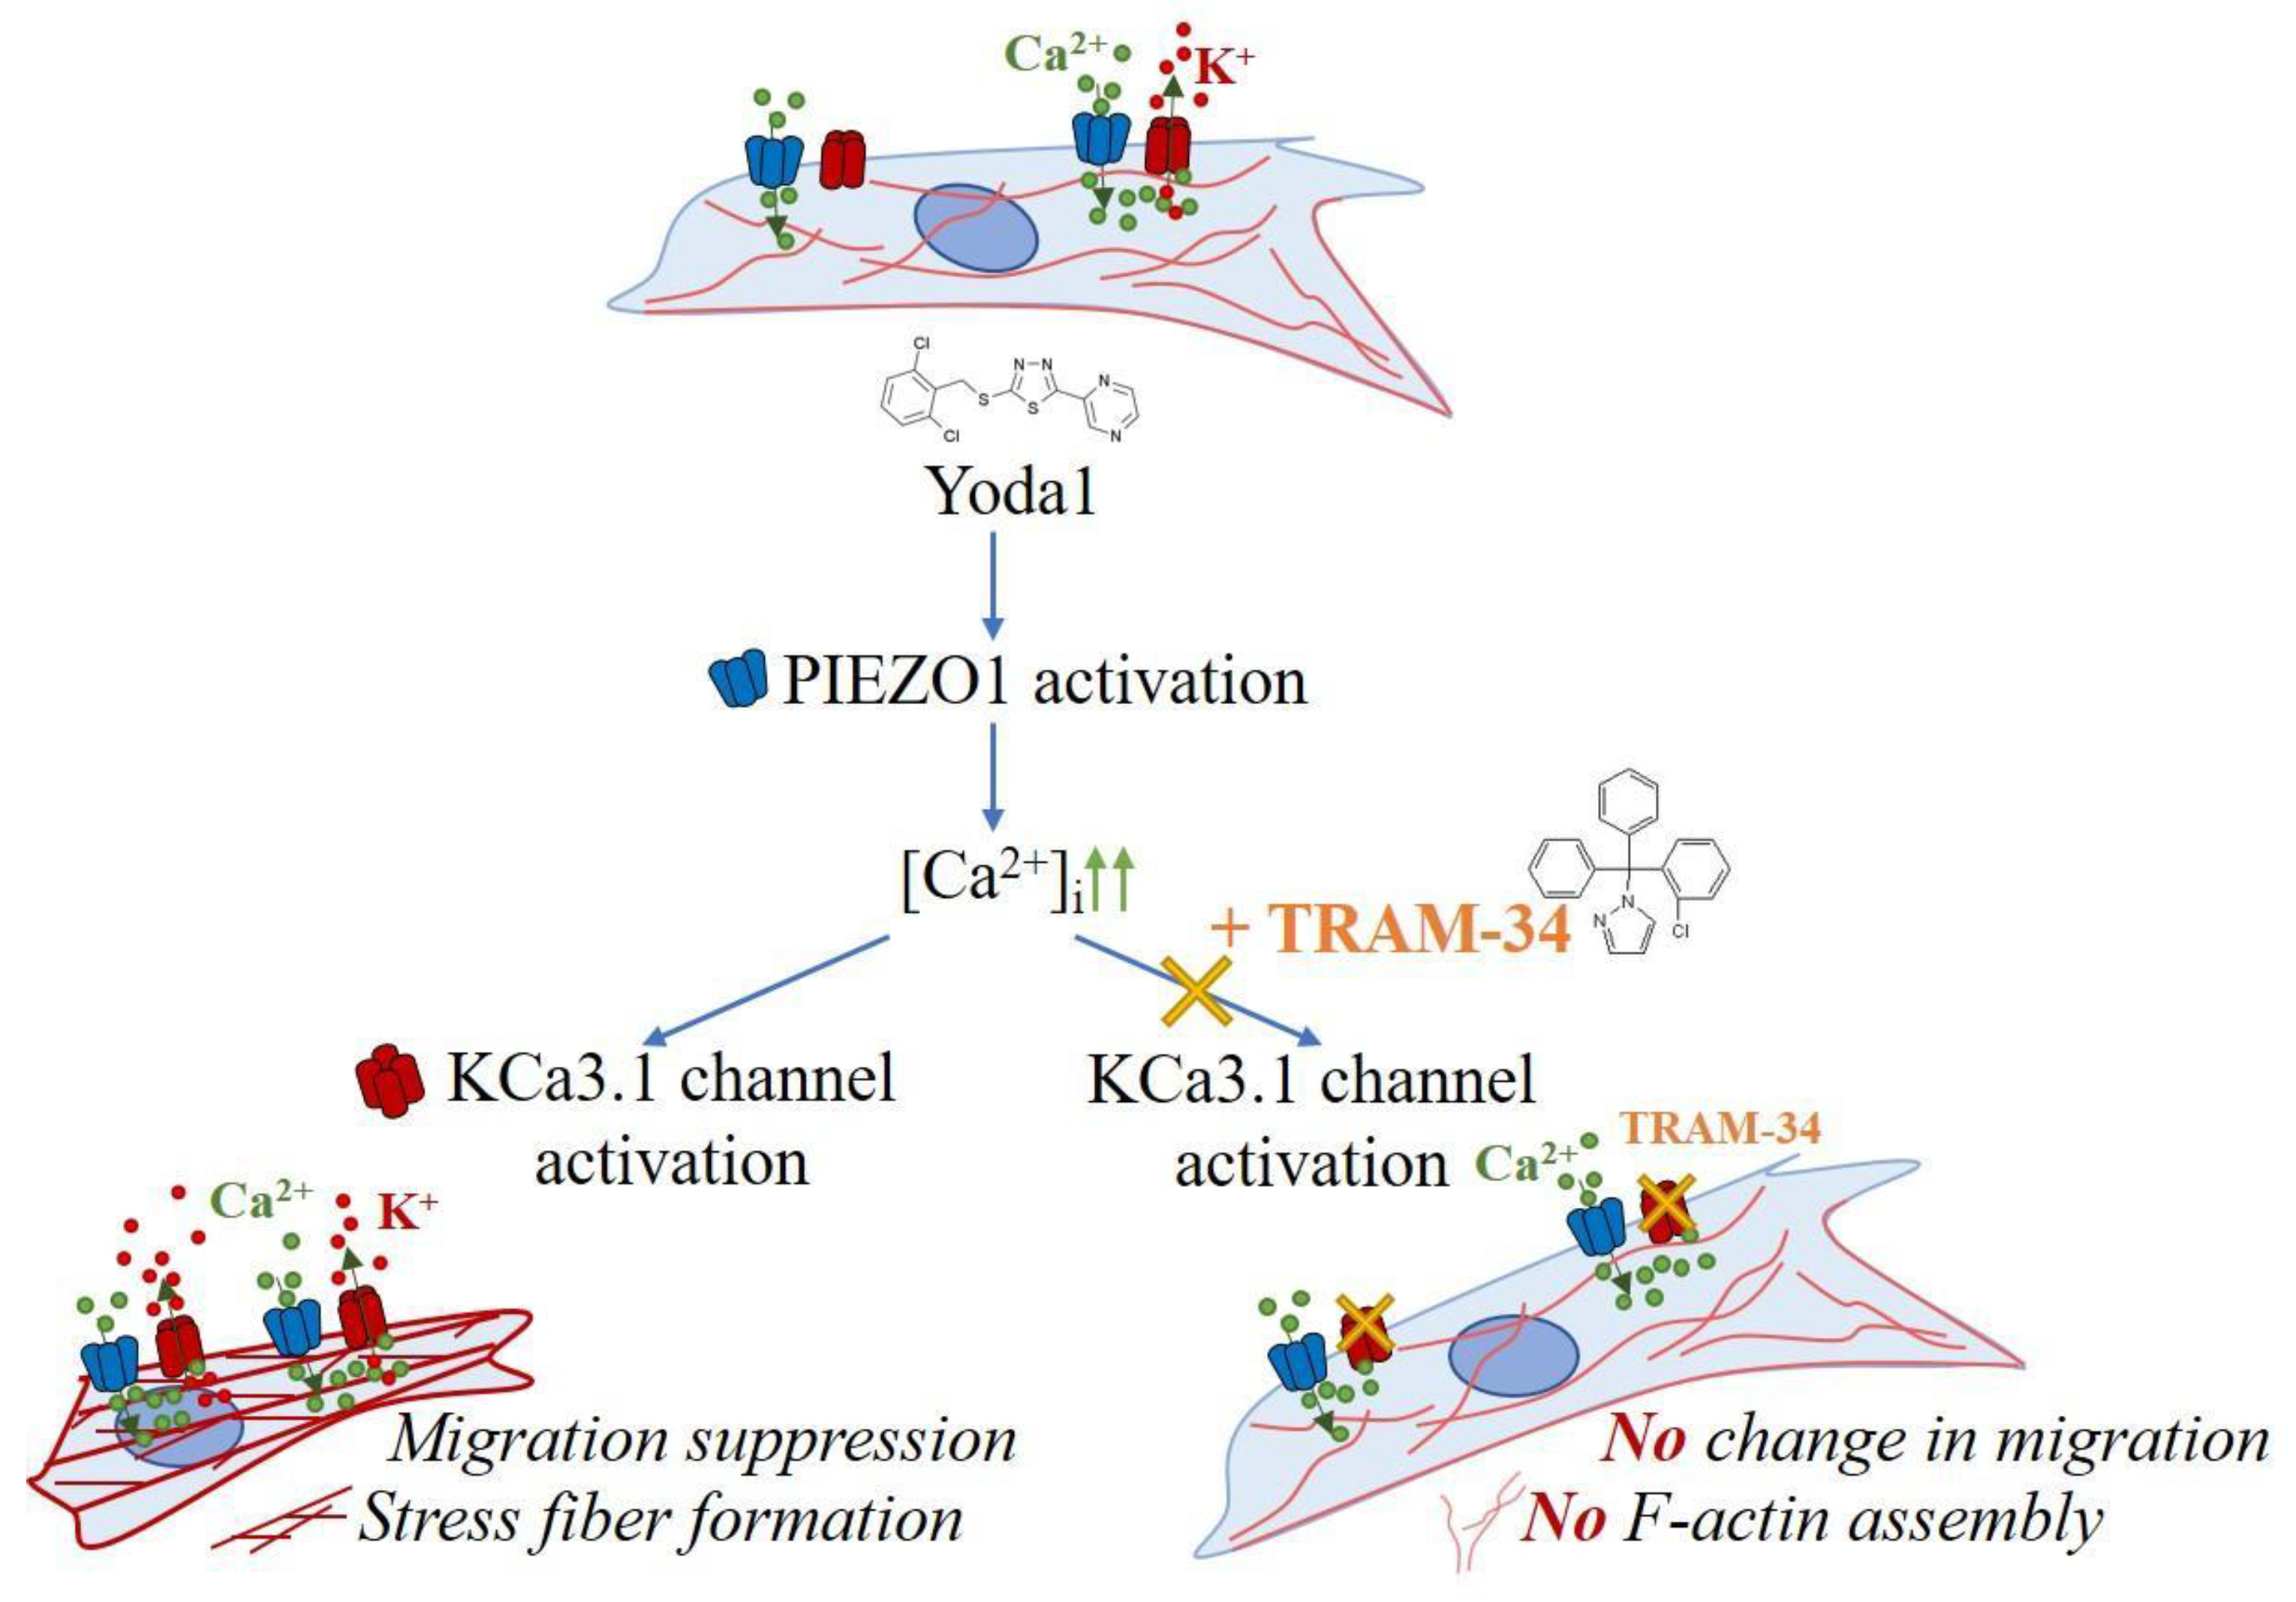
Our data clearly indicated that KCa3.1 channel activity underlies the suppression of transformed fibroblast migration and F-actin assembly caused by PIEZO1 activation by Yoda1 (Figure 4). Importantly, despite the differences in KCa3.1 staining pattern within cell population that indicate the variability in the level of KCa3.1 channel activity in the plasma membrane of 3T3B-SV40 cells, the abrogation of the effects of PIEZO1 activation by TRAM-34 is clearly observed. Also, the tight interconnection between PIEZO1 activity caused by Yoda1 and KCa3.1 activation is highlighted by the observation that TRAM-34 alone had no effect of 3T3B-SV40 cell migration. This implies that the proper function of the PIEZO1-KCa channel complex could be crucial for cell physiology. The importance of "correct" functioning of the PIEZO1-KCa3.1 complex was emphasized in the study of epidermal growth factor (EGF) mediated - macropinocytosis in A431 cells [5]. Particularly, it was shown that Yoda1-induced PIEZO1 activity leads to persistent KCa3.1 activation, which prevents actin rearrangement, induces the disruption of ruffle formation and the completion of macropinosome cup formation. Thus, chemical stimulation of PIEZO1 leads to inhibition of EGF-stimulated macropinocytosis, which contributes to a decrease in cancer cell viability. Another striking example of the finely regulated function of the PIEZO1-KCa3.1 channel complex is the adaptation of erythrocytes to constantly changing volumes. Dysregulation of this channel complex leads to disruptions in the osmoregulatory mechanisms of erythrocytes, which are the cause of several hemolytic diseases [31].
The specific molecular mechanisms that underlie the effects of PIEZO1-KCa3.1 channel activity and its impact on cell signaling remain to be elucidated. Particularly, KCa3.1 channel activation could result in the change of membrane potential and the increase of the driving force for Ca2+ thus acting as a “positive feedback loop” allowing more Ca2+ to enter the cell via PIEZO1 [32]. At the same time, the activation/inhibition or modulation of other downstream effectors or ion channels in 3T3B-SV40 cells by the changes in the plasma membrane potential could not be excluded. Another possibility is that the activation of KCa3.1 channels by Ca2+ influx via PIEZO1 could interfere with the processes of cell volume regulation that, in turn, affect cell motility and migration [33]. In conclusion, it should be noted that our data highlight the importance of precise functioning of the PIEZO1-KCa3.1 channel complex and demonstrate that KCa3.1 channel activity in the PIEZO1-KCa3.1 complex underlie the effects of cell motility inhibition and cytoskeleton reorganization induced by selective PIEZO1 activation in 3T3B-SV40 cells.
3. Materials and Methods
3.1. Cell Culture and Reagents
Transformed mouse 3T3B-SV40 fibroblasts (obtained from the shared research facility “Vertebrate Cell Culture Collection”, St. Petersburg, Russia, https://incras-ckp.ru/catalog/3t3b-sv40/) were cultured in DMEM medium (Biolot, St. Petersburg, Russia) containing 10% fetal bovine serum (Biowest, Nuaille, France) and 40 μg/ml antibiotic gentamicin in 5% CO2 at 37° C. Cells were seeded in culture dishes on 4*4 mm or 12*12 mm glass coverslips for patch-clamp and fluorescence analysis, respectively. Working solutions of selective PIEZO1 agonist Yoda1 (10 μM, Tocris, Bristol, UK) and selective blocker of KCa3.1 channels TRAM-34 (5 μM, Tocris, Bristol, UK) were prepared from 10 mM Yoda1 and 5 mM TRAM-34 stocks dissolved in DMSO. Selective SK blocker apamin (Santa Cruz Biotechnology, California, CA, USA) was dissolved in distilled water (to 100 μM stock) and was added at 200 nM final concentration to the patch pipette prior to patch-clamp experiments.
3.2. Patch-Clamp Experiments
The electrophysiology setup was based on the patch-clamp amplifier Axopatch 200B and analog-to-digital converter Axon Digidata 1550A (Molecular Devices LLC, San Jose, CA, USA), controlled by a personal computer with Axon PClamp 10.7 Software Suite (Molecular Devices LLC, San Jose, CA, USA) for data registration, processing, and analysis. Pipettes were pulled from borosilicate glass capillaries with filament (BF-150-86-10, Sutter Instruments, Novato, CA, USA); the resistance was ~5–10 MΩ when filled with a working solution. Single-channel recordings were detected using the cell-attached mode of the path-clamp technique. The cells were placed in the experimental chamber filled with a bath solution containing (in mM): 145 KCl, 1 MgCl2, 2 CaCl2, 10 Hepes/TrisOH to nullify resting membrane potential. The recording patch pipette was filled with an external standard working solution (in mM): 145 NaCl, 1 MgCl2, 2 CaCl2, 10 Hepes/TrisOH and 200 nM apamin. pH of all solutions was 7.2 - 7.3. For stimulation of the activity of mechanogated PIEZO1 channels, the classical method that is the application of “negative” pressure (suction, ΔP<0) through a patch pipette was applied. All experiments were performed at room temperature (RT, 22–23 °C). The single-channel conductance of KCa channels in each experiment was calculated from the slope of I-V relationship after linear approximation, and mean conductance value (± S.E.M.) was averaged from n=7 independent cell-attached experiments.
3.3. RT-PCR
The PCR primers were designed using the GeneRunner v5.0.59 software. The primer sequences used for hKCNN4: 5′-GGC CAA GCT TTA CAT GAA C-3′ (forward) and 3′-ATC ATG AAG TTG TGC ACG TG-5′ (reverse). The predicted amplicon size is 325 bp. PCR was performed in a volume of 15 µl using 10 ng of cDNA, 0.3 µM of each primer, 100 µM of each dNTP, 2.5 mM MgCl2, 1X CoralLoad PCR buffer and 1 unit Hot-Taq polymerase (Qiagen, Maryland, USA). The PCR cycling conditions were 9 min 30s at 94 °C; 35 cycles of 30s at 94 °C, 30s at 55 and 57 °C, and 30s at 72 °C; 5 min at 72 °C; 10 °C in the end for storage. 10 µl of the PCR reaction was subjected to electrophoresis on a 6% polyacrylamide gel, then was stained with DNA-binding dye Gel Red (1:10000, Biotium, Fremont, CA, USA). The visualization of reaction was performed by UV fluorescence in the E-Gel Imager System (Thermo Fisher Scientific, Waltham, MA, USA).
3.4. Wound Healing Migration Assay
For wound healing assay the cells were trypsinized, resuspended in fresh medium and placed to each well of 3-well culture silicon inserts (Ibidi, Germany) pre-installed to culture dishes at concentration of 30.000 cells per well. Then, the cells were incubated for 6-7 h to allow spreading and monolayer formation. After the gentle removal of culture inserts, the experimental cell-free wounds (starting points at 0 h) were photographed on the stage of inverted microscope with 10✕ objective and CCD camera. Then, the following reagents: DMSO (control, 0,2%), 10 µM Yoda1, 5 µM TRAM-34, and 10 µM Yoda1 + 5 µM TRAM-34 were added to the cells. As a control, DMSO (0.2% DMSO) was added to the culture medium. After 18 h of incubation the same wounds were photographed and analysed. Particularly, the wounds captured before the addition of the reagents and after 18 h of treatment were outlined in the ImageJ software (NIH, Bethesda, MD, USA) using the “freehand selection” tool, and then the area of the wounds was determined using the “Measure - Area” command. A minimum of n=33 wounds were analyzed for each experimental condition. The results are presented as the mean (± S.D) remaining (after 18 h) percentage of the initial wound size.
3.5. Immunofluorescence
For immunofluorescent staining specific primary antibodies against KCa3.1 channels (anti-KCa3.1, Cat. No GB114347, ServiceBio, Hubei, China) were used. Cells were fixed in 4% paraformaldehyde for 10 min at RT, then the cells were permeabilized with 0.25% Tween-20 (10 min, RT). Nonspecific binding of the antibodies was blocked by incubating the samples in phosphate-buffered saline (PBS) containing 10% goat serum (1 hour, RT). Then, the cells were incubated with the primary antibodies at 1:100 dilution overnight at +4 °C. Staining with fluorescently labeled secondary antibodies (1:200, Goat anti-rabbit conjugated to Cy3, Santa Cruz, USA) for 40 min at RT in the dark was performed for fluorescent detection of KCa3.1 channels. Cell nuclei were counterstained with 4′,6-diamidino-2-phenylindole (DAPI, Sigma-Aldrich, St. Louis, MO, USA, 0.05 μg/ml, 30 min at RT). Then the cells were mounted on glass slides using Vectashield mounting medium (Vector Laboratories, USA). Between all staining steps cells were washed 2-3 times with PBS. The specificity of the staining was confirmed by eliminating the primary antibodies followed by incubation of the cells only with secondary fluorescent antibodies (fluorescent signal was not observed under these conditions, see Figure S2). Visualization of the fluorescently labeled preparations were performed on Olympus FV3000 (Olympus, Shinjuku, Tokyo, Japan) confocal microscope with 40x oil immersion objective using excitation at 405 (DAPI) and 561 (Cy3) nm. Images were analyzed and processed in ImageJ software.
3.6. F-actin Labeling
Cells were incubated in the presence of 10 µM Yoda or combination of 10 µM Yoda1 + 5 µM TRAM-34 for 18 h before actin labeling. F-actin staining with rhodamine-phalloidin (TRITC-phalloidin, Sigma-Aldrich, USA) was performed as previously described [10]. Particularly, F-actin was stained with using a standard procedure. The cells were fixed in 4% paraformaldehyde (10 min, RT) followed by permeabilization with 0.1% Triton X-100 for 8 min. After each step the cells were washed 2-3 times with PBS 1x. Then, the cells were incubated with 2 µM TRITC-phalloidin at 37° C for 15 min, mounted on glass slides using a Vectashield mounting medium and visualized with Olympus FV3000 using a 40x oil objective and excitation wavelength of 561 nm. Acquisition parameters were kept constant during the experiments for correct comparison of cell fluorescence. Fluorescent images were processed with ImageJ. Cell cytoskeletons were outlined using the “Freehand selection tool”, and then fluorescence intensity was quantified and averaged for at least 25 cells in each experiment. The results are presented as the mean fluorescent intensities ± S.D.
3.7. Statistical Analysis
The statistical analysis was performed in the GraphPad Prism 8.0 program (GraphPad Software, USA). Before the statistical procedures, the data was tested for normality (Shapiro-Wilk’s test) and the absence of the outliers (ROUT). The comparisons of experimental wound areas (to control) were performed using Mann-Whitney test, and F-actin fluorescence intensities were compared with the corresponding control values using Student’s t-test, p<0.05 was considered as significant.
Supplementary Materials
The following supporting information can be downloaded at: https://www.mdpi.com/article/doi/s1, Figure S1: Representative whole-cell recordings demonstrating the presence of KCa3.1-mediated currents channels in the plasma membrane of 3T3B-SV40 cells. Figure S2: Specificity of used antibodies against KCa3.1 channels. Figure S3: No effect of apamin, selective SK channel inhibitor, on Yoda1-induced suppression of transformed fibroblast migration. Figure S4: No effect of KCa3.1 inhibitor TRAM-34 on transformed fibroblast migration.
Author Contributions
V.Y.V.: data curation; formal analysis; investigation; validation; visualization; writing—original draft; writing—review and editing. V.I.C.-N.: conceptualization; data curation; formal analysis; funding acquisition; investigation; methodology; project administration; resources; supervision; validation; visualization; writing—original draft; writing—review and editing. All authors have read and agreed to the published version of the manuscript.
Funding
This research was funded by the Russian Science Foundation, grant number: 22-74-10037-П (to C.-N. V.I.).
Institutional Review Board Statement
Not applicable.
Informed Consent Statement
Not applicable.
Data Availability Statement
The original contributions presented in this study are included in the article/supplementary material. Further inquiries can be directed to the corresponding authors.
Conflicts of Interest
The authors declare no conflicts of interest.
References
- Xu, Y.; Wang, Y.; Yang, Y.; Fang, X.; Wu, L.; Hu, J.; Li, J.; Mei, S. Piezo1: the key regulators in central nervous system diseases. Frontiers in cellular neuroscience. 2024, 18, 1441806. [Google Scholar] [CrossRef] [PubMed]
- Lei, L.; Wen, Z.; Cao, M.; Zhang, H.; Ling, SKK.; Fu, BSC.; Qin, L.; Xu, J.; Yung, PSH. The emerging role of Piezo1 in the musculoskeletal system and disease. Theranostics 2024, 14, 3963–3983. Available online: https://www.thno.org/v14p3963.htm. [CrossRef]
- Xiong, H.; Yang, J.; Guo, J.; Ma, A.; Wang, B.; Kang, Y. Mechanosensitive Piezo channels mediate the physiological and pathophysiological changes in the respiratory system. Respiratory research 2022, 23, 196. [Google Scholar] [CrossRef]
- Xiao, B. Mechanisms of mechanotransduction and physiological roles of PIEZO channels. Nature reviews. Molecular cell biology 2024, 25, 886–903. [Google Scholar] [CrossRef]
- Kuriyama, M.; Hirose, H.; Masuda, T.; Shudou, M.; Arafiles, J.V.V.; Imanishi, M.; Maekawa, M.; Hara, Y.; Futaki, S. Piezo1 activation using Yoda1 inhibits macropinocytosis in A431 human epidermoid carcinoma cells. Scientific reports 2022, 12, 6322. [Google Scholar] [CrossRef]
- Yang, X.; Zeng, H.; Wang, L.; Luo, S.; Zhou, Y. Activation of Piezo1 downregulates renin in juxtaglomerular cells and contributes to blood pressure homeostasis. Cell Biosci. 2022, 12, 197. [Google Scholar] [CrossRef]
- Lei, M.; Wang, W.; Zhang, H.; Gong, J.; Wang, Z.; Cai, H.; Yang, X.; Wang, S.; Ma, C. Cell-cell and cell-matrix adhesion regulated by Piezo1 is critical for stiffness-dependent DRG neuron aggregation. Cell reports 2023, 42, 113522. [Google Scholar] [CrossRef]
- Tsuchiya, M.; Hara, Y.; Okuda, M.; Itoh, K.; Nishioka, R.; Shiomi, A.; Nagao, K.; Mori, M.; Mori, Y.; Ikenouchi, J.; Suzuki, R.; Tanaka, M.; Ohwada, T.; et al. Cell surface flip-flop of phosphatidylserine is critical for PIEZO1-mediated myotube formation. Nature communications 2018, 9, 2049. [Google Scholar] [CrossRef]
- Vasileva, V.Y.; Sudarikova, A.V.; Chubinskiy-Nadezhdin, V.I. Functional coupling of Piezo1 channels and Ca2+-activated ion channels in the plasma membrane: fine-tunable interplay with wide-range signaling effects. American journal of physiology. Cell physiology 2025, 328, C1338–C1345. [Google Scholar] [CrossRef]
- Chubinskiy-Nadezhdin, V.I.; Negulyaev, Y.A.; Morachevskaya, E.A. Functional coupling of ion channels in cellular mechanotransduction. Biochemical and biophysical research communications 2014, 451, 421–424. [Google Scholar] [CrossRef]
- Chubinskiy-Nadezhdin, V.I.; Vasileva, V.Y.; Vassilieva, I.O.; Sudarikova, A.V.; Morachevskaya, E.A.; Negulyaev, Y.A. Agonist-induced Piezo1 activation suppresses migration of transformed fibroblasts. Biochemical and biophysical research communications 2019, 514, 173–179. [Google Scholar] [CrossRef]
- Grissmer, S.; Nguyen, A.N.; Cahalan, M.D. Calcium-activated potassium channels in resting and activated human T lymphocytes. Expression levels, calcium dependence, ion selectivity, and pharmacology. J Gen Physiol. 1993, 102, 601–630. [Google Scholar] [CrossRef]
- Wulff, H.; Kolski-Andreaco, A.; Sankaranarayanan, A.; Sabatier, J.M.; Shakkottai, V. Modulators of small- and intermediate-conductance calcium-activated potassium channels and their therapeutic indications. Current medicinal chemistry 2007, 14, 1437–1457. [Google Scholar] [CrossRef]
- Urrego, D.; Tomczak, A.P.; Zahed, F.; Stühmer, W.; Pardo, L.A. Potassium channels in cell cycle and cell proliferation. Philos Trans R Soc Lond B Biol Sci. 2014, 369, 20130094. [Google Scholar] [CrossRef]
- Ouadid-Ahidouch, H.; Ahidouch, A. K(+) channels and cell cycle progression in tumor cells. Front Physiol. 2013, 4, 220. [Google Scholar] [CrossRef]
- Catacuzzeno, L.; Fioretti, B.; Franciolini, F. Expression and Role of the Intermediate-Conductance Calcium-Activated Potassium Channel KCa3.1 in Glioblastoma. Journal of signal transduction 2012, 421564. [Google Scholar] [CrossRef]
- Carrisoza-Gaytan, R.; Mutchler, S.M.; Carattino, F.; Soong, J.; Dalghi, M.G.; Wu, P.; Wang, W.; Apodaca, G.; Satlin, L.M.; Kleyman, T.R. PIEZO1 is a distal nephron mechanosensor and is required for flow-induced K+ secretion. The Journal of clinical investigation 2024, 134, e174806. [Google Scholar] [CrossRef]
- Catacuzzeno, L.; Michelucci, A. Emerging connections between Piezo1 and BK channels in vascular smooth muscle cells. In European journal of physiology; Pflugers Archiv, 2024; Volume 476, pp. 1475–1477. [Google Scholar] [CrossRef]
- Jakob, D.; Klesen, A.; Allegrini, B.; Darkow, E.; Aria, D.; Emig, R.; Chica, A.S.; Rog-Zielinska, E.A.; Guth, T.; Beyersdorf, F.; Kari, F.A.; Proksch, S.; Hatem, S.N.; Karck, M.; Künzel, S.R.; Guizouarn, H.; Schmidt, C.; Kohl, P.; Ravens, U.; Peyronnet, R. Piezo1 and BKCa channels in human atrial fibroblasts: Interplay and remodelling in atrial fibrillation. Journal of molecular and cellular cardiology 2021, 158, 49–62. [Google Scholar] [CrossRef]
- Chubinskiy-Nadezhdin, V.I.; Vasileva, V.Y.; Pugovkina, N.A.; Vassilieva, I.O.; Morachevskaya, E.A.; Nikolsky, N.N.; Negulyaev, Y.A. Local calcium signalling is mediated by mechanosensitive ion channels in mesenchymal stem cells. Biochemical and biophysical research communications 2017, 482, 563–568. [Google Scholar] [CrossRef] [PubMed]
- Rossi, A.M.; Hirschhorn, R.R. Expression of growth-regulated genes in normal and SV40 transformed hamster fibroblasts. J Cell Biochem. 1991, 47, 165–173. [Google Scholar] [CrossRef]
- Chubinskiy-Nadezhdin, V.I.; Efremova, T.N.; Negulyaev, Y.A.; Morachevskaya, E.A. Coupled Activation of Mechanosensitive and Calcium-Dependent Potassium Channels in 3T3 and 3T3-SV40 Cells. Cell Tiss. Biol. 2018, 12, 231–237. [Google Scholar] [CrossRef]
- Petkova-Kirova, P.; Murciano, N.; Iacono, G.; Jansen, J.; Simionato, G.; Qiao, M.; Van der Zwaan, C.; Rotordam, M.G.; John, T.; Hertz, L.; Hoogendijk, A.J.; Becker, N.; Wagner, C.; Von Lindern, M.; Egee, S.; Van den Akker, E.; Kaestner, L. The Gárdos Channel and Piezo1 Revisited: Comparison between Reticulocytes and Mature Red Blood Cells. International journal of molecular sciences 2024, 25, 1416. [Google Scholar] [CrossRef]
- Michelucci, A.; Sforna, L.; Di Battista, A.; Franciolini, F.; Catacuzzeno, L. Ca2+ -activated K+ channels regulate cell volume in human glioblastoma cells. Journal of cellular physiology 2023, 238, 2120–2134. [Google Scholar] [CrossRef] [PubMed]
- Mulhall, E.M.; Gharpure, A.; Lee, R.M.; Dubin, A.E.; Aaron, J.S.; Marshall, K.L.; Spencer, K.R.; Reiche, M.A.; Henderson, S.C.; Chew, T.L.; Patapoutian, A. Direct observation of the conformational states of PIEZO1. Nature 2023, 620, 1117–1125. [Google Scholar] [CrossRef] [PubMed]
- Jetta, D.; Shireen, T.; Hua, S.Z. Epithelial cells sense local stiffness via Piezo1 mediated cytoskeletal reorganization. Frontiers in cell and developmental biology 2023, 11, 1198109. [Google Scholar] [CrossRef]
- Atcha, H.; Jairaman, A.; Holt, J.R.; Meli, V.S.; Nagalla, R.R.; Veerasubramanian, P.K.; Brumm, K.T.; Lim, H.E.; Othy, S.; Cahalan, M.D.; Pathak, M.M.; Liu, W.F. Mechanically activated ion channel Piezo1 modulates macrophage polarization and stiffness sensing. Nat Commun. 2021, 12, 3256. [Google Scholar] [CrossRef]
- Roach, K.M.; Bradding, P. Ca2+ signalling in fibroblasts and the therapeutic potential of KCa3.1 channel blockers in fibrotic diseases. British journal of pharmacology 2020, 177, 1003–1024. [Google Scholar] [CrossRef] [PubMed]
- Bonito, B.; Sauter, D.R.P.; Schwab, A.; Djamgoz, M.B.; Novak, I. KCa3.1 (IK) modulates pancreatic cancer cell migration, invasion and proliferation: anomalous effects on TRAM-34. Pflugers Arch - Eur J Physiol. 2016, 468, 1865–1875. [Google Scholar] [CrossRef]
- Cruse, G.; Singh, S.R.; Duffy, S.M.; Doe, C.; Saunders, R.; Brightling, C.E.; Bradding, P. Functional KCa3.1 K+ channels are required for human fibrocyte migration. The Journal of allergy and clinical immunology 2011, 128, 1303–1309.e2. [Google Scholar] [CrossRef]
- Rapetti-Mauss, R.; Picard, V.; Guitton, C.; Ghazal, K.; Proulle, V.; Badens, C.; Soriani, O.; Garçon, L.; Guizouarn, H. Red blood cell Gardos channel (KCNN4): the essential determinant of erythrocyte dehydration in hereditary xerocytosis. Haematologica 2017, 102, e415–e418. [Google Scholar] [CrossRef]
- Guéguinou, M.; Chantôme, A.; Fromont, G.; Bougnoux, P.; Vandier, C.; Potier-Cartereau, M. KCa and Ca(2+) channels: the complex thought. Biochim Biophys Acta. 2014, 1843, 2322–2333. [Google Scholar] [CrossRef] [PubMed]
- Morishita, K.; Watanabe, K.; Ichijo, H. Cell volume regulation in cancer cell migration driven by osmotic water flow. Cancer Sci. 2019, 110, 2337–2347. [Google Scholar] [CrossRef] [PubMed]
Figure 1.
Ca2+-activated intermediate-conductance (KCa3.1) potassium channels are the molecular correlates of KCa channels coupled with PIEZO1 activity. a - Representative single channel cell-attached recording (from n=7 independent experiments where channel coupling was observed) showing that PIEZO1-KCa channel coupled activation remained in the presence of 200 nM apamin, a selective blocker of SK channels, in the patch pipette. Stretch-induced PIEZO1 activation (inward currents) are followed by outward currents that reflect KCa channel activity. Holding membrane potential is -20 mV. The zero current (closed state, no channel activity) is indicated by black dashed line. The single-channel amplitude of the KCa channel is indicated by a red dashed line. Note that KCa channels remain active for about >20 s after the removal of mechanical stimuli (followed by PIEZO1 deactivation). b -The presence of KCNN4 mRNA in 3T3B-SV40 cells. The amplicon size is 325 bp. The annealing temperature of the amplicon was 55 °C. c - Immunofluorescent staining of the cells with specific antibodies against KCa3.1 proteins (anti-KCa3.1, red channel). The specificity of the staining was confirmed in control experiments (Figure S2). Cell nuclei were counterstained with DAPI (blue channel) Note the differences in the staining patterns in cell population: the presence of KCa3.1-low or negatively stained cells could be seen. The scale bar is 30 μm.
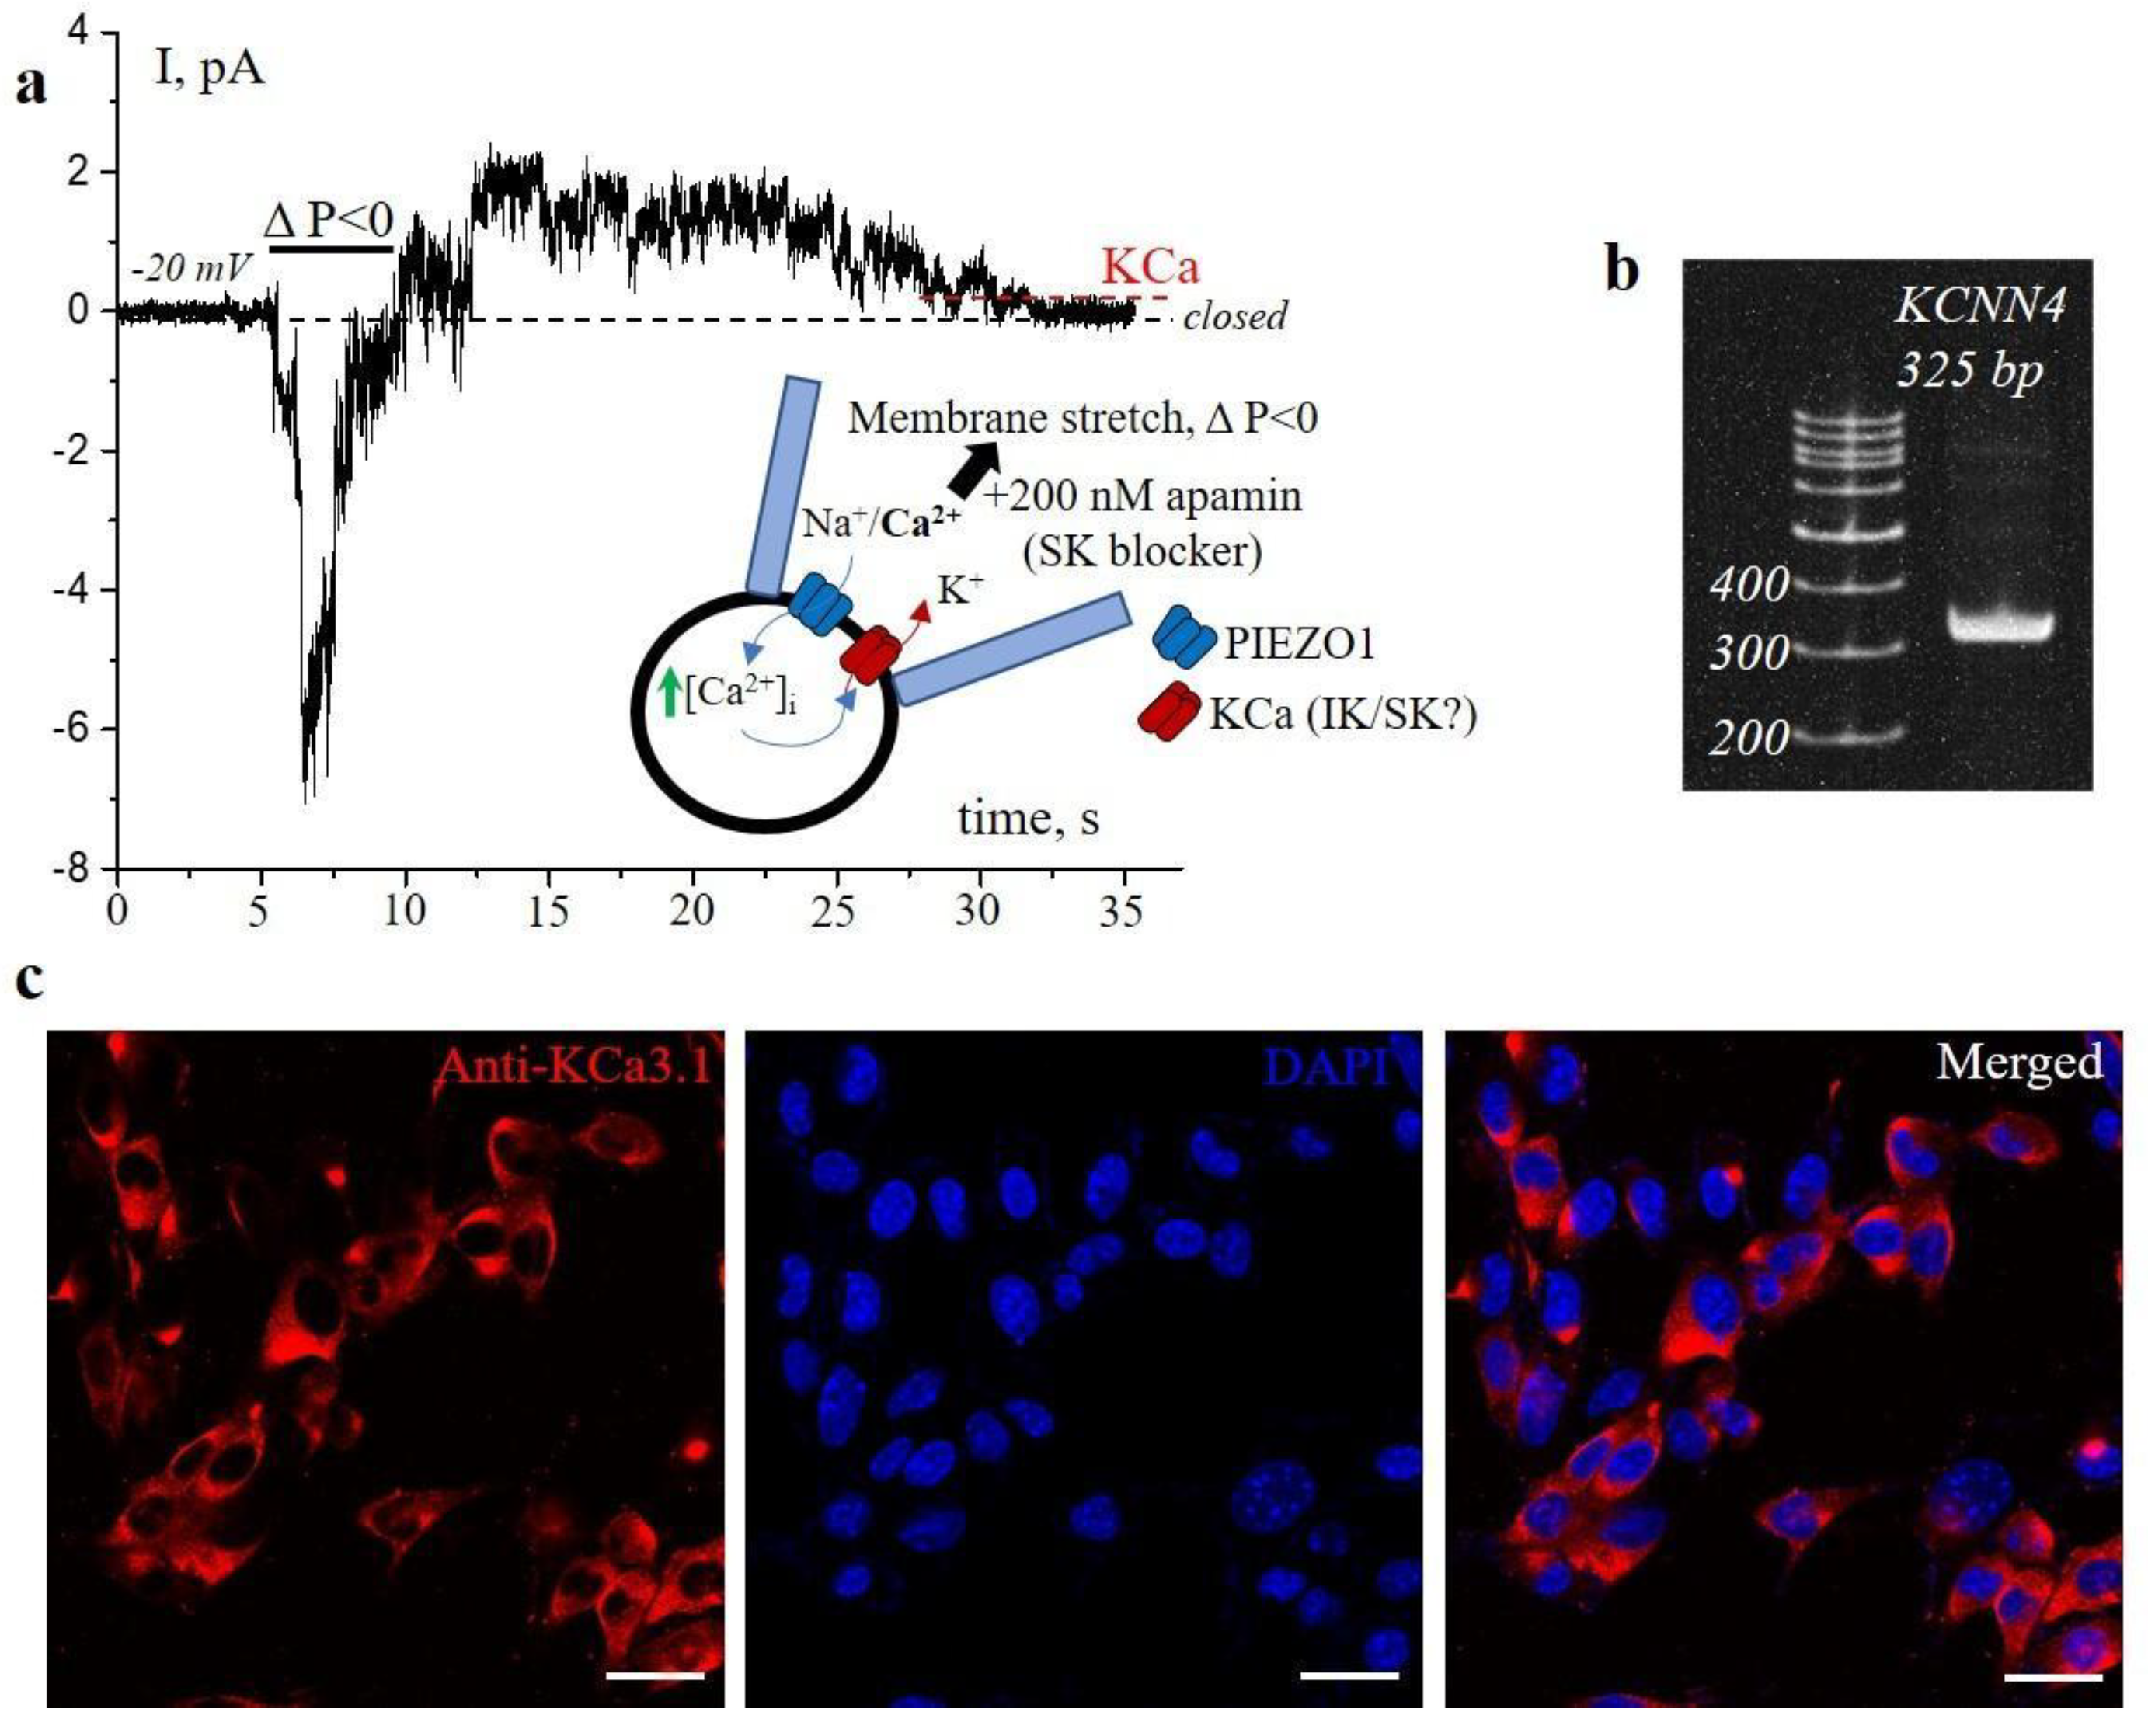
Figure 2.
Selective KCa3.1 channel inhibitor TRAM-34 abolishes Yoda1-induced suppression of transformed fibroblast migration. Representative images demonstrating the abolition of the migration inhibition (that is observed in the presence of selective activator of PIEZO1 - 10 μM Yoda1) in the presence of Yoda1 together with selective KCa3.1 channel blocker, TRAM-34 (5 μM), in the culture medium. The scale bar is 200 μm. The bar graph shows the quantitative calculation of the remaining wound sizes (in % from the initial sizes at 0 h) in each experimental condition after 18 h from the start of the experiment. Yoda1 significantly inhibits 3T3B-SV40 migration. No significant differences between control conditions and the presence of compound combination (10 μM Yoda1 and 5 μM TRAM-34) were detected. The data are presented as mean ± S.D. n - the number of wounds for each experimental condition. ns - non significant, ***p<0.001.
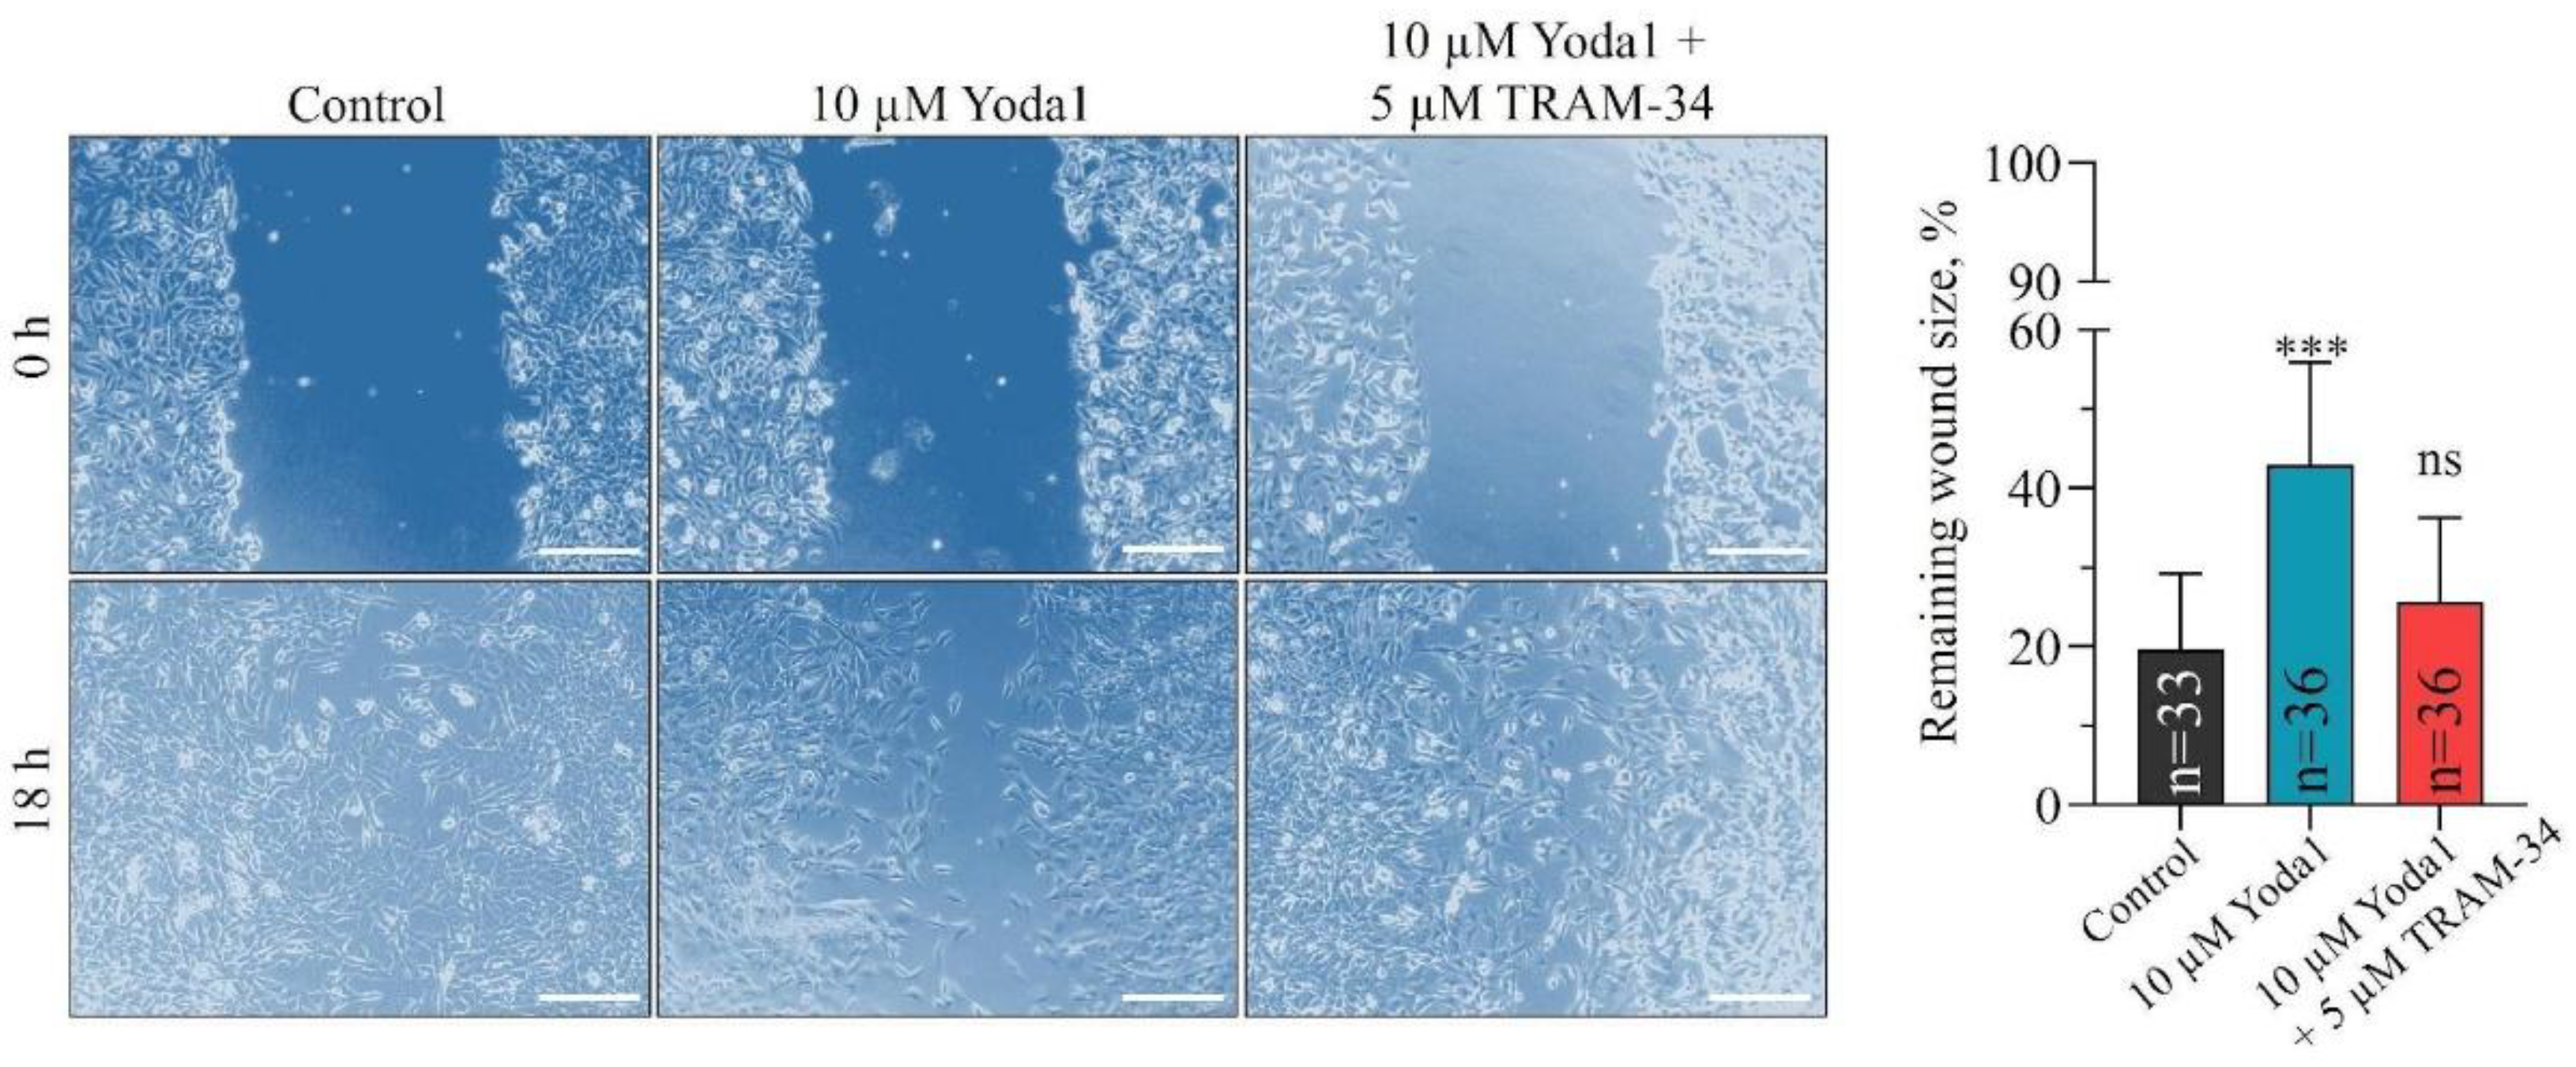
Figure 3.
TRAM-34 prevented F-actin assembly and stress fiber formation induced by Yoda1 in 3T3B-SV40 cells. Images of F-actin labeling in control, in the presence of Yoda1 (10 μM) or combination of Yoda1 (10 μM) + TRAM-34 (5 μM). The scale bar is 30 μm. The addition of TRAM-34 to Yoda1-containing culture medium prevented F-actin assembly induced by Yoda1 alone. The quantification of F-actin fluorescence intensities (arbitrary units, a.u.) demonstrates the absence of significant differences between control and Yoda1 + TRAM-34 conditions. The data are presented as mean ± S.D. ****p<0.0001.
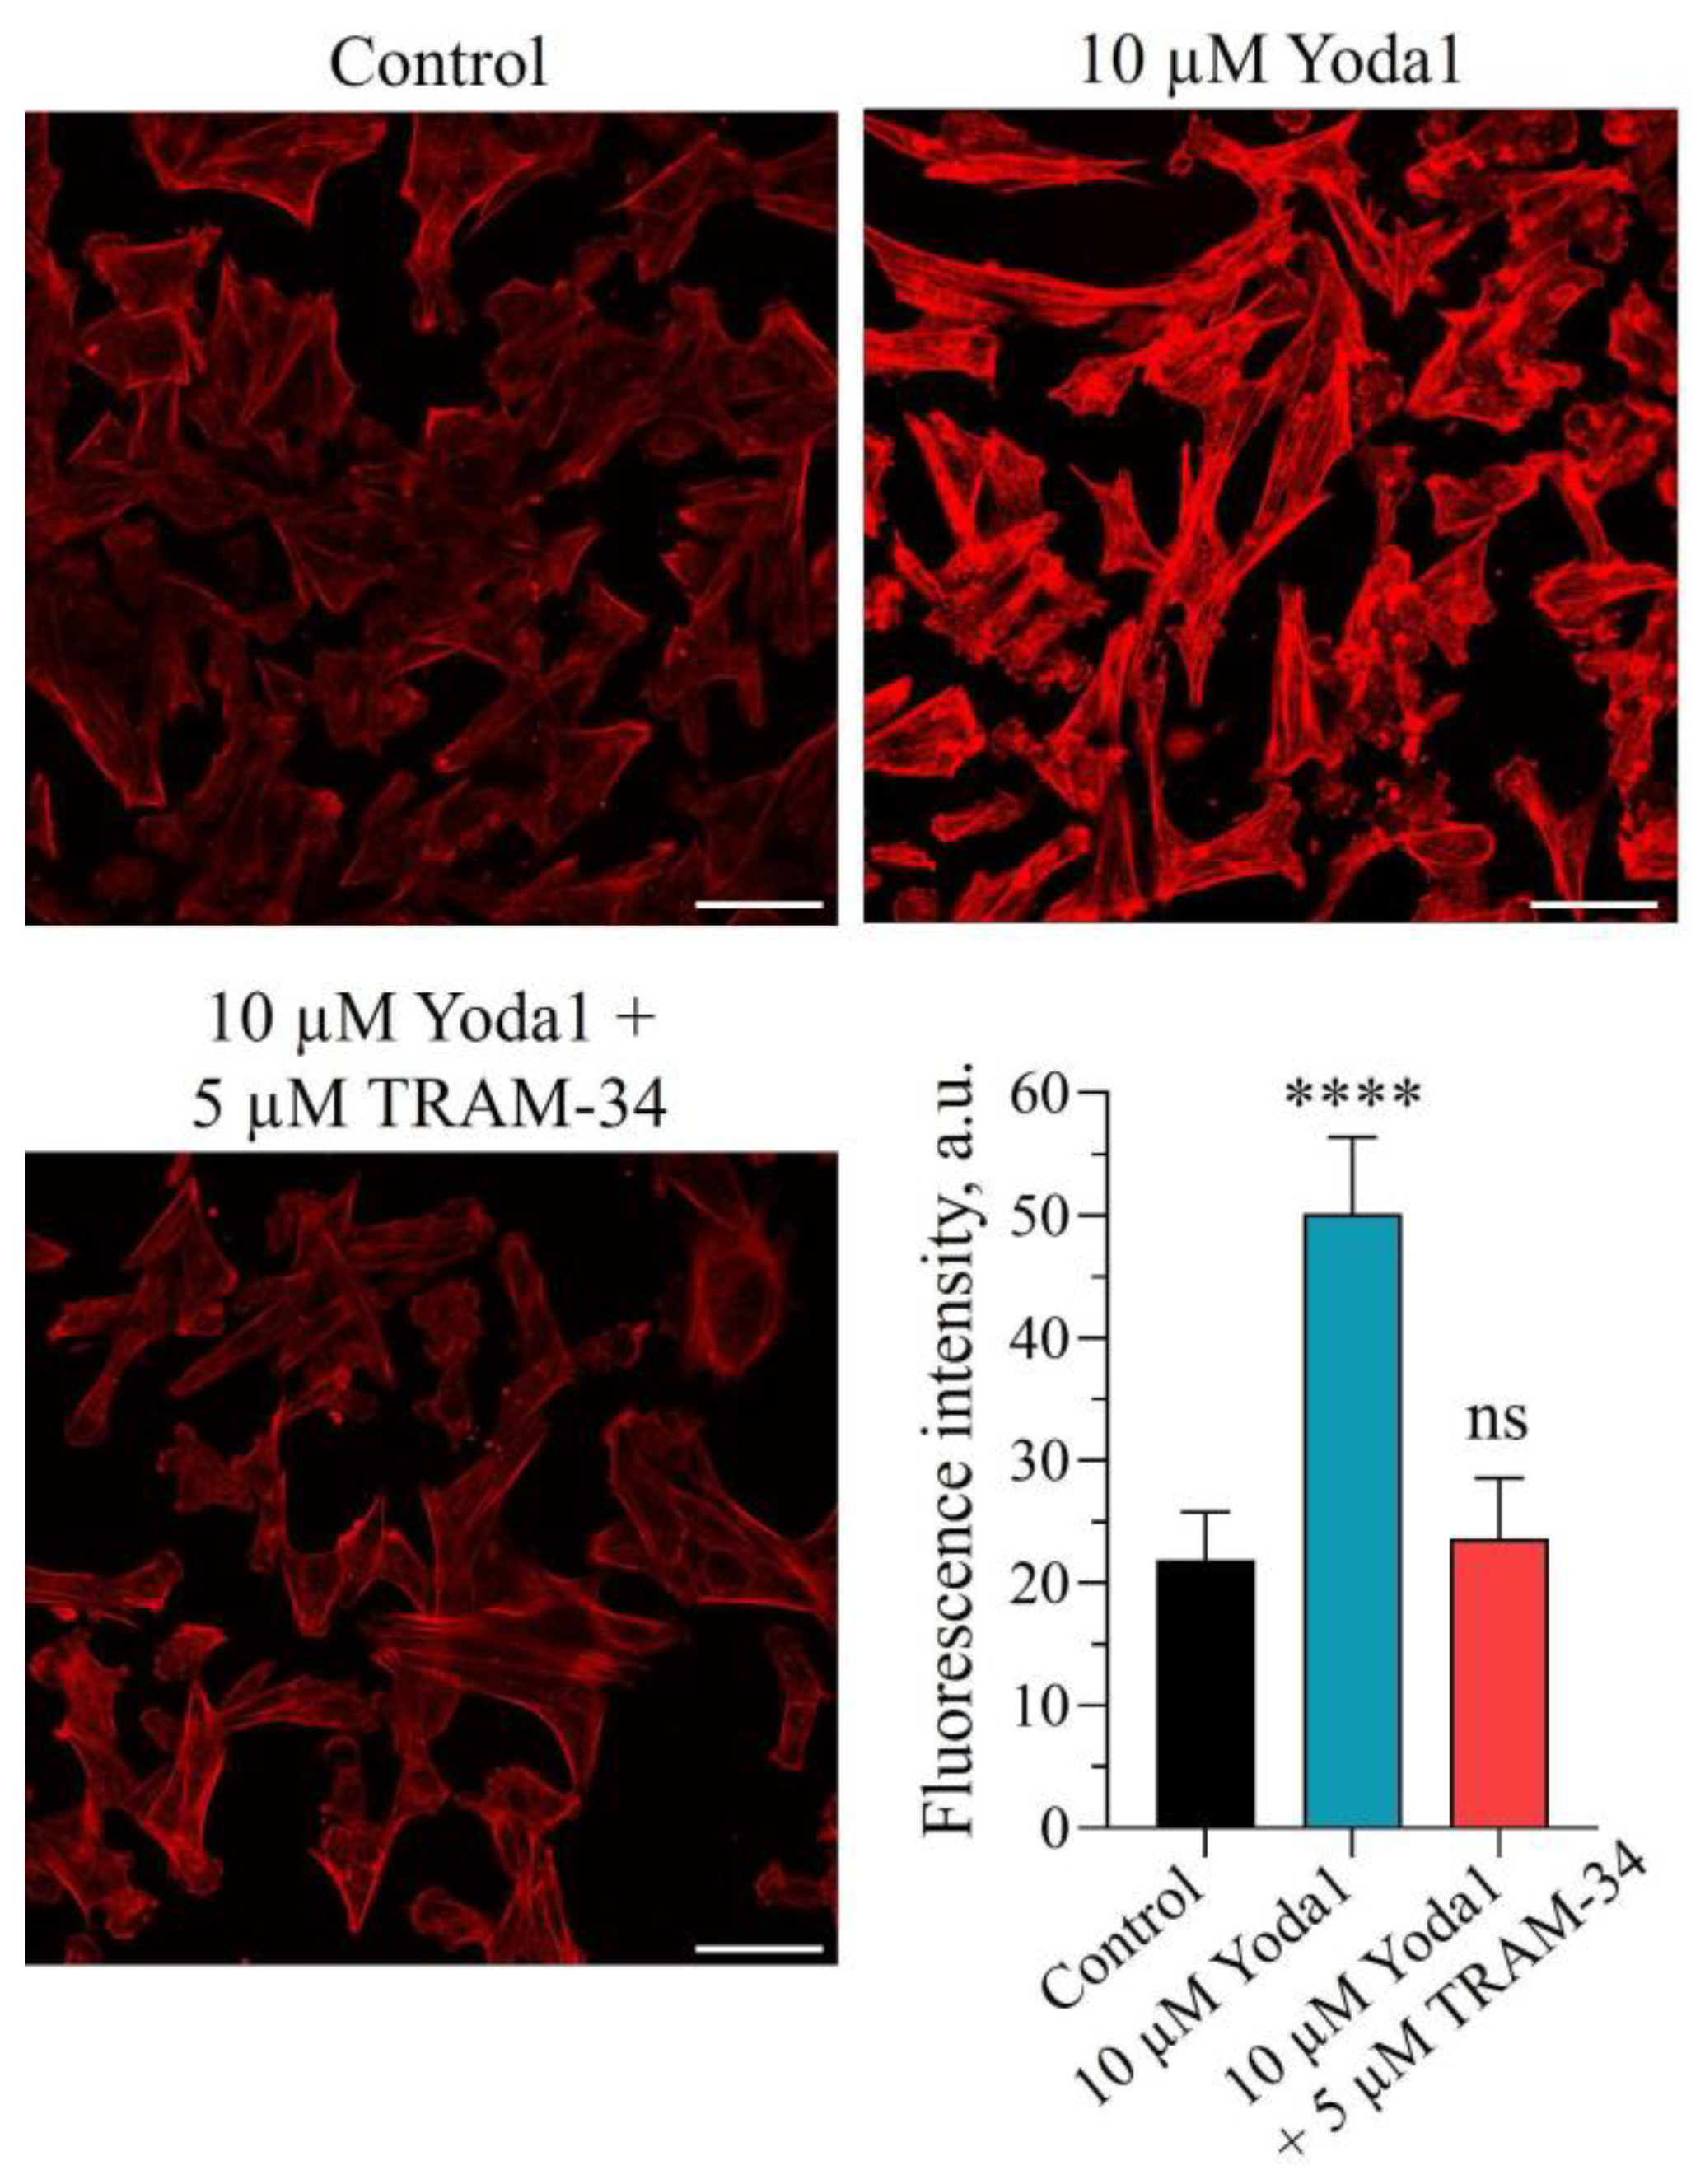
Figure 4.
KCa3.1 activity underlies inhibition of cell migration and F-actin assembly caused by selective PIEZO1 activation in transformed mouse fibroblasts.
Figure 4.
KCa3.1 activity underlies inhibition of cell migration and F-actin assembly caused by selective PIEZO1 activation in transformed mouse fibroblasts.
Disclaimer/Publisher’s Note: The statements, opinions and data contained in all publications are solely those of the individual author(s) and contributor(s) and not of MDPI and/or the editor(s). MDPI and/or the editor(s) disclaim responsibility for any injury to people or property resulting from any ideas, methods, instructions or products referred to in the content. |
© 2026 by the authors. Licensee MDPI, Basel, Switzerland. This article is an open access article distributed under the terms and conditions of the Creative Commons Attribution (CC BY) license (http://creativecommons.org/licenses/by/4.0/).
Copyright: This open access article is published under a Creative Commons CC BY 4.0 license, which permit the free download, distribution, and reuse, provided that the author and preprint are cited in any reuse.


