
Submitted:
28 January 2025
Posted:
03 February 2025
You are already at the latest version
Abstract
Three-dimensional (3D) spheroids of mesenchymal stem cells (MSCs) have high biological significance due to more accurate imitation of physiological conditions, in vivo processes and greater therapeutic efficiency compared to monolayer MSCs. However, molecular processes and specific mechanisms regulating the effectiveness of spheroids remain unknown. Endometrial MSCs are considered as reliable and potent objects for stem cell-based therapy due to availability and minor ethical concerns. Thus, knowledge of the molecular mechanisms controlling eMSC processes is of clinical importance. Regulation of a number of important physiological processes in MSCs is associated with the functioning of Ca2+-permeable mechanosensitive Piezo1 channels. It has been shown that Piezo1 is a key determinant in the regulation of intracellular Ca2+, which controls the migratory activity of 2D eMSCs. We aimed to determine the presence and functions of Piezo1 in eMSC spheroids. We detected that Piezo1 mRNA expression was lower in spheroids compared to 2D culture. Also, we observed the decrease in spheroid spreading rate in the presence of a selective Piezo1 agonist, Yoda1, during spheroid spreading or formation. The selective activation of Piezo1 could be used for the modulation of spheroid spreading rates which could be favorable for some strategies in development of spheroid-based cell therapies.
Keywords:
Piezo1
; mechanosensitive channels
; mesenchymal stem cells
; cell spheroids
; Yoda1
; calcium signaling
; cell migration
1. Introduction
Three-dimensional (3D) cultivation of mesenchymal stem cells (MSCs) as spheroids allows more accurate imitation of complex cell-cell and cell-extracellular matrix interactions that occur in vivo [1,2]. Spheroids formed from MSCs also demonstrate significantly higher efficiency in various stem cell therapies compared to cells cultured as monolayers (i.e. traditional 2D cultivation on cell culture plastic). However, the question of the nature and characteristics of molecular biological processes occurring in 3D structures and the search for specific mechanisms, the regulation of which can affect the efficiency of spheroids in cell therapy, remains unresolved. It is known that the regulation of a number of important biological processes, such as proliferation, migration, adhesion, etc., in particular, is associated with the activity of mechanosensitive ion channels, especially those that can mediate the influx of calcium ions, ubiquitous second messengers, into the cell [3]. According to several studies, the mechanosensitive Piezo1 channel is considered one of the main mechanosensors in different types of cells, including MSCs [4]. It is obvious that the processes of cell aggregation into 3D structures and disaggregation of 3D structures (spheroid spreading) are also based on mechanotransduction processes, in which Ca2+-permeable mechanosensitive Piezo1 channels may be possibly involved. The presence of Piezo1 channels has previously been described in 2D cultures of MSCs of various origins, such as bone marrow-derived MSCs, adipose-derived MSCs, dental-derived MSCs, human umbilical cord MSCs, etc. [4,5,6,7,8,9]. However, questions remain open regarding their participation and role in the spatial and temporal regulation of calcium signaling and in other cellular processes in 3D aggregates. It is important to note that the role, expression level, and functional properties of ion channels can vary significantly with different types of cell culturing (2D or 3D). Evidently, cell aggregation into spheroids is accompanied with the drastic alterations in cell shape, size, plasma membrane curvature, and cytoskeleton structure [10] which in turn could be regulated by or regulate Piezo1–dependent signaling pathways. Previously, we have identified Piezo1 channels in endometrial MSCs as one of the key regulators of intracellular Ca2+ controlling cell migration [11]. Here, we aimed to determine the functional expression and the role of Piezo1 in eMSC 3D spheroids. Particularly, we probed if functional Piezo1 is expressed in the plasma membrane in eMSCs spheroids and compared the levels of Piezo1 mRNA expression between 2D and 3D eMSC cultures. Further, we identified if selective Piezo1 stimulation affects the formation, viability and spheroid spreading rate. Finally, we compared the spheroid spreading after selective Piezo1 activation on culture plastic and glass, the surfaces of different stiffness.
2. Results and Discussion
2.1. Immunofluorescent Staining and Polymerase Chain Reaction Confirms the Presence of Piezo1 in eMSC Spheroids
Firstly, we performed immunofluorescent staining using specific anti-Piezo1 antibodies that clearly evidenced the presence of Piezo1 proteins in the eMSC spheroids (Figure 1A). Consistently, RT-PCR confirmed the presence of Piezo1 mRNA in spheroid lysates (Figure 1B). Next, using qPCR, we compared the levels of Piezo1 mRNA expression between eMSC spheroids and 2D eMSC cultured as monolayer cell culture. Importantly, we observed a decrease in Piezo1 mRNA content in spheroids compared to 2D cell culture by approximately 1.8-fold. (Figure 1C). These results are in good correlation with our previous report, where, using single-channel patch-clamp analysis, we have evidenced a significant decrease in the frequency of activation of stretch-activated channels (with biophysical characteristics similar to Piezo1) in eMSC spheroids compared to 2D cell culture [12].
2.2. Selective Chemical Piezo1 Activation Induces Ca2+ Entry in eMSC Spheroids
The presence of functionally active Piezo1 channels in the plasma membrane of the cells on the surface of the eMSC spheroids was confirmed in Ca2+ imaging experiments. In particular, we applied a selective chemical Piezo1 activator, a small synthetic compound Yoda1 [13], and monitored the changes in internal Ca2+ concentration ([Ca2+]i) in eMSC spheroids. We detected that 10 µM Yoda1 induced the increase in [Ca2+]i thus indicating the presence of Piezo1 channels in the plasma membrane (Figure 2).
2.3. Role of Piezo1 Activity in Formation of eMSC Spheroids
Next, we aimed to investigate how the selective Piezo1 activator Yoda1 affects the process of spheroid formation. Particularly, we added 10 µM of Yoda1 to the cell suspension prior to the formation of the spheroids using the hanging drop protocol (see Figure 8). Then, we monitored the process of the spheroid formation every 24 h during the spheroid assembly (48 to 72 h) and captured the images of the spheroids using an upright microscope with a CCD digital camera. Figure 3A shows the representative images of the cells in hanging drops at different stages of cell aggregation in spheroids. At the final time point, control cells formed round-shaped spheroids, whereas Yoda1-treated cells formed spheroids of irregular shape and significantly smaller sizes (Figure 3B). We speculate that the mechanism of the effect of Yoda1 on spheroid shape could be linked with the perturbation of the interactions of the cells during spheroid compactization. Interestingly, two molecules that were shown to participate in the processes of spheroid formation, integrins and cadherins [14,15], were shown to be regulated by Piezo1 activity [16,17,18]. It should be noted that the unequivocal evidence of the proposed mechanism of spheroid formation regulation by Piezo1 is hardly to be reliably obtained.
It is of specific importance to probe the viable status of the cells in hanging drops during spheroid formation to exclude the possibility that the effects of Yoda1 were due to the loss of cellular viability. Our MTT assay had clearly demonstrated that the spheroids in Yoda1-containing hanging drops are indeed viable: the addition of an MTT reagent resulted in dark color due to the processing of MTT to the violet product formazan by the mitochondria of living cells (note the color of the spheroids shown at Figure 3A). Thus, selective Piezo1 activation during spheroid formation had not prevented the process nor affected cell viability, but resulted in the change of spheroid morphology. In contrast, in our recent study we have shown that Yoda1 completely blocked the formation of spheroids from an aggressive melanoma cell line that was due to cell death in response to selective Piezo1 activation [19].
2.4. Piezo1 Activation Decrease the Rate of eMSCs Spheroid Spreading
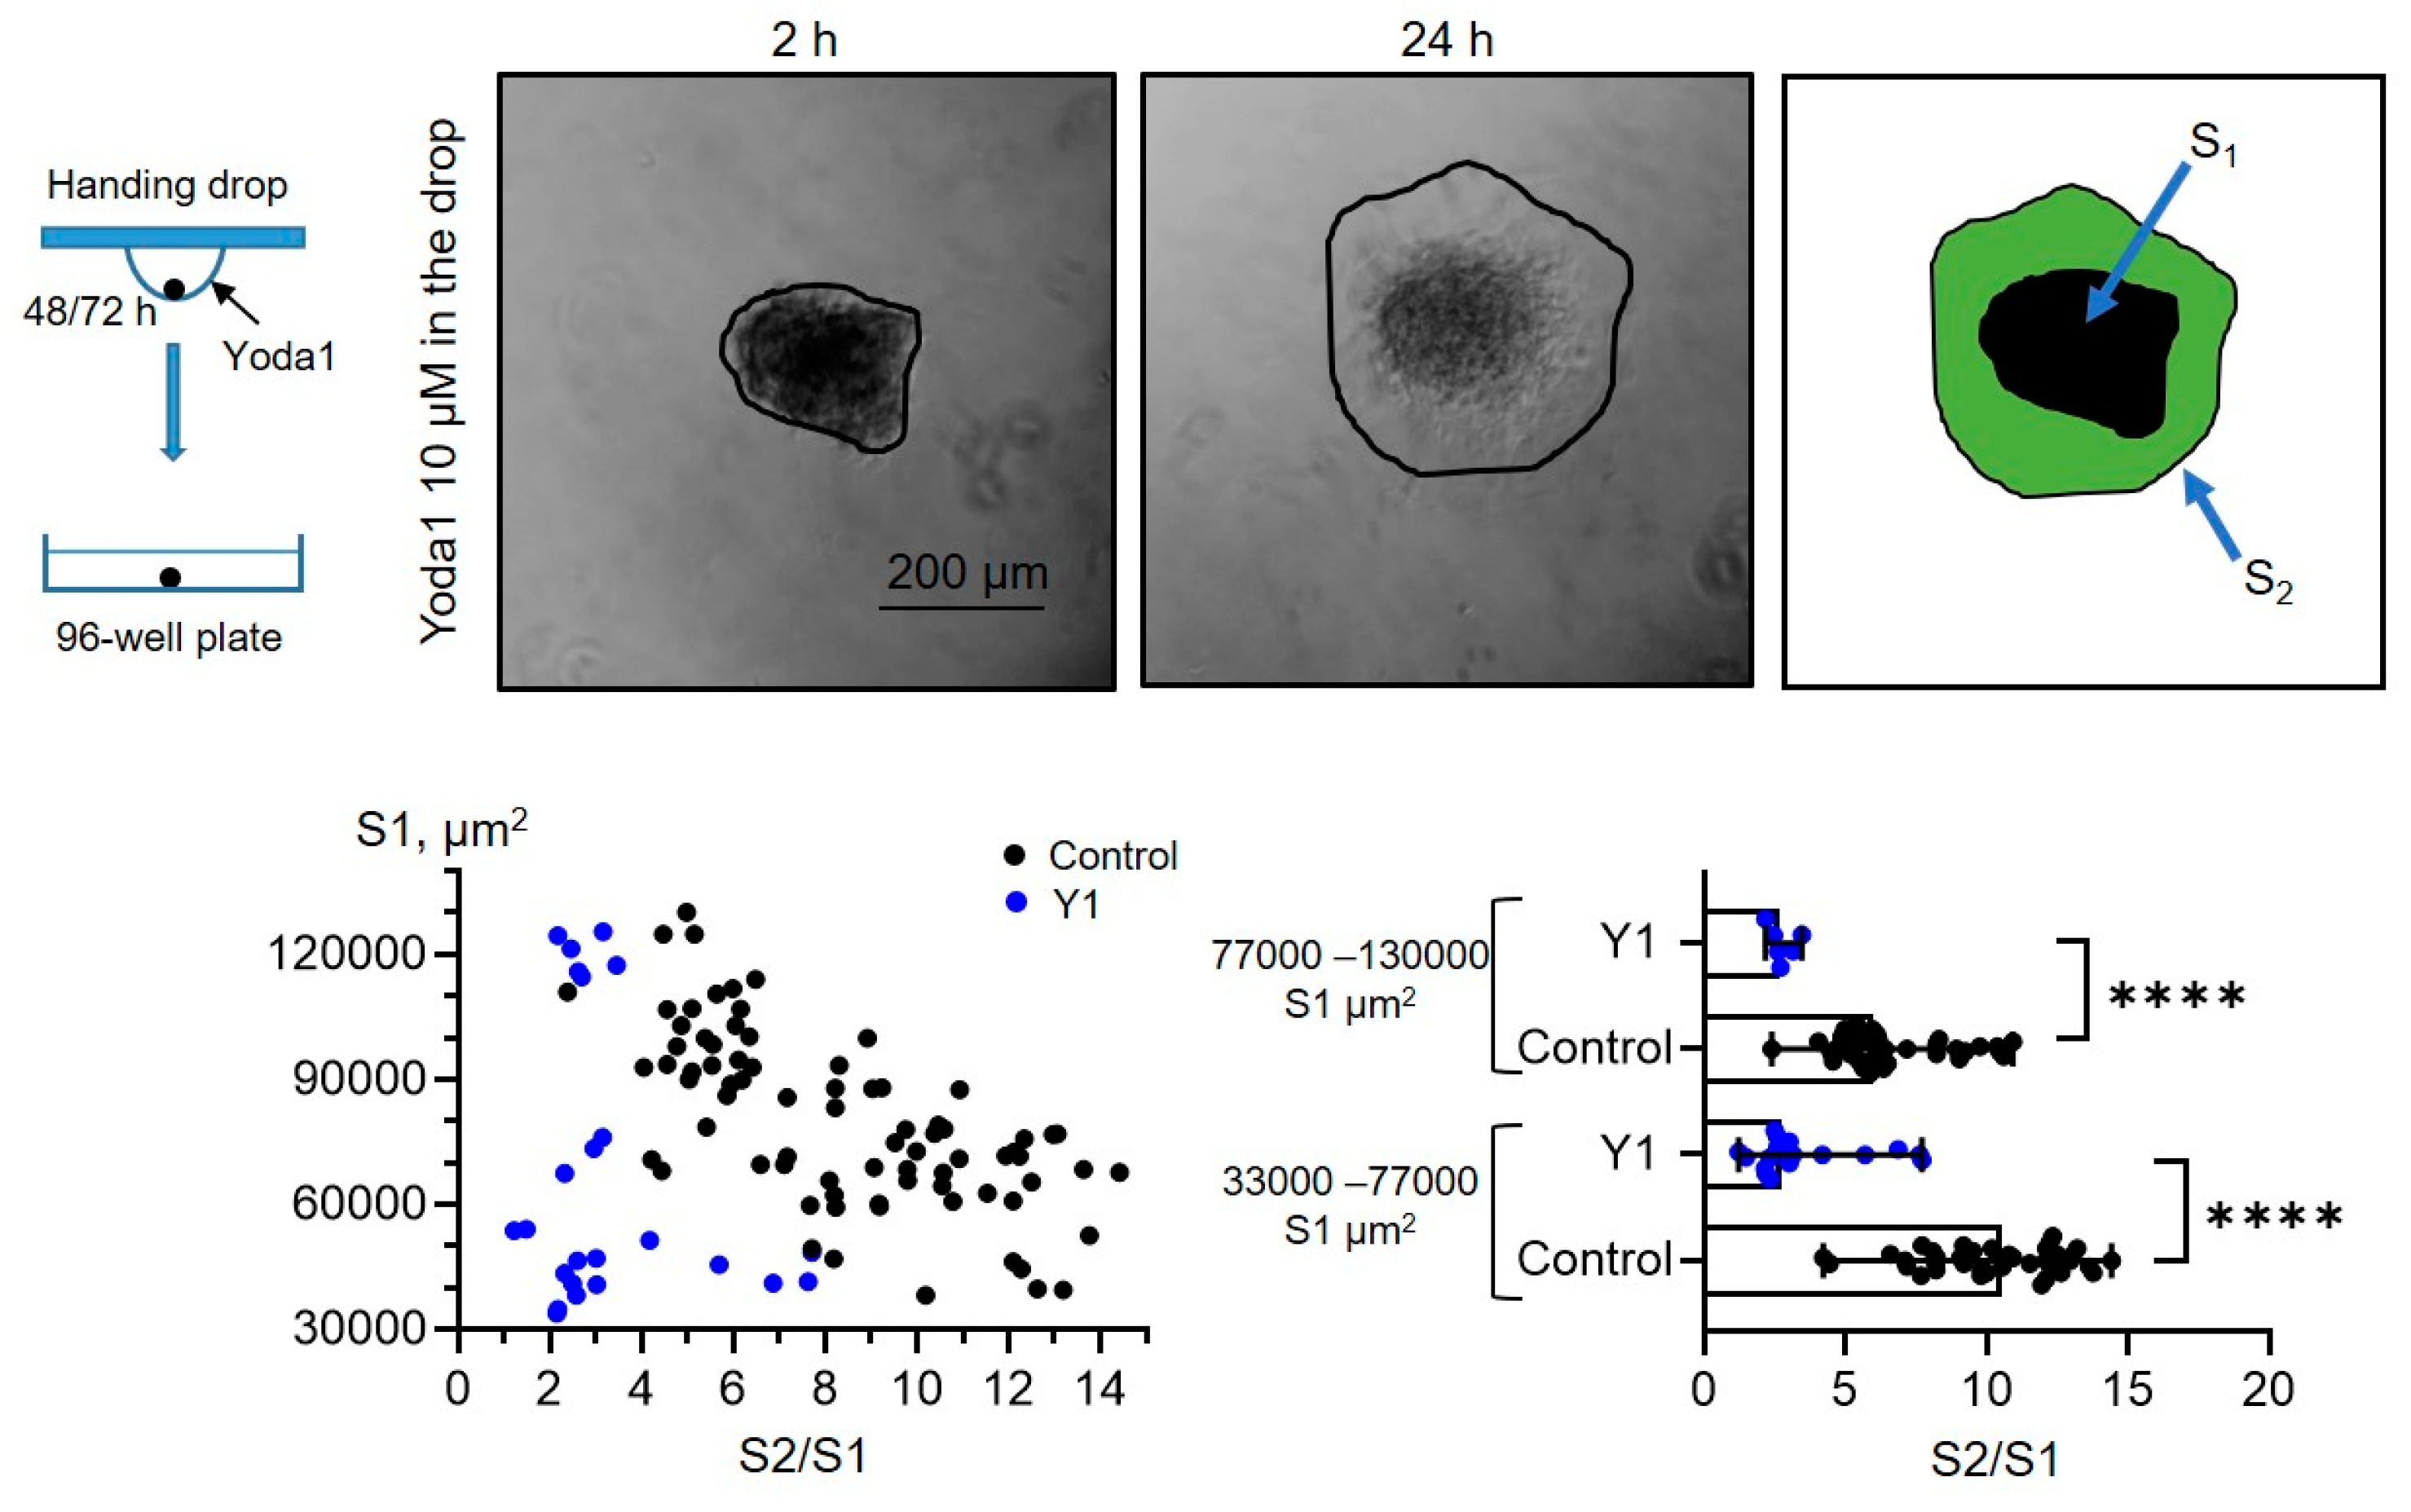
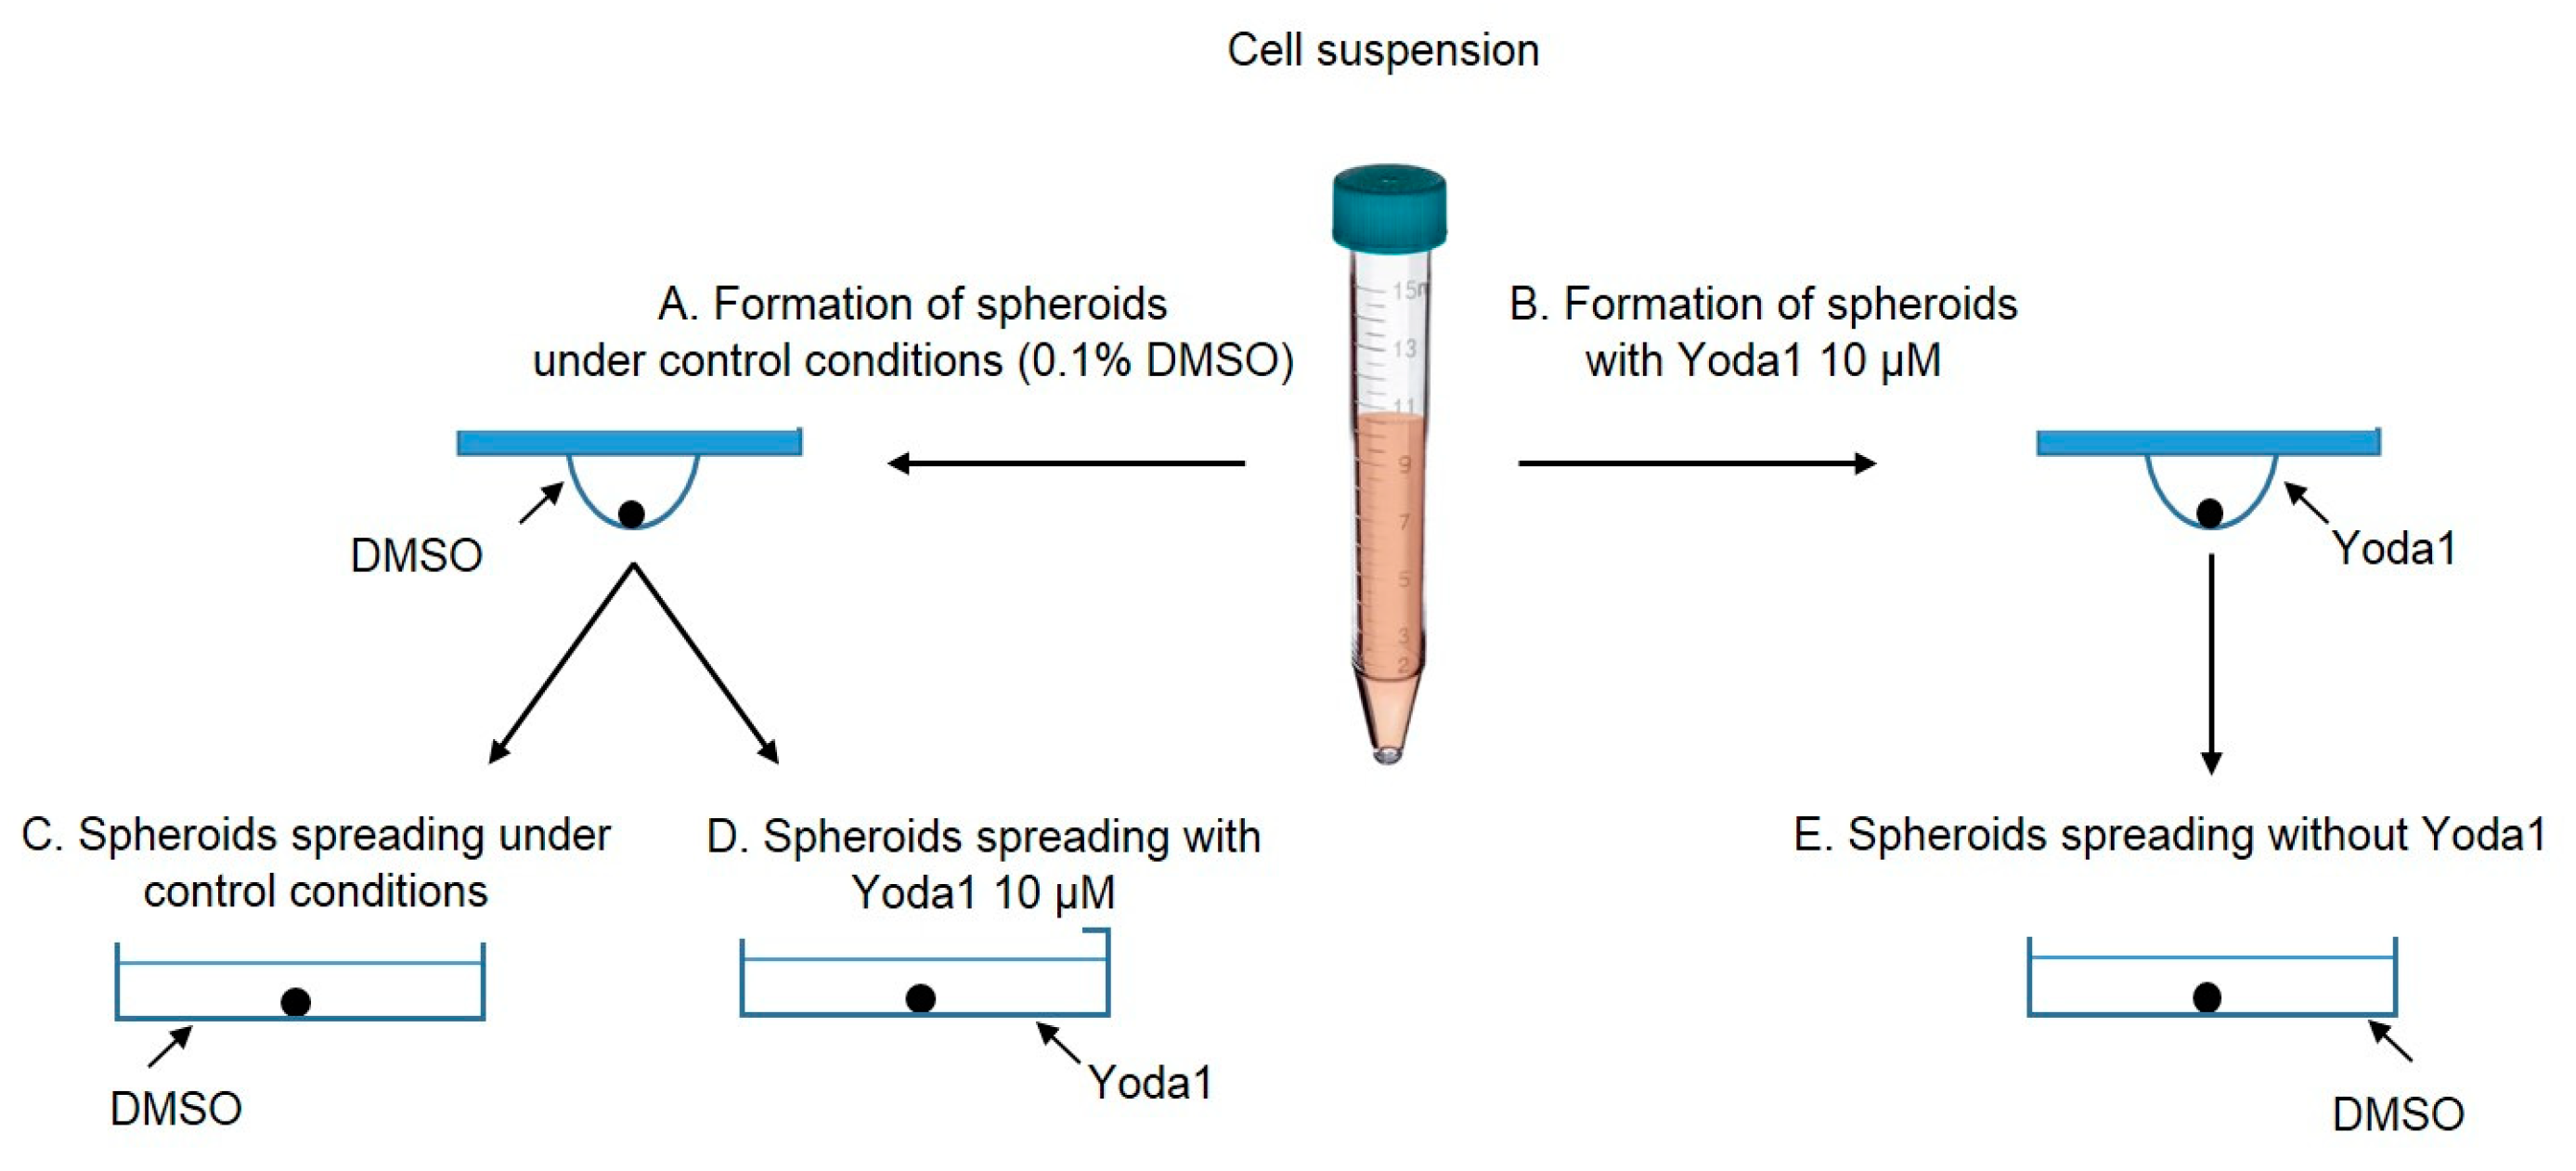
Further, we studied how selective Piezo1 activation affects the process of cell spreading from eMSC spheroids. We used two experimental protocols: (1) spheroids that were formed under control conditions (0.1% DMSO) were seeded to the wells of a 96-well plate and then 10 µM Yoda1 was added to the culture media (Figure 5, also see the scheme of the protocols in Figure 8 A, D) and (2) spheroids that were formed with Yoda1 in the hanging drops were plated to the wells in full culture media without Yoda1 (Figure 6, also see the scheme in Figure 8 B, E). As a control, eMSC spheroids formed with 0.1% DMSO were plated in full culture medium without DMSO washout (Figure 4, also see scheme in Figure 8 A, C). The spheroids were allowed to attach to the bottom of the wells for 2 h, and then the images of each spheroid were captured using an inverted microscope and CCD camera. After 24 h, the second images of the spheroids were obtained. The rate of spheroid spreading was calculated as S2/S1 ratio where S2 is the area of the spheroids and the cells that spread from the spheroid mass after 24 h from the start of the experiment and S1 is the initial area of the same spheroid (Figure 4). As the spheroids varied in initial size (S1), firstly we analyzed how spheroid spreading rate (S2/S1) is dependent on S1 value, and we observed a strong negative correlation between S1 and S2/S1 (Figure 4): i.e. the small spheroids spread faster than large ones. Thus, these results should be taken into account for the analysis of spheroid spreading rates: the spheroids of close sizes (S1 areas) should be selected from the datasets for proper comparison between control and Yoda1-exposed eMSC spheroids.
Taking this into account, we divided control, Yoda1-treated spheroids and spheroids formed in the presence of Yoda1 into the two experimental groups (areas of 33000-77000 μm2 and 77000-130000 μm2) based on their median initial size S1 (i.e., median S1 value in control), and compared the S2/S1 values between control and Yoda1-exposed groups. We observed a significant decrease in the spreading rate of the spheroids in the presence of Yoda1 during spreading or formation (Figure 5, Figure 6). Also, even small spheroids that were formed in the presence of Yoda1, had lower spreading rates than larger spheroids formed under control conditions: i.e. the smaller size of the spheroid could not compensate for the drastic effect of Yoda1 on cell spreading. Thus, irrespective of the stage on which the spheroids were treated with selective Piezo1 activator, these spheroids possess lower spreading rates compared to control. The decrease of wound healing speed of canonical two-dimensional eMSC culture in the presence of Yoda1 was previously reported in our study [11]. Interestingly, dental-derived MSCs were shown to increase their migration rates after selective Piezo1 activation [7]. Most likely, the role of Piezo1 in cell migration could be determined by the composition of Piezo1-regulated signaling pathways or other factors that control Piezo1 properties [20].
Figure 4.
Dependence of the eMSC spheroid spreading rate (S2/S1) on the initial size of the spheroid (S1). Shown are representative images after 2 h from spheroid seeding to the well and after 24 h from the start of the experiment. Spheroid borders are designated by the black lines, and S2 and S1 areas are shown as a merged image. Note the strong negative correlation between S1 and S2/S1. *r is the Pearson linear correlation coefficient. n=78 spheroids were quantified.
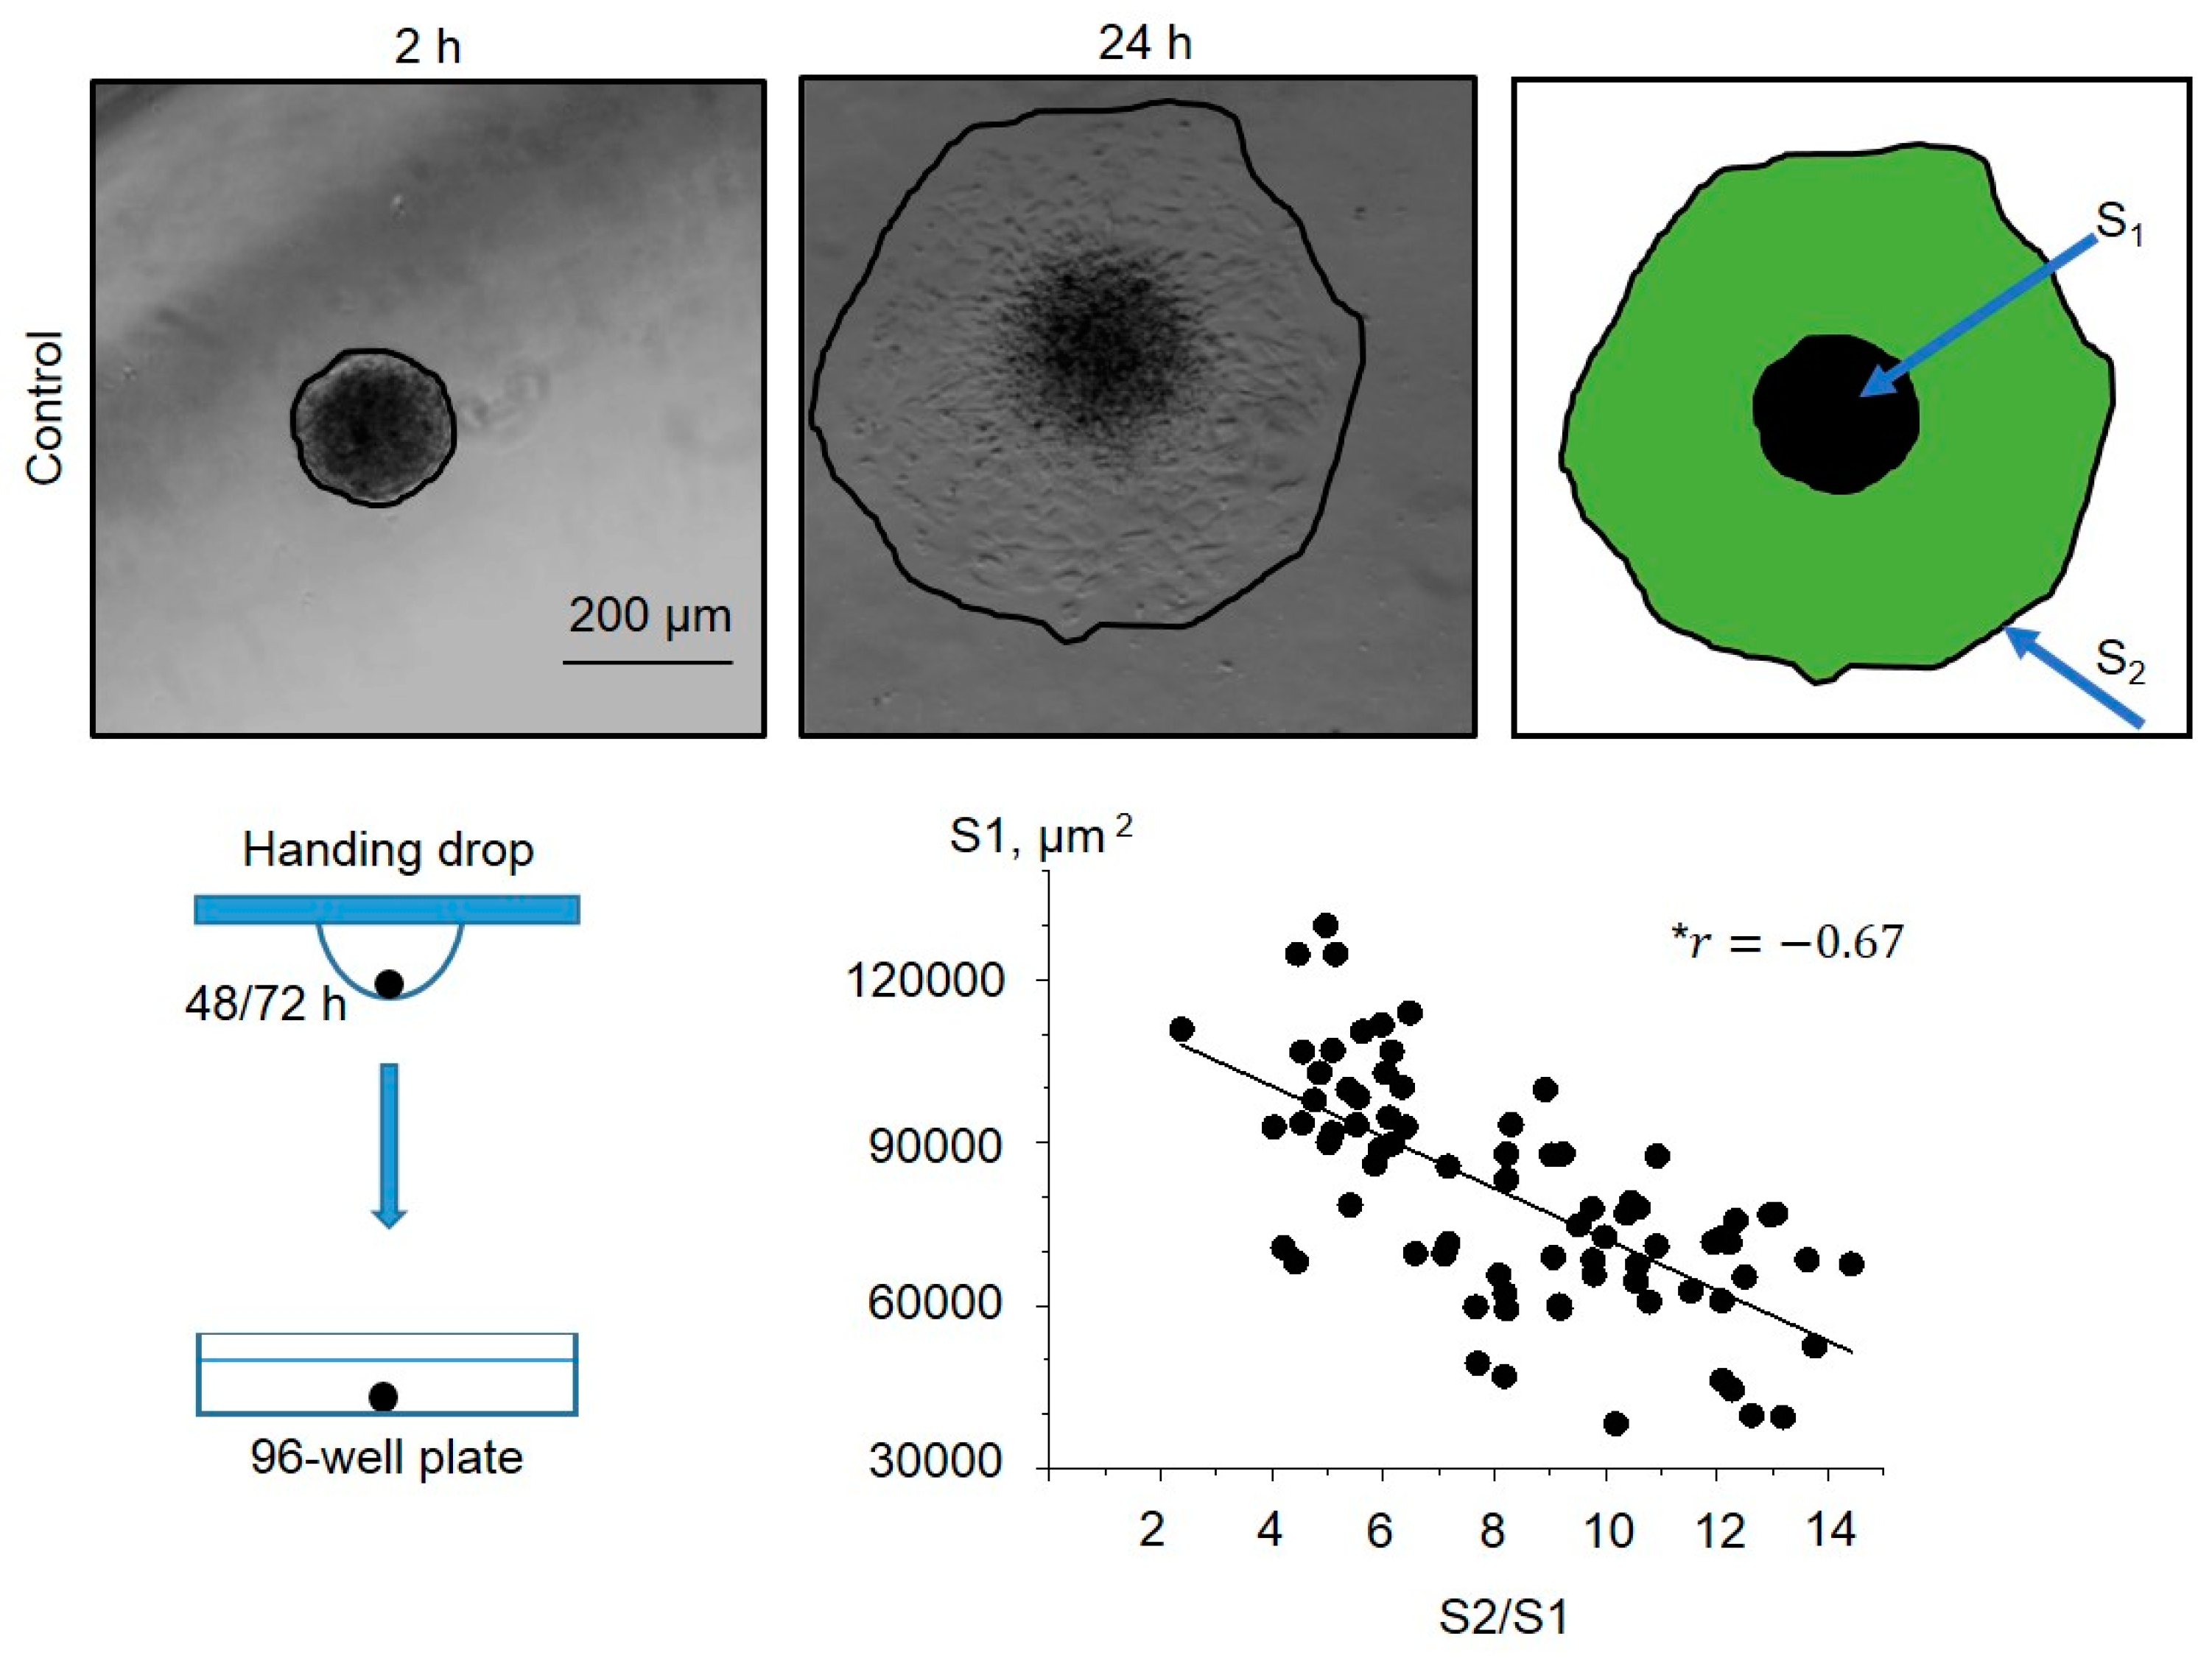
Figure 5.
Yoda1-treated eMSC spheroids have significantly lower spreading rates. Shown are representative images after 2 h from spheroid seeding to the well and after 24 h from the start of the experiment. Spheroid borders are designated by the black lines, and S2 and S1 areas are shown as a merged image. The S2/S1 vs S1 data points are plotted for control and Yoda1-treated spheroids as black and blue dots, respectively. Bar graphs showing medians with range and each point in the dataset. ****- p<0.0001, *** - p<0.001, significantly different, Mann-Whitney test. Total n=78 control and n=12 Yoda1-treated spheroids were analyzed.
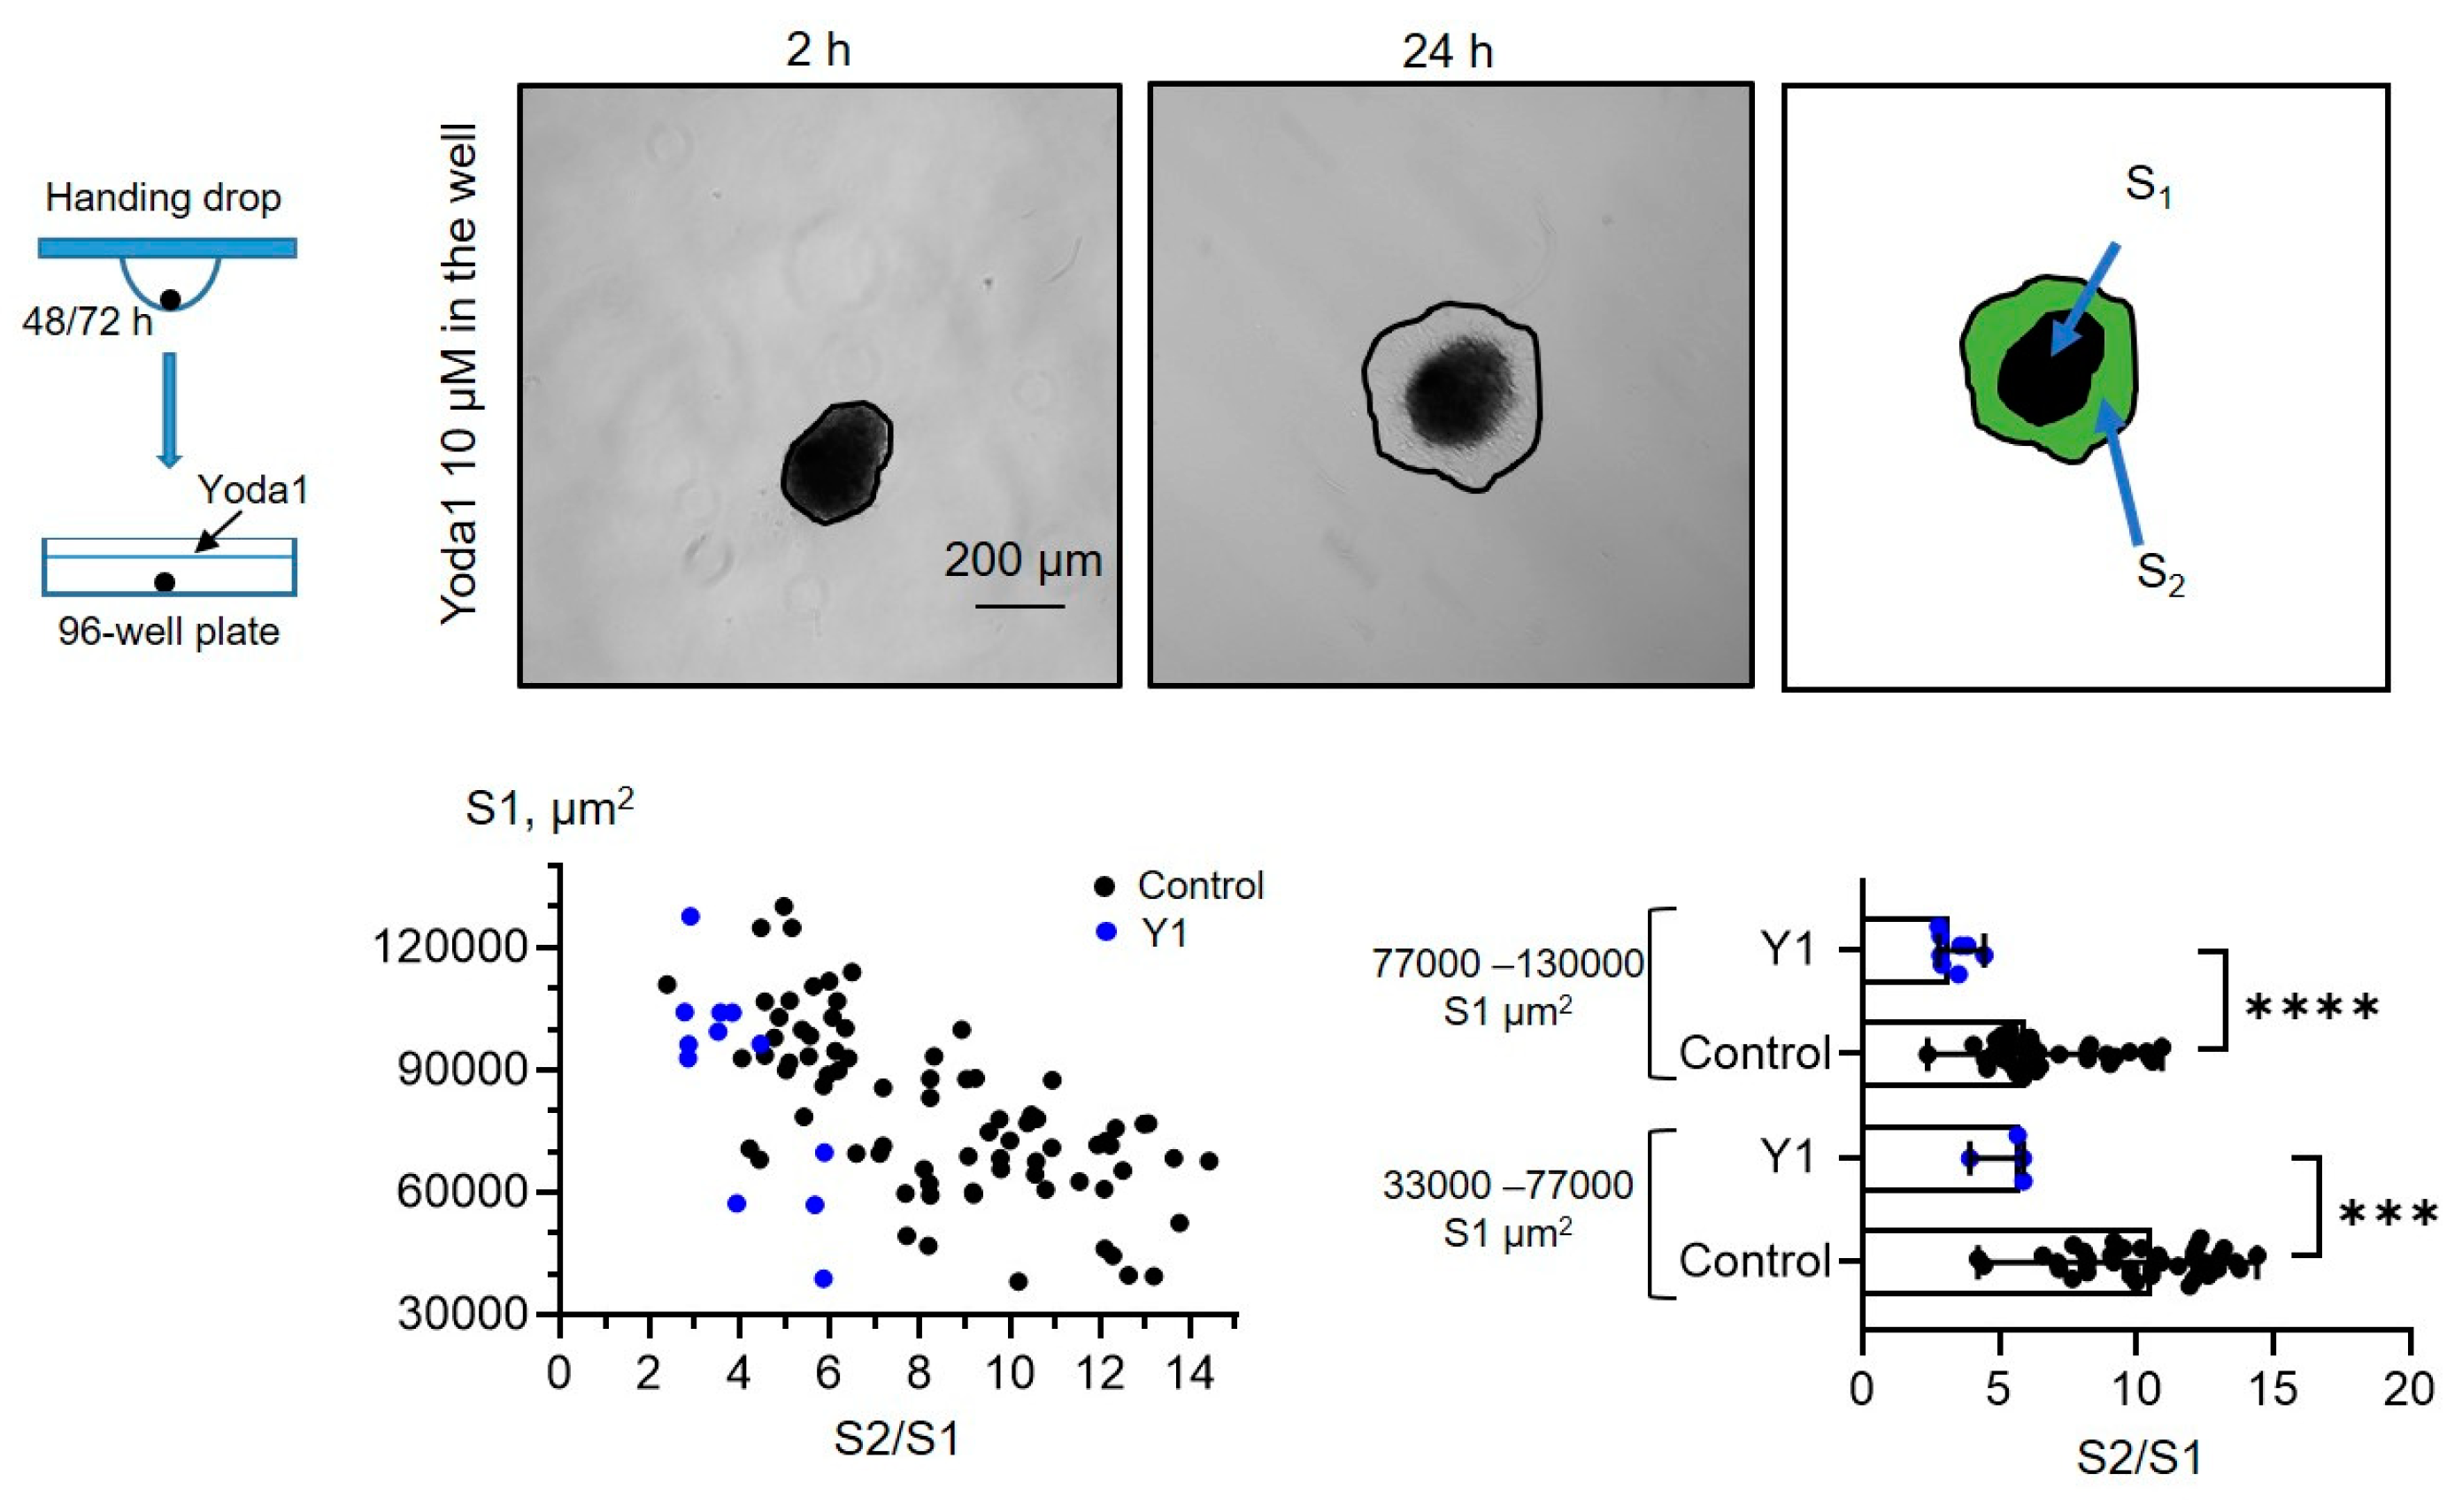
Figure 6.
eMSC spheroids formed in the presence of Piezo1 activator Yoda1 have lower spreading rates. Shown are representative images after 2 h from spheroid seeding to the well and after 24 h from the start of the experiment. Spheroid borders are designated by the black lines, and S2 and S1 areas are shown as a merged image. The S2/S1 vs S1 data points are plotted for control spheroids and spheroids formed in the presence of Yoda1 as black and blue dots, respectively. Bar graphs showing medians with ranges and all experimental points in the dataset. ****significantly different, p<0.0001, Mann-Whitney test. Total of n=78 and n=24 control and Yoda1-treated spheroids were analyzed, respectively.
2.5. Piezo1 Activation Eliminates the Differences in eMSC Spreading Rates on Plastic and Glass Surfaces
Finally, as Piezo1 was shown to perform as a sensor of substrate stiffness [21,22], we aimed to compare how the rates of spreading of control spheroids and the spheroids formed in the presence of Yoda1 are dependent on the stiffness of the surface. Particularly, we seeded the spheroids on the culture plastic and on the glass slides, and calculated S2/S1 rates for all experimental conditions (Figure 7). The control spheroids have significantly lower spreading rates on stiffer substrate (glass) compared to more softer culture plastic. This demonstrates a negative correlation between the rate of cell spreading (S2/S1) and the stiffness of the substrate. Thus, the spheroids from eMSCs can be classified as “substrate stiffness-dependent” cells [23]. It is important to note that different cell lines are able to demonstrate different preferences for substrate stiffness. For example, A549 lung carcinoma-derived epithelial cells show a positive correlation between spreading and substrate stiffness: the stiffer the substrate, the larger the area of cell spreading [24]. Interestingly, the spheroids formed in the presence of Yoda1, have almost similar spreading rates on plastic and glass surfaces. Thus, the presence of Yoda1 during spheroid formation levels out the substrate-dependent S2/S1 ratio, i.e. in the presence of the chemical agonist of Piezo1 channels, eMSC spheroids become “rigidity independent” [23].
3. Materials and Methods
3.1. Cells and Reagents
Human endometrial mesenchymal stem cells (eMSCs) isolated from desquamated endometrium of menstrual blood (eMSC line №2804) were previously characterized in the Department of Intracellular Signaling, Institute of Cytology, Russian Academy of Sciences (St. Petersburg, Russia) [25]. Particularly, eMSCs meet minimal criteria of the International Society for Cell Therapy for multipotent MSCs [26]. Particularly, eMSCs express mesenchymal surface markers (CD13, CD29, CDD44, CD73, CD90, CD105), and are negative for hematopoietic markers (CD11b, CD34, CD45, CD117, CD130, HLA-DR class 2) and are capable of differentiation in the adipogenic and osteogenic directions [25]. eMSCs were cultured in DMEM/F12 medium (Gibco, Waltham, Massachusetts, USA) with 10% fetal bovine serum (Biowest, Nuaillé, France), antibiotic gentamicin (80 µg/ml, Biolot, Russia) in humidified incubator at 37 °C and 5% CO2. Cell passaging was performed twice a week at a ratio of 1:3 using a 0.25% trypsin: EDTA solution (Gibco, Waltham, Massachusetts, USA). Cells at passages from 9 to 13 were used in the experiments.
Selective Piezo1 activator, Yoda1 (2-(5-{[(2,6-Dichlorophenyl)- methyl]sulfanyl}-1,3,4-thiadiazol-2-yl) pyrazine, Tocris, United Kingdom, Cat. 5580) was dissolved in dimethylsulfoxide (DMSO, Sigma-Aldrich, USA) to obtain a stock solution of 10 mM. Working solutions of Yoda1 (10 µM) were prepared prior to the experiments. As a control, an equal amount of vehicle (0.1% DMSO) was used.
3.2. Spheroid Formation and Viability Assay
The eMSC spheroids were formed from a suspension of conventional eMSC culture using the hanging drop method. Firstly, eMSCs were trypsinized, collected in culture medium and counted using a Countess II Automated Cell Counter (Thermo Fisher Scientific, Waltham, MA, USA). The cell concentration in suspension was adjusted to 2 × 10⁵ cells/ml (equal to 7.000 of cells in 35 µl volume of hanging drop). Drops were placed on the cover of 10 cm Petri dishes, overlaid and transferred to a CO2 incubator. Cells under the action of surface tension and gravity aggregated in hanging drops for 48-72 h. eMSCs in spheroids retain all main properties of eMSCs in 2D culture including differentiation potential, and expression of CD markers, except for CD146 [27]. The process of spheroid formation was monitored and captured every 24 h using an upright digital microscope with a CCD camera.
To investigate the effect of Piezo1 activation on spheroid formation, we used 10 µM Yoda1, a selective chemical activator for Piezo1 channels. Yoda1 was added to cell suspension before the formation of hanging drops, and the cells were exposed to Yoda1 during the spheroid formation process (48-72 h, see Figure 8 A,B). After 48-72 h the images of the spheroids formed in control and in the presence of Yoda1 were captured using a CCD digital camera. The spheroid area and shape descriptors (circularity and aspect ratio) were quantified using ImageJ. The interpretation of two latter parameters is as follows: the closer is circularity to 1, the closer the shape of the spheroid to the ideal circle. The higher is the aspect ratio - the more elongated and irregular is the shape of the spheroid.
To probe the viability of the cells during spheroid formation, we utilized specific MTT dye (Cat. No GT4101, ServiceBio, Hubei, China) based on the ability of living metabolically active cells to process MTT (3-(4,5-dimethylthiazol-2-yl) -2,5-diphenyltetrazolium bromide) into the water-insoluble violet crystals of colored product formazan. Every 24 hours, 10 μl of MTT were added to several (3-5) droplets containing the cells to monitor cell viability at various stages of 3D structure formation. After 4 hours from the addition of MTT, we captured the images of the spheroids: the presence of a dark staining of the cells indicated their viable status.
3.3. RNA Extraction and cDNA Synthesis
Total RNA extraction (from eMSCs cultured as cell monolayer or spheroids) was performed using a RNA Solo kit (Cat. No BC034T, Evrogen, Moscow, Russia). Briefly, eMSCs were trypsinized with 0.25% trypsin-EDTA solution and counted using a Countess II Automated Cell Counter. For total RNA extraction 3 × 10⁶ cells and ~420 spheroids were taken (equal to 3 × 10⁶ cells as one spheroid contains approximately 7000 cells). All steps of RNA extraction, including DNAse treatment, were performed according to the manufacturer’s instructions. RNA concentration was quantified using GeneQuant 1300 Spectrophotometer (GE Healthcare, United Kingdom). Complementary DNA (cDNA) was synthesized from 1 µg of total RNA in a 20 µl final volume using an MMLV RT kit (Cat No. SK022, Evrogen, Moscow, Russia) according to the manufacturer’s instructions.
3.4. Reverse Transcription (RT) and Quantitative Polymerase Chain Reaction (qPCR)
Before qPCR all primers were tested on cDNAs to determine the optimal conditions and expected product sizes using conventional RT-PCR. The cycling conditions were as in previous studies [28]. The number of cycling conditions was 35 cycles. qPCR was performed in the presence of intercalating dye SYBR Green I and the reference dye ROX (Sintol, Moscow, Russia). The qPCR reactions were conducted in a total volume of 25 µl with 20 ng of the cDNA sample with six technical replicates on a CFX96 Touch Real-Time PCR amplificator (Bio-Rad, Irvine, CA, USA). All experiments were performed in triplicate. HPRT1 (hypoxanthine phosphoribosyltransferase 1) and TBP (TATA-box binding protein) housekeeping genes were selected as stable reference genes for mesenchymal stem cells [29]. The primer sequences of target (Piezo1) and reference genes are listed in Table 1. The amplification steps included cDNA denaturation at 95 °C for 5 min, and 45 cycles of 95 °C for 30 s, 57 °C for 30 s and 72 °C for 30 s, followed by fluorescence plate reading. Target (Piezo1) gene expression was normalized to the expression of housekeeping genes, HPRT1 and TBP, and calculated using the 2−ΔΔCT method.
4.5. Immunofluorescence
Specific antibodies against the extracellular region of Piezo1 (Proteintech, Rosemont, Illinois, USA, Cat. No 15939-1-AP, RRID: AB_2231460) were used to visualize the channels in the plasma membrane of eMSC spheroids. The spheroids were seeded on glass coverslips (in 2 hours before the experiments) coated with poly-DL-lysine (Sigma-Aldrich, USA) and fixed with 3.7% paraformaldehyde for 10 min. Non-specific staining was blocked by incubating the cells in a 1 × phosphate buffered saline (PBS) buffer containing 10% goat serum for 1 hour at room temperature. The spheroids were then incubated with primary anti-Piezo1 antibodies (at 1:100 dilution) overnight at 4 °C followed by incubation with secondary fluorescent antibodies (1:200 dilution, goat-anti-rabbit-Cy3, ThermoFischer, USA) in the dark for 1 hour. The cell nuclei were counterstained with 0.05 ug/ml 4′,6-diamidino-2-phenylindole (DAPI, Sigma-Aldrich, USA) at room temperature for 30 min. After each step of staining, the cells were washed 3-5 times with a 1× PBS. As a control, spheroids incubated in the absence of primary antibodies were used: no staining was observed under these conditions (Supplementary Figure S2). After the staining, the glass coverslips were mounted on glass slides using the Vectashield mounting medium (Vector Laboratories, CA, USA) to minimize photobleaching. The images of the spheroids were acquired on Olympus FV3000 confocal microscope using 40x/1.3 NA oil immersion objective: the fluorescence was excited at 405 and 561 nm for DAPI and Cy3, respectively. The resulting images were merged and processed with FIJI software (NIH, Bethesda, California, USA).
4.6. Ca2+ Measurements
Ca2+ imaging setup based on inverted fluorescent microscope (Micromed I LUM, Micromed, St. Petersburg, Russia) with a 20×/0.4 NA Plan Apochromat objective, high-sensitive CCD camera (1360 × 1024 pixels, UHCCD01400KPB, Touptek Photonics, China) and ToupView controlling software (Touptek Photonics, China) was used to register the fluorescence of Fluo8-AM Ca2+ probe (Cat. No 21080, AAT Bioquest Inc., USA) similar to previously described (Vasileva et al., 2023). Briefly, eMSC spheroids were plated onto poly-DL-lysine-coated glass coverslips (for 2 hours) and loaded with 5 µM cell-permeable Fluo8-AM dye for 45 minutes (at 37 °C and 5% CO2) in "2Ca" solution contained (in mM) 150 NaCl, 6 KCl, 1 MgCl2, 2 CaCl2, and 10 HEPES/TrisOH, pH of 7.3. After 45 minutes the dye was washed out, and the spheroids were incubated for further 15 minutes to ensure complete de-esterification of the acetoxymethyl (AM) groups. Following this, the spheroids were transferred to an experimental chamber containing a “2 Ca” solution. The background level of fluorescence was recorded for 30-40 seconds, and then 10 μM Yoda1 in “2 Ca” was added to stimulate calcium entry through Piezo1. Ionomycin (5 µM), a Ca2+ ionophore, was applied at the end of each experiment to elicit maximal Ca2+ influx into the cells. Videos of Ca2+ responses of the spheroids were recorded at 3 frames per second, and then converted to image stacks using FIJI software for quantification. Several cells on the edge of the spheroid were selected using the “Freehand selection” tool, and each cell was used as an individual “region of interest” (ROI) for fluorescence measurements: a minimum of 7-9 ROIs were analyzed in each spheroid. Calcium imaging experiments with Yoda1 were repeated on at least 3 spheroids independently. To compare the fluorescence intensities between the cells, the basal level of fluorescence (before Yoda1 application) and maximal fluorescence intensity after Yoda1 were normalized to the fluorescence intensity after application of ionomycin (maximal Ca2+ entry) to eliminate the possible differences in the efficiency of cell loading with Fluo8 Ca2+ probe.
4.7. Spheroid Spreading Assay
Spheroid spreading is the process of cell spreading from the spheroids plated on the flat surface. To determine the role of Piezo1 activity in eMSC spheroid spreading, each droplet with the formed spheroid was manually transferred to a separate well of 96-well plate, and the spheroids were allowed to attach to the surface for 2 hours. Since one well of the plate contained only one spheroid, we were to analyze each spheroid individually. Then, the reagents (10 µM Yoda1 or 0.1% DMSO) were added to the wells of the plate (see Figure 8 C,D). Spheroids that were exposed to Yoda1 during their formation were spreaded under Yoda1-free conditions: the cell medium was completely replaced to full culture media with 0.1% DMSO as a vehicle (Figure 8E). The images of the spheroids were captured after spheroid attachment (2 h) and after 24 h from the beginning of the experiment: from these images the areas of the spheroids together with the cells that migrated from the spheroid mass were determined using “Measure” command of FIJI software. Then, the rate of the spheroid spreading was determined as S2/S1 ratio, where S1 is the area of the initial spheroid (at 2 h), and S2 is the area of the spheroid and the migrated cells after 24 h.
Figure 8.
Experimental protocols used in the spheroid assays. Spheroids were formed from cell suspension under control conditions (0.1% DMSO, A) and (B) in the presence of 10 µM Yoda1. Then, the control spheroids were plated into wells in 0.1% DMSO (C) or in 10 µM Yoda1 (D). Spheroids formed in the presence of Yoda1 were plated in 0.1% DMSO (E, Yoda1 was washed out).
4.8. Statistics
The statistical analysis was performed in GraphPad Prism 8.0 (GraphPad Software, USA), p <0.05 was considered significant. Before the analysis, the data were tested for Gaussian distribution (Shapiro-Wilk test), equality of standard deviations (S.D.) and the presence of outliers. The detected outliers (if any) were excluded from the datasets. For comparison of two experimental groups, two-sample unpaired Student’s t-test or Mann-Whitney test were used (for Gaussian or non-Gaussian distributions, respectively). In the case of non-equal S.D., t-test with Welch’s correction was used. The number of experimental repeats, specific statistical tests used for data comparison and p-values are indicated in the corresponding figure legends.
5. Conclusions
In the present study, we have established the role of selective Piezo1 activation in the formation and spreading of eMSC spheroids. The presence of functionally active endogenous Piezo1 ion channels in the spheroids was confirmed using molecular biology techniques supplemented with Ca2+ imaging functional assay. The spheroids formed in the presence of Yoda1, a selective chemical Piezo1 agonist, were smaller and of irregular shape, and possessed lower rates of spreading, compared to control. The addition of Yoda1 to culture media also resulted in the decrease of eMSC spreading. Importantly, Yoda1 had eliminated the differences in spheroid spreading rates on plastic and glass surfaces, thus confirming the role of Piezo1 as a sensor of the mechanical properties of the substrate. Our data imply that eMSCs retain functional Piezo1 channels after the transition from 2D culture to the spheroids, despite the lowering of Piezo1 mRNA. The selective activation of Piezo1 could be used for the modulation of spheroid spreading rates which could be favorable in some conditions for spheroid-based cell therapies.
Supplementary Materials
The following supporting information can be downloaded at the website of this paper posted on Preprints.org, Figure S1: Original gel images, Figure S2: no primary antibody control.
Author Contributions
For Conceptualization, V.I.C-N.; Methodology, Z.M.K., V.Y.V., V.I.C-N.; Validation, Z.M.K., V.Y.V., V.I.C-N.; Formal Analysis, Z.M.K., V.Y.V., V.I.C-N.; Investigation, Z.M.K., V.Y.V., V.I.C-N.; Data Curation, Z.M.K., V.Y.V., V.I.C-N.; Writing – Original Draft Preparation, Z.M.K., V.Y.V., V.I.C-N.; Writing – Review & Editing, V.Y.V., V.I.C-N.; Visualization, Z.M.K., V.Y.V.; Supervision, V.Y.V., V.I.C-N.; Project Administration, V.Y.V., V.I.C-N.; Funding Acquisition, V.I.C-N. All authors have read and agreed to the published version of the manuscript
Funding
This research was funded by Russian Science Foundation, grant №22-74-10037.
Institutional Review Board Statement
The study was conducted in accordance with the guidelines of the Declaration of Helsinki (1989, updated in 2013) that were accepted and claimed by the Local Ethics Commission of the Institute of Cytology of RAS.
Informed Consent Statement
Informed consent was obtained from all subjects involved in the study.
Data Availability Statement
The raw data supporting the conclusions of this article will be made available by the authors on request.
Acknowledgments
The authors would like to thank Mariia Shorokhova for the initial help with spheroid formation protocols.
Conflicts of Interest
The authors declare no conflict of interest. The funders had no role in the design of the study; in the collection, analyses or interpretation of data; in the writing of the manuscript or in the decision to publish the results.
References
- Pampaloni, F.; Reynaud, E. G.; Stelzer, E. H. The third dimension bridges the gap between cell culture and live tissue. Nature reviews. Molecular cell biology. 2007. 8(10), 839–845. [CrossRef]
- Cesarz, Z.; Tamama, K. Spheroid Culture of Mesenchymal Stem Cells. Stem cells international. 2016. 9176357. [CrossRef]
- Cooper D.; Dimri M. Biochemistry, Calcium Channels. [Updated 2023 Jul 25]. In: StatPearls [Internet]. Treasure Island (FL): StatPearls Publishing; 2025 Jan-. Available from: https://www.ncbi.nlm.nih.gov/books/NBK562198/.
- Huang, Z.; Huang, Y.; Ning, X.; Li, H.; Li, Q.; Wu, J. The functional effects of Piezo channels in mesenchymal stem cells. Stem cell research & therapy. 2023. 14(1), 222. [CrossRef]
- Sugimoto, A.; Miyazaki, A.; Kawarabayashi, K.; Shono, M.; Akazawa, Y.; Hasegawa, T.; Ueda-Yamaguchi, K.; Kitamura, T.; Yoshizaki, K.; Fukumoto, S.; Iwamoto, T. Piezo type mechanosensitive ion channel component 1 functions as a regulator of the cell fate determination of mesenchymal stem cells. Scientific reports. 2017. 7(1), 17696. [CrossRef]
- Huang, X.; Chen, D.; Liang, C.; Shi, K.; Zhou, X.; Zhang, Y.; Li, Y.; Chen, J.; Xia, K.; Shu, J.; Yang, B.; Wang, J.; Xu, H.; Yu, C.; Cheng, F.; Wang, S.; Zhang, Y.; Wang, C.; Ying, L.; Li, H.; … Chen, Q. Swelling-Mediated Mechanical Stimulation Regulates Differentiation of Adipose-Derived Mesenchymal Stem Cells for Intervertebral Disc Repair Using Injectable UCST Microgels. Advanced healthcare materials. 2023. 12(3), e2201925. [CrossRef]
- Mousawi, F.; Peng, H.; Li, J.; Ponnambalam, S.; Roger, S.; Zhao, H.; Yang, X.; Jiang, L. H. Chemical activation of the Piezo1 channel drives mesenchymal stem cell migration via inducing ATP release and activation of P2 receptor purinergic signaling. Stem cells (Dayton, Ohio). 2020. 38(3), 410–421. [CrossRef]
- Wang, S.; Chennupati, R.; Kaur, H.; Iring, A.; Wettschureck, N.; Offermanns, S. Endothelial cation channel PIEZO1 controls blood pressure by mediating flow-induced ATP release. The Journal of clinical investigation. 2016. 126(12), 4527–4536. [CrossRef]
- Sun, Y.; Liu, J.; Xu, Z.; Lin, X.; Zhang, X.; Li, L.; Li, Y. Matrix stiffness regulates myocardial differentiation of human umbilical cord mesenchymal stem cells. Aging. 2020. 13(2), 2231–2250. [CrossRef]
- Białkowska, K.; Komorowski, P.; Bryszewska, M.; Miłowska, K. Spheroids as a Type of Three-Dimensional Cell Cultures-Examples of Methods of Preparation and the Most Important Application. International journal of molecular sciences. 2020. 21(17), 6225. [CrossRef]
- Chubinskiy-Nadezhdin, V.; Semenova, S.; Vasileva, V.; Shatrova, A.; Pugovkina, N.; Negulyaev, Y. Store-Operated Ca2+ Entry Contributes to Piezo1-Induced Ca2+ Increase in Human Endometrial Stem Cells. International journal of molecular sciences. 2022. 23(7), 3763. [CrossRef]
- Chubinskiy-Nadezhdin, V. I.; Sudarikova, A. V.; Shorokhova, M. A.; Vasileva, V. Y.; Khairullina, Z. M.; Negulyaev, Y. A. Single ion channel recording in 3D culture of stem cells using patch-clamp technique. Biochemical and biophysical research communications. 2022. 619, 22–26. [CrossRef]
- Syeda, R.; Xu, J.; Dubin, A. E.; Coste, B.; Mathur, J.; Huynh, T.; Matzen, J.; Lao, J.; Tully, D. C.; Engels, I. H.; Petrassi, H. M.; Schumacher, A. M.; Montal, M.; Bandell, M.; Patapoutian, A. Chemical activation of the mechanotransduction channel Piezo1. eLife. 2015. 4, e07369. [CrossRef]
- Lin, R. Z.; Chou, L. F.; Chien, C. C.; Chang, H. Y. Dynamic analysis of hepatoma spheroid formation: roles of E-cadherin and beta1-integrin. Cell and tissue research. 2006. 324(3), 411–422. [CrossRef]
- Lin, R. Z.; Chang, H. Y. Recent advances in three-dimensional multicellular spheroid culture for biomedical research. Biotechnology journal. 2008. 3(9-10), 1172–1184. [CrossRef]
- Wang, J.; Jiang, J.; Yang, X.; Zhou, G.; Wang, L.; Xiao, B. Tethering Piezo channels to the actin cytoskeleton for mechanogating via the cadherin-β-catenin mechanotransduction complex. Cell reports. 2022. 38(6), 110342. [CrossRef]
- Lei, M.; Wang, W.; Zhang, H.; Gong, J.; Wang, Z.; Cai, H.; Yang, X.; Wang, S.; Ma, C. Cell-cell and cell-matrix adhesion regulated by Piezo1 is critical for stiffness-dependent DRG neuron aggregation. Cell reports. 2023. 42(12), 113522. [CrossRef]
- Cheng, D.; Wang, J.; Yao, M.; Cox, C. D. Joining forces: crosstalk between mechanosensitive PIEZO1 ion channels and integrin-mediated focal adhesions. Biochemical Society transactions. 2023. 51(5), 1897–1906. [CrossRef]
- Vasileva, V. Y.; Khairullina, Z. M.; Chubinskiy-Nadezhdin, V. I. Piezo1 Activation Prevents Spheroid Formation by Malignant Melanoma SK-MEL-2 Cells. International journal of molecular sciences. 2023. 24(21), 15703. [CrossRef]
- Kinsella, J. A.; Debant, M.; Parsonage, G.; Morley, L. C.; Bajarwan, M.; Revill, C.; Foster, R.; Beech, D. J. Pharmacology of PIEZO1 channels. British journal of pharmacology. 2024. 181(23), 4714–4732. [CrossRef]
- Wang, Y.; Wang, J.; Zhang, J.; Wang, Y.; Wang, Y.; Kang, H.; Zhao, W.; Bai, W.; Miao, N.; Wang, J. Stiffness sensing via Piezo1 enhances macrophage efferocytosis and promotes the resolution of liver fibrosis. Science advances. 2024. 10(23), eadj3289. [CrossRef]
- Atcha, H.; Jairaman, A.; Holt, J. R.; Meli, V. S.; Nagalla, R. R.; Veerasubramanian, P. K.; Brumm, K. T.; Lim, H. E.; Othy, S.; Cahalan, M. D.; Pathak, M. M.; Liu, W. F. Mechanically activated ion channel Piezo1 modulates macrophage polarization and stiffness sensing. Nature communications. 2021. 12(1), 3256. [CrossRef]
- Tilghman, R. W.; Cowan, C. R.; Mih, J. D.; Koryakina, Y.; Gioeli, D.; Slack-Davis, J. K.; Blackman, B. R.; Tschumperlin, D. J.; Parsons, J. T. Matrix rigidity regulates cancer cell growth and cellular phenotype. PloS one. 2010. 5(9), e12905. [CrossRef]
- Li, J.; Han, D.; Zhao, Y. P. Kinetic behaviour of the cells touching substrate: the interfacial stiffness guides cell spreading. Scientific reports. 2014. 4, 3910. [CrossRef]
- Zemelko, V.I.; Grinchuk, T.M.; Domnina, A.P. et al. Multipotent mesenchymal stem cells of desquamated endometrium: Isolation, characterization, and application as a feeder layer for maintenance of human embryonic stem cells. Cell Tiss. Biol. 2012. 6, 1–11. [CrossRef]
- Dominici, M.; Le Blanc, K.; Mueller, I.; Slaper-Cortenbach, I.; Marini, F.; Krause, D.; Deans, R.; Keating, A.; Prockop, D.j; Horwitz, E. Minimal criteria for defining multipotent mesenchymal stromal cells. The International Society for Cellular Therapy position statement. Cytotherapy. 2006. 8(4), 315–317. [CrossRef]
- Domnina, A.; Alekseenko, L.; Kozhukharova, I.; Lyublinskaya, O.; Shorokhova, M.; Zenin, V.; Fridlyanskaya, I.; Nikolsky, N. Generation of Therapeutically Potent Spheroids from Human Endometrial Mesenchymal Stem/Stromal Cells. Journal of personalized medicine. 2021. 11(6), 466. [CrossRef]
- Vasileva, V. Y.; Khairullina, Z. M.; Sudarikova, A. V.; Chubinskiy-Nadezhdin, V. I. Role of Calcium-Activated Potassium Channels in Proliferation, Migration and Invasion of Human Chronic Myeloid Leukemia K562 Cells. Membranes. 2023. 13(6), 583. [CrossRef]
- Rauh, J.; Jacobi, A.; Stiehler, M. Identification of stable reference genes for gene expression analysis of three-dimensional cultivated human bone marrow-derived mesenchymal stromal cells for bone tissue engineering. Tissue engineering. Part C, Methods. 2015. 21(2), 192–206. [CrossRef]
Figure 1.
Expression of Piezo1 in eMSC spheroids. (A) Immunofluorescent staining evidenced the presence of Piezo1 proteins. Shown are representative confocal slices obtained from the bottom plane (near to coverglass) and through the center of the spheroid. The schematic illustrations of focal planes used for acquisition are shown at the right from the images. Red channel - Piezo1 immunofluorescence, blue channel - cell nuclei. (B) Piezo1 mRNA was detected in spheroid lysates: the primers against Piezo1 amplified the product of the expected size (165 bp). (C) Relative mRNA expression levels of Piezo1 in 2D and 3D eMSC cultures counted using the 2-ΔΔCt method. The qPCR data were normalized to HPRT1 and TBP gene mRNA (see Materials and Methods). ***- significantly different, unpaired t-test, p<0.001.
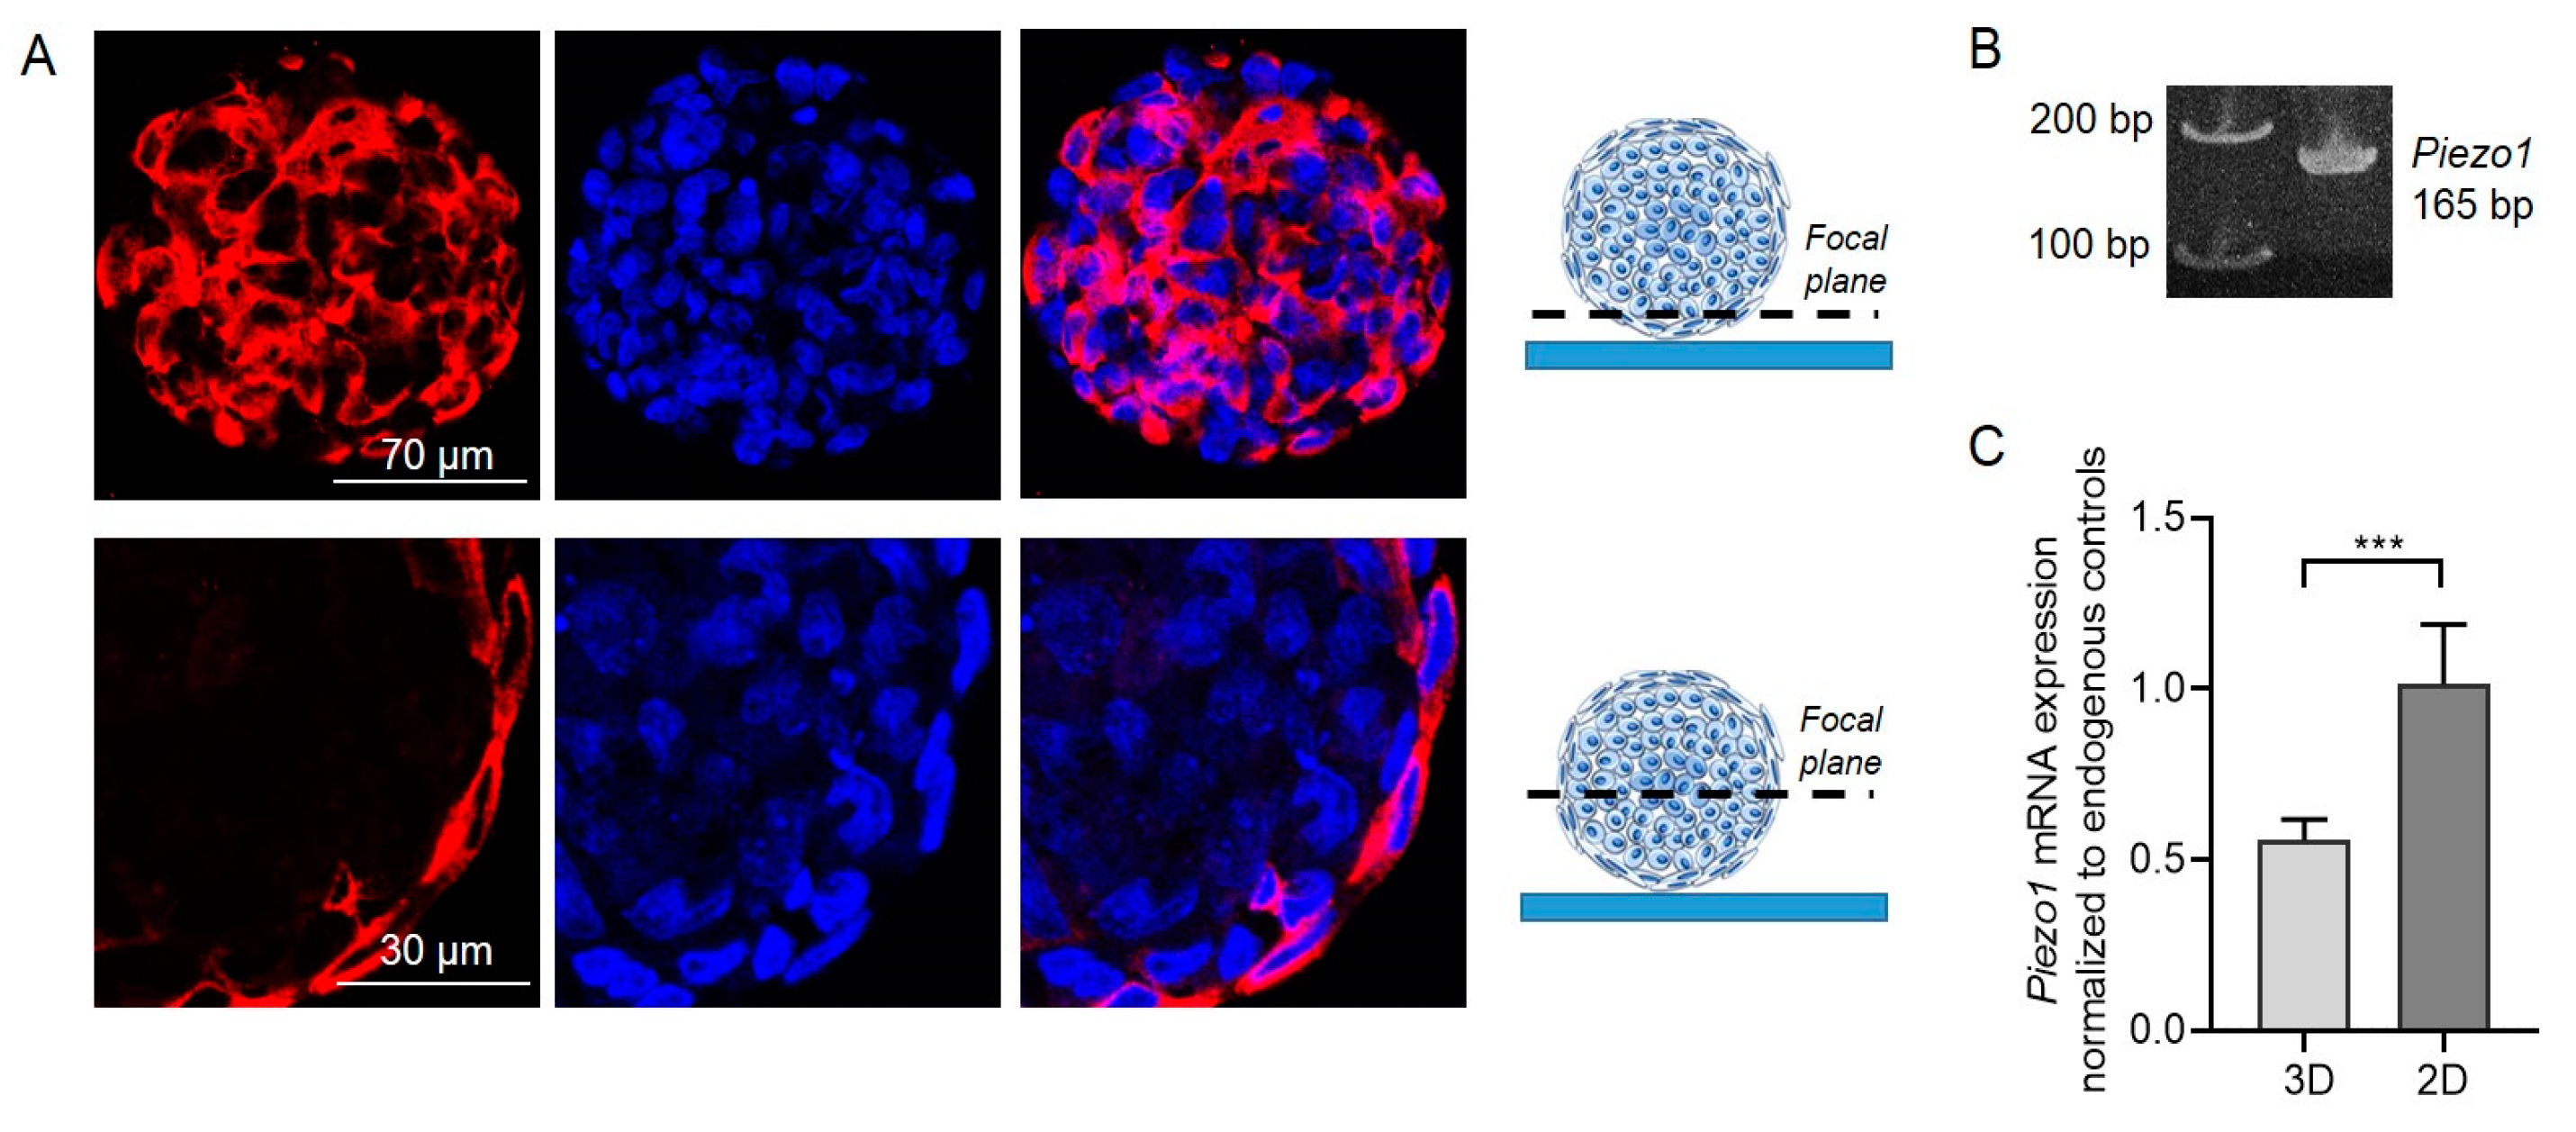
Figure 2.
Selective chemical Piezo1 agonist, Yoda1, evokes Ca2+ entry in eMSC spheroids. Shown are pseudo-colored images of the representative spheroid loaded with Fluo8 Ca2+ probe demonstrating the increase of [Ca2+]i after application of 10 µM Yoda1. Ca2+ ionophore ionomycin (IM) was applied at the end of each experiment to evoke maximal Ca2+ entry (maximal Fluo8 fluorescence). The level of basal fluorescence (in 2 Ca, before Yoda1 addition) and fluorescence after Yoda1 application (Y1) of each cell was normalized to the maximal Ca2+ entry (fluorescence after ionomycin, IM). Shown are normalized mean (± S.D.) fluorescence values of n=24 cells from n=3 independent experiments (individual spheroids). ****- significantly different, paired t-test, p<0.0001.
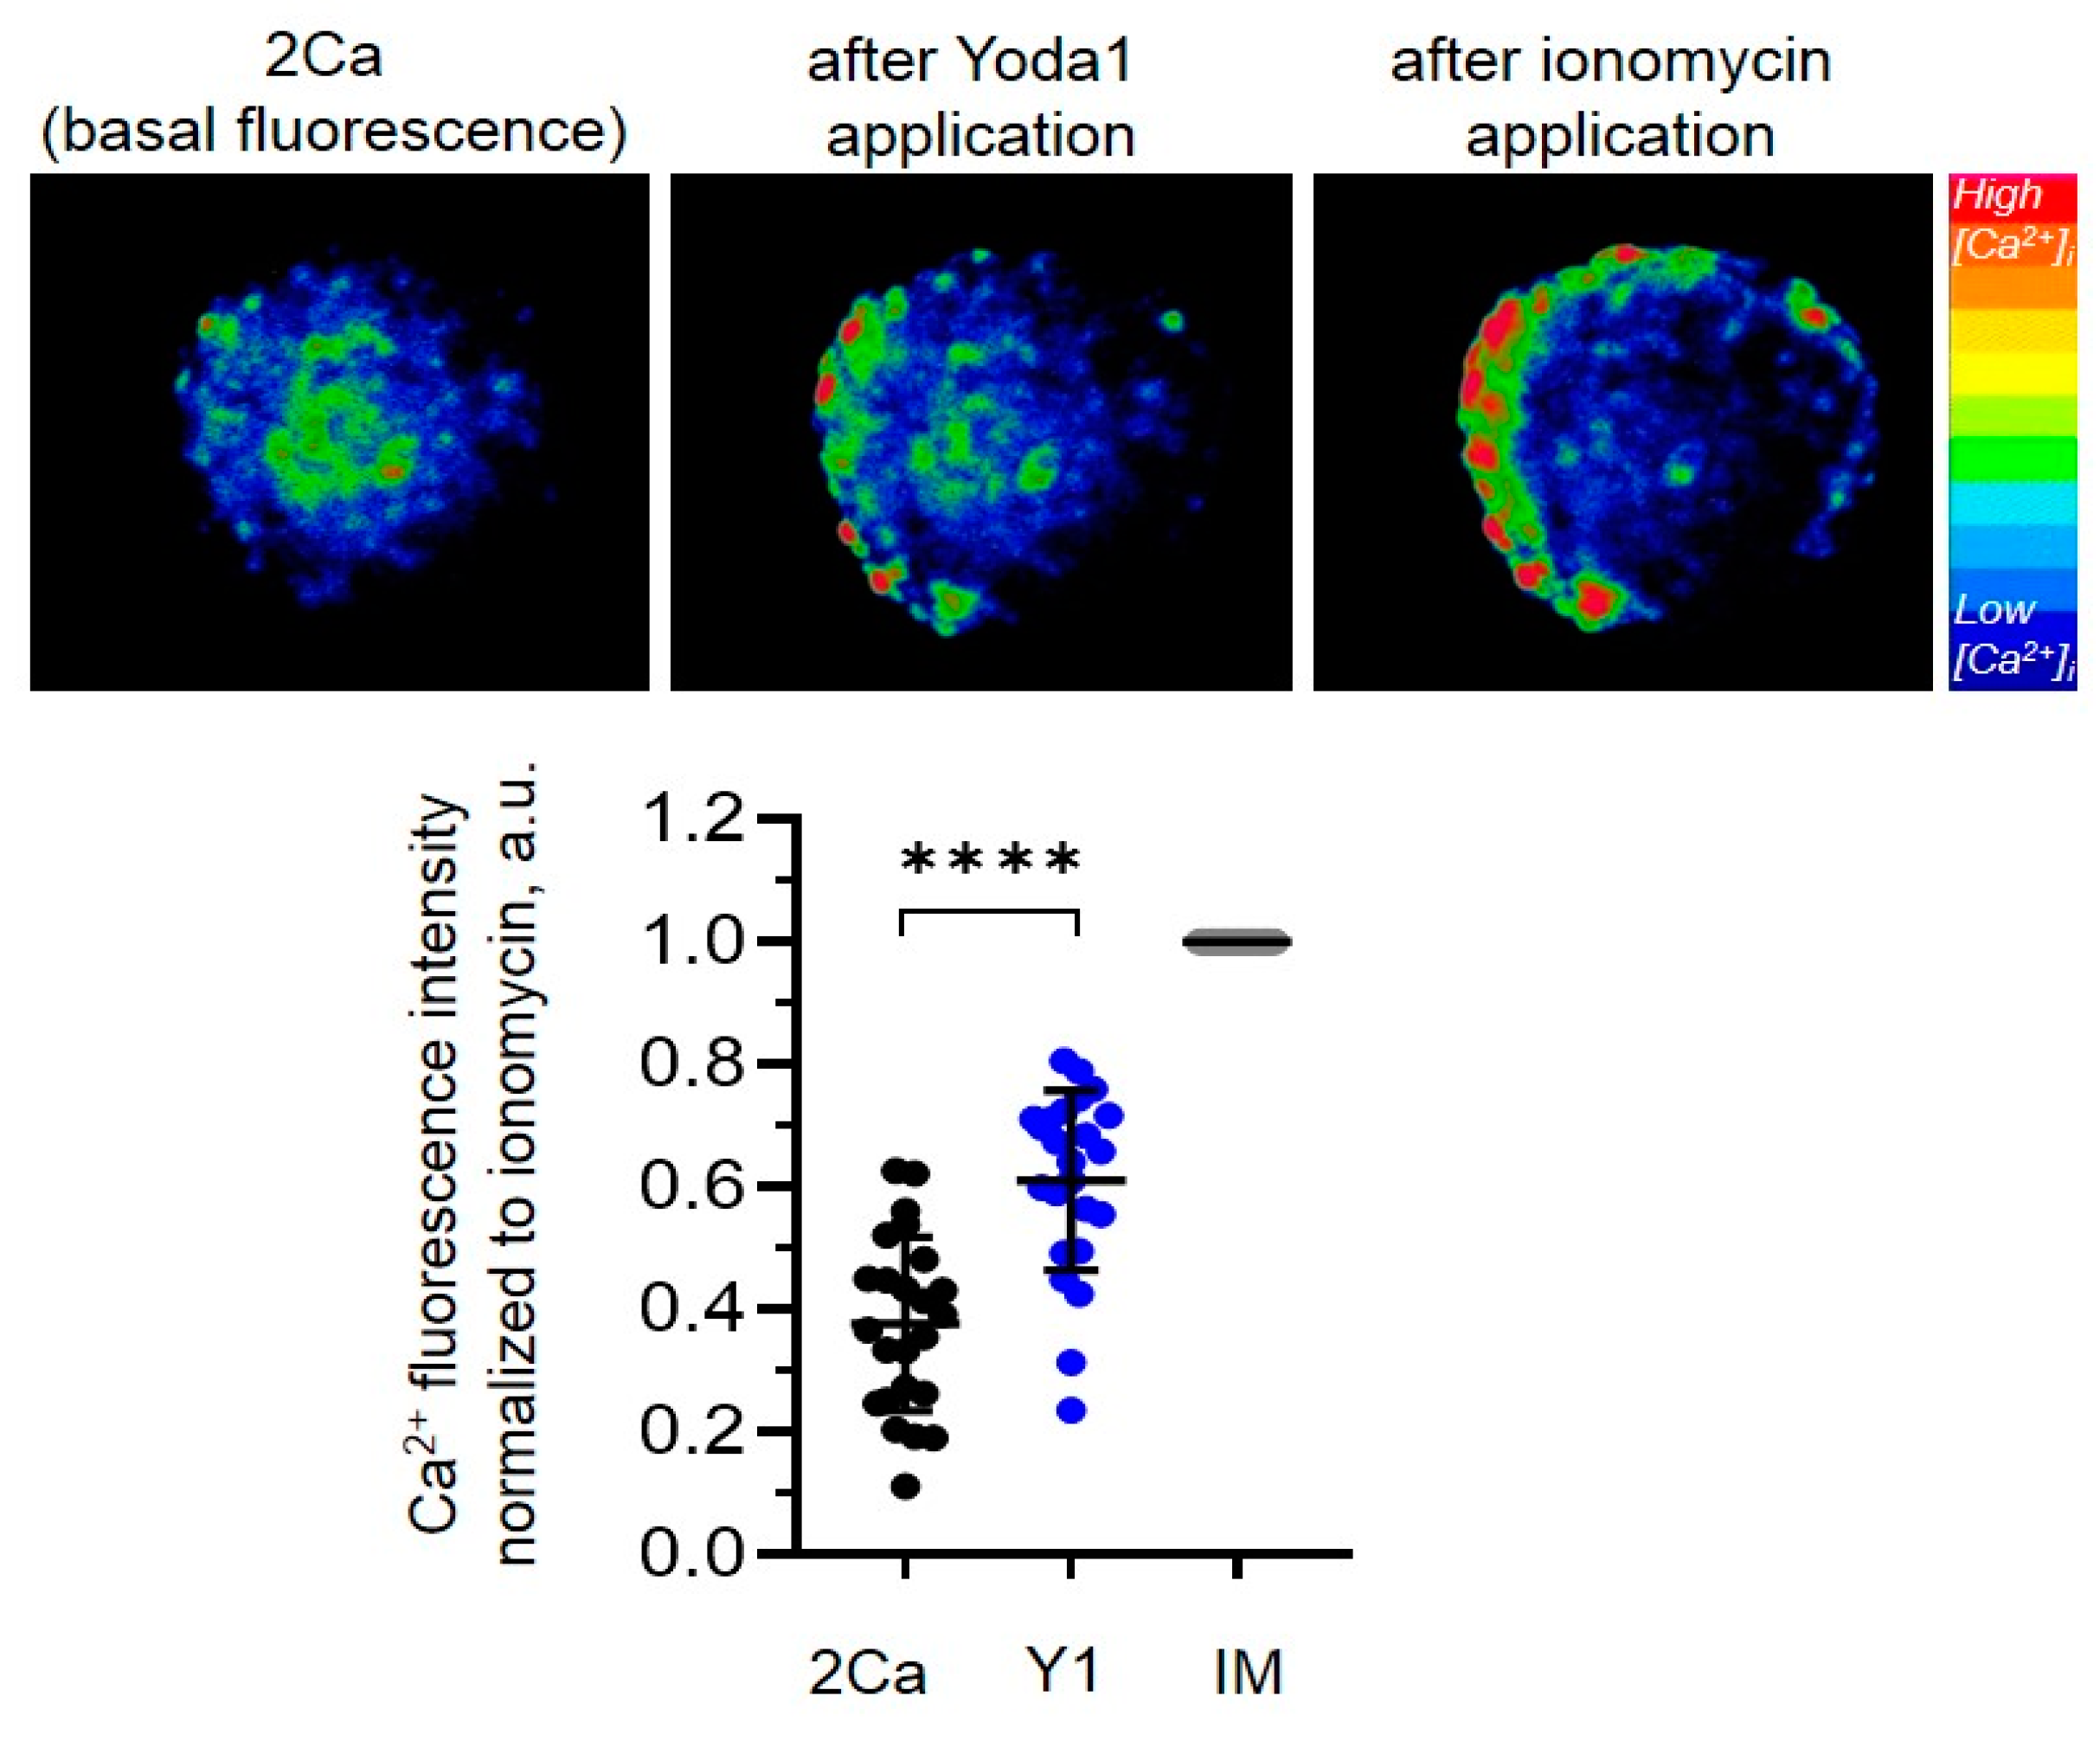
Figure 3.
The presence of Yoda1 in the hanging drops during eMSCs spheroid formation affects the morphological parameters of the spheroids. (A) Shown are the cells in different stages of spheroid formation at 24, 48 and 72 h in control (0.1% DMSO) and in the presence of 10 µM Yoda1. Note the dark color of the spheroids that indicate that the cells in hanging drops are viable (see Materials and Methods for details). (B) The morphological parameters of the spheroids after 72 h. The exposure of eMSCs to Yoda1 resulted in the formation of smaller (lower area) and more irregular (less circular and more elongated) spheroids, compared to control. Shown are medians (inside the box), upper and lower quartiles (box borders) and minimal and maximal values (whiskers). The area, circularity and aspect ratio parameters are significantly different between the groups (****p<0.0001, Mann-Whitney test). Total of n=230 control and n= 98 spheroids formed with Yoda1 were analyzed.
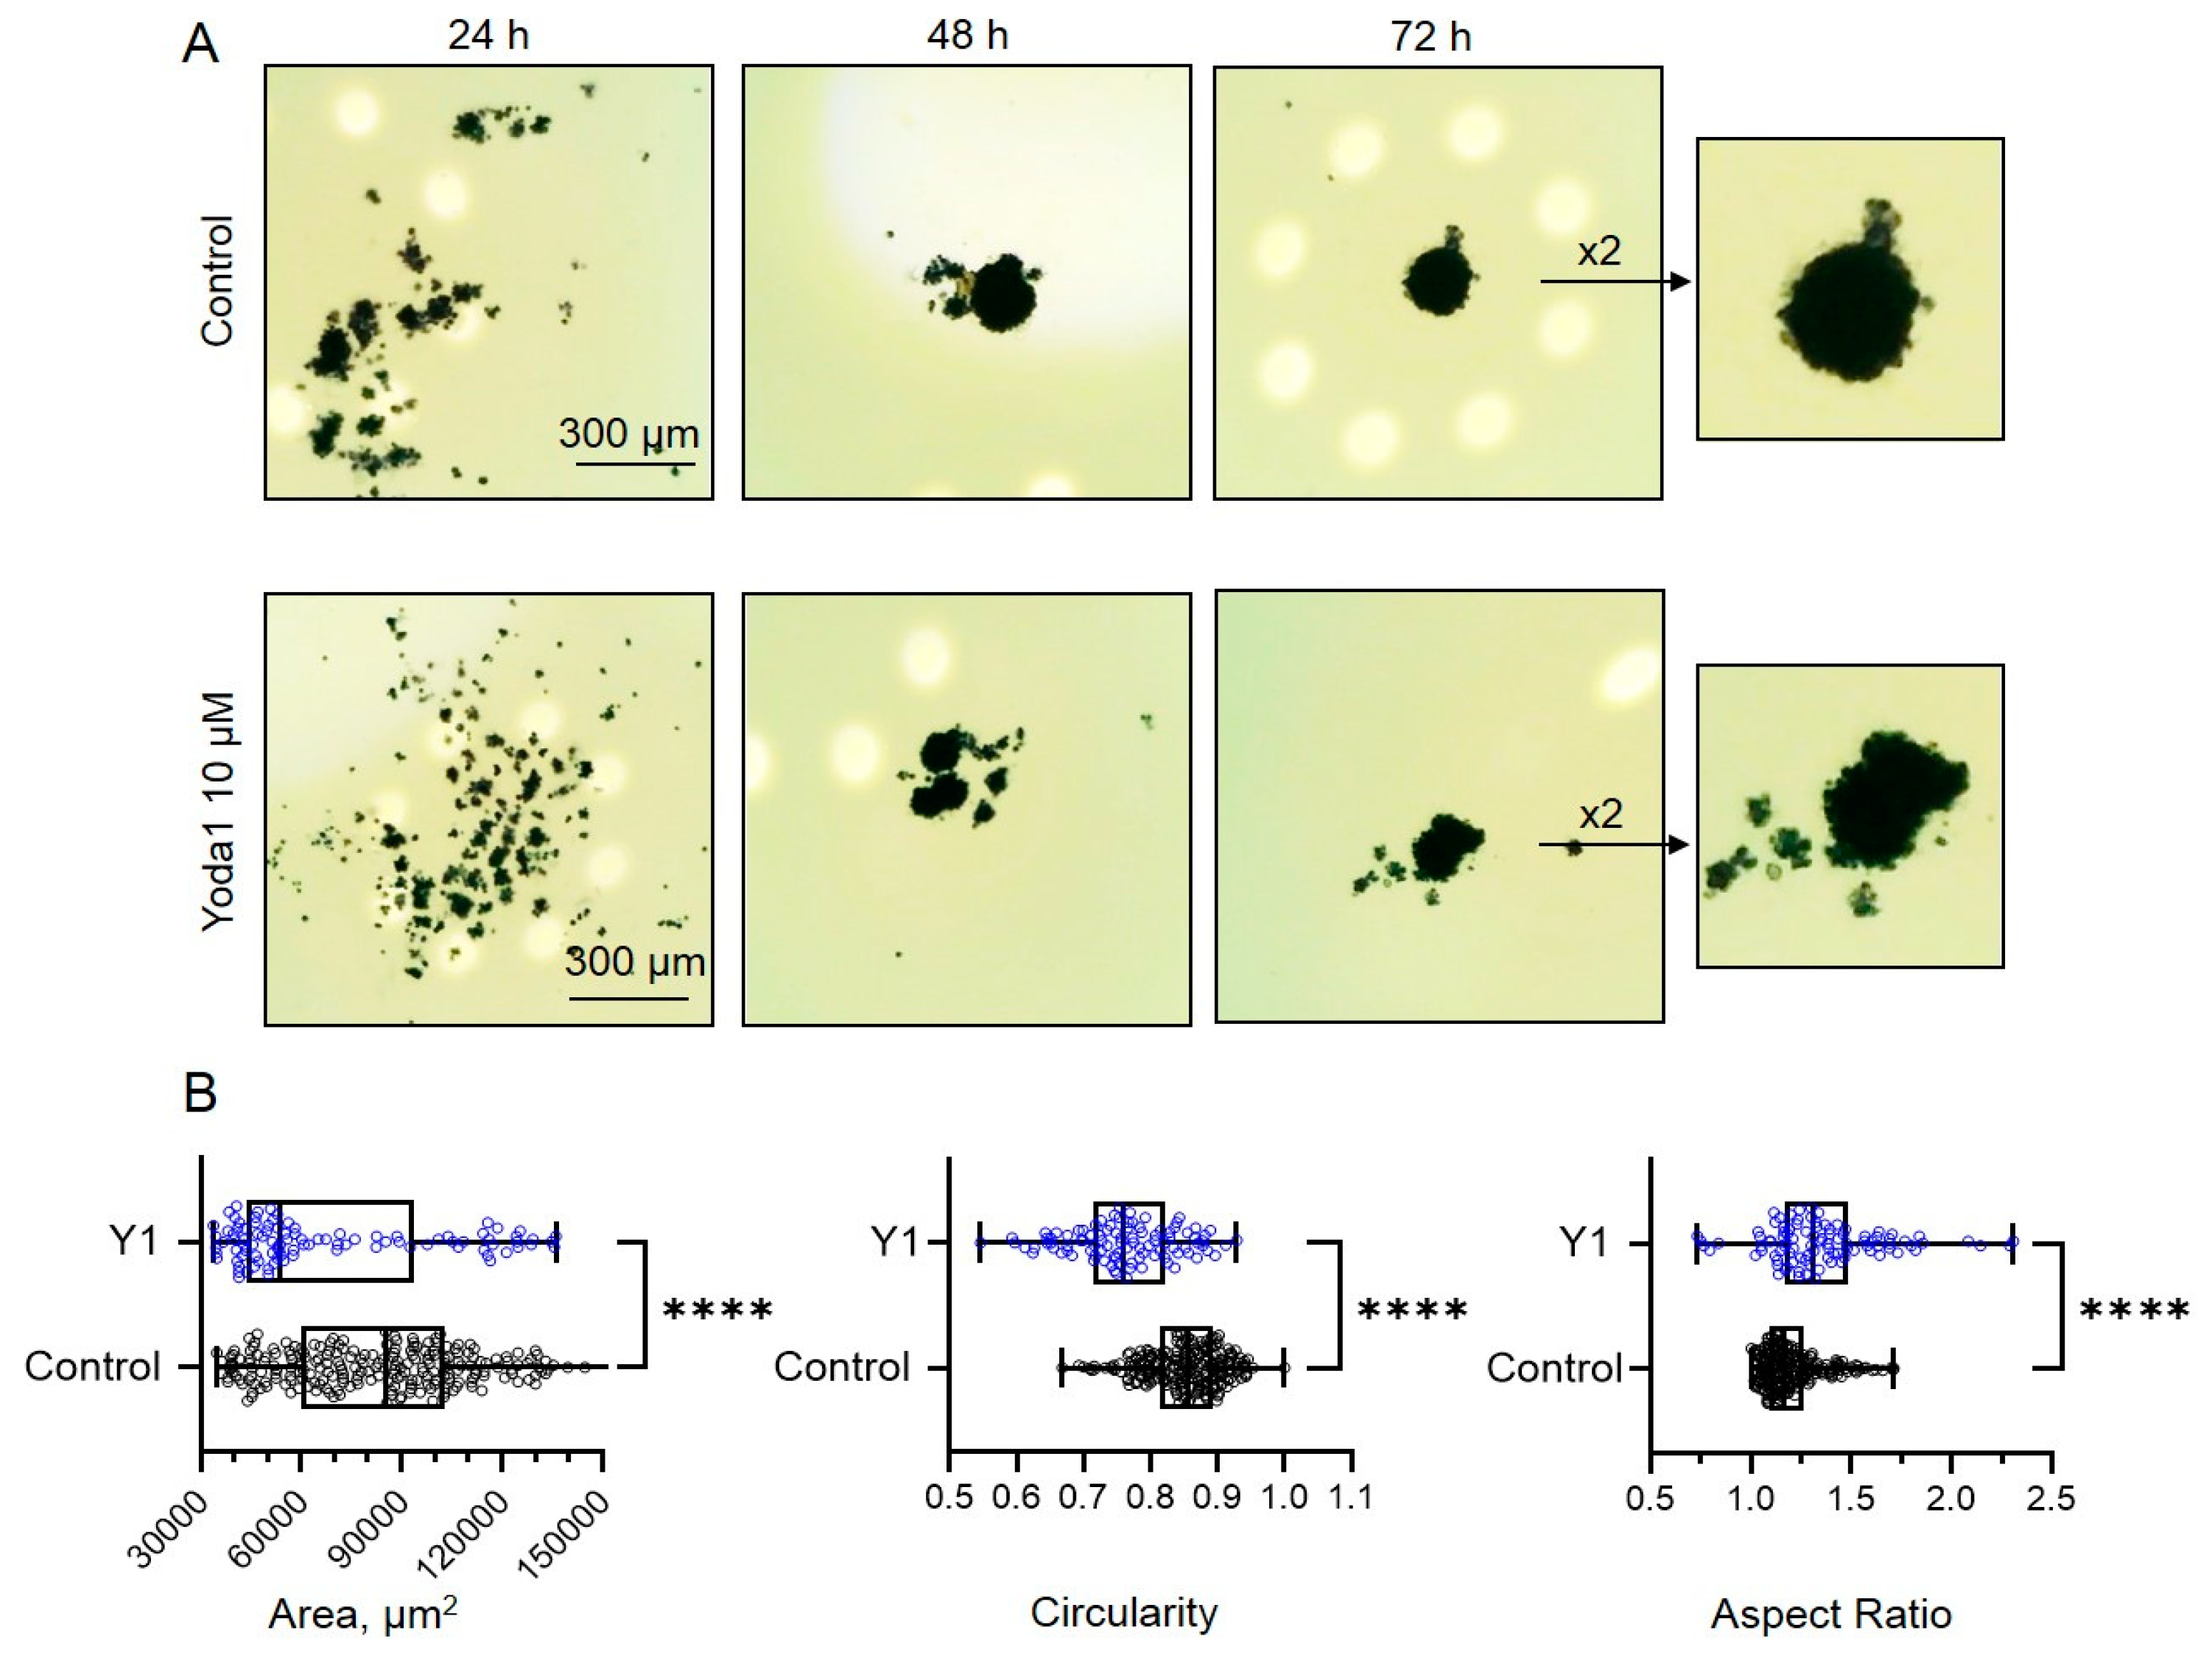
Figure 7.
eMSCs spreading rates on plastic and glass surfaces is dependent on Piezo1 activity. On the left - the S2/S1 vs S1 data points are plotted for spheroids formed under control conditions (Control) and in the presence of Yoda1 (Y1) spreaded on plastic (Plastic control and Y1, black dots) and glass (Glass control and Y1, green dots). Note almost similar distributions of experimental values for the spheroids formed with Yoda1 and spreaded on glass and plastic (Plastic Y1 and Glass Y1). Yoda1-formed spheroids were divided into two experimental groups, based on the median size of the spheroid area (S1). On the right ‒ corresponding quantifications of S2/S1 rates. Bar graphs showing medians with ranges and all experimental points in the dataset. ns - non-significantly different, *p<0.05, ** p<0.01. Mann-Whitney test. Total number of control spheroids spread on plastic (n=78) or glass (n=30); Yoda1-treated spheroids spreaded on plastic (n=24) or glass (n=22).
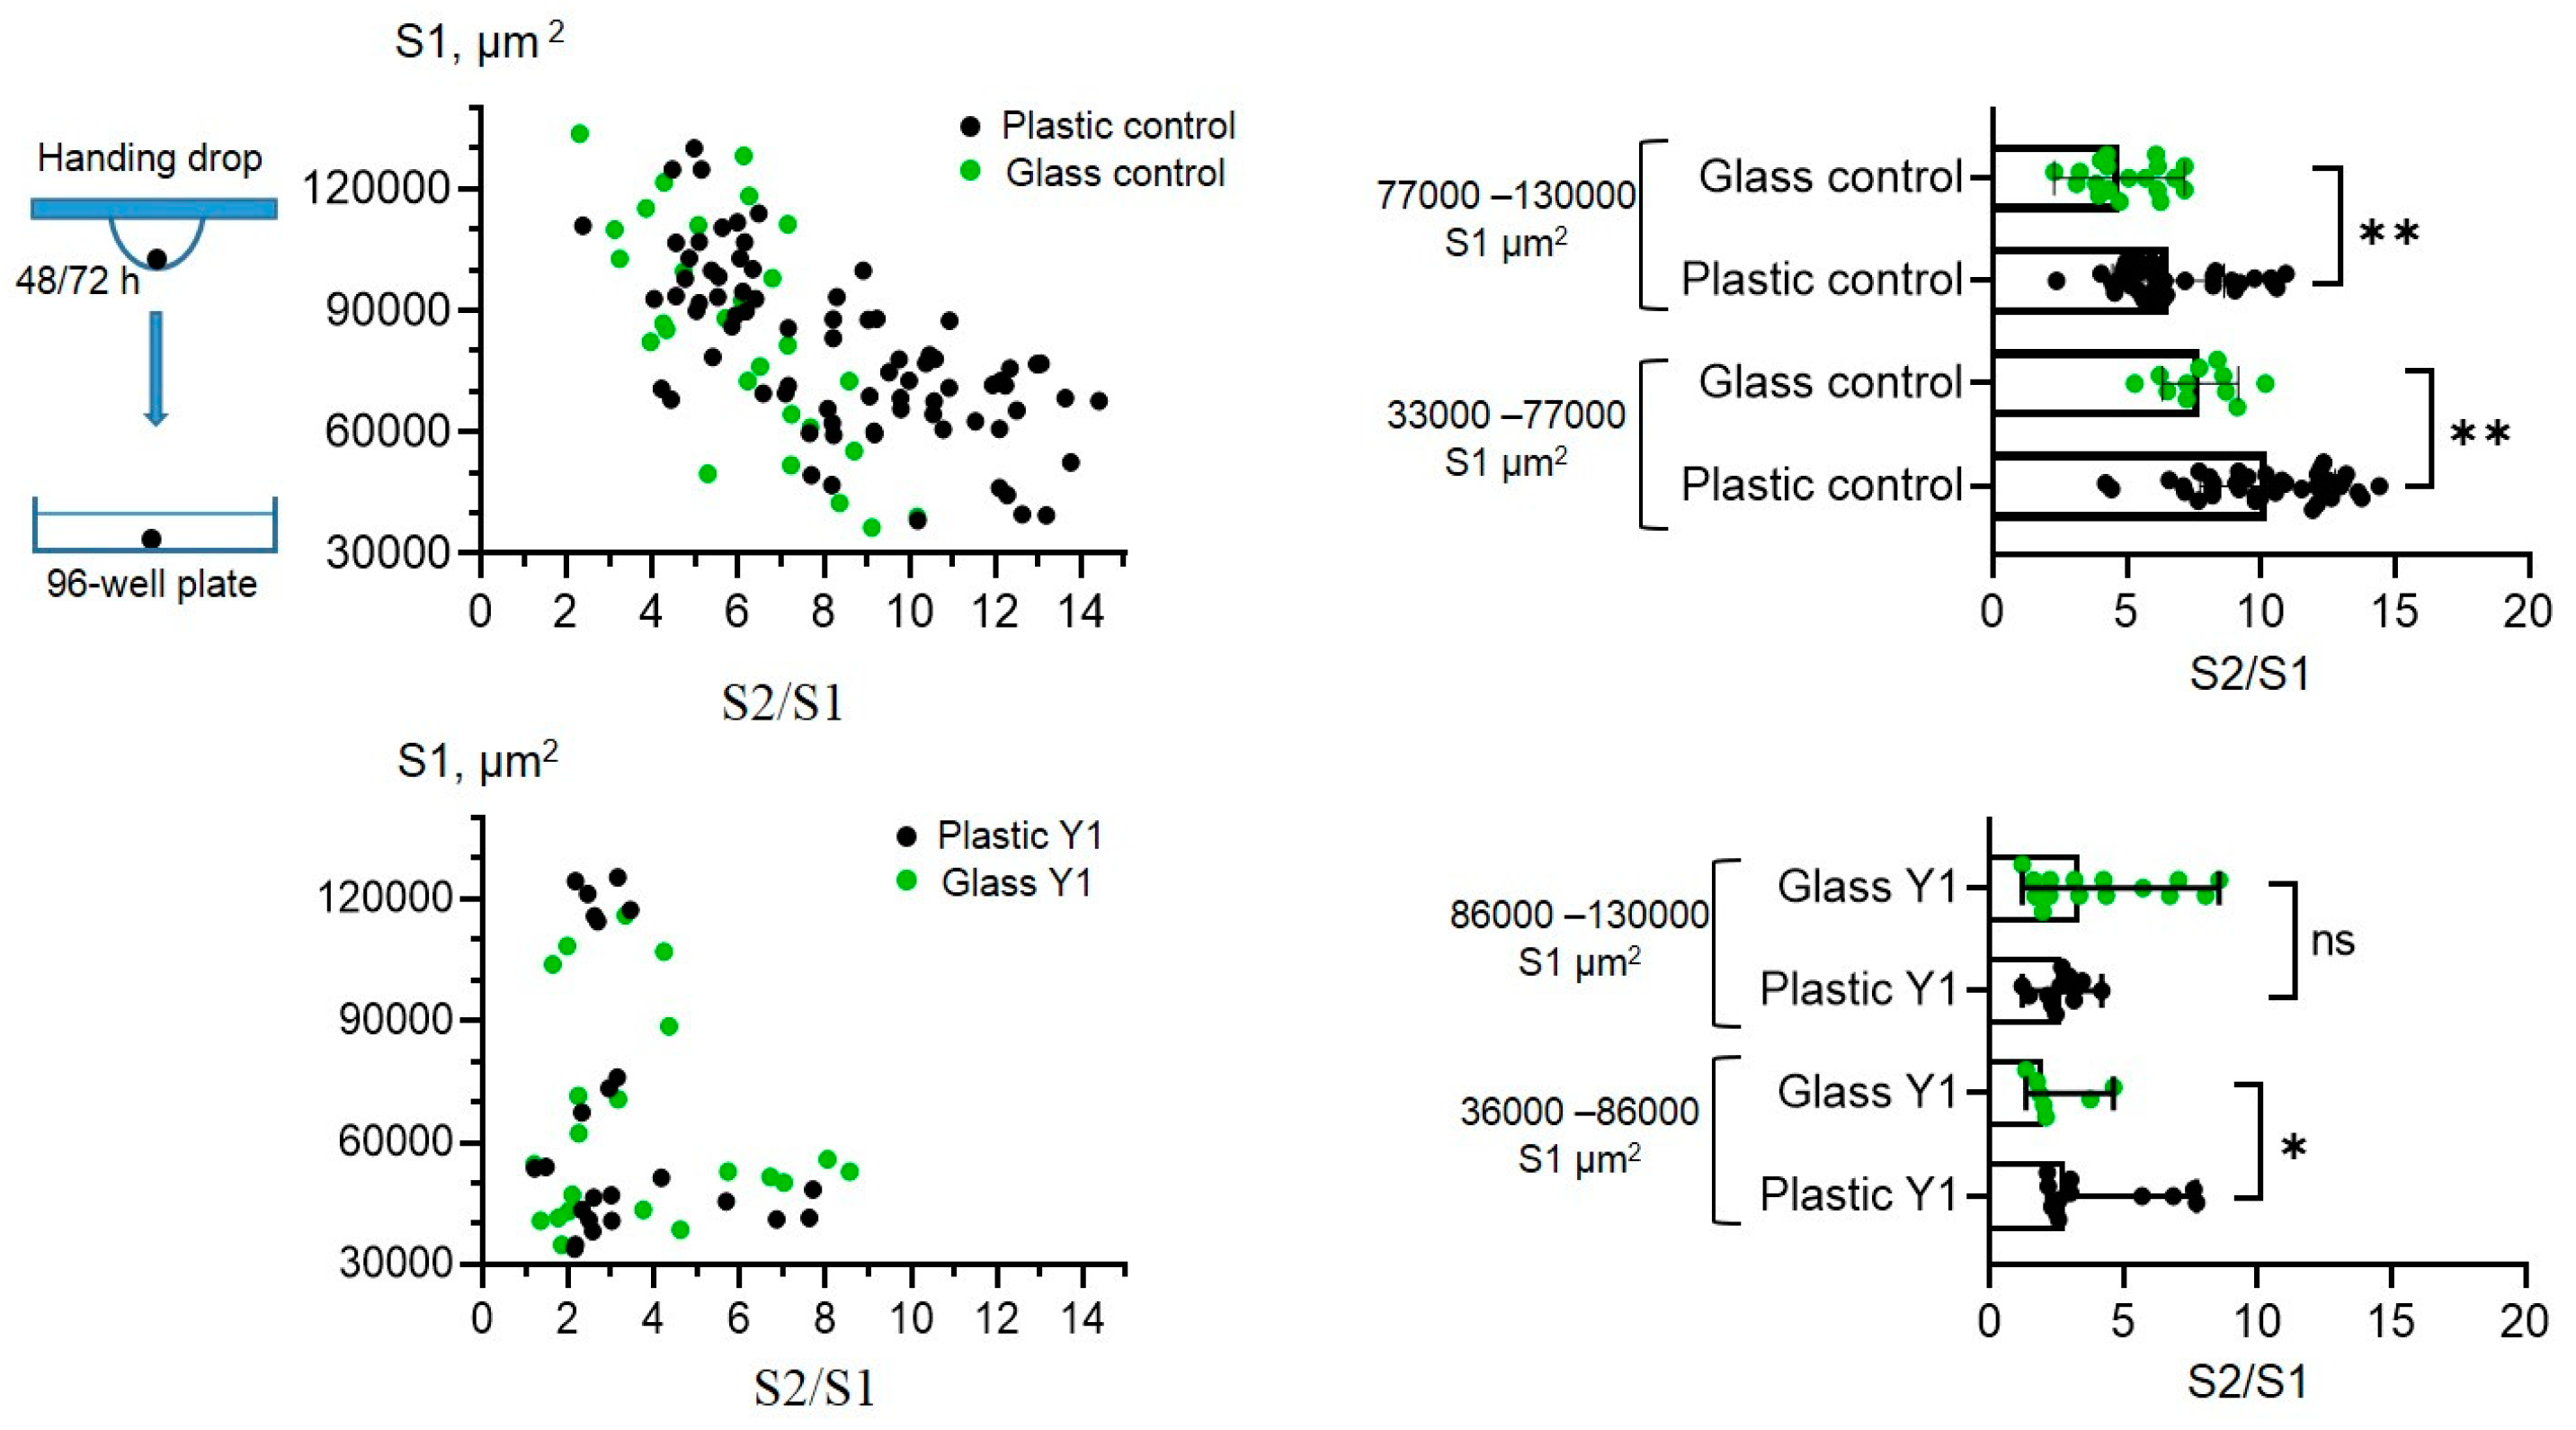

Table 1.
Primer sequences (5’ to 3’) used for qPCR analysis. HPRT1 and TBP encodes hypoxanthine phosphoribosyltransferase 1 and TATA-box binding protein, respectively, were used as reference genes.
Table 1.
Primer sequences (5’ to 3’) used for qPCR analysis. HPRT1 and TBP encodes hypoxanthine phosphoribosyltransferase 1 and TATA-box binding protein, respectively, were used as reference genes.
| Gene | Primer sequence |
|---|---|
| Piezo1 | forward: ACTTTCCCATCAGCACTCGG; reverse: CCAAGCAGTCCTTGAGACCC |
| HPRT1 | forward: TGACACTGGCAAAACAATGCA; reverse: GGTCCTTTTCACCAGCAAGCT |
| TBP | forward: CACGAACCACGGCACTGATT; reverse: TTTTCTTGCTGCCAGTCTGGAC |
Disclaimer/Publisher’s Note: The statements, opinions and data contained in all publications are solely those of the individual author(s) and contributor(s) and not of MDPI and/or the editor(s). MDPI and/or the editor(s) disclaim responsibility for any injury to people or property resulting from any ideas, methods, instructions or products referred to in the content. |
© 2025 by the authors. Licensee MDPI, Basel, Switzerland. This article is an open access article distributed under the terms and conditions of the Creative Commons Attribution (CC BY) license (http://creativecommons.org/licenses/by/4.0/).
Copyright: This open access article is published under a Creative Commons CC BY 4.0 license, which permit the free download, distribution, and reuse, provided that the author and preprint are cited in any reuse.


