1. Introduction
Combined sewer overflow (CSO) pollution has emerged as a critical challenge for urban water management worldwide [
1]. During rainfall event, exceeding the conveyance capacity of sewer networks or treatment capacity of wastewater treatment plants, excess untreated mixed sewage is discharged directly into receiving waters via overflow structures. Such discharges typically contain high concentrations of organic matter, nutrients, and suspended solids, which constitute the dominant fraction of CSO pollution loads and drive the primary water quality impacts. In addition, CSO discharges may transport trace pollutants associated with particulate matter [
2], reflecting the coupled behavior of pollutants during overflow events.
CSO discharges trigger a wide range of environmental risks. They accelerate eutrophication and the formation of black-odor water bodies [
3], disrupt the structures and function of aquatic ecosystem [
4], increase the transmission risk of pathogenic microorganisms, and pose long-term threats to human health due to chronic exposure to toxic substances [
5]. Frequent CSO events also impose considerable operational and maintenance burdens on urban drainage infrastructure [
6,
7]. In China, where wastewater collection and treatment capacities are increasing and point-source pollution is largely controlled [
8], CSO has become a major contributor to urban non-point source pollution. Therefore, systematic CSO control is essential for safeguarding water quality, ecosystem integrity, public health, and sustainable urban development [
9,
10].
Although rainfall precipitation was widely recognized as key drivers of runoff wash-off and CSO generation [
11], CSO pollution is not a simple consequence of individual rainfall events. Rather, it results from a complex sequence of interconnected processes, including dry-weather pollutant accumulation, rainfall-induced transport, in-sewer transport, and eventual overflow discharge. Existing research mainly concentrated on pollutant transport and discharge mechanisms during rainfall, focusing on rainfall–runoff responses, sewer sediment mobilization driven by rapidly increasing flow, and pollutant release through CSO structures, with comparatively limited attention to pollutant accumulation during antecedent dry period (ADP) and its influence on subsequent CSO pollution dynamics. This knowledge gap limits accurate load prediction and weakens the scientific basis for targeted control strategies.
Surface sediments derive from atmospheric deposition, vehicular abrasion particles, and biogenic debris [
12], and their accumulation is influenced by ADP, street sweeping frequency, and wind disturbances [
13]. Conceptual model describing street particle production, transport, and delivery has been developed [
14], but field-based verification at the event-scale remains limited. Sewer sediments, primarily from domestic wastewater and redeposited surface runoff [
15], with additional contributions from sewer biofilms [
16]. Pollutant stocks accumulate continuously during dry periods, and their magnitude governs the potential for CSO pollution release [
17]. Nevertheless, interactions among multiple pollutant source reservoirs and their chain-response behaviors during rainfall events remain poorly understood, hindering mechanism-based source apportionment and control.
Moreover, pollutant release characteristics vary significantly across land-use types and surface categories. Organic pollutants and nutrients are generally higher in commercial areas than in residential zones [
18], while transportation streets are typically dominated by suspended solids and heavy metals [
19]. In contrast, rooftop runoff generally exhibits relatively low pollution levels [
20]. Pronounced first-flush effects are widely reported in surface runoff [
21,
22,
23]. Rainfall depth, intensity, and duration strongly influence overflow pollutant loads [
24,
25]. However, most studies focus on these output-side drivers, while the internal coupling mechanisms linking pollutant accumulation and transport remains inadequately understood.
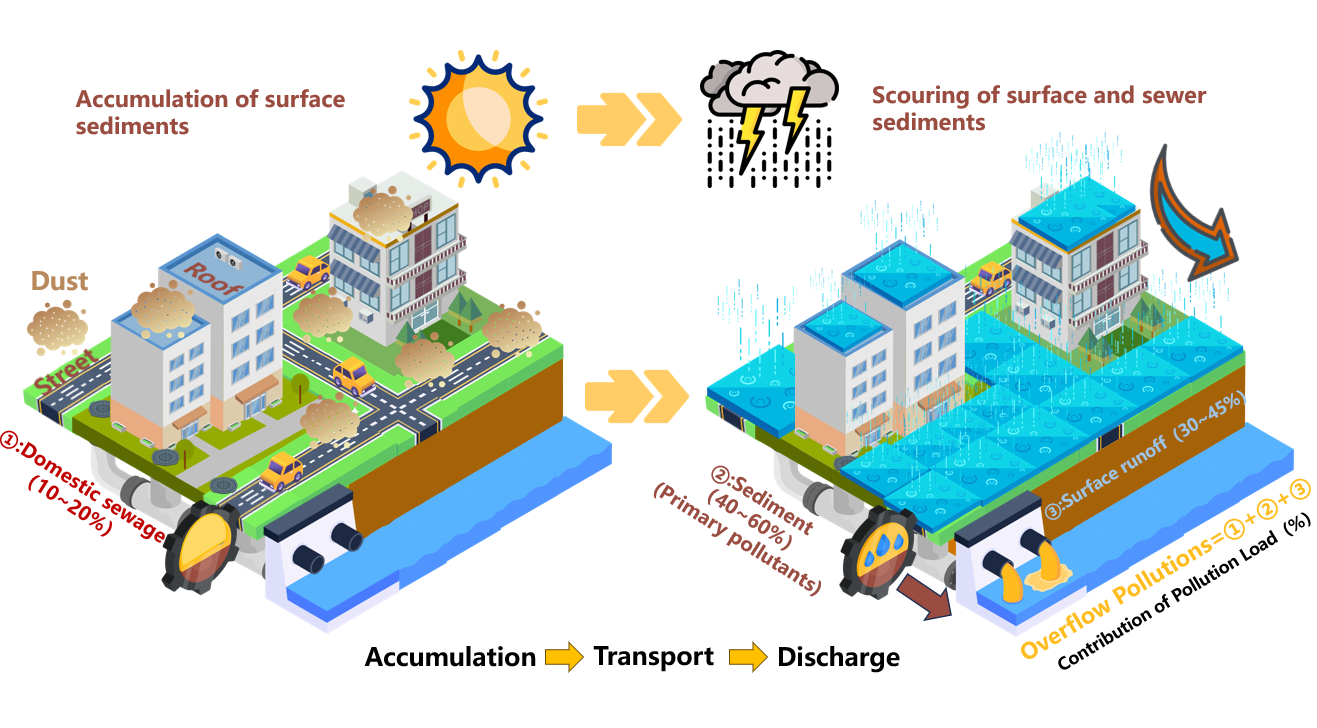
Overall, domestic sewage, surface runoff, and sewer sediments constitute the primary pollutant sources in CSO systems [
26]. Domestic sewage contributes substantially to background loads in the absence of rainfall dilution [
27]. Sewer sediments can account for up to 60–70% of total pollutant loads [
28]. A comprehensive understanding the composition and contribution mechanisms of these sources is essential for advancing CSO management from traditional static assessments toward integrated strategies encompassing source reduction, in-system process control, and end-of-pipe regulation.
To address these gaps, this study aims to investigate how CSO pollution responses and source apportionment under the dual drivers of dry-weather pollutant accumulation and rainfall characteristics. A typical combined sewer catchment in the central urban area of a Chinese city was selected, and an integrated sampling and analytical framework was developed to capture the full sequence of pollutant accumulation, transport, and discharge processes. From both temporal and spatial perspectives, this study systematically elucidates accumulation patterns of domestic sewage, surface sediments, and sewer sediments, and quantitatively evaluates their respective contributions to CSO pollution. The results advance mechanistic understanding beyond traditional static evaluation, providing both theoretical insights and practical guidance for precision control and optimized management of CSO in urban drainage systems.
3. Results and Discussion
3.1. Accumulation of Surface Sediment
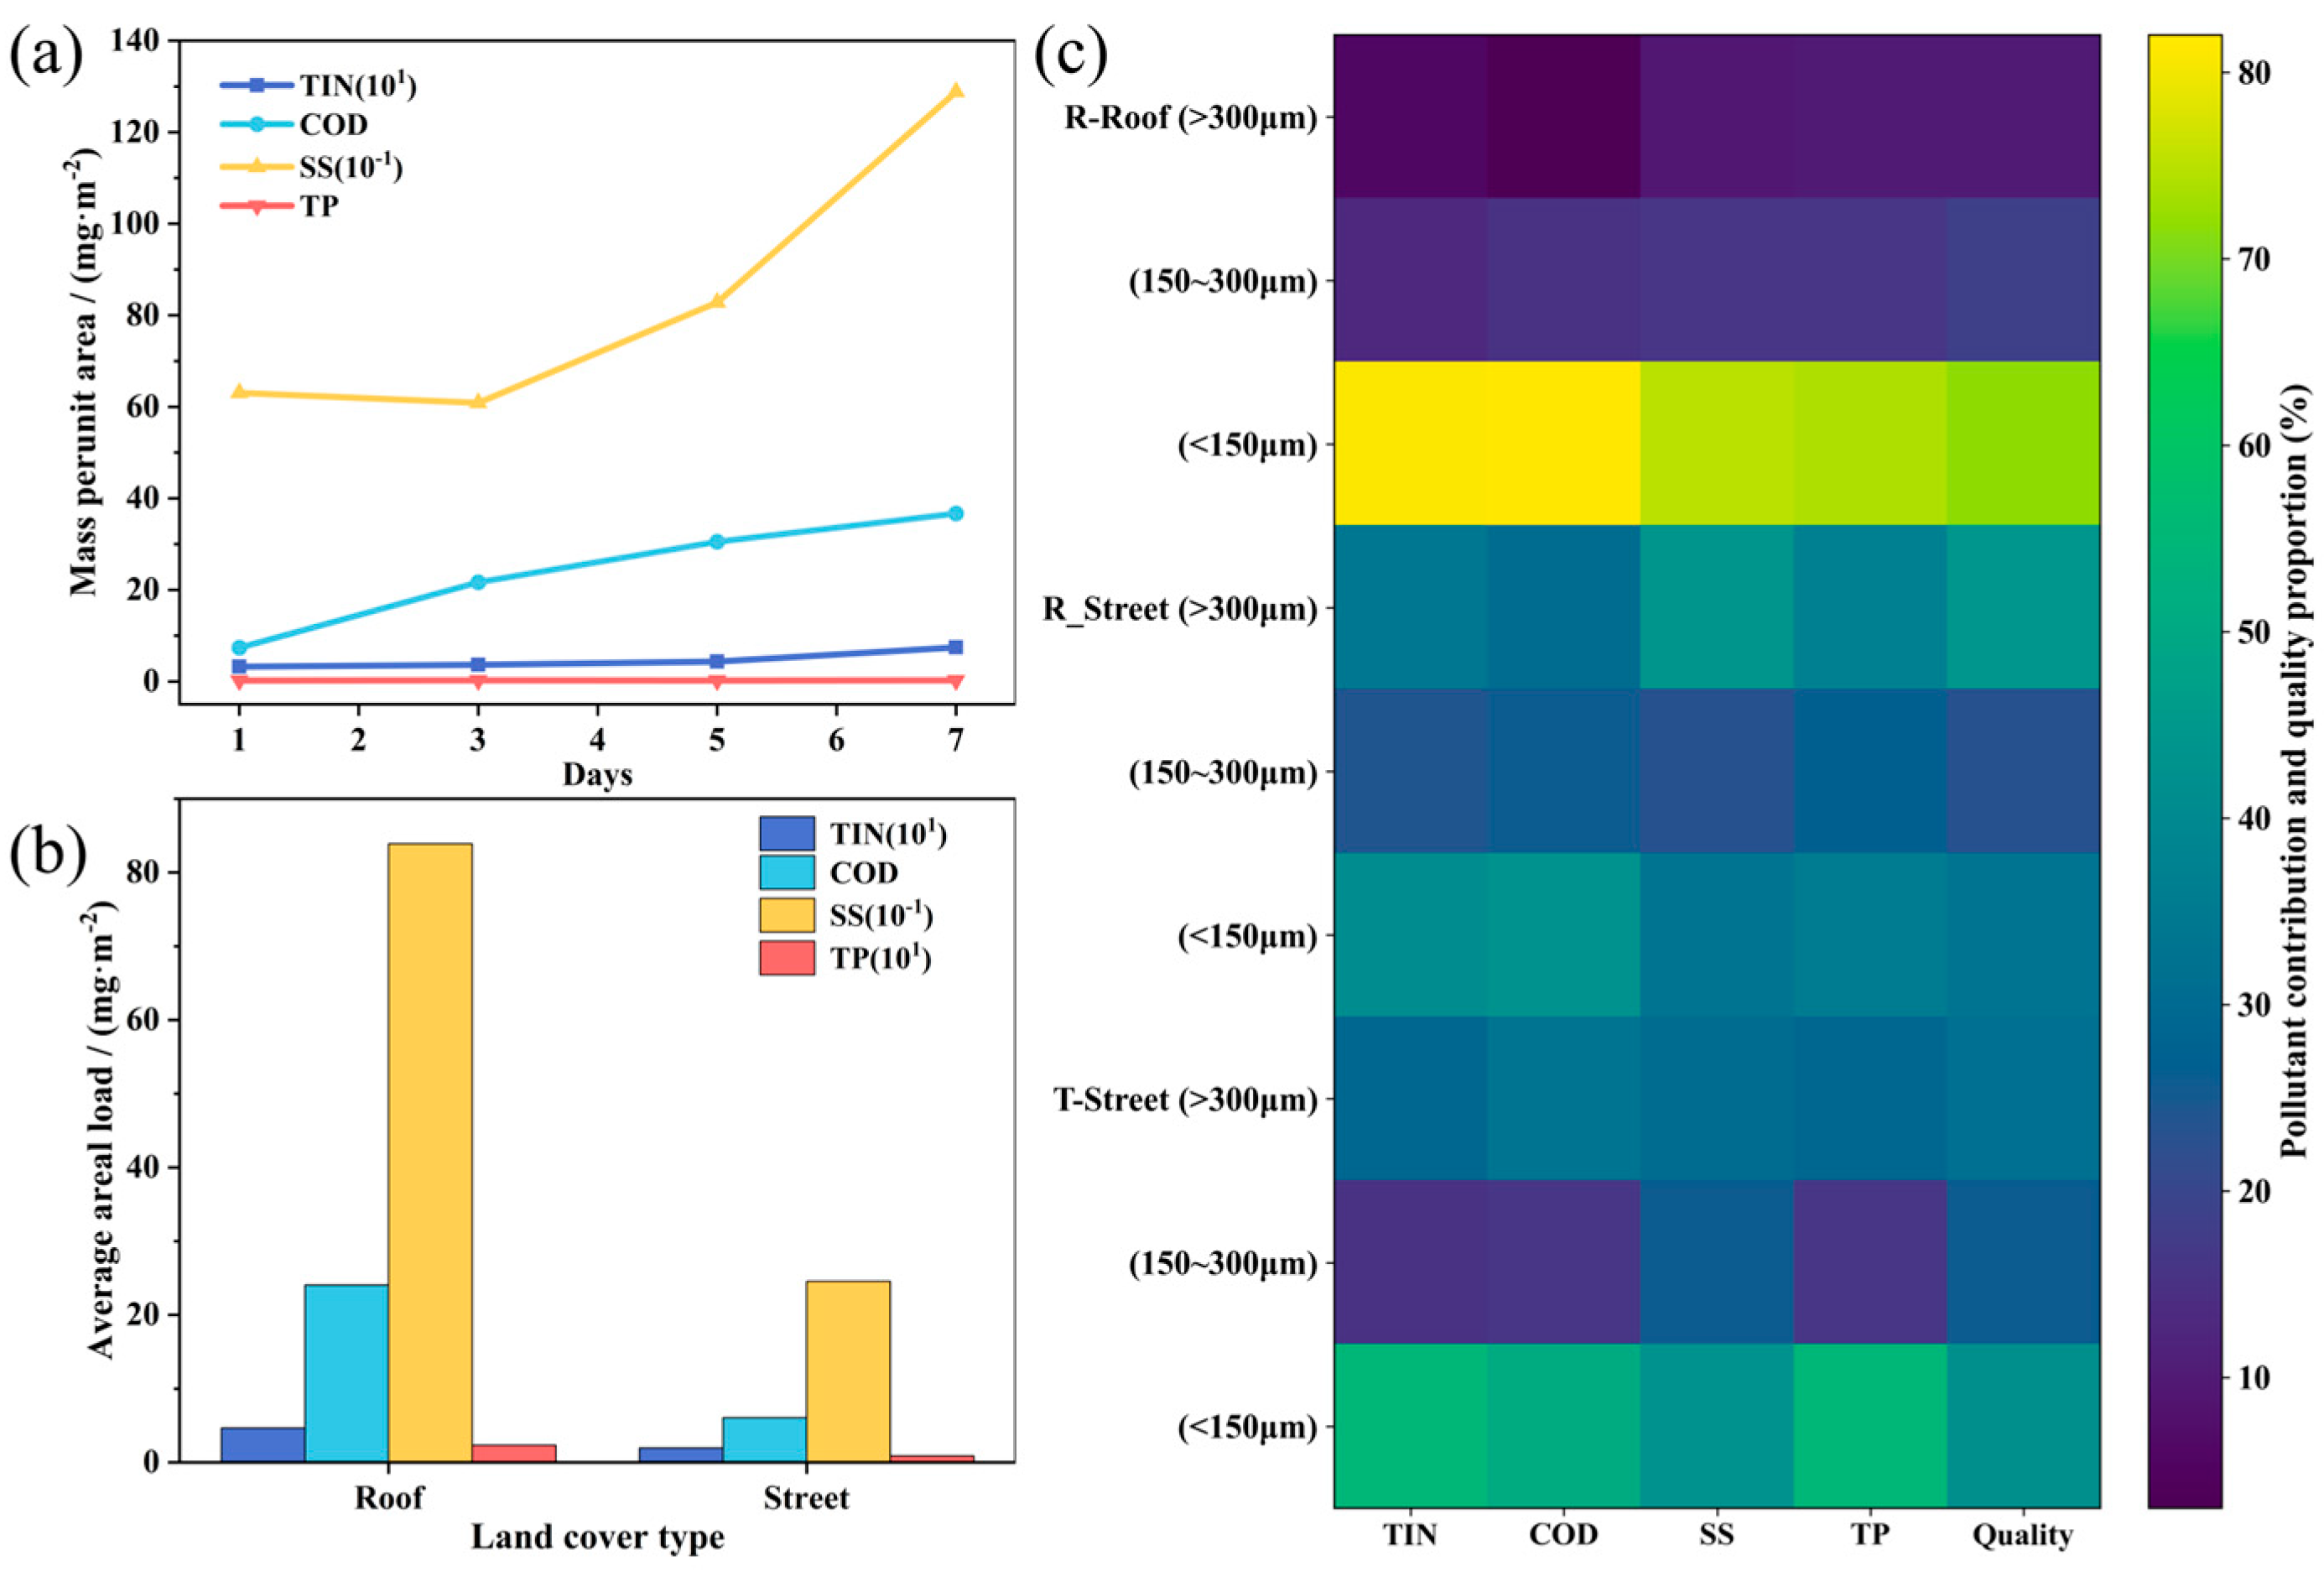
Urban surface sediments function as major carriers of CSO pollutants, and their build-up directly influences the magnitude of first-flush wash-off and associated discharge risks [
40]. Rooftop sediments in residential areas illustrate these dynamics (
Figure 2(a)). Across dry periods of 1–7 days, pollutant loads exhibited clear accumulation patterns: while TP, which remained relatively stable, TIN, COD, and SS increased markedly with prolonged dry days. For example, COD loads increased from 7.36 mg/m
2 after 1 dry day to 21.66, 30.51, and 36.67 mg/m
2 after 3, 5, and 7 dry days, respectively, reflecting continuous inputs from atmospheric deposition and gravitational settling during dry periods.
Marked differences in sediment loads were observed across surface types. Street sediments exhibited considerably lower loads TIN, COD, SS, and TP loads of 0.11–0.38, 2.50–9.03, 57.23–513.53, and 0.06–0.39 mg/m
2, respectively, whereas rooftop sediments exhibited substantially higher ranges of 0.32–0.74, 7.36–36.67, 608.69–1288.00, and 0.22–0.25 mg/m
2 (
Table S1). This pronounced “rooftop dust > street dust” gradient (
Figure 2(b)) is mainly attributed to the low-disturbance conditions on rooftops, which facilitate long-term particle accumulation. In contrast, vehicular movement and routine street sweeping reduce sediment retention on road surfaces. Functionally, residential areas consistently exhibited higher sediment loads than transportation zones, implying less favorable dispersion and deposition environments within densely populated neighborhoods.
Particle-size distribution further governed sediment mobility and pollutant-carrying capacity [
14]. Sieving results showed that rooftop sediments were dominated by fine particles (<100 μm), accounting for 46.5% of total mass, combined fine and medium-fine fractions (100–150 μm) contributed 71.7% (
Figure 2(c)), consistent with observations by Miguntanna et al.[
41]. In transportation areas, coarse (>300 μm) and fine (<100 μm) fractions were similarly abundant (31.7% and 30.6%), whereas residential street dust was characterized by medium-coarse and coarse particles (150–300 μm), which together contributed more than 65%. These differences reflect distinct disturbance conditions, with vehicular activity redistributing coarse particles on roads and residential areas accumulating mid-sized particles due to lower turbulence and weaker surface cleaning.
The linkage between particle size and pollutant contribution was further visualized using a heatmap (
Figure 2(c)). For rooftop sediments, particles smaller than 150 μm accounted for over 73% of all pollutant loads and peaked at 82.2%, underscoring the central role of fine particles as pollutant carriers due to their high specific surface area and abundant reactive sites [
42]. Conversely, in transportation areas, fine particles contributed much less to SS, and in residential street dust, pollutant loads were concentrated in medium and coarse fractions. These patterns emphasize that surface function and disturbance intensity jointly shape the pollutant-bearing characteristics of urban sediments.
3.2. Rainfall-Runoff Response Characteristics
Surface runoff is the primary vector transporting urban surface sediments [
43] and directly trigger CSO pollutant release. Its water-quality dynamics reflect both sediment wash-off responses and the integrated influence of rainfall characteristics and underlying surface conditions [
44]. In this study, three natural rainfall events (B, C, and D) were examined to characterize runoff pollution behaviors in residential and transportation zones and on different surface types (rooftop, street); rainfall event A was excluded because surface runoff samples could not be collected due to a temporary adjustment in field personnel scheduling. By integrating SWMM simulations with dry-weather pollutant build-up and rainfall-runoff wash-off formulations, the underlying pollutant-migration mechanisms were further revealed.
3.2.1. Runoff Pollutions of Rainfall Events
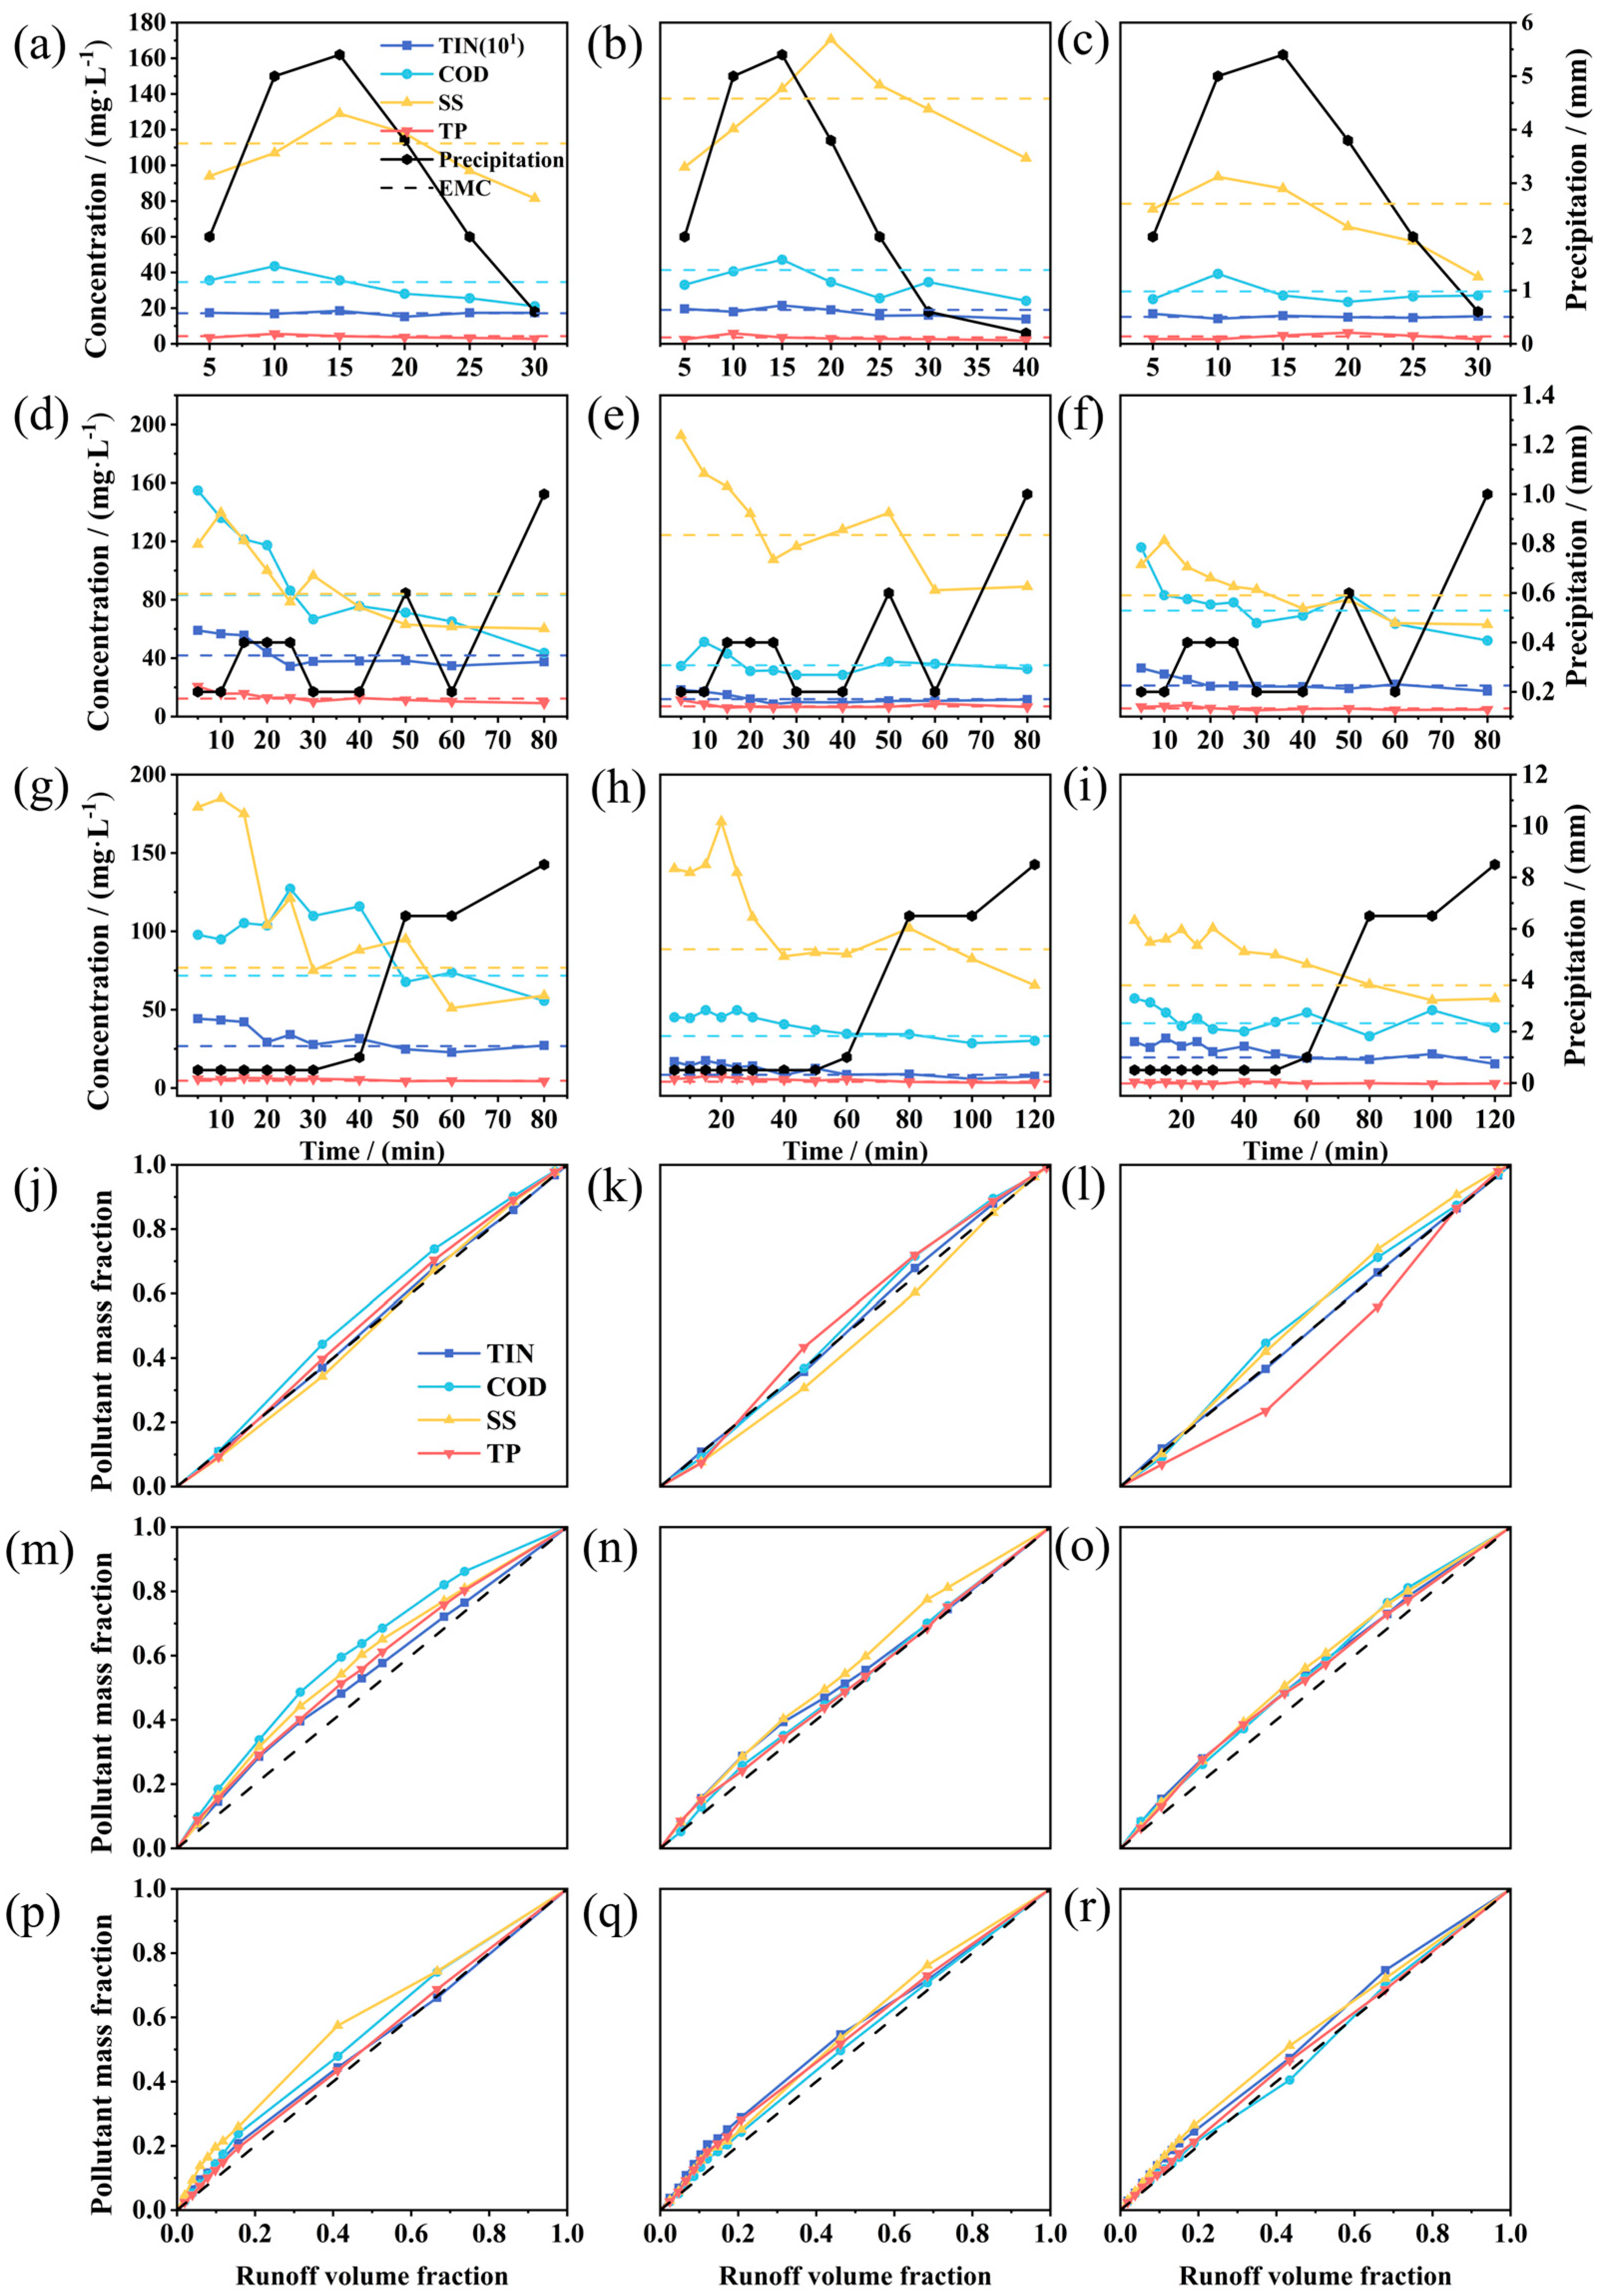
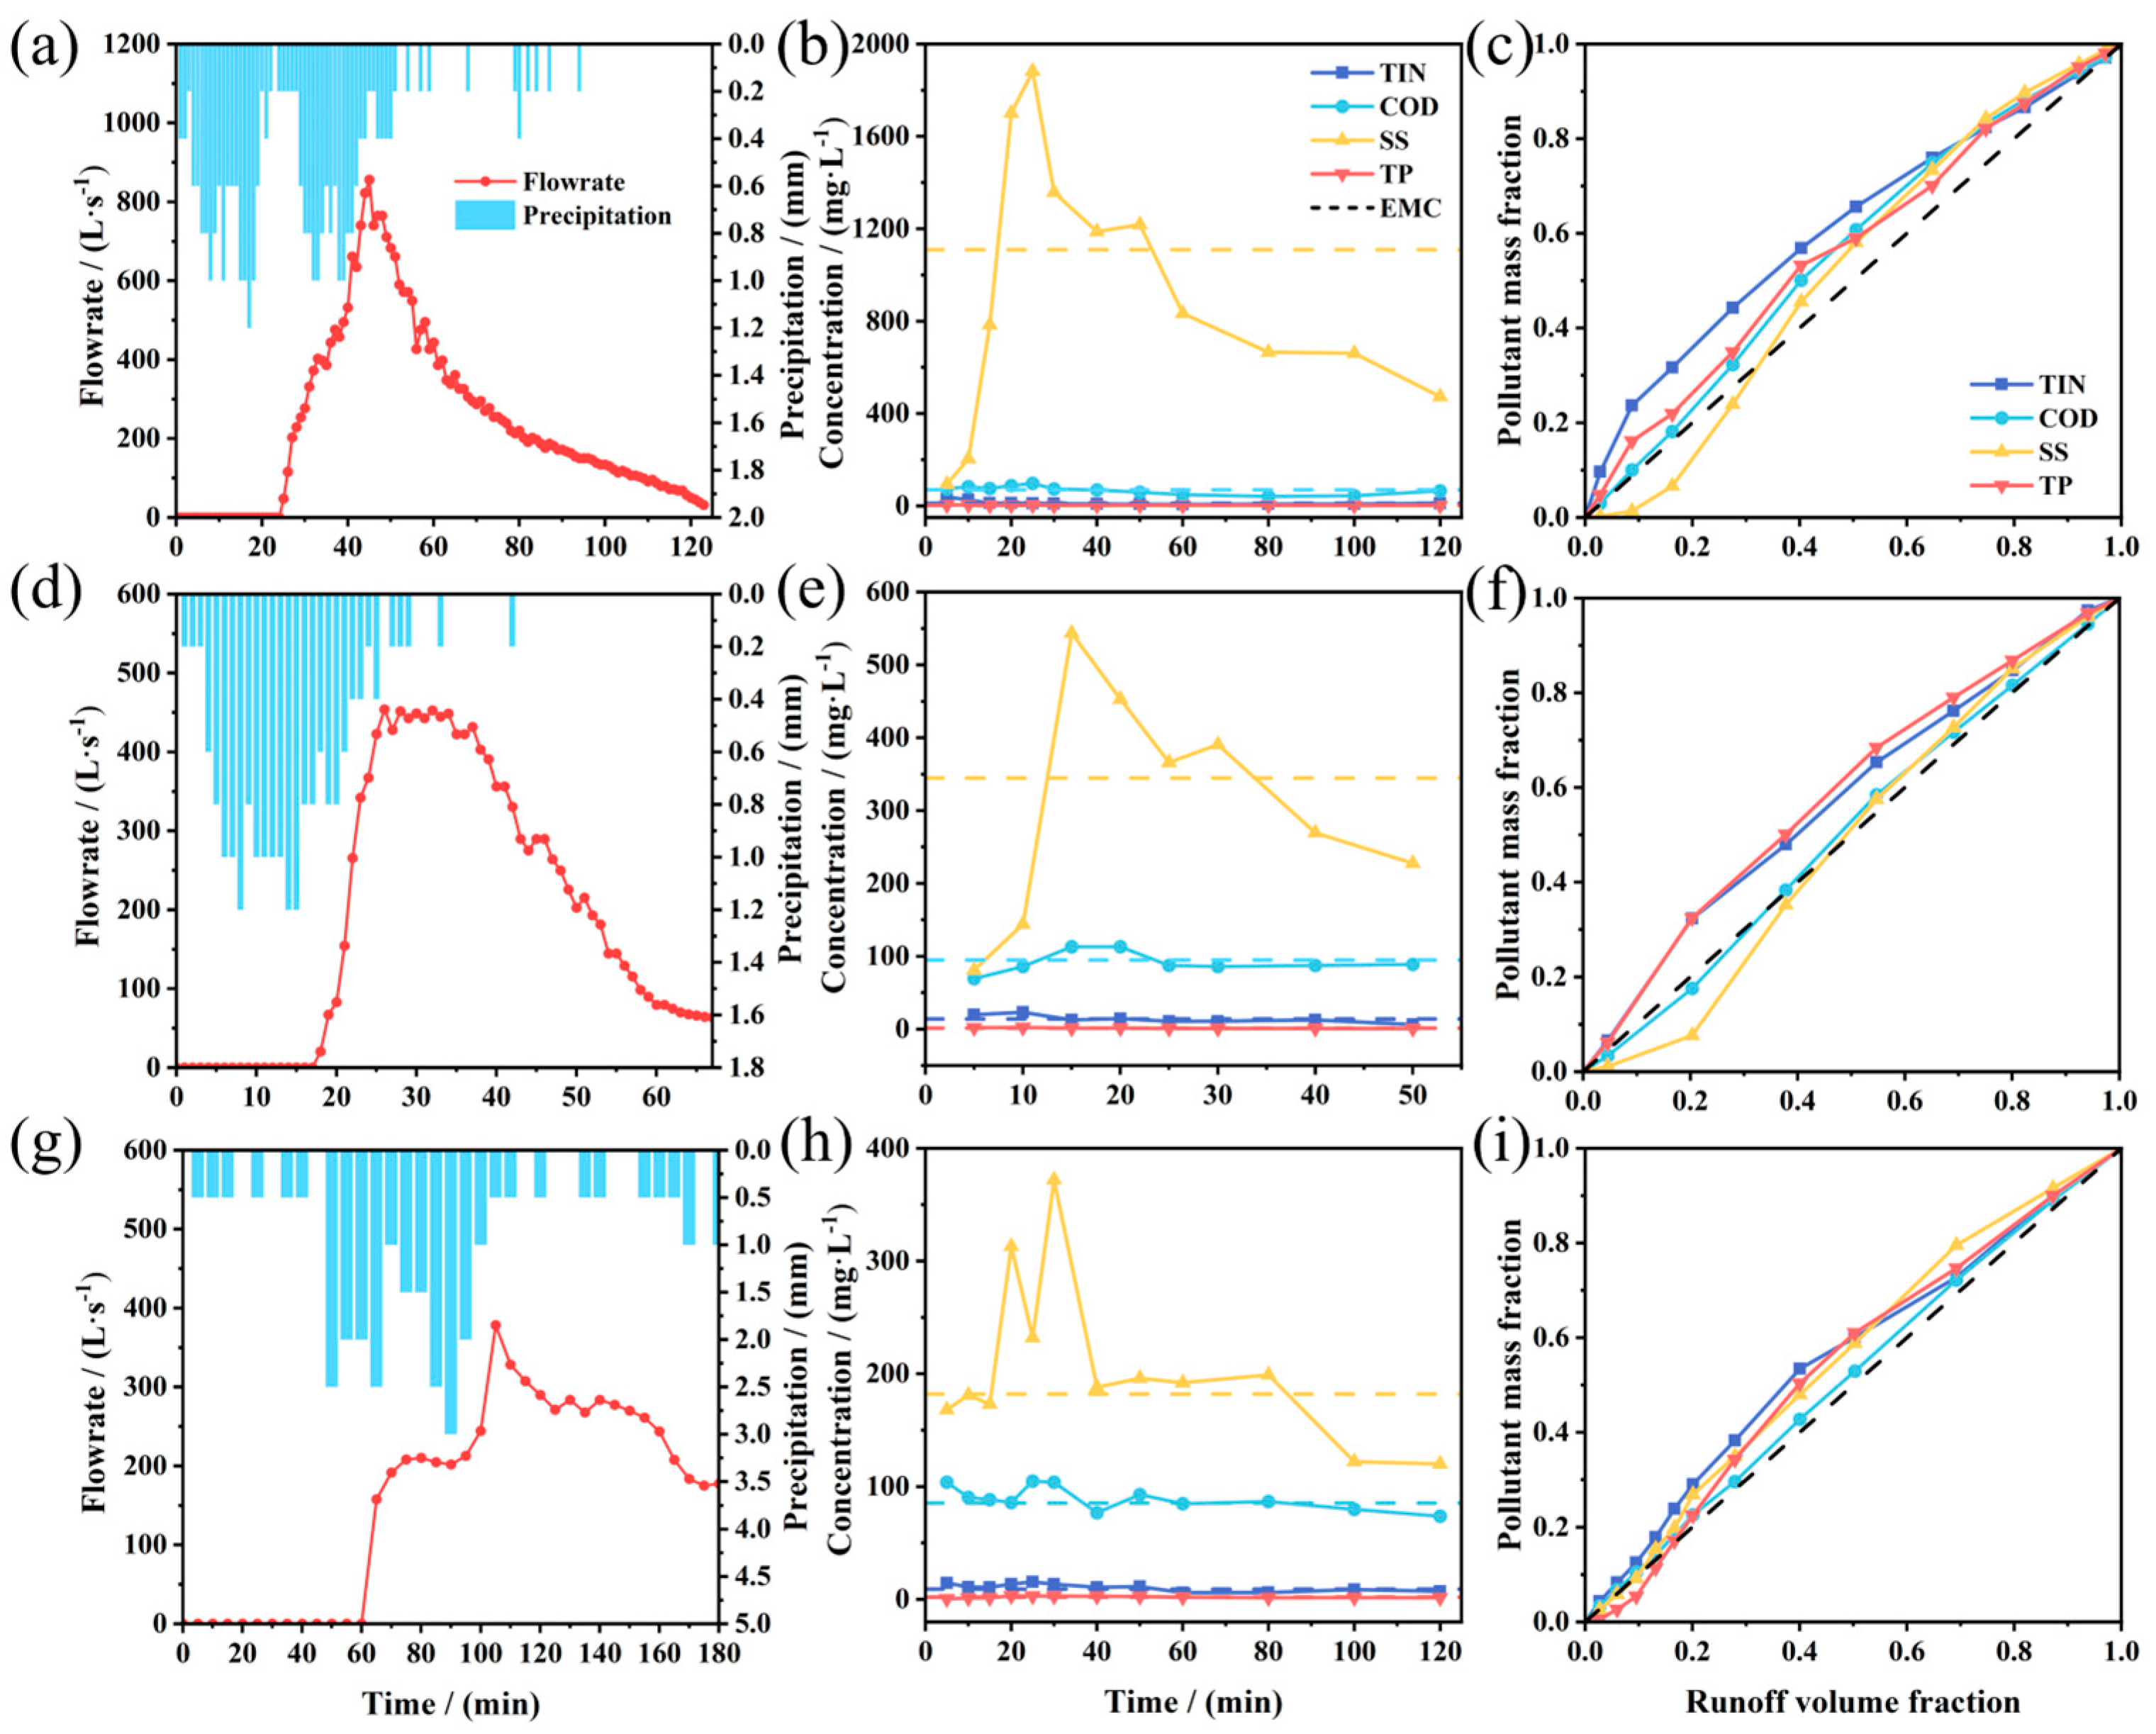
For Event B (moderate rainfall, duration 0.5 h, ADP 4 days), pollutant concentrations across all surfaces peaked within 20 min of rainfall onset, aligning with the peak rainfall intensity and subsequently declining due to dilution (
Figure 3(a)–(c)). Pollution was most severe on transportation street (
Figure 3(b)), where EMC values for all pollutants exceeded 1.2 times the Class IV surface-water standard (GB 3838-2002) [
45]. SS reached an EMC of 137.40 mg/L (peak 170.50 mg/L), 4.5 times the secondary effluent standard (GB 18918-2002)[
46]. Residential area rooftop runoff exhibited milder pollution (
Figure 3(c)), with SS decreasing from 93.60 mg/L to 37.50 mg/L as rainfall progressed.
Event C (light but long-duration rainfall; ADP 14 days), displayed pronounced first-flush characteristics (
Figure 3(d)–(f)). Concentration peaks occurred within 10 min after rainfall onset, well before the rainfall-intensity peak, signaling rapid wash-off of accumulated pollutants. Residential street runoff exhibited the highest pollution, with TIN, COD, and TP concentrations of 3.44–5.90 mg/L, 43.64–154.80 mg/L, and 0.92–2.07 mg/L. Their EMCs (4.19, 83.16, and 1.23 mg/L) were 2.8, 2.8, and 4.1 times the Class IV standard (GB 3838-2002).
Event D (heavy rainfall, ADP 1 day) also showed early concentration peaks within 20 min (
Figure 3(g)–(i)), followed by sharp declines driven by intense dilution. On residential street, TIN and SS fluctuated between 2.28–4.42 mg/L and 51.00–184.50 mg/L. Despite the short ADP, EMC exceeded Class IV standard (GB 3838-2002), likely due to re-deposition from preceding rainfall events and insufficient early-event dilution.
The M(V) curves for event B (
Figure 3(j)–(l)) were flat, indicating the absence of a strong first-flush effect due to limited antecedent accumulation and sustained dilution. The steep initial slopes of M(V) curves for event C residential street (>45°,
Figure 3(m)) highlight substantial sediment accumulation during the prolonged dry period and limited early-event dilution. This trend was also reflected in the between-event comparison, where the COD EMC of residential street was 2.4 times that of Event B. Transportation Street (except COD) and residential rooftops also displayed marked first-flush behavior (
Figure 3(n), (o)). For event D (
Figure 3(p)–(r)), a clear SS first-flush occurred on residential street, whereas rooftops did not show a strong surge.
Overall, the average EMC values for runoff pollution across all three events exceeded the Class IV standard (GB 3838-2002) (
Table S2) but remained lower than values reported in many Chinese cities [
47,
48,
49]. Pollution dynamics were shaped by the interplay antecedent dry duration, rainfall characteristics, and functional-zone attributes. Event B exhibited the lowest concentrations due to limited antecedent accumulation and strong dilution; Event C showed the highest due to long dry-periods build-up and weak early-event dilution; Event D, despite a short dry period, still showed elevated pollution attributable to residual pollutant re-deposition and inadequate early dilution. First-flush effects followed C > D > B, patterns observed by Yan et al.[
50]. Spatially, pollution severity ranked residential street > transportation street > residential rooftop. Higher TIN and COD levels in residential street suggest stronger domestic-source contributions, whereas transportation street were dominated by SS, underscoring the roles of vehicular wear particles and street dust [
51]. Despite high dry-period accumulation on rooftop, runoff pollution remained modest due to low wash-off efficiency and strong dilution [
52].
3.2.2. Pollutant Transport Mechanisms Based on SWMM Scour-Equation Inversion
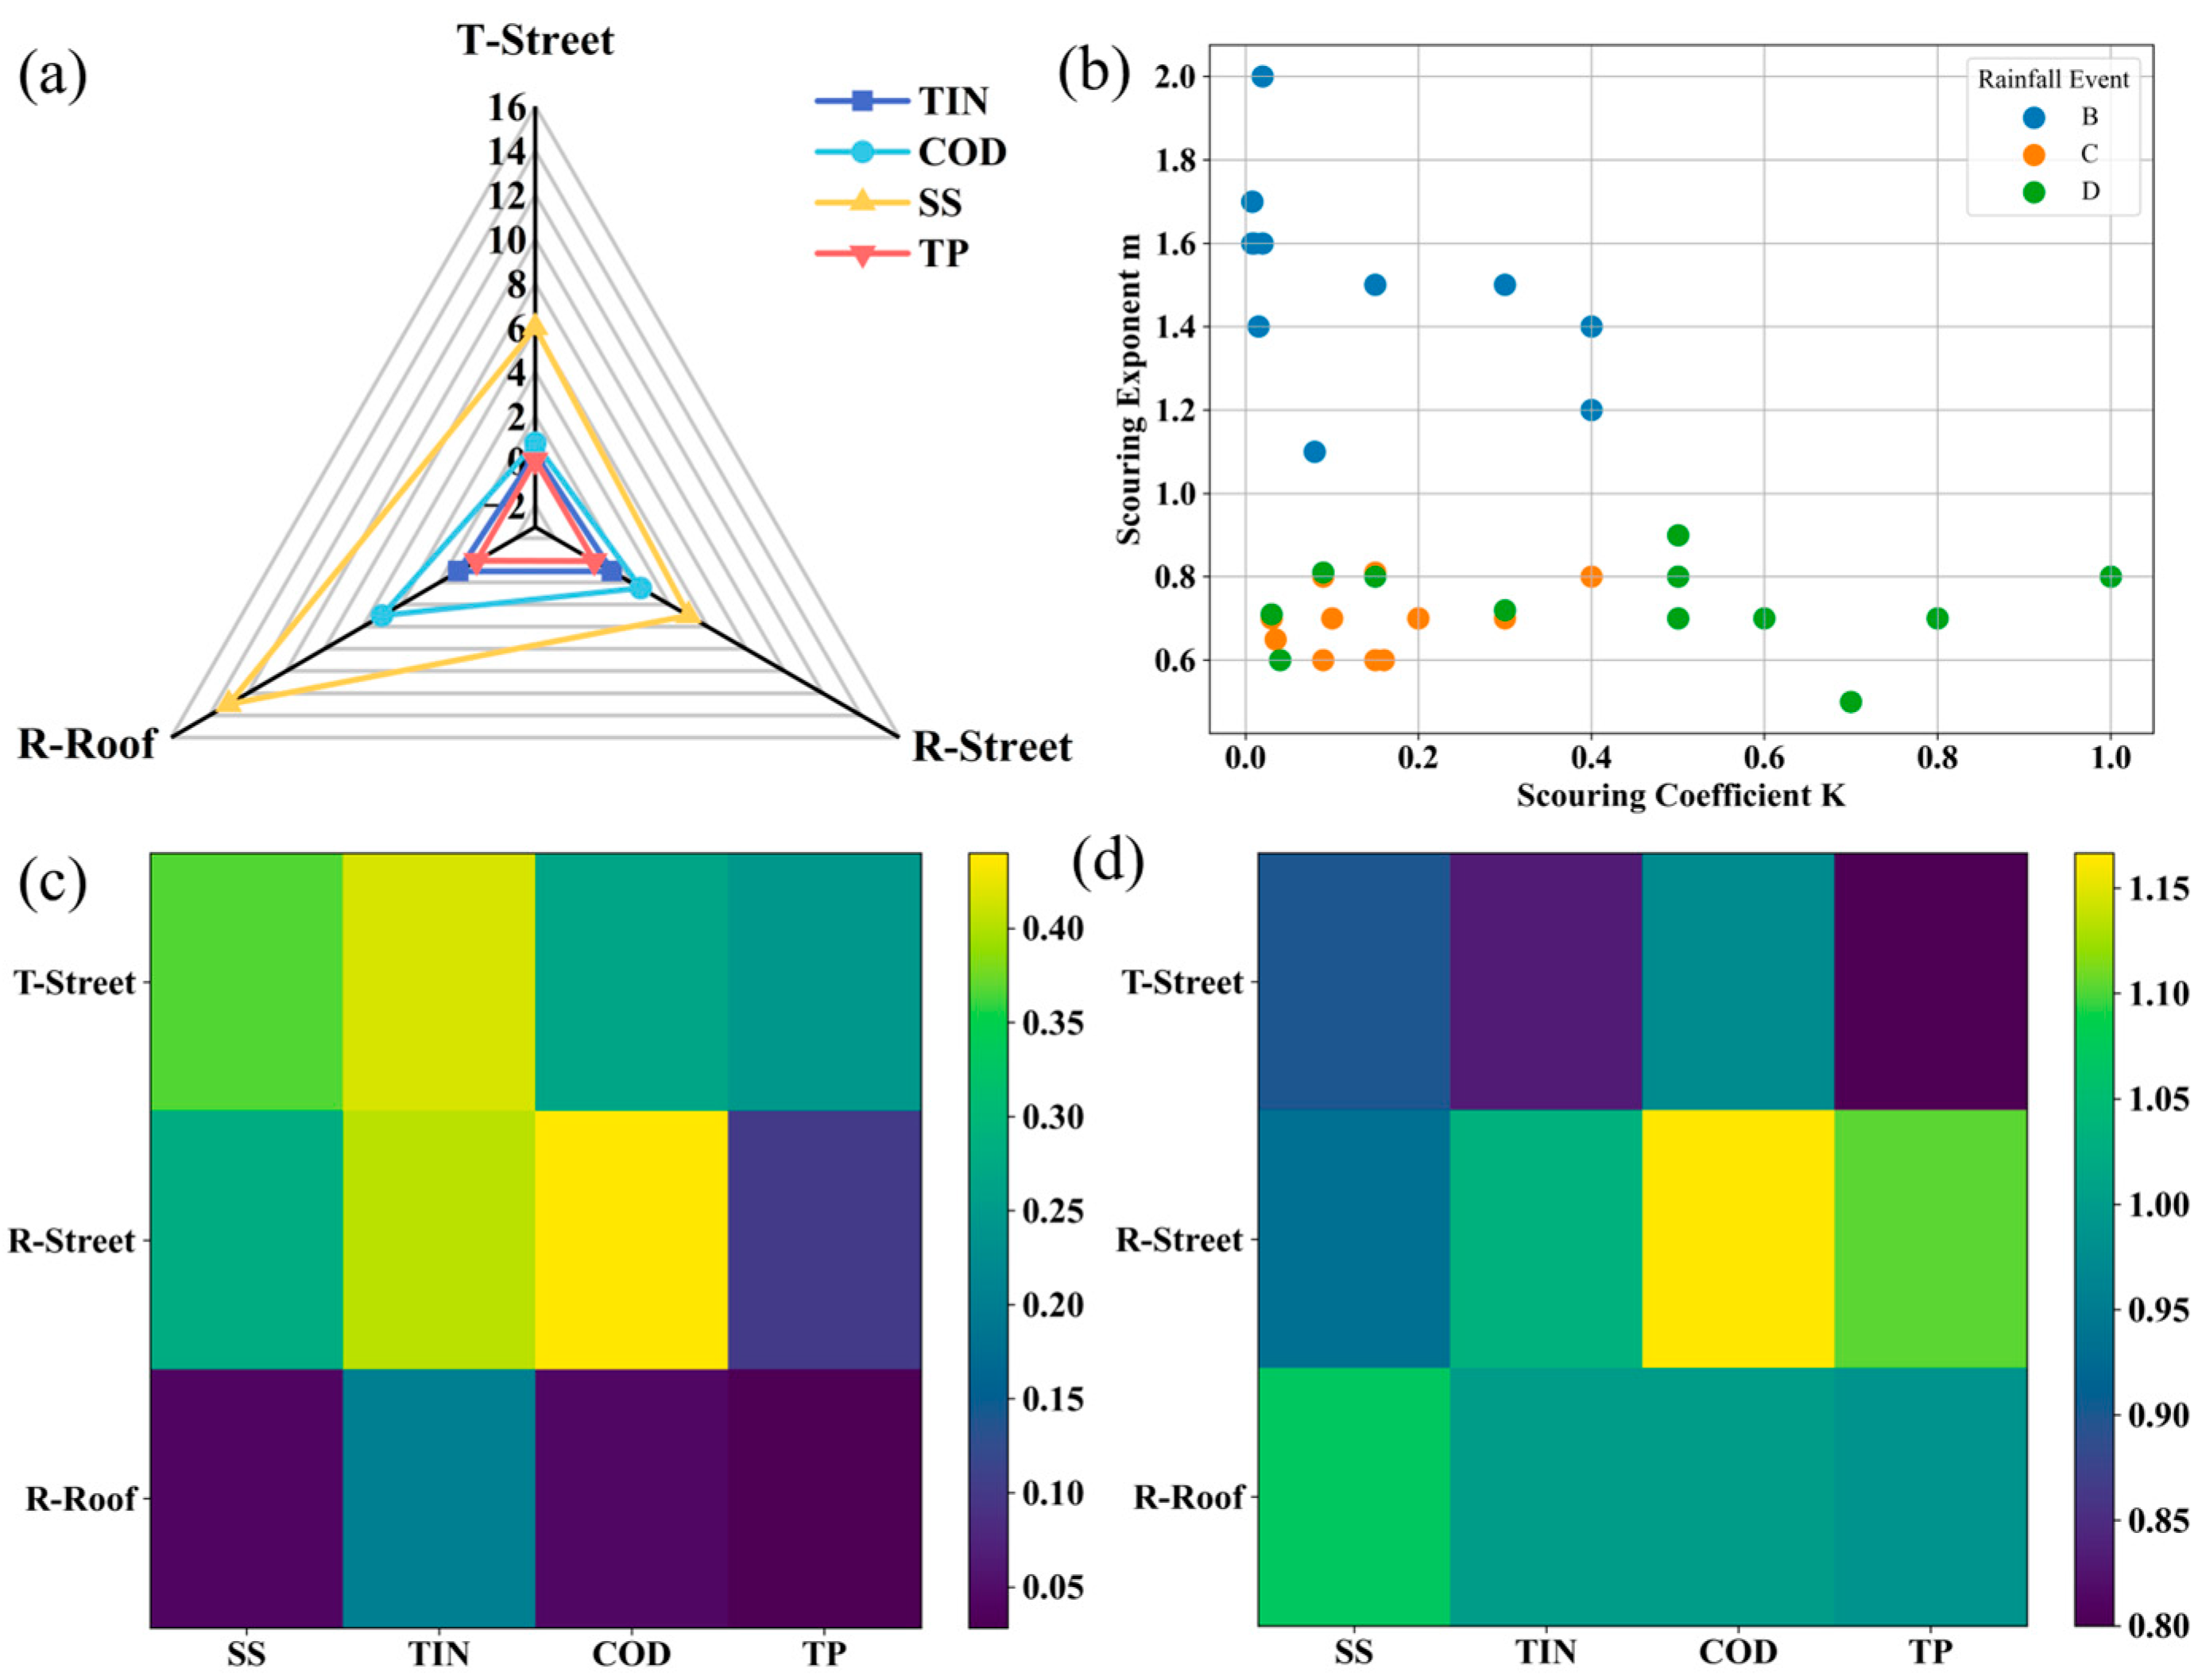
The study area was partitioned into three sub catchments levels according to the inspection-well network. Dry-weather build-up equations were derived from sediment loads, and maximum accumulation values are presented in
Figure 4(a). ADP for the three rainfall events were assigned accordingly. Surface-cleaning efficiencies were parameterized by land-use: 60% for transportation street, 50% for residential street, and 0% for rooftops. Wash-off parameters were calibrated against observed runoff quality, yielding NSE values exceeding 0.7 for all pollutants (
Figure S2).
The derived wash-off coefficient K and wash-off exponent m varied significantly across the three events (
Figure 4(b)). Event B exhibited low K and high m, suggesting limited early detachment, strong dilution, and concentration peaks tightly coupled to flow variation. This agrees with the weak first-flush effect observed in the M(V) curves. Event C showed low K and low m, indicating that accumulated pollutants were rapidly mobilized by the initial thin runoff layer. Subsequent increases in flow had limited additional influence, consistent with a strong accumulation-driven first flush. Event D had high K but low m, implying that residual or re-deposited pollutants were readily detached, even under low early rainfall intensities, producing elevated initial concentrations. Collectively, these findings indicate that intense rainfall enhances the instantaneous nature of pollutant release, whereas weak rainfall favors an accumulation-driven, strongly first-flush-dominated processes.
Surface-type comparisons (
Figure 4(c)) revealed higher wash-off coefficients on streets, reflecting easier detachment of street sediments during rainfall initiation. Rooftops consistently display low wash-off coefficients (<0.1 for all pollutants except TIN), demonstrating that although rooftops may accumulate high pollutant loads per unit area, fine or sorbed pollutants have a low mechanical detachment efficiency under rainfall. Pollutant-specific susceptibility differed among land surfaces. Transportation street followed the order TIN > SS > COD > TP, while residential street showed COD > TIN > SS > TP. Residential rooftops displayed TIN > COD > SS > TP. Wash-off exponent m (
Figure 4(d)) further showed, transportation street showed the order COD > SS > TIN > TP (with TP having the strongest first-flush behavior), and residential street exhibited COD > TP > TIN > SS. For residential rooftops, m values were close to 1, indicating the absence of a distinct first-flush effect—consistent with the earlier M(V) curve analysis. These findings align well with the M(V) analyses and reinforce the differentiated roles of accumulation intensity, rainfall dynamics, and surface characteristics in shaping wash-off mechanisms.
3.3. Flushing Characteristics of Sewer Sediment
Combined sewer sediments represent a key latent pollution reservoir within CSO systems, and their resuspension during rainfall events can substantially enhance pollutant export to receiving waters. A comprehensive characterization of sewer sediments was conducted (
Figure 5), elucidating their physical attributes, pollutant load distribution, and rainfall-induced disturbance mechanisms.
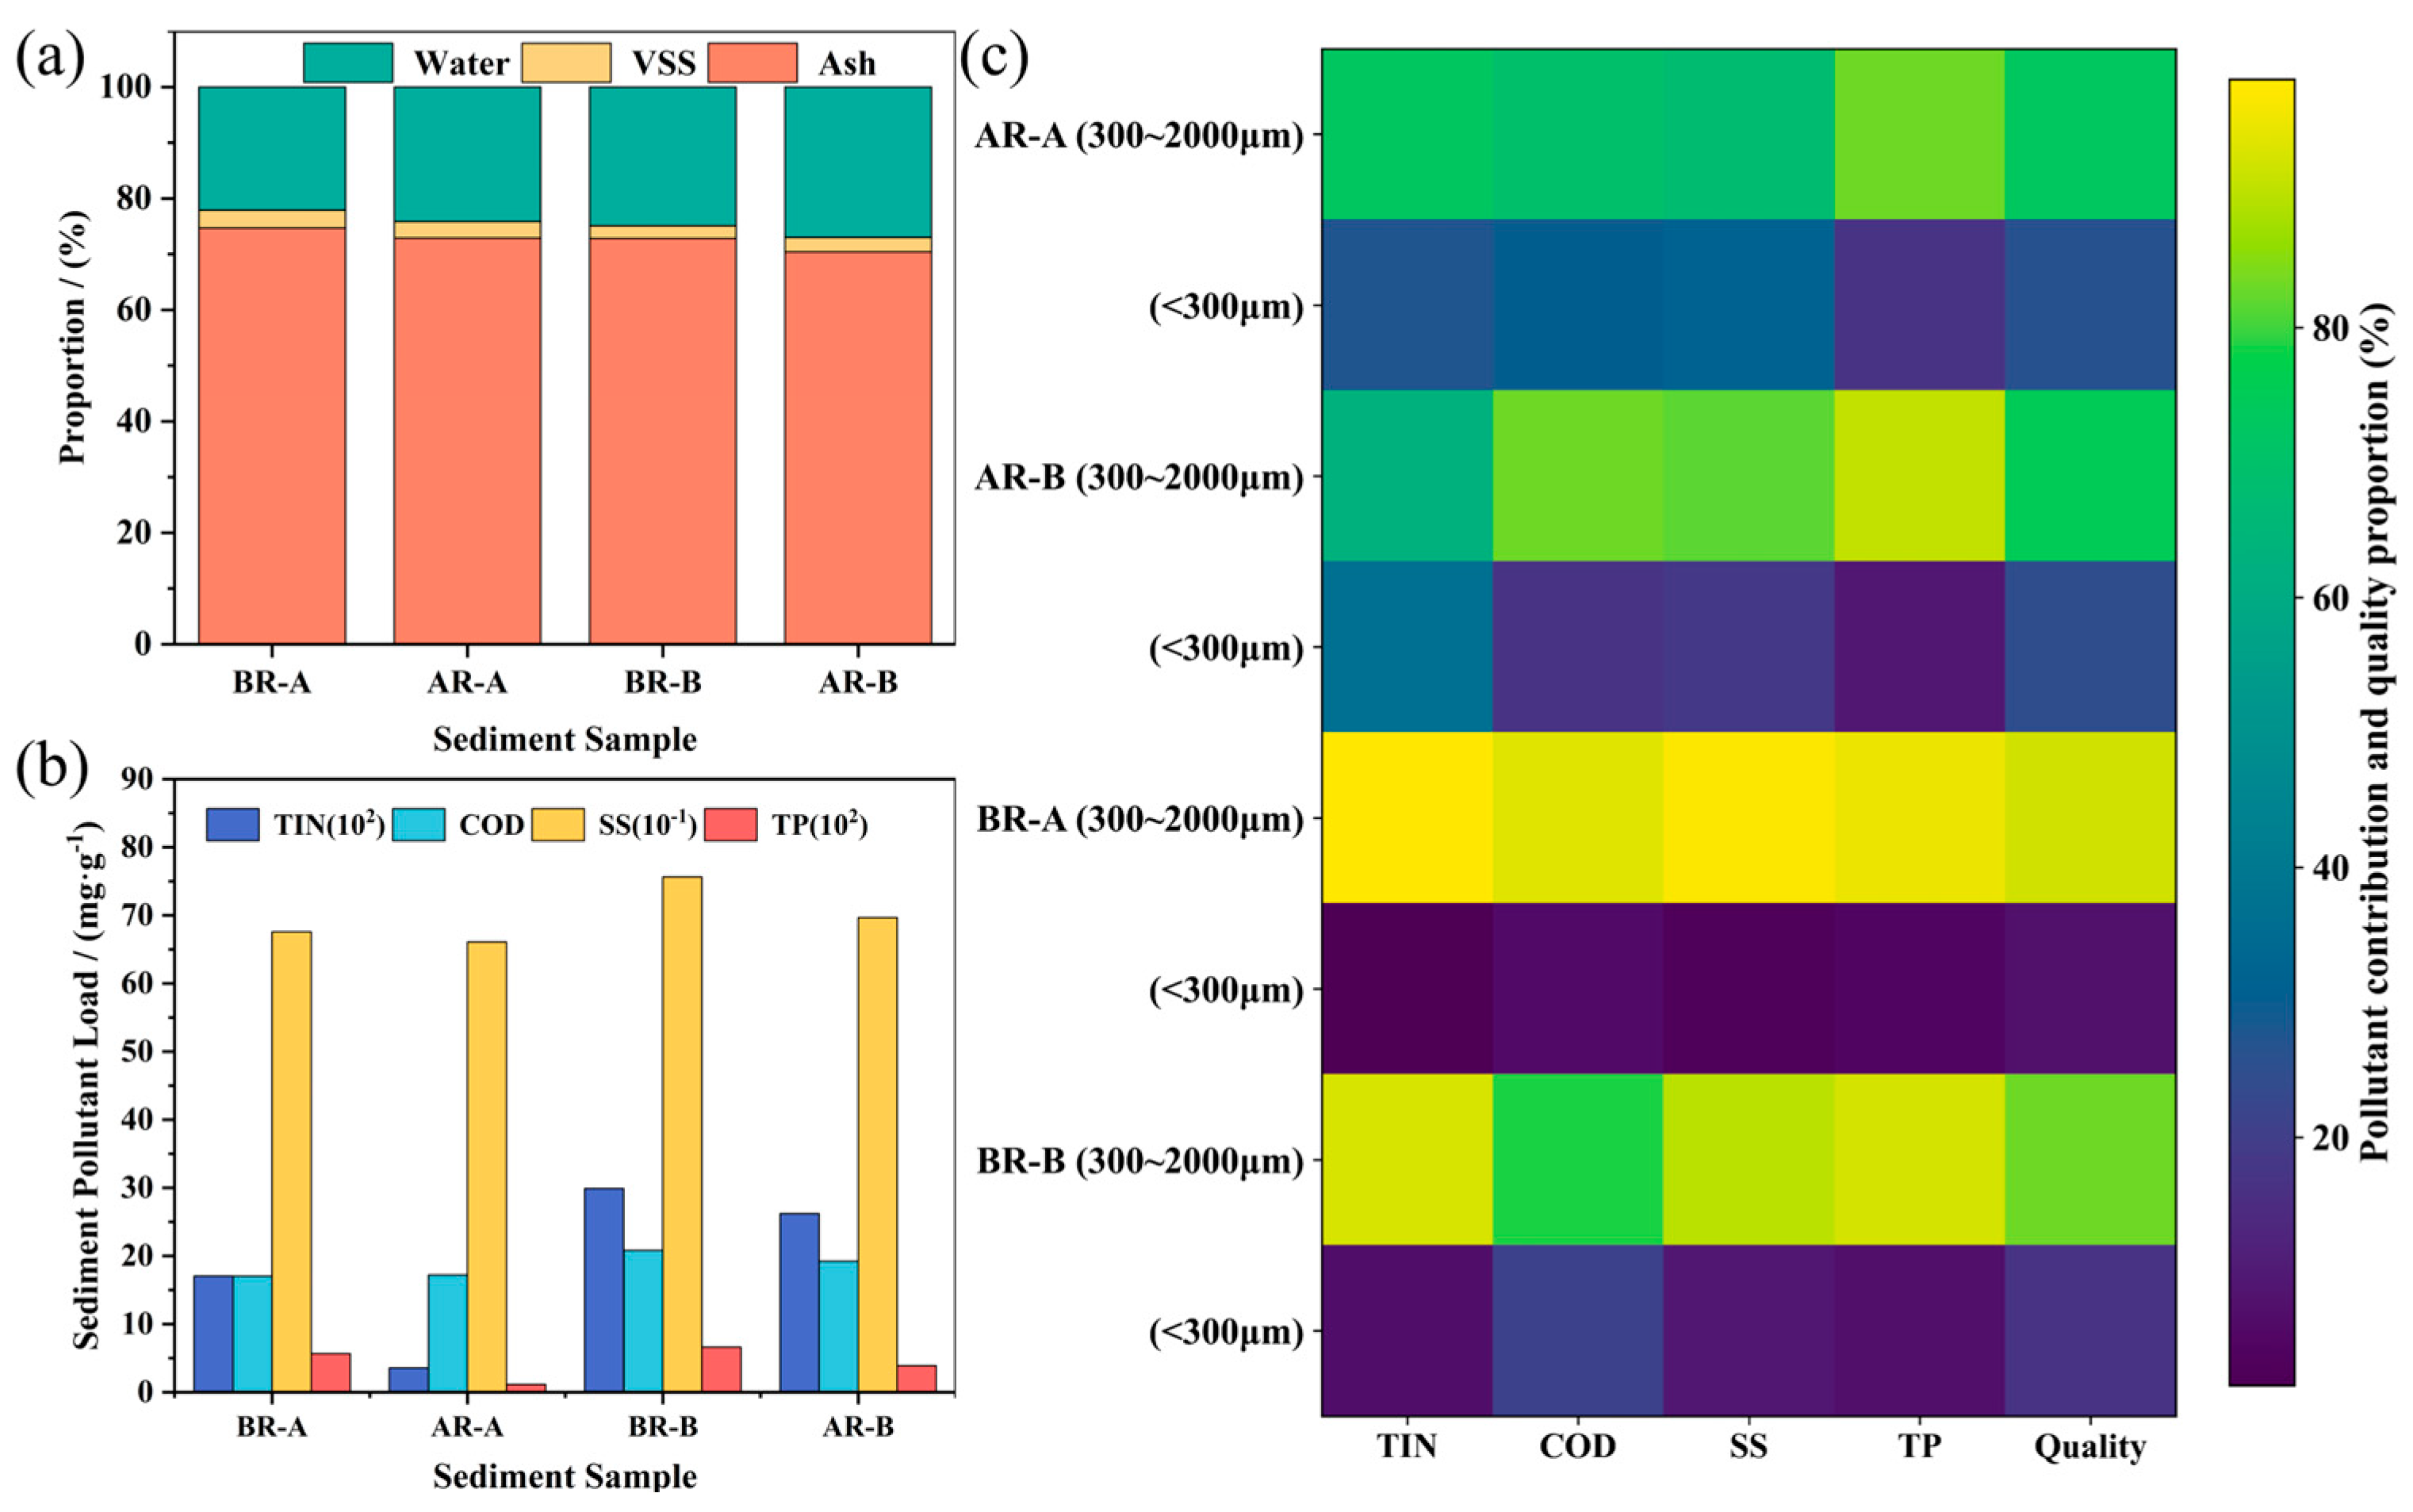
Compositional properties of the sediments are shown in
Figure 5(a). Ash and VS accounted for 70.41–74.70% and 2.28–3.20%, respectively, indicating that inorganic particles (sand- and gravel-sized fractions) dominate the solid phase, whereas organic components are mainly retained in the moisture phase. Sediment moisture content ranged from 22.10% to 26.99%, consistent with Yu et al. [
24]. Rainfall primarily altered the water content: following hydraulic scouring, soaking, or resuspension, moisture increased by approximately 2%, whereas VS content remained nearly unchanged, suggesting that short-term rainfall event exerts limited disturbance on the bulk volatile organic fraction.
Pollutant loads before and after rainfall are shown in
Figure 5(b) and
Table S3. During dry periods, average TIN, COD, SS, and TP loads were 0.23, 18.92, 715.90, and 0.06 mg/g, respectively. Rainfall-driven runoff inflow and scouring removed surface-adsorbed contaminants, reducing these values to 0.15, 18.20, 678.68, and 0.02 mg/g. The disturbance effect was most pronounced under intense rainfall (Event A), where TIN and TP decreased from 0.17 and 0.06 mg/g to 0.04 and 0.01 mg/g. In contrast, reductions under moderate rainfall (Event B) were marginal, indicating a strong positive relationship between hydraulic shear intensity and pollutant detachment.
The heatmap in
Figure 5(c) further highlights particle size distribution and pollutant contributions. Under both dry periods and post-rainfall static conditions, coarse particles (300–2000 μm) overwhelmingly dominate, accounting for 77.62–94.73% of the total mass. This reflects the strong settling stability of coarse fractions within sewer conduits. Intense rainfall increased the proportion of fine particles (<300 μm) from 7.89% to 17.27%, driven by fragmentation of larger aggregates and detachment of fine materials from pipe walls. These patterns demonstrate that high-energy hydrodynamic conditions enhance the mobility and downstream transport potential of fine particle fractions. Coarse particles consistently served as the primary carriers of pollutant loads across all scenarios, confirming their role as the major long-term pollution source within sewer sediments, underscoring their importance in desilting and sewer maintenance strategies. Following rainfall, the contribution of fine particles increased. Under intense rainfall (Event A), fine particles contribution to 36.85% of TIN, whereas moderate rainfall (Event B) increased the COD contribution to 20.88%. These findings corroborate that stronger hydrodynamic forces favor the transport of fine, pollutant-rich particles and explain the elevated fine-fraction contaminants frequently observed in CSO discharges.
3.4. Rainfall-Overflow Response Characteristics
CSO water quality is governed by the competing influences of pollutant wash-off and rainfall dilution. Stormwater inflow enhances in-sewer hydraulics energy, resuspending sediments and mobilizing surface-derived pollutants, while simultaneously diluting in-sewer concentrations through the intrusion of relatively clean rainfall. The dynamic balance between these processes determines both the magnitude and temporal evolution of overflow pollution.
3.4.1. Dynamics of Water Quality During Overflow Events
For event A (
Figure 6(a), (b)), overflow water quality displayed a typical progression from wash-off dominance to dilution control. SS concentrations rose sharply with the hydrograph, reaching an instantaneous peak of 1882 mg/L at 25 min, reflecting the combined influence of initial surface runoff and subsequent intense hydraulic scouring that mobilized large quantities of sewer sediments. In contrast, TIN and TP peaked rapidly within the first 5–10 min (38.02 and 4.01 mg/L), followed by a steady decrease due to rainfall dilution. COD varied more gradually (40.63–97.40 mg/L), exhibiting a broadened peak attributable to the simultaneous effects of wash-off and dilution. Wash-off analysis (
Figure 6(c),
Table 2) showed initial M(V) slopes > 45° MFF
30 >1 for TIN, COD, and TP, indicating moderate first-flush behavior. Although SS exhibited MFF
30 <1, its IF
30–60 >1 indicated a mid-flush effect. The initial flushing intensity followed TIN > TP > COD > SS, consistent with the more rapid transport of dissolved N and P relative to particulate solids.
Event B (
Figure 6(d), (e)) showed a comparable sequence but with notably lower pollutant peaks due to antecedent scouring during Event A. Peak concentrations of SS, TIN, and TP (543, 23.01, and 2.24 mg/L) decreased by 71%, 40%, and 44%, respectively, indicating substantial depletion of readily mobilizable pollutants. Wash-off characteristics (
Figure 6(f),
Table 2) revealed that TIN and TP maintained first-flush signatures (M(V) >45° and MFF
30 >1), whereas COD and SS transitioned toward mid-flush behavior (IF
30–60 >1 but MFF
30 <1). The relative first-flush strength ranked TP > TIN > COD > SS.
Event D (
Figure 6(g), (h)) was influenced by low early rainfall intensity and the during the preceding 84 mm storm, which had already disturbed much of the sewer sediment stock. Consequently, pollutants peaks were the lowest among the three events (e.g., TIN:15.46 mg/L, SS: 372 mg/L). Concentration increased during the first 30 min but declined thereafter, reflecting a dilution-dominant regime. Together with Events B and D, these patterns highlight that the temporal dynamics of in-system pollutant storage exert a critical control on subsequent CSO pollution strength. Wash-off analysis (
Figure 6(i),
Table 2) indicated that TIN retained a moderate first flush (M(V) >45° and MFF
30 >1). COD showed no evidence of either first- or mid-flush characteristics. Although the initial slopes for SS and TP were <45°, both exhibited MFF
30 >1, indicating early mass-release behavior despite initially low concentration gradients. As seen in
Figure 6(h), cumulative loads of SS and TP increased sharply when cumulative overflow volume reached 20–30%, producing early-event load enrichment likely driven by enhanced flow-induced sediment transport. The flushing intensity ranked TIN > SS > TP > COD.
3.4.2. Pollution-Driven Mechanisms of Overflow Events
Although all three rainfall events triggered CSO overflow once cumulative rainfall reached approximately 14–15 mm, their hydrodynamic and water-quality responses differed markedly. The onset of overflow lagged behind rainfall by ~20 min, 18 min, and 1 h for Events A, B, and D, respectively, reflecting variations in initial system storage and conveyance capacity. Overflow durations were 2 h, 1 h, and 2 h, and total overflow volume followed the order A (1804.59 m3) > D (1750.40 m3) > B (768.35 m3). Correspondingly, peak flow rates were 0.85, 0.45, and 0.38 m3/s, each exhibiting a delayed response relative to peak rainfall intensity, indicating the hydraulic inertia characteristic of combined sewer systems.
In terms of pollution levels, CSO water quality during the three events remained lower than values reported for major domestic and international cities [
25,
53], yet substantially exceeded Class IV surface-water standards (
Table S4). TIN exceeded the standard by more than fivefold, COD by over 1.3-fold, while SS (above the Grade-II discharge standard) and TP surpassed the standard by more than fivefold and 3.5-fold, respectively. These results identify TIN, SS, and TP as the primary pollutants of concern in the study area.
The mechanisms driving pollutant release were collectively governed by ADP and sediment accumulation, rainfall characteristics, and residual pollution storage. Pearson correlation analysis (
Figure S3) revealed that ADP and sediment accumulation were the dominant controls on SS, exhibiting an extremely strong positive correlation (r = 0.94). This is consistent with the event-specific exceedance ratios (Event A > Event B > Event D: 35.97 > 10.49 > 5.07), demonstrating intensified particulate transport under longer dry conditions. Rainfall depth exhibited a strong positive correlation with TP (r = 0.97), indicating enhanced wash-off of particulate phosphorus during larger rainfall events. Rainfall intensity was the primary determinant of TIN release (r = 0.995), reflecting a pronounced first-flush response whereby high-intensity rainfall rapidly mobilized nitrogenous pollutants. Event B, with the highest rainfall intensity, presented the greatest TIN EMC-1.5 times that of Event C, which had the lowest intensity-demonstrating that strong hydraulic scouring accelerates nitrogen detachment from surface and in-sewer sources. Despite Event D occurring only one day after a major rainfall event, TIN and TP concentrations remained elevated, suggesting that residual pollutants in sewer sediments and surface sediments can induce secondary pollution. This underscores the need for timely post-storm street sweeping and sewer desilting to mitigate carry-over contamination.
Overall, CSO pollution dynamics were shaped by the coupled influences of ADP, sediment accumulation, rainfall depth and intensity, and residual pollutant storage. ADP predominantly governed SS loads, rainfall depth enhanced phosphorus wash-off, rainfall intensity governed nitrogen first-flush efficiency, and secondary pollution effects further shaped pollutant levels. These insights offer scientific guidance for targeted CSO pollution control and event-based urban drainage management.
3.5. Source Apportionment of Overflow Pollutant Loads
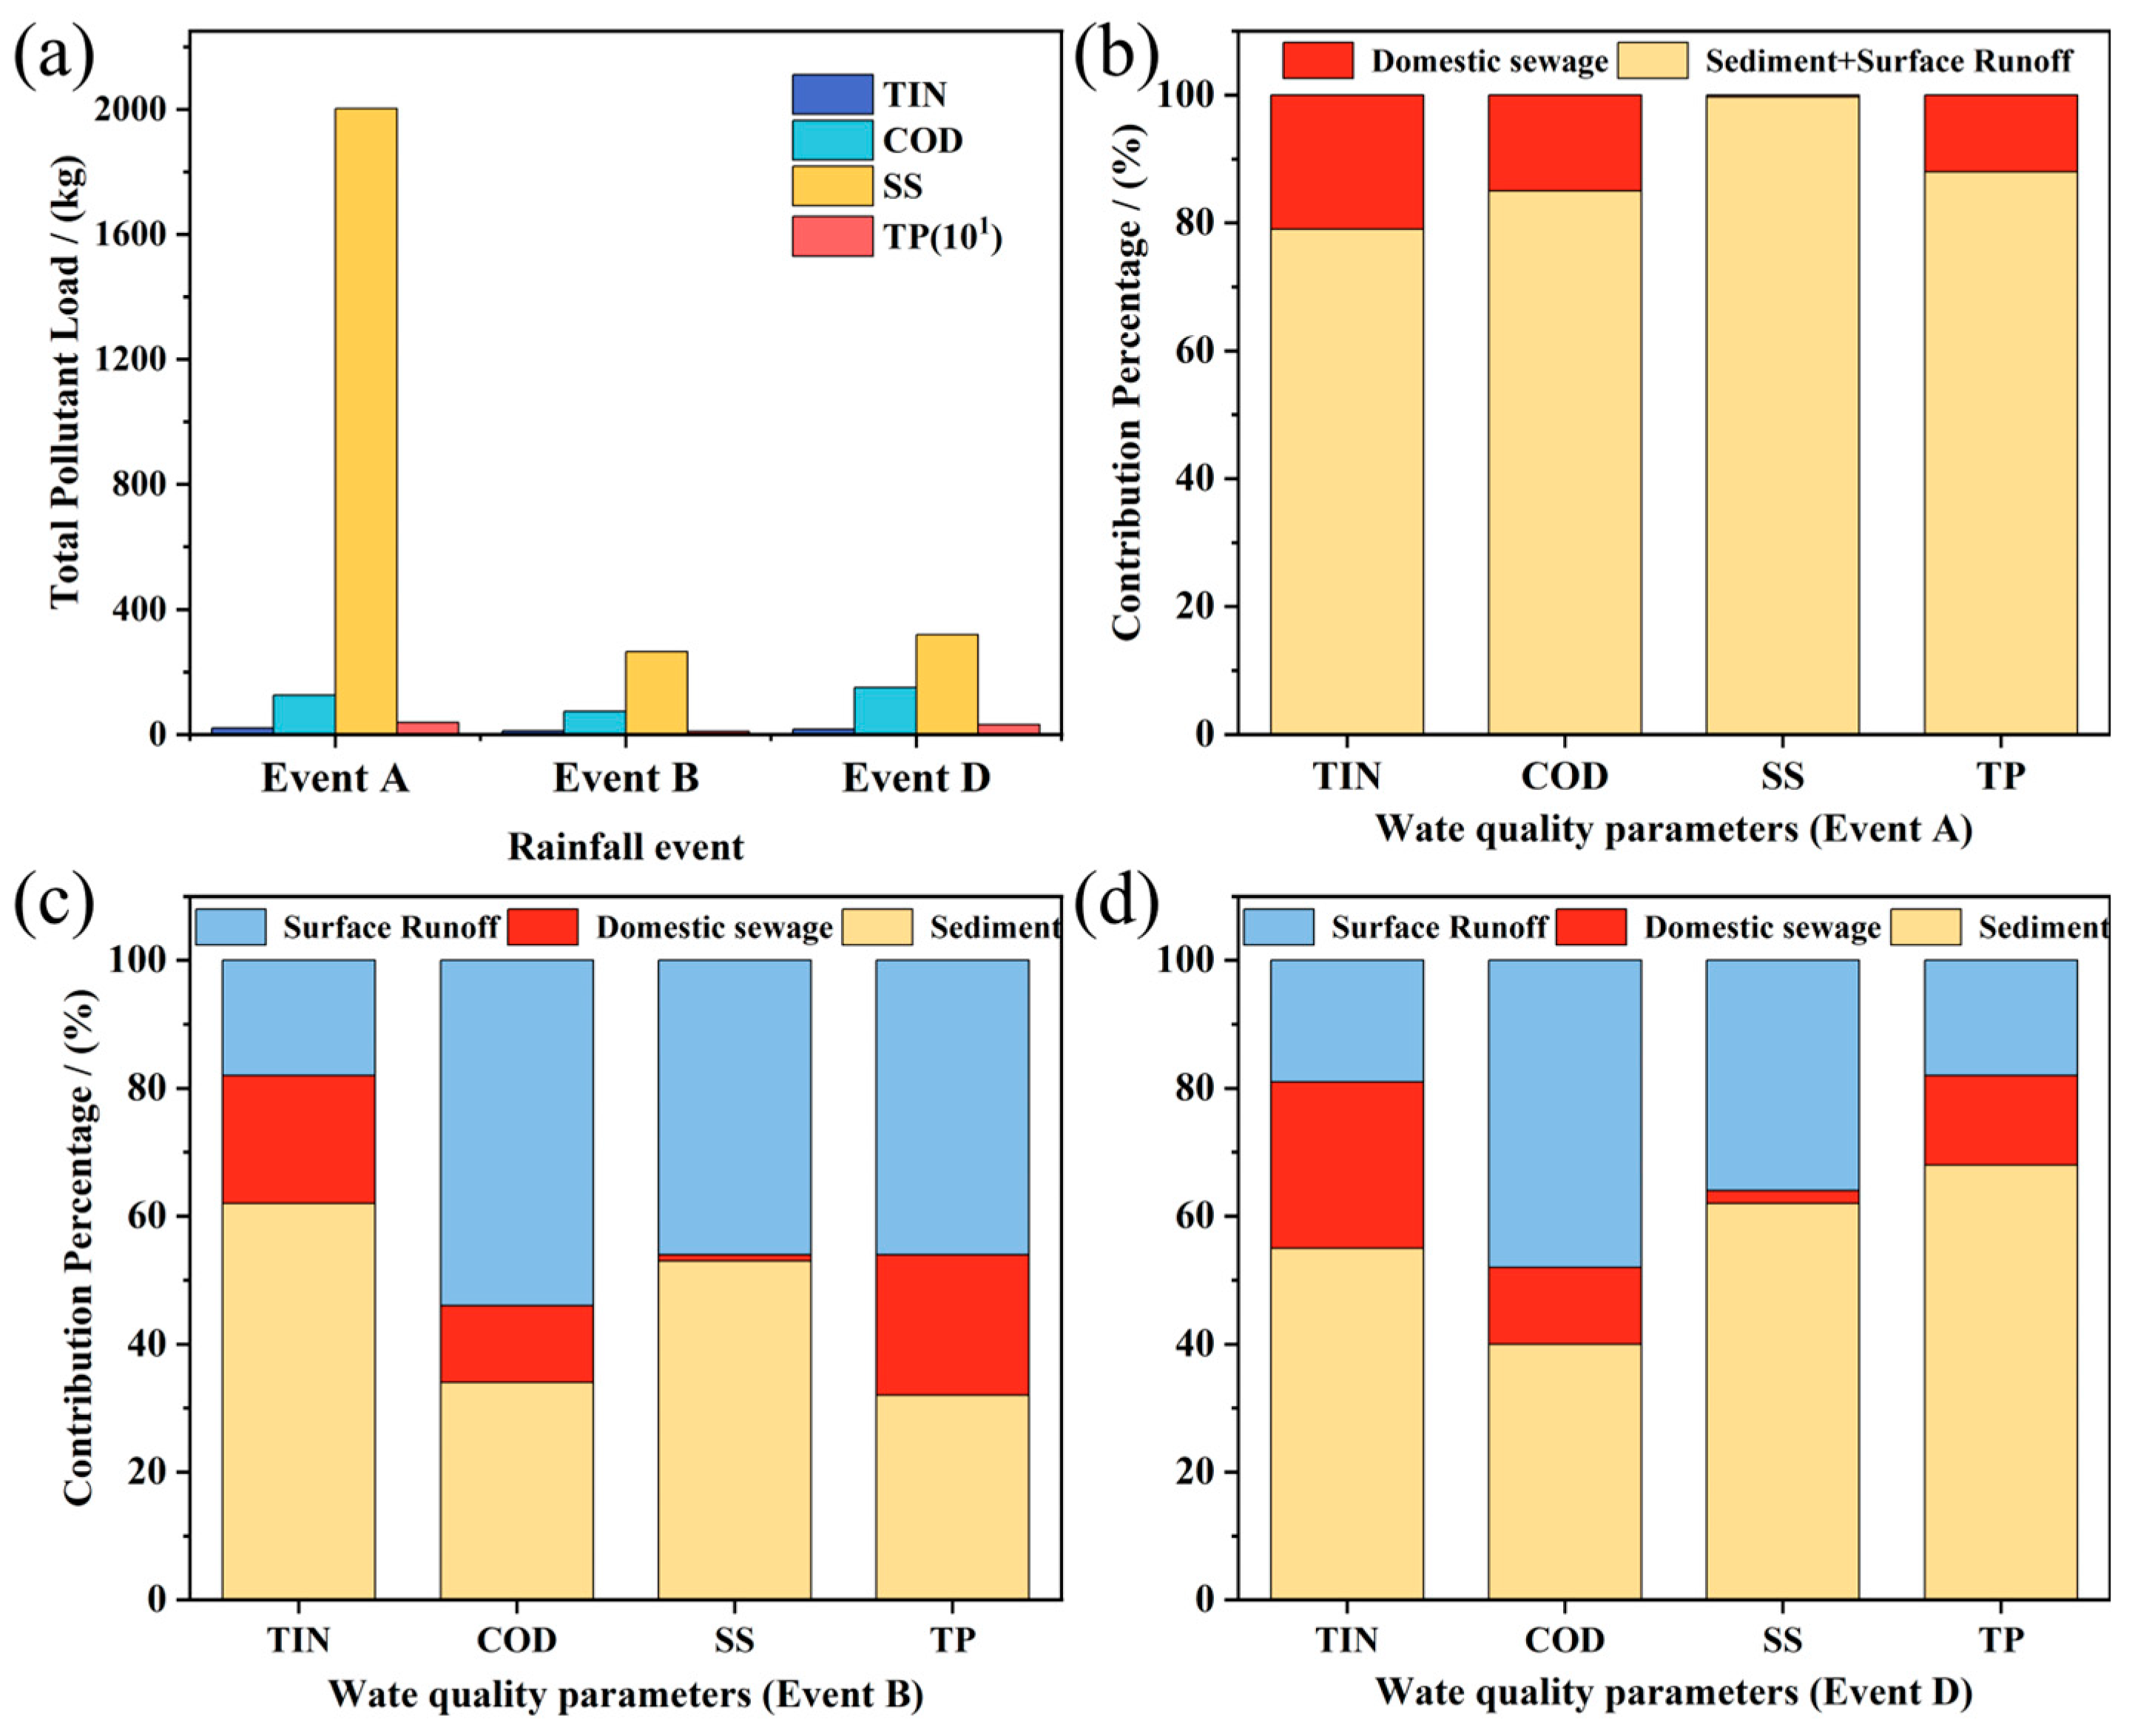
Rainfall characteristics directly shape CSO pollution loads through the sequential process of accumulation-transport-discharge. As shown in
Figure 7(a), Event A generated the largest pollutant loads due to its long ADP (ADP > 14 days without sewer-flushing rainfall), the greatest rainfall depth, and the highest overflow volume. Total pollutant loads followed the order Event A > Event D > Event B, confirming the fundamental mechanism that CSO loads arise from the combined effects of sediment accumulation, rainfall-driven wash-off, and overflow discharge.
Source-apportionment results (
Figure 7(b)–(d)) revealed marked differences among the three major sources—surface runoff, domestic sewage (
Table S5), and sewer sediments—and demonstrated strong pollutant-specific dependencies. Domestic sewage contributed relatively stable shares across pollutants, with the highest contribution to TIN (20–26%), followed by TP (12–22%), and limited contributions to SS (2%) and COD (12–15%).
Surface runoff exhibited more variable effects across pollutant groups. It accounted for the highest proportion of COD (48–54%), moderate and stable contributions to TIN (18–19%), and a broader range for SS (36–46%) and TP (18–46%), reflecting the spatial heterogeneity of surface-deposition pathways.
Sewer sediments consistently emerged as the dominant contributor among the three sources. Their contribution reached 53–62% for SS, 55–62% for TIN, 34–40% for COD, and 32–68% for TP, aligning well with previous studies [
25,
28]. These results reaffirm that sewer sediments act as a major pollution reservoir and a primary driver of CSO pollutant loads in the study area, emphasizing the urgent need for targeted management interventions.
3.6. Insights, Limitations, and Contributions
This study revealed the spatiotemporal evolution and dominant mechanisms governing pollutant dynamics during both dry and wet periods in the catchment, thereby clarifying the formation pathways and critical control points of CSO pollution. During dry periods, incomplete surface cleaning and prolonged absence of strong hydraulic flushing promote persistent accumulation of pollutants on paved surfaces and within sewer sediments, forming a “stockpiling phase”. Once intense rainfall occurs, these accumulated sediments are rapidly mobilized by runoff scouring, producing pronounced first-flush overflow pollution peaks at overflow outlets.
Surface-runoff pollution is jointly controlled by urban functional zoning, pollutant deposition pathways, and rainfall wash-off mechanisms. Because the dominant source contributions vary significantly across functional zones, spatially differentiated control strategies are required. During rainfall, pollutant transport exhibits strong event dependency: Light rain should prioritize source reduction and initial-runoff interception (e.g., green roofs, permeable pavements, sunken green spaces and other sponge infrastructure). Moderate to heavy rain requires optimizing conveyance pathways and enhancing pre-event surface cleaning to limit peak loads and hydraulic stress. Post-storm sweeping and sewer desilting should also be implemented to prevent re-accumulation of residual pollutants. Given the substantial contributions of sewer sediments, establishing a periodic desilting schedule is essential to reduce pollutant reservoirs and limit the occurrence of high-concentration pollutant pulses.
From a broader perspective, China is transitioning from “engineering-led” CSO management toward “smart and resilient” systems. The source-apportionment insights generated in this study provide quantitative support for operations and maintenance of drainage systems and can guide optimized deployment of sponge-city facilities. Looking forward, integrating smart drainage infrastructure, digital twin platforms, and machine-learning approaches can enable dynamic prediction of CSO pollutant transport and facilitate adaptive operation of gates, pumps, and detention facilities. Coupling these with Life Cycle Assessment (LCA) methods enables evaluation of energy use and carbon footprint across the CSO system’s “transport-reduction-discharge” lifecycle, promoting environmentally and carbon-optimized drainage planning.
Despite the insights, the study has limitations. Monitoring constraints and a limited number of rainfall events prevented range of rainfall intensities, durations, and ADP conditions captured. Future research should expand both spatially and temporally coverage, integrating multi-source long-term monitoring with high-resolution hydrodynamic modeling across diverse scenarios. This would enhance the precision and generalizability of source-apportionment results and further elucidate the interactive mechanisms linking rainfall characteristics, surface features, and sewer hydraulics.
Overall, this study addresses a critical knowledge gap in understanding overflow-pollution formation mechanisms in the region. Theoretically, it established a coupled conceptual model for the three major pollution sources—surface runoff, domestic sewage, and sewer sediments—and clarifies how dry-period accumulation and rainfall-driven transport jointly shape CSO dynamics. Practically, by identifying key pollutant carriers and intervention points, this study provides data-driven guidance for prioritizing overflow-reduction measures, planning desilting schedules, and optimizing runoff management strategies. These contributions hold significant value for advancing the refinement, intelligence, and sustainability of urban drainage systems.
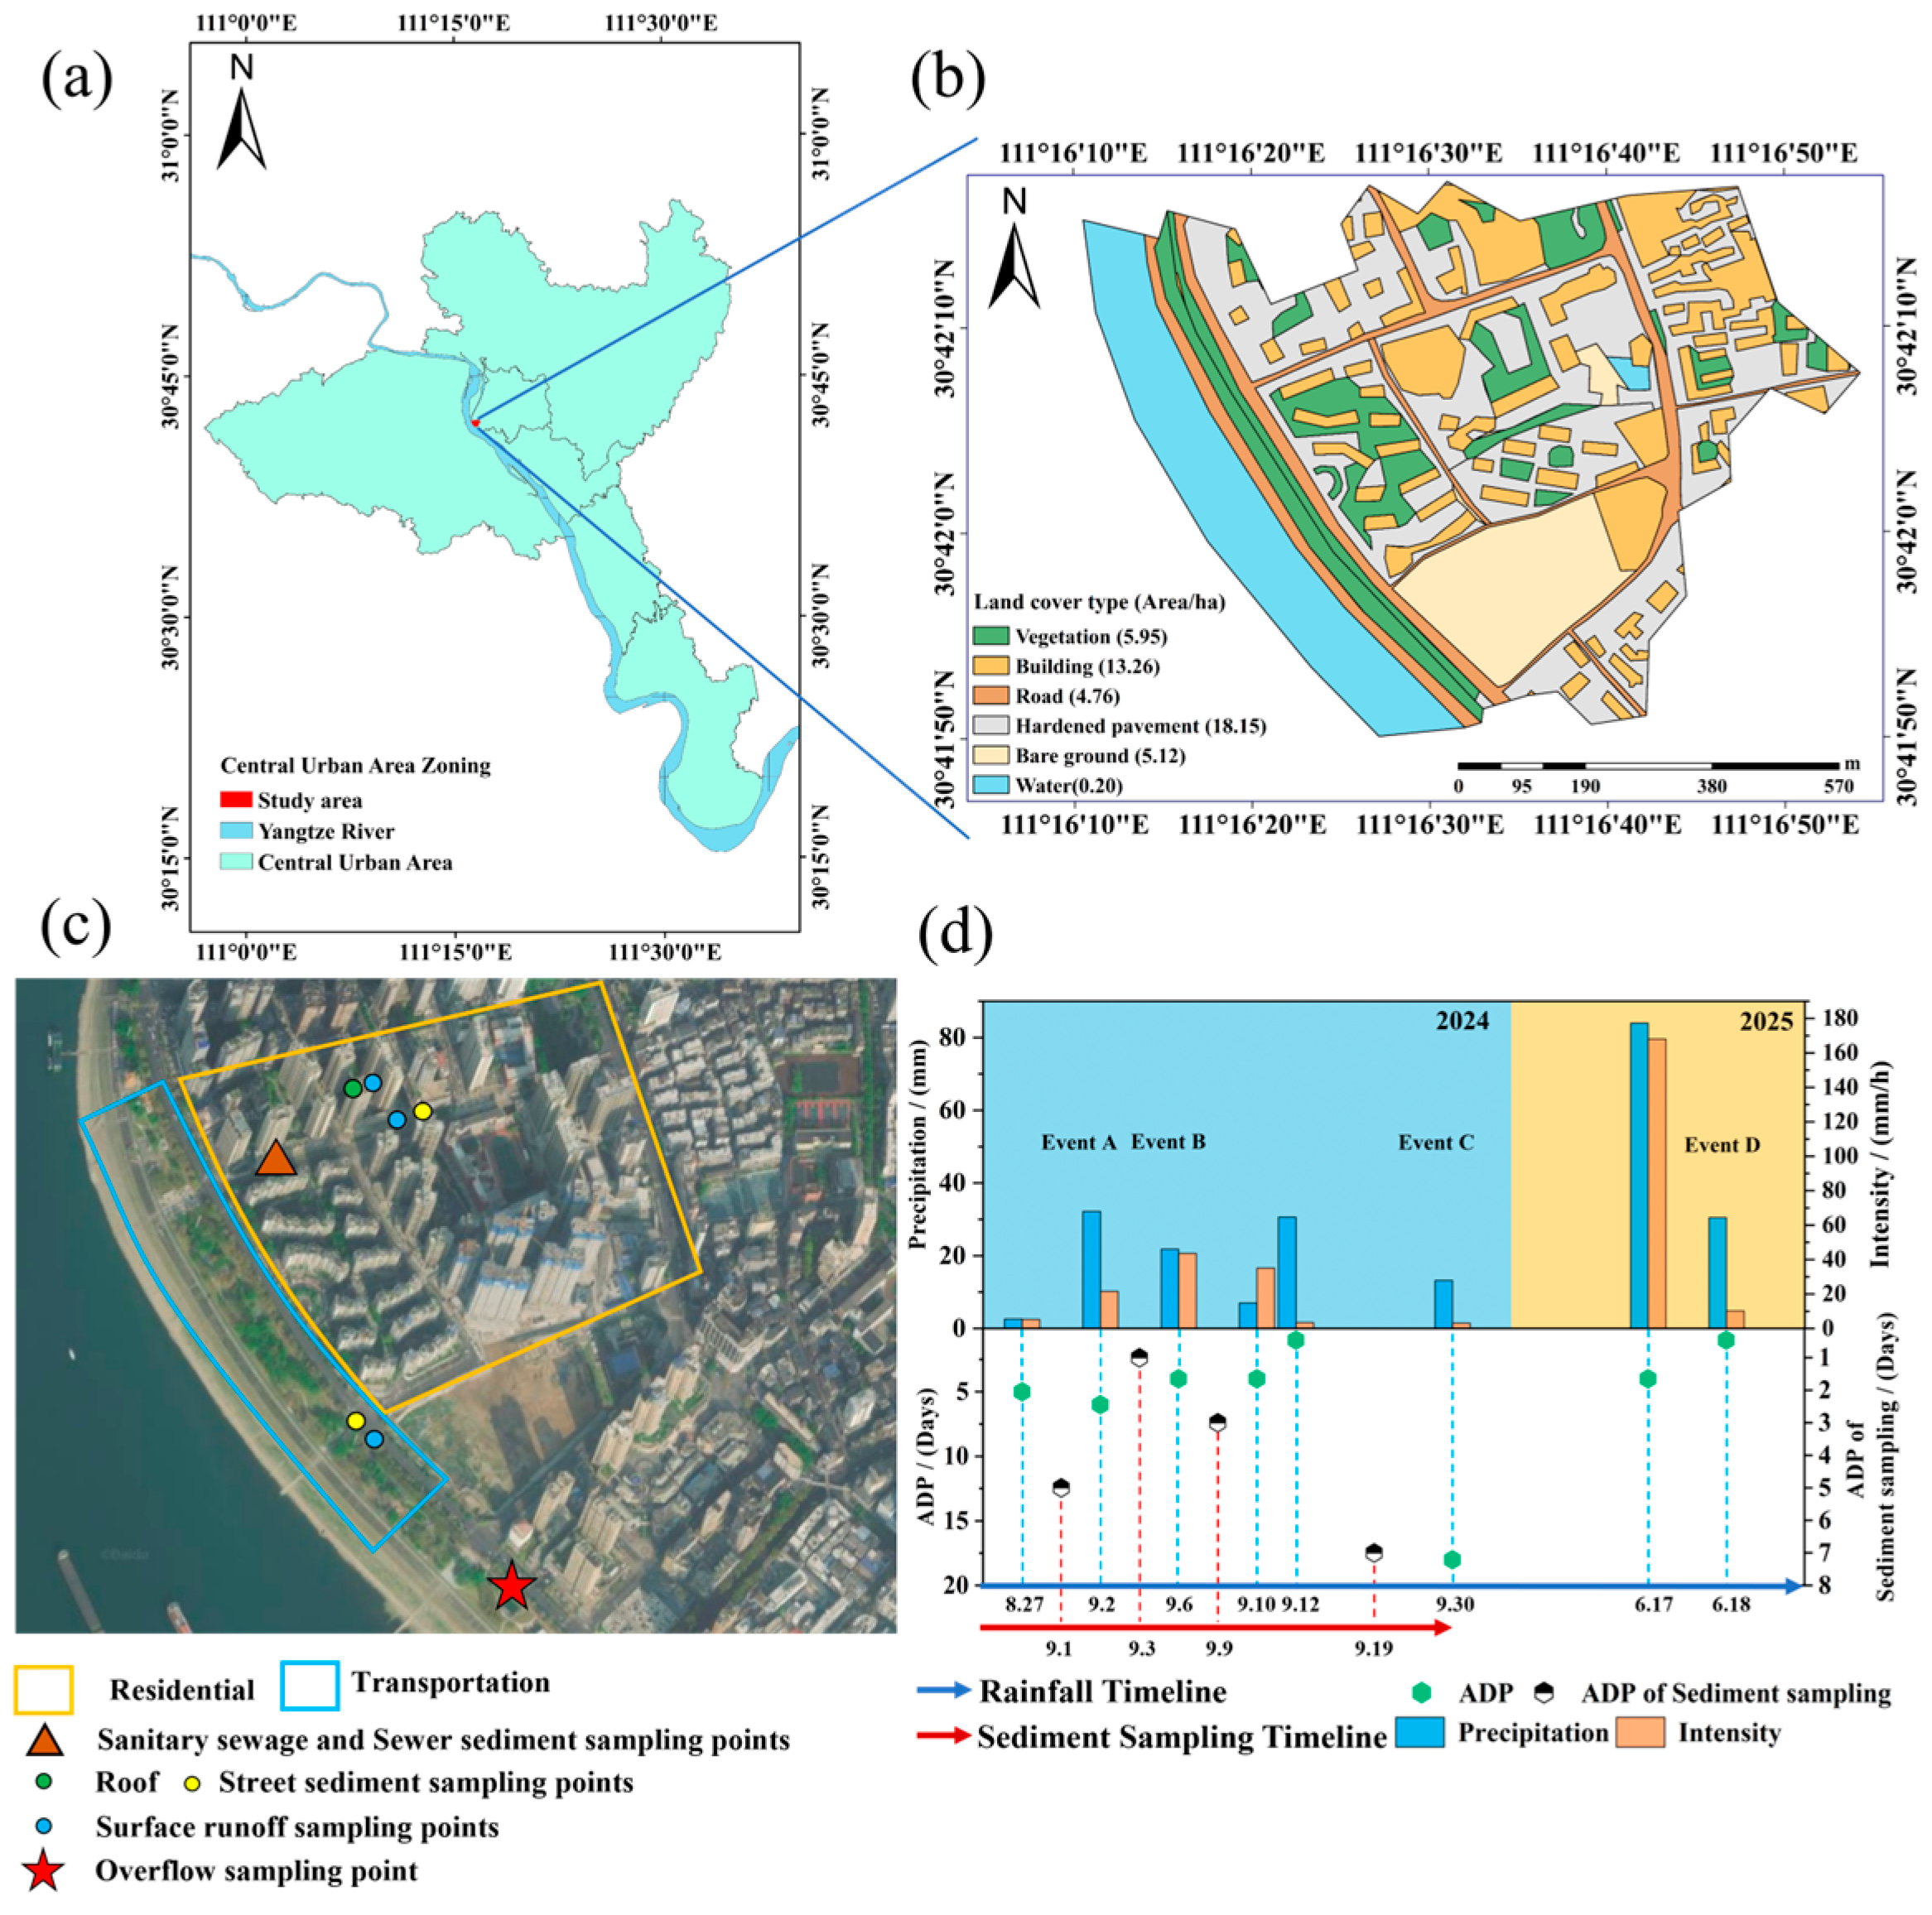
Figure 1.
Research area overview: (a) Distribution map of urban centers in the study area; (b) Land cover distribution map of the study area; (c) Distribution map of sampling points; (d) Precipitation characteristics, where ADP represents antecedent dry period.
Figure 1.
Research area overview: (a) Distribution map of urban centers in the study area; (b) Land cover distribution map of the study area; (c) Distribution map of sampling points; (d) Precipitation characteristics, where ADP represents antecedent dry period.
Figure 2.
Characteristics of surface sediments during drought periods: (a) Accumulated pollutant load per unit area over 1–7 days in rooftop sediments. (b) Average accumulated pollutant load per unit area over 1–7 days in surface sediments. (c) Mass fraction of sediment particle size and contribution to carried pollutant load.
Figure 3.
Time-varying pollutant concentrations and M(V) curves during rainfall events. Each row corresponds from left to right to residential street, transportation street, and residential rooftops: (a)–(c) for rainfall event B, (j)–(l) for the corresponding M(V) curve; (d)–(f) correspond to rainfall event C, (m)–(o) represent the corresponding M(V) curves; (g)–(i) correspond to event D, (p)–(r) represent the corresponding M(V) curves.
Figure 4.
Accumulation and erosion parameters under rainfall events: (a) Maximum accumulation of pollutants in surface sediments; (b) K and m values for each pollutant under rainfall events B, C, and D across different land surfaces; (c) Heatmap of average erosion coefficients across different land surfaces; (d) Heatmap of average erosion indices across different land surfaces.
Figure 5.
Characteristics of sewer sediment: (a) Sediment composition; (b) Concentrations of various pollutants; (c) Mass fraction distribution by particle size and pollutant load contribution.
Figure 5.
Characteristics of sewer sediment: (a) Sediment composition; (b) Concentrations of various pollutants; (c) Mass fraction distribution by particle size and pollutant load contribution.
Figure 6.
Overflow pollution characteristics: each row corresponds from left to right to rainfall and drainage hydrographs, pollutant dynamic concentrations, and M(V) curve. (a)–(c), (d)–(f), and (g)–(i) correspond to events A, B, and D, respectively.
Figure 6.
Overflow pollution characteristics: each row corresponds from left to right to rainfall and drainage hydrographs, pollutant dynamic concentrations, and M(V) curve. (a)–(c), (d)–(f), and (g)–(i) correspond to events A, B, and D, respectively.
Figure 7.
Overflow pollutant load and contribution: (a) Pollutant load discharged during different rainfall events; (b)-(d) Percentage contribution of pollution sources for events A, B, and D, respectively.
Figure 7.
Overflow pollutant load and contribution: (a) Pollutant load discharged during different rainfall events; (b)-(d) Percentage contribution of pollution sources for events A, B, and D, respectively.
Table 1.
Pollution sources, sampling methods, and sample numbers during dry and rainfall periods.
Table 1.
Pollution sources, sampling methods, and sample numbers during dry and rainfall periods.
| Sampling period |
Pollution source |
Sampling method |
Sample labeling rule |
Sample ID |
Number of samples |
| Dry period |
Domestic sewage |
Samples were collected during at least three consecutive dry days. Continuous 24 h sampling was performed at 2 h intervals on both weekdays and weekends. |
Weekday/
Weekend-Time |
— |
24 |
| Surface sediment |
Sampling plots (3 × 3 m²) were established in representative functional zones. Soluble and particulate fractions were collected using an alternating dry-wet vacuum method. |
Date-Functional Zone-Land Cover Type |
R-Roof
R-Street
T-Street |
12 |
| Sewer sediment |
Grab samples were collected before and after rainfall events using a sediment dredge. |
Date-BR/AR |
BR-A
AR-A
BR-B
AR-B |
4 |
| Rainfall period |
Surface runoff |
During the first 30 mins, samples were taken every 5 min; from 30 - 60 min, every 10 min; thereafter, every 20 min until runoff or overflow ceased. |
Date-Functional Zone-Land Cover Type-Time |
R-Roof
R-Street
T-Street |
83 |
| Overflow sewage |
Composite samples were collected at overflow outlets during rainfall events at intervals consistent with runoff sampling. |
Date-Overflows-Time |
CSO-Event A
CSO-Event B
CSO-Event D |
32 |
Table 2.
MFF30 and IF30–60 value for CSO events.
Table 2.
MFF30 and IF30–60 value for CSO events.
| Rainfall events |
TIN |
COD |
SS |
TP |
| MFF30
|
|---|
| A |
1.55 |
1.18 |
0.94 |
1.28 |
| B |
1.37 |
0.97 |
0.76 |
1.41 |
| D |
1.18 |
0.91 |
1.08 |
1.02 |
| Average |
1.37 |
1.02 |
0.93 |
1.24 |
| |
IF30-60 |
| A |
0.87 |
1.16 |
1.32 |
0.93 |
| B |
0.94 |
1.14 |
1.34 |
1.00 |
| D |
0.85 |
0.89 |
0.92 |
1.04 |
| Average |
0.89 |
1.06 |
1.19 |
0.99 |