Submitted:
14 January 2026
Posted:
15 January 2026
You are already at the latest version
Abstract
Fluid jet polishing process (FJP) demonstrates high shape accuracy and surface quality in the machining of nonlinear and complex surfaces, and it achieves precise and adjustable material removal rates through computer control. However, there are still challenges in terms of machining efficiency, system complexity, and stability. Particularly, there is uncertainty in process optimization, especially with higher challenges in optimizing process parameters after changes in working conditions. This study utilizes digital twin technology to propose a new framework for optimizing the FJP process. By reviewing the application of DT in the machining field, this paper identifies the limitations of existing methods and proposes a human-centric design approach that integrates key factors of DT-driven FJP, such as jet kinetic energy, nozzle structure, abrasive type, and machining path. This method encompasses multiple aspects from removal function models to machining path algorithms. By introducing a core method based on transfer learning, this research aims to improve the predictive accuracy, machining efficiency, and stability of the FJP process, realizing efficient and precise polishing operations. Ultimately, this paper validates the proposed method through a case study on 3D printed workpieces, discusses the key enabling technologies, and main challenges. This study not only advances the application potential of FJP process but also provides a new perspective and strategy for optimizing complex machining processes using DT technology.
Keywords:
digital twin
; surface roughness prediction
; fluid jet polishing
; transfer learning
; machining process
1. Introduction
Fluid jet polishing (FJP) is a process that involves mixing water with abrasive particles and ejecting this mixture through a small nozzle at high velocities, thereby achieving fine polishing on the surface of a workpiece. Different to the contact machining method such as diamond cutting [1,2] and grinding [3], this non-contact finishing technique is favored for its ability to achieve high-precision polishing without causing overheating of the workpiece. The advantages of FJP extend beyond this, as it also avoids the issue of tool wear and is capable of adapting to the processing requirements of complex nonlinear surfaces. With computer control, FJP can achieve accurate processing effects and controllable material removal rates, making it particularly suitable for processing hard alloys, ceramics, glass, quartz, and other special materials. Due to its fine processing capability, FJP is also able to handle complex freeform surfaces, thus becoming an indispensable branch of technology in the field of ultra-precision machining.
Despite the great potential of FJP technology in the field of precision machining, it still faces challenges and limitations, such as the need for improved processing efficiency, system complexity, and stability requirements. The main issues faced by FJP include the imprecision of process optimization and low efficiency. Traditional optimization methods often cannot fully cope with the uncertainties during the polishing process, such as fluctuations in slurry concentration or unexpected changes in fluid pressure, which can affect the quality of machining. Moreover, most FJP systems use open-loop control systems that cannot effectively provide feedback during the polishing process to adapt to uncertainties during machining.
Fortunately, with the development of intelligent manufacturing, new solutions are emerging to address these issues [4,5]. In particular, digital twin (DT) technology has been widely applied in various fields, including product lifecycle management, processing, assembly processes, and predictive and health management [6]. In the FJP process, DT technology has the potential to enhance the accuracy and efficiency of process simulation, optimization, and control by integrating real-time sensor feedback into simulation models and data analysis processes. Therefore, in-depth research into the application of DT technology in FJP, especially in terms of process parameters, material removal function models, and processing path algorithms, will be key to improving machining precision and efficiency.
In this article, a DT-based method is proposed to optimize the FJP process. Firstly, previous research on DT in the field of machining is reviewed to identify the shortcomings of existing methods. The key factors of FJP, such as jet kinetic energy, nozzle design, abrasive type, processing path, and removal rate model, are analyzed. Then, new methods that combine FJP with other technologies are discussed. Subsequently, a high-fidelity DT-based human-centric interaction design framework for the FJP process is proposed. This study explores methods based on transfer learning, which are aimed at predicting machining quality in a rapid and efficient manner, to realize efficient, precise, and stable polishing processes. The effectiveness of the proposed method is validated through polishing experiments on the 3D printed material.
2. Related Works
This section will review and analyze the current application status of DT in the machining field and research work related to process design and finally summarize the existing research gaps.
2.1. Digital Twin in Machining
As the manufacturing industry transitions towards the paradigm of intelligent manufacturing, DT-driven processing systems stand out for their capabilities in sensing, predicting, decision-making, and controlling. These systems are characterized by: 1) the integration of various DT models, 2) the systematic operations that are constituted by interactions between these models, and 3) the provisioning of diverse services through the combination of these operational processes. The analysis of DT-driven machining can be approached from three perspectives: component (point), connectivity (line), and Loop (face).
(a) Component Perspective: DT models serve as high-fidelity virtual counterparts to physical entities [7]. They are influenced by differing manufacturing and process requirements and typically include geometric models, knowledge models, and algorithmic models [8]. Geometric models represent the changing geometric states and physical alterations of an entity [9]. Knowledge models uncover complex data correlations within the machining process and support various functionalities like algorithm development and process optimization [10]. Algorithmic models are crucial for forecasting the actual production process and enabling dynamic and real-time modifications to the machining process [11].
(b) Connectivity Perspective: Examining the flow and transformation of data unveils that DT machining systems embody three critical operations: from physical to digital (sensing), virtual analysis (cognition), and from digital back to physical (feedback and interaction). Sensing involves real-time acquisition of physical data to support decision-making [12]; cognition is the process of acquiring knowledge or predictive information [13]; feedback generates or displays actions that alter the physical world [14]; and interaction encompasses human participation within a looped environment [15].
(c) Loop Perspective: The operation of a DT machining system is cyclical, providing looped services tailored to various manufacturing stages, including process planning, autonomous decision control, human-in-the-loop control, and quality inspection. Process planning integrates various factors and verifies simulation results through actual machining to improve quality [16]. Autonomous decision control adjusts and fine-tunes the machining process based on sensed information [17]. Human-in-the-loop control refers to intelligent decision-making by on-site personnel with the assistance of human-machine interactions [18]. DT-driven quality inspection involves analyzing production data to monitor product quality [19].
In summary, DT technology, with its comprehensive models, operations, and services, offers an integrated and dynamically optimized environment for intelligent manufacturing, enhancing processing efficiency, quality, and flexibility. This advancement is unlocking transformative potential in the manufacturing sector. A focus on the loop perspective, particularly the process design phase and related decision models within the DT machining system, will be crucial in future explorations.
2.2. Digital Twin-Driven Process Design
Intelligent machining primarily targets enhancing machining performance. This entails not only elevating the quality of the product but also amplifying the efficiency of the machining process. Consequently, post-designing a product that conforms to aesthetic standards, it's crucial to conduct manufacturing simulations to ascertain if the product's performance aligns with the anticipated benchmarks. Furthermore, it's imperative to evaluate the machining process to establish whether any modifications are necessary. Therefore, process design is crucial and important. The scope of research in process design spans products, processes, and systems. Utilizing iterative design outcomes during the process design phase can bolster the quality of machining. Product design is largely concerned with devising product functionality and the allocation of product tolerances [20]. In addition, process design is inherently intricate, demanding a holistic assessment of diverse elements, including the workpiece, machining equipment, and parameters [21].
When it comes to the design of the manufacturing process, DT play a pivotal role in offering services such as mapping out manufacturing routes [22], optimizing parameters [23], designing eco-friendly processes [24], reapplying knowledge [25], and evaluating procedures [26]. In system analysis, researchers have delved into methods for appraising spindle performance, strategies for optimizing processes in response to fluctuating operational conditions, and assessing the system's compatibility during the design phase [27]. These design instances, facilitated by iterative features, have demonstrated that DT-led design paradigms can significantly enhance the performance of products, processes, and systems.
2.3. Research Gaps and Motivations
Although pioneers have explored machining processes driven by DT, there still exist some gaps in the field of ultra-precision machining that urgently need to be explored and studied, as follows:
(1) While the DT technology has been recognized by scholars in the field as an important means to enhance the intelligence of manufacturing systems, there is still room for exploration in the research of high-fidelity modeling and analysis of DT in ultra-precision machining scenarios.
(2) Many studies on the method of machining process design already exist [28], but most of these methods are data-driven and are severely constrained by the original data collection scenarios. This significantly hinders the widespread application of DT across various fields.
(3) High-fidelity DT models have been proven to provide important references for process parameter design, but there is a lack of rational process design models to address reasonable parameter design after changes in different processes and scenarios, especially when dealing with variable batch research and development tasks.
The above issues are interrelated; therefore, proposing a human-centric parameter design mode and a system self-adaptation mechanism may be an effective way to fill the research gaps mentioned above. This will also be the main focus of the subsequent sections of this paper.
3. Digital Twin-Driven Process Design Method for Multi-Jet Polishing
This section will analyze the multi jet polishing process and propose a process design framework driven by DT based on its characteristics. Finally, the adaptive features of this framework are proposed based on the framework.
3.1. Multi-Jet Polishing Process
Multi jet polishing is a type of abrasive water jet polishing (AWJP). The fundamental mechanism of AWJP is illustrated in Figure 1, where a stream of polishing fluid is propelled at high speed towards the surface of a workpiece by a high-pressure pump. This fluid contains abrasive particles that remove material from the workpiece through impact and shear forces, resulting in surface polishing. After the collision, the polishing fluid and abrasives are recirculated back to a recovery system, allowing for continuous processing of the workpiece. The existing methods are mainly divided into pre-mixed and post-mixed jets. Pre-mixed jets involve mixing abrasives with water before pressurizing and ejecting through a nozzle to form an abrasive water jet. This approach is known for its high uniformity of abrasive mixture, lower required pressure, high energy utilization, and good jet dynamic characteristics. However, it has the drawback of system complexity and significant wear issues. Currently, considering the internal structure and wear resistance of the hydraulic system equipment, post-mixed jets are more widely used. Nevertheless, the pivotal parameters of AWJP can be outlined as follows:
Kinetic Energy Parameters: The kinetic energy of the jet is principally manifested through the energy and velocity of the abrasive particles. The greater the energy and velocity imparted to these particles, the more significant their effect on the workpiece's surface. To augment the efficiency of material removal and the precision of the machining process, a thorough investigation is imperative for the sensitive parameters that influence the kinetic energy of the abrasives, such as the jet's pressure, angle, standoff distance, and abrasive characteristics.
Nozzle Design: Beyond the kinetic energy parameters, the design, quantity, and motion pattern of the nozzles in AWJP play a substantial role in the machining performance. Achieving superior machining capabilities and enhanced surface quality necessitates a qualitative analysis of the nozzle performance.
Abrasives: As the key agents of material removal in AWJP technology, the physical attributes of the abrasives—such as shape, size, and type—have a direct bearing on the efficiency of the machining process and the surface quality of the machined workpiece. This necessitates a focus on the various commonly used abrasive particle shapes currently available.
3.2. The Framework for Digital Twin-Driven Process Design Method
The dynamic nature of machining environments, where processes evolve over time, often leads to a decrease in the efficiency of process planning execution. Before implementing a process, it is crucial to evaluate whether the current process content meets the machining requirements of the workpiece and can produce a finished product of specified quality. Furthermore, it is essential to perform optimization calculations on real-time data and critical parameters during the process implementation, to provide a preselection of optimal parameters and effective numerical references. Therefore, a human-centric process parameter design method driven by DT is introduced, as illustrated in Figure 2. In the discussed human-centric design approach, the DT model serves as the sole data source during the three-dimensional process design, playing a vital role in conveying process information. The core of the DT-driven human-centric process parameter design method is the generation of an interactive process model based on the design model.
The process design enables the creation of a three-dimensional solid process model that can manage process information. Automatic extraction of design model information provides a foundational layer of information. The construction of a process knowledge base, consisting of process instance libraries, process rule libraries, and equipment resource libraries, supports the reuse of process instances and automatic process decision-making within the aid of process design systems. Automatic process decision-making includes selecting machining methods, equipment, planning process routes, NC machining operations, and computing decisions to achieve knowledge-based automatic planning of process routes and programmatic calculation of process parameters, generating comprehensive and detailed process information. Finally, the generated process information is integrated into a process information tree. Combined with model lightweight processing, a three-dimensional operation manual is created to realize visual guidance on the shop floor. Therefore, compared to traditional process evaluation methods, the human-centric process design approach has the following characteristics:
Multi-Modal Process Information Perception: The perception of the machining process relies on the equipment configured on-site to collect data, resulting in a massive twin dataset consisting of multi-source heterogeneous data mappings. The human-centric process design model supports this twin data, achieving optimization through machining quality prediction, and refining machining paths, process methods, and process parameters.
Quality-Centric Approach: The entire process is quality-driven, with continuous adjustments made based on quality metrics derived from the virtual simulations and real-time data analysis, ensuring that the final product meets the specified standards.
Dynamic Adaptation: The combination of real-time data with simulation allows for dynamic adaptation of the process, ensuring that any deviations from the desired outcomes can be corrected promptly, leading to a more agile and resilient manufacturing process.
Proactive Problem-Solving: By placing humans in the loop, the design method allows for preemptive actions to be taken, ensuring that any potential issues can be anticipated and mitigated effectively, thus reducing downtime and enhancing the overall efficiency of the process.
Human-In-The-Loop Design Mode: The system uses virtual simulation technology to explore and predict the unknown world, followed by process modifications based on quality information until process execution is completed. Process designers can take proactive measures to avoid or solve potential disturbances in advance.
By implementing these characteristics, the proposed method aims to improve both the efficiency and quality of process planning in dynamic machining environments.
3.3. The Adaptability of Process Design
In today's manufacturing industry, the adaptability of process design is crucial for ensuring product performance and manufacturing efficiency. Current research indicates that due to the complexity of manufacturing environments and the variability of process parameters, static process design models struggle to meet the rapidly changing market demands. Fluctuations in the environment, changes in material properties, and differences in operator skills are key factors that affect the stability of process design and product performance. Moreover, to meet the demands for personalized and customized products, process design must be flexible to accommodate continuously updated product characteristics and manufacturing technologies.
Adaptive process design models can adjust process parameters in real-time, ensuring that product performance meets predefined standards despite fluctuations in raw material supply, changes in environmental conditions, and variations in production equipment performance. These models, through real-time data collection, advanced data processing technology, and machine learning algorithms, can monitor and predict the impact of key process parameters on product performance, making immediate adjustments when deviations are detected. In a production mode of multiple varieties and small batches, they can quickly switch between different products, reducing the time and cost to set new process parameters, thereby increasing production flexibility and efficiency. As such, adaptive process design models can learn and predict the process conditions required for new product designs, quickly adapt to changes on the production line, reduce downtime, and enhance overall production capacity.
With the advancement of manufacturing technology, especially in the context of Industry 4.0, the importance of adaptive process design models will be further enhanced to support more intelligent and automated production systems. Thus, the demand for adaptability in product quality prediction models is also growing. The core component of the adaptive process design model is the adaptability of the product quality prediction model. Transfer learning is an important pathway to improve the adaptability of product prediction models, which will be the focus of subsequent content and is the main innovative point of this article.
4. Transfer Learning-Based Method
This section introduces a feature encoding-based transfer learning prediction model for forecasting surface roughness, which takes into account the workpiece material (i.e., 316L stainless steel 3D printed parts), polishing parameters (feed rate (f), fluid pressure (P), tool offset (TO), and distance (d)), as well as surface roughness parameters (i.e., initial surface roughness, Rai, and final surface roughness, Raf). Figure 3 illustrates the framework of the proposed Feature Encoded Transfer Learning (FETL) model. The model consists of two core modules: (a) the feature encoding module and (b) the regression prediction module. After encoding the input data in the feature encoding module, the generated feature values are passed to the regression prediction module, where the final predicted surface roughness is determined through the guidance aggregation of multiple sub-decision trees.
4.1. Transfer Learning Strategy
When the source and target domains are studied, it becomes evident that the input data distributions for different tasks vary significantly. Notably, for different workpiece materials, there is a shift in the data concerning polishing parameters and the resulting surface roughness. When the same model is used to perform both tasks simultaneously, this shift can lead to a significant reduction in model accuracy. To make full use of grinding data from different materials and processes, a feature encoding-based transfer learning strategy is proposed in this paper. This strategy enables the model to transfer from the labeled data of different tasks (source domain data) to the unlabeled data of the new task (target domain data), thus training a model suitable for the target domain. The core idea of this strategy is that an encoder is designed to process the input data and learn a domain-invariant feature representation. Based on this feature, predictions for data from both domains can be better made simultaneously.
As shown in Figure 4, the training process of the prediction model is divided into two stages. In the first stage, the data from the source and target domains are randomly mixed and then input into the feature encoding module to learn a common representation of the data between domains. In the second stage, using the encoding module trained in the first stage, the feature representation of the current task's input data is obtained and passed into the regression prediction module, which learns the mapping between the encoded features and the predicted values. When training the encoding module, the loss function is designed to focus on the information loss between the encoded feature and the original input, guiding the learning direction of the encoding module and eliminating the impact of model overfitting on the target domain's feature recognition ability.
The training of the encoder module consists of forward propagation and backward parameter tuning processes. Assuming that the network processes m training samples in one batch, with the individual input sample being (x(i), y(i)), where x(i) is a 4-dimensional input vector and y(i) is the labeled final surface roughness for that sample. Then, the forward propagation calculates the input features at each layer as follows:
In the formula, xl-1 is the feature vector calculated from the l-1 layer, and it is also the input vector of the l-th layer; wl and bl are the weights and bias vectors of the neurons in the l-th layer network, respectively. f(∙) is the activation function, and the activation function of this model is LeakyReLU. Its calculation formula is as follows:
In the formula, α is a constant between 0 and 1, where x is the input variable. For a sample set {(x (1), y (1)),..., (x (m), y (m))} containing m samples, the overall cost function of the encoder module is:
In the formula, λ stands for the weight attenuation parameter, is the total number of layers in the network, is the total number of neurons in the l-th layer of the network, is the total output of the encoding module under the current weight w and bias b, and is the weight of neurons in the l-th layer.
During the backpropagation process, the weight and bias parameters are adjusted based on the gradient descent method to minimize the overall cost function. The update formula for the l-th layer parameters is as follows:
In the formula, α is learning speed.
When the cost error of the entire network structure is minimized, a pre-trained encoder module is obtained. The encoder module proposed in this paper consists of four Basic Blocks connected in series, each block containing a fully connected layer and an activation function layer. The input data is a 1×4×m vector, which the first two blocks gradually expand to 1×8×m and 1×16×m vectors, respectively. Then, through the last two blocks, the vector is gradually compressed back to 1×8×m and finally to a 1×4×m feature vector. That is, the encoding module eventually outputs a feature vector whose dimensions are the same as the original input data.
The training of the regression prediction module consists of four parts: data preparation, decision tree construction, ensemble prediction, and parameter updating. First, the original input data is processed using the trained encoding module from stage one, which provides the input data for the regression prediction module. Second, a random training sample set is obtained using a bootstrapping sampling method, and fully split child decision trees are built. Then, the final predicted surface roughness is determined through the ensemble of multiple sub-decision trees. Finally, the predictions are compared with the actual values, and the parameters of the regression prediction module are updated accordingly.
4.2. Loss Function
Loss function for stage 1: The purpose of the first stage of training is to enable the encoding module to learn a feature expression that is invariant across domains from the mixed data of the target and source domains, in order to better accomplish the surface roughness prediction task. However, for this feature expression, it is not possible to obtain true label values to calculate the loss function. Therefore, this paper focuses on the error of the final prediction task, as well as the information loss between the feature and the original input data, designing the following loss function:
where is Lost information loss, is the mean squared error loss, and is the balancing weight coefficient.
The information loss due to loss is used to measure how much information is lost when the feature expression is used instead of the original input data, expressing the similarity between the two. Its calculation formula is shown below:
where and are the probabilities of event x occurring in different domains p and q, respectively, and X is the total data sample.
The mean squared error loss calculates the square difference between the predicted values and the target values. By doing so, relatively large differences are penalized more, and relatively small differences are penalized less. It is one of the loss functions commonly used in regression tasks, and its calculation formula is shown below:
In the first stage of training, the input to the encoding module is passed to the fully connected layer, and its output is used as the final surface roughness prediction value, which is then used to calculate the MSE loss with actual values. This is weighted with the information loss calculated from the encoded features to obtain the overall total loss value. The model parameters of each block of the encoding module are updated through backpropagation.
Loss function for stage 2: The purpose of the second stage of training is to enable the regression prediction module to learn the mapping relationship between the encoded features and the surface roughness prediction values, which is a classic regression problem. During the model training process, it is only necessary to focus on the error of the prediction task, therefore the MSE loss function is used as the overall loss function for stage two.
5. Experimental Verification
This section will use polishing cases of 3D printed parts to verify the feasibility of the method.
5.1. Experimental Setup
During the MJP experiment, the ZEEKO IRP200 machine was used for polishing with different process parameters, as shown in Figure 5. Two different working conditions were set up, using 7 nozzles and 4 nozzles, respectively (see Figure 5c and Figure 5d). The polishing setup is shown in Figure 5(b), with 3D printed 316L stainless steel components and CoCr (see Figure 5e and Figure 5f). In addition, the meanings of the related parameters can be found in Table 1. After polishing, the surface roughness (Ra) was measured three times and averaged to obtain the final experimental Ra. For the two conditions, 43 and 80 sets of experimental data items with different polishing parameters were collected, including feed rate (f), fluid pressure (P), tool offset (TO), step size (d), initial surface roughness (Rai), and surface direction.
Our model was implemented in PyTorch and optimized using the Adam optimizer, with the parameters set to β_1=0.9 and β_2=0.999. The proposed model was compiled on a computer server equipped with a Tesla V100 PCIe 32GB GPU card, using Python 3.6, Pytorch 1.8, and CUDA 10.2.
5.2. Surface Topography Analysis Before and After Multi-Jet Polishing
The surface treatment effects of 316L stainless steel and CoCr after the 3D printing process were evaluated. As shown in Figure 6, a clear observation from the before-and-after comparison indicates that the laser melting traces produced during the 3D printing process were effectively eliminated by the Multi Jet Polishing (MJP) procedure. Moreover, surface defects such as un-melted particles and cracks were also significantly improved. However, as can be seen from the surface comparison photos before and after polishing, there are still some larger-scale wave-like textures present. This is because the micrometer-sized particles in the abrasive media used during polishing can only remove roughness to a certain extent and are not effective for millimeter or sub-millimeter level irregularities. Therefore, in order to achieve a higher surface finish, more stringent surface pre-treatment techniques must be employed prior to mechanical polishing.
5.3. Comparison with State-of-the-Arts
Quantitative evaluation was conducted using state-of-the-art (SOTA) methods, including XGBoost, RF (Random Forest), LASSO (Least Absolute Shrinkage and Selection Operator), and SVR (Support Vector Regression). The numerical results of these methods are presented in Figure 7. Our method outperformed in all three metrics: MAE (Mean Absolute Error), MSE (Mean Square Error), and R2 (Coefficient of Determination). MAE, MSE, and R2 are metrics used to measure the predictive capability of regression models. They quantify the model's prediction accuracy by calculating the differences between the true values and the predicted values.
MAE is the average of the absolute errors and is less sensitive to outliers, but it does not reflect the distribution of predictive errors. MSE is the average of the squared errors, which is sensitive to outliers (because when the error is greater than 1, squaring it will further amplify the value), but it can reflect the distribution of predictive errors. R2 indicates the proportion of the variance for the dependent variable that's explained by the model; its value ranges from 0 to 1, with values closer to 1 indicating a better fit of the model to the data.
As shown in Figure 7, our method achieved the lowest MAE and MSE, indicating the smallest discrepancy with the true values. The highest MAE and MSE were observed for LASSO, indicating the lowest prediction accuracy. The other three methods had similar metric values, suggesting a comparable level of discrepancy between their predictions and the actual values. From the R2 metric perspective, our model had the best fit to the data, while XGBoost had the poorest fit. The results also indicate that the prediction errors calculated by MAE and MSE do not fully represent the model's fitting ability.
5.4. Ablation Experiments
In this section, an ablation study will be conducted to determine the effectiveness of the main innovations in the proposed method. Specifically, the impact of the loss function, transfer strategy, and Artificial Neural Network (ANN) [29] feature transformation on performance improvement was studied. The quantitative results of the ablation experiments are shown in Table 2.
Compared to using only MSELOSS, our method reduced MAE (Mean Absolute Error) by 0.01 and increased R2 by 0.021, with no change in MSE. Training with MSELOSS directly targets the reduction of mean squared error, which is sensitive to outliers, so the model training results tend to eliminate outliers, which may lead to a homogenization of prediction results and not learning the true distribution of the data. Compared to not using a transfer strategy, R2 increased by 0.19, MAE decreased by 0.015, and MSE decreased by 0.04. The purpose of transfer is to make full use of existing data, applying the knowledge learned from similar data to new tasks, which is why there is a significant improvement in all three evaluation metrics. Compared to the common Min-Max feature transformation method, the proposed method has improvements in both MAE and R2, but the extent of improvement is smaller compared to others. Figure 8 shows the fit of different models to each sample in the ablation study.
6. Conclusions
In conclusion, the research presented in this paper marks a significant advancement in the field of fluid jet polishing (FJP) by addressing its existing challenges of efficiency, system complexity, and stability, particularly in the face of uncertain process optimization. Through the innovative application of DT technology, this study has proposed a novel framework designed to enhance the optimization of the FJP process, successfully circumventing the limitations of traditional methods.
The human-centric design approach adopted in this framework, which meticulously integrates critical factors of DT-driven FJP, including jet kinetic energy, nozzle structure, abrasive type, and machining path, has proven to be a comprehensive method that extends beyond simple removal function models to sophisticated machining path algorithms. The incorporation of a core methodology based on transfer learning stands at the forefront of this research, aiming to significantly uplift the predictive accuracy, machining efficiency, and stability of the FJP operations.
The practical validation of this method, as demonstrated through a case study involving the polishing of 3D printed materials, has not only underscored the effectiveness of the proposed method but also highlighted the key enabling technologies while pinpointing the main challenges that are yet to be overcome.
This study is pivotal as it propels the application potential of FJP technology forward, and simultaneously, it provides a novel perspective and strategy for optimizing complex machining processes. By leveraging the capabilities of DT technology, this research contributes a substantial body of knowledge to the domain of advanced manufacturing processes and opens up new avenues for further exploration and innovation.
Author Contributions
Conceptualization, investigation, and writing—original draft preparation, H.M.; methodology, and software, H.M. and X.C.; validation, Z. Z. and R. W.; formal analysis, X.C. (Xie Chen); data curation, L. G.; project administration, J.C.; funding acquisition, X.C. (Xiao Chen); supervision and writing—review and editing, R. W. All authors have read and agreed to the published version of the manuscript.
Funding
The study is supported by the National Key R & D Program of China (Grant No. 2025YFB3411702) and Hubei Key R&D Program (Grant No. 2023BAB195)
Data Availability Statement
The original contributions presented in this study are included in the article. Further inquiries can be directed to the corresponding author.
Conflicts of Interest
The authors declare no conflicts of interest.
Abbreviations
The following abbreviations are used in this manuscript:
| DT | Digital twin |
| RF | Random Forest |
| SVR | Support Vector Regression |
| AWJP | Abrasive Water Jet Polishing |
| MAE | Mean Absolute Error |
| FJP | Fluid Jet Polishing, |
| UPM | Ultra-Precision Machining |
| LASSO | Least Absolute Shrinkage and Selection Operator |
| R2 | Coefficient of Determination |
| MSE | Mean Square Error |
References
- Liu, C.; Ke, J.; Yin, T.; Yip, W.S.; Zhang, J.; To, S.; Xu, J. Cutting mechanism of reaction-bonded silicon carbide in laser-assisted ultra-precision machining. International Journal of Machine Tools and Manufacture 2024, 203, 104219. [Google Scholar] [CrossRef]
- Chen, X.; Chu, J.; Zhu, Z.; Liu, C. Effect of temperature on surface morphology of single-crystal silicon in nanometric cutting. Applied Surface Science 2025, 684. [Google Scholar] [CrossRef]
- Liu, C.; Yip, W.S.; To, S.; Chen, B.; Xu, J. Numerical Investigation on the Effects of Grain Size and Grinding Depth on Nano-Grinding of Cadmium Telluride Using Molecular Dynamics Simulation. Nanomaterials 2023, 13. [Google Scholar] [CrossRef] [PubMed]
- Wang, R.; Cheung, C.F.; Zang, Y.; Wang, C.; Liu, C. Material removal rate optimization with bayesian optimized differential evolution based on deep learning in robotic polishing. Journal of Manufacturing Systems 2025, 78, 178–186. [Google Scholar] [CrossRef]
- Liu, S.; Bao, J.; Zheng, P. A review of digital twin-driven machining: From digitization to intellectualization. Journal of Manufacturing Systems 2023, 67, 361–378. [Google Scholar] [CrossRef]
- Liu, S.; Lu, Y.; Shen, X.; Bao, J. A digital thread-driven distributed collaboration mechanism between digital twin manufacturing units. Journal of Manufacturing Systems 2023, 68, 145–159. [Google Scholar] [CrossRef]
- Liu, J.; Wen, X.; Zhou, H.; Sheng, S.; Zhao, P.; Liu, X.; Kang, C.; Chen, Y. Digital twin-enabled machining process modeling. Advanced Engineering Informatics 2022, 54. [Google Scholar] [CrossRef]
- Zheng, P.; Sivabalan, A.S. A generic tri-model-based approach for product-level digital twin development in a smart manufacturing environment. Robotics and Computer-Integrated Manufacturing 2020, 64. [Google Scholar] [CrossRef]
- Pashkov, A.E.; Malashchenko, A.Y.; Pashkov, A.A. On Creating Digital Technologies for the Production of Large Aircraft Frame and Skin Parts. Russian Metallurgy (Metally) 2022, 2021, 1777–1785. [Google Scholar] [CrossRef]
- Ladj, A.; Wang, Z.; Meski, O.; Belkadi, F.; Ritou, M.; Da Cunha, C. A knowledge-based Digital Shadow for machining industry in a Digital Twin perspective. Journal of Manufacturing Systems 2021, 58, 168–179. [Google Scholar] [CrossRef]
- Giuliano, G.; Corrado, A.; Polini, W. A Geometric Algorithm to Evaluate the Thickness Distribution of Stretched Sheets through Finite Element Analysis. Applied Sciences 2021, 11. [Google Scholar] [CrossRef]
- Ganser, P.; Venek, T.; Rudel, V.; Bergs, T. Dpart – a Digital Twin Framework for the Machining Domain. MM Science Journal 2021, 2021, 5134–5141. [Google Scholar] [CrossRef]
- Xia, L.; Zheng, P.; Li, X.; Gao, R.X.; Wang, L. Toward cognitive predictive maintenance: A survey of graph-based approaches. Journal of Manufacturing Systems 2022, 64, 107–120. [Google Scholar] [CrossRef]
- Rakic, Aleksandar S.Z.; Dimic, Zoran; Knezevic, Mladen. digital thread-driven distributed collaboration mechanism between digital twin manufacturing units . BioResources 2021, 16, 1115–1130. [Google Scholar] [CrossRef]
- Zhu, Z.; Xi, X.; Xu, X.; Cai, Y. Digital Twin-driven machining process for thin-walled part manufacturing. Journal of Manufacturing Systems 2021, 59, 453–466. [Google Scholar] [CrossRef]
- Plakhotnik, D.; Curutiu, A.; Zhulavskyi, A.; Beudaert, X.; Munoa, J.; Stautner, M. Framework for Coupled Digital Twins in Digital Machining. MM Science Journal 2021, 2021, 5093–5097. [Google Scholar] [CrossRef]
- Ma, C.; Gui, H.; Liu, J. Self learning-empowered thermal error control method of precision machine tools based on digital twin. Journal of Intelligent Manufacturing 2021, 34, 695–717. [Google Scholar] [CrossRef]
- Liu, S.; Lu, S.; Li, J.; Sun, X.; Lu, Y.; Bao, J. Machining process-oriented monitoring method based on digital twin via augmented reality. The International Journal of Advanced Manufacturing Technology 2021, 113, 3491–3508. [Google Scholar] [CrossRef]
- Dreyfus, P.-A.; Psarommatis, F.; May, G.; Kiritsis, D. Virtual metrology as an approach for product quality estimation in Industry 4.0: a systematic review and integrative conceptual framework. International Journal of Production Research 2021, 60, 742–765. [Google Scholar] [CrossRef]
- Wu, Y.; Zhou, L.; Zheng, P.; Sun, Y.; Zhang, K. A digital twin-based multidisciplinary collaborative design approach for complex engineering product development. Advanced Engineering Informatics 2022, 52. [Google Scholar] [CrossRef]
- Sulitka, M.; Kolar, P.; Sveda, J.; Smolik, J.A.N. Strategy for Implementating Predictive Process-Oriented Machine Tool Digital Twins. MM Science Journal 2022, 2022, 5954–5961. [Google Scholar] [CrossRef]
- Xin, Y.; Chen, Y.; Li, W.; Li, X.; Wu, F. Refined Simulation Method for Computer-Aided Process Planning Based on Digital Twin Technology. Micromachines (Basel) 2022, 13. [Google Scholar] [CrossRef] [PubMed]
- Zheng, C.M.; Zhang, L.; Kang, Y.-H.; Zhan, Y.; Xu, Y. In-process identification of milling parameters based on digital twin driven intelligent algorithm. The International Journal of Advanced Manufacturing Technology 2022, 121, 6021–6033. [Google Scholar] [CrossRef]
- Chen, Z.; Zou, J.; Wang, W. Towards comprehensive digital evaluation of low-carbon machining process planning. Artificial Intelligence for Engineering Design, Analysis and Manufacturing 2022, 36. [Google Scholar] [CrossRef]
- Li, J.; Zhou, G.; Zhang, C. A twin data and knowledge-driven intelligent process planning framework of aviation parts. International Journal of Production Research 2021, 60, 5217–5234. [Google Scholar] [CrossRef]
- Liu, J.; Zhou, H.; Liu, X.; Tian, G.; Wu, M.; Cao, L.; Wang, W. Dynamic Evaluation Method of Machining Process Planning Based on Digital Twin. IEEE Access 2019, 7, 19312–19323. [Google Scholar] [CrossRef]
- Shen, N.; Wu, Y.; Li, J.; He, T.; Lu, Y.; Xu, Y. Research on procedure optimisation for composite grinding based on Digital Twin technology. International Journal of Production Research 2022, 61, 1736–1754. [Google Scholar] [CrossRef]
- Wang, R.; Ji, D.Y.; Liu, C.; Lee, J. Available at SSRN 5955781; V-TimesNet: Vision-Augmented TimesNet for Improved Anomaly Detection in Semiconductor Plasma Dry Etching.
- Wang, R.; Cheng, M.N.; Loh, Y.M.; Wang, C.; Cheung, C.F. Ensemble learning with a genetic algorithm for surface roughness prediction in multi-jet polishing. Expert Systems with Applications 2022, 207, 118024. [Google Scholar] [CrossRef]
Figure 1.
Principal diagram of precision AWJP.
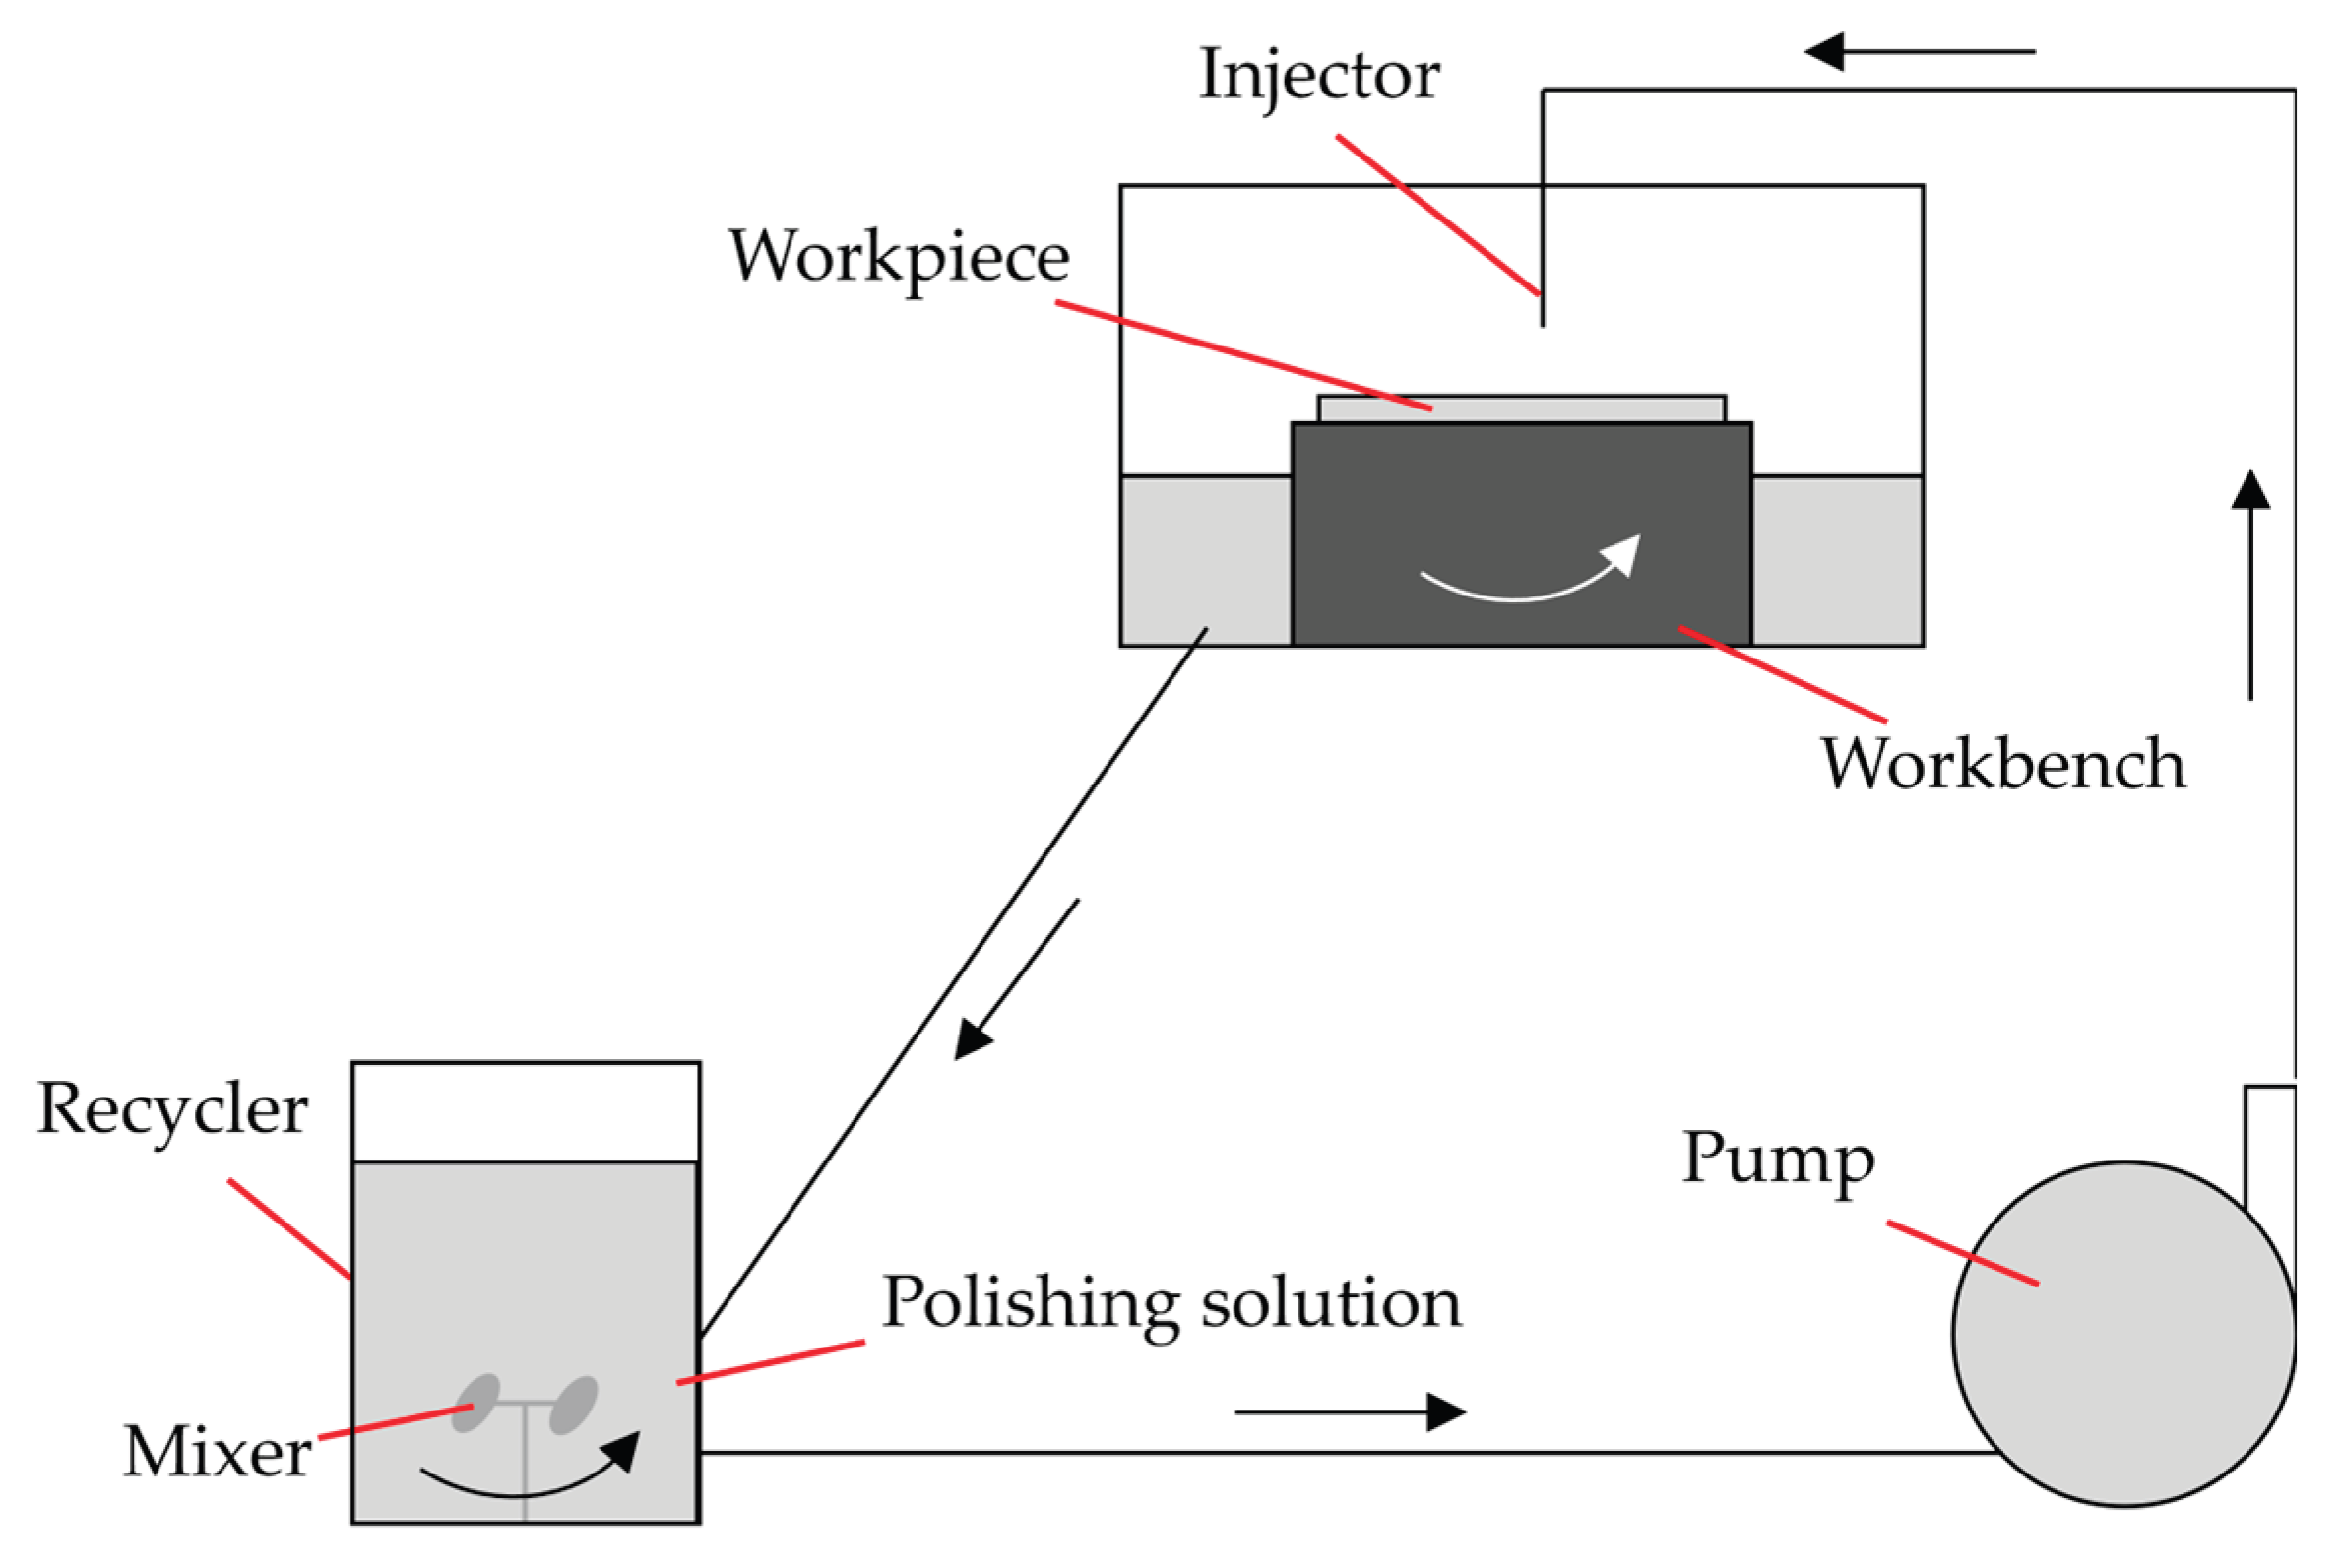
Figure 2.
Human-centric process parameter design mode.
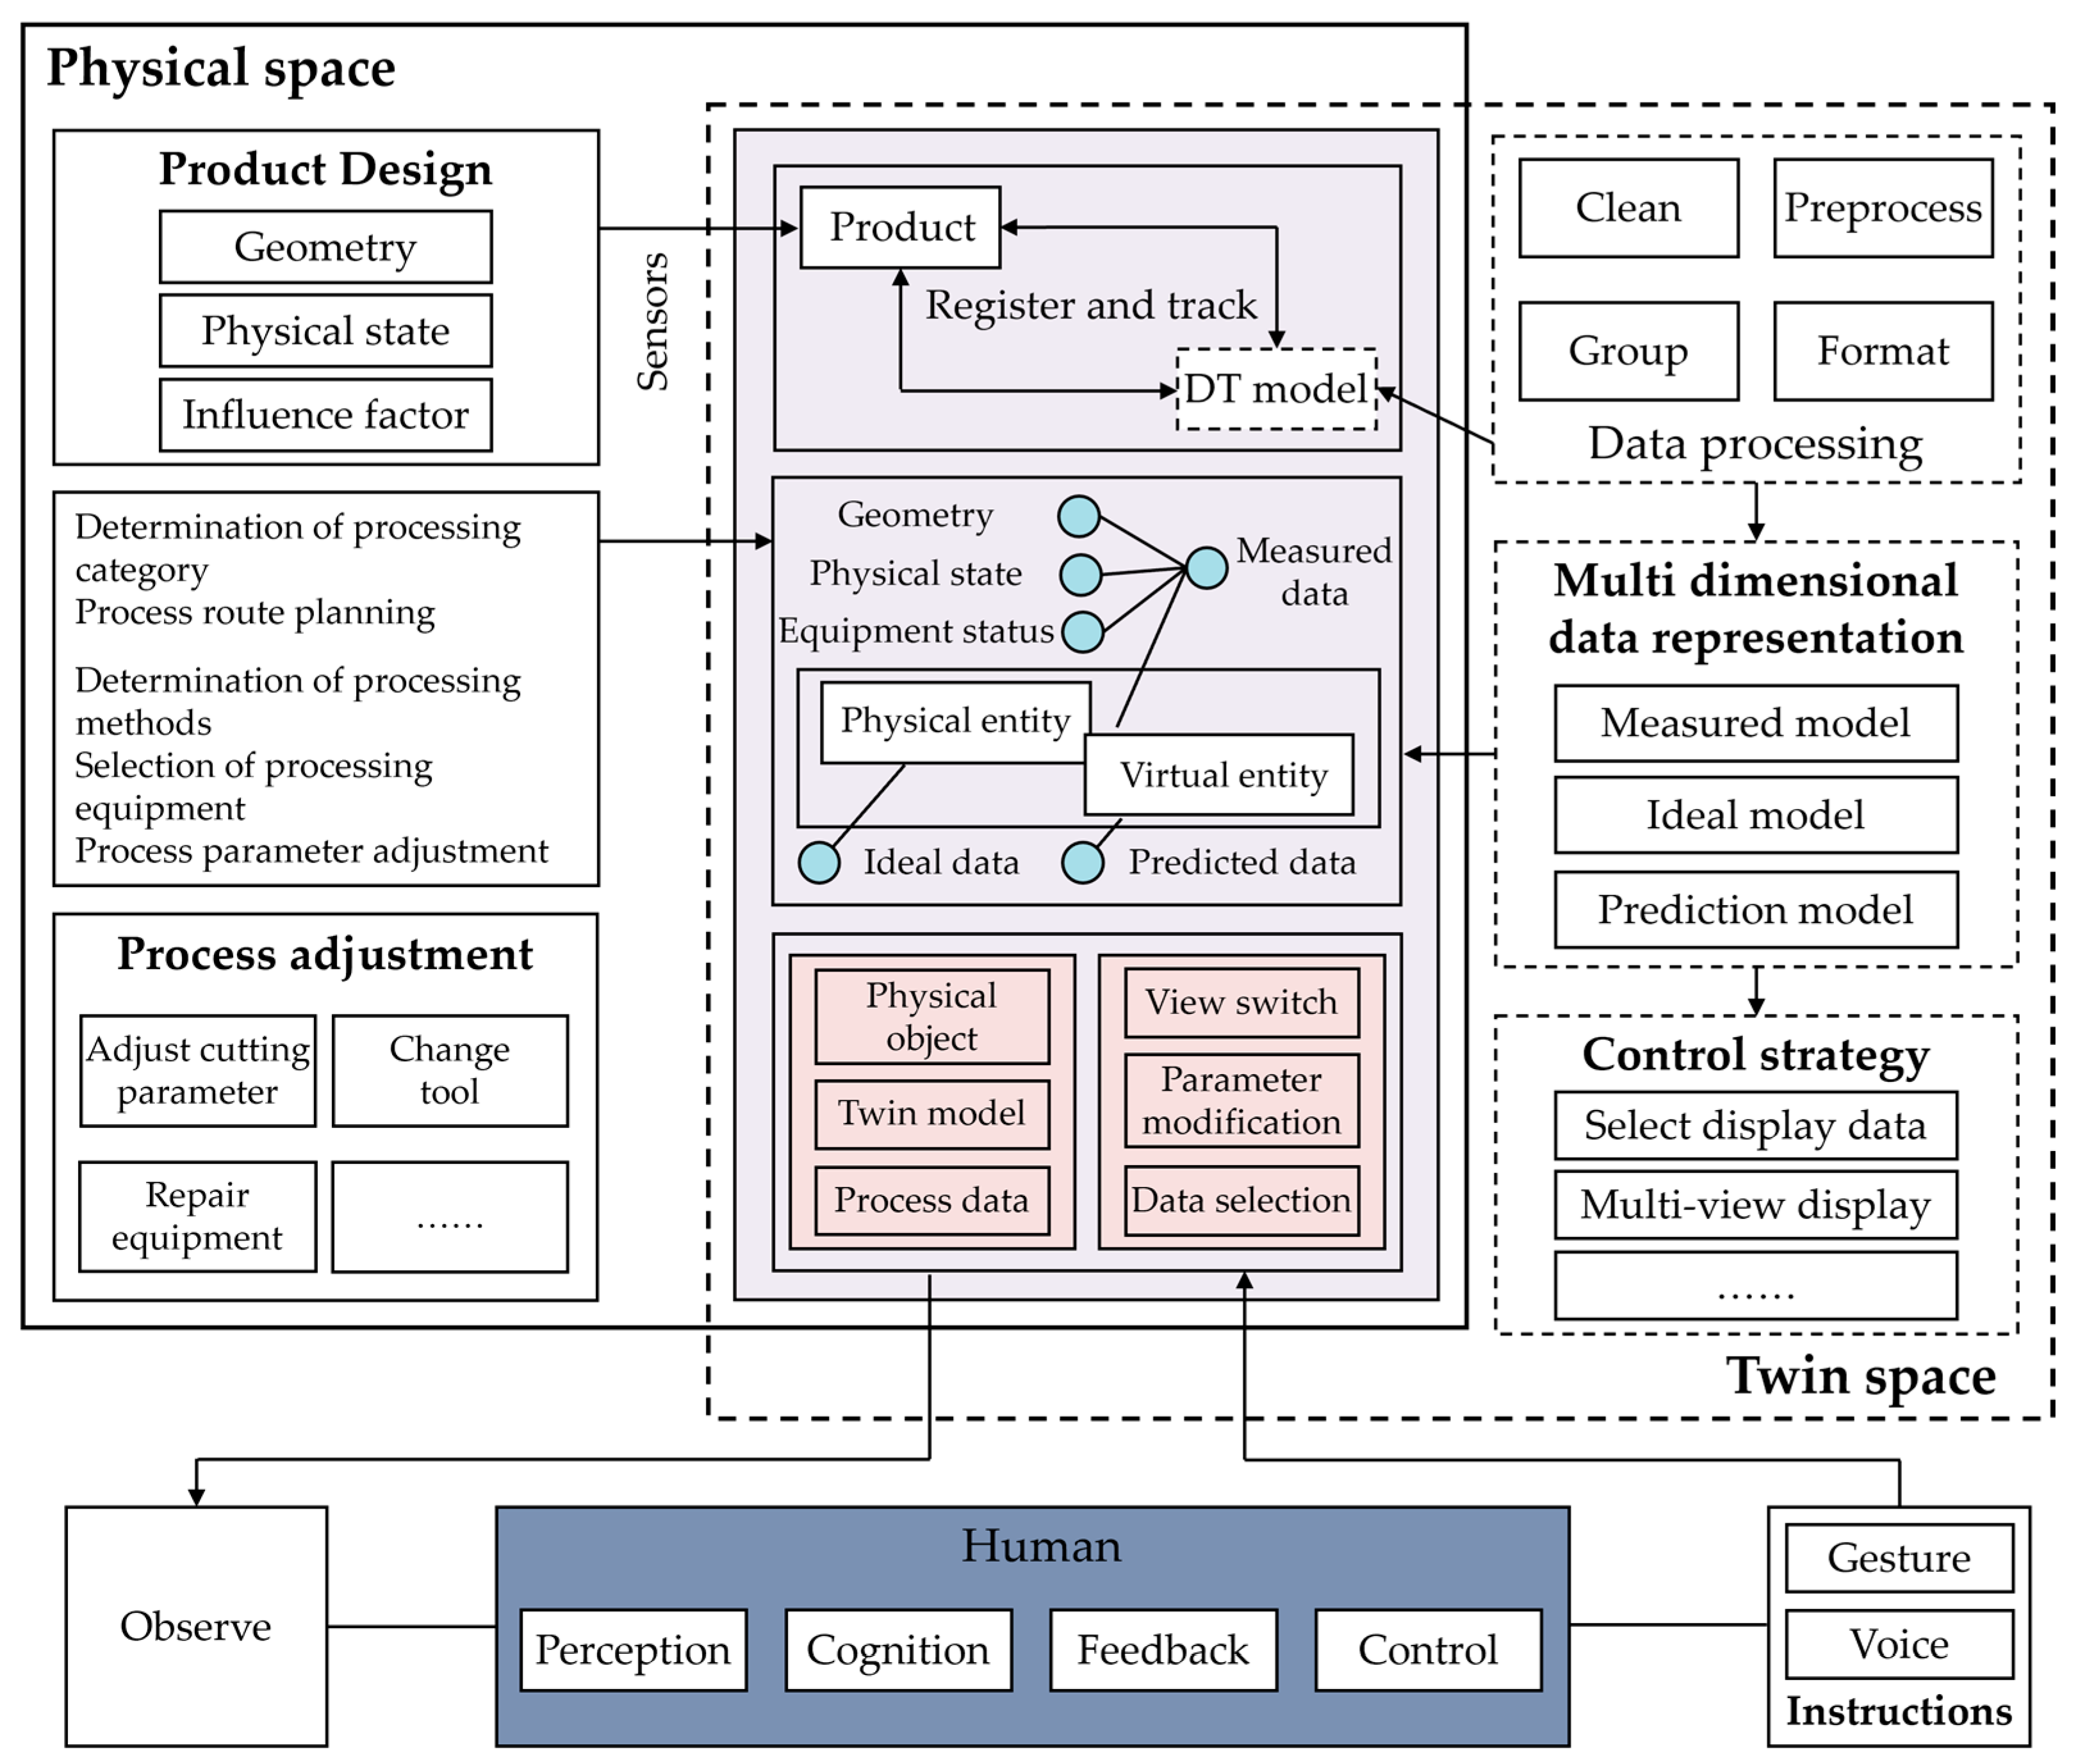
Figure 3.
The architecture of proposed network.
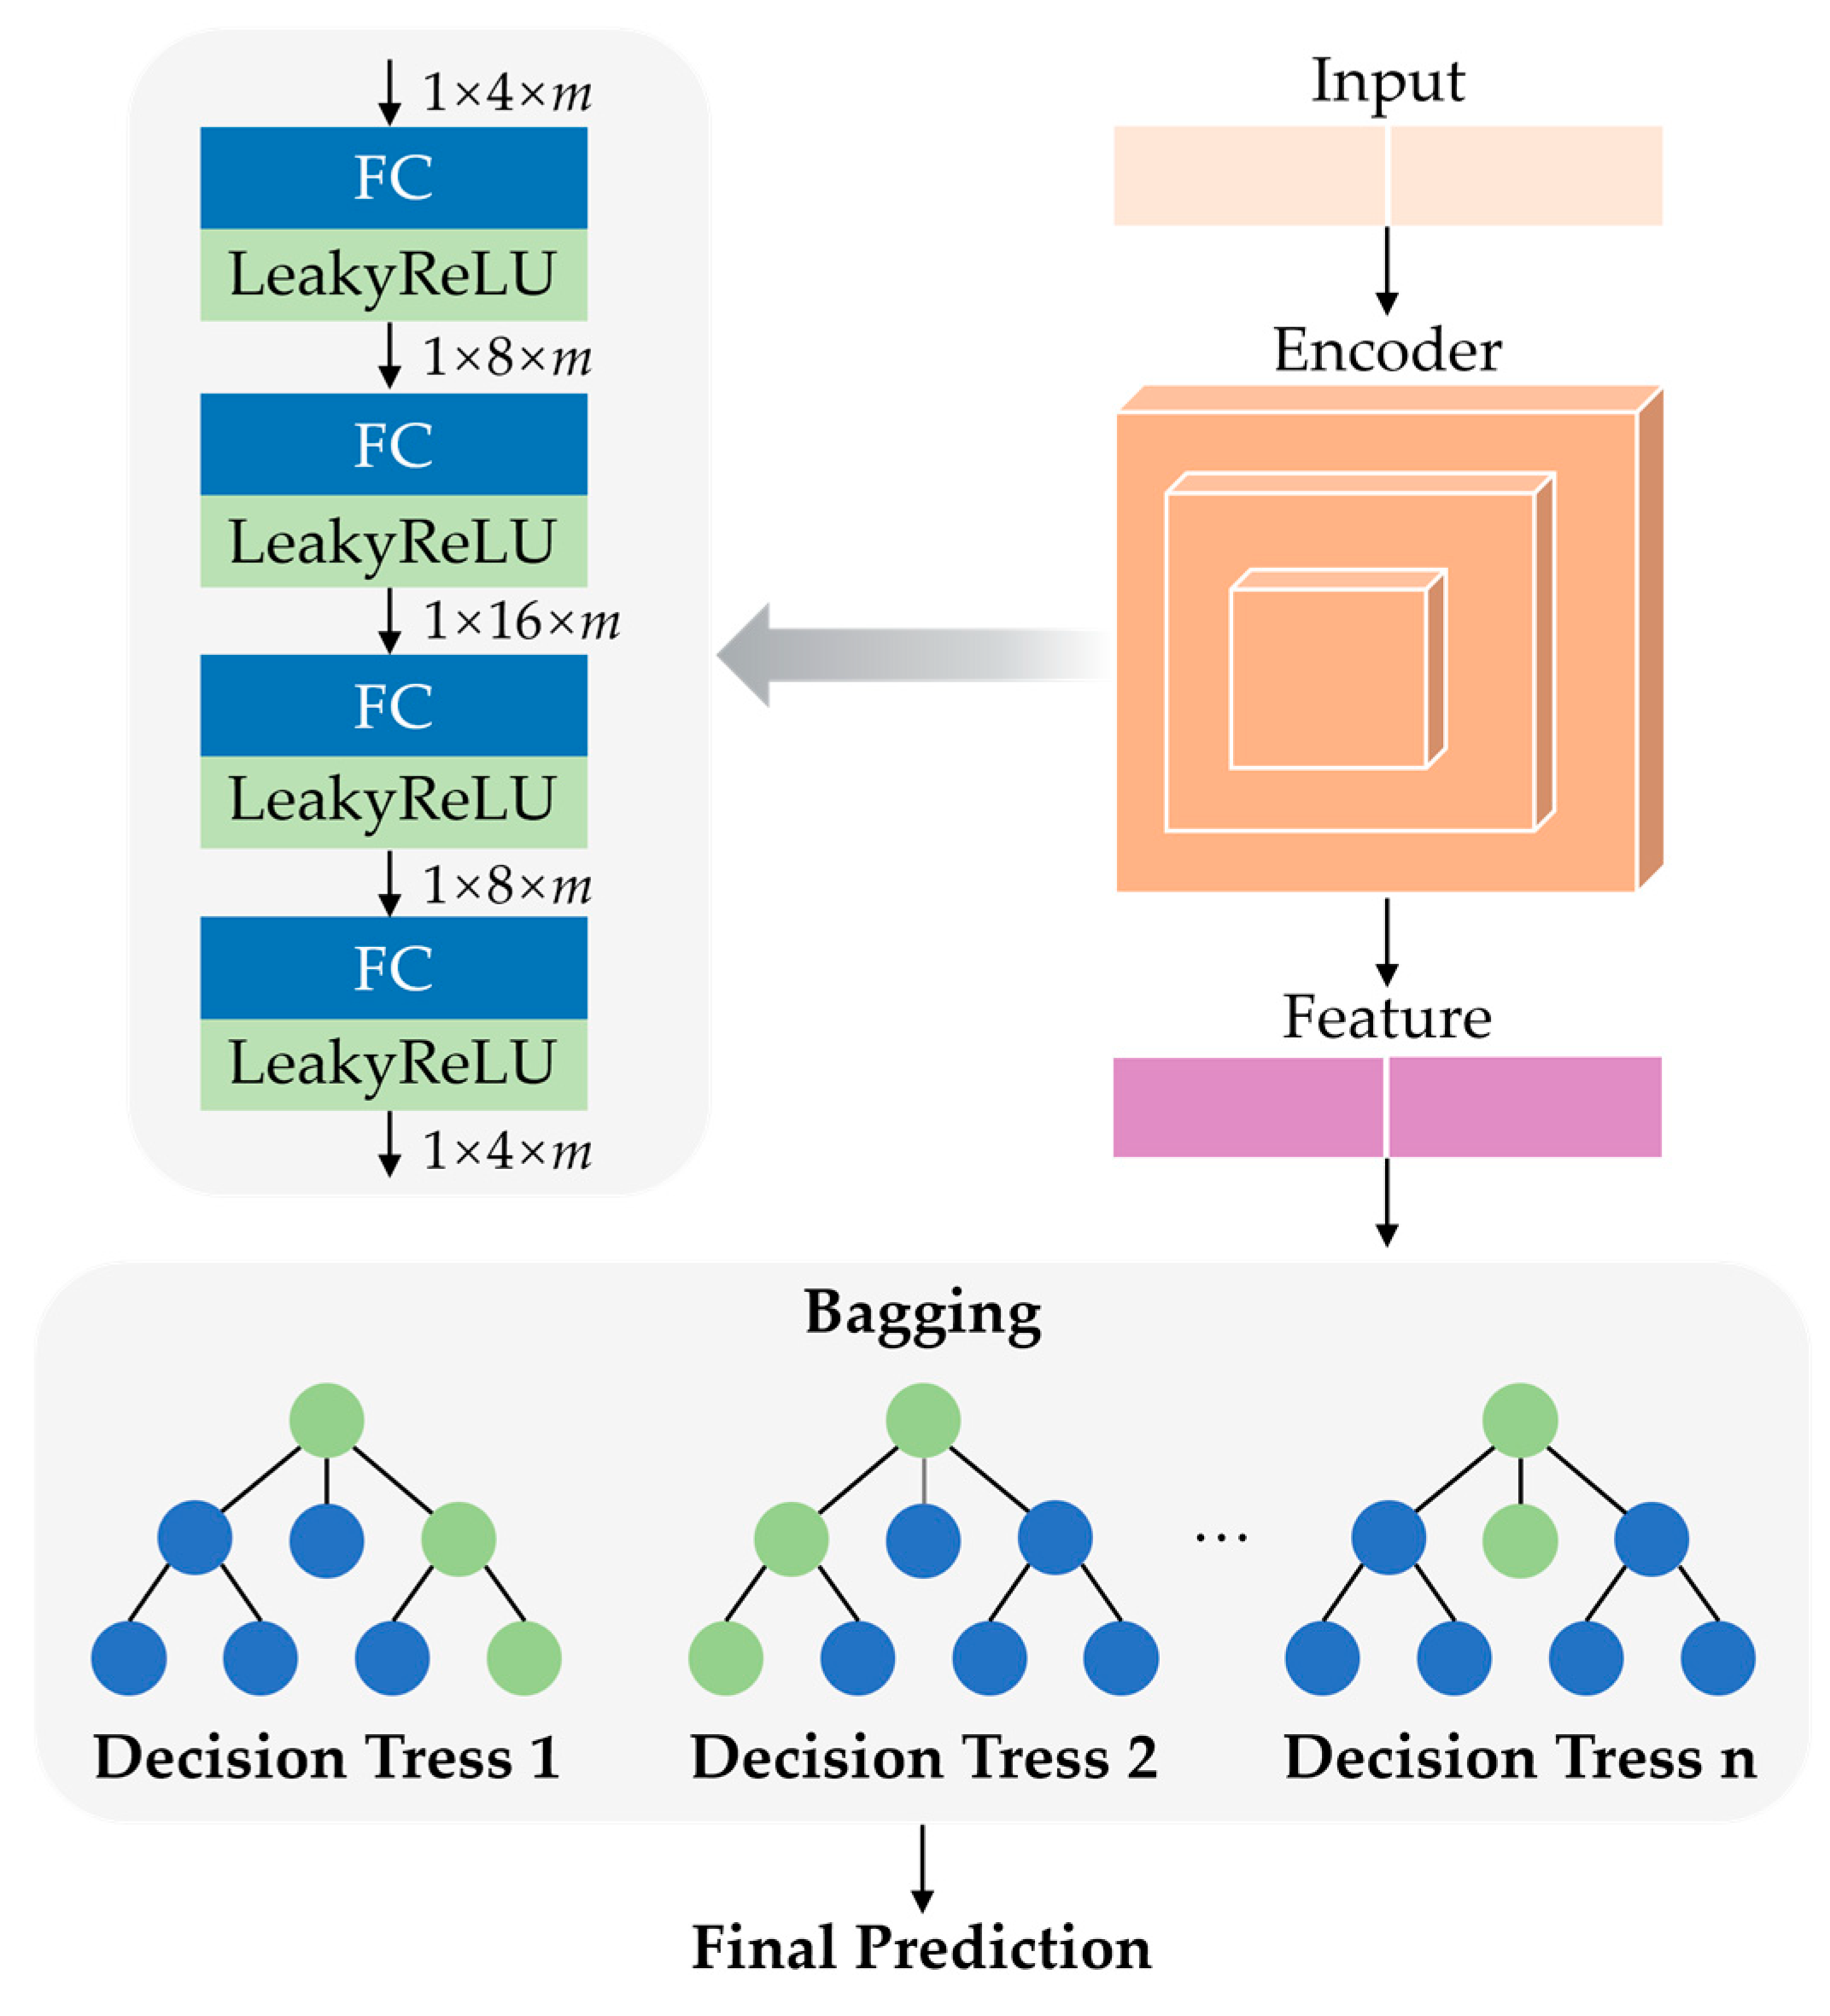
Figure 4.
The training process of the prediction model in (a) Stage 1and (b) Stage 2.
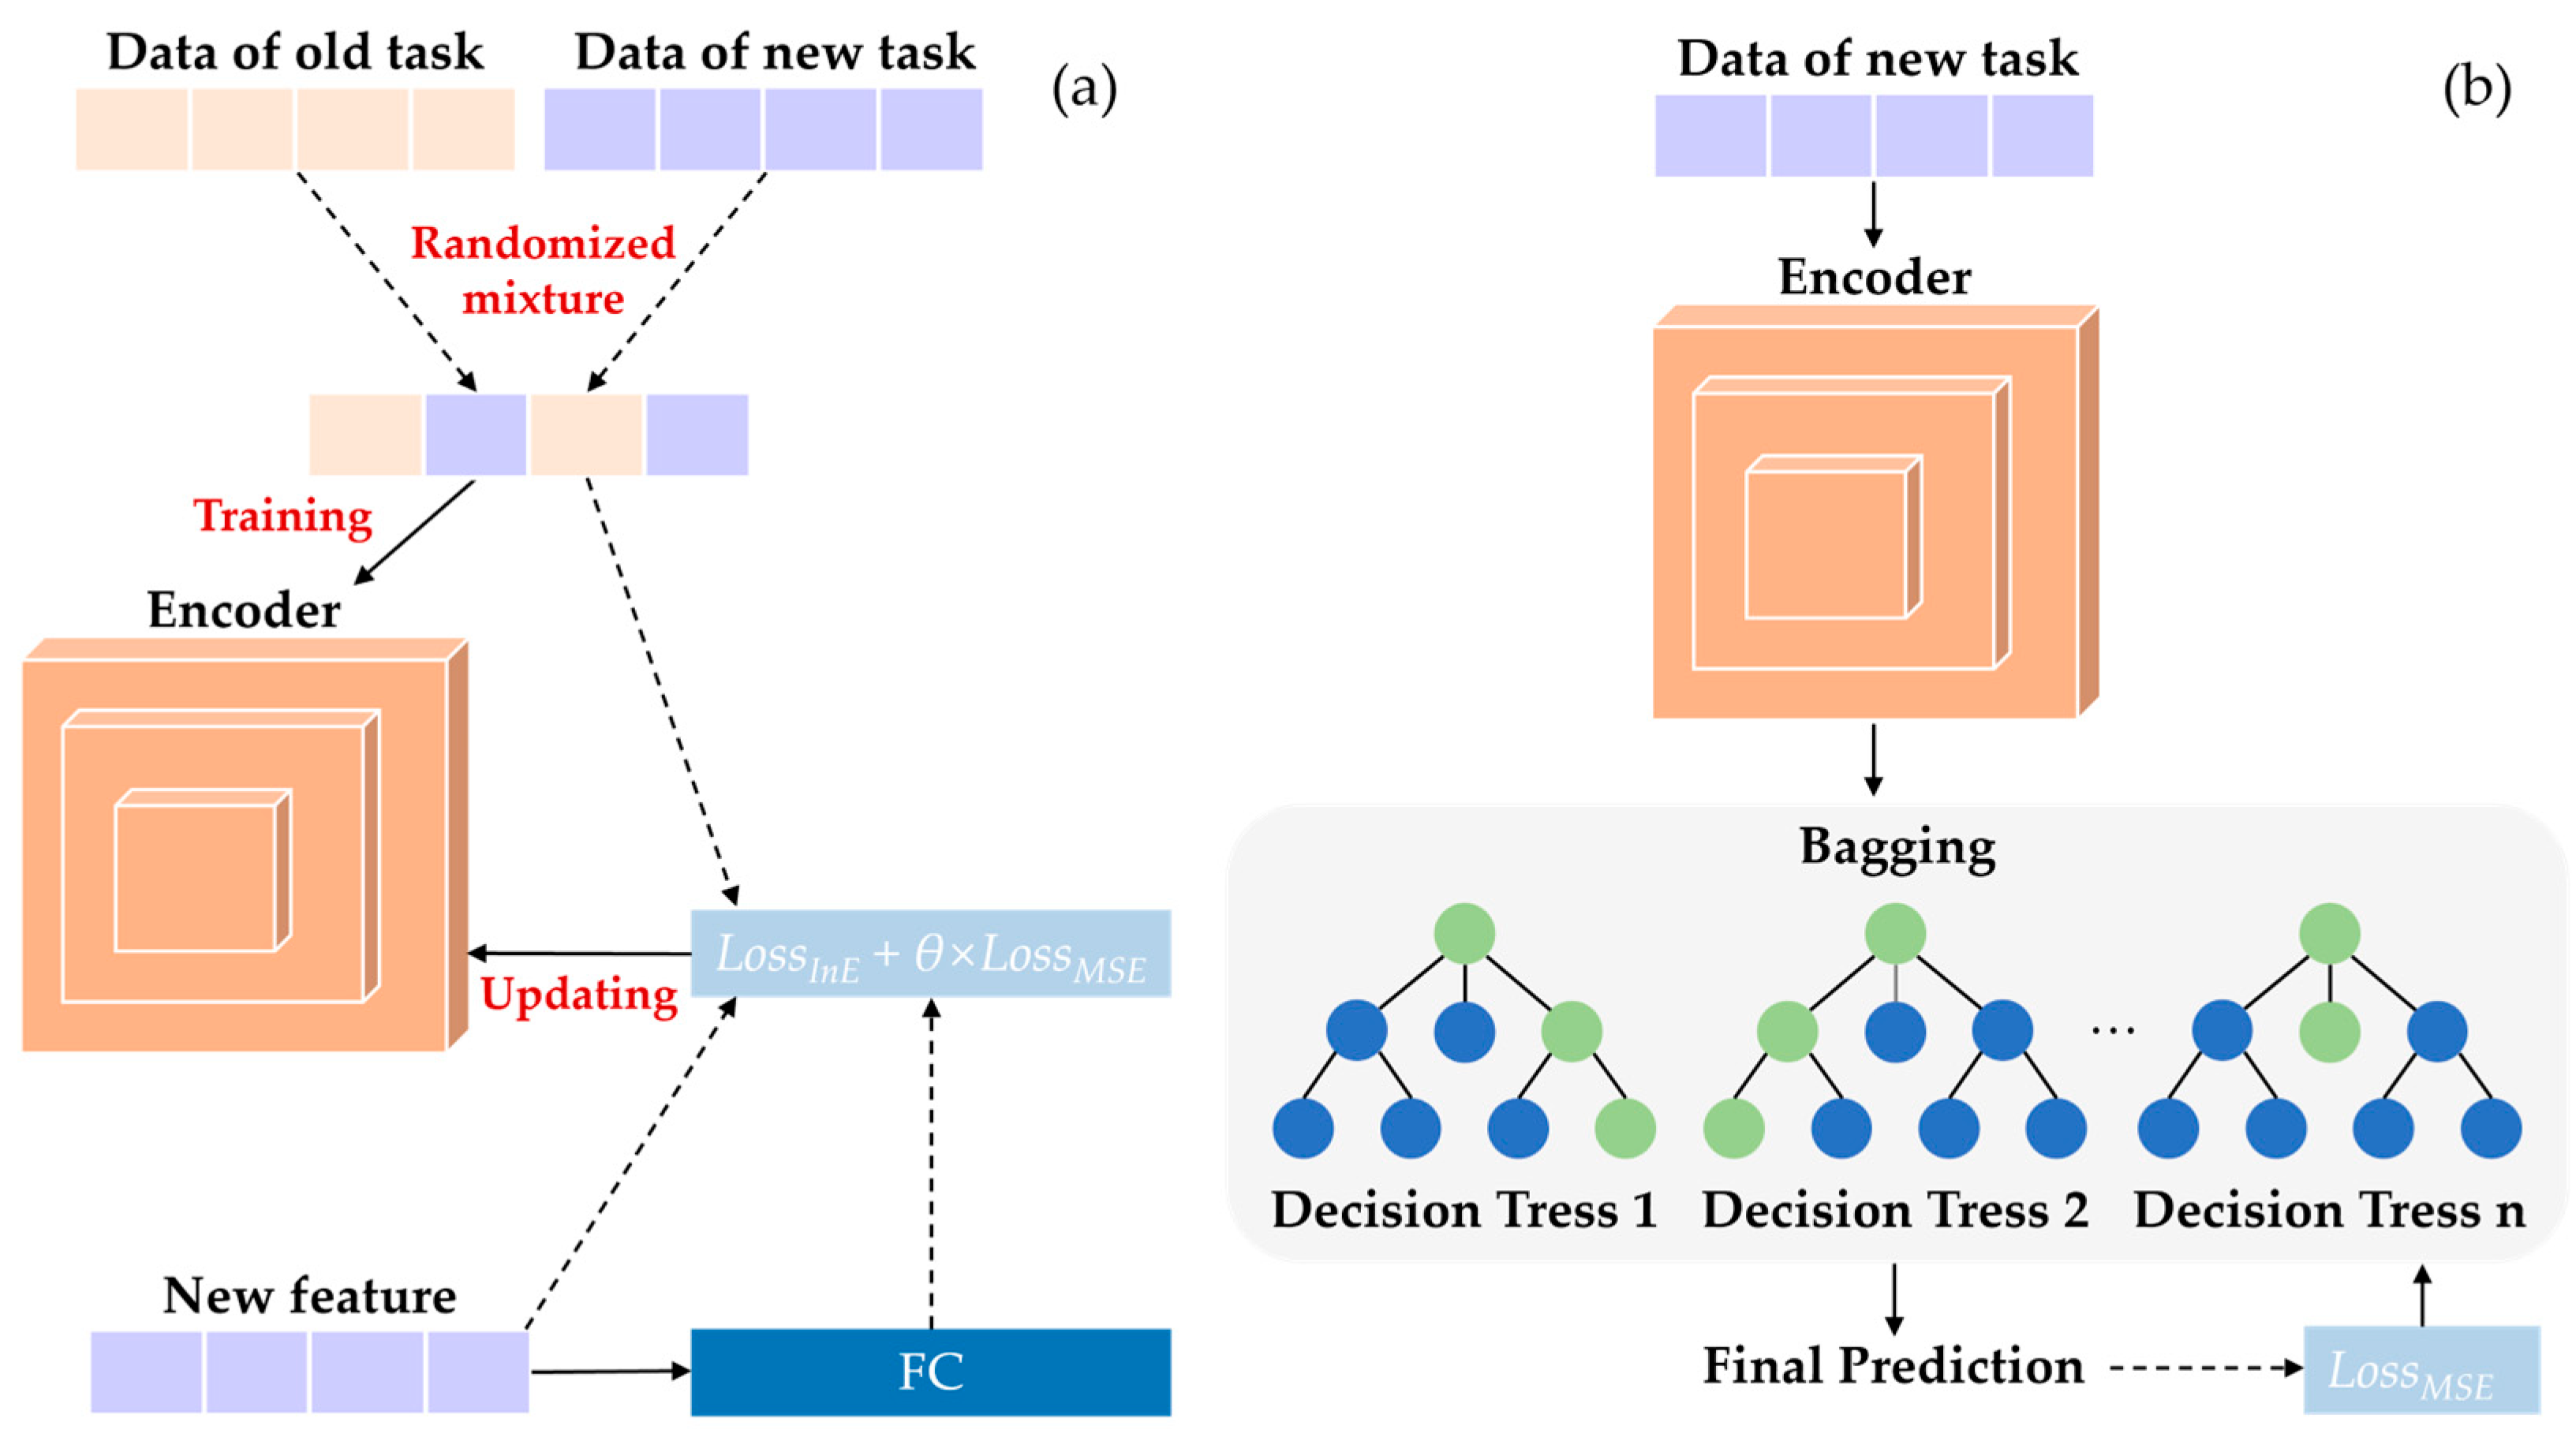
Figure 5.
Experiment setup for multi-jet polishing. (a) The ZEEKO IRP 200 polishing equipment, (b) the polishing setting, (c) the 4-jet nozzle, (d) the 7-jet nozzle, (e) the 316L stainless steel workpiece, and (f) the CoCr workpiece.
Figure 5.
Experiment setup for multi-jet polishing. (a) The ZEEKO IRP 200 polishing equipment, (b) the polishing setting, (c) the 4-jet nozzle, (d) the 7-jet nozzle, (e) the 316L stainless steel workpiece, and (f) the CoCr workpiece.
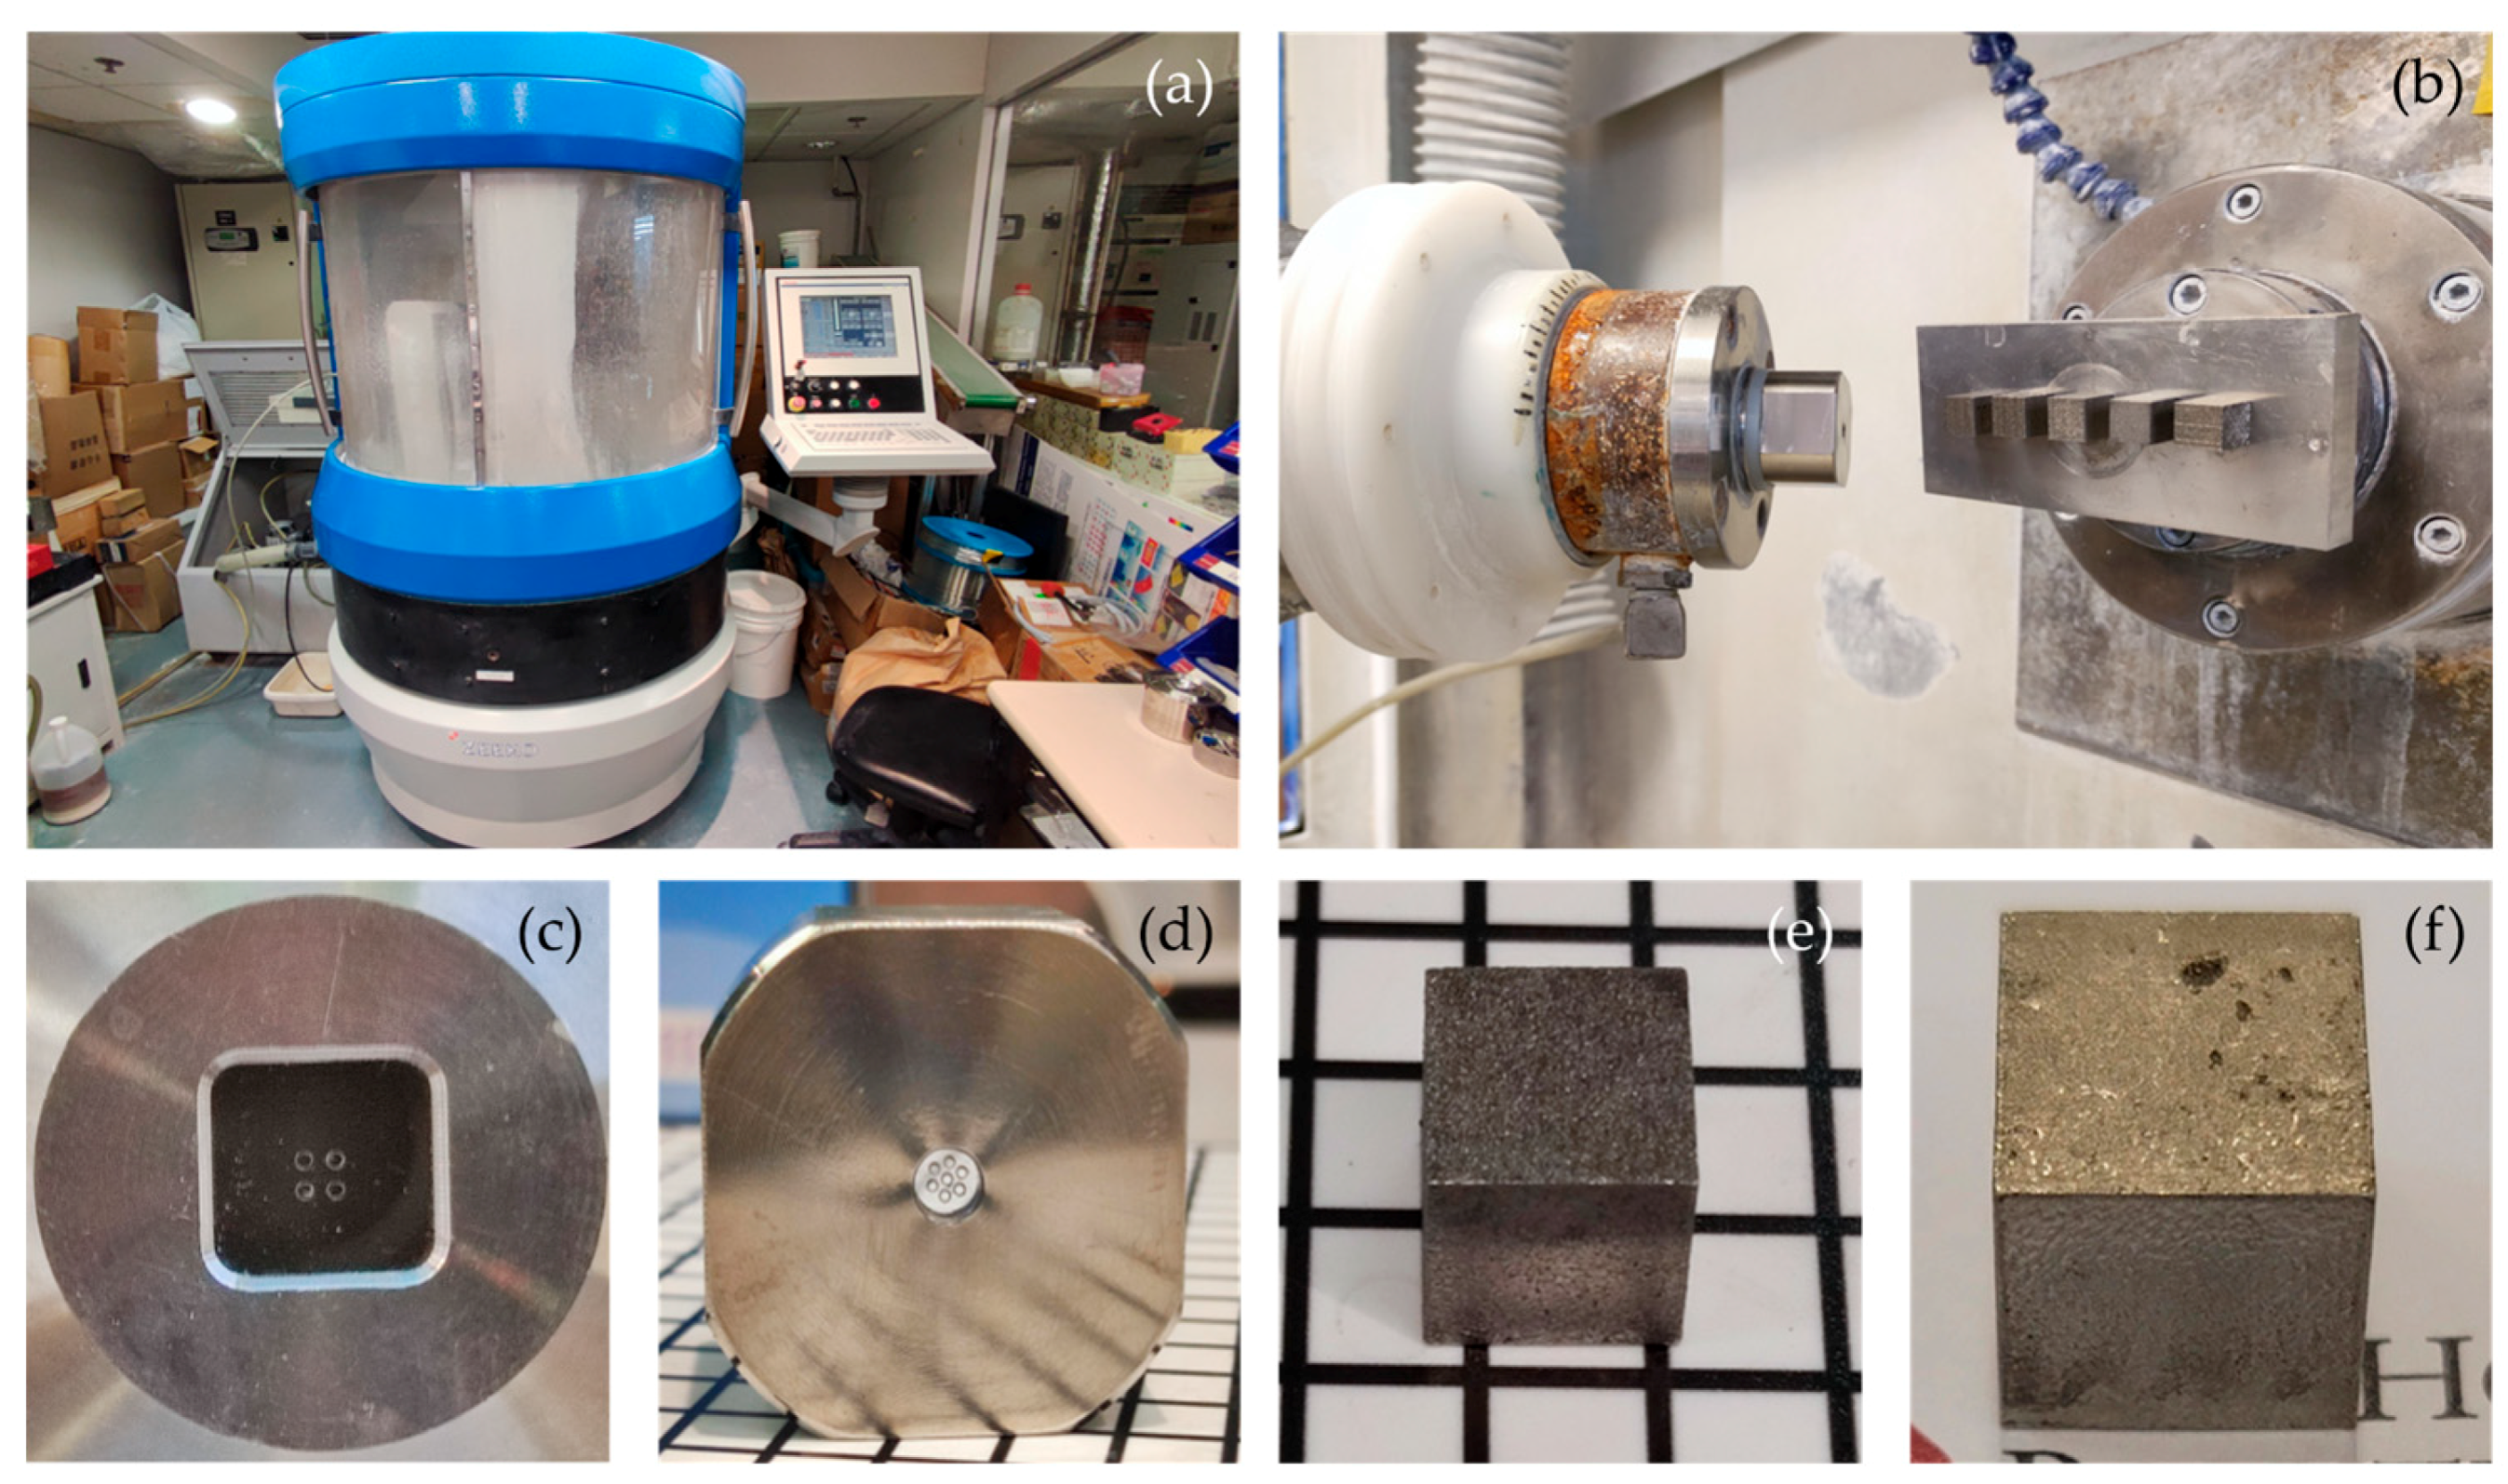
Figure 6.
Scanning electron microscope images of the 316L workpiece before and after multi-jet polishing. (a) The top surface and (b) side surface of workpiece before polishing, respectively. (c) The top surface and (d) side surface of workpiece after polishing, respectively.
Figure 6.
Scanning electron microscope images of the 316L workpiece before and after multi-jet polishing. (a) The top surface and (b) side surface of workpiece before polishing, respectively. (c) The top surface and (d) side surface of workpiece after polishing, respectively.
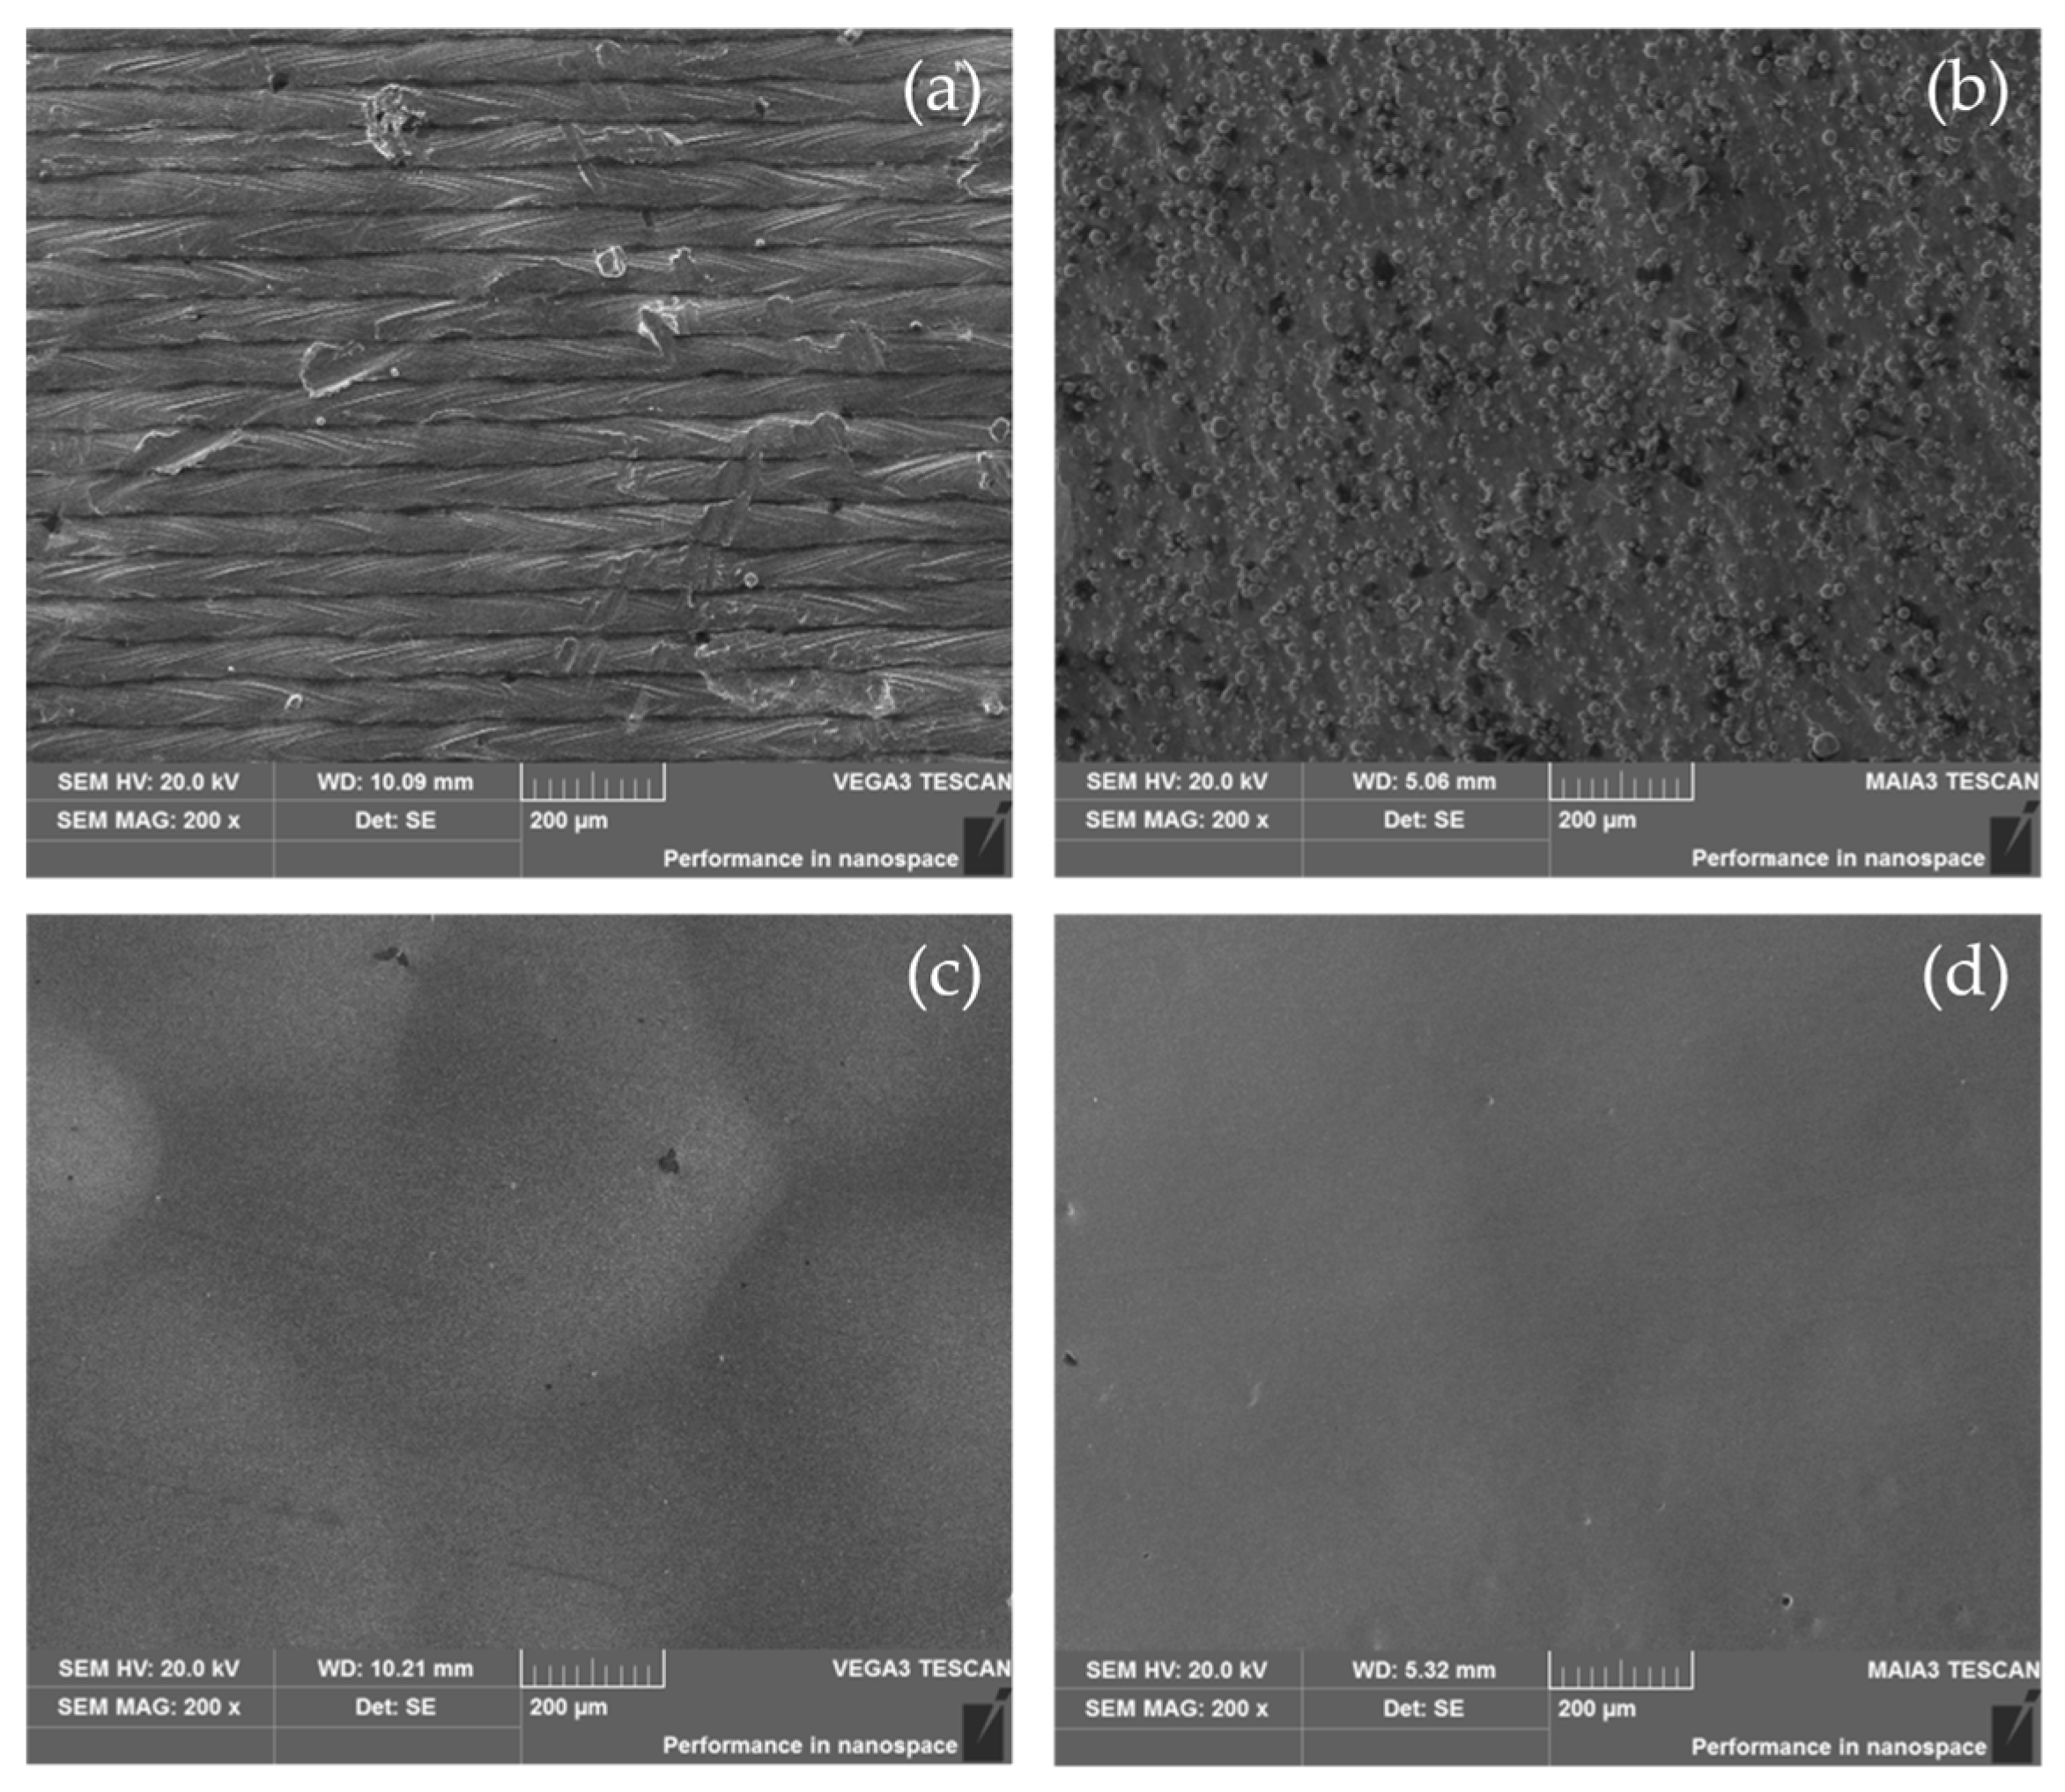
Figure 7.
Comparison of prediction accuracy with SOTA model.
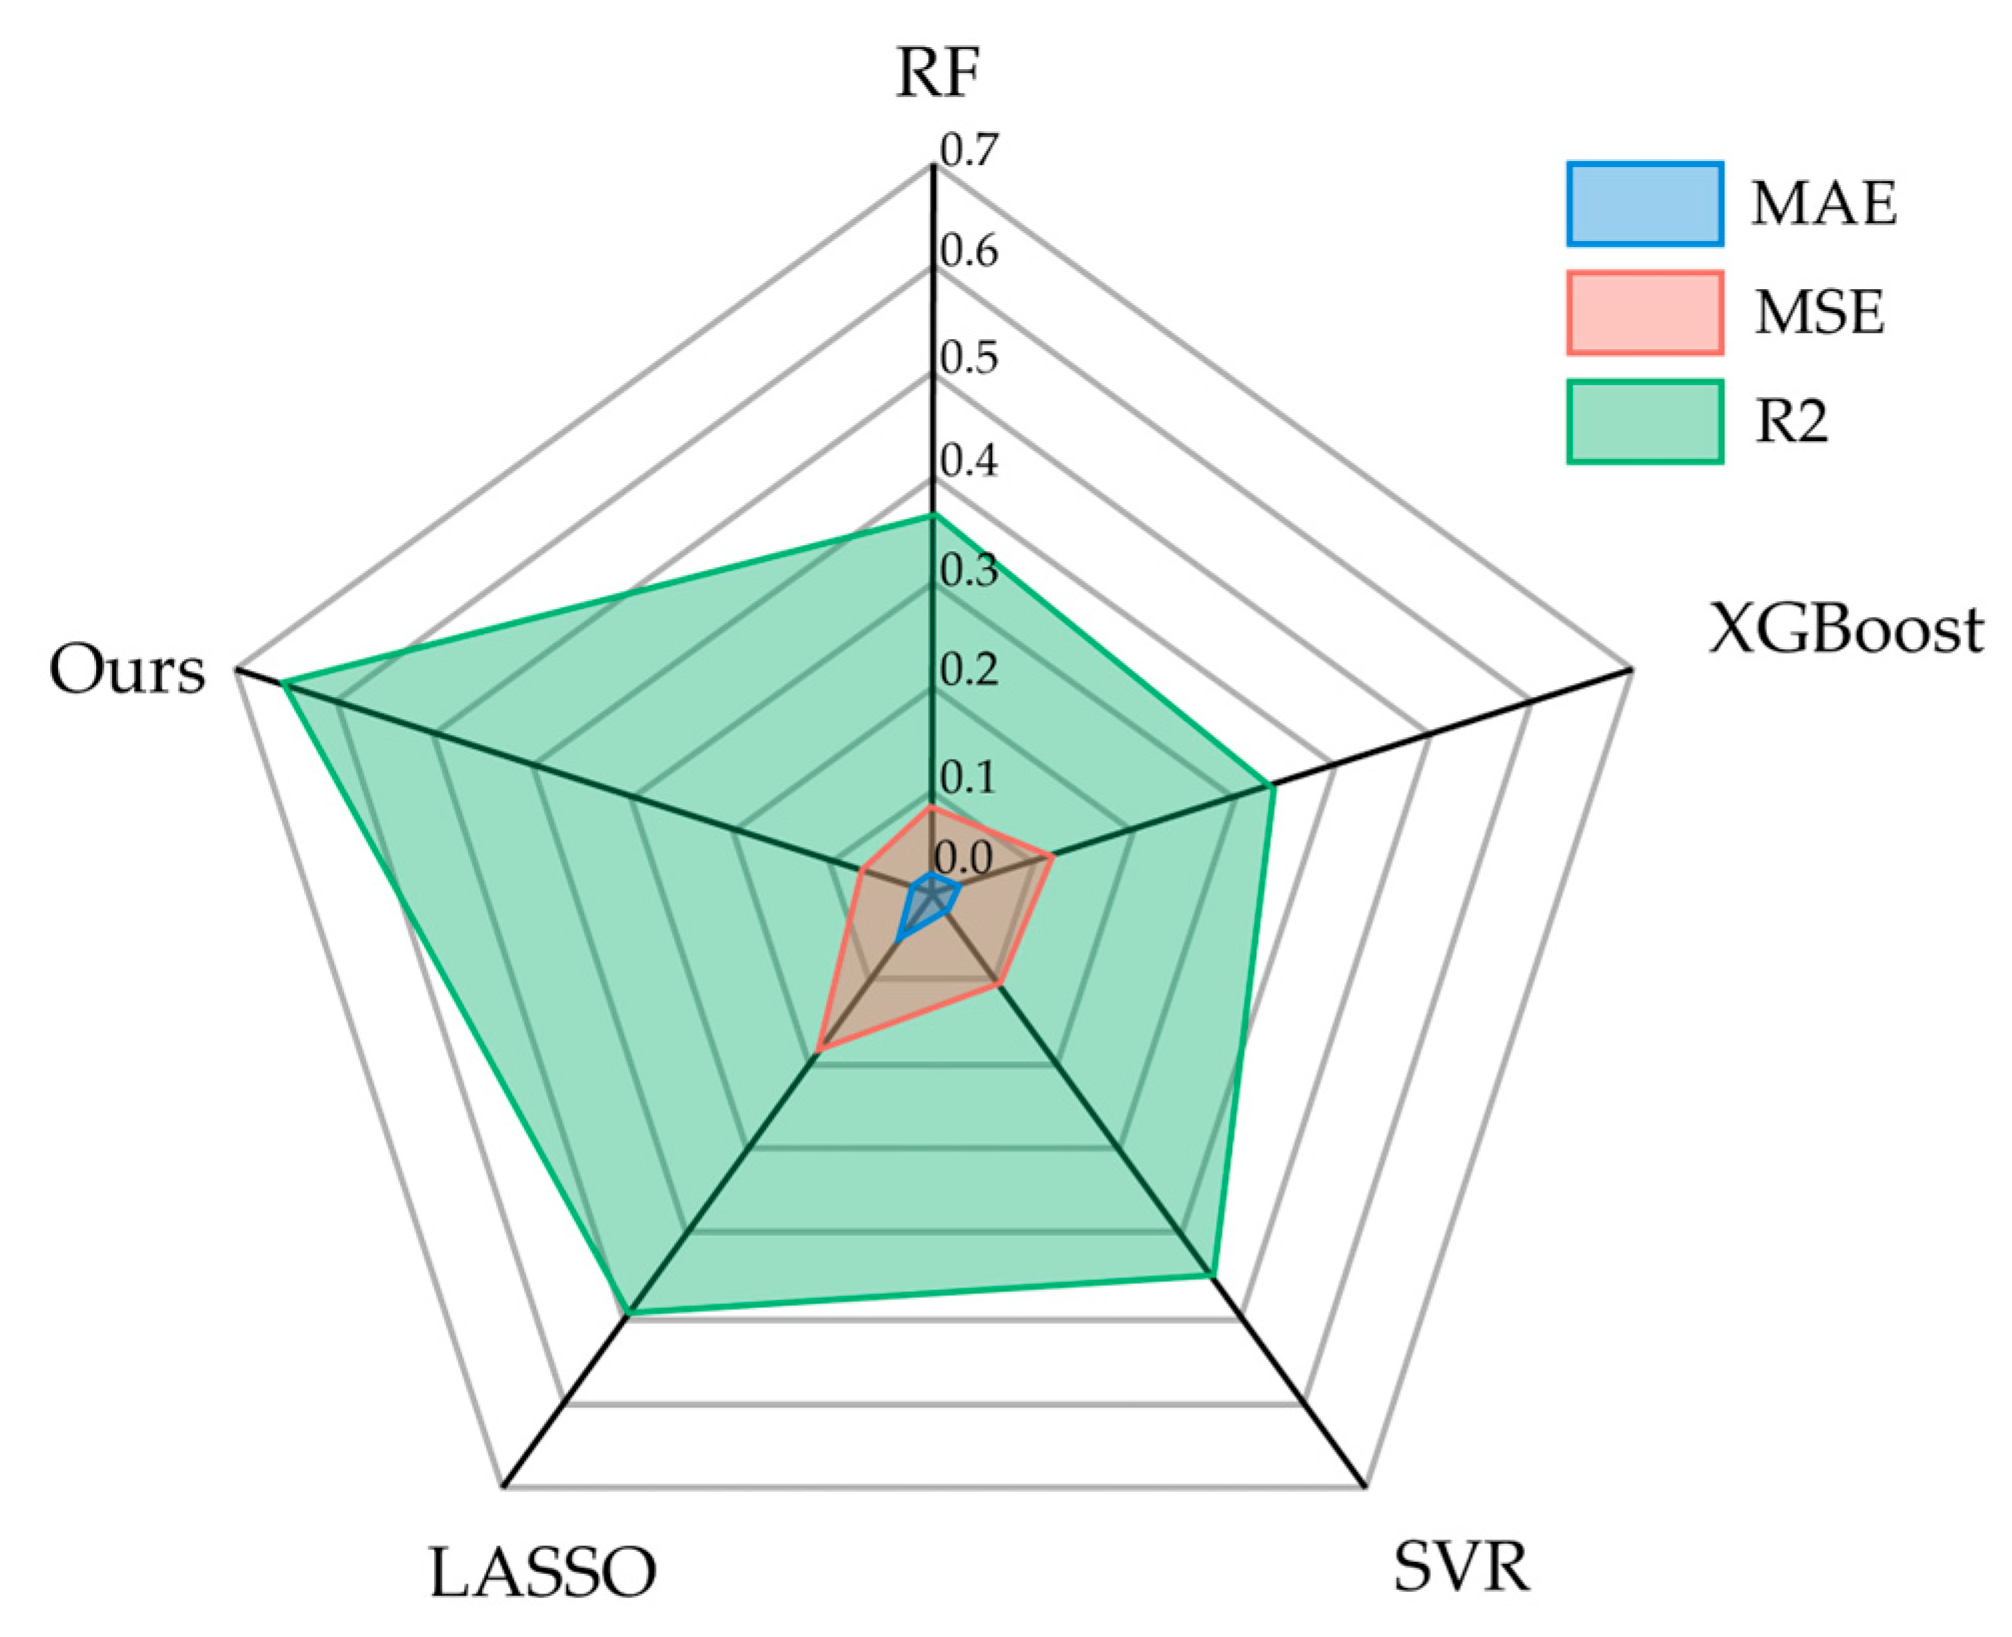
Figure 8.
Results of ablation test. (a) Ours, (b) MSELoss, (c) w/o Transfer, and (d) Min-Max.
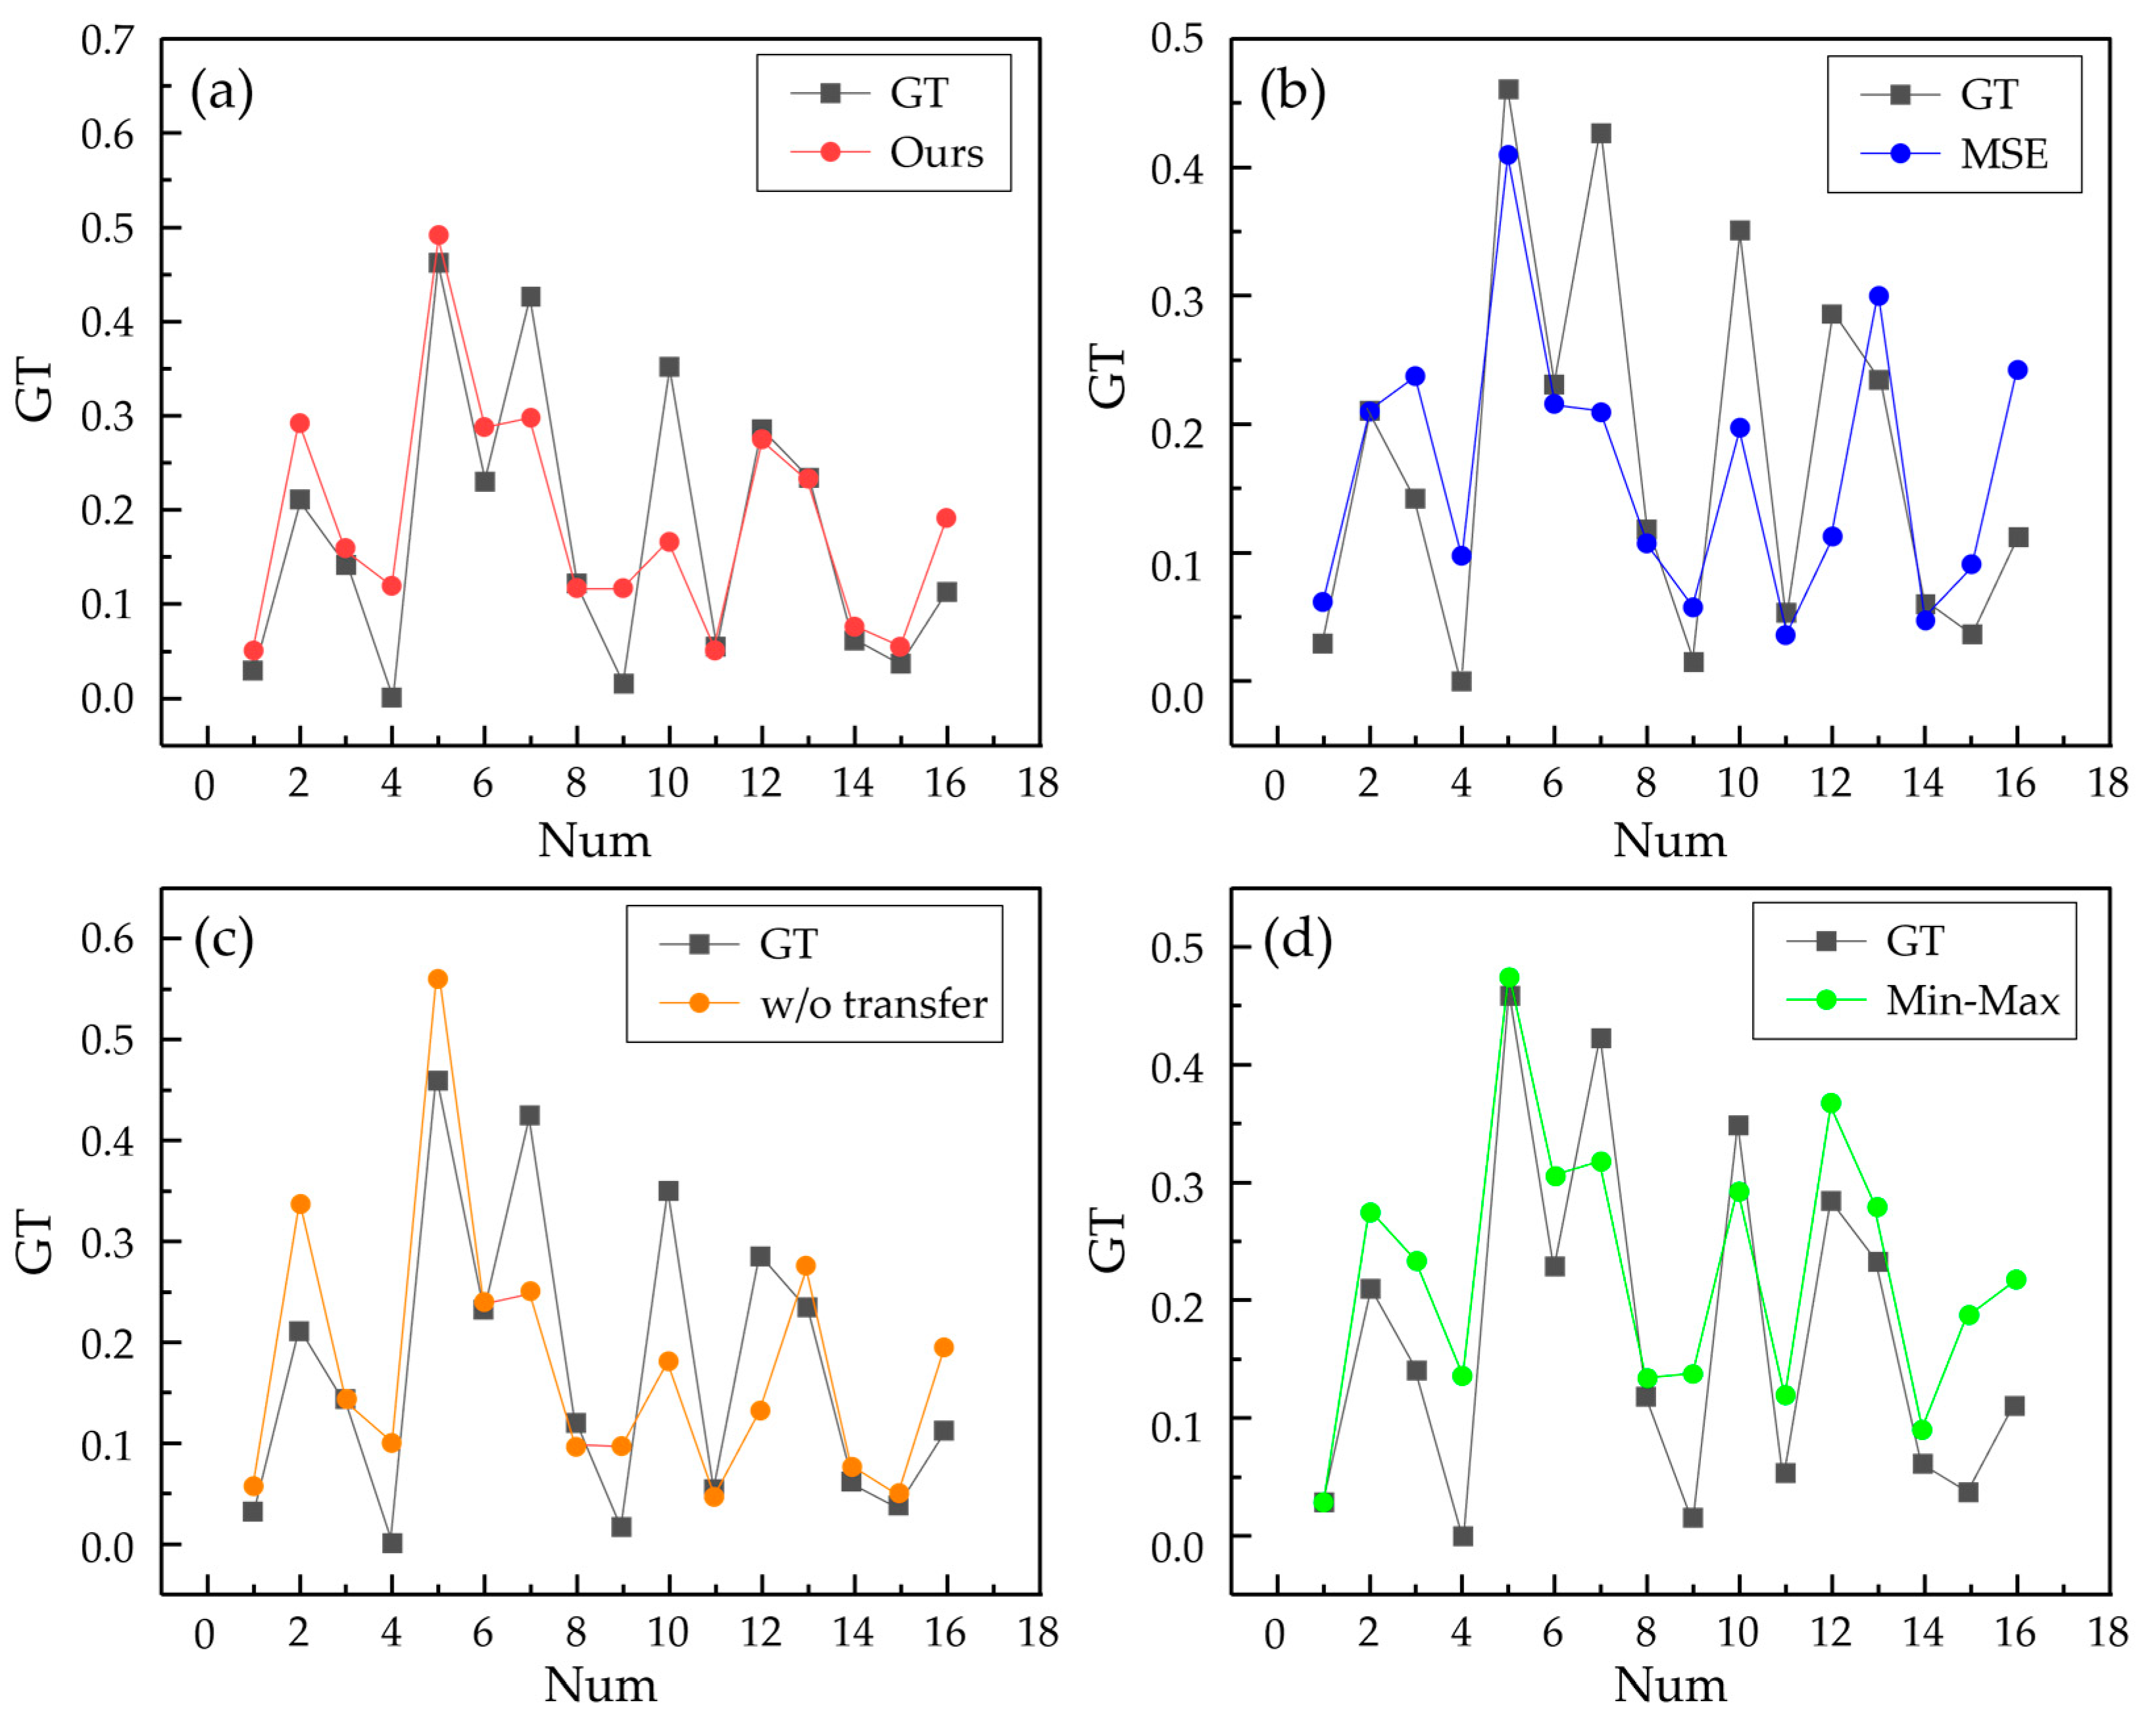

Table 1.
Parameter settings for MJP experiments.
| Parameter | Working condition 1 | Working condition 2 | |
| Injector | 7 | 4 | |
| Material | 316L stainless steel | CoCr | |
| Feed rate size (mm/min) | 10, 15, 20, 25, 30, 40, 60, 80 | 10, 15, 20, 25, 30, 40, 60, 80 | |
| Fluid pressure (bar) | 4, 5, 6, 7, 8, 9, 10 | 4, 5, 6, 7, 8, 9, 10 | |
| Tool offset (mm) | 2.5, 5, 7.5, 10, 12.5, 15 | 2.5, 5, 7.5, 10, 12.5, 15 | |
| Step size (mm) | 0.1, 0.2, 0.3, 0.4, 0.5, 0.6, 0.7, 0.8 | 0.1, 0.2, 0.3, 0.4, 0.5, 0.6, 0.7, 0.8 | |
| Initial surface roughness (nm) | 400~500 | 2000~4200 | |
| Surface direction | TS (Top) | TS (Top) | |
Table 2.
Ablation test.
| Methods | MAE | MSE | R2 |
| Ours | 0.066 | 0.007 | 0.643 |
| Min-Max | 0.073 | 0.007 | 0.616 |
| w/o Transfer | 0.081 | 0.011 | 0.453 |
| MSELoss | 0.076 | 0.007 | 0.622 |
Disclaimer/Publisher’s Note: The statements, opinions and data contained in all publications are solely those of the individual author(s) and contributor(s) and not of MDPI and/or the editor(s). MDPI and/or the editor(s) disclaim responsibility for any injury to people or property resulting from any ideas, methods, instructions or products referred to in the content. |
© 2026 by the authors. Licensee MDPI, Basel, Switzerland. This article is an open access article distributed under the terms and conditions of the Creative Commons Attribution (CC BY) license (http://creativecommons.org/licenses/by/4.0/).
Copyright: This open access article is published under a Creative Commons CC BY 4.0 license, which permit the free download, distribution, and reuse, provided that the author and preprint are cited in any reuse.


