
Submitted:
14 January 2026
Posted:
15 January 2026
You are already at the latest version
Abstract
Axial postural abnormalities in Parkinson’s Disease (PD) are traditionally assessed us-ing clinical rating scales, although picture-based assessment is considered the gold standard. This study evaluates the reliability and clinical relevance of two markerless body-tracking frameworks, the RGB-D-based Microsoft Azure Kinect (MAK) and the RGB-only Google MediaPipe Pose (MP), using a synchronous dual-camera setup. Forty PD patients performed a 60-second static standing task. We compared MAK with three MP models (at different complexity levels) across horizontal, vertical, sagittal, and 3D joint angles. Results show that lower-complexity MP models achieved high congruence with MAK for trunk and shoulder alignment (ρ > 0.75), while the lateral view signifi-cantly improved sagittal tracking (ρ ≥ 0.72). Conversely, the high-complexity model introduced significant skeletal distortions. Clinically, several angular parameters emerged as robust metrics for postural assessment and global motor impairments, while sagittal angles correlated with motor complications. Unexpectedly, a more up-right frontal alignment was associated with greater freezing of gait severity, suggest-ing that static postural metrics may serve as proxies for dynamic gait performance. In addition, both RGB-only and RGB-D frameworks effectively discriminated between postural severity clusters. These findings demonstrate that MP models are a reliable alternative to RGB-D sensors for objective postural assessment in PD, facilitating the widespread application of objective posture measurements in clinical contexts.
Keywords:
markerless human pose estimation
; Parkinson’s disease
; axial symptoms
; postural assessment
; Google MediaPipe
; Microsoft Azure Kinect
; clinical validation
; technical validation
; digital biomarkers
; angular measurements
1. Introduction
Axial Postural Abnormalities (PAs) are common and critical dysfunctions across various pathologies [1,2,3,4]. They frequently lead to balance deficits, instability, and a significantly increased risk of falls, posing a serious threat to patient safety and independence [5]. While early detection of PA onset serves a crucial preventative function, quantifying changes in existing PAs over time is equally essential for optimizing therapeutic interventions and improving patient quality of life [6].
This need for objective quantification is particularly relevant in Parkinson’s Disease (PD), in which axial PA are highly prevalent, ranging from frequent subtle flexed postures of the trunk and lower limbs to severe deformities such as camptocormia, antecollis, or Pisa syndrome, which affect over 20% of patients [7]. In fact, subtle medio-lateral or antero-posterior flexion is present even in early phases, requiring continuous compensatory actions for postural control [8]. In addition to altered postural alignment, many patients with PD exhibit postural instability, which manifests as increased body sway during quiet standing and reduced stability during voluntary or externally perturbed movements. This instability reflects the progressive involvement of axial motor control mechanisms and may be further influenced by disease-related factors, the presence of dyskinesias, or fluctuations related to dopaminergic therapy [9].
The current assessment of PA severity predominantly relies on subjective clinical rating scales or analogue measuring tools (e.g., goniometers), often lacking precision and inter-rater reliability [10,11,12,13]. While marker-based Motion Capture (MoCap) systems represent the gold standard for accurate, objective measurement, their high cost, time-consuming setup, and spatial requirements severely limit their adoption in routine, long-term monitoring in clinical or home settings. This has driven the demand for non-invasive, cost-effective technological solutions that provide easy-to-use, quantitative, and repeatable measurements.
Early technological efforts favored wearables for motion analysis, particularly for quantifying postural instability [14,15,16,17,18]. However, wearables face several limitations for comprehensive postural assessment, particularly in older patients and in subjects limited by motor impairment: the need for numerous sensors for multi-segmental analysis, complex calibration and synchronization, and inherent patient discomfort. This has led to the emergence of non-invasive video analysis using body-tracking algorithms. The field evolved from marker-assisted RGB systems, based on pure computer vision techniques, to more sophisticated RGB-Depth (RGB-D) cameras (e.g., Microsoft Kinect), which provide 3D skeletal tracking via depth mapping [19,20,21,22,23,24]. Unfortunately, these specialized RGB-D sensors are plagued by short product lifecycles and planned obsolescence, hindering the long-term viability and large-scale adoption of the applications they enable. This emphasizes the need to transition away from specialized depth-sensing hardware toward more readily available, inexpensive, and stable RGB-only devices (e.g., standard cameras). Moving away from specific, short-lived depth sensors toward simpler, less expensive, and readily available RGB-only devices would significantly prolong the lifespan of developed applications, favoring broader adoption in daily life.
Recent innovative and high-performing Deep Learning (DL) Human Pose Estimation (HPE) frameworks are providing new momentum for RGB-only video analysis [25,26,27]. Leveraging the advantages of non-invasive video analysis, systems such as the Google MediaPipe [28] and OpenPose [29] frameworks have gained significant traction. While many applications primarily rely on estimating 2D pixel-based coordinates for tasks such as real-time Human Activity Recognition (HAR) [30], the underlying models can also extend these estimates to 3D [31] and have shown emerging utility in the analysis of movement disorders [32].
In the specific context of postural assessment, several studies have started applying HPE models. In [33], the authors used a computer vision approach on static dorsal RGB images of PD subjects to semi-automatically identify bone points for posture evaluation, showing promising classification results but highlighting sensitivity to camera-subject distance. The authors in [34] utilized key points automatically extracted by the OpenPose framework on static images to identify points of interest for post-processing algorithms, though their evaluation remained susceptible to camera positioning and rotation. The authors in [35] used the 2D pixel-based MP model to analyze postural characteristics of young adults from static images (frontal, dorsal, and lateral views) and quantify differences in angular and linear (pixel-distance) measurements between sexes. However, world-space (3D) coordinates are seldom used in these contexts; furthermore, MP’s 3D models tend to exhibit reconstruction problems under highly dynamic conditions [36].
Based on current literature, no studies appear to directly utilize the 3D models provided by Google MediaPipe for a comprehensive evaluation of postural abnormalities in PD.
To cover this gap, the primary objective of this study is to investigate the potential and limitations of the 3D skeletal models obtained from Google MediaPipe Pose (MP) RGB-only framework in quantifying axial postural alterations in subjects with PD by directly comparing their performance against the robust 3D body tracking algorithm of Microsoft Azure Kinect (MAK). We utilized a synchronized dual-camera setup (frontal and lateral views) to capture a prolonged standing task of 40 PD patients. The choice of a 60-second task, instead of single-image analysis, allows for the detection of variations in postural alignment and balance over time during the steady task [37]. Furthermore, using MAK cameras with MKV storage capability allows us to robustly extract both the Azure Kinect body-tracking model and the Google MediaPipe Pose models (using only the RGB stream) from the same synchronized video recordings, facilitating direct, comparative validation.
The study introduces several innovative elements in the field of digital PD monitoring. First, we implement a synchronous multi-view architecture (main-frontal and sub-lateral) to overcome the inherent depth-estimation limitations of RGB-only frameworks, enabling the acquisition of angular measurements that would otherwise be inaccurate from a frontal perspective. Second, we provide a granular evaluation of MP 3D models, investigating whether increased computational complexity translates into higher measurement accuracy than RGB-D tracking. From a clinical perspective, we investigate whether objective parameters derived from these 3D markerless models effectively reflect the severity of axial PAs observed in PD patients and align with standardized clinical assessments of posture, global motor impairment, and other functional domains [38]. By addressing these questions, this study aims to define the boundaries of RGB-only human pose estimation, enhancing the development of accessible, camera-based clinical assessment tools.
The activities were conducted as part of the OMNIA-PARK project [39], a multicenter study focused on axial symptoms in Parkinson’s disease. The project applied multi-sensor approaches (such as vision systems, surface electromyography, and wearables) combined with artificial intelligence techniques, with the aim of investigating in depth postural abnormalities, gait disorders, speech alterations, and dysphagia [40] to provide a comprehensive assessment of the axial symptom effects.
2. Materials and Methods
2.1. Participants and Clinical Assessment
A total of 40 patients (12 females and 28 males) diagnosed with Parkinson’s Disease (PD) according to the Movement Disorder Society (MDS) clinical diagnostic criteria [41], with a mean age of 68.9 ± 6.3 years, a mean disease duration of 10.4 ± 4.7 years, and treated with dopaminergic therapy (levodopa equivalent daily dose -LEDD-: 912.6 ± 413.0 mg/day, calculated according to established conversion factors [42]) were enrolled in this study. Participants were consecutively recruited from routine outpatient visits by expert neurologists at the Department of Neuroscience “Rita Levi Montalcini” of the University of Turin and at the Movement Disorders outpatient clinic of “Sapienza” University of Rome, following the same recruitment protocol and standardized inclusion/ exclusion criteria. Inclusion was restricted to PD patients with moderate-to-advanced disease, defined as a Hoehn & Yahr (H&Y) score in the 2.5 – 4 range [43]. Exclusion criteria included: neurological signs suggestive of atypical or secondary Parkinsonism; cognitive impairment defined as a Montreal Cognitive Assessment (MoCA) score ≤ 21 [44]; inability to provide informed consent; orthopedic, rheumatologic, other neurological conditions, and/or previous surgeries significantly affecting gait or balance. The study was conducted in accordance with the Declaration of Helsinki and received ethical approval from the institutional review board (“Comitato Etico Territoriale (CET) interaziendale AOU Città della Salute e della Scienza di Torino”, Protocol 0080563 No. 512/2023, approved on June 17, 2024). All participants provided written informed consent prior to enrollment.
About 7 days before the instrumental analysis, all participants underwent a comprehensive clinical evaluation to characterize motor, cognitive, and quality-of-life domains. This assessment included: the MDS Unified Parkinson’s Disease Rating Scale (MDS-UPDRS) [45], the MoCA test, the Berg Balance Scale (BBS) [46], the Unified Dyskinesia Rating Scale (UDysRS) [47], New Freezing of Gait Questionnaire (NFOG) [48], the Parkinson’s Disease Fatigue Scale (PFS-16) [49], the King’s Parkinson’s Pain Scale (KING) [50], and the Parkinson’s Disease Questionnaire (PDQ-8) [51]. Following the clinical assessment, participants attended an instrumental acquisition session involving various motor and non-motor tasks. All clinical evaluations and instrumental acquisitions were performed while patients were on their usual dopaminergic therapy (ON state), to reflect real-life clinical conditions and ensure patient safety and compliance during tasks. The Motion Analysis laboratories of the PolitoBIOMed Lab (Politecnico di Torino, Turin, Italy) and of the Sapienza University (Rome, Italy) hosted all the experimental sessions. The present study specifically focuses on static postural performance, consisting of two 60-second standing tasks: one with eyes open and one with eyes closed. To facilitate multi-view (and multi-sensor) data synchronization for subsequent analysis, participants were instructed to perform a single raising movement with the left arm immediately after recording began: this movement serves to temporally align the collected data for postural analysis.
2.2. Postural Data Acquisition System
Instrumental postural analysis was conducted using two distinct markerless human pose estimation (HPE) systems: the Google MediaPipe Pose (MP) framework (v0.10.21) and the Microsoft Azure Kinect (MAK) skeletal tracking system (Azure Kinect Body Tracking SDK v1.1.0). This dual-system approach was designed to evaluate the consistency and reliability of an RGB-only approach (MP) compared to an RGB-D depth-based solution (MAK) in quantifying PD-specific axial PAs.
A dual-camera setup featuring two MAK devices (Microsoft Inc., Redmond, WA, United States) [52] was developed for this study. To ensure temporal synchronization, the devices were connected in a daisy-chain configuration via a 3.5-mm audio cable using the dedicated sync in and sync out ports (on the back of each device). In this configuration, one camera operated as the Main and the other as the Sub, with the Sub’s recording triggered exclusively by the Main’s synchronization signal.
Both cameras were interfaced with a single mini-PC (ZOTAC©, Zotac, Fo Tan, New Territories, Hong Kong, China; processor: 2.4 GHz quad-core 9th generation, graphics card: NVIDIA GeForce RTX 2060 6 GB, RAM: 16 GB) via high-speed data cables (lengths: 2.5m for Main, 5 m for Sub). The devices were mounted on tripods to ensure stability and powered externally to guarantee high performance. The Main camera was positioned directly in front of the participant, while the Sub camera was placed laterally (approximately 2.5 m) to enable simultaneous, synchronous dual-view recording of the postural tasks. The acquisition setup scheme is illustrated in Figure 1.
The recording procedure was managed through a custom-built Unity-based user interface that executed separate batch files for each device according to multi-device synchronization specifications [53]. The cameras were configured to capture RGB (1280x720p, Nominal FOV: 90°x59°), Depth (NFOV unbinned), and Infrared (IR) streams at 30 FPS, maintaining an inter-camera delay of less than 10 msec. The raw output from each camera was a single Matroska Video (MKV) file containing the multi-modal streams for the entire duration of the task.
2.3. Human Pose Estimation: from Video to Skeletal Models
The 60-second MKV video recordings were processed using a custom Python script to extract skeletal models from both the Google MediaPipe Pose (MP) and Azure Kinect (MAK) frameworks. An example of skeletal model estimation is shown in Figure 2.
MP is an open-source single-person tracking algorithm that estimates 33 landmarks for a person detected in the camera field of view, using only the RGB stream stored in the MKV file. MP provides frame-by-frame skeletal data in 2D image coordinates and 3D world coordinates. The Python script allows configuration of model complexity (0: lite; 1: full; 2: heavy) and detection and tracking confidences (range 0–1). In this study, the confidence threshold was set to 0.7 to balance false positives (e.g., misidentifying non-human silhouettes) with consistent tracking of partially occluded landmarks. Only the 3D skeletal models were considered in the present study to enable a direct comparison with the MAK. Three distinct MP models were generated by setting the three complexity levels; we named them MP_3D_0, MP_3D_1, and MP_3D_2, respectively. For these models, the 3D world coordinates (X, Y, Z) of each landmark are expressed relative to the model’s origin, located at the hip center.
MAK uses a proprietary multi-person tracking algorithm. It estimates the position of 33 three-dimensional joints to form a skeletal model for each detected person in the camera’s field of view (FOV). Unlike MP, MAK estimation is primarily based on the Depth stream of the MKV file. The resulting 3D world coordinates (X, Y, and Z) for each joint are expressed in an absolute coordinate system centered on the device. The skeletal model from MAK is designed as KIN_3D.
As shown in Figure 2, the two models exhibit clear differences in the positioning of several key points, necessitating the identification of common points (joints and landmarks) to ensure a fair comparison. Unlike MAK, the MP models are simplified in the upper body, while concentrating many landmarks on the face [54,55].
While the optimal tracking condition requires only the patient to be within the FOV (Figure 2), the varying degrees of motor impairment in the patient group necessitated the presence of at least one supporting operator for patient safety. This introduced multiple individuals in the FOV, and consequently, into the recordings, requiring specific offline procedures to isolate the patient’s skeletal data:
- For MP: As a single-person framework, MP tracks the first viable subject (not necessarily the patient) it detects. To ensure the patient was correctly tracked, a masking procedure was applied to the initial frames of the RGB stream to hide other potential confounding individuals, forcing the algorithm to initialize tracking on the patient. Once initialized, the MP tracker maintained the focus on the patient (not the operators) for the remainder of the task.
- For MAK: A custom MATLAB (MathWorks, Inc., Natick, MA, USA) procedure was developed to disambiguate the patient from the operators. The procedure used spatial filtering, prioritizing the subject positioned most centrally and closest to the camera (the patient), ultimately discarding all other, more lateral and farther-away detected skeletons (the operators).
The final output of this phase consists of MAT files, one for MAK and three for the MP variants, directly usable for the subsequent analysis.
2.4. Trajectories Preprocessing
The 3D trajectories of all skeletal points (joints for MAK and landmarks for MP) were processed and analyzed using custom-developed MATLAB scripts (version 2024b). A standardized preprocessing pipeline was applied to the raw 3D data (i.e., trajectories) from both views and across all skeletal models (KIN_3D, MP_3D_0, MP_3D_1, and MP_3D_2). The preprocessing procedure consists of the following sequential steps:
- Resampling: All data were resampled at 50 Hz to remove timestamp jitters, ensure a uniform temporal baseline, and increase the sample density.
- Median filtering: A 10-sample median filter was applied to each trajectory component (X, Y, and Z) to remove sporadic spikes or outliers.
- Low-pass filtering: High-frequency noise was mitigated using a low-pass Butterworth filter (4th-order, 5 Hz cut-off frequency), ensuring that the resulting signals retained only the frequencies relevant to static postural analysis.
Subsequently, the preprocessed trajectory of the left wrist was used to identify a stable 40-second window for the postural analysis. The temporal window was defined starting from TI (3 seconds after the peak of left wrist raising) to TF (40 seconds after TI). This window selection was designed to isolate the period of maximum postural stability, minimizing potential artifacts from incidental body movements or adjustments typically occurring at the beginning and end of the recording session. All joint and landmark trajectories were trimmed to this specific 40-second window for the estimation of postural parameters.
2.5. Estimation of Postural Parameters
The postural analysis was restricted to body points (joints and landmarks) common to all models (MAK and MP): the head, shoulders, hips, knees, and ankles. Since the MP framework does not estimate a dedicated landmark for the head center, the Nose landmark was utilized as the reference point for head position in all corresponding MP angular measurements. A custom MATLAB script was developed to estimate postural parameters from the preprocessed 3D trajectories, enabling a comprehensive assessment of posture through four groups of angular measurements.
Horizontal parameters (frontal plane, Main view) evaluate the alignment of bilateral joints relative to the horizontal line. They were computed as the angle between the segment connecting bilateral body points and the X-axis in the frontal plane (XY), excluding the Z component. This group includes the horizontal alignment of the shoulders (HM_SHOULD), hips (HM_HIP), knees (HM_KNEE), and ankles (HM_ANKLE).
Vertical parameters (frontal plane, Main view) evaluate the lateral body bending by computing the angle between a body segment and the Y-axis (vertical) in the frontal plane (XY), excluding the Z component. This group includes the alignment of the upper trunk (VM_TRUNK, defined between the shoulder and hip centroids), the head (VM_HEAD, between the head and the shoulder centroid), and the lower body (VM_ANKLE, between the hip and ankle centroids).
Sagittal parameters (Main and Sub views) evaluate the antero-posterior (forward-backward) lean of body segments by computing the angle between a body segment and the Z-axis in the sagittal plane (YZ), excluding the X component for Main, and the angle between a body segment and the X-axis in the frontal plane (XY) for Sub. For the frontal view (Main camera), this group includes the bending for the upper trunk (ZM_TRUNK, segment between shoulder and hip centroids), head (ZM_HEAD, segment between head and shoulder centroid), knee (ZM_KNEE, segment between hip and knee centroids), and ankle (ZM_ANKLE, segment between knee and ankle centroids). For the lateral view (Sub camera), the same angles are computed using only the left-side joints, which were the most visible and consistently tracked from the lateral perspective. Specifically, angles for the upper trunk (ZS_TRUNK, segment between left shoulder and left hip), head (ZS_HEAD, segment between head and left shoulder), knee (ZS_KNEE, segment between left hip and left knee), and ankle (ZS_ANKLE, segment between left knee and left ankle) were estimated.
Joint 3D angles (Main and Sub views) evaluate joint-specific 3D angles. For the frontal view, angles were computed separately for both left (L) and right (R) sides to detect potential asymmetries in the shoulders (LM_SHOULD and RM_SHOULD), hips (LM_HIP and RM_HIP), and knees (LM_KNEE and RM_KNEE). For the lateral view, angles for the elbow (LS_ELB), hip (LS_HIP), and knee (LS_KNEE) were estimated for the left body side.
Figure 3 illustrates the estimated angles for frontal and lateral views.
In addition, segment lengths (Main view) were computed to measure the length of key body segments. In particular, the shoulder width (WM_SHOULD) and hip width (WM_HIP) were computed to highlight differences across MAK and MP models in crucial body points involved in angular measurement.
Angular measures between two segments (vectors v1 and v2) were computed using Equation (1):
Segment lengths were calculated as the Euclidean distance between two 3D points (P1 and P2), as shown in Equation (2).
Finally, a Symmetry Index (SI) was computed to assess differences between the left (L) and right I sides of the body using Equation (3).
2.6. Statistical Analysis
The KIN_3D and MP 3D models were initially compared by calculating mean and standard deviation (SD) for all estimated angles to summarize the central tendency of postural alignment and instability across the cohort. To assess the statistical significance of differences in angular measurements between the three MP variants and the KIN_3D model, the Wilcoxon Signed-Rank Test was used. This non-parametric choice was selected due to the paired nature of the data and to ensure robustness against potential non-normality in the differences between measurements, as suggested by the Shapiro-Wilk normality test [56].
The statistical relationship and consistency between models were evaluated using Pearson’s correlation coefficient; this choice is particularly suited to assessing the proportionality between instrumental systems across continuous measurements. This analysis was conducted at two levels: inter-model agreement, evaluating the relationship between each MP variant and the reference KIN_3D model; and intra-model consistency, assessing the relationship between pairs of MP models to estimate the impact of algorithmic complexity on measurement performance.
For joint angles (Main view only), the Symmetry Index was compared across all models to evaluate postural asymmetries and investigate whether the different tracking algorithms influenced the detection of bilateral discrepancies. Furthermore, Pearson’s correlation was used to assess the clinical validity of the objective parameters by examining the strength and significance of their association with the standardized clinical scales and scores.
A deeper investigation was finally performed based on the clinical assessment of posture (MDS-UPDRS item 3.13): the cohort was divided into two clusters according to the assigned severity score. In addition, the Principal Component Analysis (PCA) was performed to investigate the relationship between postural parameters and clinical severity. Prior to PCA, all variables were standardized using Z-score normalization to ensure equal weighting. The PCA was computed independently for each model (KIN_3D, MP_3D_0, and MP_3D_1) to assess their respective capacities to represent clinical stratification. The first three principal components (PC1, PC2, and PC3) were retained for 3D visualization, and 95% confidence ellipsoids were calculated for each severity group (Cluster 1 vs. Cluster 2). Finally, the feature weights on the first principal component (PC1) were examined to rank the contribution of specific postural angles to the overall variance, providing an objective measure of feature importance for clinical stratification.
All statistical computations and PCA visualizations were performed using MATLAB (version R2024b). Statistical significance for all tests was set at p-value < 0.05.
3. Results
3.1. Angular Measurements Analysis Across 3D Markerless Models
In this section, a comparative analysis of markerless models is conducted to assess the reliability and consistency of angular measurements.
3.1.1. Horizontal Angles (Main View)
Table 1 presents the mean and standard deviation for the horizontal alignment angles obtained from the patient cohort. In addition, the statistical significance of the differences in angular measurements between each MP model and KIN_3D is reported.
The MP_3D_0 and MP_3D_1 models exhibited high congruence with the KIN_3D reference for upper-body alignment (shoulders and hips), as indicated by both mean values and standard deviations, without significant differences. Conversely, a significant discrepancy was observed for lower-body measurements (knees and ankles), which increased with model complexity. Specifically, the MP_3D_2 model introduced substantial errors, particularly in the shoulders (12.19° vs. 4.22° for KIN_3D) and the knees (26.45° vs. 2.81° for KIN_3D), while remaining congruent only in hip alignment. This behavior, indicative of a distorted 3D reconstruction due to erroneous depth estimation, is consistent with previous observations in both dynamic [36] and static conditions in healthy populations [57].
Correlation analysis (Table 2) further supports these findings. For horizontal angles, a significant moderate-to-strong correlation (ρ between 0.57 and 0.72) was found between the lower-complexity MP models (MP_3D_0 and MP_3D_1) and KIN_3D for shoulder and hip alignment. Poor correlation was observed in the lower limbs. The correlation with KIN_3D for knee and ankle measurements was negligible for MP_3D_0 and weak for MP_3D_1. Although the MP_3D_2 maintained a moderately significant correlation for shoulders and hips (ρ ≥ 0.49), the substantial absolute bias in mean angles (Figures S1 of Supplementary Materials) indicates that this model applies a systematic offset across the cohort, rather than failing to capture inter-subject variability, a phenomenon previously noted in healthy subjects [57].
Regarding internal consistency, the three MP variants demonstrated strong reciprocal correlations for hip alignment and moderate correlations for the shoulders. Notably, MP_3D_1 and MP_3D_2 models remained moderately-to-strongly correlated across all angular measures (ρ ≥ 0.61), suggesting they share a common algorithmic foundation for variability estimation, despite the significant reconstruction errors in the highest complexity model (MP_3D_2).
In summary, MP frameworks demonstrate promising reliability and strong correlation with RGB-D (KIN_3D) measurements for the horizontal alignment of the hips and shoulders estimated from a frontal view, except for MP_3D_2, which shows a high systematic bias. Reliability significantly degrades for the lower limbs (knees and ankles). Consequently, the use of MP models for horizontal alignment is comparable to RGB-D sensors only for upper-body assessment and should be restricted to complexities 0 and 1.
3.1.2. Vertical Angles (Main View)
Table 3 presents the mean and standard deviation values for the vertical (lateral flexion) angles obtained from the reference sample. In addition, the statistical significance of the differences in angular measurements between each MP model and KIN_3D is reported.
All three MP models exhibited high congruence with the KIN_3D reference in measuring lateral body flexion. A slight discrepancy was noted in the mean VM_HEAD angle (alignment of the head relative to the shoulder center) for lower complexities (MP_3D_0 and MP_3D_1), which appeared to converge toward the reference value in the MP_3D_2 model. The high absolute mean head angle is consistent with the clinical profile of the cohort, which includes subjects with Camptocormia and Pisa Syndrome, in which the head assumes an anomalous lateral alignment relative to the shoulder center. Figures in S2 of the Supplementary Materials delve into the observed behavior.
These findings were further supported by Pearson’s correlation analysis (Table 4). The results demonstrated a strong correlation (ρ ≥ 0.79) between all MP models and KIN_3D in measuring lateral trunk flexion (VM_TRUNK). However, the correlation for VM_HEAD was only moderate for MP_3D_0 and MP_3D_1 (ρ < 0.50), reflecting a systematic underestimation bias. Crucially, the MP_3D_2 model achieved the highest correlation (ρ = 0.76) with KIN_3D for the head angle, indicating superior performance for this specific anatomical metric in a pathological context. This result partially contradicts previous observations in healthy subjects [57], where the heavy model showed significant errors. It is likely that the pronounced postural deviation in PD patients (e.g., severe lateral leaning) provides clearer visual features, enabling the more complex MP model to resolve measurement challenges more effectively.
Conversely, the distal lower-body measurement (VM_ANKLE) showed negligible correlations with KIN_3D across all MP models. This lack of correlation likely reflects the restricted range of observed values and the minimal differences in mean and standard deviation compared to KIN_3D. In such cases, even subtle measurement noise or slight discrepancies can affect the correlation coefficient, despite the small absolute error.
3.1.3. Sagittal Angles (Main and Sub Views)
Table 5 presents the mean and standard deviation for the sagittal angles obtained from the reference sample. The statistical significance of the differences in angular measurements between each MP model and KIN_3D is also reported.
In the frontal perspective (Main view), all MP models consistently overestimated the sagittal angles of the trunk and ankles, exhibiting a significant absolute bias (e.g., ZM_TRUNK is around 109.5° for MP vs. 99.9° for KIN_3D). While the knee angle maintained slightly more coherence with the reference model (KIN_3D), a difference of several degrees persisted. This systematic overestimation likely stems from a fundamental divergence in landmark localization (MP) and joint positioning (MAK).
Regarding the head angle (ZM_HEAD), MP measurements were excessively high, with the error significantly exacerbated in MP_3D_2 (mean: 159.4°). This behavior is attributable to the inherent challenge of estimating depth from a single frontal RGB stream. Crucially, this effect was significantly mitigated in the lateral perspective (Sub view), where MP measurements were generally more closely aligned with KIN_3D, although a substantial offset in ZS_HEAD persisted due to differing anatomical reference points (Figure 2), especially between the head joint (MAK) and the head point estimated from face landmarks (MP). It is important to note that, unlike the frontal perspective, angular measurements from the Sub camera were derived only from the left side of the body, which is more visible in the implemented setup. The figures in S3 of the Supplementary Materials delve into the observed behavior.
Pearson’s correlation analysis (Table 6) highlights the superior performance of the lateral perspective compared to the frontal view for antero-posterior assessment. This result strongly supports the advantage of the multi-camera system implemented in this study. Specifically, correlations with KIN_3D markedly improved in the lateral view for the trunk (ρ ≥ 0.87), knee (ρ ≥ 0.72 for MP_3D_0 and MP_3D_1), and ankle (ρ = 0.65 for MP_3D_2). The notable exception was the head angle (ZS_HEAD), which showed a lower correlation than in the frontal view, likely because the Nose landmark is noisier when viewed in profile. Conversely, internal consistency (intra-model correlation) among MP variants showed conflicting results regarding camera positioning. While congruency improved for the trunk and knee angles from the lateral perspective, a significant loss of consistency was observed for the ankles across all models and for the head at higher complexities.
In conclusion, while MP models exhibit systematic absolute bias (e.g., approximately 10° overestimation for ZM_TRUNK), they show moderate-to-strong correlations with KIN_3D in quantifing the severity of trunk flexion from both perspectives. Furthermore, the use of the lateral view (Sub camera) significantly enhanced coherence and correlation for lower-limb angles (ZS_KNEE, ZS_ANKLE), proving advantages for reliable antero-posterior postural analysis.
3.1.4. Joint Angles (Main and Sub Views)
Table 7 presents the mean and standard deviation values for the 3D joint angles obtained from the reference sample. The statistical significance of the differences in angular measurements between each MP model and KIN_3D is also reported.
In the frontal perspective (Main View), all models show congruence in shoulder angle measurements and consistently highlight a clear discrepancy between the right and left sides of the body. This discrepancy is attributable to actual postural asymmetry within the cohort, where several subjects exhibit marked lateral trunk flexion that misaligns the shoulder line. The MP models, particularly MP_3D_0 and MP_3D_1, show high absolute coherence with KIN_3D in capturing this asymmetry, despite a minimal systematic offset. Conversely, the MP_3D_2 model exhibits a substantial asymmetry at the hips, a discrepancy not observed in the other models, which is likely linked to distortions in the 3D skeletal reconstruction, as previously reported for this complexity [57].
Furthermore, all MP models underestimate knee angles by approximately 10° - 12°. This bias, coupled with the poor correlation in the frontal perspective (Table 8), is largely explained by the fundamental difference in the reference-point definitions between KIN_3D (joints) and MP (landmarks) models (Figure 2). This hypothesis is strongly supported by the analysis of segment lengths. Specifically, shoulder and hip widths were measured as 0.31±0.01 m and 0.16±0.01 m for KIN_3D; 0.33±0.01 m and 0.21±0.01 m for MP_3D_0; 0.34±0.01 m and 0.23±0.01 m for MP_3D_1; and 0.33±0.01 m and 0.21±0.01 m for MP_3D_2. This dimensional discrepancy confirms that the angular estimations are derived from different anatomical reference points.
For the lateral perspective (Sub View), the MP_3D_2 model exhibited clear inaccuracies, overestimating the left elbow and hip angles while underestimating the knee angle. In contrast, MP_3D_0 and MP_3D_1 appeared more coherent with KIN_3D. Notably, KIN_3D showed excessive elbow-angle variability (high standard deviation), likely due to the inherent difficulty of the MAK algorithm in stably estimating wrist joint position from a lateral profile. Despite this, Table 8 shows stronger correlations for angles estimated from the lateral perspective, consistent with previous findings and further supporting the utility of a dual-perspective setup. The figures in S4 of the Supplementary Materials delve into the observed behavior.
The ability of the MP frameworks to reflect relevant asymmetry, despite absolute measurement biases, was examined via the Symmetry Index (SI) for bilateral joints (Figure 4).
The SI analysis shows that all models effectively detect shoulder misalignment, as evidenced by lower SI values, though the MP models differ statistically from KIN_3D due to biases in angular measurements. For the hips, all models maintained high symmetry (SI > 0.98), except for MP_3D_2 (SI = 0.94), reinforcing the evidence of reconstruction issues in the high-complexity model. Knee SI values were similar across all models, with a slight reduction for MP_3D_2. These results confirm that MP_3D_0 and MP_3D_1 models can reliably estimate bilateral symmetry, making them suitable for detecting also postural asymmetries in Parkinson’s Disease, whereas MP_3D_2 should be avoided due to significant hip-level distortions.
3.1.5. Summary of Technical Comparison and Selection of Parameters
The technical validation, encompassing horizontal, vertical, sagittal, and 3D joint angles, enabled a robust identification of the most reliable MP models and measurement perspectives for the subsequent clinical validation.
In terms of absolute bias, the lower-complexity models (MP_3D_0 and MP_3D_1) demonstrated the highest coherence with KIN_3D, exhibiting lower systematic offsets and superior preservation of bilateral symmetry. Consequently, MP_3D_0 was identified as a preferred candidate due to its balance of computational efficiency and tracking stability.
Despite the presence of systematic absolute offsets across several metrics, the primary criterion for selecting postural parameters for the clinical correlation phase was their ability to reliably capture inter-subject variability, as confirmed by high, statistically significant Pearson correlation coefficients. In contrast, MP_3D_2 exhibited critical failures, including severe biases and a loss of skeletal symmetry, resulting from an unstable 3D reconstruction from a single view. Therefore, MP_3D_2 was excluded from clinical analysis. The final comparison was restricted to MP_3D_0, MP_3D_1, and KIN_3D to evaluate the respective capabilities of RGB-only versus RGB-D models in characterizing pathological posture.
The following parameters were selected for the next stage of analysis based on their demonstrated technical reliability and correlation strength:
- Horizontal Angles (Main View): HM_SHOULD and HM_HIP
- Vertical Angles (Main View): VM_TRUNK and VM_HEAD
- Sagittal Angles (Main View): ZM_TRUNK and ZM_HEAD
- Sagittal Angles (Sub View): ZS_TRUNK, ZS_HEAD, and ZS_KNEE
- Joint Angles (Main View): LM_HIP and RM_HIP
- Joint Angles (Sub View): LS_ELB, LS_HIP, and LS_KNEE
3.2. Markerless Models and Clinical Assessment
This section evaluates the clinical validity of the selected markerless models by comparing objective measurements with the clinical assessments performed on the reference sample (40 subjects with PD). As previously mentioned, the clinical protocol included multiple validated, standardized scales covering motor symptom severity, balance and gait impairment, motor complications (presence and severity), non-motor symptom severity, and PD-related impairment in activities of daily living. Although several scales are not exclusively focused on posture, they were included in this analysis to explore whether static postural alignment reflects broader motor and functional domains.
The following scores, assigned by a team of neurologists, were categorized by clinical domain (Figure 5):
The final stage of the models’ validation was to assess the clinical relevance of the selected postural parameters by calculating the Pearson correlation coefficients (ρ) between the parameters (from KIN_3D, MP_3D_0, MP_3D_1) and these established clinical scales and scores. Figure 6 illustrates the correlation coefficients for KIN_3D (a), for MP_3D_0 (b), and MP_3D_1 (c), allowing for a direct comparison of the three models. In Figure 6(a), correlations with |ρ| > 0.3 for KIN_3D between angular parameters and clinical scores for KIN_3D are displayed in orange. In Figure 6(b) and 6(c), orange cells indicate correlations shared by both MP_3D_0 and MP_3D_1 models, highlighting the most consistent clinical agreement across all models. Conversely, blue cells indicate correlations with |ρ| > 0.3 unique to the MP models, identifying areas where RGB-only estimation might provide alternative or specific clinical insights.
3.2.1. Motor Impairment and Balance
The correlation analysis between the selected postural metrics and clinical scales evaluating motor impairment (MDS_POS, MDS_GAIT, MDS_LA, MDS-III_TS, H&Y, and NFOG_TS) and balance (MDS_PI, BERG_TS) reveals a distinct hierarchy of predictive capabilities, strongly dependent on the measurement plane and the specific joint under investigation.
For KIN_3D, almost all selected parameters, except for horizontal shoulder and hip alignments, show a significant relationship with the clinical posture assessment (MDS_POS). This demonstrates that both frontal and lateral view parameters successfully capture the complexity of axial PAs in PD. The hip parameters (LM_HIP and RM_HIP) further quantify the observed frontal postural asymmetry. The MP models align closely with this behavior, exhibiting slightly lower but significant correlations in the same direction, thereby confirming their capability to quantify axial PAs from both frontal and lateral perspectives.
The MP models differ significantly from KIN_3D in the lateral view knee angle (LS_KNEE), a joint crucial for comprehensive clinical assessment. Specifically, the knee parameters (LS_KNEE and ZS_KNEE) show a strong inverse correlation with the gait item (MDS_GAIT) for KIN_3D, meaning a more flexed knee angle correlates with greater gait impairment. This clinically relevant relationship is not consistently replicated by the MP models. This finding reinforces the previously noted performance limitations of the RGB-only framework compared to the RGB-D model in accurately reconstructing distal lower-limb parameters.
Conversely, all models show consensus regarding the elbow angle (LS_ELB), which exhibits a consistent inverse correlation with gait (MDS_GAIT), postural instability (MDS_PI), and leg agility (MDS_LA) items.
Considering overall motor impairment (MDS-III_TS), only the LS_ELB parameter shows a consistent inverse correlation across all models: a smaller angle (indicating a more flexed arm) is associated with higher overall severity scores. The same pattern holds true for balance (BERG_TS), where increased elbow flexion appears as a marker of a more significant balance disorder.
Other postural parameters show weak, non-significant correlations with MDS-UPDRS_III_TS and BERG_TS, scales that assess diverse functions not exclusively restricted to static posture. Similarly, correlations with the H&Y stages are weak, indicating that the overall stage of disease progression reflects cumulative disability that is not strictly predicted by static postural alignment alone, but rather by a combination of dynamic and functional factors.
Interestingly, a significant negative correlation was observed across all markerless models between metrics of trunk, shoulders, and hips (VM_TRUNK, HM_SHOULD, HM_HIP) and the severity of freezing of gait (NFOG_TS). The MP models appeared to amplify this relationship in specific parameters (e.g., VM_TRUNK in MP_3D_1: ρ= -0.46). Interpreting this result requires caution, as minor angular values in the horizontal and vertical directions (i.e., apparently better posture) are associated with higher freezing of gait scores. Freezing of gait is a dynamic phenomenon, primarily related to deficits in anticipatory postural adjustments, axial rotation, and gait initiation, rather than to static postural alignment during quiet standing. The observed inverse correlations, therefore, effectively reflect a dissociation between static posture and dynamic locomotor control, rather than a causal relationship.
3.2.2. Motor Complications
Postural metrics demonstrated the strongest clinical relevance in predicting motor complications (MDS-IV_TS) and dyskinesias (UDYS_TS).
The three models were highly consistent in identifying a correlation between a specific subgroup of sagittal parameters derived from the lateral view (ZS_TRUNK, ZS_HEAD, ZS_KNEE) and the overall motor complications scores (MDS-IV_TS), showing comparable correlation strengths across all models.
The sagittal head angle from lateral view (ZS_HEAD) emerged as a consistently sensitive predictor of complication severity. KIN_3D showed a significant negative correlation (ρ = -0.32) with MDS-IV_TS, which was not only replicated but strengthened by the MP models (both MP_3D_0 and MP_3D_1 showed ρ ≥ -0.42). A similarly robust negative correlation was found between ZS_HEAD and UDYS_TS.
At first glance, this inverse relationship may appear counterintuitive, as higher motor complication scores are associated with smaller sagittal deviations (i.e., apparently better head alignment). However, this pattern reflects a well-known clinical dissociation between rigid axial and hyperkinetic phenotypes in advanced PD.
MDS-IV_TS and UDYS_TS capture the global burden of motor complications, encompassing both fixed postural deformities and dynamic dyskinetic movements. In patients with a predominantly rigid-axial phenotype, severe motor complications are frequently accompanied by marked postural abnormalities, possibly also at the neck in the form of antecollis, resulting in a persistent pathological ZS_HEAD angle.
Conversely, patients with severe generalized dyskinesias may exhibit increased trunk and neck variability even during quiet standing. Although their posture is functionally unstable, this variability reduces the mean sagittal deviation measured over a static acquisition, leading to apparently less altered ZS_HEAD values.
Importantly, the angular metrics used in this study quantify the predominant static alignment and do not capture postural variability. As a result, ZS_HEAD preferentially reflects the burden of fixed axial rigidity rather than the amplitude of involuntary movements.
Within this framework, the observed negative correlation indicates that higher complication scores are associated with a shift toward rigid axial involvement, which dominates the static postural signature captured by both RGB-D and RGB-only systems.
Interestingly, the MP models also identified a significant correlation for the trunk flexion parameter (ZS_TRUNK), a relationship not detected by KIN_3D. This suggests that the RGB-only framework may offer unique sensitivity in linking trunk rigidity and flexion to the functional impact of motor complications.
3.2.3. Non-Motor Symptoms
The correlation analysis between postural parameters and clinical scales evaluating Non-Motor Symptoms (NMS) revealed interesting relationships with perceived fatigue (PFS-16_TS).
Unlike the MP models, which showed only weak correlations, the KIN_3D model detected a significant negative correlation between the knee angles ZS_KNEE (ρ = -0.31) and LS_KNEE (ρ = -0.33) and the perceived fatigue scale (PFS-16_TS). This inverse relationship indicates that a more flexed knee (i.e., reduced angular extension) is associated with higher perceived fatigue. This may reflect the increased muscular cost of maintaining a crouched posture, leading to earlier exhaustion and a greater subjective sense of fatigue.
In contrast, the markerless models consistently indicate the absence of significant correlations (|ρ| < 0.30) between almost all postural parameters and the Pain Scale (KING_TS) and MDS-UPDRS Section I (MDS-I_TS). This suggests that static postural alignment, while closely linked to motor complications and specific functional impairments, is not a robust predictor of pain or other non-motor experiences, such as mood or sleep disorders, in this patient cohort.
3.2.4. Activities of Daily Living
In general, the postural parameters demonstrated weak correlation with the assessment of Activities of Daily Living (MDS-II_TS) across both KIN_3D and MP_3D_0 models. Conversely, the MP_3D_1 model exhibited significant correlations with this score for specific parameters, primarily those derived from the frontal (Main) view, such as HM_HIP, ZM_TRUNK, LM_HIP, and RM_HIP. From the lateral (Sub) view, the knee angle (LS_KNEE) was the notable exception, showing a significant correlation across both KIN_3D and MP_3D_1.
The observed correlation between an apparently more upright posture (indicated by smaller HM_HIP and ZM_TRUNK deviations, or higher LM_HIP and RM_HIP extension) and higher MDS-II_TS scores indicating worse ADL performance, which could possibly be related to a different phenotype of patients regarding trunk rigidity, highlights a dissociation between static postural alignment and functional performance in daily life. Patients who appear more aligned during quiet standing may still experience substantial disability due to bradykinesia, rigidity, impaired balance, and difficulty in postural transitions, features that are central to MDS-II but not captured by static posture metrics.
The MP_3D_1 model appears to be more sensitive to this compensated, rigid posture rather than a genuinely functional and flexible one. However, such static alignment does not equate to functional efficiency and may coexist with significant limitations in mobility and autonomy. Overall, these findings reinforce the concept that static postural assessment provides complementary (but not substitutive) information regarding functional disability in PD, and that preserved visual alignment should not be assumed to indicate better performance in activities of daily living.
3.2.5. Relationship with Postural Severity
To evaluate the clinical relevance of the objective measurements, participants were divided into two groups based on the MDS-UPDRS item 3.13 (Posture) score: Cluster 1 (scores 0-1; no or mild alteration) and Cluster 2 (scores 2-4; evident axial PAs). Table 9 summarizes the differences (mean and standard deviations) for these clusters across the validated models.
All models demonstrated a consistent ability to discriminate between the two severity clusters. Although statistically significant differences were observed only for a limited subset of parameters, the trends were stable across models.
Specifically, horizontal angles (HM_SHOULD and HM_HIP) identified greater joint misalignment in Cluster 2, correctly intercepting the increased asymmetries associated with advanced disease stages. The hip misalignment was more pronounced in KIN_3D than in the MP models; this discrepancy likely arises from the MP reconstruction process, in which the hip center serves as the coordinate system origin, potentially reducing absolute angular deviations.
Lateral flexion (VM_TRUNK and VM_HEAD) and sagittal lean metrics (ZM_TRUNK, ZM_HEAD, ZS_TRUNK, and ZS_HEAD) clearly differentiated the two clusters. Cluster 2 exhibited significantly higher forward and lateral flexion, consistent with postural alterations in advanced stages.
Furthermore, reductions in hip (LM_HIP and RM_HIP, LS_HIP), elbow (LS_ELB), and knee (LS_KNEE) were observed in Cluster 2, objectively characterizing the crouched stance typical of severely affected patients.
To further investigate the discriminative power of the analyzed models, a Principal Component Analysis (PCA) was performed (Figure 7). This multivariate approach captured the most significant variance associated with clinical severity in a reduced 3D space. All three models demonstrated a clear spatial separation between clusters within their respective 95% confidence ellipsoids. Notably, the variance explained by the first three principal components was remarkably consistent across models (~71-72%), suggesting that both RGB-D and RGB-only models effectively preserve the fundamental covariance structure of the postural data.
The parameter weights on the first principal component (PC1) were analyzed to identify the primary drivers of cluster separation (Figure 8). The weight profiles were nearly identical across all models, confirming their similarities in capturing postural severity.
In conclusion, these results validate the use of markerless systems for objective postural stratification. Both RGB-D and RGB-only frameworks proved capable of detecting pathological shifts, providing a robust quantitative support to clinical assessment.
4. Discussion
The primary objective of this study was to investigate the potential and limitations of Google MediaPipe Pose (MP) 3D models for quantifying postural alterations and instability in PD using only RGB information. This was achieved through a synchronized dual-camera (Microsoft Azure Kinect) setup designed to overcome the inherent depth-estimation limitations of MP models and hardware-dependent algorithms of RGB-D sensors. The implemented system integrates two distinct perspectives: a main (frontal) camera and a sub (lateral) camera. This architecture allows for 3D skeletal reconstruction using both the RGB-D sensor and the RGB-only MP framework applied to standard video streams. The strength of this approach lies in its ability to directly compare the precision of a depth-measuring system (MAK) with that of a deep-learning-based estimator (MP). In this study, the RGB-D sensor served as the ground truth, as it had previously been validated against a gold-standard motion capture system [19,23,24,58,59,60]. Performance across three MP computational complexities was rigorously compared against the RGB-D skeletal model (KIN_3D), both from a technical and clinical perspective.
The technical results highlight that, for postural assessment in PD, higher computational complexity does not translate into greater clinical accuracy. A key finding of this study is that lower-complexity MP models achieved a high degree of technical equivalence with the KIN_3D model, particularly in assessing angular measurements and bilateral body symmetries. Conversely, the high-complexity model introduced significant distortions in the 3D skeletal reconstruction, especially at the hip and ankle levels, despite being theoretically more sophisticated. This observation confirms our previous findings [57] on healthy participants, although some parameters of MP_3D_2 seem to perform better in the PD cohort, likely facilitated by the more pronounced abnormalities typical of PD.
A crucial element emerging from this study is the advantage of the lateral view (Sub camera) for a comprehensive postural analysis using MP. While the frontal view is sufficient for detecting lateral trunk lean or Pisa syndrome, it systematically fails to provide the depth information required to quantify sagittal angles, such as those associated with camptocormia or knee flexion. The proposed dual-camera architecture successfully bridges this gap, elevating the MP model performance to excellent levels, comparable to KIN_3D for sagittal parameters. While a technical challenge persists at the distal extremities (knees and ankles), where the RGB-only system struggles to replicate the precision of the RGB-D sensor, the axial and proximal tracking remains highly reliable.
From a clinical perspective, one consistent finding was a strong association between elbow flexion angles and both global motor symptom severity (MDS-UPDRS III) and balance performance (BBS) across both MP and KIN_3D models. This suggests that upper-limb flexion may serve as a clinically informative surrogate marker of global motor severity; crucially, MP models were just as effective as the RGB-D sensor at intercepting this clinical indicator using only a standard video stream.
An important and clinically relevant finding concerns the dissociation between static postural alignment and functional performance. The data show that patients who maintain an apparently more correct or upright frontal alignment are often those with higher Freezing of Gait (NFOG-Q) scores and greater disability in activities of daily living (MDS-UPDRS II total score). This association should be cautiously interpreted. Waiting for confirmation in external datasets, it highlights that preserved static alignment does not necessarily reflect preserved motor function in PD. In these patients, reduced angular deviations during quiet standing may coexist with marked axial rigidity, bradykinesia, and impaired postural transitions, which are central contributors to freezing of gait and functional disability.
Markerless postural metrics, therefore, capture structural alignment but do not directly encode dynamic adaptability or motor fluidity, underscoring the need to interpret static posture measures within a broader functional framework. The MP models successfully intercepted this complex clinical strategy with the same sensitivity as the RGB-D sensor, proving that objective postural assessment can reveal quality-of-movement information that eludes simple visual observation.
Finally, the ability of all models to discriminate between clinical severity clusters, with similar performance in PCA (Figure 7) and in detecting more relevant parameters (Figure 8), confirms that lower-complexity MP models provide a clinical stratification capability comparable to that of RGB-D sensors. Despite minor systematic offsets, they are fully suitable for severity-impairment stratification, providing a reliable means to obtain angular metrics aligned with standardized clinical assessments.
Although MP has recently been successfully utilized across various clinical settings for limb movement analysis, gait, and physical exercises, primarily using 2D models based on image coordinates [35,61,62,63,64], to our knowledge, there are no applications of 3D models in the context of Parkinson’s disease providing insights into axial postural abnormalities from both technical and clinical perspectives.
Despite the promising results, several limitations must be acknowledged. First, estimating distal lower-limb kinematics (specifically at the knees and ankles) remains a challenge for RGB-only models. While the multi-view setup significantly improved sagittal tracking, the inherent lack of hardware-derived depth data makes these segments more susceptible to errors caused by perspective, footwear, or slight self-occlusions during standing. To mitigate this limitation, future developments could integrate kinematic constraints, anthropometric scaling, or multi-perspective skeletal fusions, which were not included in this study, to refine and improve 3D reconstructions.
Second, the current analysis was conducted in a controlled environment. Although Google MediaPipe Pose aims to enhance accessibility, its performance in home settings, characterized by background clutter, sub-optimal lighting, and unconstrained camera angles, remains to be fully investigated.
Third, the 60-second standing task, while effective for capturing static postural alignment and compensatory rigidity, does not account for dynamic postural transitions. Future research should extend this validation to dynamic tasks (e.g., sit-to-stand or walking) to evaluate the robustness of MP models during movement.
Furthermore, while our cohort of 40 patients provided significant initial insights, the sample size needs to be expanded. A larger, more varied population would allow for more robust stratification across all MDS-UPDRS severity levels. Specifically, balancing the distribution of postural severity scores is essential to confirm whether the high correlation coefficients and discriminative power of the angular parameters remain consistent across the full clinical spectrum, thereby enhancing the statistical power of the correlations.
Finally, a technical limitation is the current dual-camera setup, which limits the solution’s portability. While the synchronized setup was essential for direct validation of MP models against MAK, the spatial requirements for positioning the Main and Sub cameras are significant. However, this hardware could be significantly simplified for obtaining similar measurements for MP by using a single standard webcam and introducing a sequential assessment protocol, recording the patient first from a frontal and then a lateral perspective. This could yield the same comprehensive metrics without the burden of a multi-camera setup, further enhancing accessibility and enabling clinicians to perform objective assessments with a single, simpler video-recording device, such as a tablet or smartphone.
5. Conclusions
This study demonstrates that markerless human pose estimation using lower-complexity MP models provides a reliable, hardware-independent solution for postural assessment in Parkinson’s Disease. Our findings confirm that this software-based solution, based on RGB-only information, is not only technically consistent with RGB-D cameras for several angular measurements and body symmetry metrics, but is also clinically sensitive enough to intercept complex hallmarks of the disease.
The transition from specific, short-lived hardware sensors, such as RGB-D cameras, to flexible, software-based solutions, such as Google MediaPipe Pose, marks a significant step toward scalable digital biomonitoring. By demonstrating that reliable postural assessments can be derived from standard video streams, this work supports the development of accessible, camera-based tools for precision medicine, thereby enhancing the ability to monitor PD progression and optimize therapeutic interventions in both clinical and remote settings.
Author Contributions
Conceptualization, C.F. and G.A.; methodology, C.F. and G.A.; software, C.F.; validation, C.F. and G.A.; formal analysis, C.F. and G.A.; investigation, C.F., G.A, C.A.A., M.P., G.I., S.G., A.S.; resources, C.F., M.G., G.I., M.P., A.S.; data curation, C.F. and M.G.; writing—original draft preparation, C.F. and G.A.; writing—review and editing, C.F., G.O, M.G., M.P., S.G., G.I., and C.A.A.; visualization, C.F. and G.A.; supervision, C.F., G.O., C.A.A., A.S., L.L., and M.G.; project administration, C.F., C.A.A. and M.G.; funding acquisition, C.F., M.G., A.S., and C.A.A. All authors have read and agreed to the published version of the manuscript.
Funding
This research was funded by European Union “PNRR-PRIN 2022 P20223R3R4 OMNIA-PARK project, Next Generation EU within the PRIN 2022 PNRR program”.
Institutional Review Board Statement
The study was conducted in accordance with the Declaration of Helsinki and approved by the Comitato Etico Territoriale (CET) interaziendale AOU Citta’ della Salute e della Scienza di Torino (Protocol 0080563 No. 512/2023; approved on 17 June 2024).
Informed Consent Statement
Informed consent was obtained from all subjects involved in the study.
Data Availability Statement
The dataset is not publicly available because it is currently being used by multiple research groups funded under the same project. Data sharing will be considered once all ongoing studies within the project have been completed.
Acknowledgments
The authors would like to thank all the other research partners involved in the OMNIA-PARK project for their valuable support throughout the development of the project and for their contribution to the data collection phase. The authors also thank the patients and their families for their participation. Generative AI tools (Google Gemini Pro) were used to assist with grammar, language, and style editing. The scientific content, analysis, figures, and conclusions presented herein are the original work of the authors and were developed without the use of such tools.
Conflicts of Interest
The authors declare no conflicts of interest.
References
- Doro, E.; Azzollini, V.; Ghilli, M.; Roncella, M.; Chisari, C. Postural alterations in breast cancer survivors: proposal of the PABS evaluation protocol based on a systematic review. Eur J Phys Rehabil Med. 2023, 59, 406–413. [Google Scholar] [CrossRef]
- Alizadehkhaiyat, O.; Roebuck, M.M.; Makki, A.T.; Frostick, S.P. Postural Alterations in Patients with Subacromial Impingement Syndrome. Int J Sports Phys Ther. 2017, 12, 1111–1120. [Google Scholar] [CrossRef]
- Debû, B.; De Oliveira Godeiro, C.; Lino, J.C.; Moro, E. Managing Gait, Balance, and Posture in Parkinson’s Disease. Curr Neurol Neurosci Rep. 2018, 18, 23. [Google Scholar] [CrossRef] [PubMed]
- Cao, S.; Cui, Y.; Jin, J.; Li, F.; Liu, X.; Feng, T. Prevalence of axial postural abnormalities and their subtypes in Parkinson’s disease: a systematic review and meta-analysis. J Neurol. 2023, 270, 139–151. [Google Scholar] [CrossRef] [PubMed]
- Al-Wardat, M.; Geroin, C.; Schirinzi, T.; et al. Axial postural abnormalities and pain in Parkinson’s disease. J Neural Transm. 2023, 130, 77–85. [Google Scholar] [CrossRef]
- Gandolfi, M.; Geroin, C.; Imbalzano, G.; Camozzi, S.; Menaspà, Z.; Tinazzi, M.; Artusi, C.A. Treatment of axial postural abnormalities in parkinsonism disorders: A systematic review of pharmacological, rehabilitative and surgical interventions. Clin Park Relat Disord. 2024, 10, 100240. [Google Scholar] [CrossRef] [PubMed]
- Tinazzi, M.; Gandolfi, M.; Ceravolo, R.; Capecci, M.; Andrenelli, E.; et al. Postural Abnormalities in Parkinson’s Disease: An Epidemiological and Clinical Multicenter Study. Mov Disord Clin Pract. 2019, 6, 576–585. [Google Scholar] [CrossRef]
- Doherty, K.M.; van de Warrenburg, B.P.; Peralta, M.C.; Silveira-Moriyama, L.; et al. Postural deformities in Parkinson’s disease. Lancet Neurol. 2011, 10, 538–49. [Google Scholar] [CrossRef]
- Bloem, B.R.; Okun, M.S.; Klein, C. Parkinson’s disease. Lancet 2021, 397, 2284–2303. [Google Scholar]
- Fortin, C.; Feldman, D.E.; Cheriet, F.; Labelle, H. Clinical methods for quantifying body segment posture: a literature review. Disabil Rehabil. 2011, 33, 367–383. [Google Scholar] [CrossRef]
- Porto, A.B.; Okazaki, V.H.A. Procedures of assessment on the quantification of thoracic kyphosis and lumbar lordosis by radiography and photogrammetry: A literature review. J Bodyw Mov Ther. 2017, 21, 986–994. [Google Scholar] [CrossRef] [PubMed]
- Rosário, J.L. Biomechanical assessment of human posture: a literature review. J Bodyw Mov Ther. 2014, 18, 368–373. [Google Scholar] [PubMed]
- Pongmala, C.; Artusi, C.A.; Zibetti, M.; et al. Postural abnormalities in Asian and Caucasian Parkinson’s disease patients: A multicenter study. Parkinsonism Relat Disord. 2022, 97, 91–98. [Google Scholar]
- Iosa, M.; Picerno, P.; Paolucci, S.; Morone, G. Wearable inertial sensors for human movement analysis. Expert Rev Med Devices 2016, 13, 641–59. [Google Scholar] [PubMed]
- Huang, X.; Xue, Y.; Ren, S.; Wang, F. Sensor-Based Wearable Systems for Monitoring Human Motion and Posture: A Review. Sensors (Basel) 2023, 23, 9047. [Google Scholar]
- Roggio, F.; Ravalli, S.; Maugeri, G.; et al. Technological advancements in the analysis of human motion and posture management through digital devices. World J Orthop. 2021, 12, 467–484. [Google Scholar] [CrossRef]
- Simpson, L.; Maharaj, M.M.; Mobbs, R.J. The role of wearables in spinal posture analysis: a systematic review. BMC Musculoskelet Disord. 2019, 20, 55. [Google Scholar] [CrossRef]
- Papi, E.; Koh, W.S.; McGregor, A.H. Wearable technology for spine movement assessment: A systematic review. J Biomech. 2017, 64, 186–197. [Google Scholar] [CrossRef]
- Zhang, Z.; Hong, R.; Lin, A.; et al. Automated and accurate assessment for postural abnormalities in patients with Parkinson’s disease based on Kinect and machine learning. J NeuroEngineering Rehabil 2021, 18, 169. [Google Scholar] [CrossRef]
- Hong, R.; Zhang, T.; Zhang, Z.; et al. A summary index derived from Kinect to evaluate postural abnormalities severity in Parkinson’s Disease patients. NPJ Parkinsons Dis. 2022, 8, 96. [Google Scholar]
- Bawa, A.; Banitsas, K.; Abbod, M. A Review on the Use of Microsoft Kinect for Gait Abnormality and Postural Disorder Assessment. J Healthc Eng. 2021, 2021, 4360122. [Google Scholar]
- Ferraris, C.; Votta, V.; Nerino, R.; et al. At-home assessment of postural stability in parkinson’s disease: a vision-based approach. J Ambient Intell Human Comput 2024, 15, 2765–2778. [Google Scholar] [CrossRef]
- Cerfoglio, S.; Ferraris, C.; Vismara, L.; et al. Estimation of gait parameters in healthy and hemiplegic individuals using Azure Kinect: a comparative study with the optoelectronic system. Front Bioeng Biotechnol. 2024, 12, 1449680. [Google Scholar] [CrossRef]
- Ferraris, C.; Amprimo, G.; Cerfoglio, S.; Masi, G.; Vismara, L.; Cimolin, V. Machine-Learning-Based Validation of Microsoft Azure Kinect in Measuring Gait Profiles. Electronics 2024, 13, 4739. [Google Scholar] [CrossRef]
- Roggio, F.; Trovato, B.; Sortino, M.; Musumeci, G. A comprehensive analysis of the machine learning pose estimation models used in human movement and posture analyses: A narrative review. Heliyon 2024, 10, e39977. [Google Scholar] [CrossRef]
- di Biase, L.; Pecoraro, P.M.; Bugamelli, F. AI Video Analysis in Parkinson’s Disease: A Systematic Review of the Most Accurate Computer Vision Tools for Diagnosis, Symptom Monitoring, and Therapy Management. Sensors (Basel) 2025, 25, 6373. [Google Scholar] [CrossRef] [PubMed]
- Amprimo, G.; Masi, G.; Pettiti, G.; Olmo, G.; Priano, L.; Ferraris, C. Hand tracking for clinical applications: Validation of the Google MediaPipe Hand (GMH) and the depth-enhanced GMH-D frameworks. Biomedical Signal Processing and Control 2024, 96, 106508. [Google Scholar] [CrossRef]
- Lugaresi, C.; Tang, J.; Nash, H.; McClanahan, C.; Uboweja, E.; et al. Mediapipe: A framework for building perception pipelines. arXiv 2019, arXiv:1906.08172. [Google Scholar] [CrossRef]
- Cao, Z.; et al. OpenPose: Realtime Multi-Person 2D Pose Estimation Using Part Affinity Fields. IEEE Transactions on Pattern Analysis and Machine Intelligence 2021, 43, 172–186. [Google Scholar] [CrossRef]
- Janapati, M.; Allamsetty, L.P.; Potluri, T.T.; Mogili, K.V. Gait-Driven Pose Tracking and Movement Captioning Using OpenCV and MediaPipe Machine Learning Framework. Eng. Proc. 2024, 82, 4. [Google Scholar]
- Wang, J.; Tan, S.; Zhen, X.; et al. Deep 3D human pose estimation: A review. Computer Vision and Image Understanding 2021, 210, 103225. [Google Scholar] [CrossRef]
- Pecoraro, P.M.; Marsili, L.; Espay, A.J.; Bologna, M.; di Biase, L. Computer Vision Technologies in Movement Disorders: A Systematic Review. Mov Disord Clin Pract. 2025, 12, 1229–1243. [Google Scholar] [CrossRef]
- Aldegheri, S.; Artusi, C.A.; Camozzi, S.; Di Marco, R.; et al. Camera- and Viewpoint-Agnostic Evaluation of Axial Postural Abnormalities in People with Parkinson’s Disease through Augmented Human Pose Estimation. Sensors 2023, 23, 3193. [Google Scholar] [CrossRef]
- Artusi, C.A.; Geroin, C.; Imbalzano, G.; et al. Assessment of Axial Postural Abnormalities in Parkinsonism: Automatic Picture Analysis Software. Mov Disord Clin Pract. 2023, 10, 636–645. [Google Scholar] [PubMed]
- Roggio, F.; Di Grande, S.; Cavalieri, S.; Falla, D.; Musumeci, G. Biomechanical Posture Analysis in Healthy Adults with Machine Learning: Applicability and Reliability. Sensors 2024, 24, 2929. [Google Scholar] [CrossRef]
- Lin, Y.; Jiao, X.; Zhao, L. Detection of 3D Human Posture Based on Improved Mediapipe. Journal of Computer and Communications 2023, 11, 102–121. [Google Scholar] [CrossRef]
- Kondo, Y.; Ariake, Y.; Suzuki, I.; et al. Two-minute standing endurance test for axial postural abnormalities in patients with Parkinson’s disease. Gait Posture 2024, 112, 81–87. [Google Scholar] [CrossRef] [PubMed]
- Geroin, C.; Artusi, C.A.; Gandolfi, M.; et al. Does the Degree of Trunk Bending Predict Patient Disability, Motor Impairment, Falls, and Back Pain in Parkinson’s Disease? Front Neurol. 2020, 11, 207. [Google Scholar]
- Gallo, S.; Patera, M.; Imbalzano, G.; Zampogna, A.; et al. Objective Monitoring of Axial symptoms in Parkinson’s Disease (OMNIA-PARK): the Study Protocol. Mov Disord. 2025, 40. Available online: https://www.mdsabstracts.org/abstract/objective-monitoring-of-axial-symptoms-in-parkinsons-disease-omnia-park-the-study-protocol/ (accessed on 9 January 2026).
- Gazzanti Pugliese di Cotrone, M.A.; Akhtar, N.F.; Patera, M.; Gallo, S.; et al. Early Detection of Dysphagia Signs in Parkinson’s Disease: An Artificial Intelligence-Based Approach Using Non-Invasive Sensors. Sensors (Basel) 2025, 25, 6834. [Google Scholar]
- Postuma, R.B.; Berg, D.; Stern, M.; Poewe, W.; et al. MDS clinical diagnostic criteria for Parkinson’s disease. Mov. Disord. 2015, 30, 1591–1601. [Google Scholar] [PubMed]
- Jost, S.T.; Kaldenbach, M.A.; Antonini, A.; et al. Levodopa Dose Equivalency in Parkinson’s Disease: Updated Systematic Review and Proposals. Mov Disord. 2023, 38, 1236–1252. [Google Scholar] [CrossRef]
- Hoehn, M.M.; Yahr, M.D. Parkinsonism. Neurology 1967, 17, 427. [Google Scholar] [CrossRef]
- Dalrymple-Alford, J.C.; MacAskill, M.R.; Nakas, C.T.; et al. The MoCA: well-suited screen for cognitive impairment in Parkinson disease. Neurology 2010, 75, 1717–25. [Google Scholar] [CrossRef]
- Goetz, C.G.; Tilley, B.C.; Shaftman, S.R.; et al. Movement Disorder Society-sponsored revision of the Unified Parkinson’s Disease Rating Scale (MDS-UPDRS): Scale presentation and clinimetric testing results. Mov. Disord. 2008, 23, 2129–2170. [Google Scholar] [CrossRef] [PubMed]
- Berg, K.O.; Wood-Dauphinee, S.L.; Williams, J.I.; Maki, B. Measuring balance in the elderly: validation of an instrument. Can J Public Health 1992, 83, S7–11. [Google Scholar]
- Goetz, C.G.; Nutt, J.G.; Stebbins, G.T. The Unified Dyskinesia Rating Scale: presentation and clinimetric profile. Mov Disord. 2008, 23, 2398–2403. [Google Scholar]
- Nieuwboer, A.; Rochester, L.; Herman, T.; et al. Reliability of the new freezing of gait questionnaire: agreement between patients with Parkinson’s disease and their carers. Gait Posture 2009, 30, 459–463. [Google Scholar] [CrossRef] [PubMed]
- Brown, R.G.; Dittner, A.; Findley, L.; Wessely, S.C. The Parkinson fatigue scale. Parkinsonism Relat Disord. 2005, 11, 49–55. [Google Scholar] [CrossRef] [PubMed]
- Chaudhuri, K.R.; Rizos, A.; Trenkwalder, C.; et al. King’s Parkinson’s disease pain scale, the first scale for pain in PD: An international validation. Mov Disord. 2015, 30, 1623–1631. [Google Scholar] [CrossRef]
- Jenkinson, C.; Fitzpatrick, R.; Peto, V.; Greenhall, R.; Hyman, N. The PDQ-8: Development and validation of a short-form Parkinson’s disease questionnaire. Psychol. Health 1997, 12, 805–814. [Google Scholar] [CrossRef]
- Azure Kinect documentation. Available online: https://learn.microsoft.com/en-us/previous-versions/azure/kinect-dk/ (accessed on 09 01 2026).
- Azure Kinect synchronization. Available online: https://learn.microsoft.com/en-us/previous-versions/azure/kinect-dk/multi-camera-sync (accessed on 09 01 2026).
- MediaPipe Pose Landmark Model. Available online: https://github.com/google-ai-edge/mediapipe/blob/master/docs/solutions/pose.md (accessed on 09 01 2026).
- Azure Kinect Joint hierarchy. Available online: https://learn.microsoft.com/en-us/previous-versions/azure/kinect-dk/body-joints. (accessed on 09 01 2026).
- Whitley, E.; Ball, J. Statistics review 6: Nonparametric methods. Crit Care 2002, 6, 509. [Google Scholar] [CrossRef]
- Ferraris, C.; Amprimo, G.; Cerfoglio, S.; Vismara, L.; Cimolin, V. A Deep Dive Into MediaPipe Pose for Postural Assessment: A Comparative Investigation. IEEE Access 2025, 13, 211055–211074. [Google Scholar] [CrossRef]
- Albert, J.A.; et al. Evaluation of the Pose Tracking Performance of the Azure Kinect and Kinect v2 for Gait Analysis in Comparison with a Gold Standard: A Pilot Study. Sensors 2020, 20, 5104. [Google Scholar] [CrossRef]
- Antico, M.; et al. Postural control assessment via Microsoft Azure Kinect DK: An evaluation study. Comput Methods Programs Biomed. 2021, 209, 106324. [Google Scholar] [CrossRef]
- Guess, T.M.; et al. Comparison of Azure Kinect overground gait spatiotemporal parameters to marker based optical motion capture. Gait Posture 2022, 96, 130–136. [Google Scholar] [CrossRef]
- Lafayette, T.B.G.; et al. Validation of Angle Estimation Based on Body Tracking Data from RGB-D and RGB Cameras for Biomechanical Assessment. Sensors (Basel) 2022, 23, 3. [Google Scholar] [CrossRef] [PubMed]
- Lagomarsino, B.; Massone, A.; Odone, F.; Casadio, M.; Moro, M. Video-based markerless assessment of bilateral upper limb motor activity following cervical spinal cord injury. Comput Biol Med. 2025, 196, 110908. [Google Scholar] [CrossRef] [PubMed]
- Hii, C.S.T.; et al. Automated Gait Analysis Based on a Marker-Free Pose Estimation Model. Sensors (Basel) 2023, 23, 6489. [Google Scholar] [CrossRef] [PubMed]
- Menychtas, D.; et al. Gait analysis comparison between manual marking, 2D pose estimation algorithms, and 3D marker-based system. Front Rehabil Sci. 2023, 4, 1238134. [Google Scholar] [CrossRef] [PubMed]
Figure 1.
Schema of the dual-camera setup.
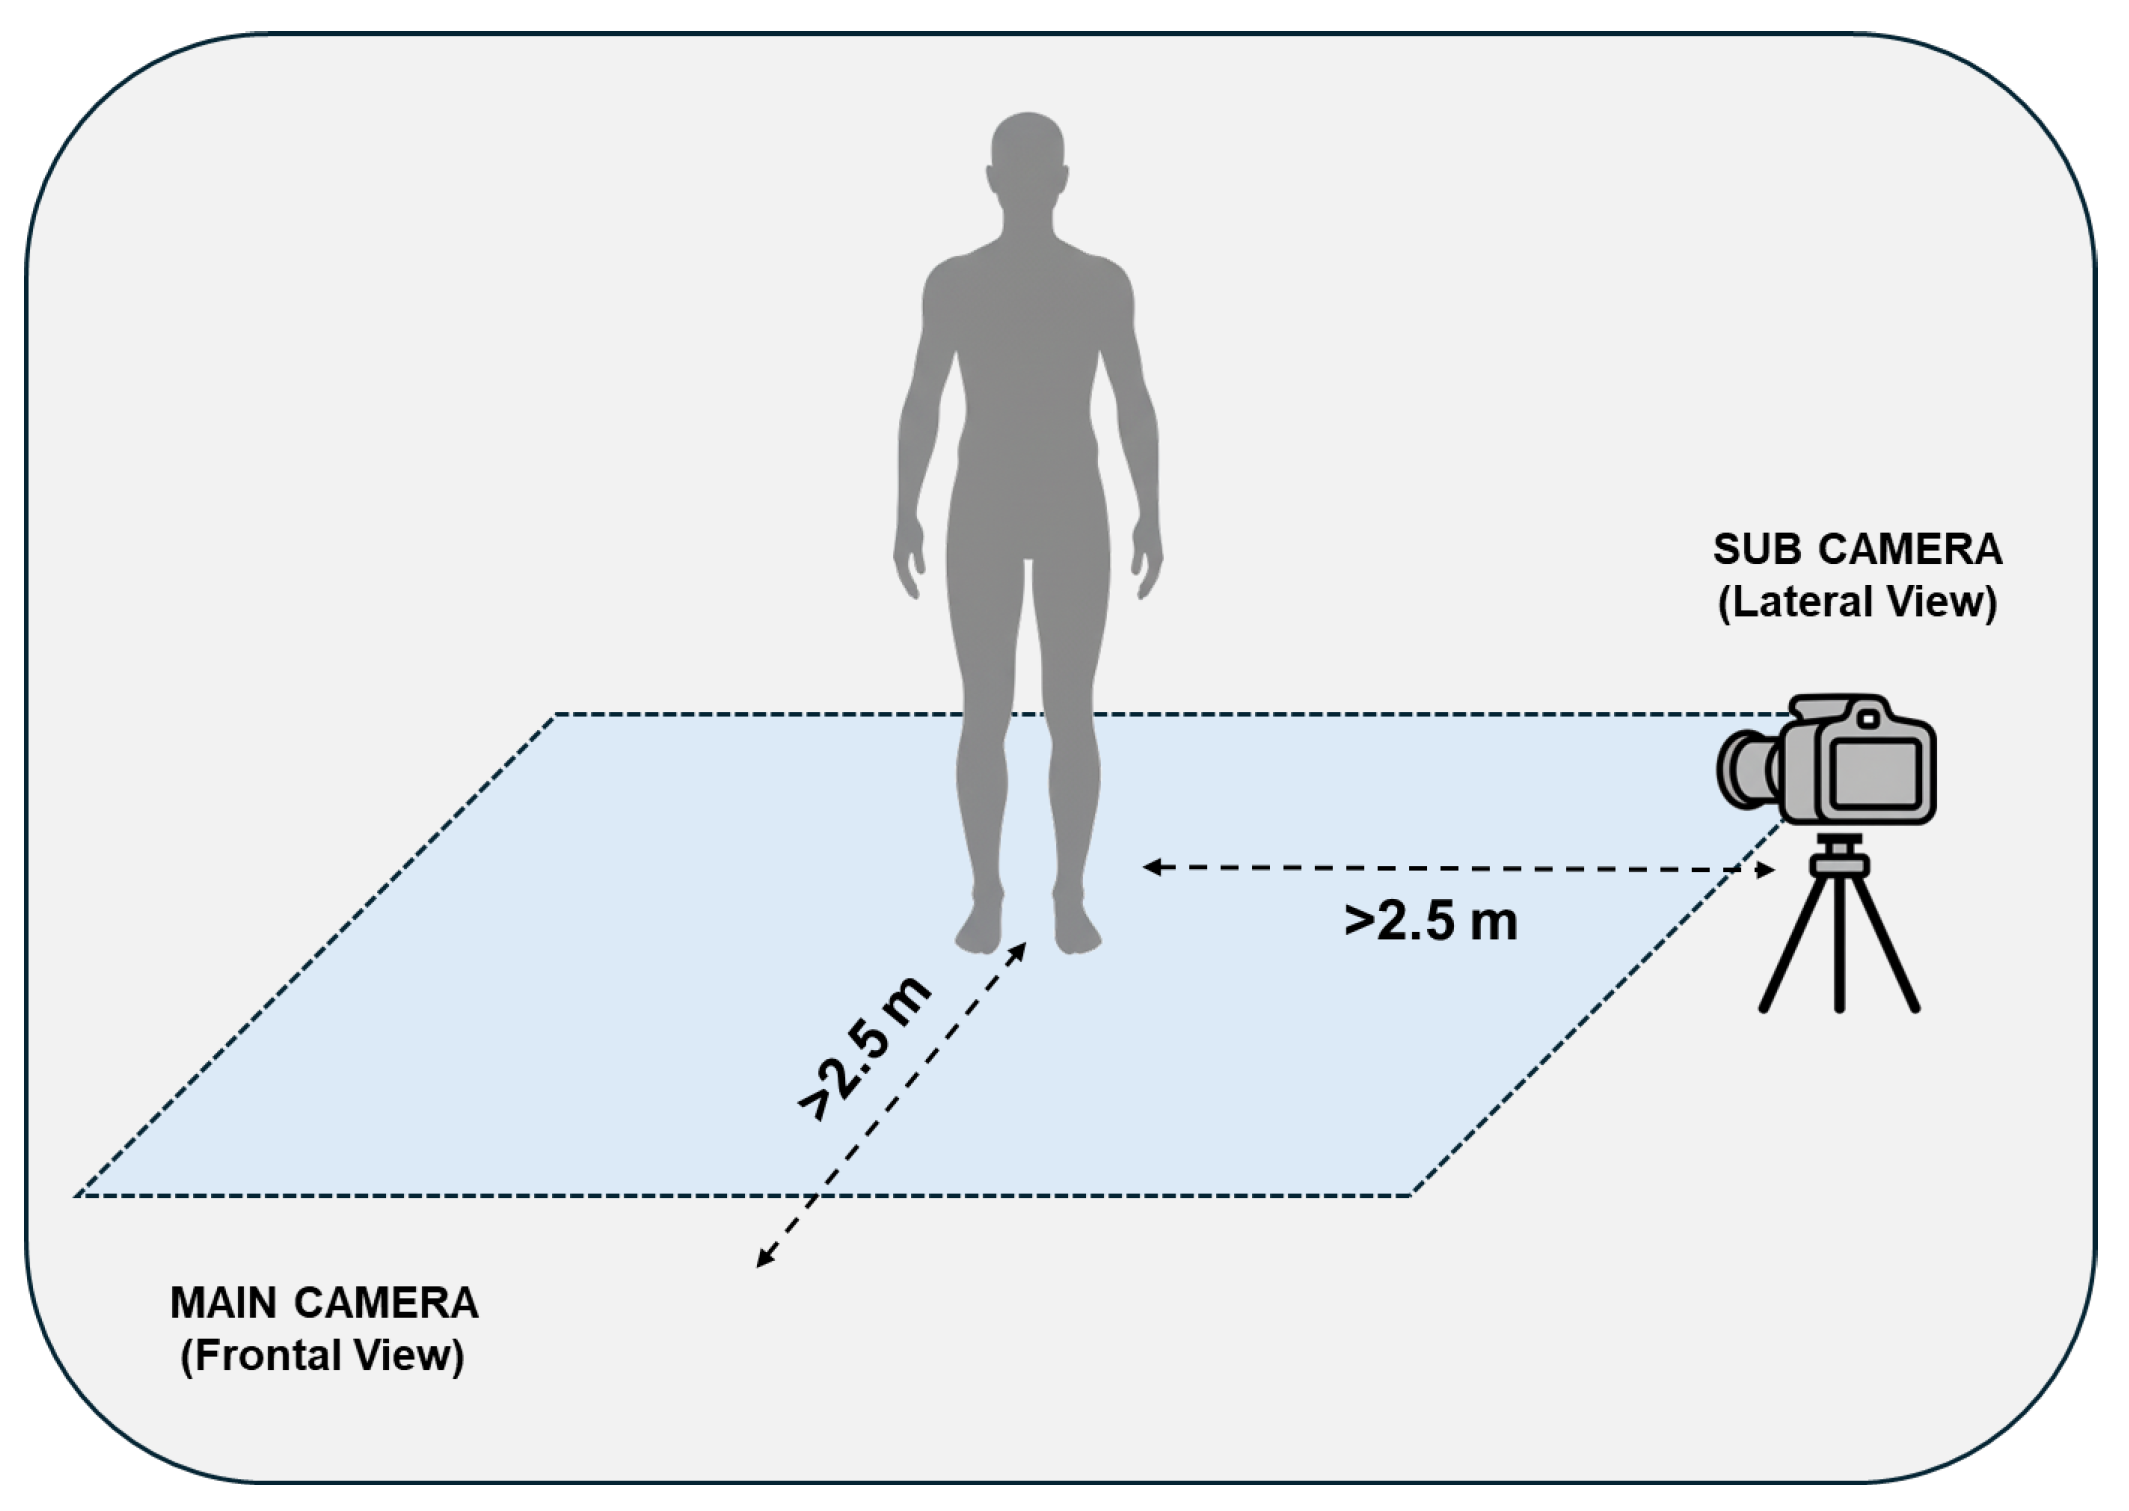
Figure 2.
Example of skeletal models estimated for MAK (a) and MP (b) on the same subject. Key points on the head are not visible due to the anonymization procedure.
Figure 2.
Example of skeletal models estimated for MAK (a) and MP (b) on the same subject. Key points on the head are not visible due to the anonymization procedure.
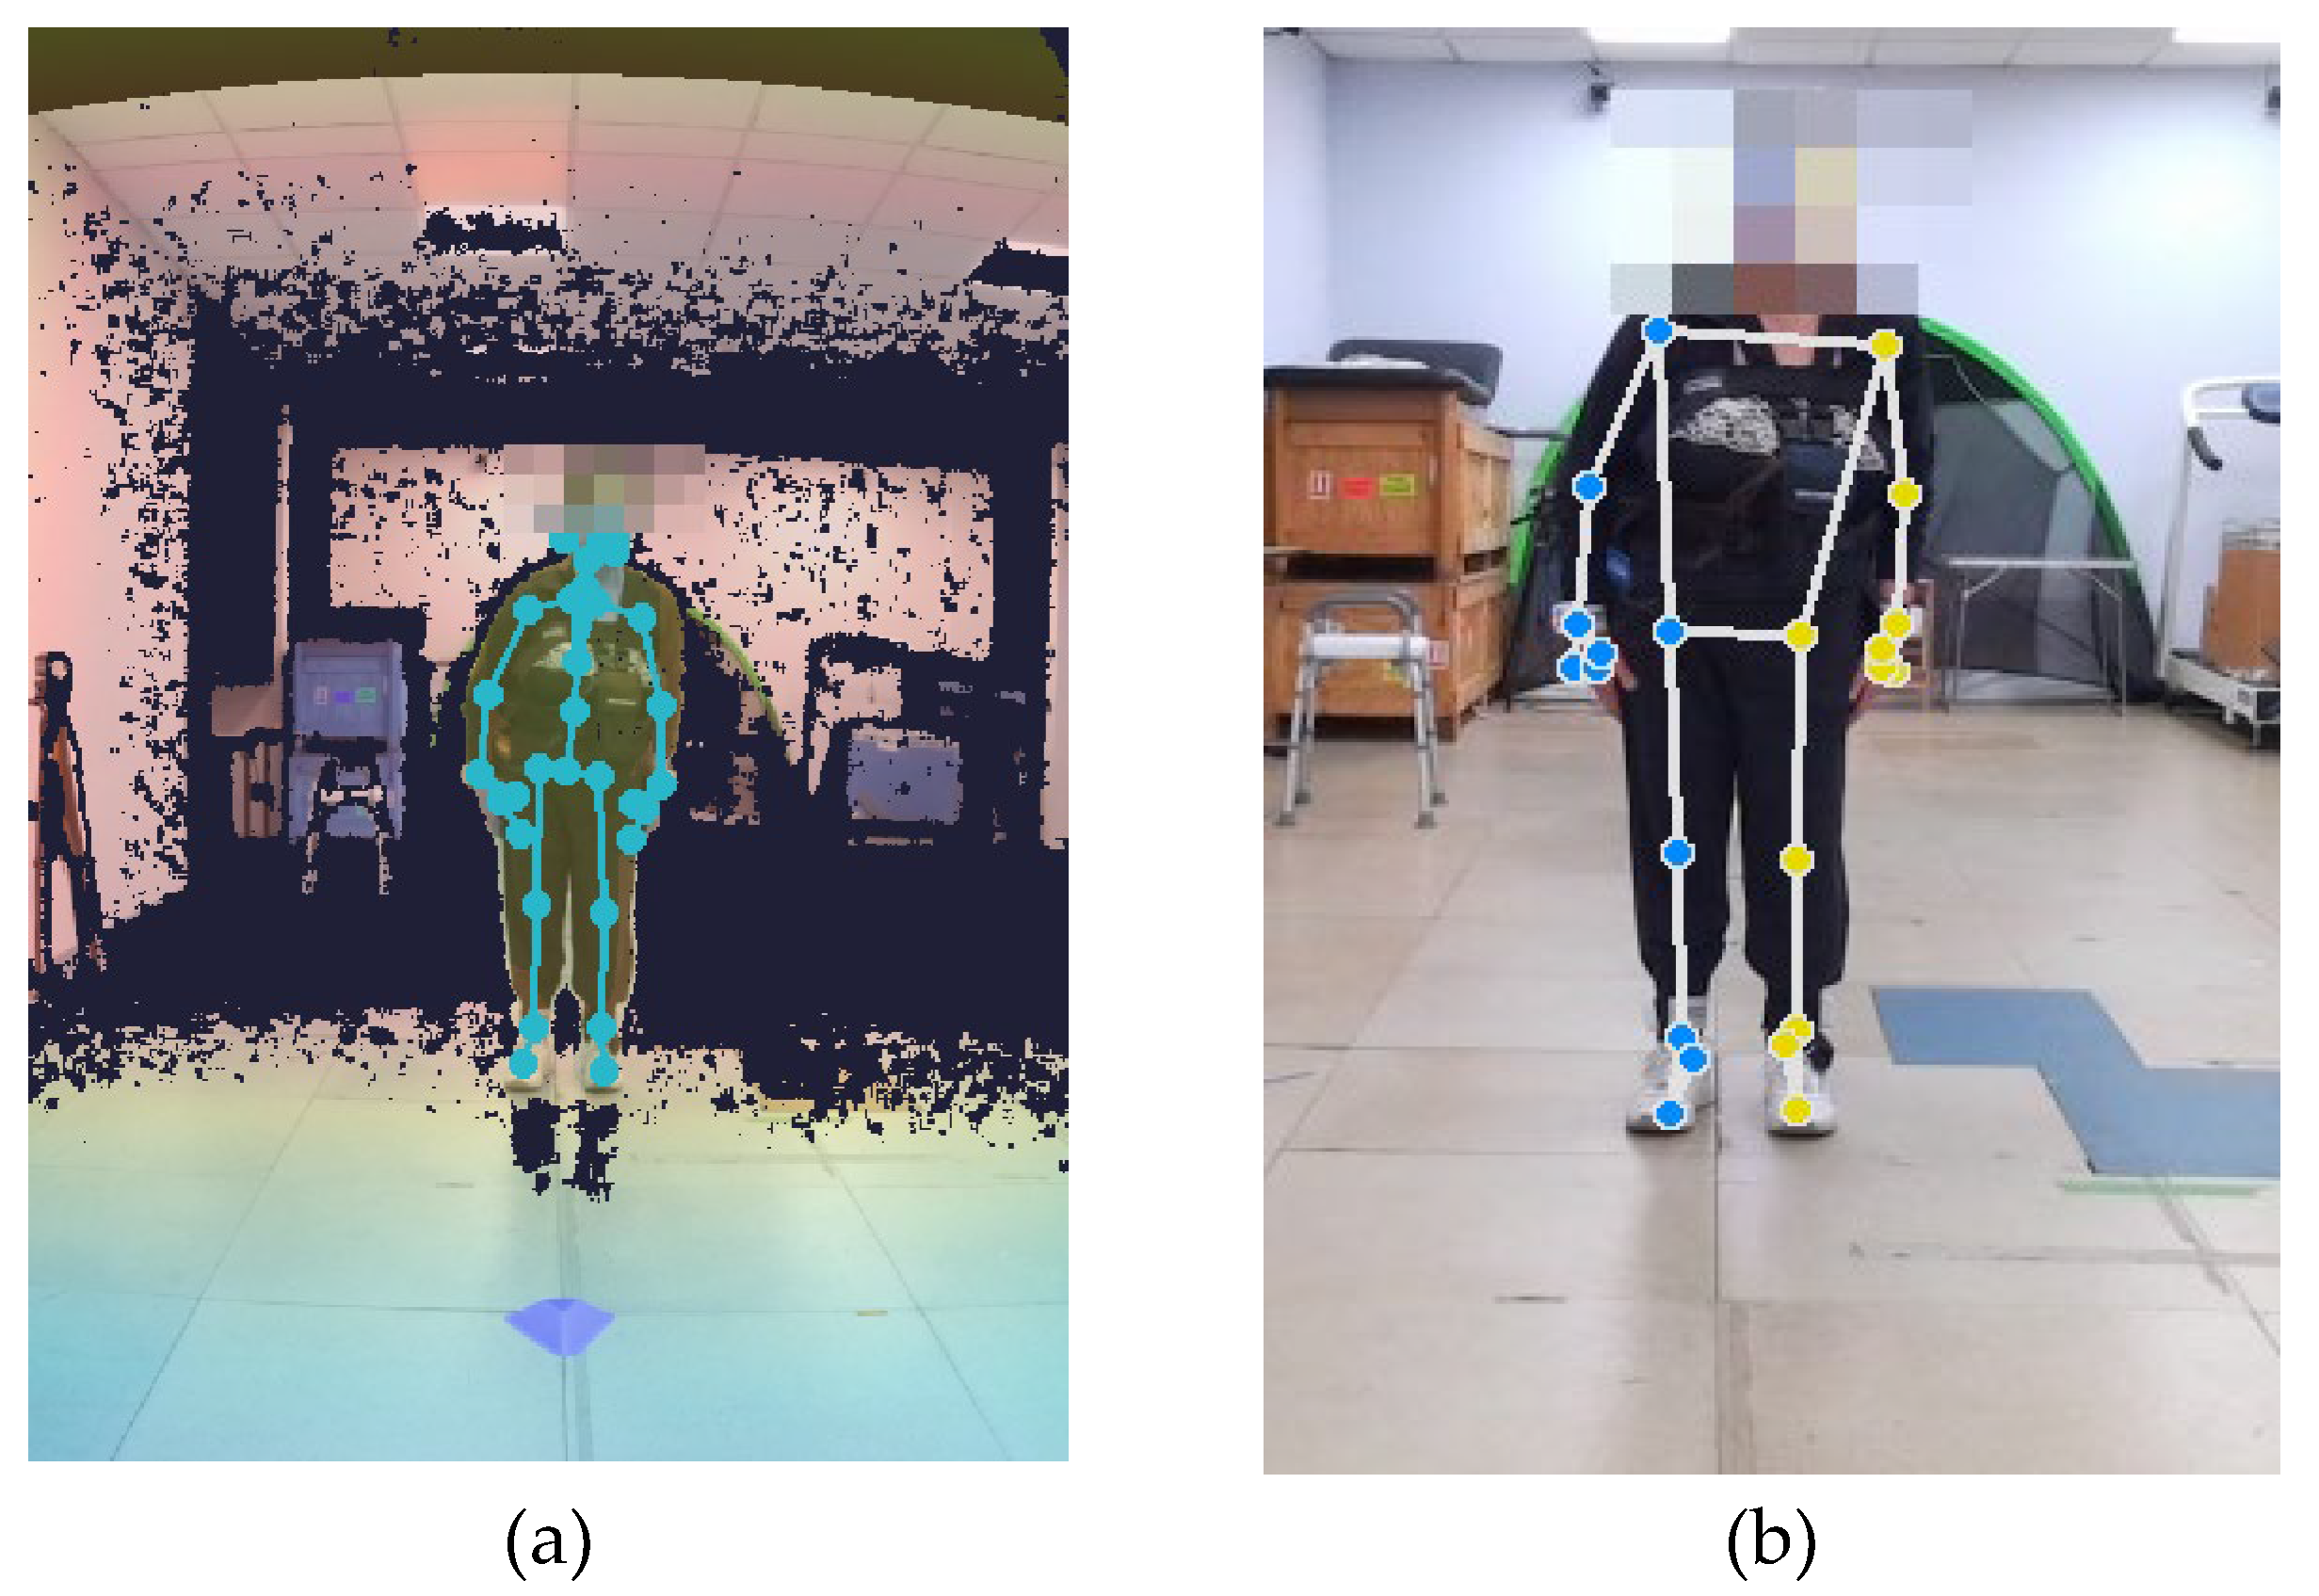
Figure 3.
Angles computed for the analysis: Horizontal and vertical angles from the frontal (Main) view (a); sagittal angles from the frontal (Main) and lateral (Sub) views (b); joint 3D angles from the frontal (Main) and lateral (Sub) views (c).
Figure 3.
Angles computed for the analysis: Horizontal and vertical angles from the frontal (Main) view (a); sagittal angles from the frontal (Main) and lateral (Sub) views (b); joint 3D angles from the frontal (Main) and lateral (Sub) views (c).
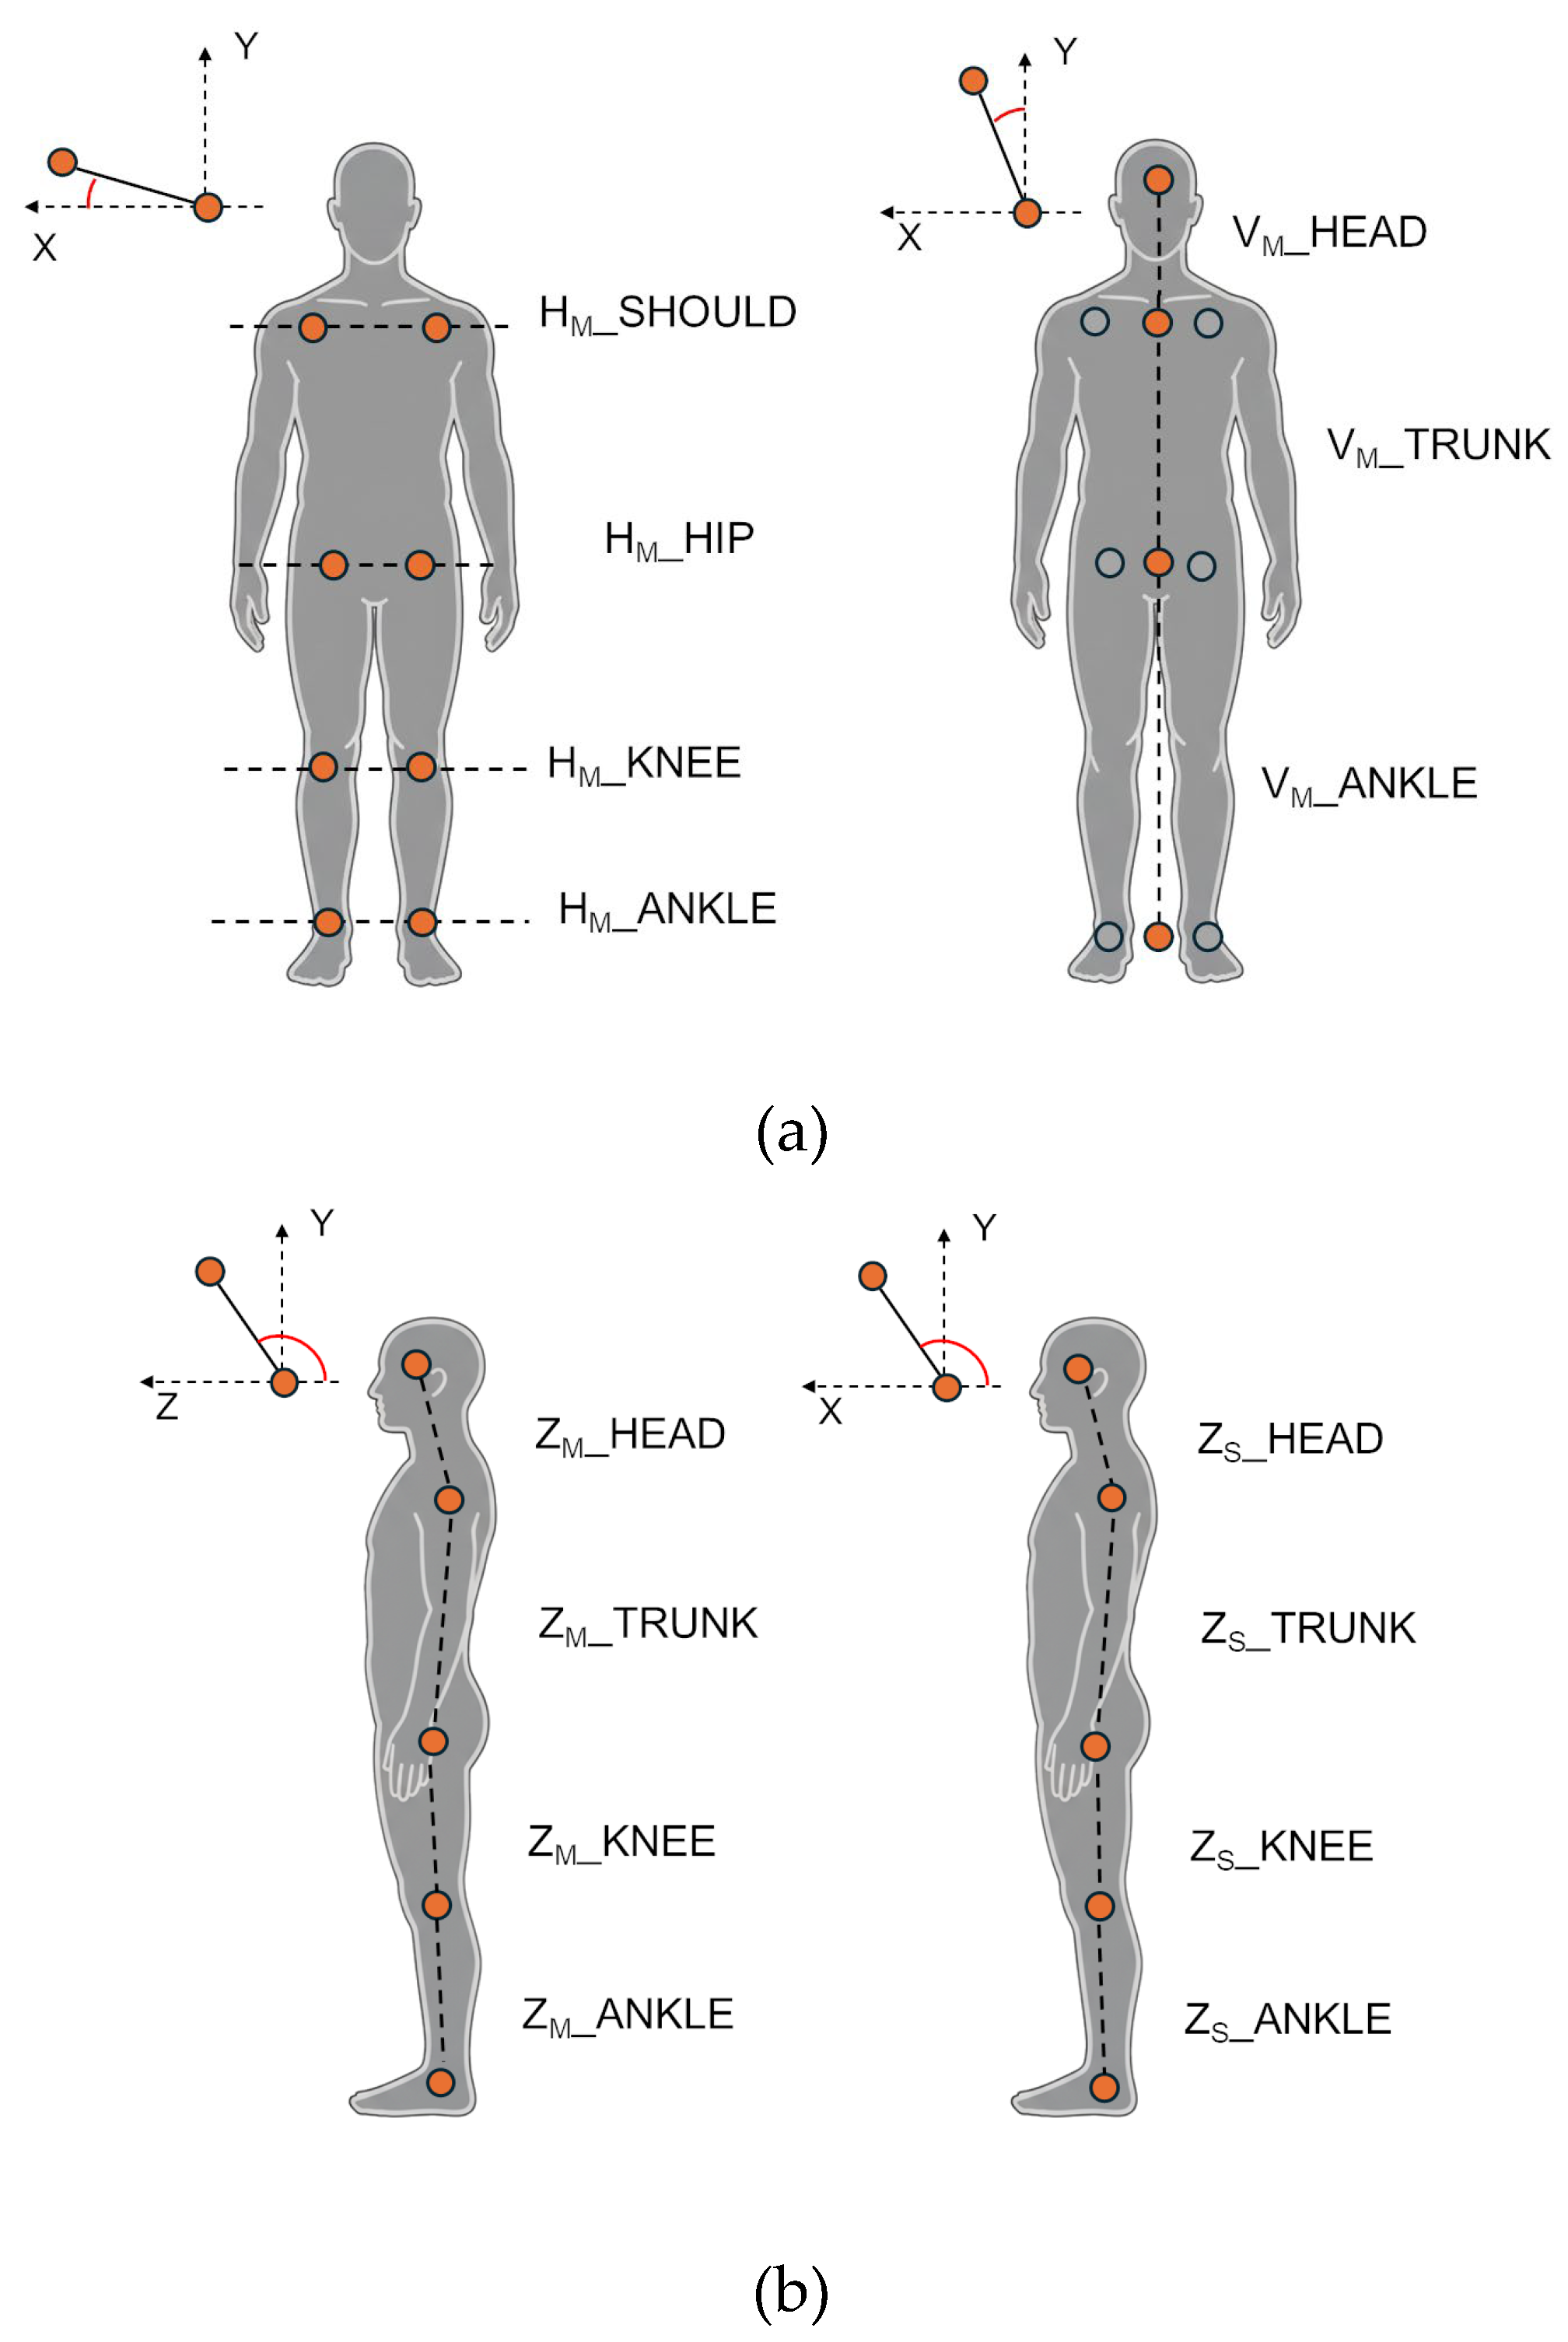
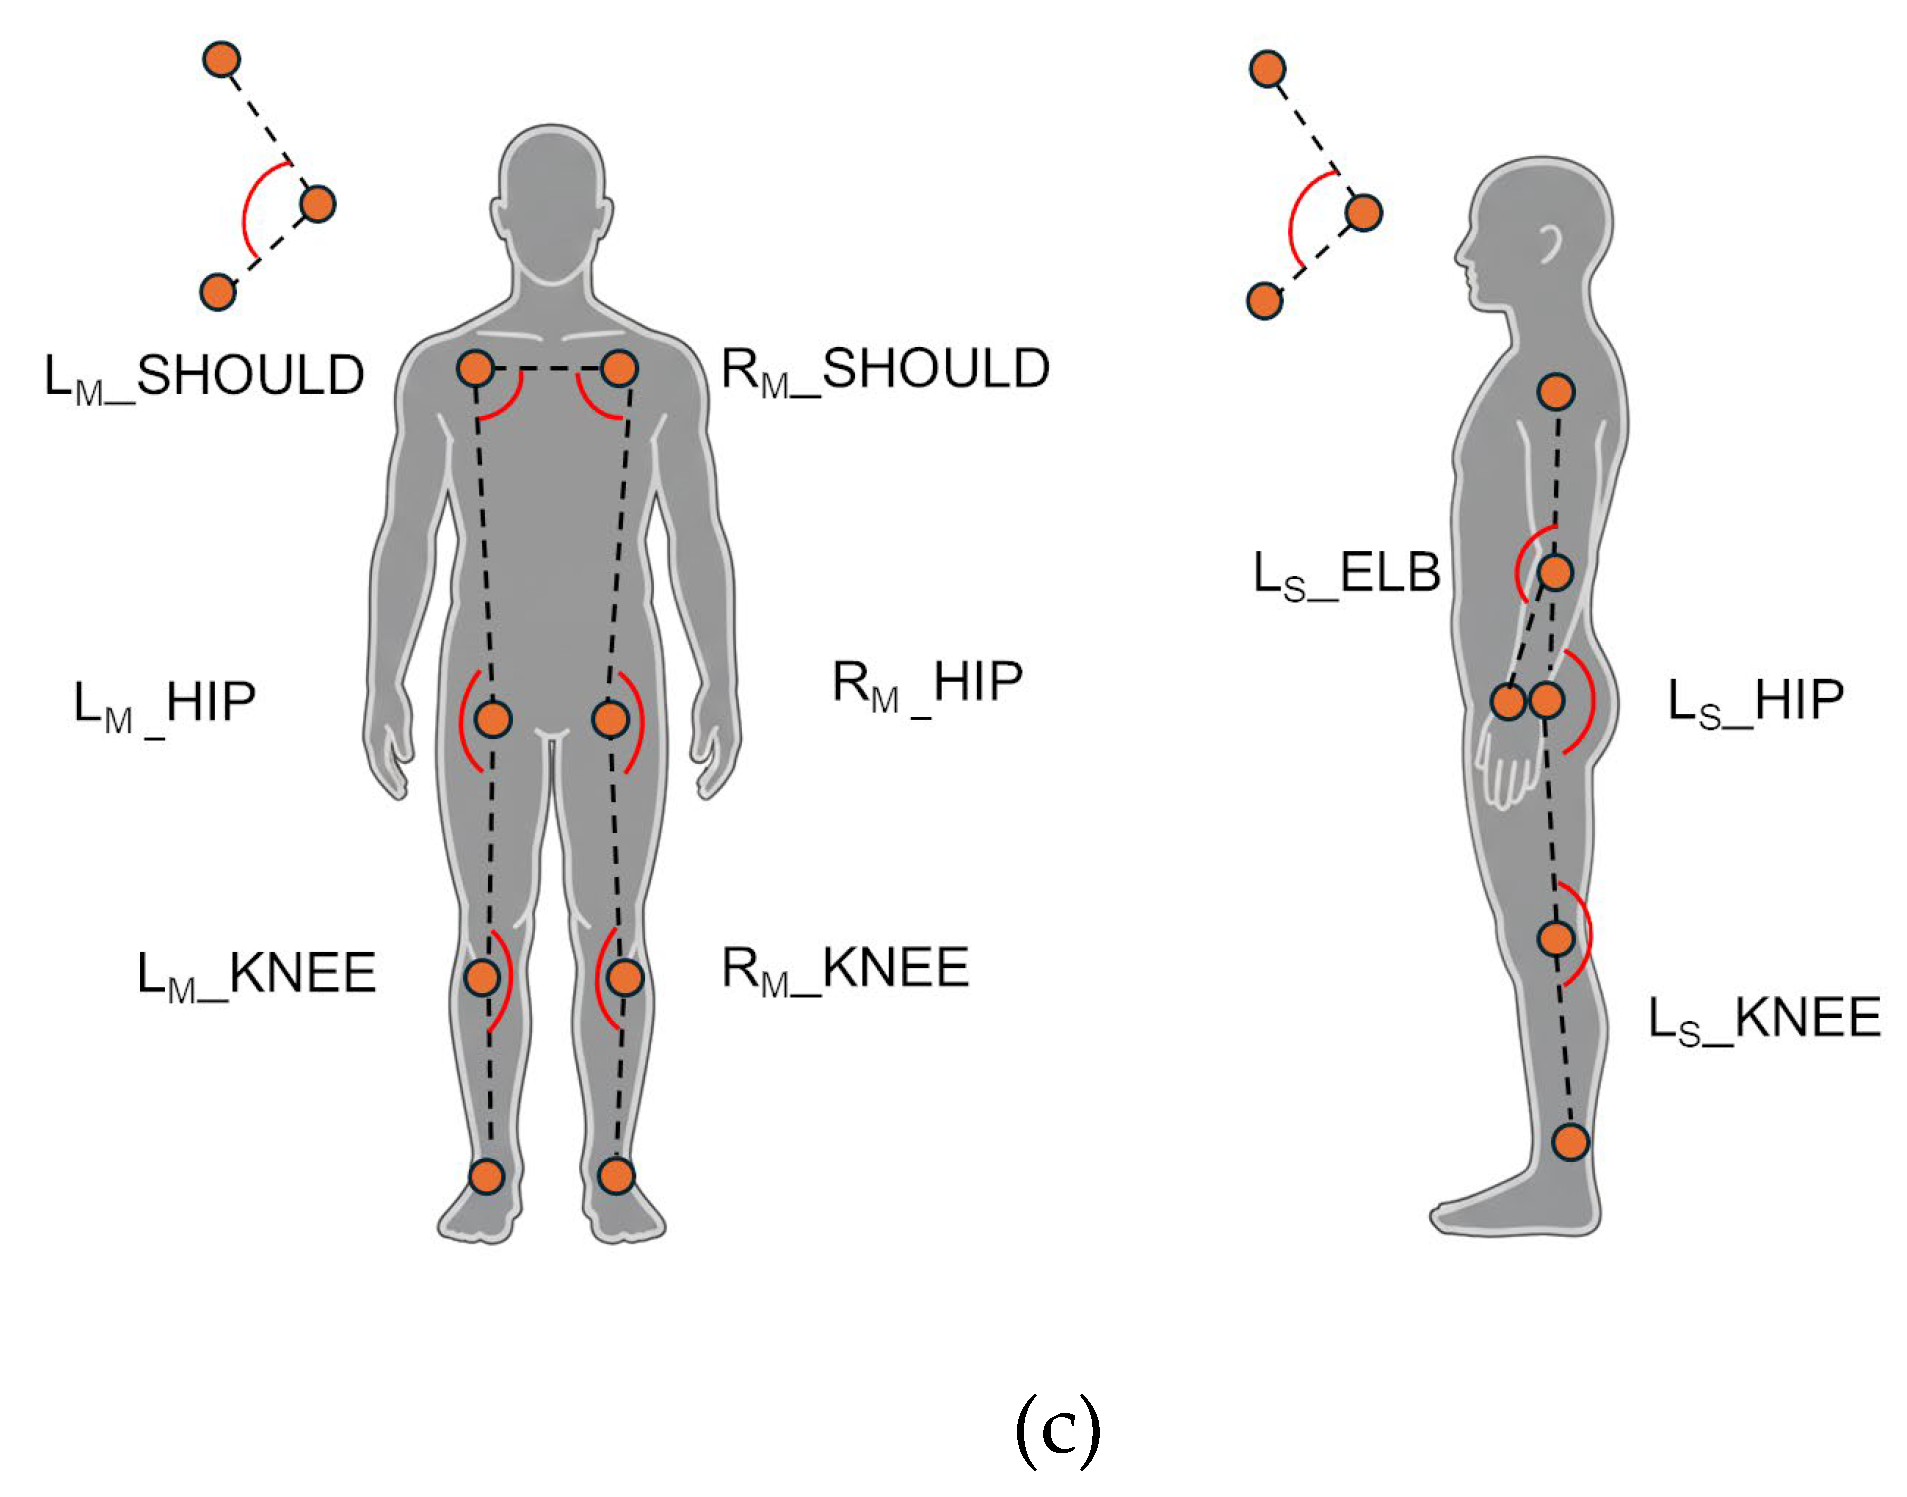
Figure 4.
Average Symmetry Index (SI) across angles and models. Symbols indicate statistical significance of MP models vs. KIN_3D (*: p < 0.05, **: p < 0.01; ***: p < 0.001).
Figure 4.
Average Symmetry Index (SI) across angles and models. Symbols indicate statistical significance of MP models vs. KIN_3D (*: p < 0.05, **: p < 0.01; ***: p < 0.001).
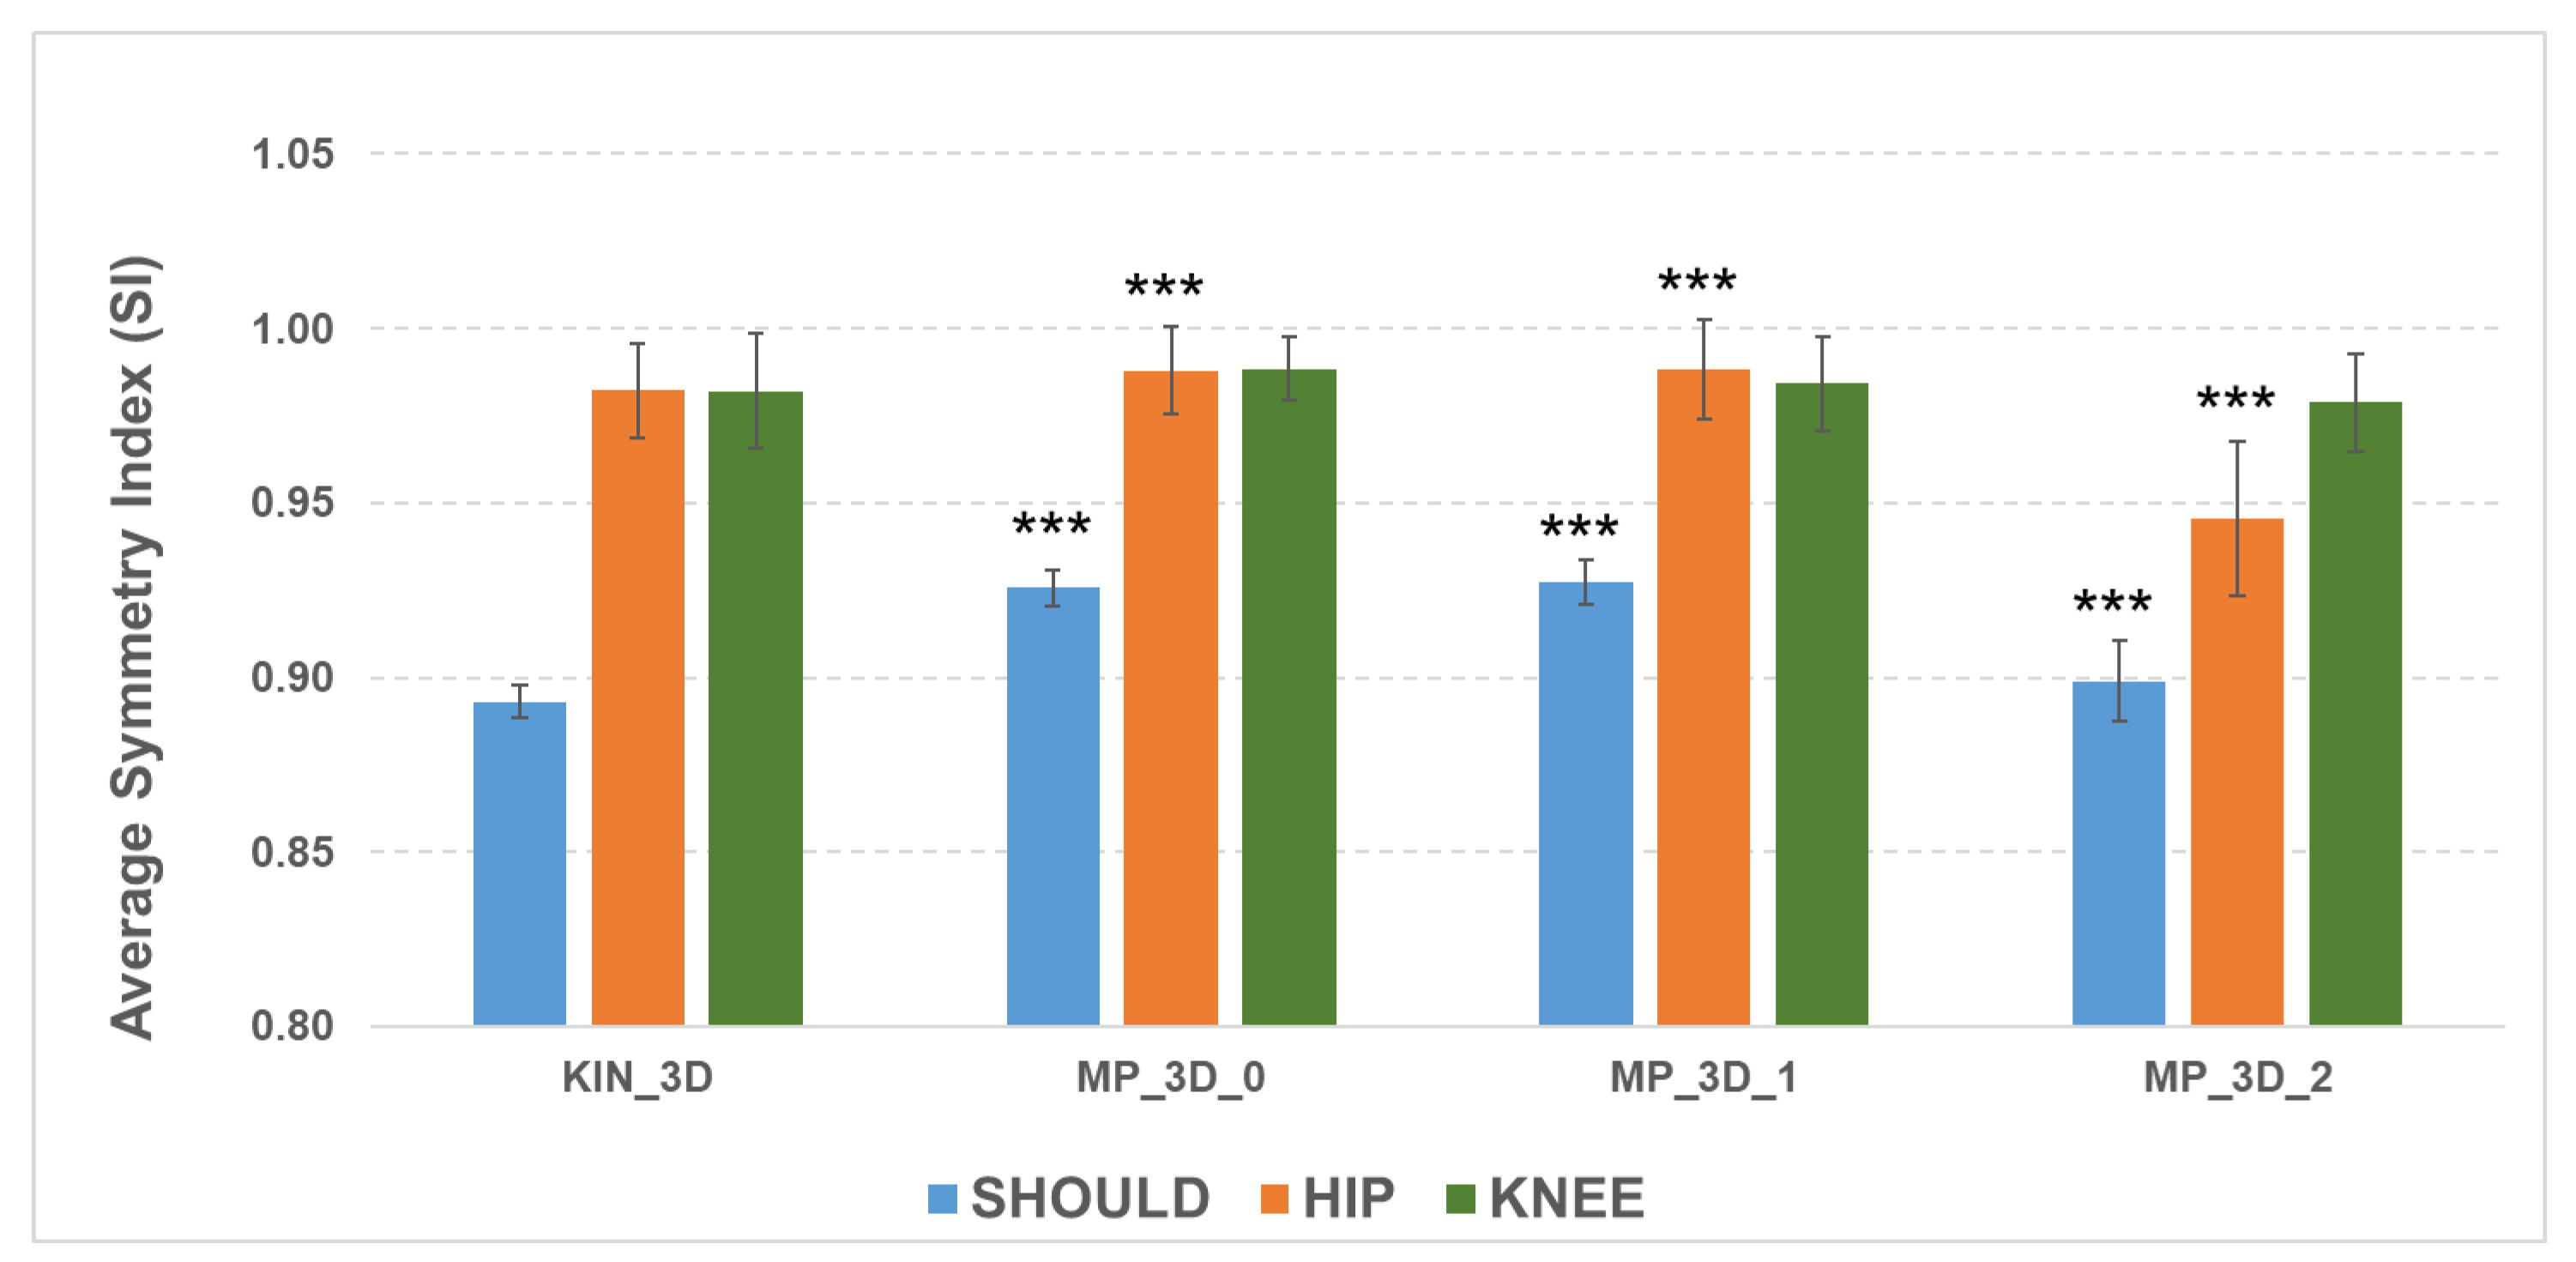
Figure 5.
Clinical scales and scores assigned by neurologists. 1: Mean value of left and right Leg Agility assessment.
Figure 5.
Clinical scales and scores assigned by neurologists. 1: Mean value of left and right Leg Agility assessment.
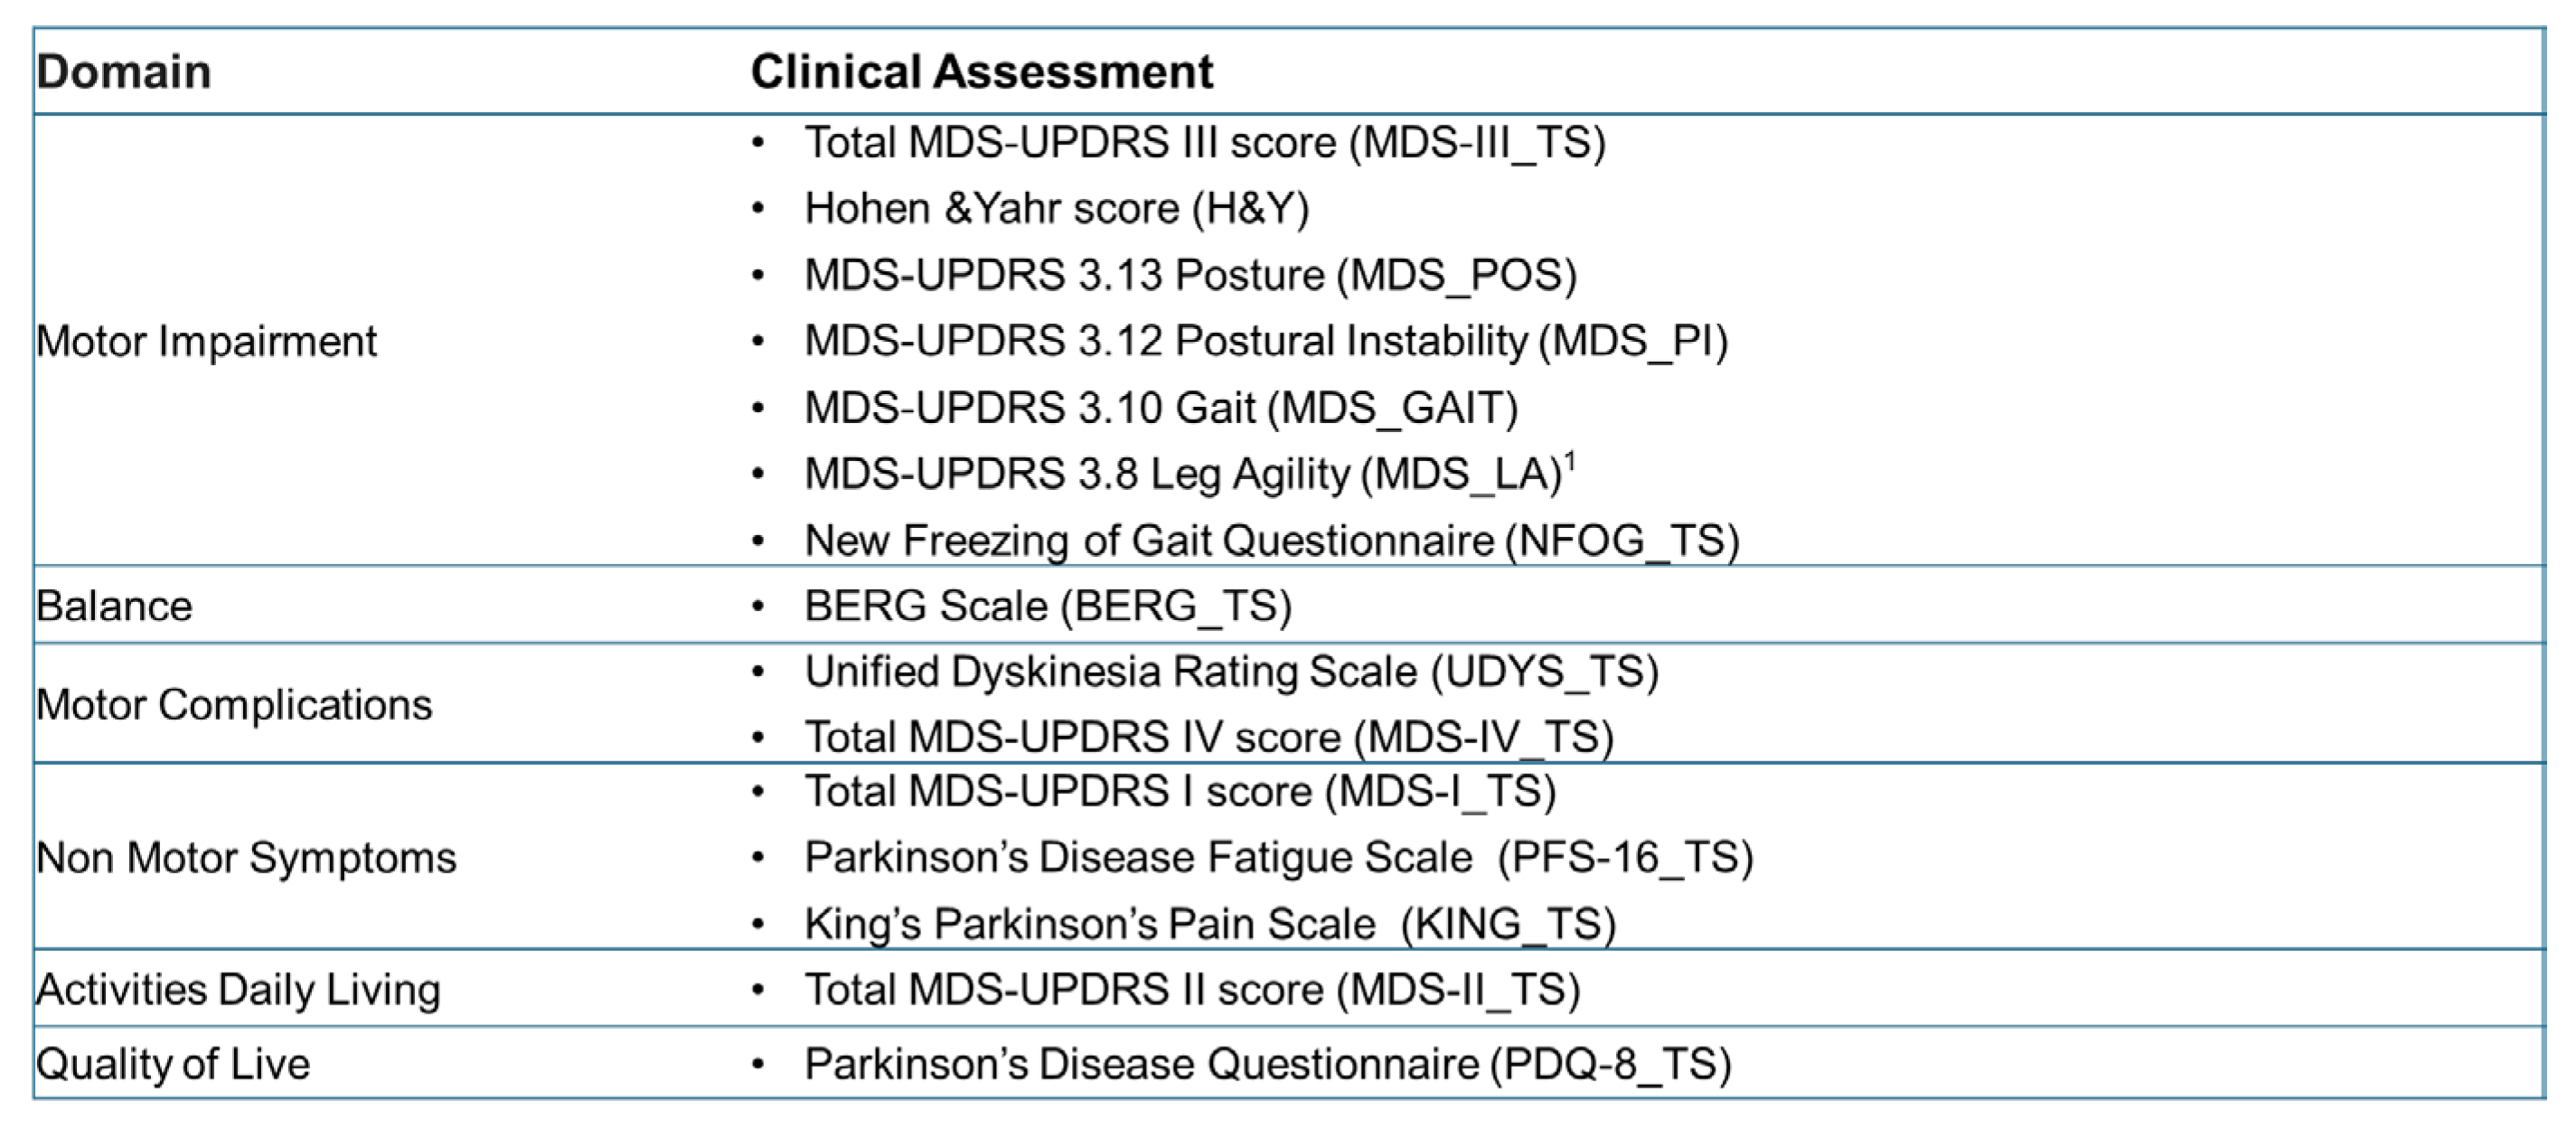
Figure 6.
Correlations between angular parameters and clinical scales/scores for KIN_3D (a), MP_3D_0 (b), and MP_3D_1 (c). Orange cells indicate correlations with |ρ| > 0.3 for KIN_3D and those shared by MP_3D_0 (b) and MP_3D_1 (c). Blue cells highlight additional correlations with |ρ| > 0.3 unique to the MP models.
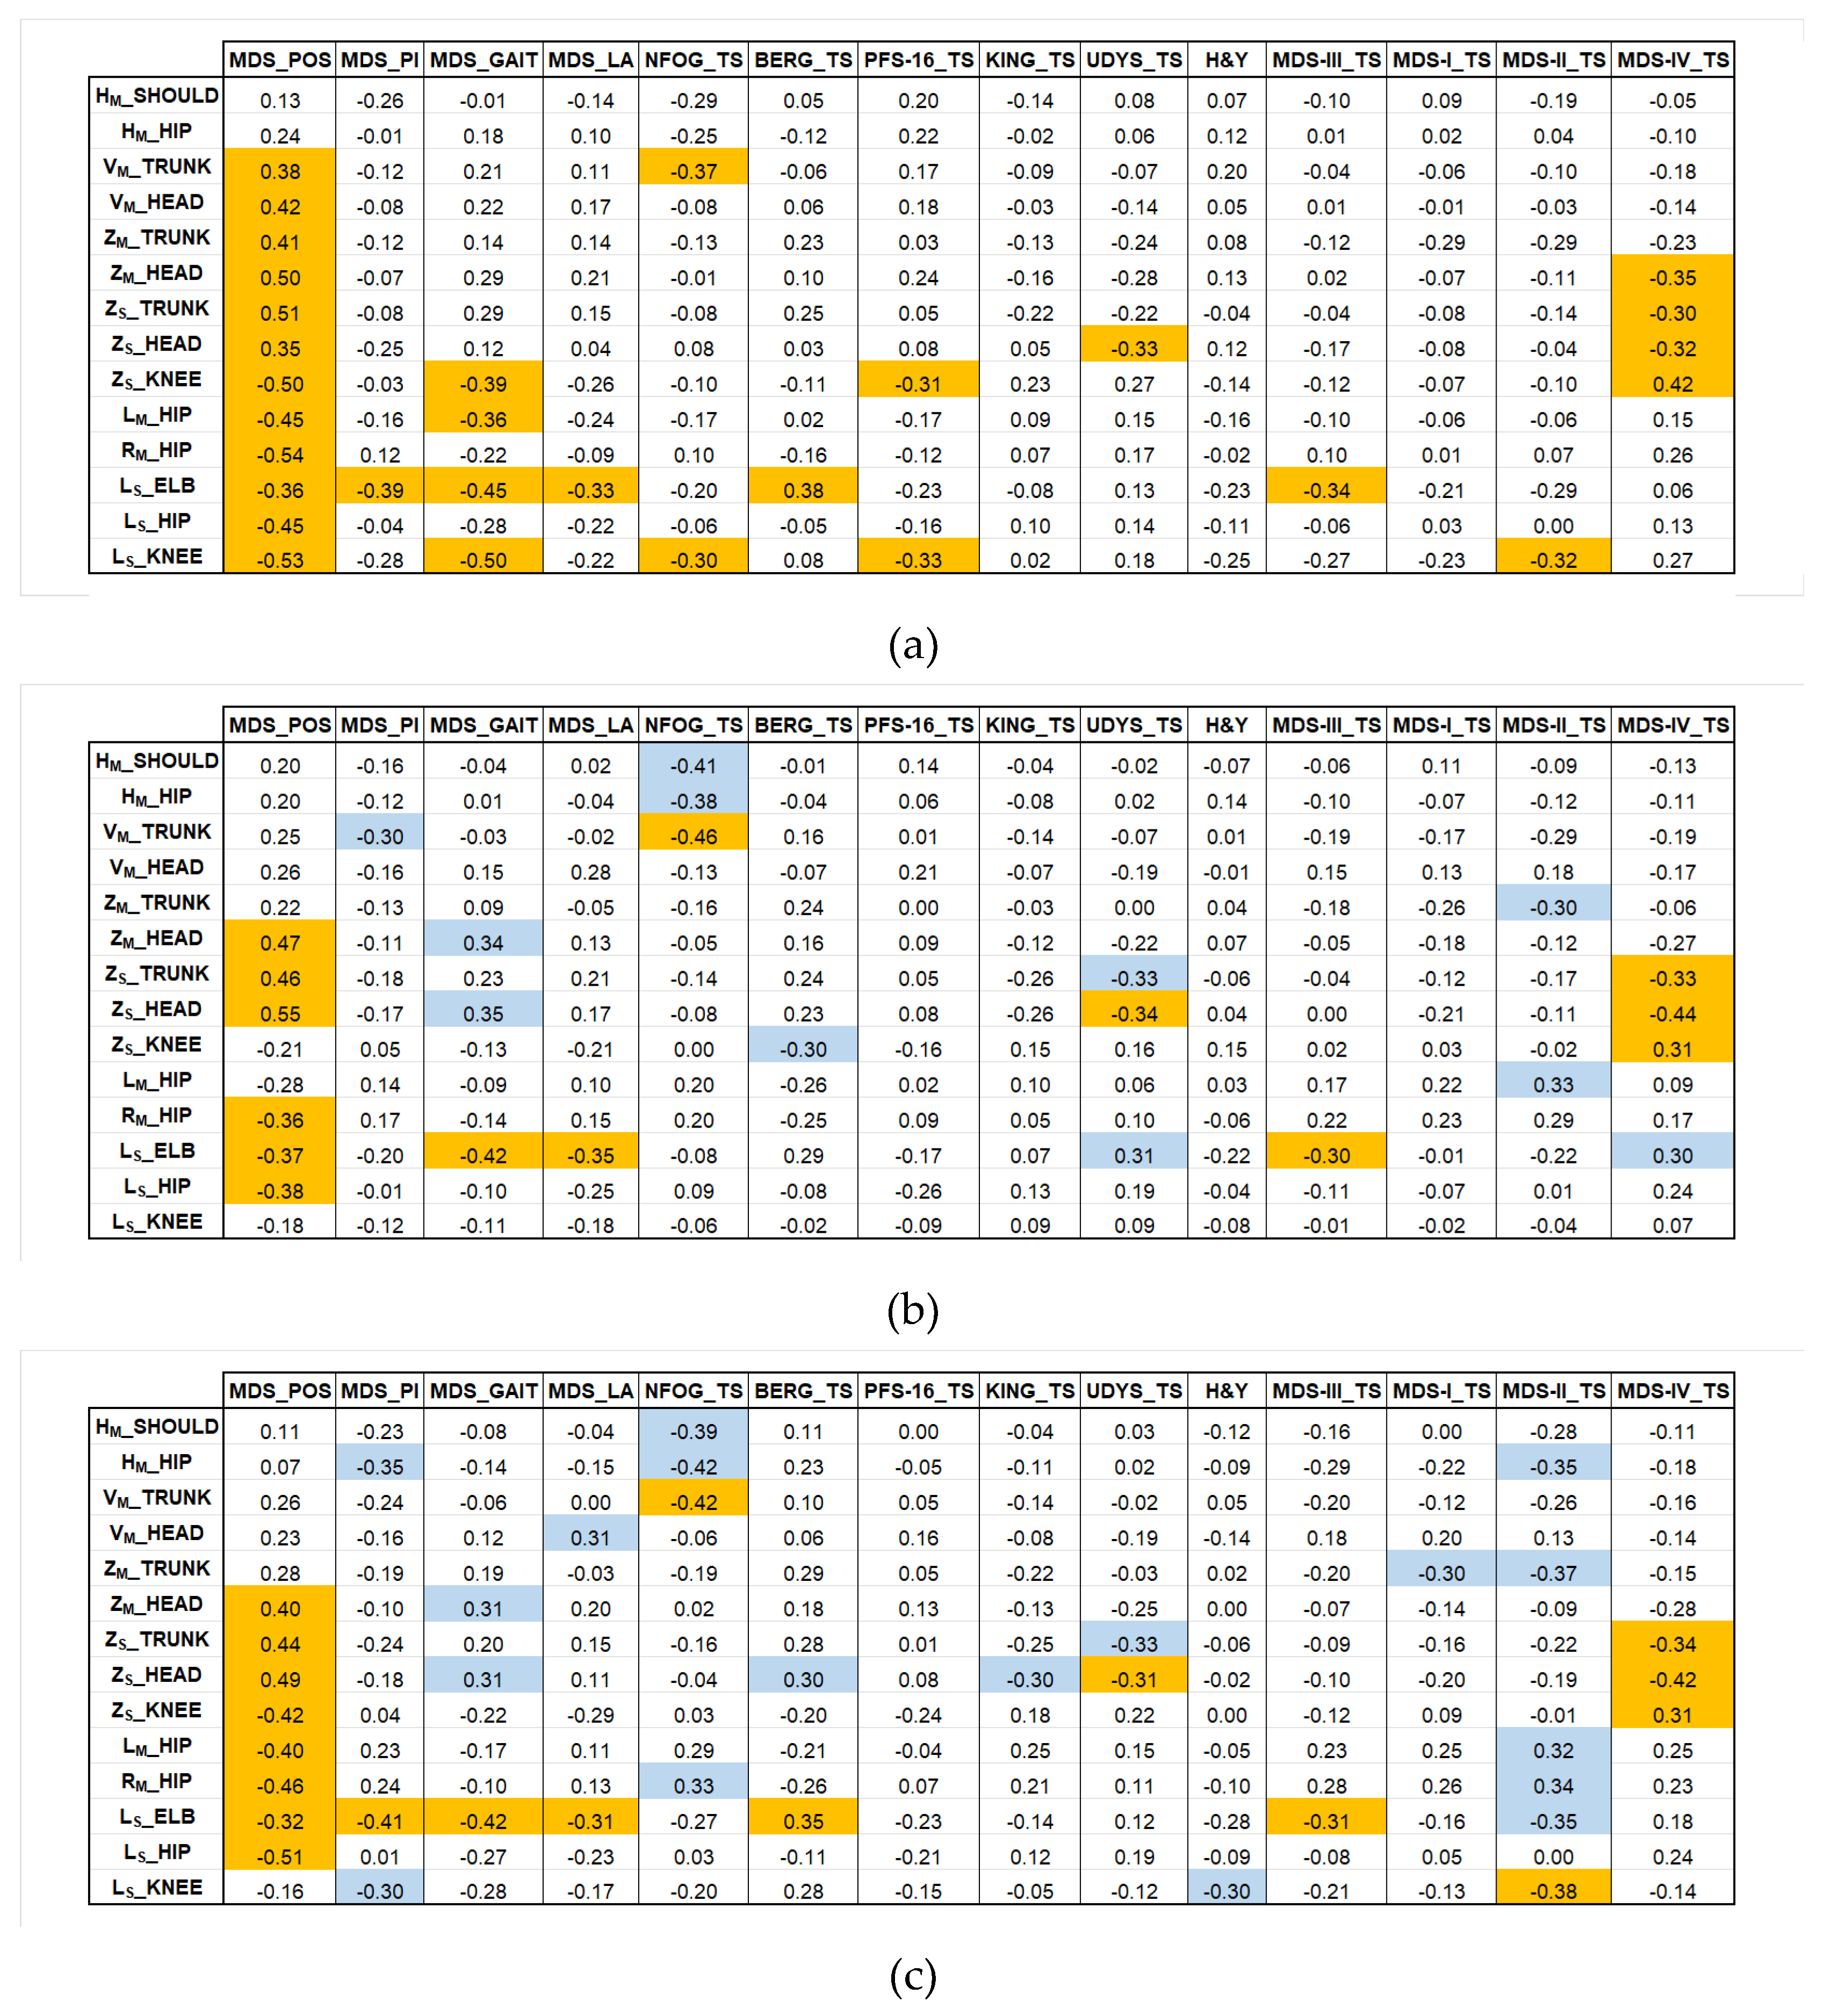
Figure 7.
PCA components that discriminate the 2 Clusters related to posture clinical severity across all models.
Figure 7.
PCA components that discriminate the 2 Clusters related to posture clinical severity across all models.
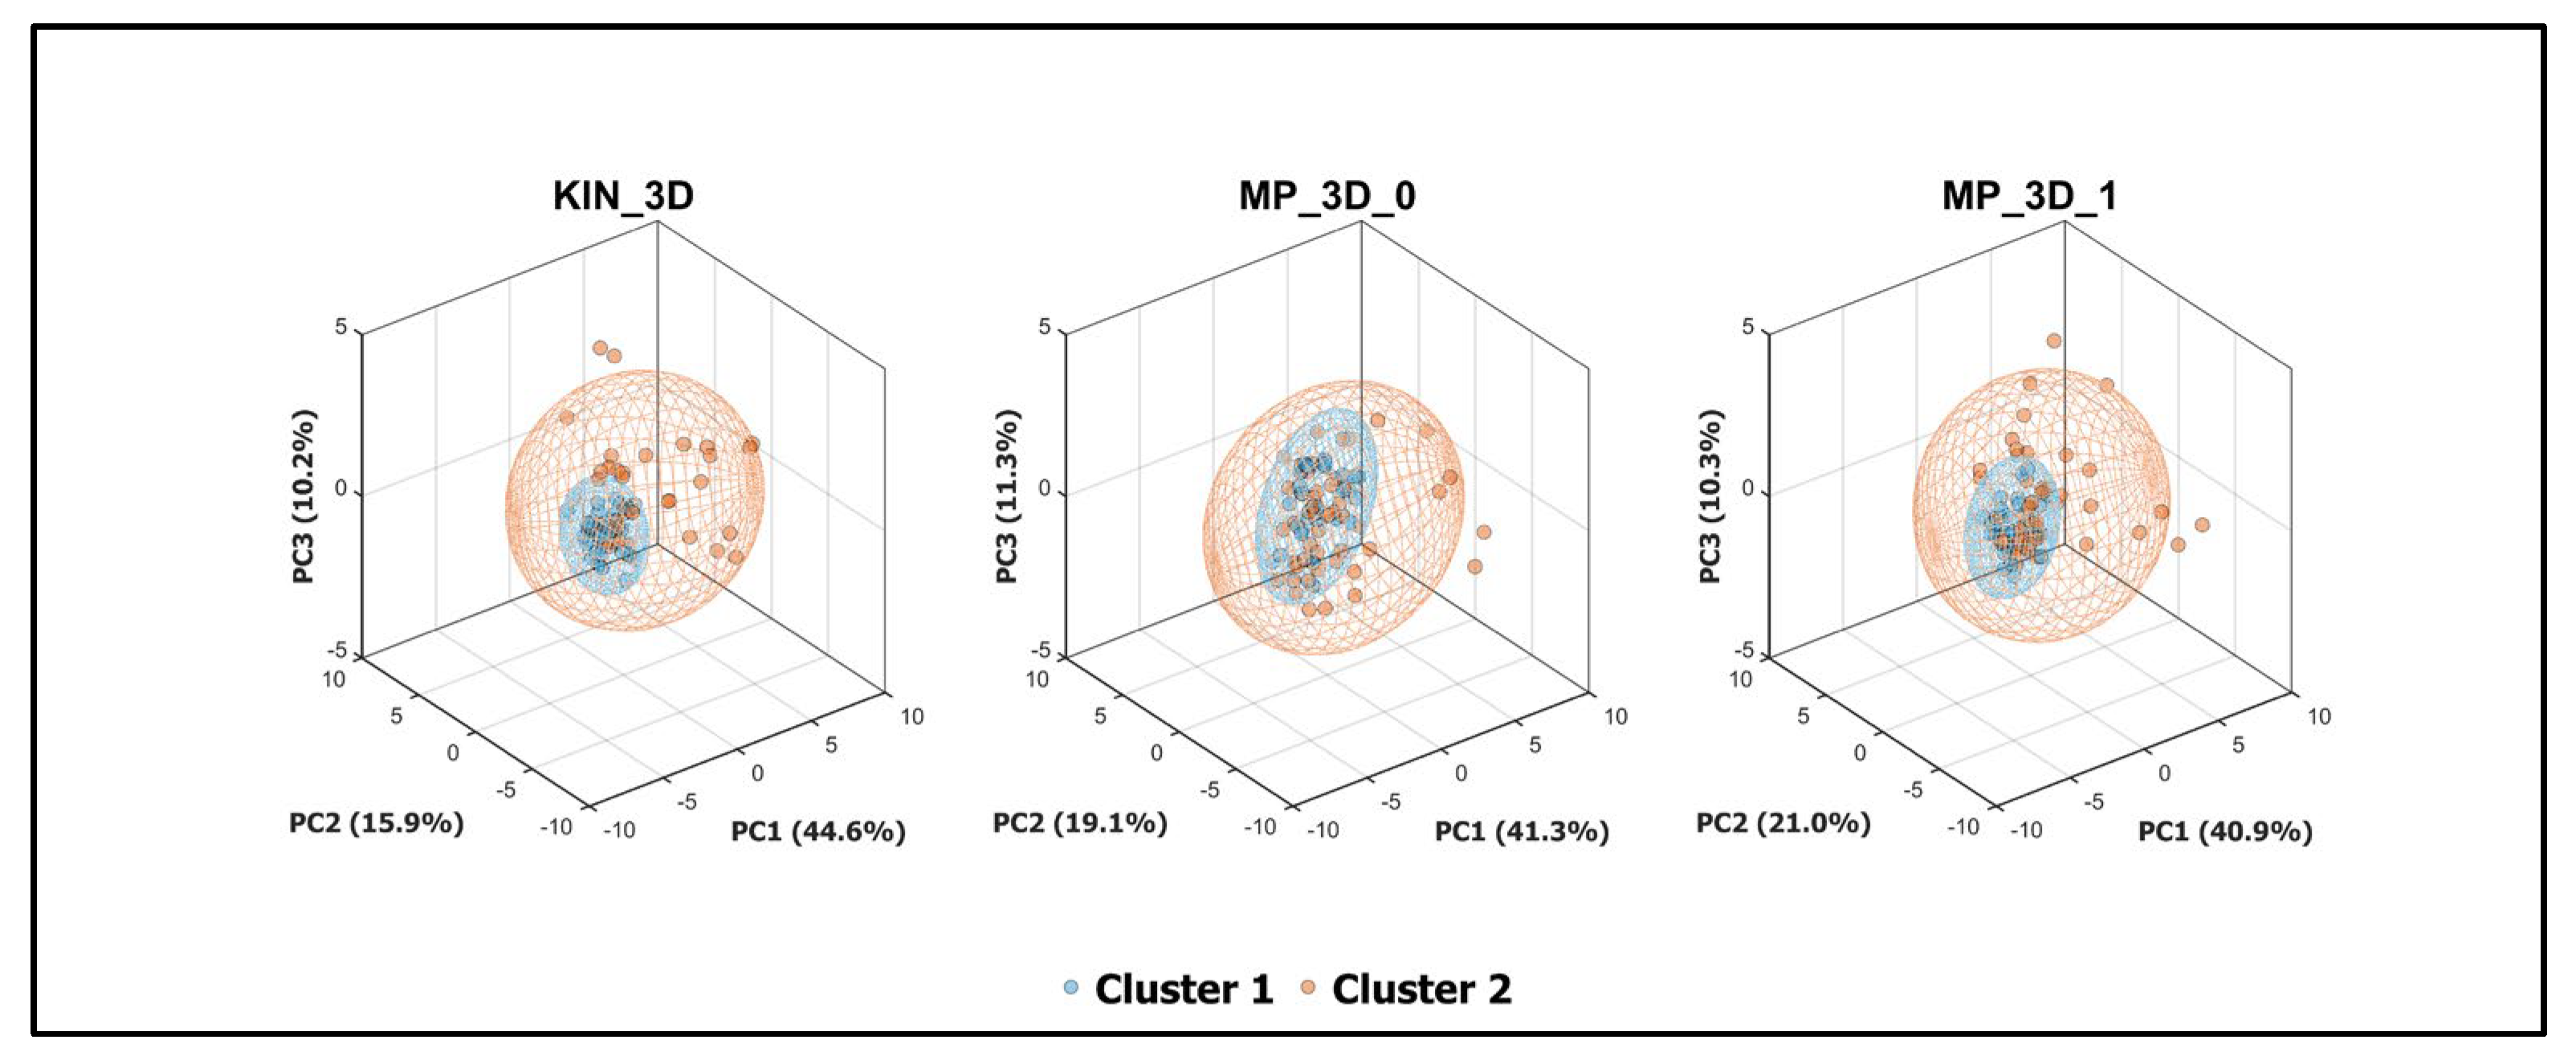
Figure 8.
Weights of angular measurements in the first principal components (PC1) across all models.
Figure 8.
Weights of angular measurements in the first principal components (PC1) across all models.
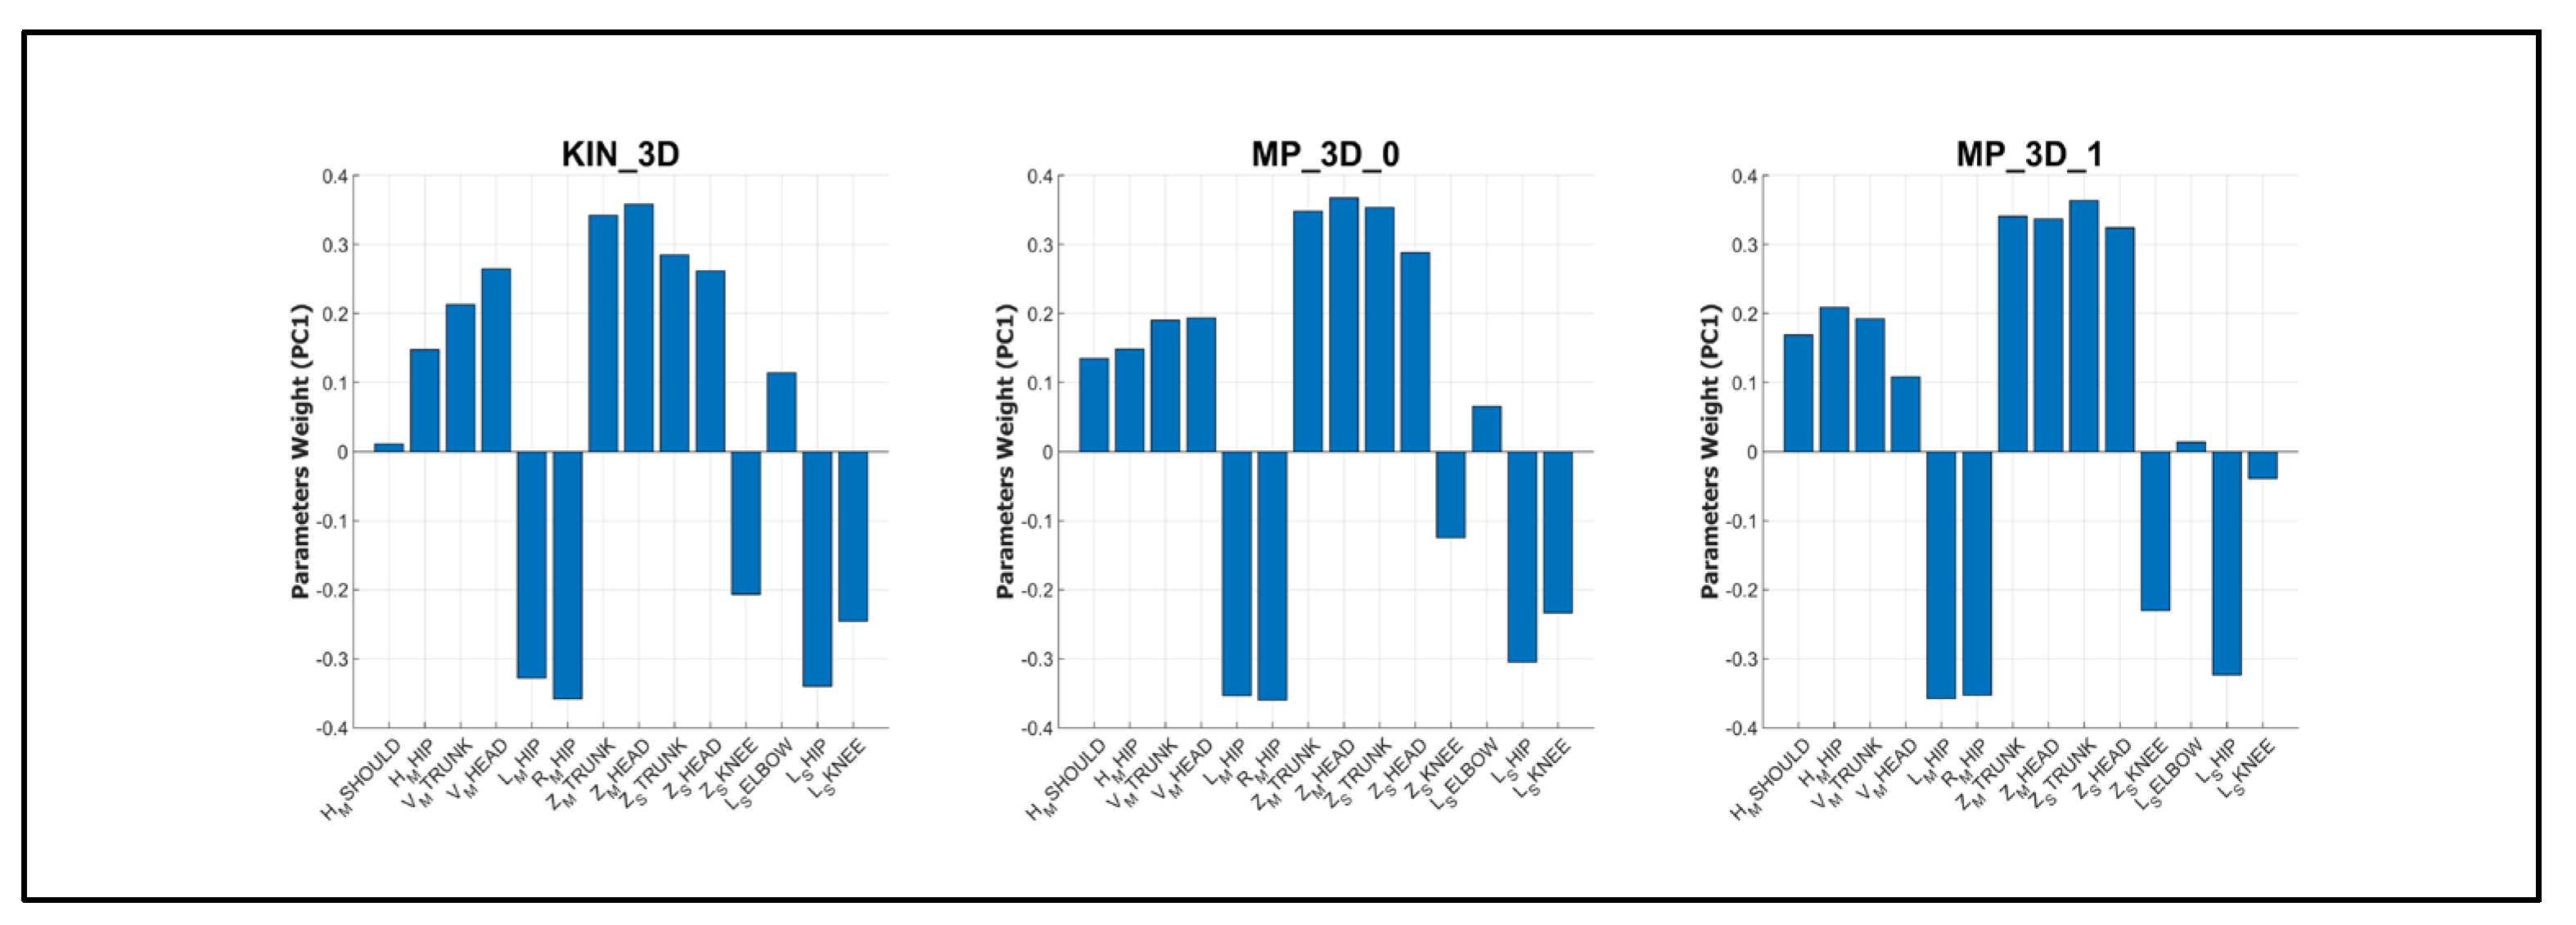

Table 1.
Mean and standard deviation for horizontal angles across all 3D models1.
| Parameter | MP_3D_0 | MP_3D_1 | MP_3D_2 | KIN_3D |
|---|---|---|---|---|
| HM_SHOULD (°) | 3.88±0.67 | 3.86±0.63 | 12.19±0.60*** | 4.22±0.90 |
| HM_HIP (°) | 2.87±0.43 | 2.86±0.40 | 3.36±0.41 | 3.04±0.67 |
| HM_KNEE (°) | 4.43±1.19*** | 7.70±1.04*** | 26.45±1.00*** | 2.81±0.63 |
| HM_ANKLE (°) | 6.36±1.44*** | 7.85±1.46*** | 9.70±0.93*** | 3.39±0.94 |
1 Symbols indicate statistical significance (*: p < 0.05, **: p < 0.01; ***: p < 0.001) between the MP model and KIN_3D.
Table 2.
Pearson’s correlation coefficients (ρ) between MP models (complexity 0, 1, and 2) and KIN 3D 1.
Table 2.
Pearson’s correlation coefficients (ρ) between MP models (complexity 0, 1, and 2) and KIN 3D 1.
| Parameter | MP_3D_0 vs. KIN_3D |
MP_3D_1 vs. KIN_3D |
MP_3D_2 vs. KIN_3D |
MP_3D_0 vs. MP_3D_1 |
MP_3D_0 vs. MP_3D_2 |
MP_3D_1 vs. MP_3D_2 |
|---|---|---|---|---|---|---|
| HM_SHOULD | 0.72*** | 0.72*** | 0.52*** | 0.85*** | 0.57*** | 0.61*** |
| HM_HIP | 0.73*** | 0.57*** | 0.49*** | 0.72*** | 0.73*** | 0.87*** |
| HM_KNEE | 0.13 | 0.22* | -0.06 | -0.02 | 0.18 | 0.65*** |
| HM_ANKLE | -0.04 | 0.24* | 0.09 | -0.08 | -0.17 | 0.85*** |
1 Symbols indicate statistical significance (*: p < 0.05, **: p < 0.01; ***: p < 0.001).
Table 3.
Mean and standard deviation for vertical angles across all 3D models1.
| Parameter | MP_3D_0 | MP_3D_1 | MP_3D_2 | KIN_3D |
|---|---|---|---|---|
| VM_TRUNK (°) | 3.92±0.55* | 3.97±0.53** | 4.45±0.51*** | 3.44±0.58 |
| VM_HEAD (°) | 12.98±3.44 | 13.17±2.85 | 17.58±3.66 | 17.69±4.54 |
| VM_ANKLE (°) | 1.78±0.41 | 2.15±0.43* | 1.67±0.38 | 1.57±0.46 |
1 Symbols indicate statistical significance (*: p < 0.05, **: p < 0.01; ***: p < 0.001) between the MP model and KIN_3D.
Table 4.
Pearson’s correlation coefficients (ρ) between MP models (complexity 0, 1, and 2) and KIN 3D 1.
Table 4.
Pearson’s correlation coefficients (ρ) between MP models (complexity 0, 1, and 2) and KIN 3D 1.
| Parameter | MP_3D_0 vs. KIN_3D |
MP_3D_1 vs. KIN_3D |
MP_3D_2 vs. KIN_3D |
MP_3D_0 vs. MP_3D_1 |
MP_3D_0 vs. MP_3D_2 |
MP_3D_1 vs. MP_3D_2 |
|---|---|---|---|---|---|---|
| VM_TRUNK | 0.84*** | 0.87*** | 0.79*** | 0.93*** | 0.94*** | 0.87*** |
| VM_HEAD | 0.45*** | 0.44*** | 0.76*** | 0.84*** | 0.55*** | 0.37** |
| VM_ANKLE | 0.04 | 0.05 | 0.16 | 0.69*** | 0.70*** | 0.81*** |
1 Symbols indicate statistical significance (*: p < 0.05, **: p < 0.01; ***: p < 0.001).
Table 5.
Mean and standard deviation for sagittal angles across all 3D models1.
| Parameter | MP_3D_0 | MP_3D_1 | MP_3D_2 | KIN_3D |
|---|---|---|---|---|
| ZM_TRUNK (°) | 109.55±1.43*** | 109.18±1.23*** | 109.52±1.18*** | 99.93±1.16 |
| ZM_HEAD (°) | 143.67±1.56*** | 143.58±1.48*** | 159.44±1.11*** | 101.40±2.44 |
| ZM_KNEE (°) | 88.04±0.99*** | 90.99±1.00** | 88.33±1.01*** | 93.64±0.86 |
| ZM_ANKLE (°) | 114.59±0.99*** | 112.77±1.08*** | 113.54±1.07*** | 107.92±0.83 |
| ZS_TRUNK (°) | 87.91±0.89*** | 90.59±0.99*** | 89.58±1.01*** | 86.11±1.12 |
| ZS_HEAD (°) | 155.93±1.62*** | 157.06±1.59*** | 166.27±1.74*** | 134.48±1.73 |
| ZS_KNEE (°) | 88.72±0.96 | 84.47±0.79*** | 86.87±0.84*** | 88.92±0.78 |
| ZS_ANKLE (°) | 93.84±1.05 | 92.66±0.91*** | 102.90±0.78*** | 94.72±0.79 |
1 Symbols indicate statistical significance (*: p < 0.05, **: p < 0.01; ***: p < 0.001) between the MP model and KIN_3D.
Table 6.
Pearson’s correlation coefficients (ρ) between MP models (complexity 0, 1, and 2) and KIN 3D 1.
Table 6.
Pearson’s correlation coefficients (ρ) between MP models (complexity 0, 1, and 2) and KIN 3D 1.
| Parameter | MP_3D_0 vs. KIN_3D |
MP_3D_1 vs. KIN_3D |
MP_3D_2 vs. KIN_3D |
MP_3D_0 vs. MP_3D_1 |
MP_3D_0 vs. MP_3D_2 |
MP_3D_1 vs. MP_3D_2 |
|---|---|---|---|---|---|---|
| ZM_TRUNK | 0.75*** | 0.65*** | 0.63*** | 0.81*** | 0.80*** | 0.89*** |
| ZM_HEAD | 0.72*** | 0.77*** | 0.70*** | 0.93*** | 0.93*** | 0.95*** |
| ZM_KNEE | 0.17 | 0.28* | 0.36** | 0.66*** | 0.49*** | 0.76*** |
| ZM_ANKLE | 0.25* | 0.21 | 0.39** | 0.76*** | 0.75*** | 0.79*** |
| ZS_TRUNK | 0.89*** | 0.87*** | 0.87*** | 0.98*** | 0.98*** | 0.98*** |
| ZS_HEAD | 0.53*** | 0.46*** | 0.30** | 0.93*** | 0.78*** | 0.79*** |
| ZS_KNEE | 0.72*** | 0.73*** | 0.56*** | 0.73*** | 0.64*** | 0.68*** |
| ZS_ANKLE | 0.35** | 0.48*** | 0.65*** | 0.47*** | 0.51*** | 0.52*** |
1 Symbols indicate statistical significance (*: p < 0.05, **: p < 0.01; ***: p < 0.001).
Table 7.
Mean and standard deviation for joint angles across all 3D models1.
| Parameter | MP_3D_0 | MP_3D_1 | MP_3D_2 | KIN_3D |
|---|---|---|---|---|
| LM_SHOULD (°) | 83.07±0.70*** | 80.90±0.60* | 75.24±0.51*** | 79.98±0.85 |
| RM_SHOULD (°) | 96.40±0.71*** | 93.57±0.60*** | 92.18±0.64*** | 99.10±0.85 |
| LM_HIP (°) | 156.64±1.78*** | 162.22±1.60 | 164.80±1.61 | 163.46±1.35 |
| RM_HIP (°) | 156.83±1.84*** | 159.77±1.76*** | 148.02±1.58*** | 162.36±1.26 |
| LM_KNEE (°) | 153.10±1.20*** | 159.56±1.20*** | 155.05±1.29*** | 165.00±1.42 |
| RM_KNEE (°) | 153.25±1.38*** | 155.78±1.53*** | 152.06±1.40*** | 165.81±1.39 |
| LS_ELB (°) | 143.47±1.78* | 148.53±1.68** | 160.95±1.57*** | 145.66±3.44 |
| LS_HIP (°) | 162.47±1.82 | 162.20±1.96 | 168.60±1.87*** | 163.94±1.25 |
| LS_KNEE (°) | 163.01±1.54*** | 165.91±1.29 | 157.73±1.50*** | 167.09±1.30 |
1 Symbols indicate statistical significance (*: p < 0.05, **: p < 0.01; ***: p < 0.001) between the MP model and KIN_3D.
Table 8.
Pearson’s correlation coefficients (ρ) between MP models (complexity 0, 1, and 2) and KIN 3D 1.
Table 8.
Pearson’s correlation coefficients (ρ) between MP models (complexity 0, 1, and 2) and KIN 3D 1.
| Parameter | MP_3D_0 vs. KIN_3D |
MP_3D_1 vs. KIN_3D |
MP_3D_2 vs. KIN_3D |
MP_3D_0 vs. MP_3D_1 |
MP_3D_0 vs. MP_3D_2 |
MP_3D_1 vs. MP_3D_2 |
|---|---|---|---|---|---|---|
| LM_SHOULD (°) | 0.25* | 0.24* | 0.15 | 0.73*** | 0.63*** | 0.59*** |
| RM_SHOULD (°) | 0.21 | 0.26* | 0.02 | 0.60*** | 0.66*** | 0.54*** |
| LM_HIP (°) | 0.51*** | 0.56*** | 0.56*** | 0.80*** | 0.73*** | 0.82*** |
| RM_HIP (°) | 0.71*** | 0.72*** | 0.72*** | 0.86*** | 0.83*** | 0.89*** |
| LM_KNEE (°) | -0.10 | 0.16 | 0.17 | 0.41*** | 0.43*** | 0.62*** |
| RM_KNEE (°) | 0.14 | 0.21 | 0.28* | 0.64*** | 0.62*** | 0.83*** |
| LS_ELB (°) | 0.71*** | 0.77*** | 0.76*** | 0.78*** | 0.78*** | 0.79*** |
| LS_HIP (°) | 0.62*** | 0.71*** | 0.72*** | 0.81*** | 0.80*** | 0.88*** |
| LS_KNEE (°) | 0.43*** | 0.36*** | 0.52*** | 0.59*** | 0.52*** | 0.64*** |
1 The symbols indicate statistically significant correlation (*: p < 0.05, **: p < 0.01; ***: p < 0.001).
Table 9.
Comparison between postural severity clusters across all models1.
| Parameter | MP_3D_0 | MP_3D_1 | KIN_3D | |||
|---|---|---|---|---|---|---|
| Cluster 1 | Cluster 2 | Cluster 1 | Cluster 2 | Cluster 1 | Cluster 2 | |
| HM_SHOULD (°) | 3.04±0.63 | 4.38±0.70 | 3.55±0.61 | 4.04±0.64 | 3.37±0.93 | 4.72±0.88 |
| HM_HIP (°) | 2.44±0.44 | 3.13±0.43 | 2.65±0.40 | 2.99±0.40 | 2.49±0.66 | 3.37±0.67 |
| VM_TRUNK (°) | 3.14±0.51 | 4.37±0.58 | 3.05±0.51 | 4.51±0.55 | 2.26±0.54 | 4.13±0.61 |
| VM_HEAD (°) | 9.87±2.23 | 14.81±4.15 | 10.81±2.39 | 14.56±3.12 | 10.48±3.28 | 21.93±5.28 |
| ZM_TRUNK (°) | 108.91±1.18 | 109.93±1.58 | 107.85±1.09 | 109.96±1.31 | 97.45±0.99 | 101.39±1.26 |
| ZM_HEAD (°) | 140.53±1.32 | 145.52±1.70† | 141.34±1.29 | 144.90±1.59* | 95.51±2.10 | 104.86±2.64† |
| ZS_TRUNK (°) | 85.16±0.83 | 89.52±0.92‡ | 87.17±0.83 | 92.60±1.09‡ | 82.15±1.06 | 88.44±1.14‡ |
| ZS_HEAD (°) | 150.65±1.55 | 159.03±1.65‡ | 152.25±1.72 | 159.89±1.51‡ | 131.13±1.62 | 136.44±1.80 |
| ZS_KNEE (°) | 89.63±0.86 | 88.18±1.02 | 86.15±0.74 | 83.48±0.81† | 91.02±0.73 | 87.69±0.81‡ |
| LM_HIP (°) | 158.35±1.50 | 155.63±1.94 | 165.25±1.42 | 160.43±1.70* | 167.24±1.10 | 161.23±1.49‡ |
| RM_HIP (°) | 159.97±1.61 | 154.98±1.98* | 164.27±1.66 | 157.12±1.83* | 167.00±0.98 | 159.63±1.42‡ |
| LS_ELB (°) | 146.72±1.73 | 141.56±1.82† | 151.15±1.53 | 146.99±1.76 | 149.02±3.48 | 143.69±3.42 |
| LS_HIP (°) | 164.26±1.58 | 161.41±1.97 | 167.37±1.45 | 159.15±2.26† | 167.10±0.98 | 162.08±1.41† |
| LS_KNEE (°) | 163.22±1.30 | 162.89±1.67 | 166.55±1.01 | 165.54±1.46 | 171.67±1.10 | 164.39±1.41‡ |
1: Symbols indicate statistical significance difference between Cluster 1 and Cluster 2 (*: p < 0.05; †: p < 0.01; ‡: p < 0.001).
Disclaimer/Publisher’s Note: The statements, opinions and data contained in all publications are solely those of the individual author(s) and contributor(s) and not of MDPI and/or the editor(s). MDPI and/or the editor(s) disclaim responsibility for any injury to people or property resulting from any ideas, methods, instructions or products referred to in the content. |
© 2026 by the authors. Licensee MDPI, Basel, Switzerland. This article is an open access article distributed under the terms and conditions of the Creative Commons Attribution (CC BY) license (http://creativecommons.org/licenses/by/4.0/).
Copyright: This open access article is published under a Creative Commons CC BY 4.0 license, which permit the free download, distribution, and reuse, provided that the author and preprint are cited in any reuse.


