
Submitted:
15 January 2026
Posted:
15 January 2026
You are already at the latest version
Abstract
Background/Objectives: Dysregulation of purinergic signaling influences tumor progression and immune evasion in hepatocellular carcinoma (HCC). We aimed to characterize the transcriptional landscape of this system, identify prognostic markers, and investigate how the tumor microenvironment modulates pharmacological response to combined sorafenib and doxazosin in 3D spheroid models. Methods: We integrated RNA-seq data from the TCGA-LIHC to identify differentially expressed genes, pathway enrichment, gene co-expression networks, prognostic associations, and machine learning-based biomarker selection. Modulation of key targets was assessed in HepG2 and HepG2/LX-2 spheroids treated with sorafenib and doxazosin using qPCR and flow cytometry. Results: Transcriptomics revealed dysregulation and network fragmentation, where high expression of ADA, NT5E, and ADORA1 correlated with poor overall survival. In 3D models, co-treatment significantly downregulated NT5E and ADORA1 mRNA expression, while ADORA2A was specifically reduced in the co-culture setting. For ADA, effect size analysis revealed a large magnitude of inhibition in HepG2 spheroids. Although flow cytometry showed high CD73 protein expression remained stable across treatments in co-culture, the combination therapy successfully overcame stromal protection, significantly increasing apoptosis (active caspase-3) in both mono- and co-culture spheroids compared to vehicle and monotherapy. Conclusions: We identified a purinergic prognostic signature in HCC and demonstrated that the combination therapy of sorafenib and doxazosin targets the adenosine-generating axis and specific receptors. We show that the stromal microenvironment sustains CD73 protein expression even under transcriptional inhibition, highlighting the critical role of 3D co-culture models in deciphering therapeutic resistance mechanisms.
Keywords:
sorafenib
; doxazosin
; NT5E
; hepatic stellate cells
; drug resistance
1. Introduction
Hepatocellular carcinoma (HCC) ranks as the sixth most frequent malignancy and the third leading cause of cancer-related mortality worldwide, with a steadily increasing incidence [1]. Chronic necroinflammation is a primary driver of hepatocarcinogenesis, inducing chromosomal instability and malignant transformation of proliferating hepatocytes. Major risk factors include chronic Hepatitis B and C infections, alcohol abuse, and metabolic disorders such as metabolic-associated steatotic liver disease (MASLD) [3]. Furthermore, liver cirrhosis is detected in approximately 90% of HCC patients, highlighting the critical role of fibrotic remodeling in tumor development [4]. Despite surveillance programs, most patients are diagnosed at intermediate or advanced stages, where curative options like resection or transplantation are no longer viable, resulting in a poor prognosis [4,5].
The hepatic tumor microenvironment (TME) plays a pivotal role in disease progression and therapeutic resistance. Hepatic Stellate Cells (HSCs), typically quiescent vitamin A-storing pericytes, undergo activation in response to liver injury, transdifferentiating into proliferative, extracellular matrix-producing myofibroblasts [6]. In the liver TME, activated HSCs are the main source of cancer-associated fibroblasts (CAFs), secreting growth factors (e.g., TGF-β1, PDGF) that fuel tumor growth, invasion, and epithelial-mesenchymal transition (EMT). Consequently, the crosstalk between tumor cells and the stromal compartment acts as a physical and biological barrier against systemic therapies [7,8,9].
However, traditional two-dimensional (2D) monolayer cultures fail to recapitulate this complex spatial architecture and pathophysiology of the in vivo liver tissue. The lack of cell-cell interactions, extracellular matrix (ECM) deposition, and physiological oxygen and nutrients gradients in 2D models often leads to poor predictive value for drug screening [7,8,9,10]. In contrast, three-dimensional (3D) multicellular tumor spheroids (MCTS) serve as a superior preclinical model. By incorporating stromal components like HSCs, co-culture spheroids mimic the physical barriers to drug penetration and the metabolic reprogramming, such as hypoxia-driven adenosine accumulation, that characterize resistant solid tumors, offering a more reliable platform for evaluating combinatorial therapies [7,8,9,10,11].
Sorafenib, a multikinase inhibitor targeting RAF/MEK/ERK and VEGFR/PDGFR signaling, was the first approved systemic therapy for advanced HCC. [12]. While it promotes apoptosis and inhibits angiogenesis, its clinical benefit is often limited by the rapid drug resistance, partly driven by stromal interactions and the activation of compensatory survival pathways, most notably the PI3K/Akt signaling axis [13,14]. This scenario underscores the urgent need for novel therapeutic strategies.
Doxazosin, a quinazoline-derived α1-adrenergic blocker used to treat benign prostatic hyperplasia [15,16], has emerged as a promising repurposing candidate. Beyond its antihypertensive effects, doxazosin exhibits antitumor properties in prostate, breast, and glioblastoma models, often via mechanisms independent of α1-adrenoceptors, including the potent inhibition of the PI3K/Akt pathway [17,18,19]. Doxazosin also has an antifibrotic effect, acting directly on hepatic stellate cells and decreasing their activation markers, such as type I collagen and smooth muscle alpha actin [20].
Purinergic signaling consists of extracellular purines and purinergic receptors and modulates cell proliferation, invasion, and immune response during cancer progression [21,22]. The enzymes CD39 (NTPDase-1; ENTPD1), CD73 (ecto-5’-nucleotidase; NT5E), and ADA (adenosine deaminase; ADA) are expressed in immune, tumor, and stromal cells. These enzymes are responsible for regulating ATP and adenosine levels by hydrolyzing extracellular ATP in multiple steps [23]. In the context of HCC, it has been shown that CD73+ CAFs can promote chemoresistance to sorafenib and cisplatin in HCC cells. This indicates that CD73+ CAFs are a potential therapeutic target for HCC treatment [24].
Adenosine signaling connects this metabolic landscape to the drug-resistance mechanisms targeted by doxazosin. Recent evidence indicates that the activation of P1 receptors, particularly ADORA1 (A1R) and ADORA2A (A2AR), can directly trigger the PI3K/Akt/mTOR cascade, fueling tumor cell proliferation and inhibiting apoptosis [25,26]. This creates a mechanistic rationale in which the dysregulated purinergic system sustains survival pathways that counteract sorafenib efficacy [24]. Therefore, targeting the purinergic axis could re-sensitize tumor cells to therapy.
Given the high molecular heterogeneity of HCC, targeting a single gene often fails to capture the complexity of therapy resistance. Therefore, mapping the global transcriptional landscape is essential to identify robust prognostic biomarkers and drug targets within specific signaling networks. Integrative approaches that combine large-scale transcriptomic data from patient cohorts, such as The Cancer Genome Atlas (TCGA), with validatable in vitro models provide a powerful translational framework [27,28]. This strategy allows for in silico identification of dysregulated pathways and the subsequent testing of their pharmacological modulation in biologically relevant systems, bridging the gap between molecular profiling and therapeutic application.
Here, we integrated bioinformatic analysis of the TCGA – LIHC cohort with in vitro 3D spheroid models to investigate the purinergic system in HCC. We hypothesized that the dysregulated purinergic signature correlates with poor prognosis and that the combined treatment with sorafenib and doxazosin could remodel this signaling by targeting the adenosine-PI3K axis. Using HepG2 mono-cultures and HepG2/LX-2 co-cultures, we investigated whether the stromal microenvironment protects the tumor by altering purinergic targets and if combinated therapy could effectively modulate this axis.
2. Materials and Methods
2.1. RNA-Seq Data Analysis
Publicly available RNA-sequencing (RNA-seq) data and corresponding clinical information from TCGA-LIHC were retrieved from the Genomic Data Commons (GDC) portal using the TCGAbiolinks R package (v2.34.1). We selected samples processed via the “STAR - Counts” workflow to obtain raw gene expression counts. The final dataset comprised 421 samples, including 371 primary solid tumors and 50 adjacent solid tissue normal samples. Data were downloaded and prepared into a SummarizedExperiment object using the GDCdownload and GDCprepare functions, respectively. A subset of 24 genes characterizing the human purinergic system was selected for downstream analysis, including P2X receptors (P2RX1-7), P2Y receptors (P2RY1, 2, 4, 6, 11-14), adenosine receptors (ADORA1, ADORA2A, ADORA2B), and key ectonucleotidases (ENTPD1, NT5E, ADA, CD38, ALPL). Gene symbols were mapped to Ensembl IDs using the biomaRt package.
Differential expression analysis between primary tumor and normal tissue samples was performed using the DESeq2 package (v1.46.0). Low-count genes were filtered out prior to analysis to reduce noise. Raw counts were normalized using the median-ratio method to account for differences in sequencing depth. The Wald test was employed to determine statistical significance, and p-values were adjusted for multiple comparisons using the Benjamini-Hochberg (FDR) procedure. Genes with an adjusted p-value (padj) < 0.05 were considered differentially expressed (DEGs).
To elucidate the biological functions associated with the DEGs, Gene Ontology (GO) and Kyoto Encyclopedia of Genes and Genomes (KEGG) pathway enrichment analyses were conducted using the clusterProfiler package (v4.14.6). Over-representation analysis (ORA) was performed, with a primary focus on GO Biological Processes (BP) and KEGG pathways relevant to cancer biology and purinergic signaling. Significance was determined by a hypergeometric test with Benjamini-Hochberg correction (FDR < 0.05). To ensure the biological relevance of the results within the context of HCC, a curation step was applied to prioritize pathways associated with metabolism, signaling transduction, and immune response.
The prognostic value of the 24 purinergic genes was evaluated using the survival (v3.6.4) and survminer (v0.5.1) packages. Overall survival (OS) data were derived from clinical metadata (days_to_death and days_to_last_follow_up). For each gene, patients were stratified into “High” and “Low” expression groups based on the median expression value. Survival differences were assessed using the Kaplan-Meier method and the log-rank test. Additionally, multivariate Cox proportional hazards regression models were fitted to calculate Hazard Ratios (HR) and 95% confidence intervals. P-values from Cox models were adjusted for multiple comparisons (FDR), with significance defined as FDR < 0.05.
To investigate functional connectivity changes in the purinergic system during tumorigenesis, gene co-expression networks were constructed separately for normal and tumor tissues. Pairwise Pearson correlation coefficients (r) were calculated for the 24 genes. An undirected graph was constructed using the igraph package (v2.1.4), with edges defined by a hard threshold on absolute correlation, |r| > 0.4. Network topology was characterized by global metrics (density and node counts/edges) and node centrality (degree). Networks were visualized using the Fruchterman-Reingold force-directed layout to reveal community structure.
A machine learning approach was implemented to validate the discriminatory power of the purinergic signature and identify robust biomarkers. A Random Forest (RF) classifier was trained to distinguish tumor from normal samples using the caret (v7.0.1) and randomForest (v4.7.1.2) packages. The dataset was split into training (75%) and testing (25%) sets. The model was trained using 10-fold cross-validation repeated 5 times, optimizing for the Area Under the ROC Curve (AUC). Model performance was evaluated on the independent test set using metrics including accuracy, sensitivity, specificity, and AUC. To identify the most stable predictors, Recursive Feature Elimination (RFE) with Random Forest was performed using 100 bootstrap iterations. Genes were ranked by selection frequency across bootstrap samples.
2.2. Cell Culture and Spheroid Formation
The HepG2 hepatocellular carcinoma cell line was obtained from the Cell Bank of Rio de Janeiro (HUCFF, UFRJ, RRID: CVCL_0027). The LX-2 hepatic stellate cell line (RRID: CVCL_5792) was generously provided from Dr. Karen C. Martinez de Moraes, who supplied the cells from UNESP under the authorization of Prof. Scott Friedman. Both cell lines were cultured in low-glucose Dulbecco’s Modified Eagle Medium supplemented with 10% fetal bovine serum (FBS) and 1% penicillin/streptomycin at 37 °C in a 5% CO2 humidified atmosphere.
To generate HepG2 and HepG2/LX-2 spheroids (1:1 ratio), a total of 3 x 10⁴ viable cells were seeded in 96-well round-bottom plates coated with 1.5% agarose for viability assays. For the remaining assays, Nunclon Sphera 96-well U-bottom ultra-low attachment plates (Thermo Fisher Scientific) were used. After seeding, the plates were centrifuged for 10 minutes at 1200 rpm to aid spheroid formation.
2.3. Treatments
Stock solutions of sorafenib tosylate (Sigma, Cat. No. SML2633; 50 mM) and Doxazosin mesylate (Sigma, Cat. No. D9815; 10 mM) were prepared in dimethyl sulfoxide (DMSO) and stored at -20 °C. For in vitro treatments, drugs were diluted in the culture medium to the desired final concentrations. The final concentration of DMSO in the culture medium was kept below 1% (v/v) to avoid solvent toxicity.
The treatment groups used in the experiments, after determining the half-maximal inhibitory concentration (IC50), were as follows: vehicle (0.35% DMSO); sorafenib monotherapy at 10 µM and 25 µM; and co-treatment at 10 µM sorafenib + 30 µM doxazosin (S1D) and 25 µM sorafenib + 30 µM doxazosin (S2D).
2.4. Cell Viability Assay
Cell viability was evaluated using the CellTiter-Glo® 3D kit (Promega). The experiment was performed according to the manufacturer’s instructions. The results were then used to calculate the spheroid IC50 values.
2.5. Quantitative Real-Time Polymerase Chain Reaction (qPCR)
Total RNA content from spheroids was isolated using TRIzol reagent (Invitrogen) and quantified by spectrophotometry. Complementary DNA (cDNA) was synthesized from 1.4 μg of total RNA using the High-Capacity cDNA Reverse Transcription Kit (Applied Biosystems) and stored at − 20 °C until use. Real-time PCR was performed in triplicate on a StepOnePlus™ Real-time PCR system (Applied Biosystems) using the GoTaq® qPCR Master Mix (Promega), according to the manufacturer’s instructions. All primer sequences used in this study are described in the Supplementary Table S1. Values were normalized to the relative expression levels of the housekeeping gene Receptor for Activated C Kinase 1 (RACK1). To select the most accurate and stable reference gene for this analysis, RefFinder, a web-based tool (https://www.ciidirsinaloa.com.mx/RefFinder-master/), was used [29]. Relative quantification was calculated using the 2−ΔΔCt method [30].
2.6. Flow Cytometry
To determine the expression of CD39, CD73, and ADA proteins after 48 h of treatment, spheroids were collected, washed with PBS, and dissociated using TrypLE™ Express reagent. Cells were then stained with BD Pharmingen™ PerCP-Cy™5.5 mouse anti-human CD39 (clone TU66, Cat. No. 564899), BD Pharmingen™ PE mouse anti-human CD73 (clone AD2, Cat. No. 550257), and FITC mouse anti-human CD26 (clone M-A261, Cat. No. 555436), according to the manufacturer’s instructions.
To evaluate active caspase-3 expression, dissociated spheroid cells were permeabilized and stained with BD Pharmingen™ PE rabbit anti-active caspase-3 antibody (clone C92-605, Cat. No. 550821). Protein expression levels were quantified as median fluorescence intensity (MFI). For the acquisition of samples and analysis of the results, the BD Accuri™ cytometer with the C6 Plus software (version 1.0.23.1; BD Biosciences, San Jose, CA, USA) was used. The results were analyzed using FlowJo® v10 software (FlowJo LLC, Ashland, OR, USA).
2.7. Statistical Analysis
All statistical analyses and graphical representations were performed using the Rstudio (v4.4.3) with the rstatix (v0.7.3), ggpubr (v0.6.1), and ggplot2 (v4.0.1) packages. Data distribution and homogeneity of variances were assessed using the Shapiro-Wilk and Levene’s tests, respectively. For datasets satisfying parametric assumptions, multiple comparisons were performed using One-Way ANOVA followed by Tukey’s HSD post-hoc test. To evaluate the influence of the tumor microenvironment on pharmacological response, a Two-Way ANOVA was employed to assess the interaction between ‘Treatment’ and ‘Culture System’ (HepG2 vs. HepG2/LX-2).
3. Results
3.1. RNA-Seq Analysis
3.1.1. Differential Expression of Purinergic Genes in HCC
To investigate the transcriptional landscape of the purinergic system in HCC, we analyzed RNA-seq data from 421 samples. Principal Component Analysis (PCA) revealed a clear segregation between tumor and normal samples based on the expression profile of the 24 selected purinergic genes, suggesting that the dysregulation of this system could be an important source of molecular variability in HCC (Figure 1A). Differential expression analysis identified significant alterations in the purinergic signaling network (Figure 1B). The expression pattern was heterogeneous: genes encoding key enzymes for ATP and adenosine metabolism, such as ENTPD1 (CD39, log2FC = 0.64) and ADA (log2FC = 0.87), as well as adenosine receptors ADORA1 and ADORA2A, were significantly upregulated in HCC (Figure 1B). Furthermore, receptors such as P2RX2 and P2RY4 exhibited the highest magnitude of upregulation. Conversely, genes associated with ADP signaling, particularly P2RY12 (log2FC = -2.42) and P2RY13 (log2FC = -1.92), were among the most downregulated genes in the tumor tissue (Figure 1B). NT5E (CD73), responsible for adenosine generation, was downregulated (log2FC = -0.79), suggesting a complex imbalance in the extracellular nucleotide hydrolysis chain. Analysis of individual gene distributions confirmed robust overexpression of ADA, ENTPD1, P2RX2, and ADORA1 (Figure 1C) and significant downregulation of P2RY12, P2RY13, NT5E, and ALPL in tumor samples (Figure 1D). Comprehensive statistical results for all 24 analyzed genes are provided in Table 1.
3.1.2. Functional Enrichment Analysis
Analysis of Gene Ontology (GO) Biological Processes revealed that the differentially expressed genes are significantly enriched in functions related to nucleotide signaling and metabolism, such as “response to purine-containing compound” and “purine-containing compound catabolic process” (Figure 2A). Furthermore, there was a strong enrichment of pathways governing cell fate and survival, including “regulation of apoptotic signaling”, “Wnt signaling pathway”, and “TOR signaling”. Notably, terms related to the “regulation of innate immune response” were also significant, highlighting the immunomodulatory role of this system.
Complementary KEGG pathway analysis corroborated these findings (Figure 2B). The “Purine metabolism” and “Nucleotide metabolism” pathways were directly enriched, confirming the functional impact of the gene signature. The analysis linked purinergic alterations to major oncogenic signaling cascades, including the “AMPK signaling pathway”, “Calcium signaling pathway”, and “Phospholipase D signaling pathway”. The “Cell cycle” and “Apoptosis” pathways were among the most significant hits (lowest FDR), reinforcing the connection between purinergic signaling and proliferative and viability profiles of HCC.
3.1.3. Prognostic Value of Purinergic Gene Expression in HCC
To evaluate the clinical relevance of the purinergic system, we assessed the association between the expression levels of the 24 purinergic genes and patient overall survival (OS). Univariate Cox proportional hazards regression models were first used to identify prognostic genes (FDR < 0.05), followed by a multivariate Cox regression analysis adjusted for patient age and pathological tumor stage to determine whether these genes served as independent prognostic factors. Notably, high expression of P2RY6, ADA, NT5E, P2RX4, P2RY4, and ADORA1 was consistently associated with a higher risk of death (Hazard Ratio > 1; Supplementary Table S2), indicating a poor prognosis for patients with elevated levels of these transcripts.
Kaplan-Meier survival analysis further confirmed these findings. Patients stratified into the “High Expression” group (above the median) for these six genes had significantly shorter overall survival than those in the “Low Expression” group (Figure 3). P2RY6 showed the strongest prognostic association (FDR = 8.11e-08), followed by ADA (FDR = 6.52e-05) and NT5E (FDR = 0.004). Although P2RY4 showed a significant association with survival in the continuous Cox regression model (FDR = 0.0095), the Kaplan-Meier analysis using a median split did not reveal a significant difference between high and low expression groups (p = 0.84), suggesting that the prognostic impact might be non-linear or driven by a specific subset of patients.
3.1.4. Purinergic Co-Expression Network in HCC
To investigate whether the functional coordination of the purinergic system is remodeled during tumorigenesis, we constructed and compared gene co-expression networks for normal and tumor tissues. This analysis revealed a loss of connectivity and a structural collapse of the purinergic signaling network (Figure 4). In normal liver tissue, the system operates as a highly cohesive module with a network density of 0.602, maintained by 103 strong co-expression links among 19 genes. In contrast, the tumor network exhibited fragmentation, with network density plummeting to 0.231 (a ~61% reduction) and the number of strong connections dropping to just 18. Six genes (NT5E, P2RX6, P2RY11, ADORA1, ALPL, P2RX7) were completely decoupled from the main network in tumor tissue.
A distinct shift in network centrality accompanied the loss of connectivity. In normal tissue, the receptors P2RX4 and P2RY1 acted as hubs, each coordinating with 16 other genes. However, these receptors lost their central role, retaining only a single connection in tumor tissue. Conversely, a smaller and weaker core emerged in the tumor, centered around ENTPD1, P2RY13, and ADA, which became the most connected nodes (degree = 5-6). NT5E (CD73) became isolated in the tumor network, suggesting a functional uncoupling of the adenosine production machinery.
3.1.5. Predictive Analysis and Biomarker Selection
To determine whether the transcriptional profile of the 24 purinergic genes constitutes a robust molecular signature capable of distinguishing HCC from normal tissue, we implemented a machine learning approach using a Random Forest classifier. The purinergic signature demonstrated discriminatory power on the test set. The model achieved an AUC of 0.982, indicating near-perfect ability to distinguish tumor from normal samples across all classification thresholds (Figure 5A). The precision-recall curve showed high precision across all recall levels, confirming the model’s robustness even under class imbalance (Figure 5B; Supplementary Table S3).
The model achieved 100% sensitivity, correctly identifying all tumor samples in the test set. The overall accuracy was 93.3% (95% CI: 0.86 - 0.97). The Balanced Accuracy of 70.8% indicates that the signature’s predictive value exceeds chance (Kappa = 0.558). To refine the signature and identify the most critical biomarkers, we performed RFE with 100 bootstrap iterations. This analysis revealed a hierarchy of predictor stability. A core set of five genes (i.e., P2RY13, P2RY12, ENTPD1, ADA, and ALPL) was selected in nearly 100% of the bootstrap iterations (Figure 5C).
3.2. Cytotoxicity and Apoptotic Effect of Combined Therapy in Spheroids
To determine the optimal therapeutic concentrations for the 3D models, we first established the IC50 of sorafenib and doxazosin. The IC50 of sorafenib was 12.9 µM in HepG2 spheroids and increased to 28.0 µM in HepG2/LX-2 spheroids, highlighting the protective role of the stromal component (Figure 6A-B). The IC50 for doxazosin was approximately 30 µM in both types of spheroids (Figure 6C-D). Based on these results, we chose sublethal concentrations of sorafenib (10 and 25 µM) and combined them with a fixed concentration of doxazosin (30 µM) for subsequent assays.
We evaluated whether doxazosin could enhance sorafenib-induced cell death by assessing active caspase-3 staining. In HepG2 spheroids, the combined treatment (S1D and S2D) significantly increased apoptosis compared with vehicle or single treatments (p = 0.0055 and p = 0.0005 respectively) (Figure 6E-H). In HepG2/LX-2 spheroids, the potentiating effect was preserved but lower than in HepG2 spheroids (S1D p = 0.0519 and S2D p = 0.0082) and still significant compared to the vehicle (p = 0.0040 both co-treatments) (Figure 6E-H). These results validate the sorafenib plus doxazosin combination as an effective strategy to overcome the intrinsic resistance of multilayer 3D spheroids.
3.3. Modulation of Purinergic Signaling Pathway Gene Expression in Spheroids
To expand the study of purinergic signaling, we analyzed the expression of key enzymes (ENTPD1, NT5E, ADA) and adenosine receptors (ADORA1, ADORA2A, ADORA2B) by qPCR in HepG2 and HepG2/LX-2 spheroids treated with 25 µM of sorafenib (“25”) or the cotreatment S2D (Figure 7). The expression of ENTPD1 remained unaltered across all conditions and culture models (Figure 7A). In contrast, NT5E (CD73) was significantly downregulated. In HepG2 spheroids, both treatments reduced NT5E expression (p < 0.01 for 25 µM; p < 0.05 for S2D). In the co-culture model, only S2D maintained efficacy, significantly reducing NT5E levels (p < 0.05) with a large effect size (Cohen’s d > 3.0, Figure 7G), suggesting robust inhibition of adenosine production capacity (Figure 7B).
ADA expression presented a downward trend in HepG2 spheroids treated with 25 µM of sorafenib (Figure 7C). Although classical statistical significance was not reached due to sample variability (p > 0.05), the analysis of biological magnitude revealed a large effect size (Cohen’s d = 1.63; Figure 7G), suggesting a biologically relevant modulation. No changes were observed in the co-culture model for ADA.
Finally, we assessed the downstream receptors. ADORA1 expression was suppressed by S2D cotreatment in both mono- and co-cultures (p < 0.0001 and p < 0.01; Figure 7D), with massive effect sizes observed in the co-culture model (Figure 7G). ADORA2A exhibited a specific response in the co-culture setting: while the 25 µM treatment showed high heterogeneity, S2D treatment significantly downregulated ADORA2A expression (p < 0.01) in the presence of LX-2 cells (Figure 7E). The expression levels of ADORA2B receptors remained stable across all experimental conditions (Figure 7F).
3.4. Purinergic Signaling Flow Cytometry
To evaluate whether the transcriptional changes in purinergic signaling translated to cell-surface protein expression, as well as to assess the influence of the tumor microenvironment on drug response, the expression of CD39, CD73, and CD26 was analyzed in mono- and co-culture spheroids by flow cytometry. In HepG2 spheroids, combined sorafenib and doxazosin treatment significantly increased the percentage of CD39+ cells compared with the vehicle group (S1D: p = 0.007; S2D: p = 0.008; Figure 8B). This increase was observed in the co-culture system, as indicated by a significant Treatment × System interaction (Two-way ANOVA, p = 0.043). The CD39 MFI remained unchanged after doublet exclusion (Figure 8A).
For CD73, high concentration of sorafenib (25 µM) significantly reduced the proportion of CD73⁺ cells in HepG2 spheroids (p = 0.036; Figure 8D), whereas no significant differences were detected in the co-culture model (p > 0.05). CD73 MFI did not vary across conditions in either culture system (Figure 8C). CD26 expression remained stable in both frequency and intensity under all treatments and in both mono- and co-culture models (Figure 8E–F), indicating limited responsiveness of this marker to acute pharmacological modulation at the protein level.
4. Discussion
In this study, we propose the integration of transcriptomic analysis with multicellular spheroids composed of hepatocellular carcinoma cells and hepatic stellate cells to mimic the tumor microenvironment and its complexity. This finding underscores the potential of utilizing a mixed spheroid model comprising tumor and stromal cells (HepG2/LX-2) to study in vitro the efficacy of potential therapeutic interventions. This model offers a valuable representation of the in vivo tumor environment, facilitating the exploration of therapeutic strategies. Furthermore, evidence has emerged that the combination of doxazosin and sorafenib can modulate purinergic signaling. Additionally, it has been demonstrated that stromal cells present in spheroids influence the response to treatment, leading to increased resistance.
Given the existing evidence that the purinergic system plays a central role in the development of therapeutic resistance in other types of cancer [21,24], we investigated the gene expression profile of purinergic genes in HCC. Genes related to ATP metabolism (ENTPD1, P2RX2, and P2RY4) and adenosine receptors (ADORA1 and ADORA2A) appeared to be upregulated. For example, it was demonstrated that ADORA2A receptors can activate PI3K-Akt pathways, promoting the proliferation and invasion of HCC cells [30], these pathways are typically activated in sorafenib-resistant cells [13]. This scenario is supported by analyses using GO and KEGG, which identified these enriched pathways in our dataset, showing that the purinergic system acts as a modulator of tumor growth and survival signals. Surprisingly, the NT5E gene was among the top downregulated genes. High NT5E gene expression (CD73 protein) is typically associated with therapy resistance and a worse prognosis in HCC [23,30]. NT5E is highly expressed in hepatic stellate cells [31] and may have appeared downregulated in this dataset because the sample included the entire tumor tissue of patients, which is mainly composed of tumor hepatocytes [32].
Beyond differential expression, co-expression network analysis revealed a substantial rewiring of the purinergic system during hepatocarcinogenesis. In normal liver tissue, purinergic genes formed a highly interconnected network, consistent with a coordinated and homeostatic regulation of extracellular ATP and adenosine signaling. In contrast, tumor tissue exhibited a pronounced loss of connectivity and network density, reflecting a breakdown of coordinated physiological programs and a shift toward simplified survival-oriented signaling, a phenomenon commonly observed during malignant transformation [34]. This reorganization was accompanied by changes in network centrality. While P2RX4 and P2RY1 acted as major hubs in normal tissue, reflecting their constitutive role in maintaining biliary homeostasis and hepatic regeneration [35], these receptors lost connectivity in tumors. In contrast, metabolic enzymes such as ENTPD1 (CD39) and ADA emerged as central nodes. The increased centrality of ADA is in line with our prognostic findings and supports a model in which HCC cells prioritize the control of extracellular adenosine levels to promote immune evasion and metabolic adaptation to hypoxia [36]. Notably, NT5E (CD73) became isolated in the tumor network despite its known pro-tumoral role, a finding that can be explained by its predominant expression in stromal compartments, particularly activated hepatic stellate cells and cancer-associated fibroblasts, rather than in tumor hepatocytes themselves [24,37].
The network reprogramming identified in this study was further supported by survival analysis, which demonstrated that high expression of key purinergic components is associated with poor overall survival. Upregulation of genes belonging to the adenosinergic axis (i.e., NT5E, ADA, and ADORA1) correlated with unfavorable prognosis, reinforcing the notion that adenosine signaling constitutes an active pro-tumoral mechanism rather than a passive consequence of tumor hypoxia. This clinical pattern is consistent with extensive evidence from other solid tumors, including breast and colorectal cancers, where enhanced CD73-mediated adenosine production and adenosine receptor activation promote immune evasion, metastatic dissemination, and resistance to therapy [37,38]. In our study, high ADORA1 expression correlated with poor overall survival, consistent with its reported tumor-promoting functions across several solid malignancies, where ADORA1 signaling supports proliferation and survival through activation of oncogenic pathways such as AKT and MAPK [39,40]. The most robust prognostic predictor identified was the receptor P2RY6. Although underexplored in the hepatic context, its clinical relevance in HCC was recently supported by Chen et al. (2025) [41], who identified P2RY6 as a core component of an adenosine metabolism–related gene signature, in which elevated P2RY6 expression was associated with poor prognosis, enhanced immune infiltration, and increased expression of immune checkpoint molecules in HCC. This association is consistent with reports in gastric cancer, where P2RY6 activation suppresses tumor cell proliferation [42], underscoring the context-dependent nature of purinergic signaling across tumor types.
Using a machine learning framework, we assessed whether the expression profile of purinergic genes alone could distinguish hepatocellular carcinoma from normal liver tissue. The Random Forest model achieved high discriminatory performance (AUC = 0.982), indicating that purinergic remodeling represents a consistent transcriptomic feature of HCC. However, this result should be interpreted with caution due to the class imbalance in the TCGA dataset. Rather than proposing a diagnostic classifier, these findings function as an in silico validation of the biological relevance of purinergic reprogramming identified in our differential expression and network analyses. Feature selection using bootstrap recursive feature elimination revealed a stable core of the genes P2RY13, P2RY12, ENTPD1 (CD39), ADA, and ALPL that consistently contributed to tumor classification. The prominence of P2RY12 and P2RY13 is biologically meaningful, as these ADP-responsive receptors are typically associated with homeostatic purinergic signaling, including platelet regulation and immune cell motility [43]. Their reduced expression and strong predictive value align with our network results showing loss of coordinated receptor signaling and suggest impairment of physiological P2Y12-dependent immune surveillance mechanisms, previously described in myeloid cells and microglia [44]. In contrast, the recurrent selection of ENTPD1 and ADA reinforces the shift toward an adenosine-enriched extracellular milieu. This metabolic reprogramming is a potential driver of malignancy in HCC, where the overexpression of CD39 (ENTPD1) has been independently validated as a mechanism that facilitates tumor invasion and predicts poor overall survival [45,46].
The computational identification of NT5E, ADA, and ADORA1 as prognostic biomarkers provided a basis for therapeutic evaluation. Specifically, the network topology analysis suggested that the generation of an adenosine-mediated immunosuppressive state is likely not an intrinsic property of the hepatocyte alone, but relies on a disrupted interplay with the stromal compartment. To bridge the gap between this global transcriptomic landscape and clinical applicability, we transitioned from in silico profiling to a biologically relevant in vitro model. We hypothesized that combining sorafenib with doxazosin, a drug known to interfere with survival pathways downstream of purinergic receptors, could effectively remodel this dysregulated axis. Therefore, we utilized 3D multicellular spheroids incorporating HSC (LX-2) to recapitulate the physical and metabolic barriers of the tumor microenvironment, allowing us to investigate whether this pharmacological strategy could overcome stromal-mediated resistance and reverse the expression of the poor-prognosis signature of purinergic genes. To this end, we first determined the IC50 values for sorafenib and doxazosin. Notably, the IC50 of sorafenib was higher for HepG2/LX-2 spheroids than for HepG2 spheroids. The same pattern of resistance has been reported in previous studies, such as Song et al. (2016) and Khawar et al. (2018) [7,11]. We evaluated the expression of active caspase-3 and found that both co-treatments (S1D and S2D) promoted apoptosis in the spheroids; however, the level of apoptosis was higher in the HepG2 spheroids. This can be explained by the fact that HSCs act as CAFs in the tumour microenvironment, promoting chemoresistance by secreting factors such as TGF-β and HGF, which induce epithelial-mesenchymal transition (EMT) and tumour growth pathways [24,47]. Additionally, HSCs secrete extracellular matrix proteins, such as type I collagen, which may help form a physical barrier that impairs drug penetration into the spheroids [11].
We evaluated how our treatments could modulate purinergic signaling in spheroids and found that S2D co-treatment decreased the expression of genes associated with poor prognosis, such as NT5E and ADORA1, in both HepG2 and HepG2/LX-2 spheroids. Additionally, co-treatment decreased ADORA2A expression in HepG2/LX-2 spheroids. ADORA2A receptors regulate the proliferation and fibrogenesis pathways of HSCs, stimulating the synthesis of types I and III collagen [48]. This explains why co-culture spheroids are more resistant to sorafenib treatment. Furthermore, activation of these receptors mediates the phosphorylation of the PI3K/Akt pathway, inducing HCC cell proliferation and invasion [31]. In this scenario, doxazosin was able to attenuate this resistance by promoting caspase-3-mediated apoptosis in HepG2/LX-2 spheroids. These data suggest that doxazosin acts not only as a cytotoxic agent but also as a molecular modulator that disrupts the purinergic survival signaling mechanism, potentially resensitizing tumor cells to sorafenib. However, the translation from transcriptional modulation to protein-level changes revealed significant resistance mechanisms. While S2D treatment effectively reduced NT5E mRNA levels, it failed to significantly decrease the frequency of CD73+ cells in the co-culture model. This suggests that the stromal turnover of CD73 protein is highly stable or that post-transcriptional compensatory mechanisms maintain its surface expression despite transcriptional inhibition. Furthermore, we observed a paradoxical increase in the frequency of CD39+ cells following treatment. This phenomenon likely represents a compensatory feedback loop, wherein tumor cells upregulate the upstream enzyme (CD39) in response to the blockade of the downstream pathway, constituting a common adaptive response observed in metabolic signaling networks [23]. These discrepancies between mRNA and protein dynamics underscore the adaptability of the purinergic system and indicate that while the sorafenib-doxazosin combination is effective, complete inhibition of the adenosinergic axis may require direct enzymatic inhibition of CD73 combined with transcriptional modulation.
5. Conclusions
In summary, we demonstrated that the signature of dysregulated purinergic genes may be associated with a poor prognosis for patients with HCC in silico and that sorafenib treatment with doxazosin can attenuate the expression of dysregulated genes via the adenosine axis in vitro. Moreover, our findings indicate that the co-culture spheroid model offers a more representative system for investigating potential cancer therapies targeting the purinergic system, accounting for the role of stromal cells in purinergic signaling and therapy resistance.
Supplementary Materials
The following supporting information can be downloaded at website of this paper posted on Preprints.org.
Author Contributions
Conceptualization, A.C.S., F.F. and F.C.R.G.; formal analysis, A.C.S., V.K., J.N.S., A.F.W. and F.F.; investigation and methodology, A.C.S., A.F.W., V.K., J.N.S., J.O.R., N.B.N., M.L.G., R.K.M., J.V.H., C.K.D, R.M., F.F., F.C.R.G.; writing—original draft preparation, A.C.S; writing—review and editing, A.C.S., V.F.K., A.F.W., J.N.S, F.F. and F.R.C.G.; visualization, A.C.S, V.F.K.; supervision, F.F. and F.C.R.G.; project administration, F.F. and F.C.R.G.; funding acquisition, F.F. and F.C.R.G. All authors have read and agreed to the published version of the manuscript.
Funding
This study was supported by National Council for Scientific and Technological Development (CNPq; n° 163748/2021-7 and PQ n° 311540/2025-2 F.C.R.G. and PQ n° 311580/2021-1 F.F.) and by Brazilian Federal Agency for Support and Evaluation of Graduate Education (CAPES, nº 88887.936425/2024-00).
Institutional Review Board Statement
Not applicable.
Informed Consent Statement
Not applicable.
Data Availability Statement
The datasets used and analyzed during the current study are available from the corresponding author on reasonable request.
Acknowledgments
The authors thank the agencies National Council for Scientific and Technological Development (CNPq) and Brazilian Federal Agency for Support and Evaluation of Graduate Education (CAPES), as well as the institution Federal University of Rio Grande do Sul (UFRGS).
Conflicts of Interest
The authors declare that the research was conducted in the absence of any commercial or financial relationships that could be construed as a potential conflict of interest.
Abbreviations
The following abbreviations are used in this manuscript:
| 2D | Two-dimensional |
| 3D | Three-dimensional |
| ADA | Adenosine deaminase |
| ALPL | Alkaline phosphatase, liver/bone/kidney |
| AUC | Area under the ROC curve |
| BP | Biological processes |
| CAFs | Cancer-associated fibroblasts |
| cDNA | Complementary DNA |
| DEGs | Differentially expressed genes |
| DMSO | Dimethyl sulfoxide |
| ECM | Extracellular matrix |
| EMT | Epithelial–mesenchymal transition |
| ENTPD1 | Ectonucleoside triphosphate diphosphohydrolase 1 (ntpdase-1) |
| FBS | Fetal bovine serum |
| GDC | Genomic data commons |
| GO | Gene ontology |
| HCC | Hepatocellular carcinoma |
| HR | Hazard ratio |
| HSCs | Hepatic stellate cells |
| IC50 | Half-maximal inhibitory concentration |
| KEGG | Kyoto Encyclopedia of Genes and Genomes |
| MASLD | Metabolic-associated steatotic liver disease |
| MCTS | Multicellular tumor spheroids |
| MFI | Median fluorescence intensity |
| NT5E | Ecto-5′-nucleotidase |
| ORA | Over-representation analysis |
| OS | Overall survival |
| PCA | Principal component analysis |
| PR | Precision–recall |
| qPCR | Quantitative real-time polymerase chain reaction |
| RACK1 | Receptor for activated C kinase 1 |
| RF | Random forest |
| RFE | Recursive feature elimination |
| RNA-seq | RNA sequencing |
| TCGA | The cancer genome atlas |
| TCGA-LIHC | The cancer genome atlas–liver hepatocellular carcinoma |
| TME | Tumor microenvironment |
References
- Yang, J.D.; Hainaut, P.; Gores, G.J.; Amadou, A.; Plymoth, A.; Roberts, L.R. A global view of hepatocellular carcinoma: Trends, risk, prevention and management. Nat. Rev. Gastroenterol. Hepatol. 2019, 16, 589–604. [Google Scholar] [CrossRef] [PubMed]
- Villanueva, A. Hepatocellular carcinoma. N. Engl. J. Med. 2019, 380, 1450–1462. [Google Scholar] [CrossRef] [PubMed]
- Forner, A.; Llovet, J.M.; Bruix, J. Hepatocellular carcinoma. N. Engl. J. Med. 2012, 367, 368–377. [Google Scholar] [CrossRef]
- Mauro, E.; de Castro, T.; Zeitlhoefler, M.; Sung, M.W.; Villanueva, A.; Mazzaferro, V.; Llovet, J.M. Hepatocellular carcinoma: Epidemiology, diagnosis and treatment. JHEP Rep. 2025, 7, 101571. [Google Scholar] [CrossRef]
- Tsuchida, T.; Friedman, S.L. Mechanisms of hepatic stellate cell activation. Nat. Rev. Gastroenterol. Hepatol. 2017, 14, 397–411. [Google Scholar] [CrossRef]
- Khawar, I.A.; Park, J.K.; Jung, E.S.; Lee, M.A.; Chang, S.; Jeong, J.H.; Kuh, H.J. Three Dimensional Mixed-Cell Spheroids Mimic Stroma-Mediated Chemoresistance and Invasive Migration in hepatocellular carcinoma. Neoplasia 2018, 20, 800–812. [Google Scholar] [CrossRef]
- Song, M.; He, J.; Pan, Q.Z.; Yang, J.; Zhao, J.; Zhang, Y.J.; Huang, Y.; Tang, Y.; Wang, Q.; He, J.; et al. Cancer-Associated Fibroblast-Mediated Cellular Crosstalk Supports Hepatocellular Carcinoma Progression. Hepatology 2021, 73, 1717–1735. [Google Scholar] [CrossRef]
- Cogliati, B.; Yashaswini, C.N.; Wang, S.; Sia, D.; Friedman, S.L. Friend or foe? The elusive role of hepatic stellate cells in liver cancer. Nat. Rev. Gastroenterol. Hepatol. 2023, 20, 647–661. [Google Scholar] [CrossRef]
- Vinci, M.; Gowan, S.; Boxall, F.; Patterson, L.; Zimmermann, M.; Court, W.; Lomas, C.; Mendiola, M.; Hardisson, D.; Eccles, S.A. Advances in establishment and analysis of three-dimensional tumor spheroid-based functional assays for target validation and drug evaluation. BMC Biol. 2012, 10, 29. [Google Scholar] [CrossRef]
- Song, Y.; Kim, S.; Kim, K.; Choi, I.K.; Kim, A.S.; Ku, H.J.; Kim, S.Y.; Kim, S.S.; Kim, J.H.; Yoon, S.J.; et al. Activated hepatic stellate cells play pivotal roles in hepatocellular carcinoma cell chemoresistance and migration in multicellular tumor spheroids. Sci. Rep. 2016, 6, 36750. [Google Scholar] [CrossRef]
- Llovet, J.M.; Ricci, S.; Mazzaferro, V.; Hilgard, P.; Gane, E.; Blanc, J.F.; de Oliveira, A.C.; Santoro, A.; Raoul, J.L.; Forner, A.; et al. Sorafenib in advanced hepatocellular carcinoma. N. Engl. J. Med. 2008, 359, 378–390. [Google Scholar] [CrossRef]
- Zhu, Y.J.; Zheng, B.; Wang, H.Y.; Chen, L. New knowledge of the mechanisms of sorafenib resistance in liver cancer. Acta Pharmacol. Sin. 2017, 38, 614–622. [Google Scholar] [CrossRef]
- Chen, K.F.; Chen, H.L.; Tai, W.T.; Feng, W.C.; Hsu, C.H.; Chen, P.J.; Cheng, A.L. Activation of phosphatidylinositol 3-kinase/Akt signaling pathway mediates acquired resistance to sorafenib in hepatocellular carcinoma cells. J. Pharmacol. Exp. Ther. 2011, 337, 155–161. [Google Scholar] [CrossRef]
- Fulton, B.; Wagstaff, A.J.; Sorkin, E.M. Doxazosin. An update of its clinical pharmacology and therapeutic efficacy in hypertension and benign prostatic hyperplasia. Drugs 1995, 49, 295–320. [Google Scholar] [CrossRef] [PubMed]
- Wykretowicz, A.; Guzik, P.; Wysocki, H. Doxazosin in the current treatment of hypertension. Expert Opin. Pharmacother. 2008, 9, 625–633. [Google Scholar] [CrossRef] [PubMed]
- Yang, Y.F.; Wu, C.C.; Chen, W.P.; Su, M.J. Transforming growth factor-beta type I receptor/ALK5 contributes to doxazosin-induced apoptosis in H9C2 cells. Naunyn-Schmiedeberg’s Arch. Pharmacol. 2009, 380, 413–421. [Google Scholar] [CrossRef] [PubMed]
- Hui, H.; Fernando, M.A.; Heaney, A.P. The alpha1-adrenergic receptor antagonist doxazosin inhibits EGFR and NF-kappa B signalling to induce breast cancer cell apoptosis. Eur. J. Cancer 2008, 44, 160–166. [Google Scholar] [CrossRef]
- Gaelzer, M.M.; Coelho, B.P.; De Quadros, A.H.; Vianna, M.C.; Ramos, A.B.; Silva, J.B.; Guma, F.T.C.R. Phosphatidylinositol 3-Kinase/AKT Pathway Inhibition by Doxazosin Promotes Glioblastoma Cells Death, Upregulation of p53 and Triggers Low Neurotoxicity. PLoS ONE 2016, 11, e0154612. [Google Scholar] [CrossRef]
- Serna-Salas, S.A.; Arroyave-Ospina, J.C.; Zhang, M.; Damba, T.; Buist-Homan, M.; Muñoz-Ortega, M.H.; Ventura-Juárez, J.; Moshage, H. alpha-1 Adrenergic receptor antagonist doxazosin reverses hepatic stellate cells activation via induction of senescenc3e. 4Mech. Ageing Dev. 2022, 201, 111617. [Google Scholar] [CrossRef]
- Di Virgilio, F.; Adinolfi, E. Extracellular purines, purinergic receptors and tumor growth. Oncogene 2017, 36, 293–303. [Google Scholar] [CrossRef]
- Jia, W.; Huang, Z.; Zhou, L.; Tang, W.; Zhou, Q.; Chen, S.; Gu, Y.; Hou, X.; Zhang, Z. Purinergic signalling in cancer therapeutic resistance: From mechanisms to targeting strategies. Drug Resist. Updat. 2023, 70, 100988. [Google Scholar] [CrossRef]
- Di Virgilio, F.; Sarti, A.C.; Falzoni, S.; De Marchi, E.; Adinolfi, E. Extracellular ATP and P2 purinergic signalling in the tumour microenvironment. Nat. Rev. Cancer 2018, 18, 601–618. [Google Scholar] [CrossRef]
- Peng, H.; Xue, R.; Ju, Z.; Zhao, J.; He, J.; Lu, S.; Hu, W. Cancer-associated fibroblasts enhance the chemoresistance of CD73+ hepatocellular carcinoma cancer cells via HGF-Met-ERK1/2 pathway. Ann. Transl. Med. 2020, 8, 856. [Google Scholar] [CrossRef] [PubMed]
- Aria, H.; Rezaei, M.; Nazem, S.; Aria, A.; Ghalavand, A.; Teimoori, A. Purinergic receptors are a key bottleneck in tumor metabolic reprogramming: The prime suspect in cancer therapeutic resistance. Front. Immunol. 2022, 13, 947885. [Google Scholar] [CrossRef] [PubMed]
- Shi, L.; Wu, Z.; Miao, J.; Du, S.; Ai, S.; Xu, E.; Li, C.; Li, G.; Wang, W.; He, Y. Adenosine interaction with adenosine receptor A2a promotes gastric cancer metastasis by enhancing PI3K–AKT–mTOR signaling. Mol. Biol. Cell 2019, 30*, 2527–2534. [Google Scholar] [CrossRef] [PubMed]
- Weber, A.F.; Scholl, J.N.; Dias, C.K.; Lima, V.P.; Assmann, T.S.; Anzolin, E.; Kus, W.P.; Worm, P.V.; Battastini, A.M.O.; Figueiró, F. In silico, in vitro, and ex vivo analysis reveals miR-27a-3p and miR-155-5p as key microRNAs for glioblastoma progression: Insights into Th1 differentiation and apoptosis induction. FASEB J. 2024, 38, e70167. [Google Scholar] [CrossRef]
- Scholl, J.N.; Weber, A.F.; Dias, C.K.; Lima, V.P.; Grun, L.K.; Zambonin, D.; Anzolin, E.; Dias, W.W.S.; Kus, W.P.; Barbé-Tuana, F.; et al. Characterization of purinergic signaling in tumor-infiltrating lymphocytes from lower- and high-grade gliomas. Purinergic Signal. 2024, 20, 47–64. [Google Scholar] [CrossRef]
- Xie, F.; Xiao, P.; Chen, D.; Xu, L.; Zhang, B. miRDeepFinder: a miRNA analysis tool for deep sequencing of plant small RNAs. Plant Mol. Biol. 2012, 80, 75–84. [Google Scholar] [CrossRef]
- Schmittgen, T.D.; Livak, K.J. Analyzing real-time PCR data by the comparative Ct method. Nat. Protoc. 2008, 3, 1101–1108. [Google Scholar] [CrossRef]
- Ma, X.L.; Shen, M.N.; Hu, B.; Wang, B.L.; Yang, W.J.; Lv, L.H.; Wang, H.; Zhou, Y.; Sun, H.W.; Cao, Y.; et al. CD73 promotes hepatocellular carcinoma progression and metastasis via activating PI3K/AKT signaling by inducing Rap1-mediated membrane localization of P110beta and predicts poor prognosis. J. Hematol. Oncol. 2019, 12, 37. [Google Scholar] [CrossRef]
- Fausther, M.; Sheung, N.; Saiman, Y.; Bansal, M.B.; Dranoff, J.A. Activated hepatic stellate cells upregulate transcription of ecto-5′-nucleotidase/CD73 via specific SP1 and SMAD promoter elements. Am. J. Physiol. Gastrointest. Liver Physiol. 2012, 303, G904–G914. [Google Scholar] [CrossRef] [PubMed]
- Nagy, P.; Thorgeirsson, S.S.; Grisham, J.W. Organizational Principles of the Liver. In The Liver: Biology and Pathobiology, 6th ed.; Arias, I.M., Alter, H.J., Boyer, J.L., Cohen, D.E., Shafritz, D.A., Thorgeirsson, S.S., Wolkoff, A.W., Eds.; Wiley-Blackwell: Hoboken, NJ, USA, 2020; pp. 3–13. [Google Scholar]
- Anglani, R.; Creanza, T.M.; Liuzzi, V.C.; Piepoli, A.; Panza, A.; Andriulli, A.; Biscaglia, G.; Scivittaro, M.; Graziano, G.; Ancona, N. Loss of Connectivity in Cancer Co-Expression Networks. PLoS ONE 2014, 9, e87075. [Google Scholar] [CrossRef]
- Burnstock, G.; Vaughn, B.; Robson, S.C. Purinergic signalling in the liver in health and disease. Purinergic Signal. 2014, 10, 51–70. [Google Scholar] [CrossRef]
- Di Virgilio, F.; Vuerich, M. Purinergic signaling in the immune system. Auton. Neurosci. 2015, 191, 117–123. [Google Scholar] [CrossRef]
- Allard, B.; Turcotte, M.; Stagg, J. CD73-generated adenosine: orchestrating the tumor-stroma interplay to promote cancer growth. J. Biomed. Biotechnol. 2012, 2012, 485156. [Google Scholar] [CrossRef] [PubMed]
- Loi, S.; Pommey, S.; Haibe-Kains, B.; Beavis, P.A.; Darcy, P.K.; Smyth, M.J.; Stagg, J. CD73 promotes anthracycline resistance and poor prognosis in triple negative breast cancer. Proc. Natl. Acad. Sci. U. S. A 2013, 110, 11091–11096. [Google Scholar] [CrossRef] [PubMed]
- Zhou, Y.; Chu, X.; Deng, F.; Tong, L.; Tong, G.; Yi, Y.; Liu, J.; Tang, J.; Tang, Y.; Xia, Y.; et al. The adenosine A2b receptor promotes tumor progression of bladder urothelial carcinoma by enhancing MAPK signaling pathway. Oncotarget 2017, 8, 48755–48768. [Google Scholar] [CrossRef]
- Liu, H.; Kuang, X.; Zhang, Y.; Ye, Y.; Li, J.; Liang, L.; Xie, Z.; Weng, L.; Guo, J.; Li, H.; et al. ADORA1 Inhibition Promotes Tumor Immune Evasion by Regulating the ATF3-PD-L1 Axis. Cancer Cell 2020, 37, 324–339. [Google Scholar] [CrossRef]
- Chen, Y.; Wang, K.; Zhang, X.; Tao, D.; Shang, Y.; Wang, P.; Li, Q.; Liu, Y. Prognostic model development using novel genetic signature associated with adenosine metabolism and immune status for patients with hepatocellular carcinoma. J. Physiol. Biochem. 2025, 81, 157–172. [Google Scholar] [CrossRef]
- Wan, H.; Xie, R.; Xu, J.; He, J.; Tang, B.; Liu, Q.; Wang, S.; Yang, W.; Dong, X.; Guo, H.; et al. Anti-proliferative Effects of Nucleotides on Gastric Cancer via a Novel P2Y6/SOCE/Ca2+/β-catenin Pathway. Sci. Rep. 2017, 7, 2459. [Google Scholar] [CrossRef]
- Burnstock, G. Purinergic Signalling: Therapeutic Developments. Front. Pharmacol. 2017, 8, 661. [Google Scholar] [CrossRef] [PubMed]
- Haynes, S.E.; Hollopeter, G.; Yang, G.; Kurpius, D.; Dailey, M.E.; Gan, W.B.; Julius, D. The P2Y12 receptor regulates microglial activation by extracellular nucleotides. Nat. Neurosci. 2006, 9, 1512–1519. [Google Scholar] [CrossRef] [PubMed]
- Cai, X.Y.; Ni, X.C.; Yi, Y.; He, H.W. Overexpression of CD39 in hepatocellular carcinoma is an independent indicator of poor outcome after radical resection. Medicine (Baltimore) 2016, 95, e4989. [Google Scholar] [CrossRef] [PubMed]
- Bastid, J.; Cottalorda-Regairaz, A.; Alberici, G.; Bonnefoy, N.; Eliaou, J.F.; Bensussan, A. ENTPD1/CD39 is a promising therapeutic target in oncology. Oncogene 2013, 32, 1743–1751. [Google Scholar] [CrossRef]
- Affo, S.; Yu, L.X.; Schwabe, R.F. The Role of Cancer-Associated Fibroblasts and Fibrosis in Liver Cancer. Annu. Rev. Pathol. Mech. Dis. 2017, 12, 153–186. [Google Scholar] [CrossRef]
- Che, J.; Chan, E.S.L.; Cronstein, B.N. Adenosine A2A Receptor Occupancy Stimulates Collagen Expression by Hepatic Stellate Cells via Pathways Involving Protein Kinase A, Src, and Extracellular Signal-Regulated Kinases 1/2 Signaling Cascade or p38 Mitogen-Activated Protein Kinase Signaling Pathway. Mol. Pharmacol. 2007, 72, 1626–1636. [Google Scholar] [CrossRef]
Figure 1.
Transcriptional landscape of the purinergic signaling system in Hepatocellular Carcinoma (HCC). (A) Principal Component Analysis (PCA) based on the expression profiles of 24 purinergic genes distinguishes primary tumor samples (red, n= 371) from solid tissue normal samples (blue, n= 50). PC1 accounts for 19.28% of the total variance. (B) Volcano plot illustrating differential expression analysis (Tumor vs. Normal). Red points represent significantly upregulated genes (log2FC > 0, FDR < 0.05), blue points represent downregulated genes (log2FC < 0, FDR < 0.05), and grey points indicate non-significant genes. Key purinergic genes are labeled. (C) Violin plots showing the expression distribution (log-transformed) of the top upregulated genes in tumor samples. (D) Violin plots showing the expression distribution of the top downregulated genes in tumor samples. The violin’s width represents the density of samples at different expression levels.
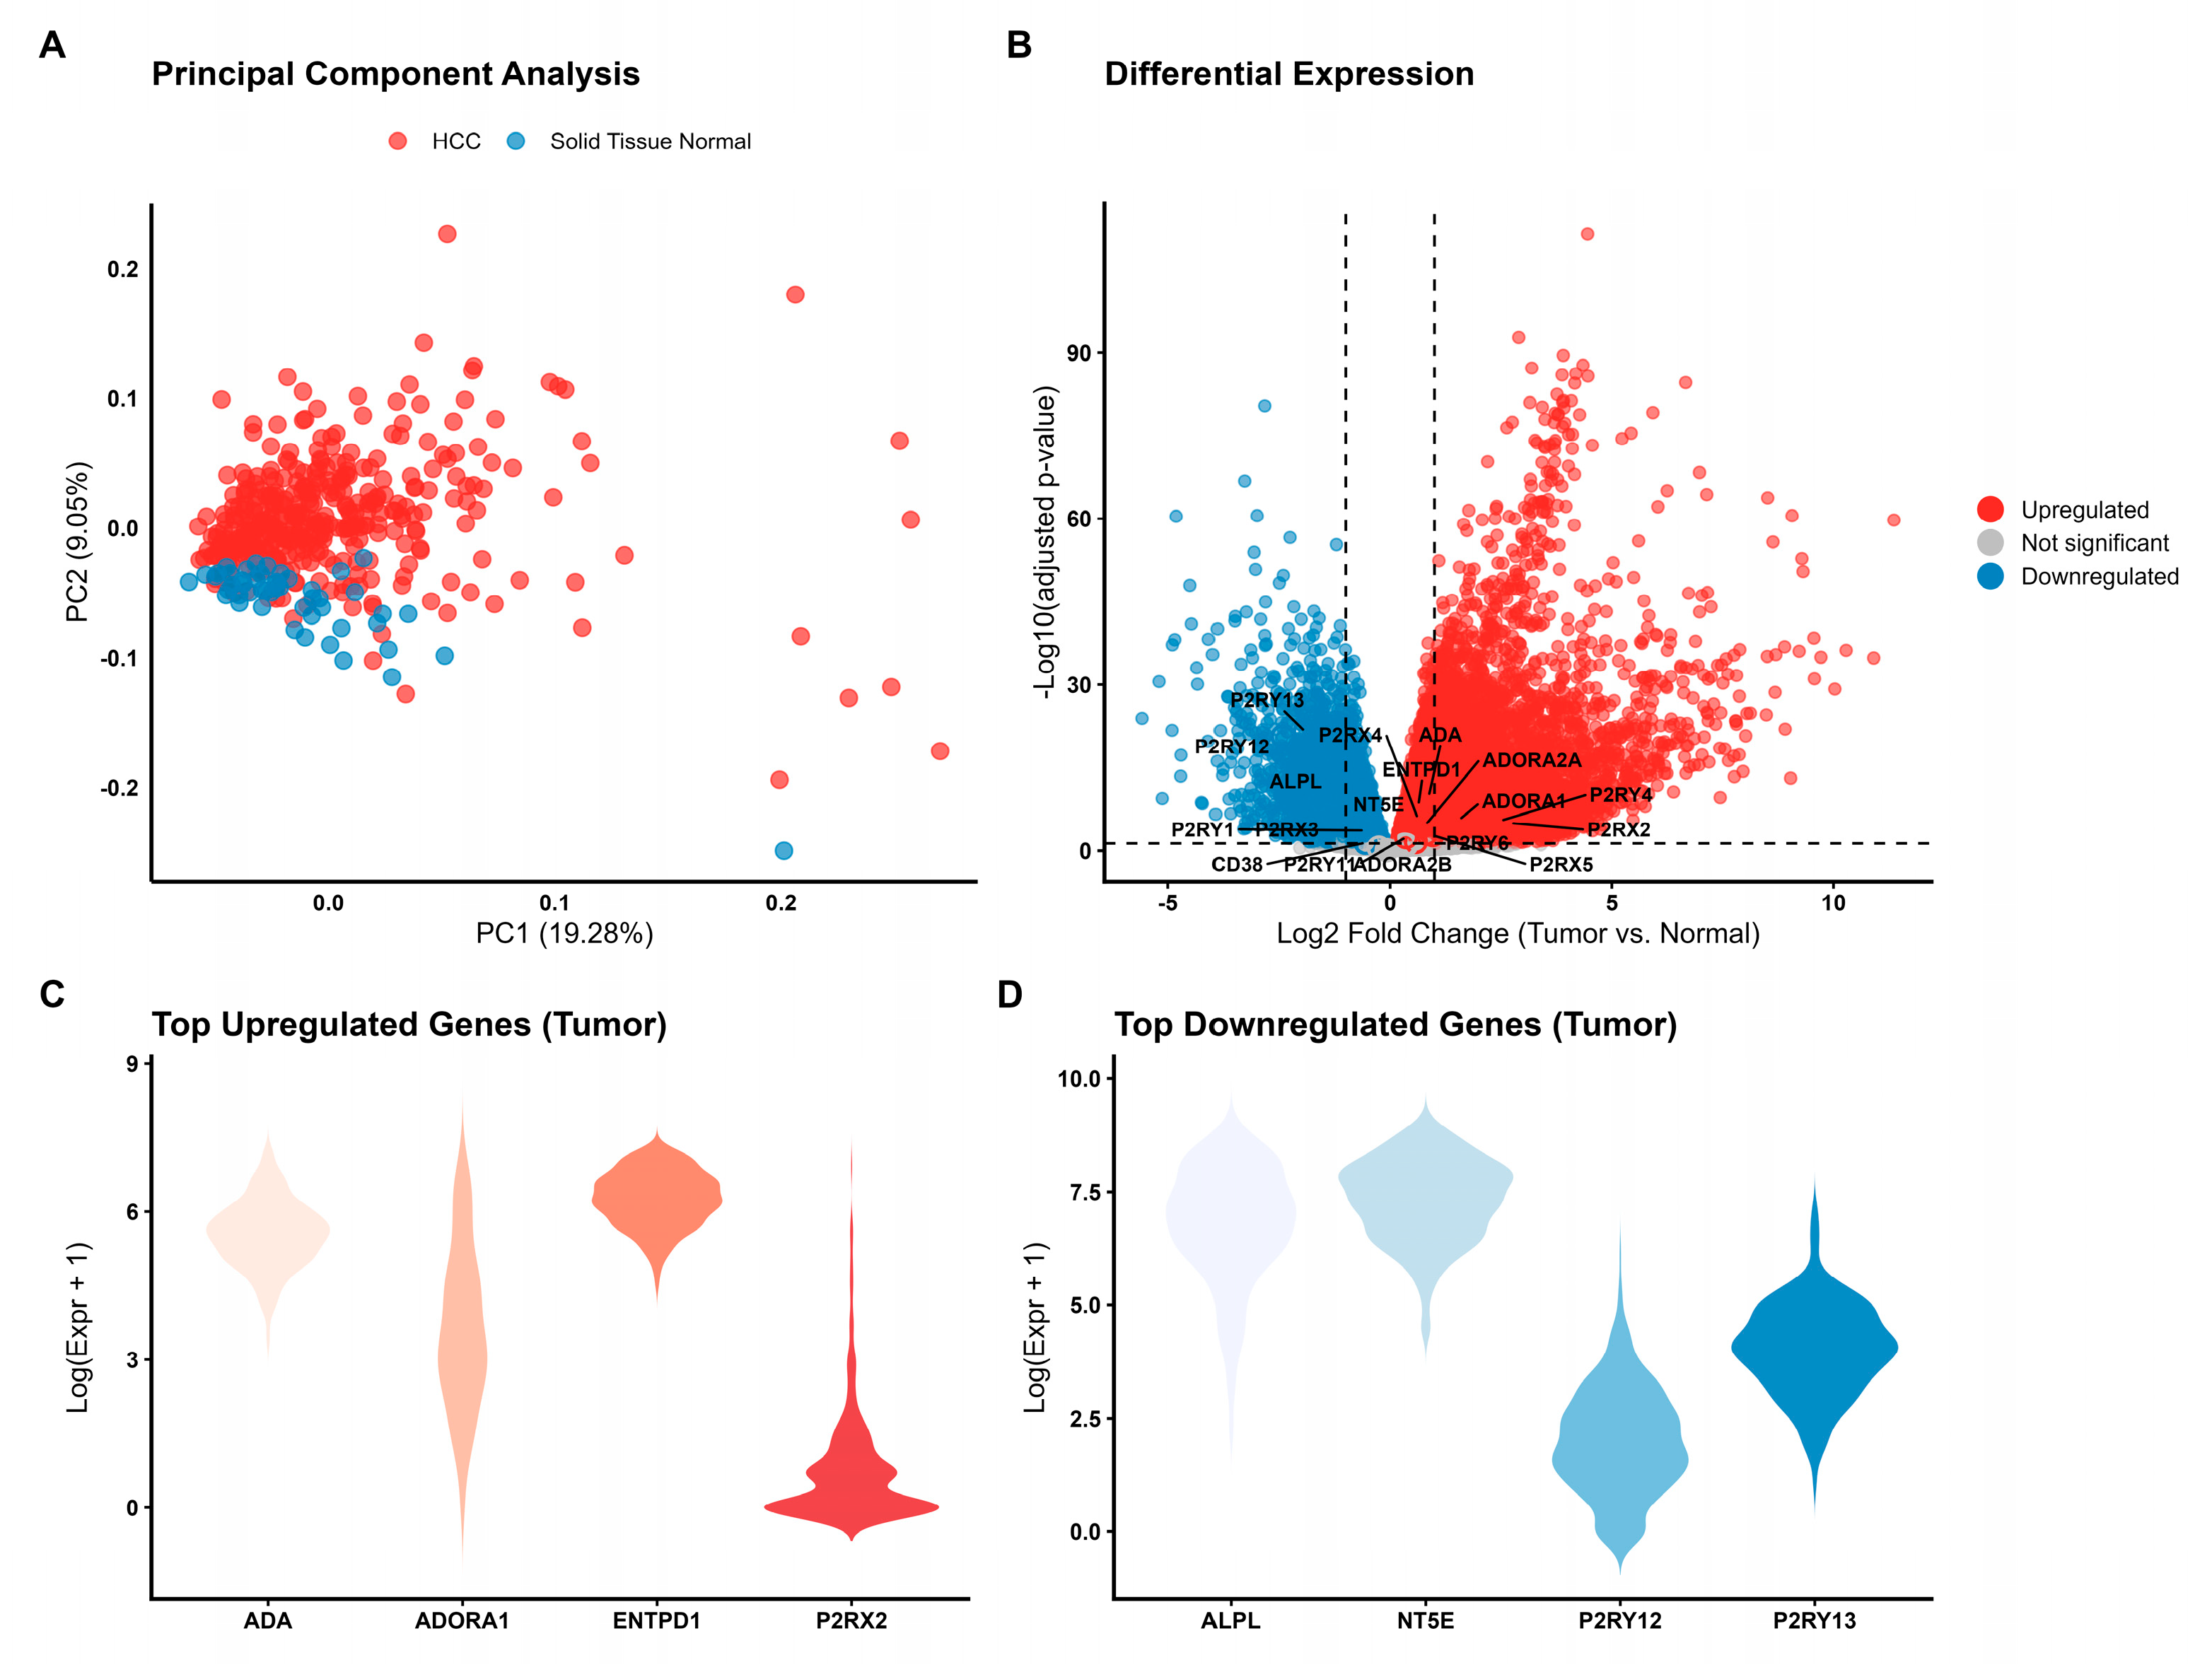
Figure 2.
Functional enrichment analysis of purinergic genes in HCC. (A) Lollipop plot showing the top enriched Gene Ontology (GO) Biological Processes. (B) Lollipop plot showing the top enriched KEGG pathways. The length of the line and the color of the dot represent statistical significance (-log10 FDR). The size of the dot represents the number of differentially expressed genes (Gene Count) associated with each term.

Figure 3.
Kaplan-Meier survival curves for the six genes significantly associated with overall survival (FDR < 0.05). Patients were stratified into “High” (red) and “Low” (blue) expression groups based on the median gene expression value. The p-values shown are from the log-rank test. High expression of (A) P2RY6, (B) ADA, (C) NT5E, (D) P2RX4, (E) P2RY4, and (F) ADORA1 is significantly associated with poor prognosis (shorter survival time).
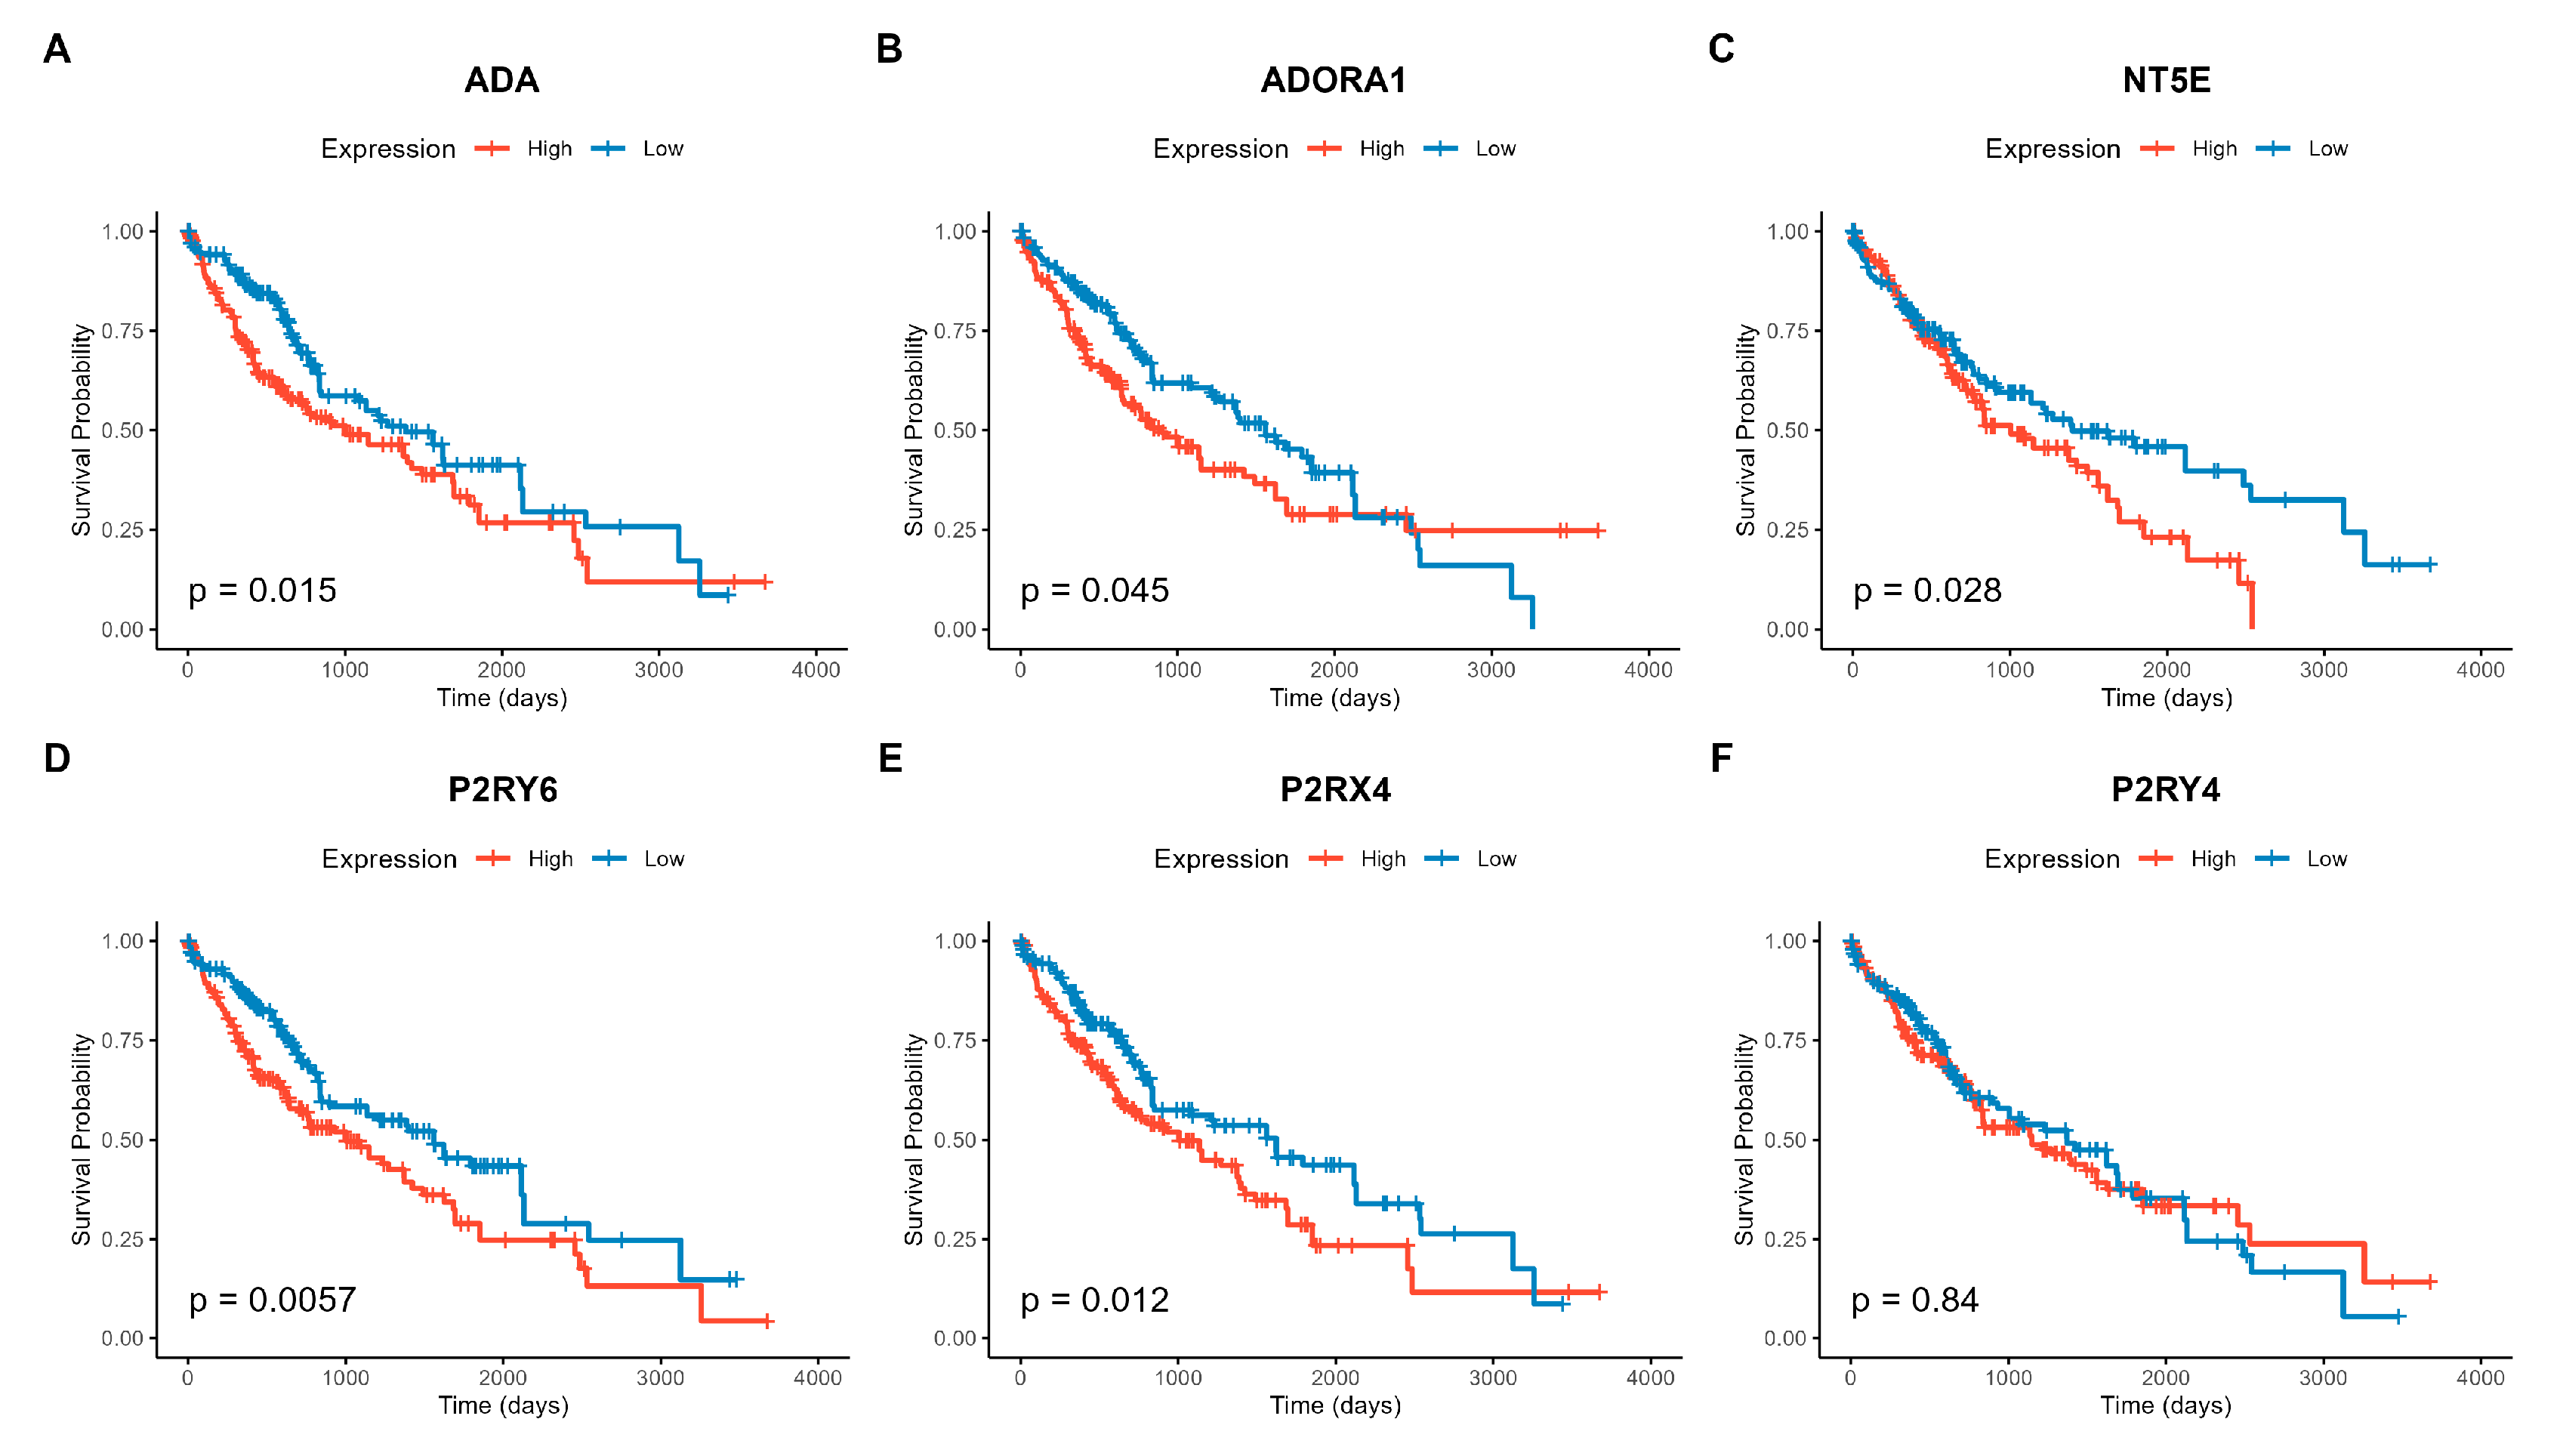
Figure 4.
Gene co-expression networks were constructed for normal adjacent tissue and primary tumor tissue. Nodes represent purinergic genes, with node size proportional to the number of connections (degree). Edges represent strong co-expression links (|r| > 0.4). The analysis reveals a transition from a dense, highly integrated network in normal tissue (Density: 0.602; 103 edges) to a fragmented architecture in the tumor (Density: 0.231; 18 edges).
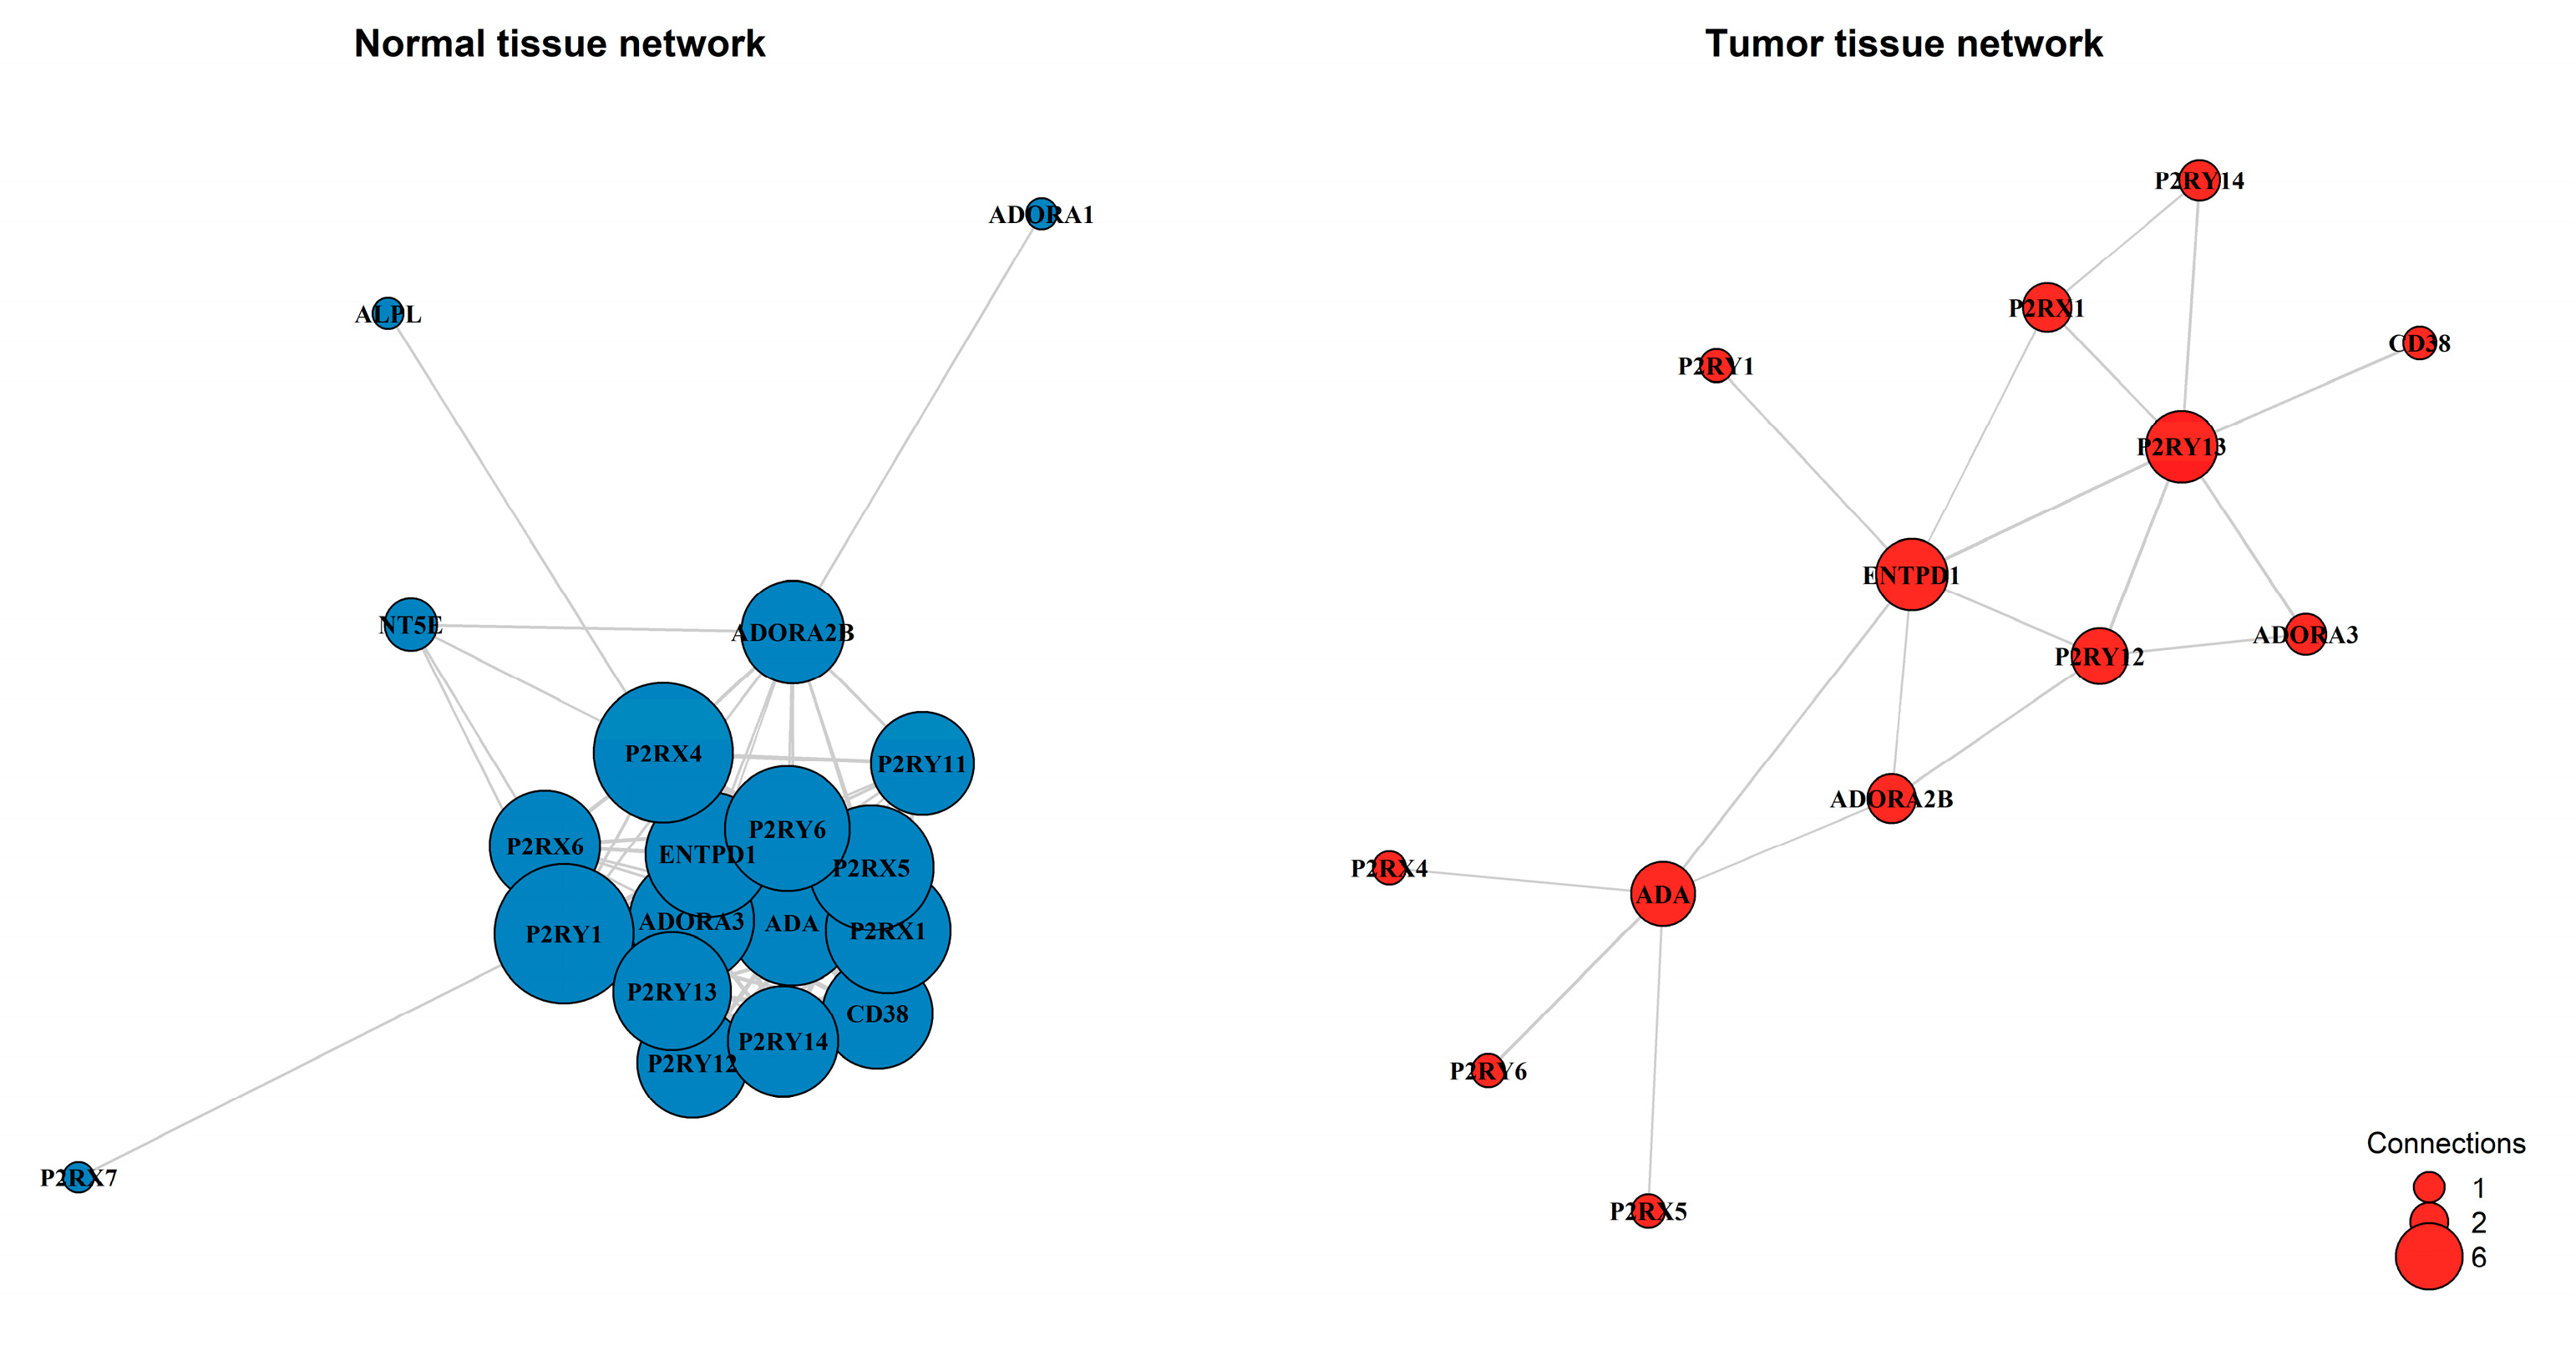
Figure 5.
Predictive performance and biomarker stability of the purinergic gene signature in HCC. (A) Receiver Operating Characteristic (ROC) curve evaluated on the independent test set. The Random Forest model achieved an Area Under the Curve (AUC) of 0.982, indicating strong discrimination between tumor and normal tissues. (B) Precision-Recall (PR) curve showing high precision across recall levels, confirming the model’s robustness despite the dataset’s class imbalance. (C) Biomarker stability analysis using Recursive Feature Elimination (RFE) with 100 bootstrap iterations. The lollipop plot illustrates the frequency with which each gene was selected as a key predictor across resamplings. Genes are ordered by stability and color-coded by their selection frequency.
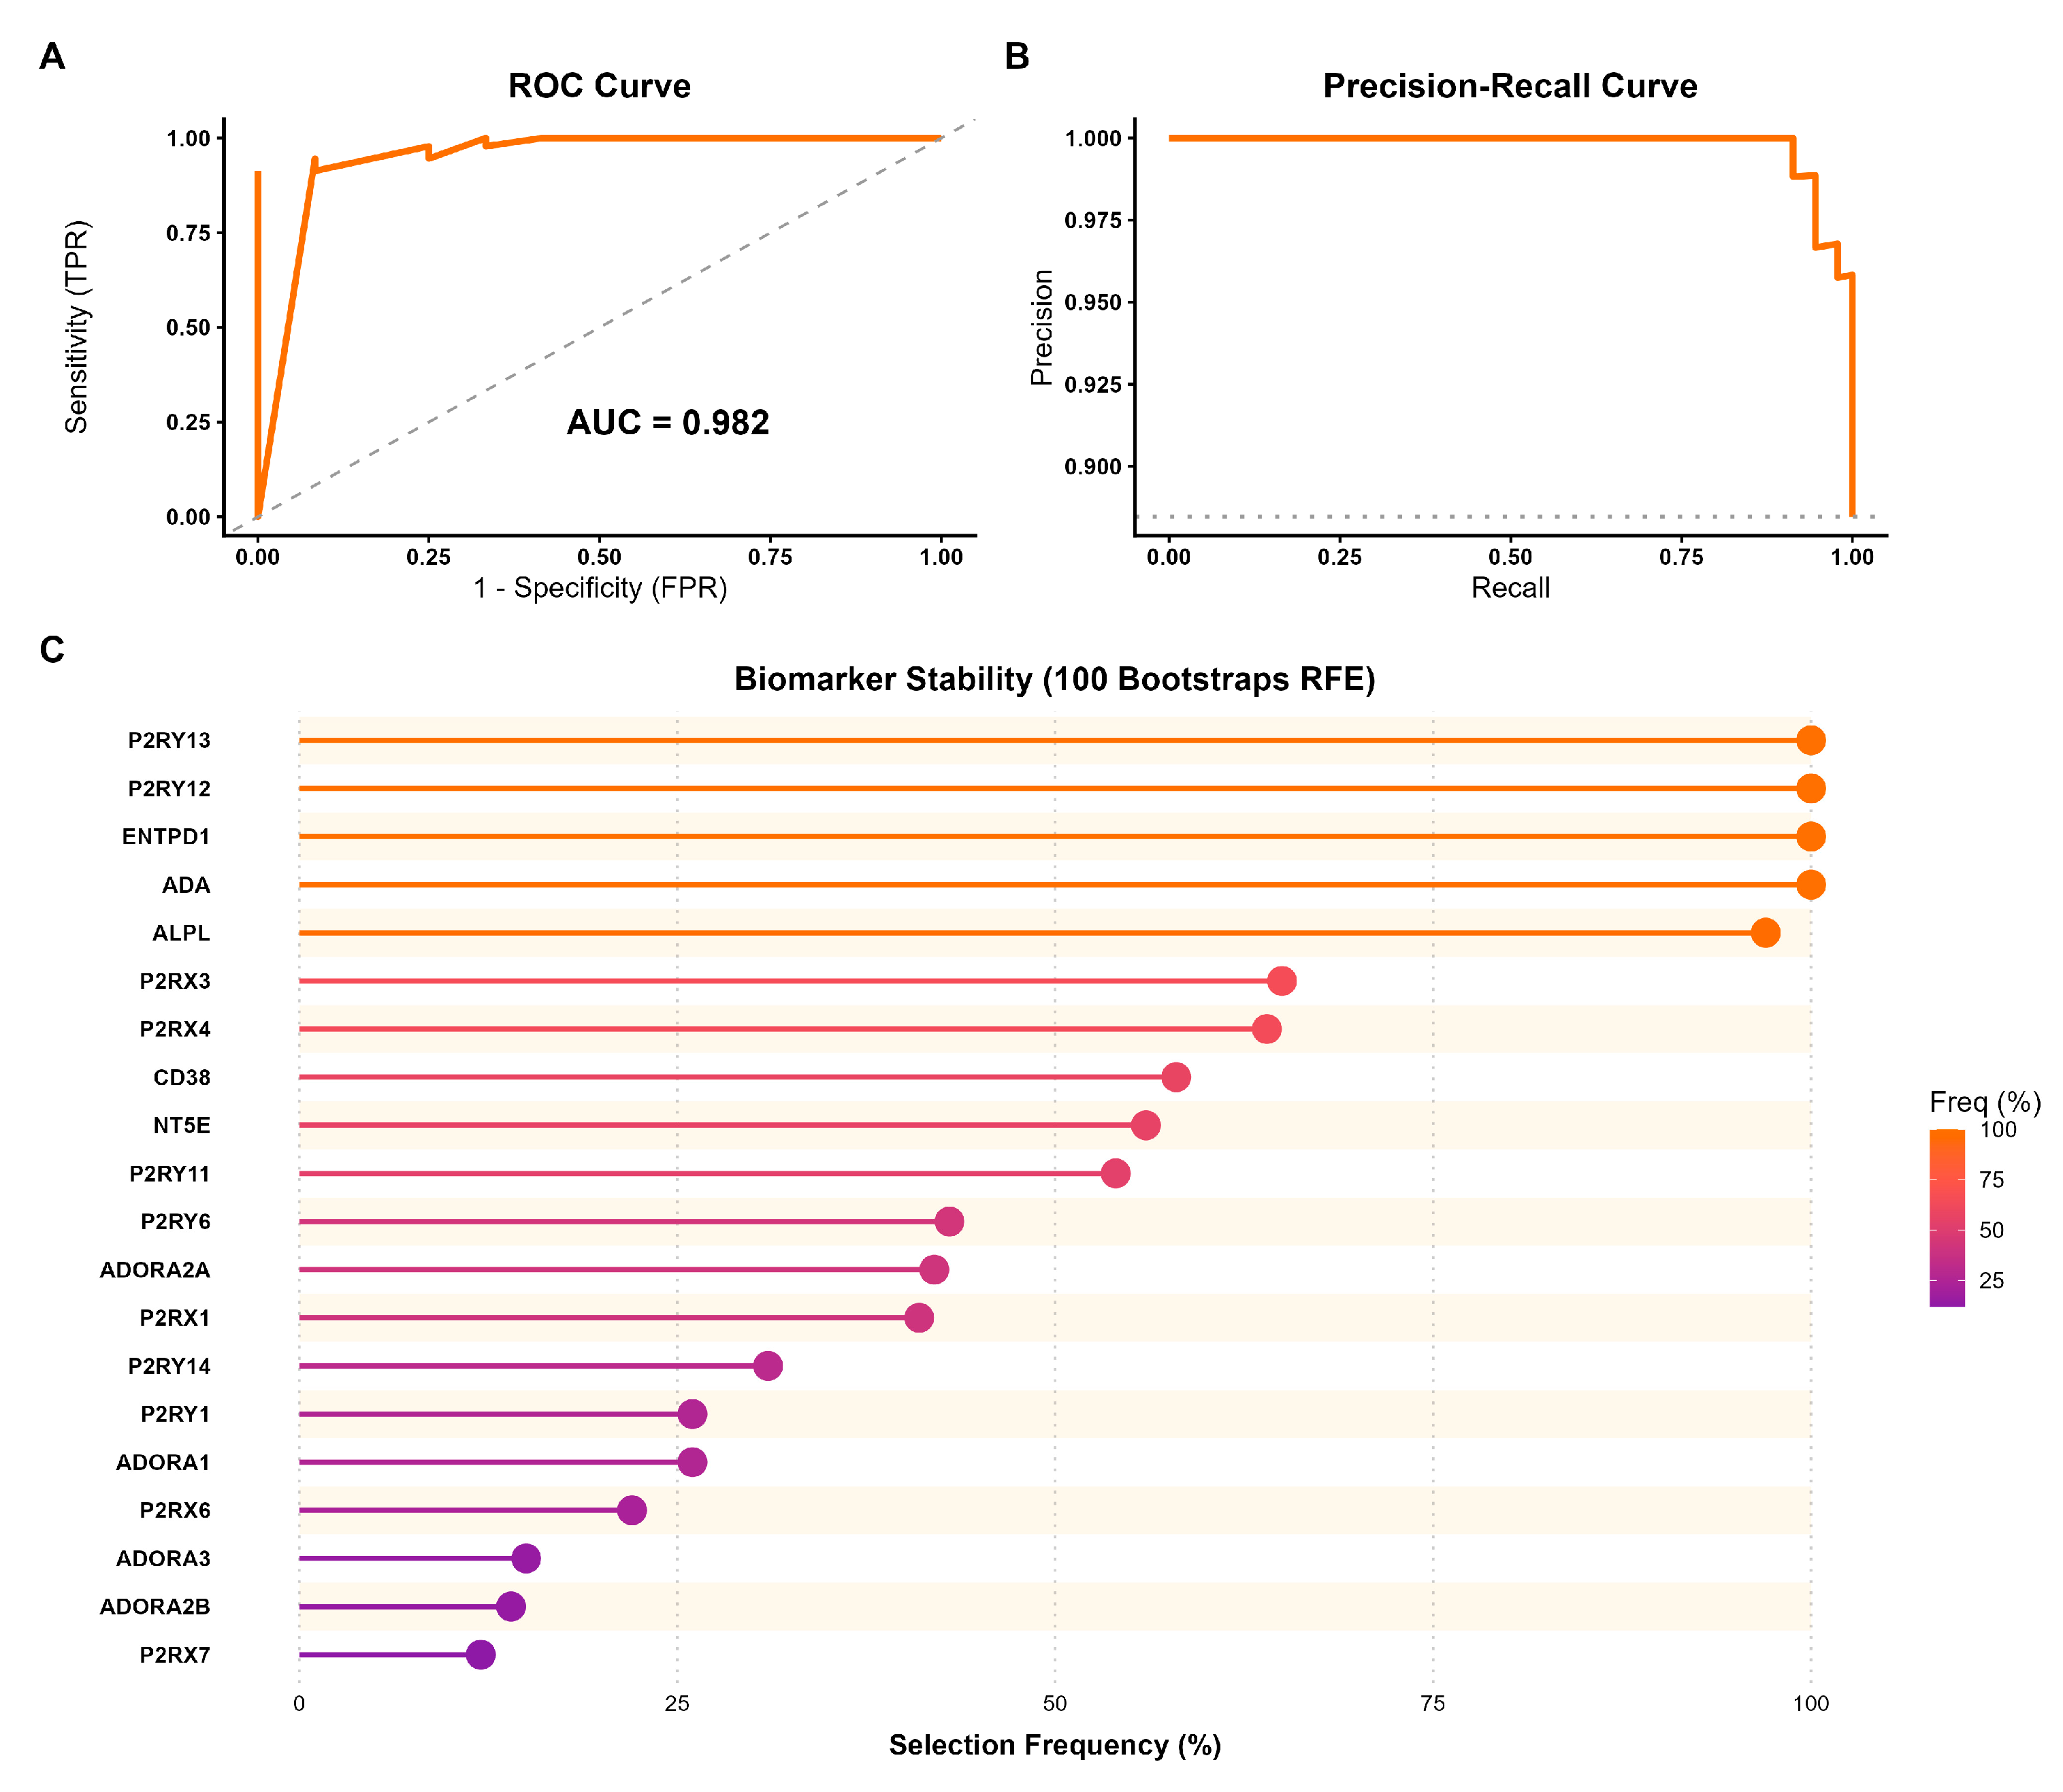
Figure 6.
Cytotoxicity and apoptotic efficacy of sorafenib and doxazosin combination in 3D liver tumor models. (A–D) Concentration-response viability curves determining the half-maximal inhibitory concentration (IC50) of sorafenib (A, B) and doxazosin (C, D) in HepG2 mono-culture and HepG2/LX-2 co-culture spheroids. (E–H) Evaluation of apoptosis via active caspase-3 detection by flow cytometry. (E) Quantification of caspase-3 expression intensity (MFI fold change) and (F) frequency of positive cells (%) in spheroids treated with Sorafenib monotherapy (10 µM and 25 µM) or combined with doxazosin 30 µM (S1D: Sorafenib 10 µM + Doxazosin; S2D: Sorafenib 25 µM + Doxazosin). (G–H) Representative flow cytometry histograms showing the fluorescence shift of active caspase-3 in HepG2 (G) and HepG2/LX-2 (H) spheroids. Data are presented as mean ± SD. Statistical significance was determined by ANOVA; Interaction p-values indicate the interplay between treatment and culture system.
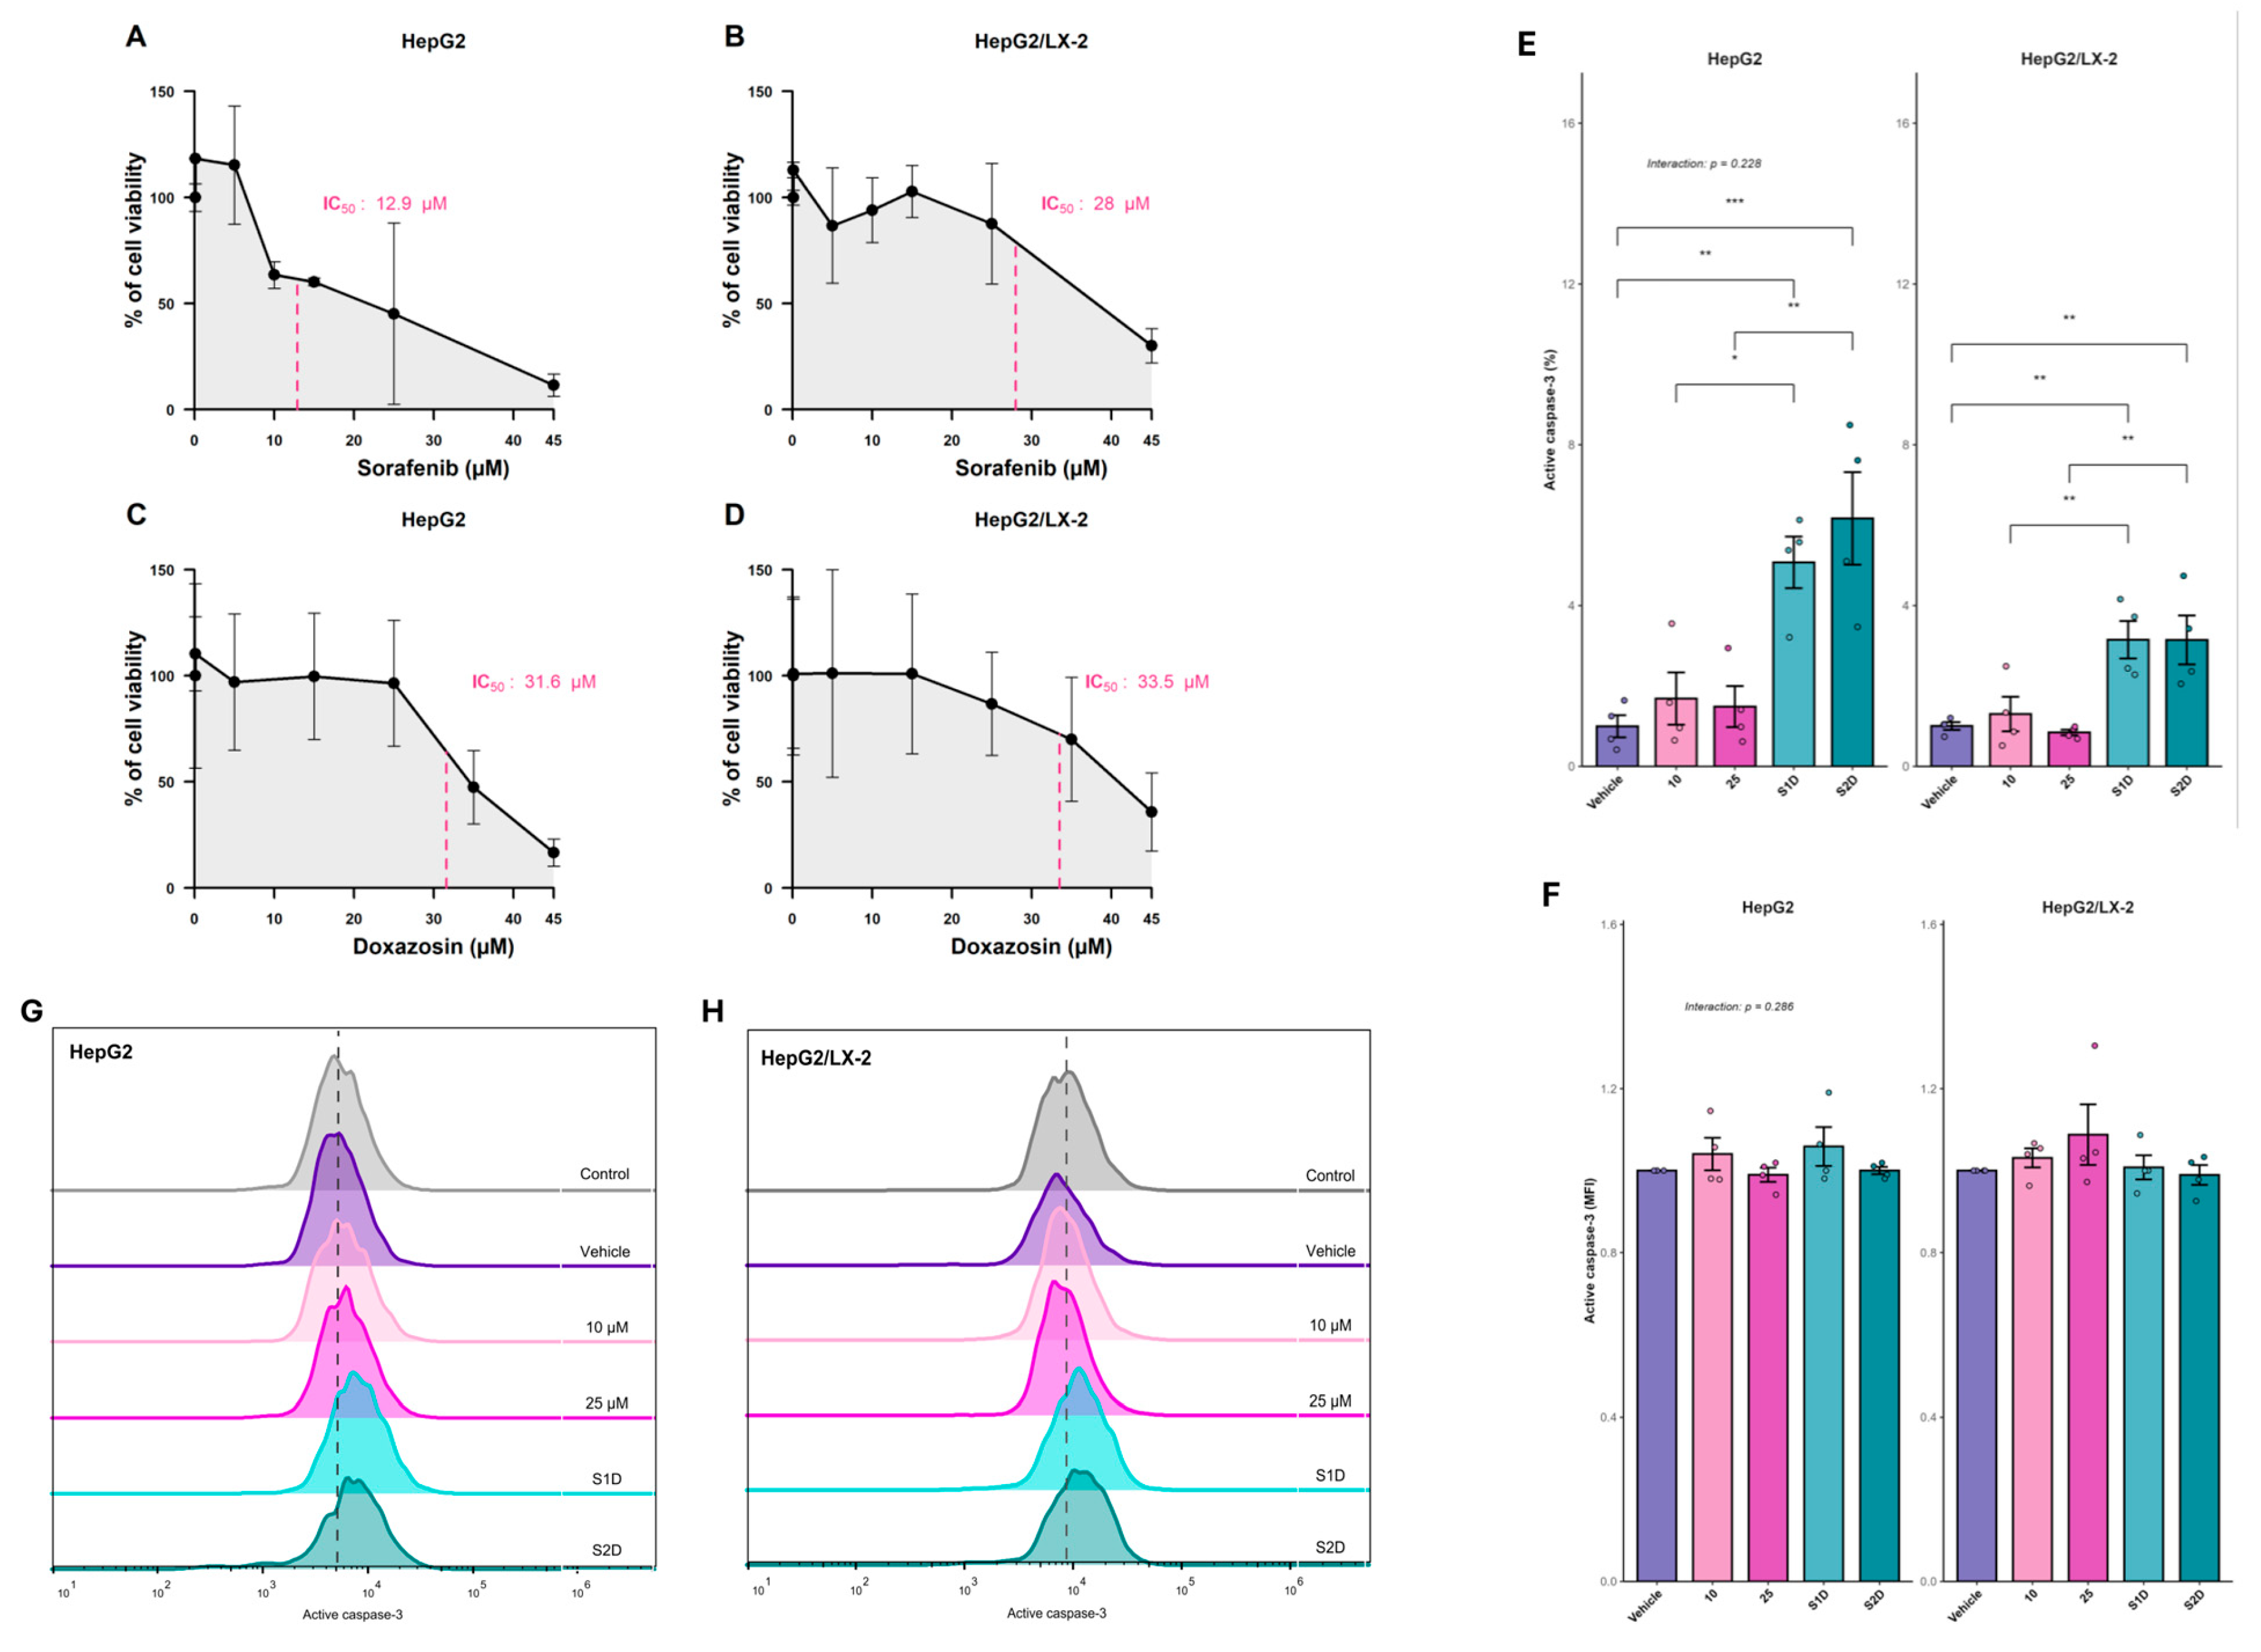
Figure 7.
Purinergic signaling pathway gene expression by qPCR. (A–F) Relative mRNA expression of ecto-enzymes (ENTPD1, NT5E, ADA) and adenosine receptors (ADORA1, ADORA2A, ADORA2B) in HepG2 and HepG2/LX-2 spheroids treated with 25 µM of sorafenib or S2D. Data were normalized to the housekeeping gene RACK1. (G) Analysis of biological effect size (Cohen’s d); the dashed line indicates the threshold for a large effect (>0.8), highlighting biological relevance independent of p-value.
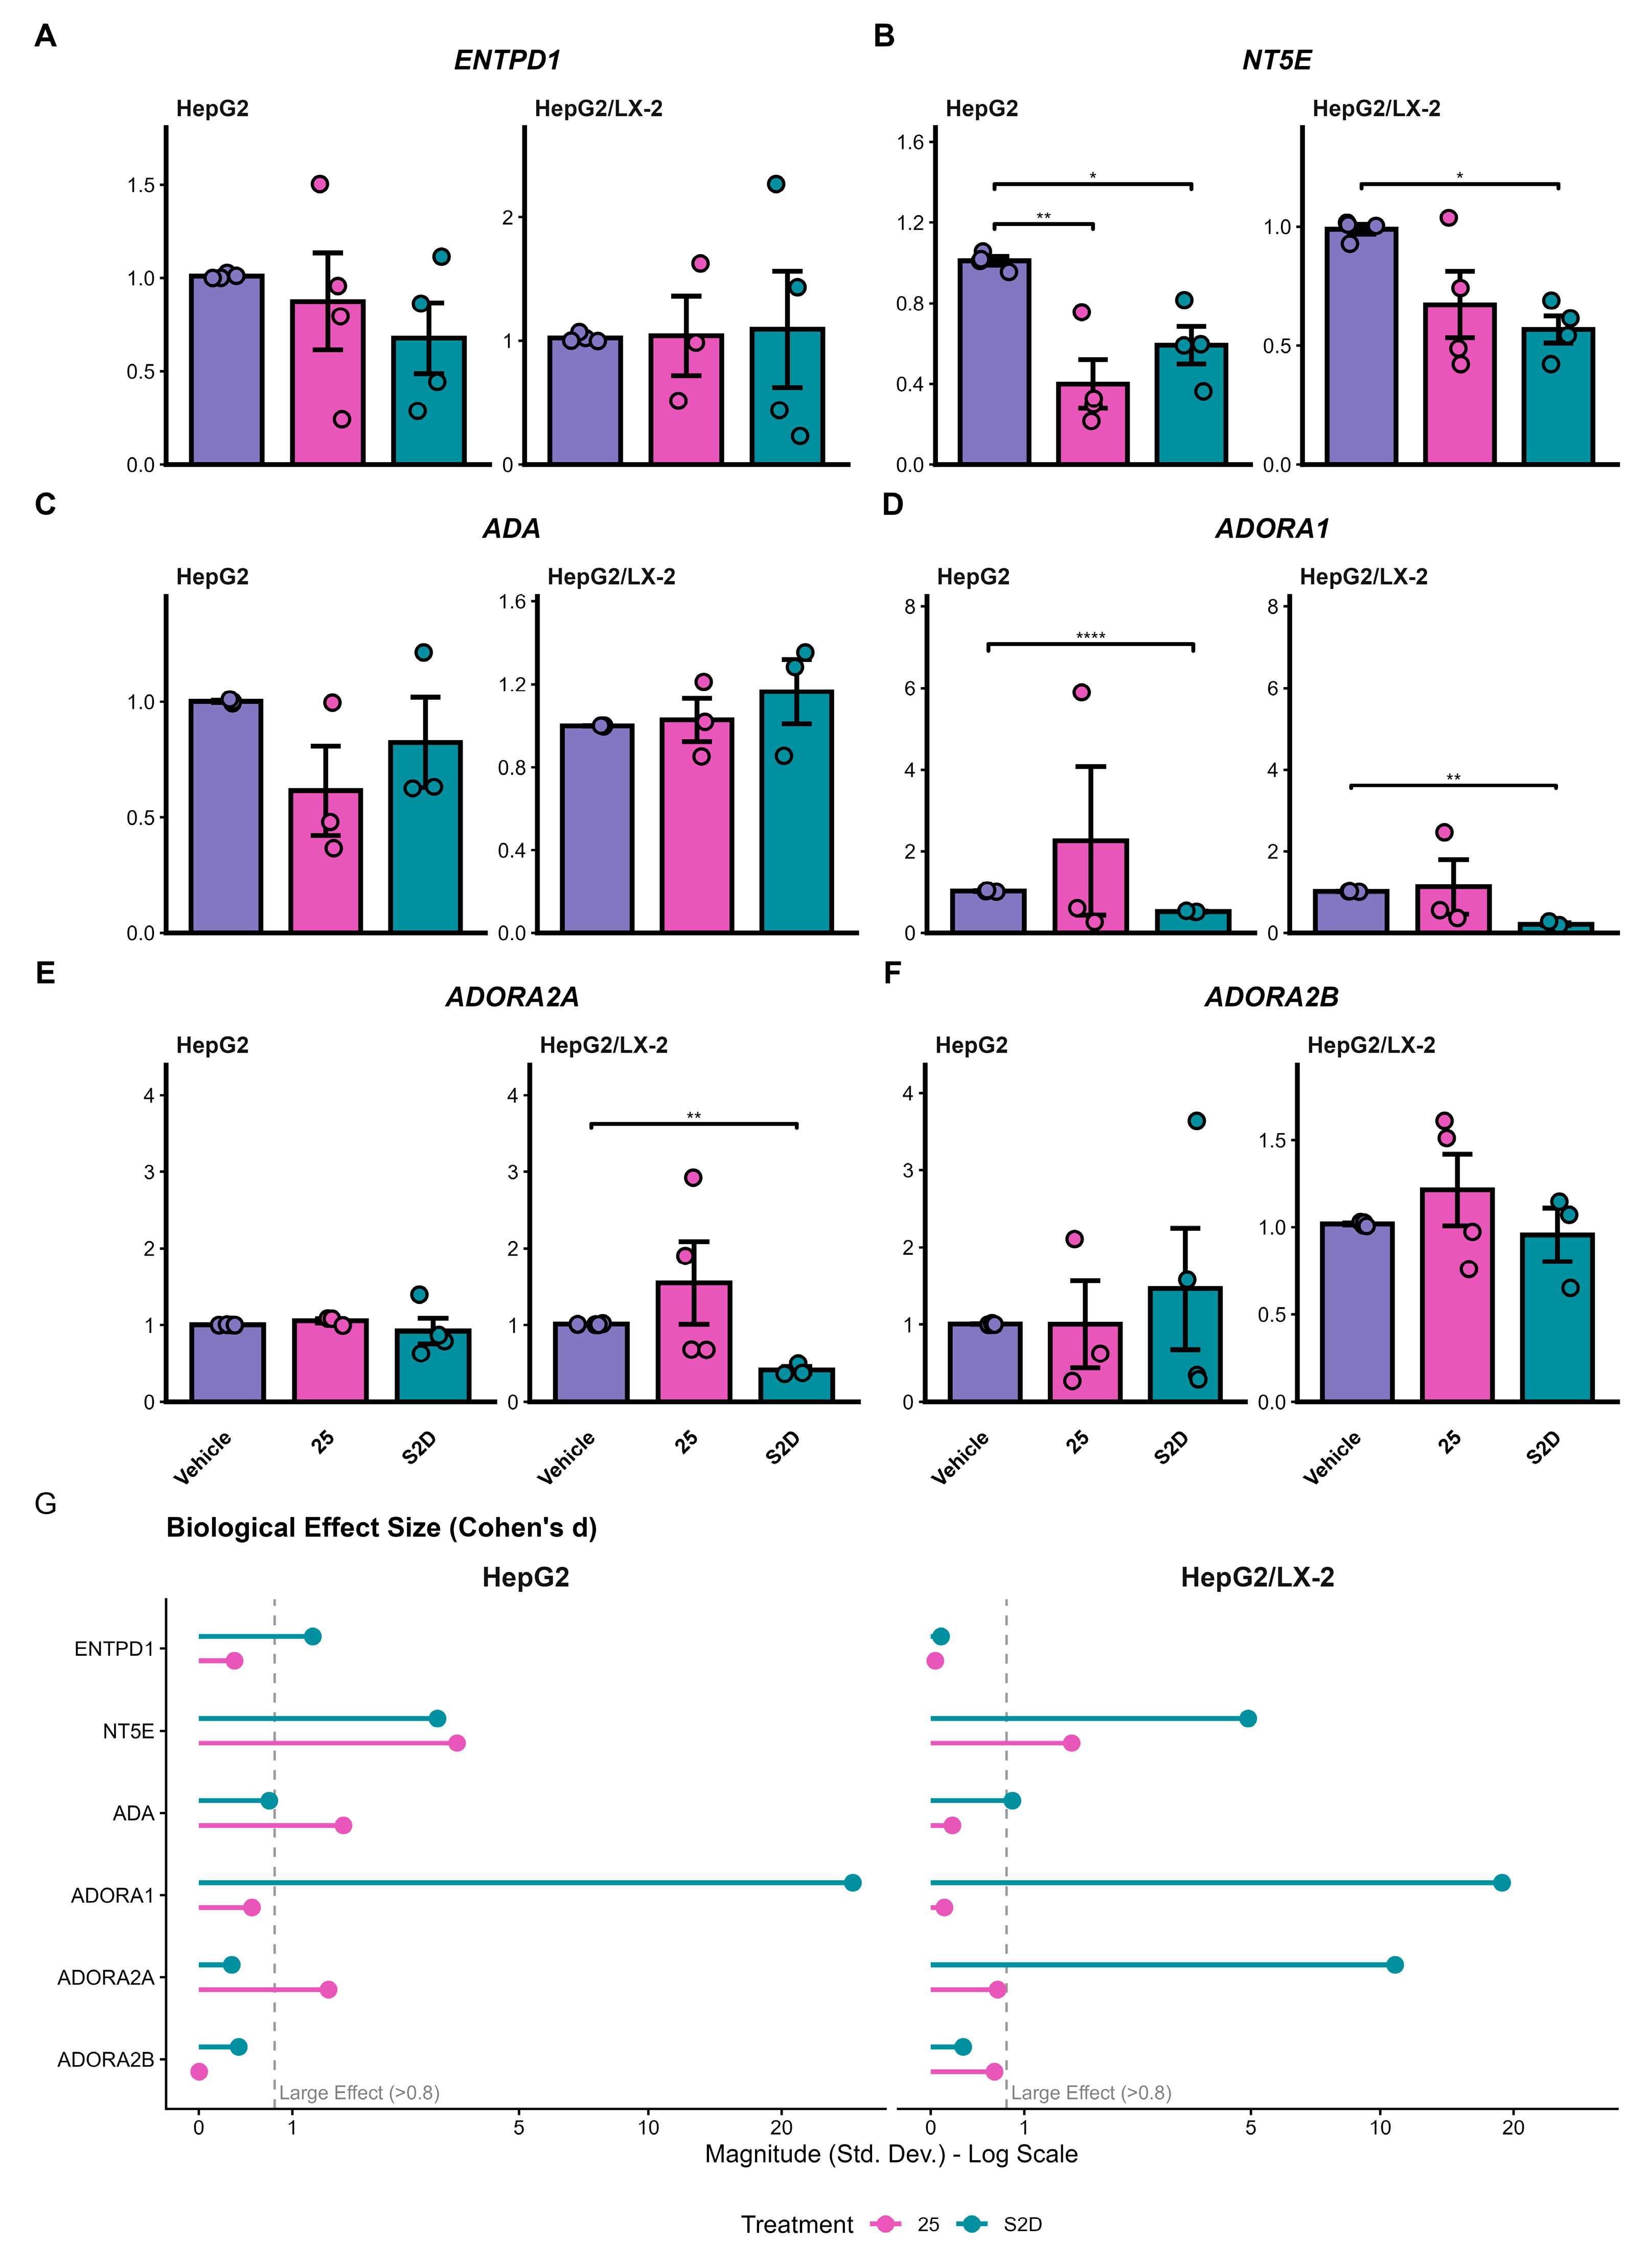
Figure 8.
Surface protein expression of purinergic ecto-enzymes in HepG2 spheroids. Flow cytometry analysis of CD39 (A, B), CD73 (C, D), and CD26 (E, F) in HepG2 mono-cultures and HepG2/LX-2 co-cultures. Panels A, C, and E show the Median Fluorescence Intensity (MFI) fold change relative to vehicle control. Panels B, D, and F show the frequency (%) of positive cells.
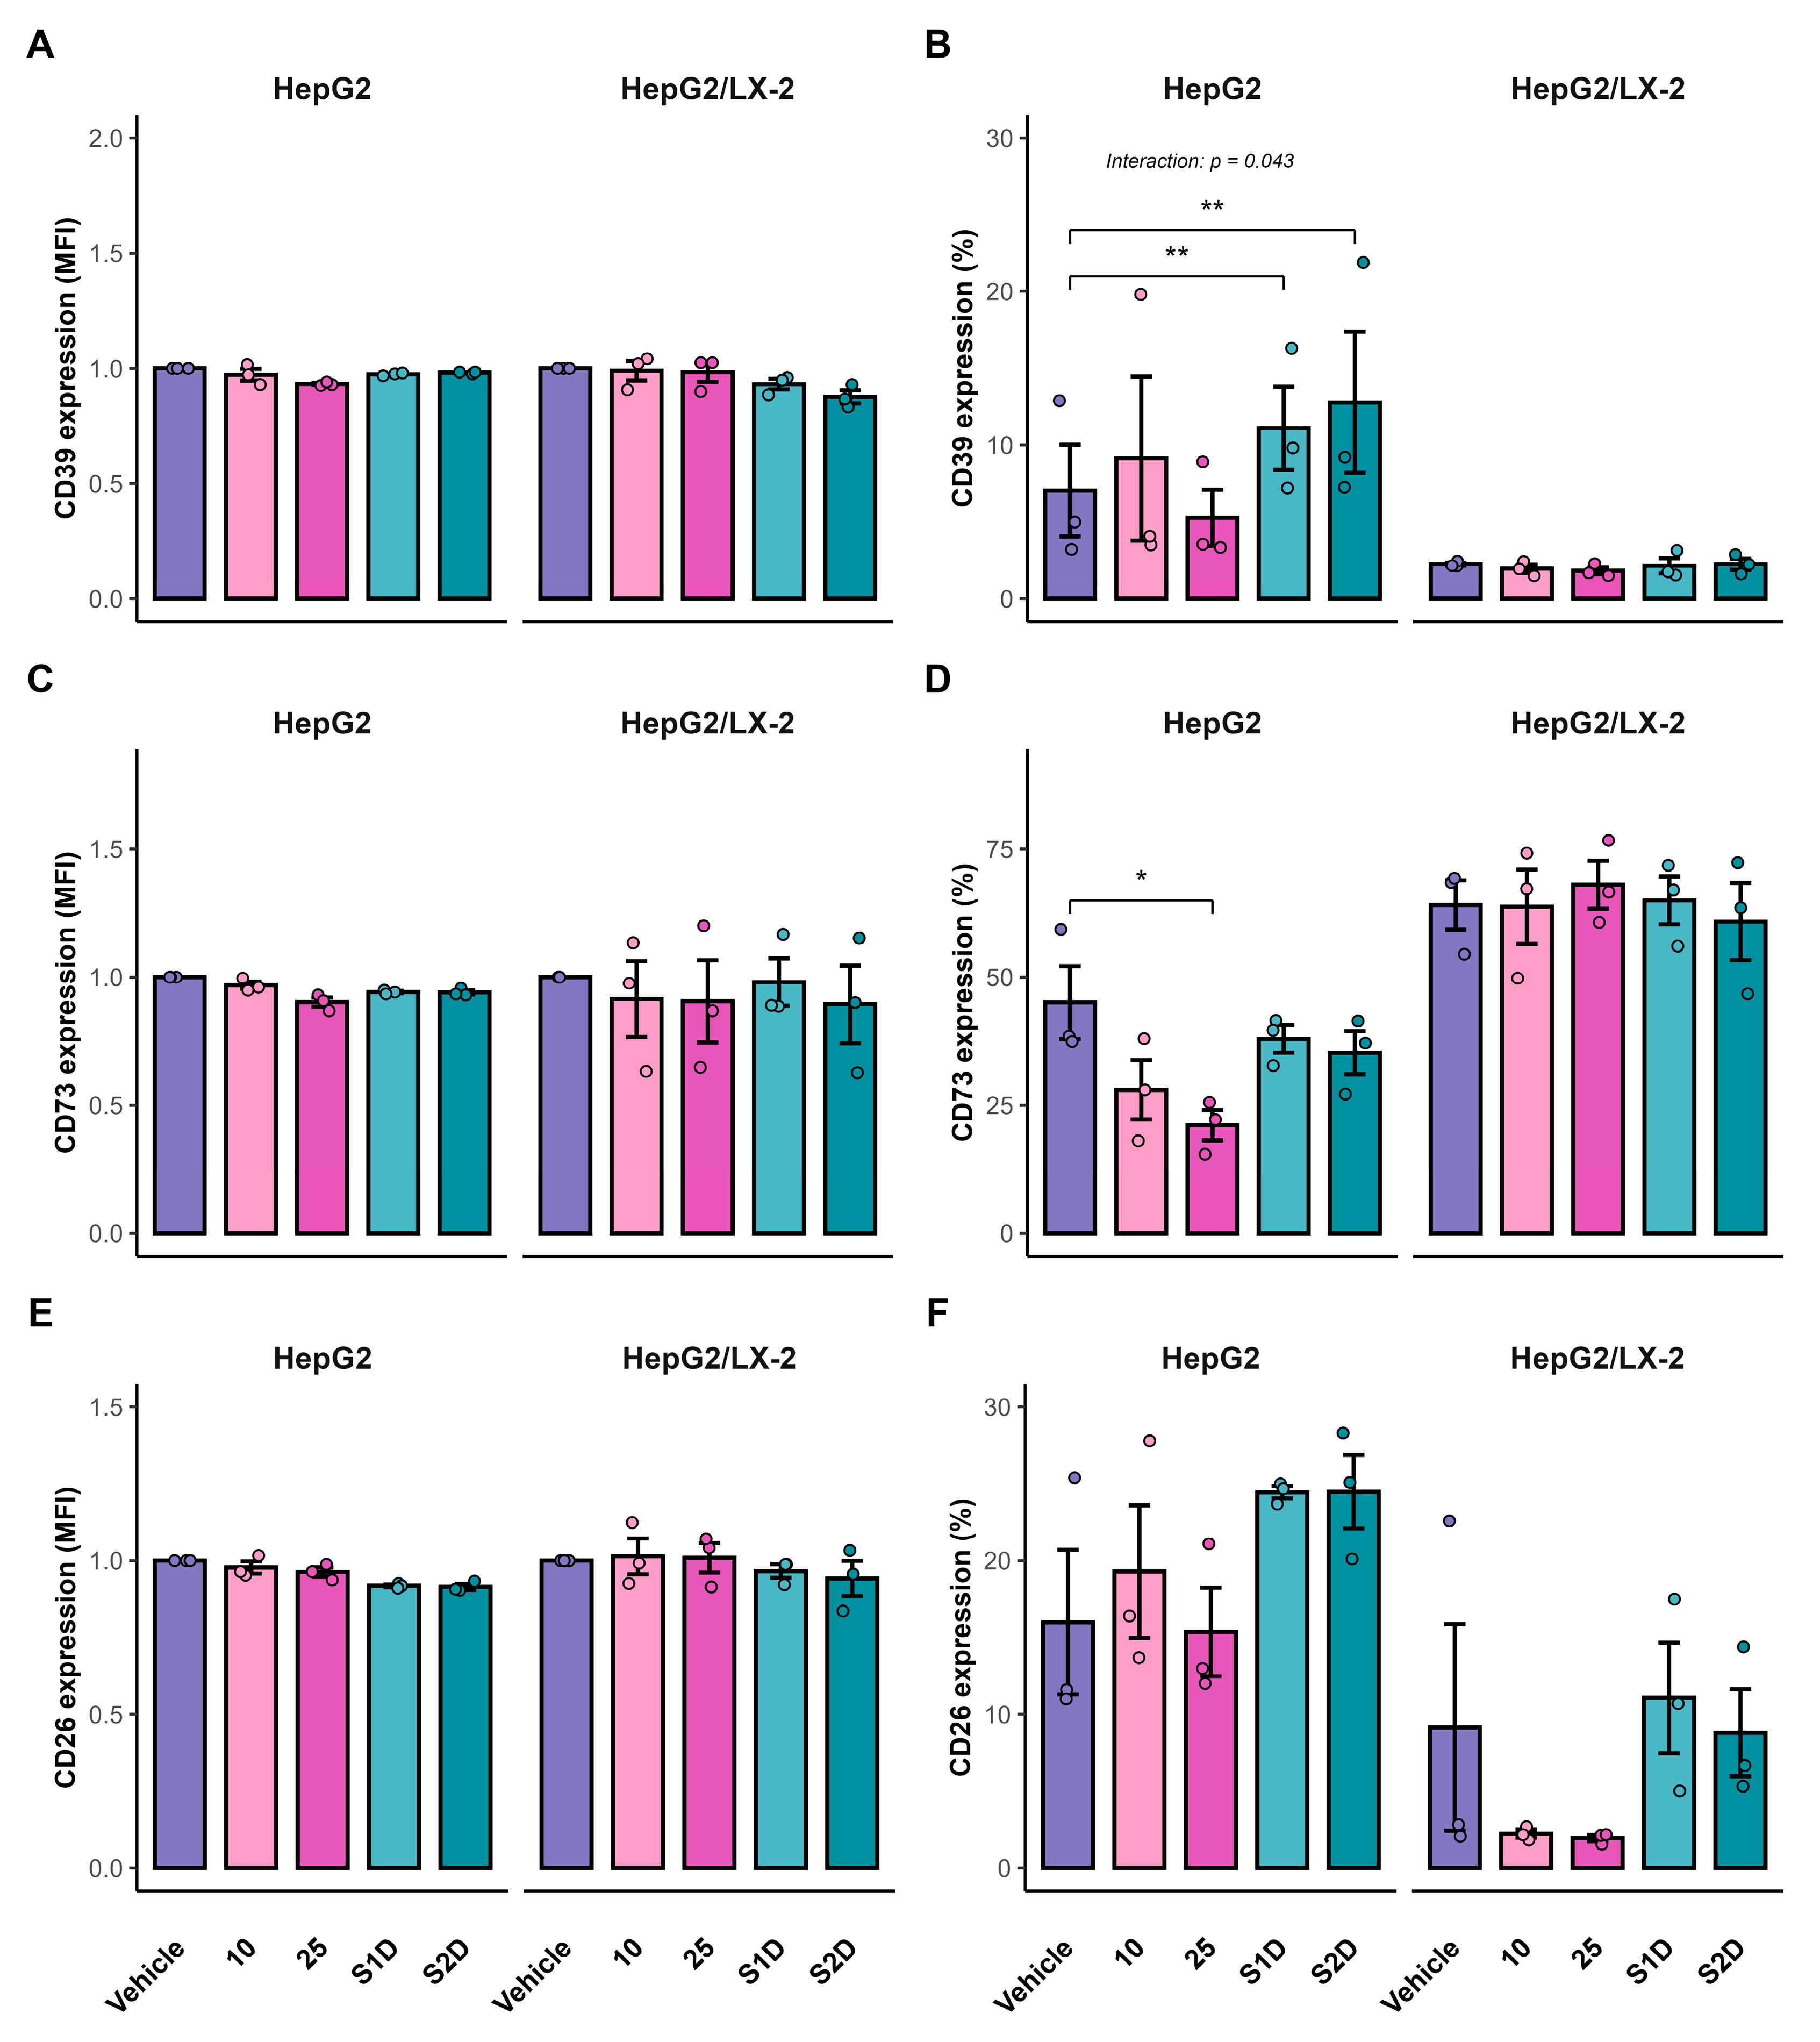

Table 1.
Differential expression statistics for the 24 purinergic system genes in HCC versus normal tissue.
Table 1.
Differential expression statistics for the 24 purinergic system genes in HCC versus normal tissue.
| Gene Symbol | Log2 Fold Change | Adj. P-value (FDR) | Regulation status |
|---|---|---|---|
| P2RX2 | 2.71 | < 0.001 | Upregulated |
| P2RY4 | 2.49 | < 0.001 | Upregulated |
| ADORA1 | 1.56 | < 0.001 | Upregulated |
| P2RX5 | 0.96 | 0.002 | Upregulated |
| ADA | 0.87 | < 0.001 | Upregulated |
| P2RY6 | 0.82 | < 0.001 | Upregulated |
| ADORA2A | 0.8 | < 0.001 | Upregulated |
| ENTPD1 | 0.64 | < 0.001 | Upregulated |
| P2RX4 | 0.62 | < 0.001 | Upregulated |
| ADORA2B | 0.58 | 0.026 | Upregulated |
| P2RY11 | 0.36 | 0.004 | Upregulated |
| CD38 | -0.56 | 0.037 | Downregulated |
| P2RY1 | -0.58 | < 0.001 | Downregulated |
| NT5E | -0.79 | < 0.001 | Downregulated |
| P2RX3 | -1.31 | < 0.001 | Downregulated |
| ALPL | -1.58 | < 0.001 | Downregulated |
| P2RY13 | -1.92 | < 0.001 | Downregulated |
| P2RY12 | -2.42 | < 0.001 | Downregulated |
| P2RY14 | 0.36 | 0.087 | Not significant |
| P2RY2 | 0.32 | 0.077 | Not significant |
| P2RX7 | -0.26 | 0.266 | Not significant |
| ADORA3 | -0.26 | 0.278 | Not significant |
| P2RX1 | -0.08 | 0.758 | Not significant |
| P2RX6 | -0.08 | 0.826 | Not significant |
Disclaimer/Publisher’s Note: The statements, opinions and data contained in all publications are solely those of the individual author(s) and contributor(s) and not of MDPI and/or the editor(s). MDPI and/or the editor(s) disclaim responsibility for any injury to people or property resulting from any ideas, methods, instructions or products referred to in the content. |
© 2026 by the authors. Licensee MDPI, Basel, Switzerland. This article is an open access article distributed under the terms and conditions of the Creative Commons Attribution (CC BY) license (http://creativecommons.org/licenses/by/4.0/).
Copyright: This open access article is published under a Creative Commons CC BY 4.0 license, which permit the free download, distribution, and reuse, provided that the author and preprint are cited in any reuse.


