
Submitted:
27 October 2025
Posted:
28 October 2025
You are already at the latest version
Abstract
Hypoxia drives esophageal adenocarcinoma (EAC) aggressiveness through stabilization of HIF1α, which regulates pro-survival and pro-metastatic pathways, including the immunosuppressive ectoenzyme CD73 (NT5E). Here, we show that NT5E is transcriptionally upregulated by HIF1α under hypoxia in EAC, correlating with advanced disease stage and poor patient survival. While NT5E inhibition alone modestly affects EAC cell viability, combined inhibition with HIF1α, particularly under hypoxia, synergistically decreases cell survival and alters purinergic metabolism. Beyond direct tumor cell effects, dual targeting of HIF-1α and CD73 disrupts CD73-mediated extracellular adenosine signaling, inhibits migration, reduces VEGF secretion, and impairs angiogenesis, highlighting disruption of tumor microenvironmental pathways critical for immune evasion and metastasis. These findings support a combinatorial strategy targeting HIF1α and CD73 as a therapeutic approach to overcome hypoxia-driven resistance in EAC.
Keywords:
HIF1α
; CD73
; NT5E
; hypoxia
; esophageal adenocarcinoma (EAC)
; purinergic signaling
; angiogenesis
1. Introduction
Esophageal cancer is the seventh leading cause of cancer-related mortality worldwide[1], with esophageal adenocarcinoma (EAC) representing a rapidly rising subtype in Western countries due to the increasing prevalence of obesity and gastroesophageal reflux disease[2,3,4]. Despite advancements in surgery, chemotherapy, and immunotherapy, the prognosis for EAC remains poor, with a five-year survival rate of 22%[5]. Tumor hypoxia, a hallmark of solid tumors, drives aggressive behavior and therapeutic resistance through stabilization of hypoxia-inducible factor 1-alpha (HIF1α), which regulates genes involved in angiogenesis, metabolism, and immune evasion[6,7].
Among the downstream targets of HIF1α, NT5E (CD73), an ecto-5′-nucleotidase, plays a pivotal role in the tumor microenvironment by converting extracellular AMP to immunosuppressive adenosine. NT5E-mediated adenosine accumulation suppresses anti-tumor immune responses, promotes angiogenesis, and facilitates metastasis, contributing to treatment resistance and poor clinical outcomes[8,9]. NT5E is frequently overexpressed, and its high expression is associated with advanced disease stage and poor survival across multiple cancers, including EAC[10,11,12]. Therapeutic targeting of CD73 has shown promise in preclinical models, particularly when combined with immune checkpoint inhibitors[13,14]. However, its specific role in hypoxic EAC and the direct effects of NT5E inhibition in cancer cells, independent of tumor microenvironmental influences, remain poorly understood.
In parallel, HIF1α has been implicated in regulating CD73 expression under hypoxia, linking hypoxic adaptation to adenosine-mediated immunosuppression[11,15,16,17]. However, strategies that simultaneously disrupt hypoxia-driven transcriptional programs and CD73-mediated extracellular adenosine signaling in EAC have not been fully explored. We hypothesize that dual targeting of HIF1α and CD73 will synergistically reduce EAC cell viability and disrupt pro-tumor microenvironmental pathways, offering a novel therapeutic approach for hypoxic, treatment-resistant EAC.
In this study, we investigated the regulation of NT5E by HIF1α in EAC under hypoxia, assessed the effects of dual inhibition on purinergic metabolism and cell viability, and evaluated their combined impact on migration, angiogenesis, and the extracellular microenvironment, aiming to inform the development of rational combinatorial strategies for EAC therapy.
2. Methods
2.1. Gene Expression and Survival Analysis
Gene expression data from the Cancer Cell Line Encyclopedia(CCLE) was downloaded from the DepMap portal[18] (DepMap Public 24Q2) and TCGA-ESCA data for esophageal cancer patients was downloaded from cBioPortal[19]. For stratifying patients by high and low expression of NT5E, patients were classified into two expression groups by maximally separated Kaplan-Meier plots.
2.2. Immunohistochemistry
Formalin-fixed paraffin-embedded (FFPE) tissue sections (4 µm) from EAC tumor and matched adjacent normal were baked (60 °C, 1 h), deparaffinized, rehydrated, and subjected to heat-induced epitope retrieval (10mM Sodium Citrate pH 6.0; HIF-1α: Tris-EDTA pH 9.0; 95–100 °C, 30 min). Endogenous peroxidase was quenched (3% H2O2, 10 min) and slides were blocked (5% normal horse serum, 30 min). Primary antibodies were applied overnight at 4 °C: NT5E/CD73 (D7F9A) Rabbit mAb #13160, 1:200; HIF-1α (D1S7W) XP® Rabbit mAb, 1:100. Detection used an HRP-polymer secondary with DAB chromogen, hematoxylin counterstain, dehydration, and resin mounting. H&E was performed per standard protocols. Negative controls (no primary/isotype) and vendor-recommended positive controls were included each run. Brightfield images were acquired on the same system with matched exposure settings; representative tumor and adjacent normal regions are shown in Figure 1G.
2.3. Cell Culture and Hypoxia Treatment
FLO-1, OE19 and OE33 esophageal adenocarcinoma (EAC) cells were cultured in RPMI 1640 supplemented with 10% fetal bovine serum and 1% penicillin-streptomycin at 37 °C and 5% CO2. For hypoxia experiments, cells were serum-starved (RPMI + 1% FBS) for 8 hours prior to assays and were placed in a hypoxia chamber (1% O2, 5% CO2, 94% N2).
2.4. siRNA Knockdown
Cells were transfected using Trilencer-27 siRNA kits (Origene) targeting NT5E, HIF1α, or non-targeting control siRNA using SiTran2.0 transfection reagent according to the manufacturer’s protocol. Knockdown efficiency was confirmed by qPCR and Western blots.
2.5. Drug Treatments
Cells were treated with acriflavine (Sigma-Aldrich) as a HIF1α inhibitor and PSB12379 (MedChem Express) as a CD73/NT5E inhibitor at indicated concentrations under normoxic or hypoxic conditions for 24–72 hours prior to viability, migration, or cell pellet/conditioned media collection for assays.
2.6. Quantitative PCR
Total RNA was extracted using the RNeasy Mini Kit (Qiagen) and reverse transcribed using the High-Capacity cDNA Reverse Transcription Kit (Applied Biosystems). qPCR was performed using SYBR Green Master Mix (Bio-Rad) on a CFX96 Real-Time PCR Detection System (Bio-Rad). Relative expression was normalized to β-actin using the ΔΔCt method.
2.7. Cell Viability Assays
Cell viability was assessed using the CellTiter-Glo Luminescent Cell Viability Assay (Promega) according to the manufacturer’s instructions, with luminescence measured using a Cytation5 plate reader (BioTek).
2.8. Metabolite Measurements
Intracellular and extracellular AMP and adenosine levels were quantified using targeted LC-MS/MS as previously described[20]. Briefly, metabolites were extracted from cell pellets using 80% methanol in water, while conditioned media was extracted using a 4:1 ratio of cold methanol to media. Samples were vortexed for 15 minutes on a thermomixer set to 4 °C to ensure thorough extraction, followed by incubation at −80 °C for 1 hour to precipitate proteins. Samples were then centrifuged at 16,000 x g for 15 minutes at 4 °C, and the supernatants were transferred to fresh tubes. The solvent was evaporated to dryness using a SpeedVac concentrator, and the dried metabolites were resuspended in mobile phase starting conditions (95:5, 0.01% formic acid in water: acetonitrile).
Analytes were separated using an Agilent 1290 Infinity II UHPLC system and detected using an Agilent 6460 triple quadrupole mass spectrometer (QQQ) operating in multiple reaction monitoring (MRM) mode. Semi-quantitative analysis was performed using external calibration curves generated from authentic standards to identify the linear range of AMP and adenosine, and data were analyzed using Agilent MassHunter software. Metabolite abundance expressed as the peak area of the primary MRM for each analyte.
2.9. Migration Assays
Cell migration was assessed using a Boyden chamber assay as described previously[21] (Corning). Cells were seeded in serum-free medium in the upper chamber and allowed to migrate toward 10% FBS in the lower chamber under normoxic or hypoxic conditions for 24 hours. Migrated cells were fixed, stained with crystal violet, and counted.
2.10. Angiogenesis Assays
Endothelial tube formation assays were performed using human umbilical vein endothelial cells (HUVECs) seeded on Matrigel (Corning), following our previously published protocol[22]. Tube formation was imaged after 8 hours, and total tube length was quantified using ImageJ.
2.11. VEGF ELISA
Conditioned media were collected from treated FLO-1 cells under hypoxia and were analyzed for VEGF concentrations using the Human VEGF ELISA Kit (Peprotech) following the manufacturer’s protocol.
2.12. Statistical Analysis
Data are presented as mean ± SD. Statistical significance was determined using unpaired Student’s t-tests and one-way or two-way ANOVA as appropriate, using GraphPad Prism 10. p-values <0.05 were considered statistically significant.
3. RESULTS
3.1. NT5E Is Upregulated by HIF1a in Esophageal Adenocarcinoma and Negatively Correlated with Survival in Patients
HIF-1a signaling has previously been shown to promote metastasis in esophageal cancer[17] and NT5E a well-known target of HIF-1a signaling in epithelial cells of other cancers[11,15,16] (Supplemental Table S1)[23], therefore we interrogated the relationship of HIF-1a and NT5E regarding its expression and impact on survival in esophageal cancers.
Utilizing gene expression data from the Cancer Cell Line Encyclopedia, we identified a significant correlation between HIF1A and NT5E gene expression in esophageal adenocarcinoma (EAC) cell lines (Figure 1A). The correlation between HIF1A and NT5E in EAC was among the most significant across all cancer sub-types (Supplemental Table S2); however, there was no correlation between HIF1A and NT5E in esophageal squamous cell carcinoma (ESCC) cell lines (Figure 1B).
To assess clinical relevance, we performed Kaplan-Meier survival analysis on esophageal cancer patient data from TCGA-ESCA, stratified by NT5E expression levels, which revealed that high NT5E expression is associated with significantly lower overall survival compared to low expression in EAC (Figure 1C) and not ESCC (Figure 1D). Notably, NT5E expression was higher in advanced stages of esophageal cancers (Figure 1E) and significantly higher in EAC patients compared to ESCC patients (Figure 1F). Furthermore, we performed IHCs for CD73/NT5E, and HIF1a expression in EAC patient samples, confirming high expression of both relative to non-cancerous tissue (Figure 1G). NT5E is associated with invasive cancer phenotypes[24] and taken together, these results highlight the importance of NT5E, and its correlation with HIF1a, specifically in EAC tumor progression, which is known to be more invasive than ESCC[25].
3.2. NT5E Is Transcriptionally Upregulated by HIF1α Under Hypoxic Conditions in EAC
To determine if HIF1α regulates NT5E expression in EAC, we exposed EAC cells to hypoxic conditions and observed significant upregulation of NT5E expression in multiple cell lines by qPCR (Figure 2A, and Supplemental Figure S2A,B). The hypoxia induced regulatory activity of HIF1a was verified by siRNA-mediated knockdown of HIF1a by qPCR (Figure 2B). Acriflavine, a known HIF1a inhibitor, also attenuated the hypoxia-induced expression of NT5E, measured by qPCR (Figure 2C and Supplemental Figure S2C), and Western blot (Figure 2D and Supplemental Figure S2D,E) confirming that HIF1a activity is essential for NT5E upregulation. These findings highlight the importance of NT5E on tumor progression and the regulatory role of HIF1a in EAC.
3.3. EAC Cells Are Sensitive to HIF1α and NT5E Inhibition, with Enhanced Effects Under Hypoxic Conditions
To evaluate the therapeutic relevance of NT5E and HIF1α, we performed siRNA-mediated knockdown experiments in FLO-1 esophageal adenocarcinoma (EAC) cells. Silencing of NT5E modestly decreased cell proliferation (Figure 3A,B). Knockdown of HIF1α significantly reduced cell viability, which was further amplified under hypoxic conditions, and dual knockdown of HIF1α and NT5E under hypoxia further decreased cell growth compared to single knockdowns (Figure 3C).
To complement genetic knockdown approaches, we treated cells with the HIF1α inhibitor acriflavine and the NT5E inhibitor PSB12379. Acriflavine markedly suppressed FLO-1 cell growth, and its potency increased under hypoxia (Figure 3D and Supplemental Figure S3A,B). PSB12379 alone exhibited minimal growth inhibition; however, combination treatment with acriflavine and PSB12379 resulted in synergistic growth suppression under hypoxic conditions, even at concentrations below the acriflavine IC50 (Figure 3E and Supplemental Figure S3C).
To contextualize these findings, we examined NT5E CRISPR dependency scores in the DepMap portal, which revealed that NT5E is broadly non-essential across cancer lineages, including EAC cell lines (Figure 3F). This observation aligns with our findings that NT5E knockdown or PSB12379 treatment alone has only modest effects on EAC cell growth, while combined inhibition with HIF1α, particularly under hypoxic conditions, significantly reduces cell viability. These results revealed a context-dependent therapeutic vulnerability to NT5E inhibition, and highlight the potential of dual targeting to overcome the limited single-agent efficacy of NT5E inhibition by leveraging the hypoxia-driven dependency on HIF1α pathways.
3.4. HIF1α and NT5E Inhibition Alters Purinergic Metabolite Levels in EAC Cells
To examine how hypoxia and inhibition of HIF1α or NT5E influence purine metabolism, we quantified intracellular and extracellular levels of adenosine monophosphate (AMP) and adenosine in FLO-1 esophageal adenocarcinoma (EAC) cells. A schematic depicting hypoxia-induced NT5E expression and its enzymatic conversion of AMP to adenosine is shown in Figure 4A.
Under hypoxia, intracellular adenosine levels decreased unexpectedly, while extracellular adenosine levels remained largely unchanged (Figure 4B). Consistent with NT5E enzymatic activity, intracellular AMP levels were reduced under hypoxia, with only marginal decreases in the media (Figure 4C), suggesting our earlier finding that hypoxia-induced NT5E expression is linked to increased AMP-to-adenosine turnover.
To determine whether these effects depend on NT5E function, FLO-1 cells were treated with increasing concentrations of the NT5E inhibitor PSB12379, the HIF1α inhibitor acriflavine, or their combination under hypoxia. PSB12379 induced a dose-dependent decrease in intracellular adenosine (Figure 4D) and a corresponding increase in adenosine levels in conditioned media up to intermediate concentrations (Figure 4E), followed by a decline at the highest dose, consistent with partial inhibition of extracellular adenosine turnover. In contrast, acriflavine treatment alone elevated intracellular adenosine, likely reflecting broader effects of HIF1α inhibition on purine metabolism. Notably, combined treatment with acriflavine and PSB12379 still resulted in a net decrease in intracellular adenosine, indicating that NT5E inhibition predominates over the opposing effect of acriflavine.
Analysis of AMP levels revealed a dose-dependent accumulation in PSB12379-treated cells, consistent with effective blockade of NT5E catalytic activity (Figure 4F). This effect was exacerbated by co-treatment with acriflavine, suggesting that inhibition of HIF1α amplifies AMP buildup, potentially through suppression of compensatory metabolic pathways. Similar increases in the intracellular AMP:adenosine ratio were observed in additional EAC cell lines (Supplemental Figure S4A), confirming the generalizability of this effect.
Collectively, these data indicate that hypoxia enhances AMP turnover through NT5E, and that dual inhibition of HIF1α and NT5E disrupts purine homeostasis, leading to accumulation of upstream metabolites and depletion of adenosine pools. These metabolic perturbations likely contribute to the observed synergistic reduction in cell viability under dual treatment conditions.
3.5. Dual Inhibition of HIF1α and NT5E Disrupts Extracellular Signaling Pathways Associated with Immune Evasion and Metastasis
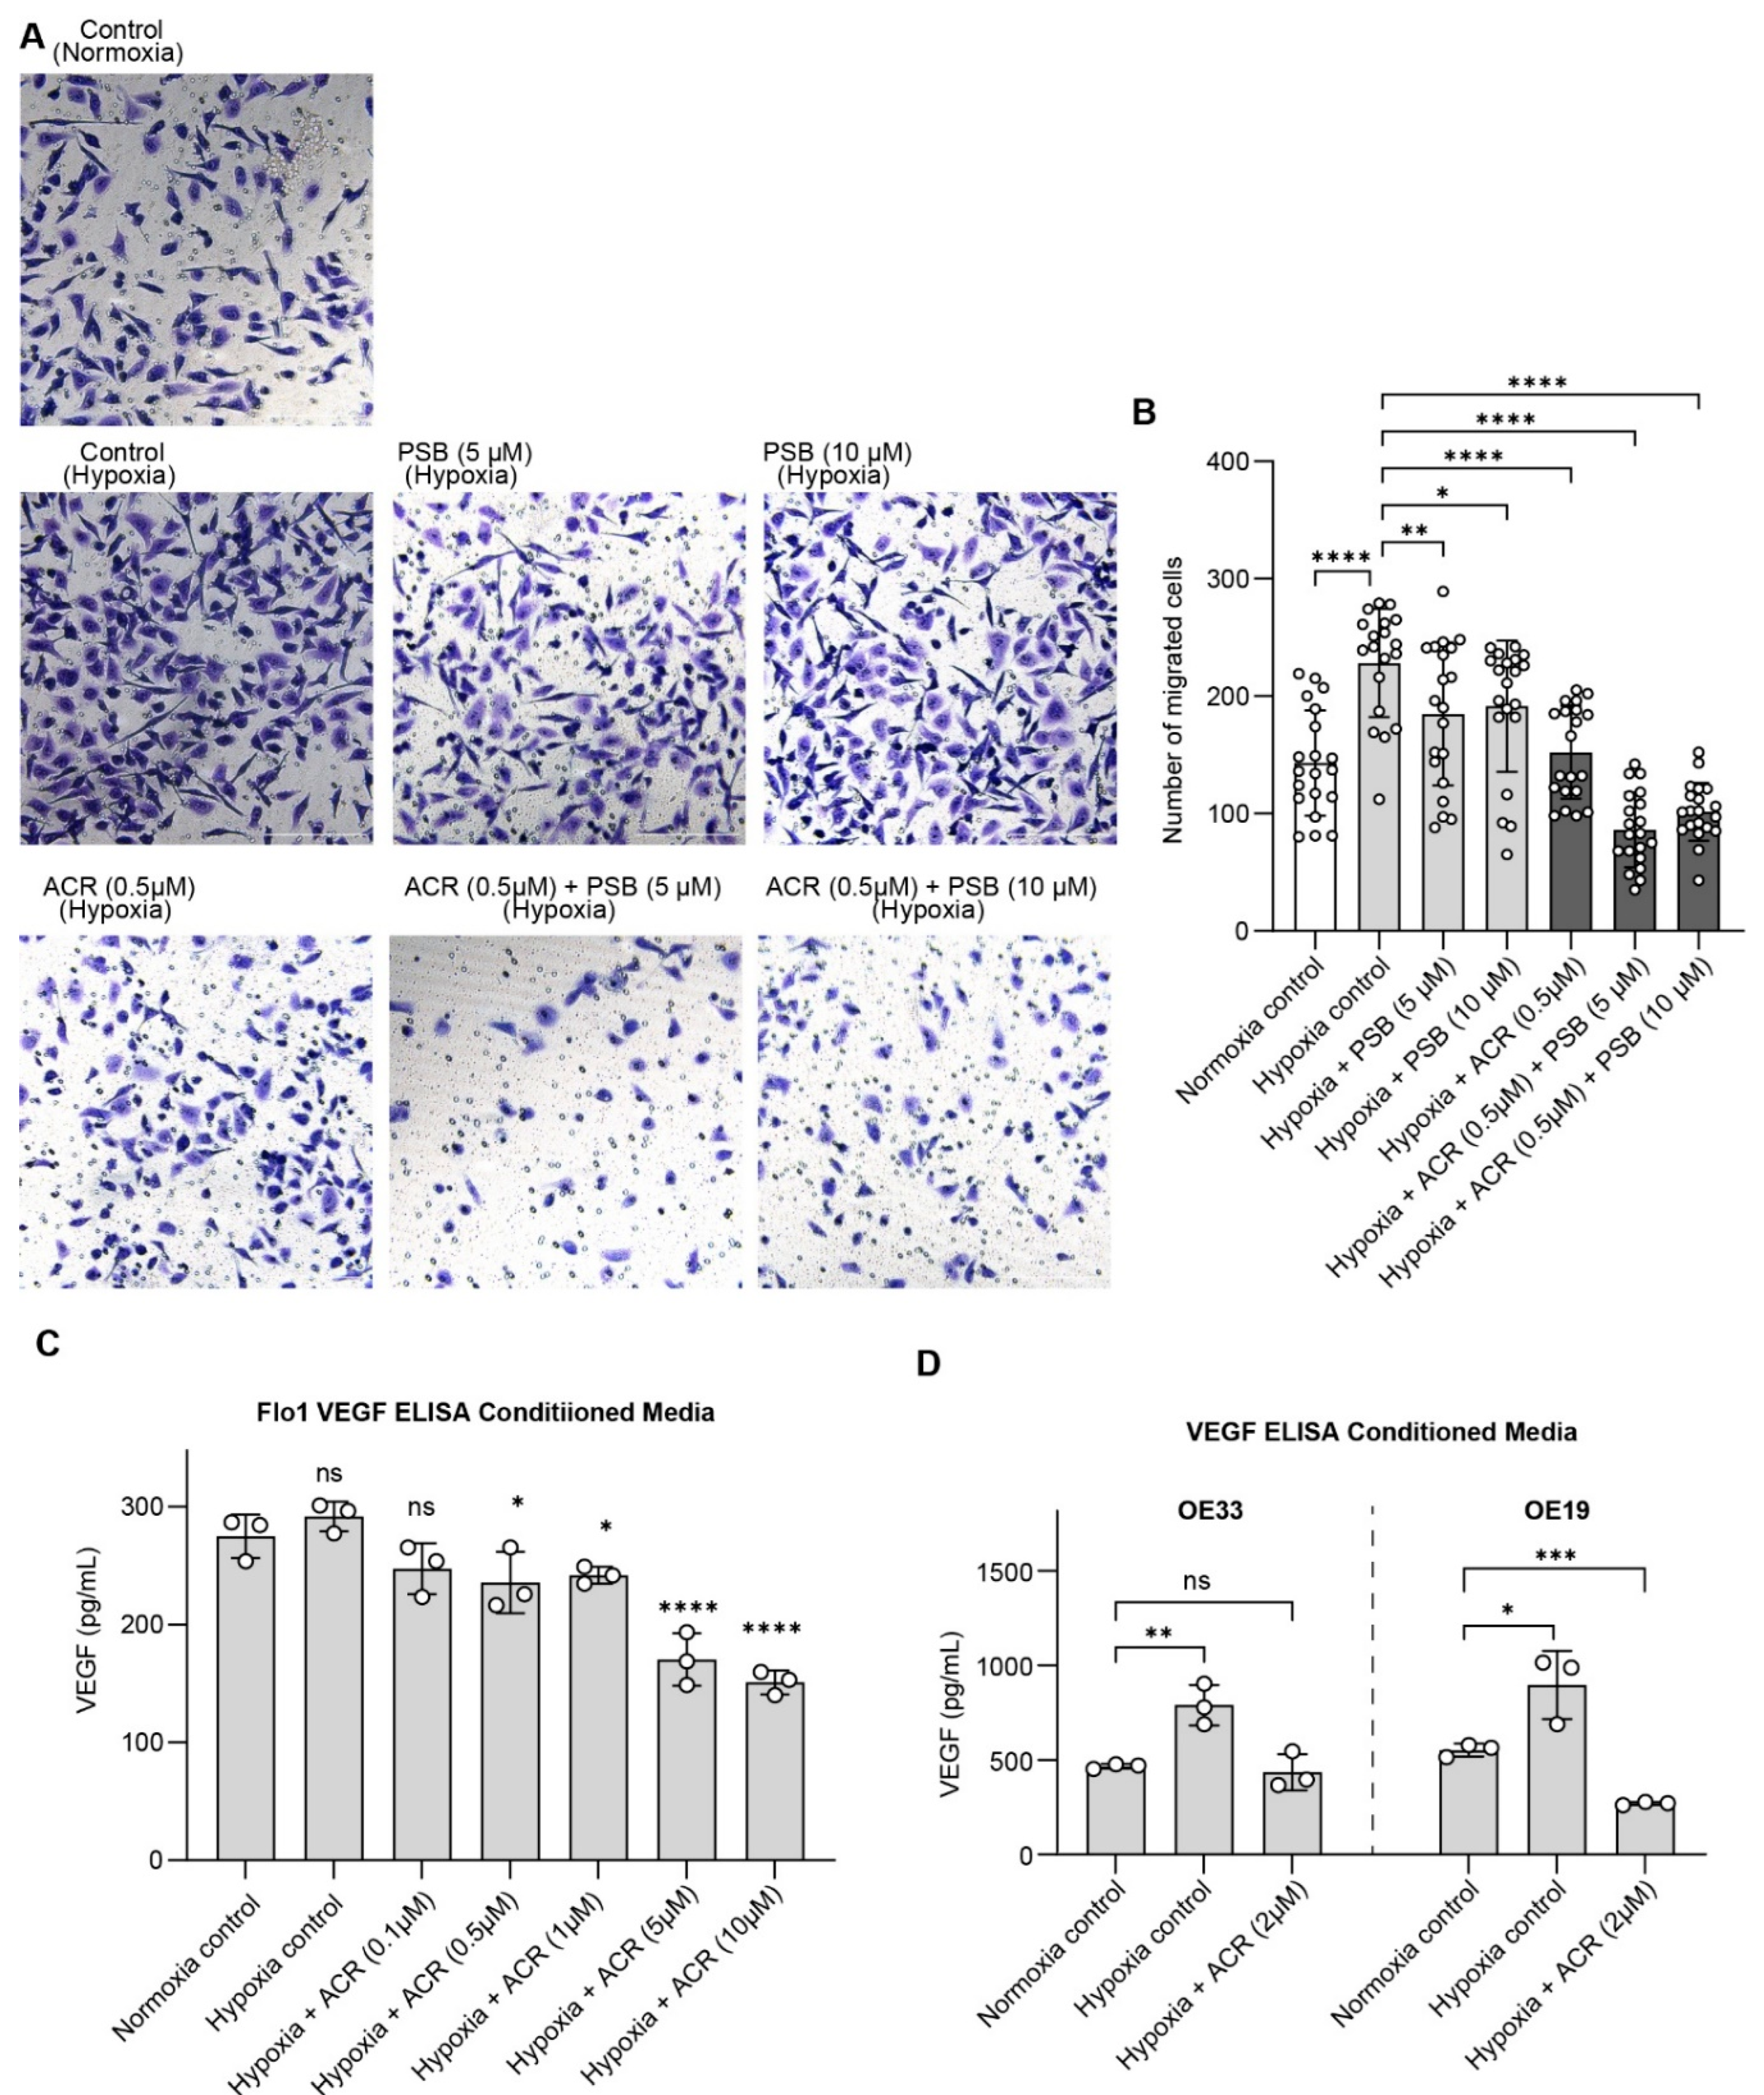
While NT5E’s role in supporting EAC cell viability under hypoxia highlights its tumor-intrinsic functions, NT5E is best characterized for its contributions to the tumor microenvironment, where CD73-generated adenosine promotes immune evasion, angiogenesis, and metastatic potential. To investigate these extracellular consequences, we next performed cell migration assays, demonstrating that combined HIF1α and NT5E inhibition significantly reduced FLO-1 cell migration under hypoxia relative to single-agent treatment, indicating that dual targeting can attenuate cellular behaviors associated with invasion and metastasis (Figure 5A).
To investigate microenvironmental factors that support metastatic potential, angiogenesis assays were performed using endothelial tube formation assays with HUVECs in conditioned media collected from EAC cells treated with acriflavine, PSB12379, or the combination under hypoxia. Conditioned media from dual-treated cells reduced endothelial tube formation compared to single treatments or controls, indicating inhibited pro-angiogenic signaling (Supplemental Figure S5A).
To directly assess the effect of HIF-1α and NT5E inhibition on VEGF secretion, a key pro-angiogenic factor, we performed VEGF ELISAs in conditioned media collected from EAC cells treated with acriflavine, PSB12379 and their combination. VEGF levels were elevated in EAC cell lines under hypoxic conditions and reduced by acriflavine treatment, indicating that HIF1α-driven pro-angiogenic signaling is effectively attenuated (Figure 5C,D). Notably, PSB12379 did not reduce VEGF levels, and in the combination treatment group, levels were reduced similarly to acriflavine alone (Supplemental Figure S5B). This suggests that while NT5E inhibition does not directly impact VEGF production, it may enhance the overall anti-tumor microenvironmental effects of HIF1α inhibition when used in combination.
Together, these results demonstrate that dual targeting of HIF1α and NT5E in EAC cells not only impacts tumor cell viability but also disrupts key extracellular pathways driving immune evasion, angiogenesis, and metastatic potential, underscoring the multifaceted therapeutic potential of this combinatorial approach in esophageal adenocarcinoma.
4. Discussion
Esophageal adenocarcinoma (EAC) remains difficult to treat, particularly within tumor hypoxic niches that stabilize HIF1α and drive therapeutic resistance and metastasis[17,26,27,28]. In this study, we identify NT5E/CD73 as a direct hypoxia-responsive effector in EAC that is transcriptionally regulated by HIF1α, and we demonstrate that simultaneous disruption of HIF1α and NT5E suppresses tumor cell viability and perturbs key extracellular programs linked to immune evasion, angiogenesis, and migration. Consistent with previous reports of CD73 as a mediator of adenosine-driven immunosuppression and poor outcomes in multiple cancers[11,15,16], we found that NT5E expression correlates with HIF1α specifically in EAC but not in ESCC, associates with reduced overall survival, and increases with disease progression, establishing NT5E as a clinically relevant, EAC-specific vulnerability.
Mechanistically, we found that hypoxia robustly induces NT5E expression in EAC cells through HIF1α, as confirmed by siRNA knockdown and pharmacological inhibition with acriflavine. This induction is functionally significant, since dual inhibition of HIF1α and NT5E under hypoxia produced synergistic suppression of cell viability, revealing a cooperative dependence on these two pathways for EAC survival. Interestingly, CRISPR dependency profiling across cancer lineages indicated that NT5E is broadly non-essential under normoxia, consistent with the limited effects of NT5E inhibition alone on EAC cell growth. However, under hypoxic conditions where HIF1α drives survival pathways, NT5E inhibition becomes highly impactful in combination, suggesting a context-dependent therapeutic vulnerability that could be therapeutically exploited in hypoxic tumors.
Our LC/MS data further illuminate this mechanism. Under hypoxia, intracellular adenosine and AMP both decreased, suggesting enhanced AMP turnover and dynamic adenosine trafficking rather than simple accumulation. One plausible explanation is transport dominance: hypoxia can upregulate equilibrative nucleoside transporters (ENT1/ENT2), favoring adenosine efflux and altering re-uptake kinetics in a pH- and membrane-potential–dependent manner[29,30]. Concurrently, adenosine may be rapidly catabolized—extracellularly by ADA to inosine and intracellularly by ADK to AMP—thereby maintaining low steady-state adenosine without requiring large changes in total nucleotide pools[31,32]. These multilayered feedbacks, combined with metabolic shifts in glycolysis and purine synthesis under hypoxia[33,34], provide a coherent explanation for the observed AMP–adenosine balance.
Pharmacologic perturbations support this view. PSB12379 produced dose-dependent intracellular AMP accumulation consistent with on-target NT5E inhibition, while intracellular adenosine decreased. In conditioned media, adenosine increased at low–intermediate PSB concentrations and declined at the highest dose (Figure 4E), suggesting a biphasic balance: partial NT5E inhibition may increase transient extracellular adenosine via altered release/re-uptake or enzyme/substrate saturation, whereas stronger inhibition limits net production from AMP. Notably, acriflavine alone increased intracellular adenosine (Figure 4D), consistent with broader HIF1α program suppression (e.g., reduced ADA and ENT activity, or altered purine salvage) rather than direct NT5E effects. Despite this, PSB12379 overrode this increase when combined, indicating NT5E’s gatekeeping role for adenosine under hypoxia while other metabolic alterations are in play. The AMP:adenosine ratio shifts we observed across additional EAC lines demonstrate that these flux changes are generalizable.
Taken together, these mechanisms provide a coherent framework for the observed drop in intracellular adenosine despite hypoxia-induced NT5E, and they help explain the dose- and compartment-specific responses to PSB12379 and acriflavine in Figure 4. Future studies will include a more comprehensive, targeted metabolomics investigation with isotope tracing, paired RNA-seq, and integrated gene–metabolite network analyses across hypoxic perturbations (HIF1α/NT5E single and dual inhibition). This approach would precisely map flux control points and pathway crosstalk with higher precision. Additionally, a multi-omic dissection may uncover novel biochemical circuits and basic cellular principles of purine homeostasis under hypoxic stress beyond the therapeutic implications we explored here.
Functionally, dual treatment also inhibited cell migration, HUVEC tube formation and VEGF secretion by tumor cells under hypoxia via HIF1α blockade, aligning with canonical HIF1α-VEGF regulation[26,28]. While NT5E inhibition alone did not suppress VEGF production, it likely attenuates adenosine-mediated paracrine signaling that sustains angiogenesis and immune evasion[35,36,37]. Together, these findings support a two-axis mechanistic model: (i) HIF1α inhibition disrupts transcriptional programs controlling hypoxic survival and angiogenesis, and (ii) NT5E inhibition limits extracellular adenosine accumulation and downstream purinergic signaling. Their convergence yields synergistic suppression of both tumor-intrinsic and microenvironmental pro-tumor pathways in EAC.
We acknowledge certain limitations. The current study was confined to in vitro models that do not fully recapitulate stromal and immune complexity in the tumor microenvironment. Future studies using 3D organoid or in vivo xenograft models of EAC will be essential to determine the physiological relevance of dual (HIF1α and NT5E) inhibition on tumor growth, angiogenesis, immune modulation and metastasis. Moreover, while acriflavine was used as a pharmacological HIF1α inhibitor, its broad action may extend beyond HIF-1α; thus, employing genetic silencing or more selective small-molecule inhibitors would further strengthen mechanistic precision.
5. Conclusions
In summary, our findings establish that concurrent targeting of HIF1α and CD73 offers a mechanistically integrated, multi-pathway therapeutic strategy for esophageal adenocarcinoma. This approach not only impairs hypoxia-driven transcriptional survival programs but also neutralizes adenosine-mediated microenvironmental adaptation, providing a strong biological rationale for developing combinatorial therapies for hypoxic, treatment-resistant EAC.
Supplementary Materials
The following supporting information can be downloaded at the website of this paper posted on Preprints.org, Supplemental Material (Supplementary Tables S1 and S2 and Supplementary Figures S2-S5 related to Figure 2, Figure 3, Figure 4 and Figure 5).
Author Contributions
Conceptualization, I.M., A.A., B.S.J.B.; Methodology, I.M., A.A.; Investigation, I.M., A.M., E.A., MS.H.; Validation, A.M., M.S.; Formal analysis, I.M.; Resources, A.A., BS.J.B, MS.H., U. vH; Data curation, I.M.; Software, I.M.; Visualization, I.M., E. A..; Writing—original draft, I.M.; Writing—review & editing, I.M., A.A., B.S.J.B., MS.H.; Supervision, A.A., B.S.J.B.; Project administration, I.M., A.A.; Funding acquisition, A.A., B.S.J.B.
Funding
This work was supported internal funds from the Warren Family Research Center for Drug Discovery and Development and the Mike and Josie Harper Cancer Research Institute.
Institutional Review Board Statement
Not applicable.
Informed Consent Statement
Not applicable.
Data Availability Statement
Public datasets used in this study include DepMap and TCGA. Raw and processed data for all figures/analyses are available from the corresponding author upon reasonable request.
Acknowledgments
We thank Bill Boggess and the Mass Spectrometry & Proteomics Core for assistance with LC–MS method optimization and data acquisition. We also acknowledge members of the Ali and Blagg laboratories for constructive discussions.
Conflicts of Interest
The authors declare no conflicts of interest. The funders had no role in the design of the study; in the collection, analyses, or interpretation of data; in the writing of the manuscript; or in the decision to publish the results.
References
- Teng Y, Xia C, Cao M, Yang F, Yan X, He S, Cao M, Zhang S, Li Q, Tan N Esophageal cancer global burden profiles, trends, and contributors. Cancer Biology & Medicine 2024, 21, 656–666.
- Xie M, Deng L, Fass R, Song G Obesity is associated with higher prevalence of gastroesophageal reflux disease and reflux related complications: a global healthcare database study. Neurogastroenterology & Motility 2024, 36, e14750.
- Fass R Gastroesophageal reflux disease. New England Journal of Medicine 2022, 387, 1207–1216. [CrossRef]
- Bray F, Laversanne M, Sung H, Ferlay J, Siegel RL, Soerjomataram I, Jemal A Global cancer statistics 2022: GLOBOCAN estimates of incidence and mortality worldwide for 36 cancers in 185 countries. CA: a cancer journal for clinicians 2024, 74, 229–263.
- Siegel RL, Giaquinto AN, Jemal A Cancer statistics, 2024. CA: a cancer journal for clinicians 2024, 74, 12–49.
- Zhao Y, Xing C, Deng Y, Ye C, Peng H HIF-1α signaling: Essential roles in tumorigenesis and implications in targeted therapies. Genes & Diseases 2024, 11, 234–251.
- Pezzuto A, Carico E Role of HIF-1 in cancer progression: novel insights. A review. Current molecular medicine 2018, 18, 343–351. [Google Scholar]
- Allard D, Chrobak P, Allard B, Messaoudi N, Stagg J Targeting the CD73-adenosine axis in immuno-oncology. Immunology letters 2019, 205, 31–39. [CrossRef] [PubMed]
- Allard B, Beavis PA, Darcy PK, Stagg J Immunosuppressive activities of adenosine in cancer. Current opinion in pharmacology 2016, 29, 7–16. [CrossRef]
- Zhou L, Jia S, Chen Y, Wang W, Wu Z, Yu W, Zhang M, Ding G, Cao L The distinct role of CD73 in the progression of pancreatic cancer. Journal of molecular medicine 2019, 97, 803–815.
- Lu X-X, Chen Y-T, Feng B, Mao X-B, Yu B, Chu X-Y Expression and clinical significance of CD73 and hypoxia-inducible factor-1α in gastric carcinoma. World journal of gastroenterology: WJG 2013, 19, 1912. [CrossRef]
- Chen C, Liu S, Ma Y. Comprehensive pan-cancer analysis of CD73: Explore its association with prognosis and tumor immune microenvironment. Heliyon 2024, 10. [Google Scholar] [CrossRef]
- Liu S, Li D, Liu J, Wang H, Horecny I, Shen R, Zhang R, Wu H, Hu Q, Zhao P. A novel CD73 inhibitor SHR170008 suppresses adenosine in tumor and enhances anti-tumor activity with PD-1 blockade in a mouse model of breast cancer. OncoTargets and therapy 2021, 4561–4574.
- Ye J, Gavras NW, Keeley DC, Hughson AL, Hannon G, Vrooman TG, Lesch ML, Johnston CJ, Lord EM, Belt BA CD73 and PD-L1 dual blockade amplifies antitumor efficacy of SBRT in murine PDAC models. Journal for Immunotherapy of Cancer 2023, 11, e006842. [CrossRef]
- Hajizadeh F, Ardebili SM, Moornani MB, Masjedi A, Atyabi F, Kiani M, Namdar A, Karpisheh V, Izadi S, Baradaran B Silencing of HIF-1α/CD73 axis by siRNA-loaded TAT-chitosan-spion nanoparticles robustly blocks cancer cell progression. European journal of pharmacology 2020, 882, 173235. [CrossRef]
- Synnestvedt K, Furuta GT, Comerford KM, Louis N, Karhausen J, Eltzschig HK, Hansen KR, Thompson LF, Colgan SP Ecto-5′-nucleotidase (CD73) regulation by hypoxia-inducible factor-1 mediates permeability changes in intestinal epithelia. The Journal of clinical investigation 2002, 110, 993–1002. [CrossRef]
- Hu X, Lin J, Jiang M, He X, Wang K, Wang W, Hu C, Shen Z, He Z, Lin H, et al. HIF-1α Promotes the Metastasis of Esophageal Squamous Cell Carcinoma by Targeting SP1. J Cancer 2020, 11, 229–240. [Google Scholar] [CrossRef] [PubMed]
- Tsherniak A, Vazquez F, Montgomery PG, Weir BA, Kryukov G, Cowley GS, Gill S, Harrington WF, Pantel S, Krill-Burger JM, et al. Defining a Cancer Dependency Map. Cell 2017, 170, 564–576.e516. [Google Scholar] [CrossRef]
- Hoadley KA, Yau C, Hinoue T, Wolf DM, Lazar AJ, Drill E, Shen R, Taylor AM, Cherniack AD, Thorsson V, et al. Cell-of-Origin Patterns Dominate the Molecular Classification of 10,000 Tumors from 33 Types of Cancer. Cell 2018, 173, 291–304.e296. [Google Scholar] [CrossRef]
- Turtoi E, Jeudy J, Henry S, Dadi I, Valette G, Enjalbal C, Turtoi A Analysis of polar primary metabolites in biological samples using targeted metabolomics and LC-MS. STAR Protoc 2023, 4, 102400. [CrossRef] [PubMed]
- Zagzag D, Lukyanov Y, Lan L, Ali MA, Esencay M, Mendez O, Yee H, Voura EB, Newcomb EW Hypoxia-inducible factor 1 and VEGF upregulate CXCR4 in glioblastoma: implications for angiogenesis and glioma cell invasion. Laboratory investigation 2006, 86, 1221–1232. [CrossRef]
- Ali MA, Choy H, Habib AA, Saha D SNS-032 prevents tumor cell-induced angiogenesis by inhibiting vascular endothelial growth factor. Neoplasia 2007, 9, 370–381. [CrossRef]
- National Center for Biotechnology Information (2024). PubChem Pathway Summary for Pathway hif1_tfpathway, HIF-1-alpha transcription factor network, Source: Pathway Interaction Database. Retrieved July 1, 2024 from https://pubchem.ncbi.nlm.nih.gov/pathway/Pathway-Interaction-Database:hif1_tfpathway. Editor (ed)^(eds): City.
- Gao Z-w, Dong K, Zhang H-z The roles of CD73 in cancer. BioMed research international 2014, 2014, 460654.
- Mariette C, Finzi L, Piessen G, Van Seuningen I, Triboulet JP Esophageal carcinoma: prognostic differences between squamous cell carcinoma and adenocarcinoma. World journal of surgery 2005, 29, 39–45. [CrossRef] [PubMed]
- Takala H, Saarnio J, Wiik H, Ohtonen P, Soini Y HIF-1α and VEGF are associated with disease progression in esophageal carcinoma. Journal of Surgical Research 2011, 167, 41–48. [CrossRef] [PubMed]
- Koukourakis MI, Giatromanolaki A, Skarlatos J, Corti L, Blandamura S, Piazza M, Gatter KC, Harris AL Hypoxia inducible factor (HIF-1a and HIF-2a) expression in early esophageal cancer and response to photodynamic therapy and radiotherapy. Cancer research 2001, 61, 1830–1832.
- Ma S, Lu C-C, Yang L-Y, Wang J-J, Wang B-S, Cai H-Q, Hao J-J, Xu X, Cai Y, Zhang Y ANXA2 promotes esophageal cancer progression by activating MYC-HIF1A-VEGF axis. Journal of Experimental & Clinical Cancer Research 2018, 37, 183.
- Boison D (2018). <i>Regulation of extracellular adenosine</i>., Springer. Boison D (2018). Regulation of extracellular adenosine, 13–32.
- Eltzschig HK, Abdulla P, Hoffman E, Hamilton KE, Daniels D, Schönfeld C, Löffler M, Reyes G, Duszenko M, Karhausen J HIF-1–dependent repression of equilibrative nucleoside transporter (ENT) in hypoxia. The Journal of experimental medicine 2005, 202, 1493–1505.
- Camici M, Garcia-Gil M, Tozzi MG The inside story of adenosine. International journal of molecular sciences 2018, 19, 784. [CrossRef]
- Camici M, Allegrini S, Tozzi MG Interplay between adenylate metabolizing enzymes and AMP--activated protein kinase. The FEBS journal 2018, 285, 3337–3352. [CrossRef]
- Wang L Mitochondrial purine and pyrimidine metabolism and beyond. Nucleosides, Nucleotides and Nucleic Acids 2016, 35, 578–594. [CrossRef] [PubMed]
- De Vitto H, Arachchige DB, Richardson BC, French JB The intersection of purine and mitochondrial metabolism in cancer. Cells 2021, 10, 2603. [CrossRef] [PubMed]
- Chen L, Ring S, Jurga A, Kurschus FC, Enk A, Mahnke K (2025). CD73 Expression by CD4+ T Cells Marks Early Effector Memory T Cells. Immunology 2025.
- Rodríguez-Pampín I, González-Pico L, Selas A, Andújar A, Prieto-Díaz R, Sotelo E (2025). Targeting the Adenosinergic Axis in Cancer Immunotherapy: Insights into A2A and A2B Receptors and Novel Clinical Combination Strategies. Pharmacological Reviews 2025, 100092.
- Chen L, Alabdullah M, Mahnke K Adenosine, bridging chronic inflammation and tumor growth. Frontiers in Immunology 2023, 14, 1258637. [CrossRef]
Figure 1.
NT5E and HIF1α co-expressed in esophageal adenocarcinoma and negatively correlated with patient survival. (A-B) X/Y plot and correlation analysis between NT5E and HIF1α expression data across esophageal adenocarcinoma (EAC) cell lines (A) and esophageal squamous cell carcinoma (ESCC) lines (B) from DepMap. (C-D) Kaplan-Meier plots of EAC (C) and ESCC (D) patients stratified by NT5E expression; assessed using log-rank (Mantel–Cox) test. (E) NT5E expression across stages of esophageal cancer. (F) NT5E expression comparison between EAC and ESCC patients; significance determined by unpaired two-tailed t-test. (G) IHC of H&E stain (left), IHC of CD73 (middle) and IHC of HIF1 (right), in EAC tumor tissue (bottom) and adjacent normal tissue (top).
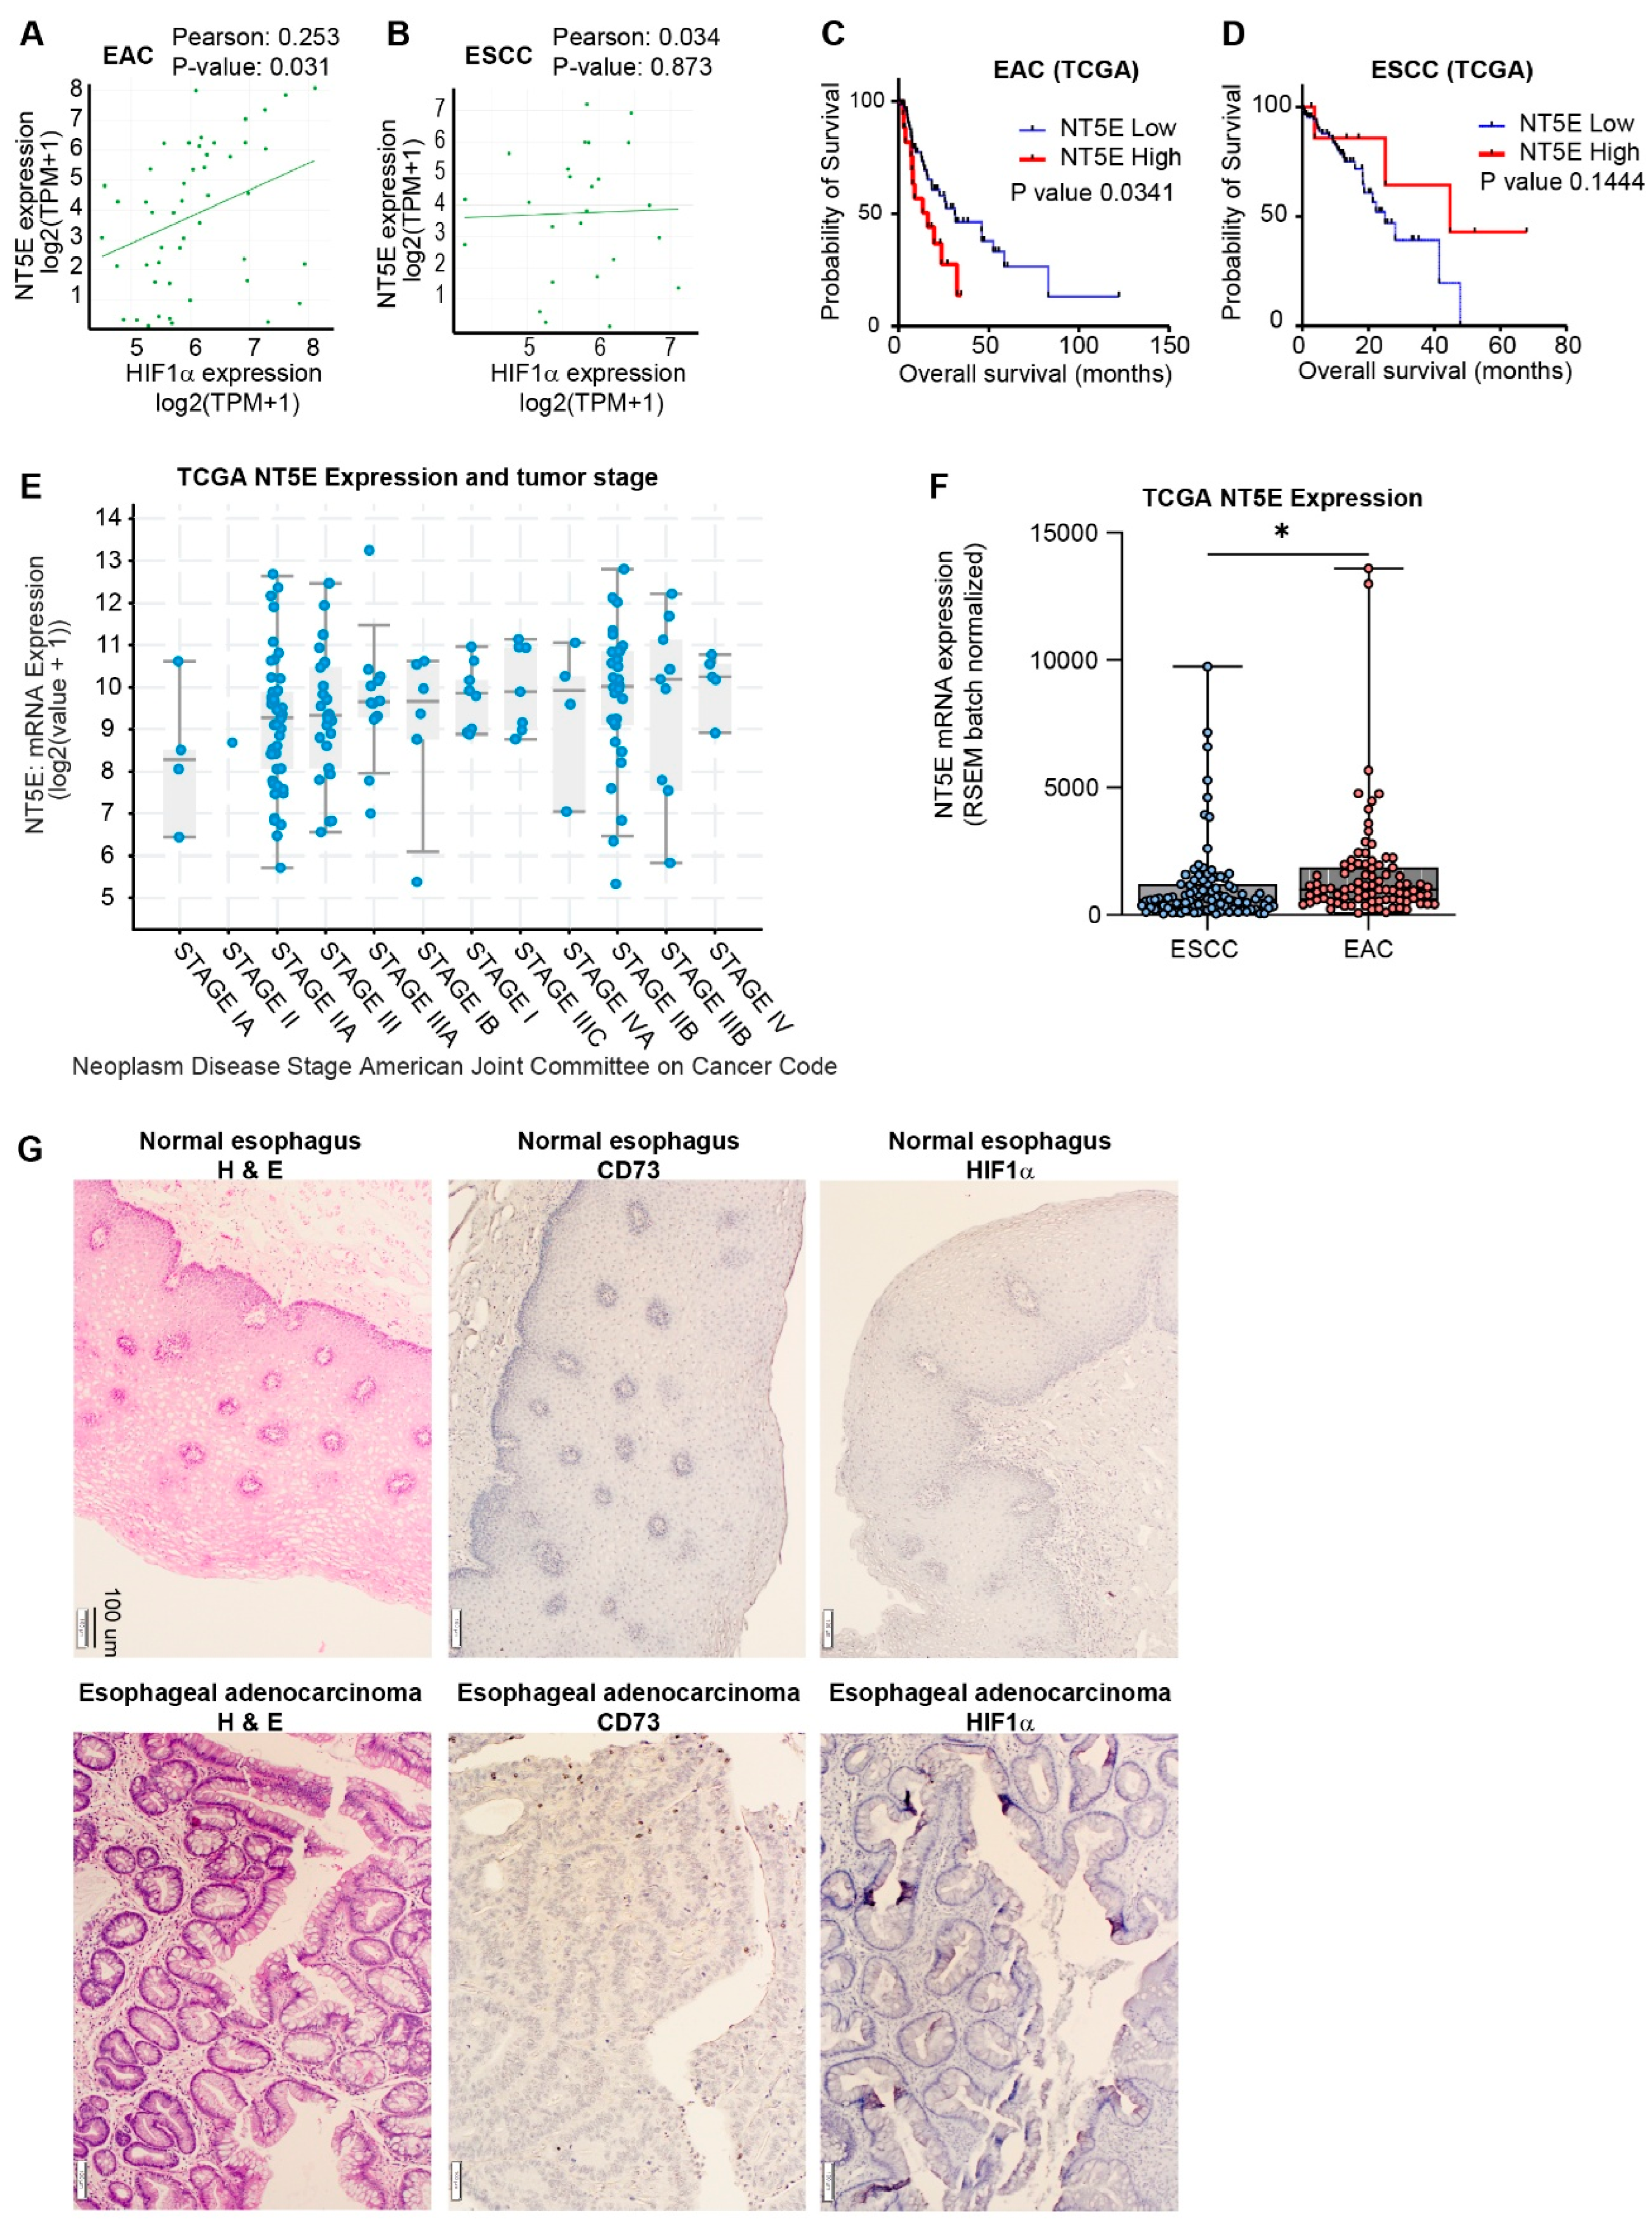
Figure 2.
NT5E is transcriptionally upregulated by HIF1α under hypoxic conditions in EAC. (A) NT5E expression by qPCR in FLO-1 cells under normoxia and hypoxia; data represent mean ± SEM (n = 4); significance determined by unpaired two-tailed t-test. (B) Effect of HIF1α knockdown on NT5E expression under hypoxia; comparisons analyzed by two-way ANOVA with Sidak correction. (C) Measurement of HIF1α and NT5E in FLO-1 cells treated with acriflavine by qPCR; data represent mean ± SEM (n = 4); analyzed by one-way ANOVA with Dunnett’s correction for multiple comparisons. (D) Western blot confirmation of NT5E protein regulation under hypoxia with acriflavine treatment.
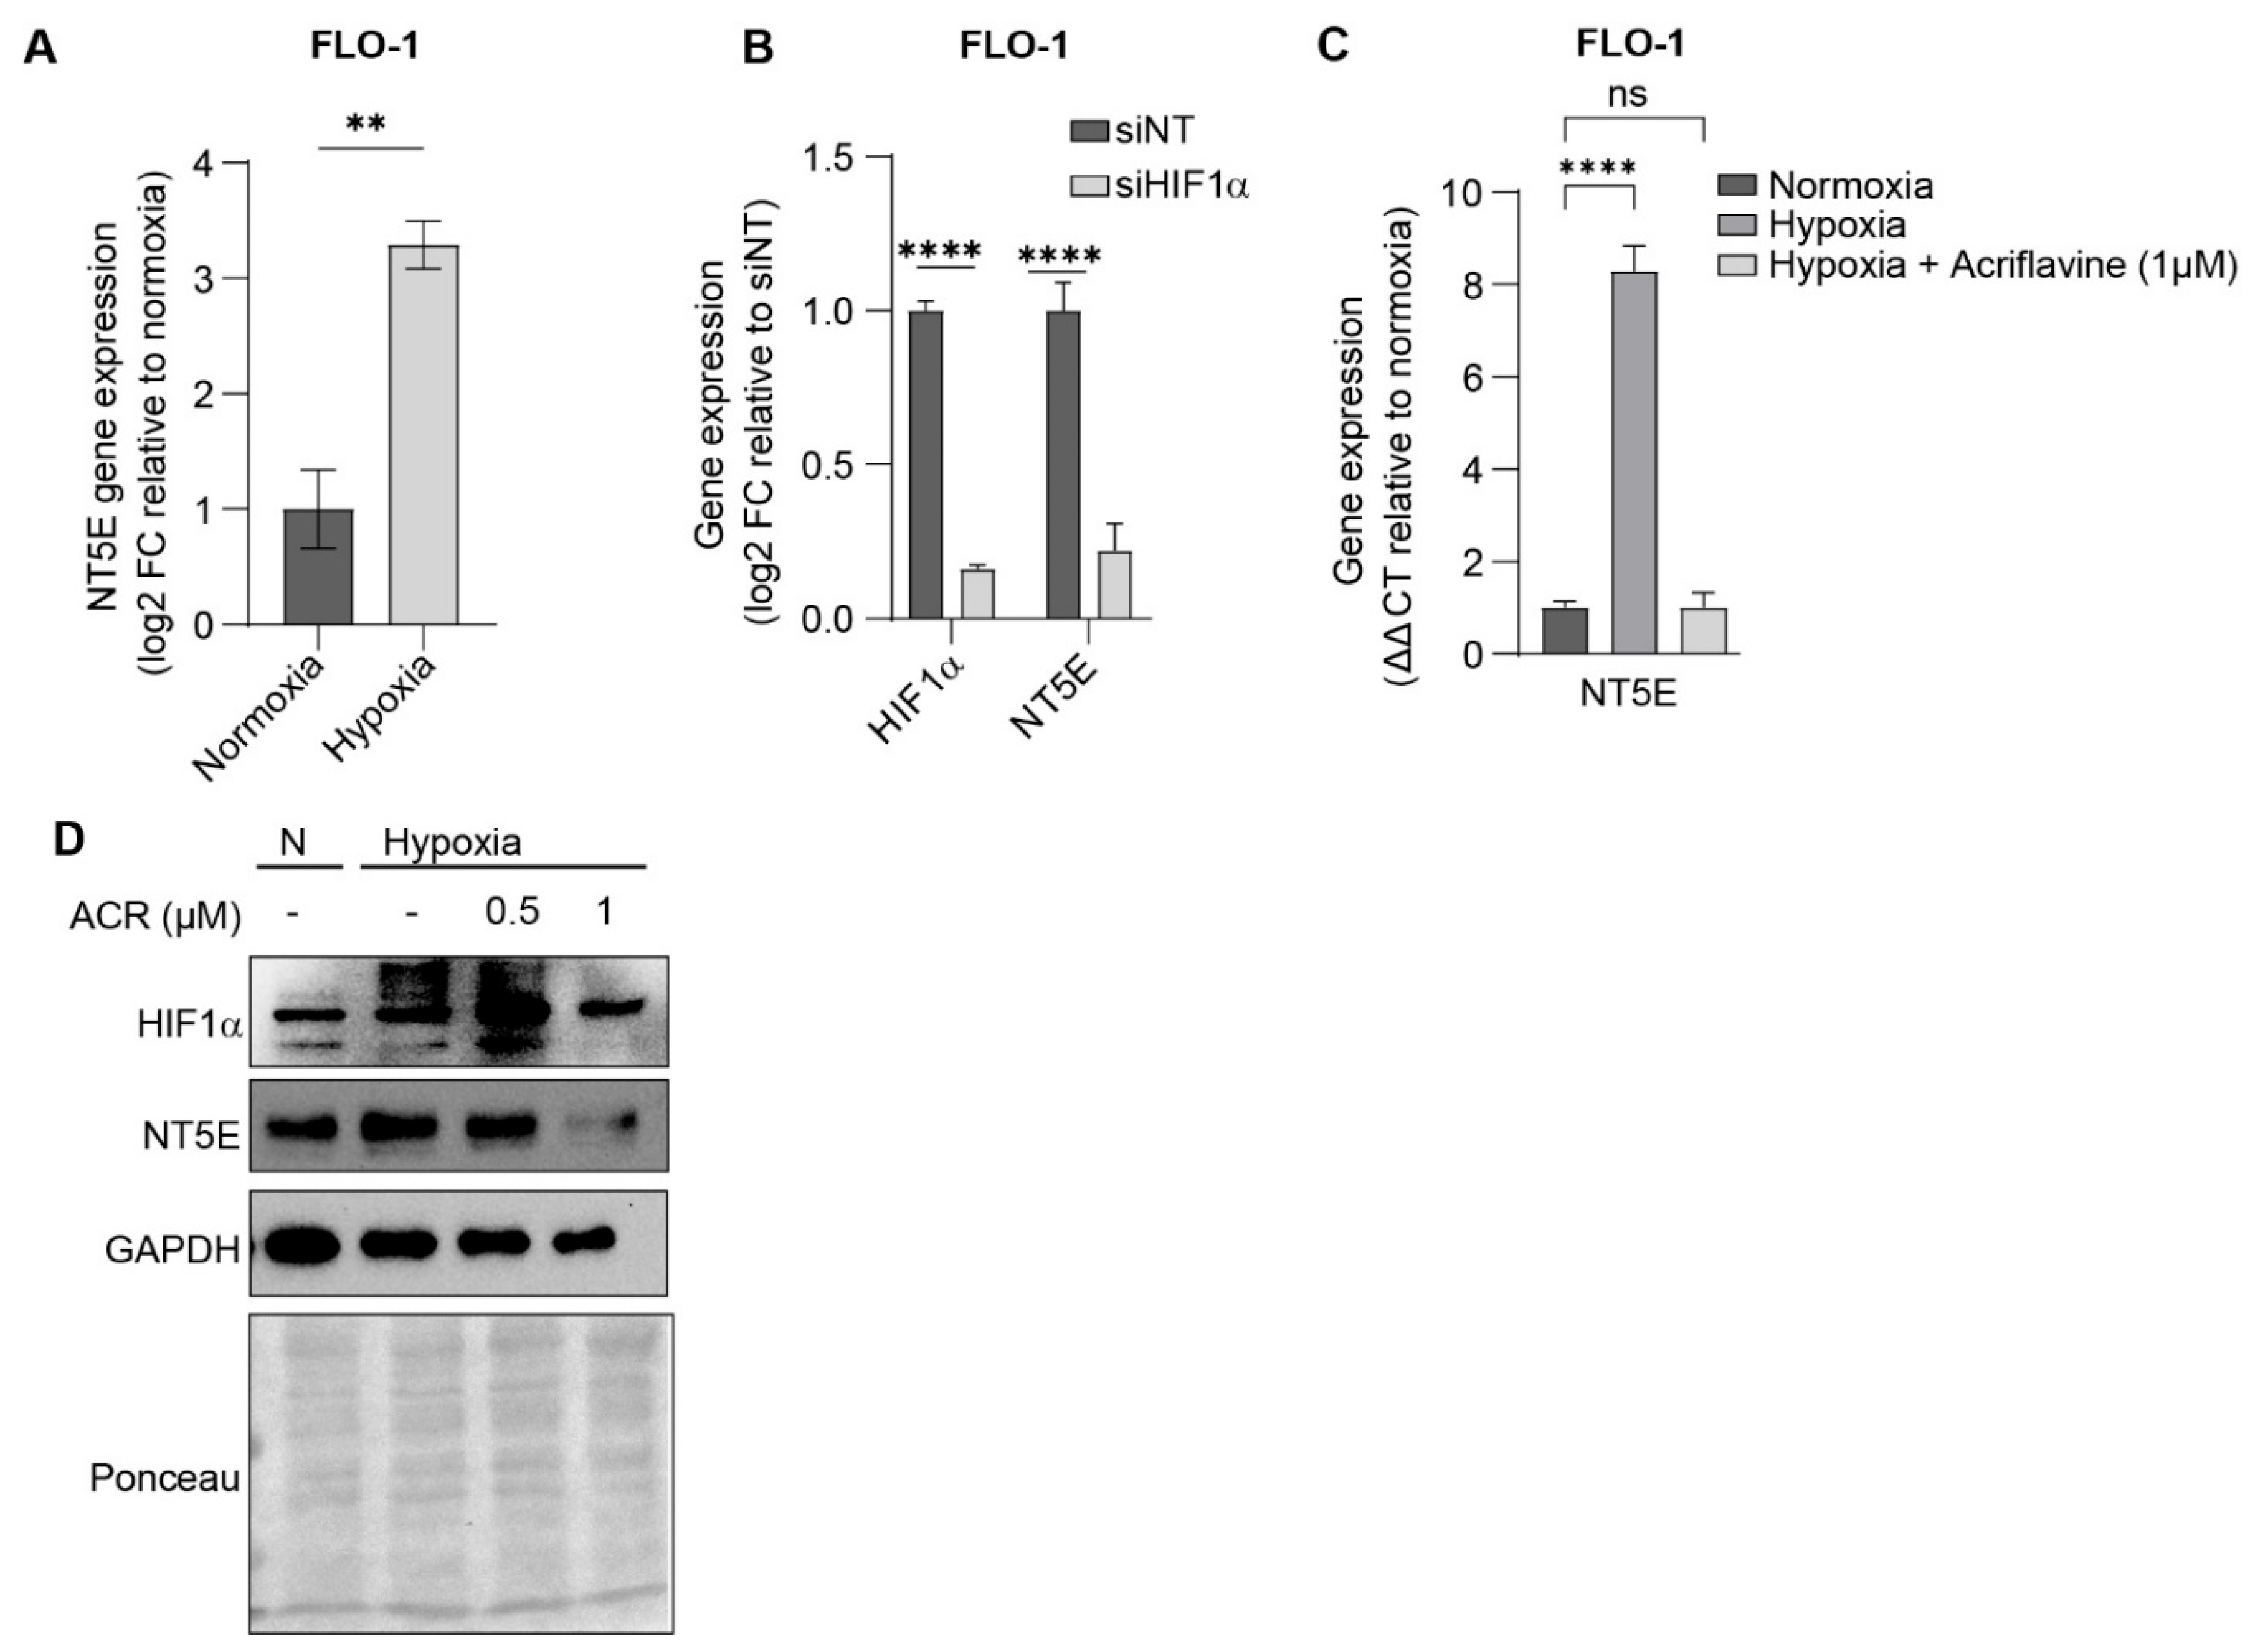
Figure 3.
EAC cells are sensitive to HIF1α and NT5E inhibition, with enhanced effects under hypoxic conditions. (A-B) HIF1α and NT5E expression measured by qPCR (A) and cell viability measurements expressed as % growth (cell titer relative to day 0) (B) upon NT5E knockdown; qPCR data represent mean ± SEM of n = 4; statistical significance determined by unpaired two-tailed t-test. (C) Cell viability in HIF1α knockdown alone and in combination with NT5E knockdown under normoxic or hypoxic conditions at 72 hours; data are mean ± SEM (n = 3); comparisons analyzed by two-way ANOVA with Dunnet’s correction. (D) % cell growth (cell titer relative to day 0) comparing acriflavine treatment in normoxic and hypoxic conditions. (E) % cell growth for combined treatment with acriflavine and PSB12379 under normoxic and hypoxic conditions, showing synergistic viability reduction. (F) NT5E CRISPR dependency scores from DepMap across cancer lineages, indicating NT5E is broadly non-essential.
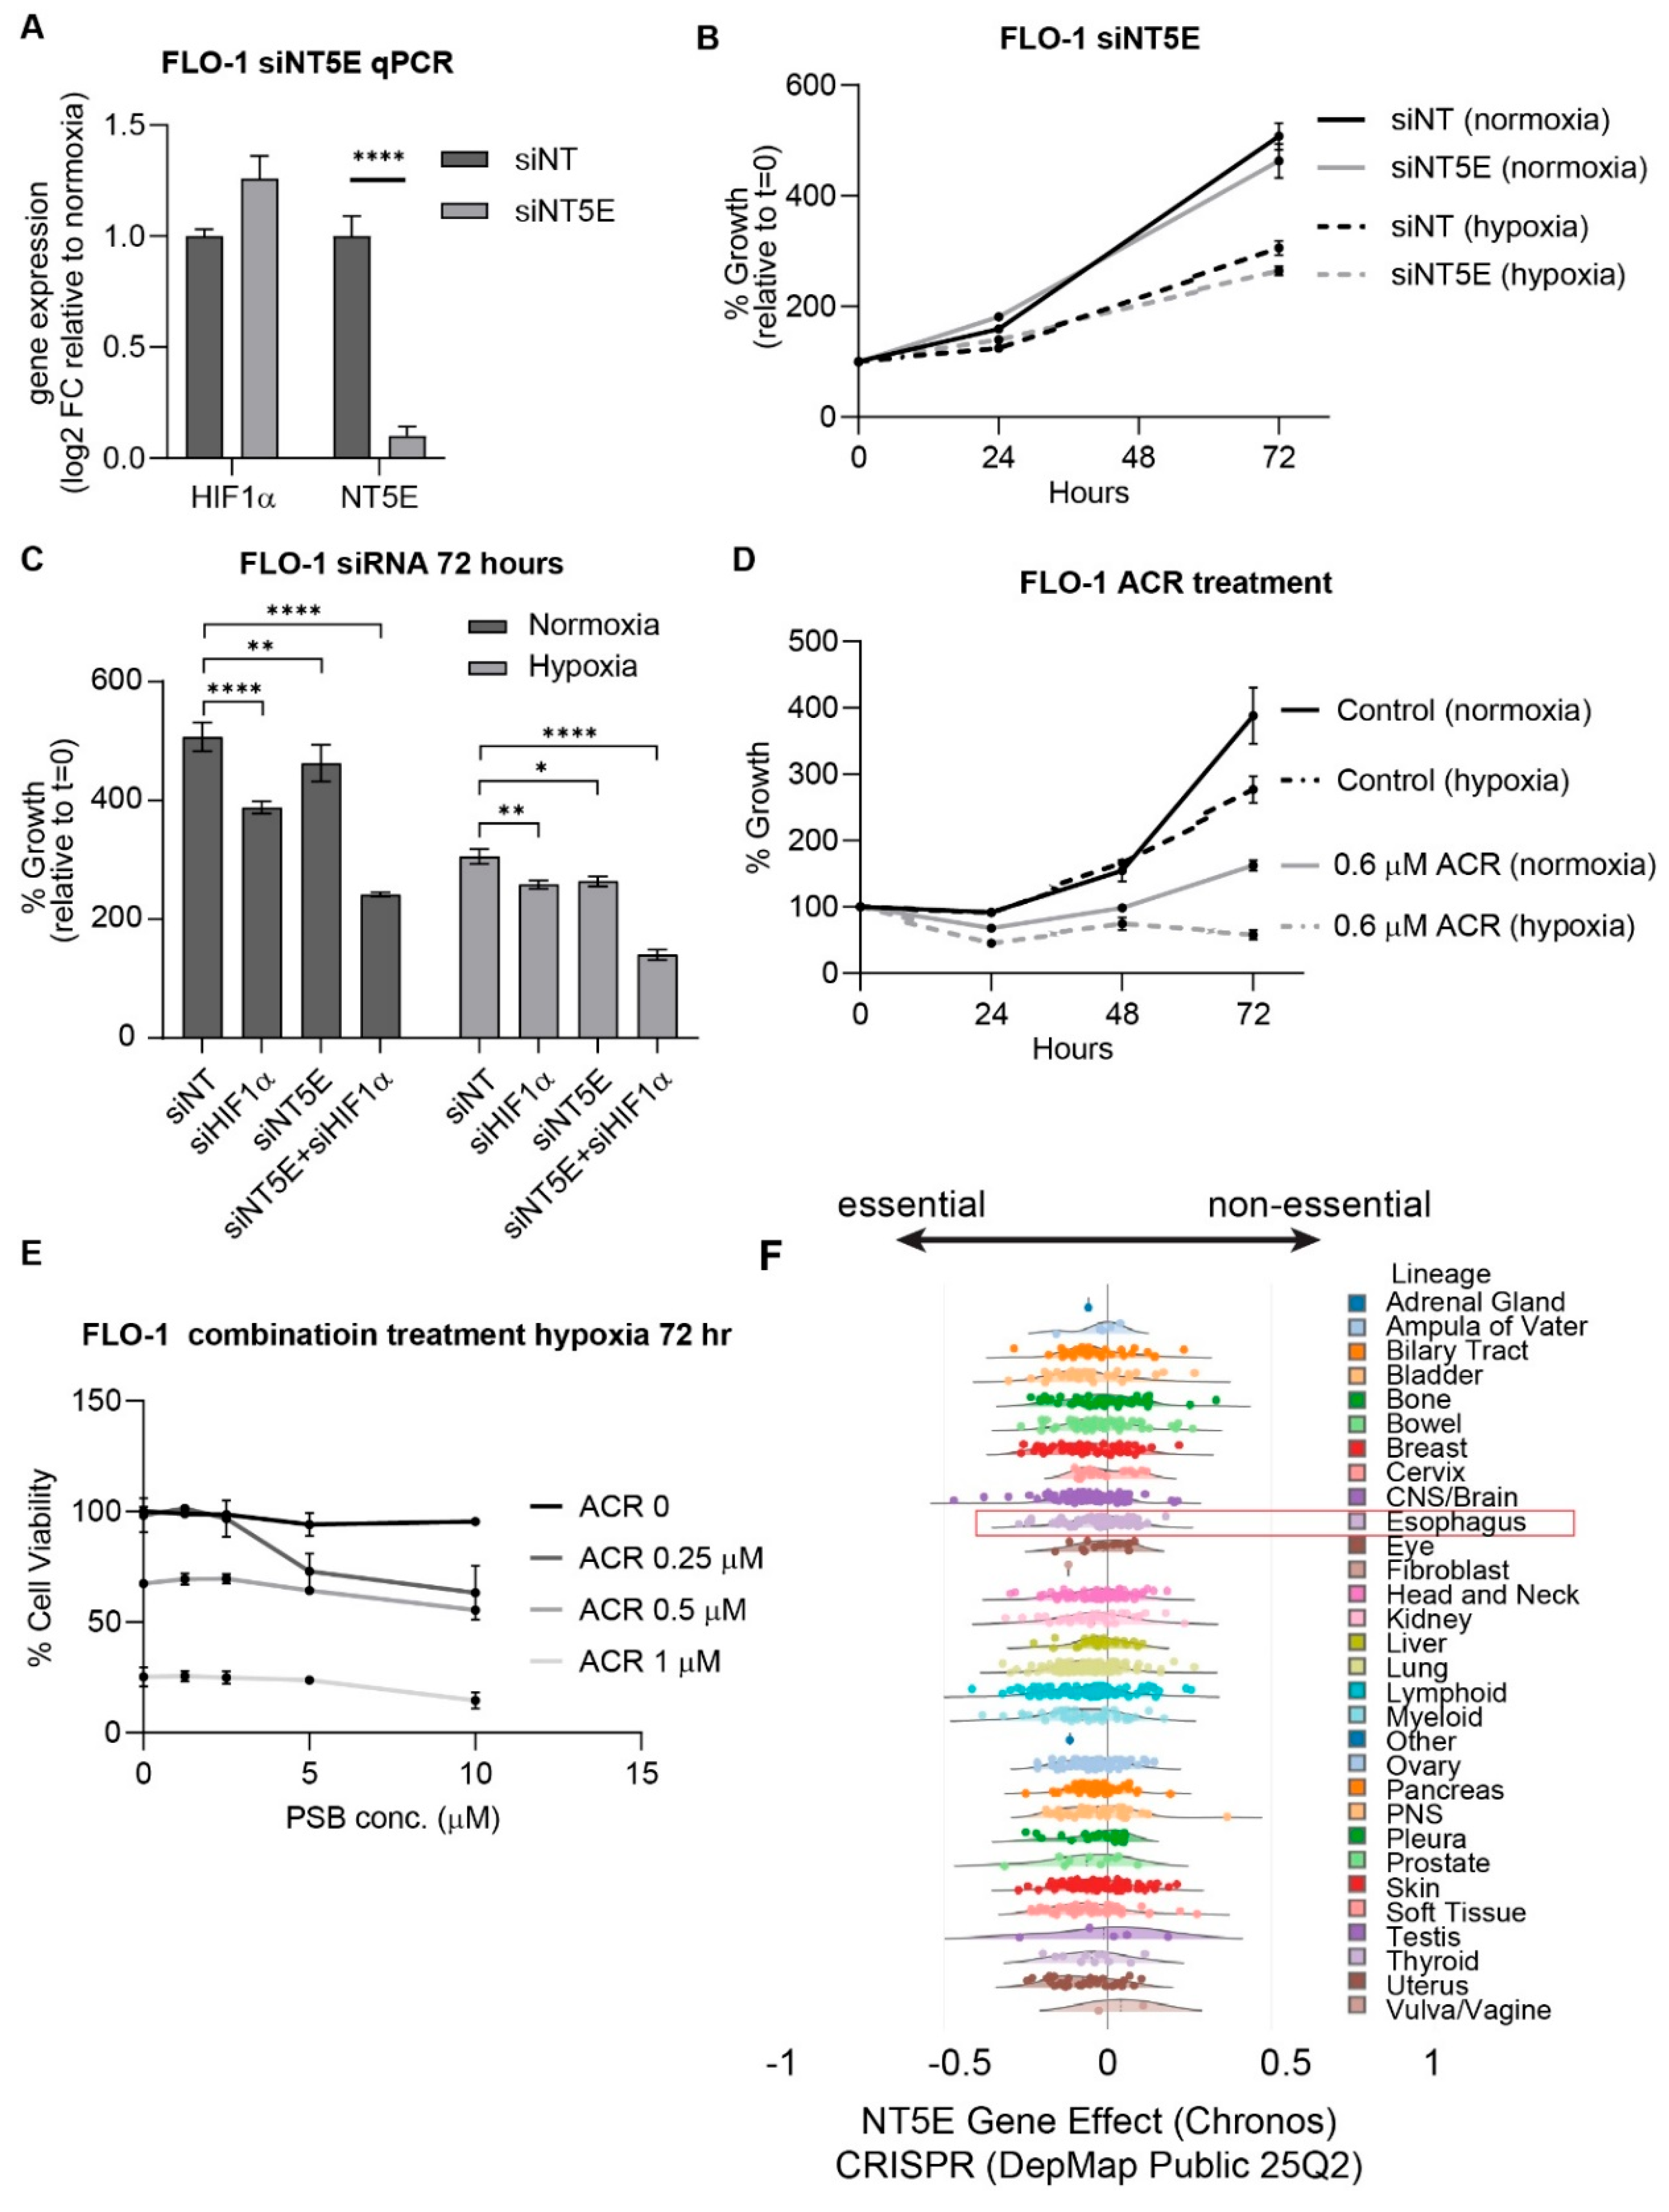
Figure 4.
HIF1α and NT5E inhibition alter purinergic metabolite levels in esophageal adenocarcinoma cells. (A) Schematic illustrating hypoxia-induced NT5E expression and the enzymatic conversion of AMP to adenosine. (B) Intracellular and extracellular adenosine levels in FLO-1 cells measured by LC-MS, cultured under normoxia or hypoxia. Data represent mean ± SD (n = 3 biological replicates); significance determined by unpaired two-tailed t-test. (C) Intracellular and extracellular AMP levels under the same conditions. Data represent mean ± SD (n = 3); significance determined by unpaired two-tailed t-test. (D) Dose-dependent changes in intracellular adenosine following treatment with PSB12379, acriflavine, or their combination under hypoxia. Data represent mean ± SD (n = 3); analyzed by two-way ANOVA with Tukey’s multiple comparison test. (E) Adenosine levels in conditioned media from the same experiment, showing dose-dependent accumulation at low and intermediate PSB12379 concentrations, followed by reduction at the highest dose. Data represent mean ± SD (n = 3); analyzed by two-way ANOVA with Tukey’s post hoc test. (F) Intracellular AMP levels under the same treatment conditions; PSB12379-induced AMP accumulation further enhanced by acriflavine co-treatment. Data represent mean ± SD (n = 3); analyzed by two-way ANOVA with Tukey’s multiple comparison test.
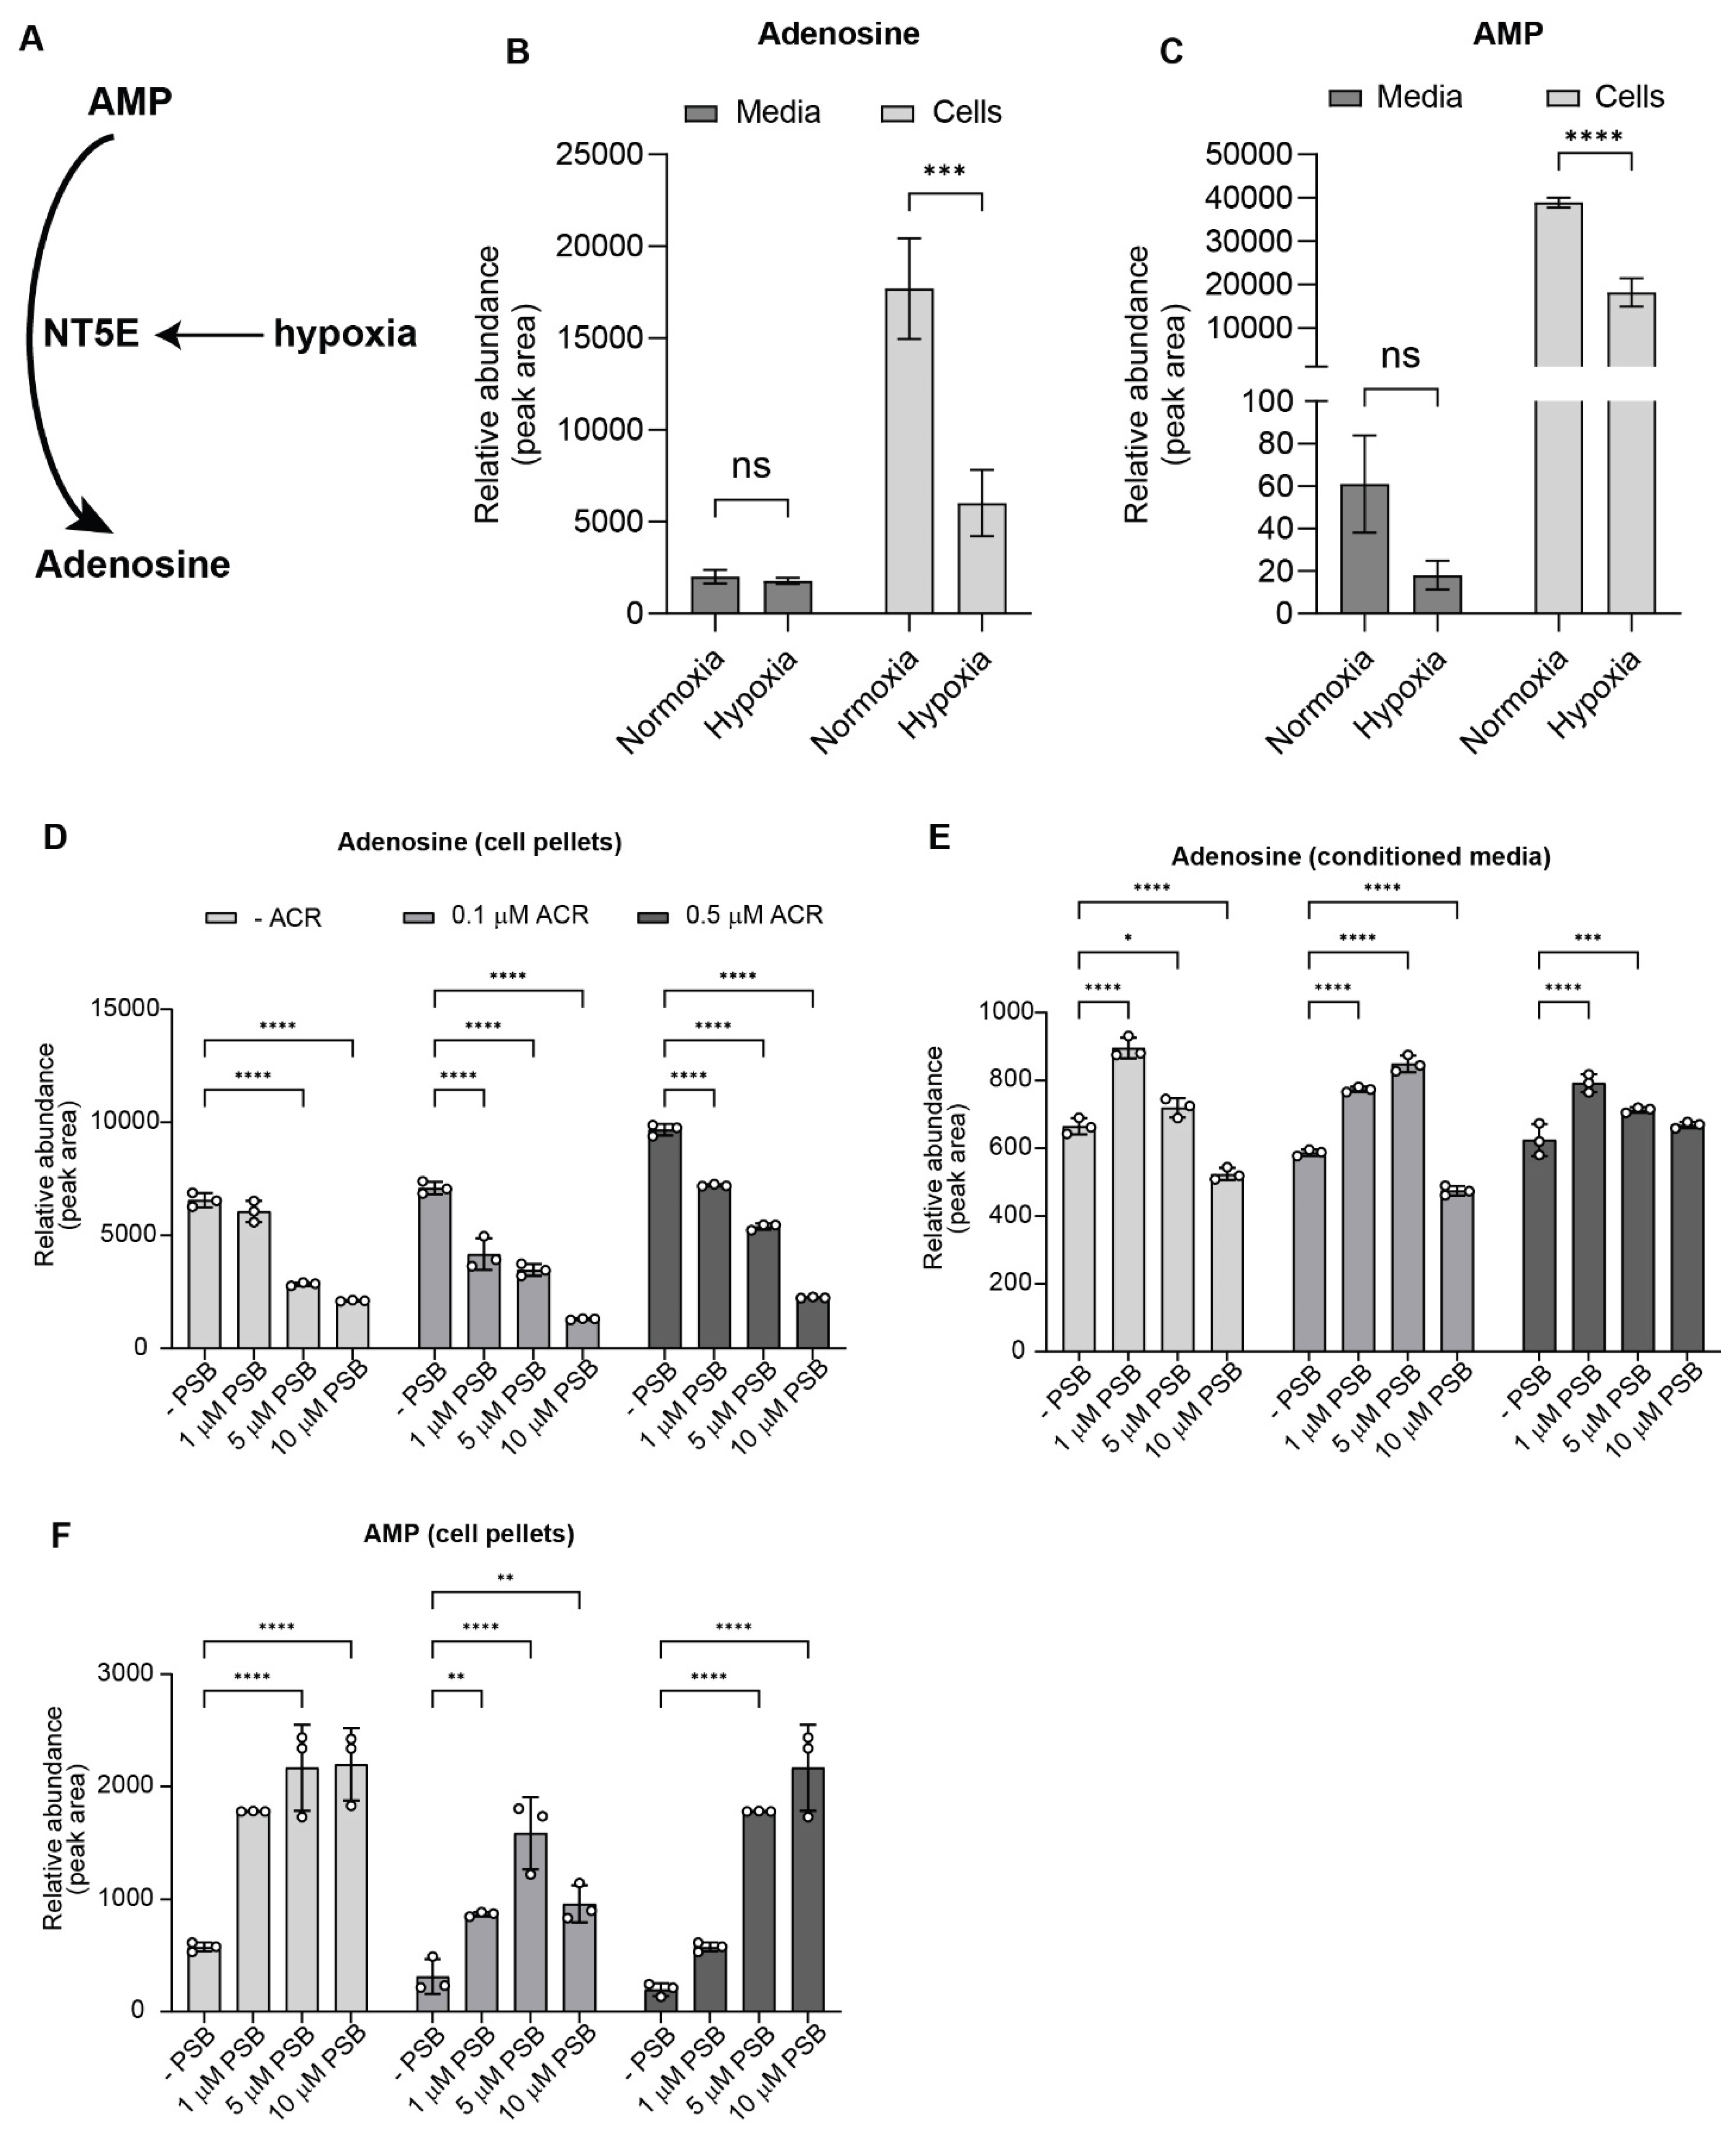
Figure 5.
Dual inhibition of HIF1α and NT5E disrupts extracellular pathways associated with immune evasion and metastasis. (A-B) Representative images (A) and cell counts (B) in FLO-1 for the cell migration assay under hypoxia with indicated treatments; data represent mean ± SD of cell counts for n = 20 images across 2 separate experiments, analyzed by one-way ANOVA. (C-D) VEGF levels in conditioned media under hypoxia with indicated treatments, data represent mean ± SD (n=3) analyzed by one-way ANOVA.
Disclaimer/Publisher’s Note: The statements, opinions and data contained in all publications are solely those of the individual author(s) and contributor(s) and not of MDPI and/or the editor(s). MDPI and/or the editor(s) disclaim responsibility for any injury to people or property resulting from any ideas, methods, instructions or products referred to in the content. |
© 2025 by the authors. Licensee MDPI, Basel, Switzerland. This article is an open access article distributed under the terms and conditions of the Creative Commons Attribution (CC BY) license (http://creativecommons.org/licenses/by/4.0/).
Copyright: This open access article is published under a Creative Commons CC BY 4.0 license, which permit the free download, distribution, and reuse, provided that the author and preprint are cited in any reuse.


