
Submitted:
14 January 2026
Posted:
15 January 2026
You are already at the latest version
Abstract
In recent years, numerous initiatives have aimed to implement renewable energy sources in diverse contexts. This article presents the design and evaluation of a photovoltaic charging station prototype for low-power devices in educational settings. Its foremost innovation is achieved through the integration of IoT technologies for real-time monitoring and optimization, enabling data collection on energy generation, consumption, and environmental conditions, with potential for AI-based processing. The system adopts a modular and scalable design, allowing adaptation to different needs and conditions.
The project demonstrates how renewable energy use can be optimized in non-commercial contexts according to environmental factors and energy demand. The system comprises four subsystems: solar energy capture via a photovoltaic panel, current regulation and control, environmental parameter monitoring, and real-time data transmission through advanced communication protocols.
Results indicate that the prototype efficiently supports device charging and enables intelligent energy management through IoT integration. Remote access to operational data facilitates real-time decision-making and management optimization. The charging efficiency allows laptops to operate for a one-hour class in off-grid outdoor environments, with up to four hours of battery life under average radiation. Beyond technical outcomes, the project positively impacted student motivation and user engagement, fostering critical thinking, problem-solving, and environmental awareness.
In conclusion, this proposal contributes to advancing the intersection of education, sustainability, and technological innovation. Its modular structure, real-time analysis capacity, and educational value make it an adaptable and replicable solution that contributes to a more efficient and sustainable energy model.
Keywords:
renewable energy
; charging station
; photovoltaic module
; environmental parameters
; data acquisition
; data transmission protocols
; cloud processing
; IoT
1. Introduction
The transition towards a sustainable energy model constitutes one of the major challenges of the 21st century. In this context, the integration of renewable energy sources into everyday infrastructures has become a key research focus aimed at reducing dependence on fossil fuels and mitigating climate change [1]. Among the areas with the greatest potential is the provision of energy for portable electronic devices, which have become essential tools in education, remote work, and a wide range of professional activities.
In educational environments, the intensive use of laptops throughout the academic day presents significant energy challenges, particularly in classrooms and outdoor spaces without direct access to the electrical grid. Solar charging stations represent a sustainable and autonomous solution capable of ensuring the continuous operation of these devices while reducing environmental impact and associated economic costs [5,13].
Spain offers particularly favorable conditions for the development of such systems, with an annual solar irradiation ranging from 1600 to 2000 kWh/m², according to the State Meteorological Agency [3]. This resource availability, combined with high-efficiency photovoltaic systems and adequate energy storage, enables the design of stations capable of powering multiple laptops simultaneously, even under variable radiation conditions [14,15].
The current state of the art includes initiatives such as photovoltaic computer laboratories for rural schools [13], portable solar power systems [14], and shared-use solar charging stations for electronic devices [15,22,25]. These solutions integrate photovoltaic modules, charge controllers, storage units, and multiple output interfaces (AC/DC), occasionally incorporating wireless charging capabilities [22] or designs specifically adapted to educational contexts [24].
The most advanced proposals integrate real-time monitoring and intelligent energy management, optimizing the balance between production and consumption and extending the system’s autonomy [6,7,8,9]. In addition to meeting energy demand, they serve as an educational tool that allows students to analyze parameters such as solar radiation, state of charge, or system efficiency in real time [26,27,28].
This article presents an innovative prototype of a photovoltaic station for the simultaneous charging of three laptops, designed and validated in an educational center. The system combines solar generation, storage, and monitoring of electrical and meteorological parameters, functioning as support for daily activities and as an educational resource on renewable energy and energy management. This article pursues a twofold aim:
- To validate the prototype in outdoor classrooms, assessing its ability to ensure continuous and safe charging under different environmental conditions.
- To optimize its operation through connectivity and IoT, incorporating sensors and real-time monitoring to record and analyze consumption and performance variables, enabling remote management and data-driven learning.
In order to provide a clear and coherent understanding of the prototype’s development and validation, the paper is organized into several sections that detail the context, design, experimental results, and discussion of improvements and future perspectives. Overall, the charging station is presented as an efficient and sustainable solution, adaptable to future needs of the electric mobility ecosystem. Furthermore, its implementation in educational settings promotes training in renewable energies and collaboration between governments, institutions, and companies to accelerate the transition towards a more sustainable energy model [1,6].
2. Materials and Methodology for Prototype Design and Testing
The solar charging station prototype was engineered to supply electrical power to low-consumption electronic devices such as laptops and mobile phones within educational settings. Its portable design optimizes solar energy capture by enabling flexible positioning according to sunlight availability. During daytime operation, the system provides direct charging for user devices, while after school hours it automatically recharges its internal energy storage module, ensuring autonomous operation during subsequent use cycles.
2.1. Structural Design and Assembling
The structure, fabricated from treated recyclable wood, was selected for its sustainability, durability, and ease of integration into educational environments. Figure 1a,b illustrate the external design and internal layout of the prototype, respectively.
In the upper Figure 1a, the exterior of the station is shown, where the photovoltaic generator supplies energy to the system. It also includes radiation, humidity, and temperature sensors that provide environmental data to optimize overall system performance. Additionally, the three charging points are displayed, allowing the connection of electronic devices or electric vehicles. In the lower Figure 1b, the internal arrangement of the installation components is presented. The supporting structure and fastening elements ensure both stability and mobility of the assembly, while providing adequate ventilation and protection against moderate rainfall.
2.2. General Description
The system is structured into three functional subsystems (Figure 2):
- Data Input Stage: The photovoltaic module supplies energy, and sensors (radiation, temperature, humidity) collect environmental data.
- Processing Stage: The processing subsystem (ESP32) regulates energy flow, controls electrical variables (voltage, current, power, energy), and monitors the battery state of charge, centralizing data management.
- Data Output Stage: The processed information is transmitted for visualization, storage, and analysis (cloud spreadsheets and mobile application), enabling real-time system status monitoring and efficient management.
The functional subsystems are physically implemented (Figure 3) into three blocks:
- Data Input Block: Photovoltaic energy generation (panel and Xunzel iSCC–LX 20 charge controller), energy storage (backup battery and regulator), and energy conversion (modified sine wave inverter with PWM techniques).
- Processing Block: Distribution and control (relay block managed by the ESP32), and monitoring and measurement (ATORCH energy meter and other sensors, data sent to the ESP32).
- Data Output Block: The ESP32 transmits real-time data (mobile application, cloud database, spreadsheet) for monitoring and optimization.
The system continuously operates by supplying power from the photovoltaic module. Once connected to the server, the ESP32-S3 collects environmental data (radiation, temperature, humidity) through calibrated sensors. It also measures the solar panel’s current and voltage to optimize energy distribution. The absorbed energy is regulated, stored in batteries, or converted to alternating current via the inverter.
The ESP32-S3 microcontroller analyzes data in real time, monitors performance, and manages the relays to adjust energy output. The processed data are transmitted to cloud platforms (Google Sheets and mobile applications) to provide the user with a clear overview and enable remote adjustments and full control.
The system includes advanced protections against overloads and short circuits (in the regulator and inverter) and data security mechanisms (passwords and encrypted wireless transmissions).
2.3. Electrical System
The charging station’s electrical system includes a photovoltaic module and two backup batteries, which supply power to the connected devices along with energy conversion and control components:
- Photovoltaic generator. It is the primary energy source of the system, supplying power directly to the devices or charging the batteries (Table 1)
- Backup Batteries. The two batteries, connected in parallel, store energy to ensure continuous power supply when the photovoltaic generator is insufficient. Their specifications are shown in Table 2:

Table 2.
Electrical Parameters of the Backup Batteries.
| Parameter | Value |
|---|---|
| Nominal Voltage (VN) | 12 V |
| Capacity (C) | 24 Ah |
| Maximum Stored Energy (Emáx) | 480 Wh |
The system includes a circuit breaker (MCB) to disconnect the photovoltaic module and assess the autonomy of the standalone system.
- Xunzel iSCC-LX Regulator. Solar charge controller for low-power photovoltaic systems. It intelligently manages the charging and discharging of the batteries, protecting them from overcharge and deep discharge. Its specifications are shown in Table 3:
- MJ-Xunzel 500 Power Inverter. Modified sine wave inverter that converts 12 V direct current (DC) into 230 V alternating current (AC). Its specifications are shown in Table 4.
2.3. Data Acquisition System
The station monitors, analyzes, and visualizes atmospheric and energetic parameters. It records the photovoltaic generation, battery status, consumption, and environmental conditions to identify usage patterns, evaluate efficiency, detect failures, and plan improvements.
-
Processing Subsystem. This subsystem is coordinated by an ESP32-S3-DevKitC-1 XTVTX WROOM-1-N16R8 controller board [17]. It enables remote communication (WiFi) with a control application and Google Sheets, and activates control relays for the power outlets.
- a.
- It utilizes the ESP32-S3 microcontroller [17], suitable for IoT applications.
- b.
- It is provided with a 32-bit dual-core LX7 processor running up to 240 MHz, 512 KB of SRAM, and 8 MB of external PSRAM.
- c.
- It features 2.4 GHz WiFi and Bluetooth 5.0 (LE) connectivity. Bluetooth 5.0 (LE) is suitable for local communication with other devices, such as the AC energy meter.
- d.
- It includes a low-power mode, which is suitable for solar projects.
- Sensing Subsystem. This subsystem provides data on environmental and electrical conditions to analyze their relationship with the system’s performance.
- Solar Radiation Sensor SUF268J001: Measures the incident solar energy to evaluate the generative capacity (Table 5):
-
Electric sensors. They optimize performance, manage the system, detect faults, and assess efficiency:
- a.
- b.
- Renogy Wanderer PG Smart Charge Controller [21]: This device manages the energy flow between the photovoltaic modules and the batteries, providing real-time data such as battery voltage, module voltage, charging current, and state of charge (SOC).
The design of the solar PV and IoT-based EV charging station relies on technologies that ensure robust functionality, optimal efficiency, and effective scalability. The selected communication protocols and cloud services contribute directly to these three critical pillars.These protocols enable reliable, energy-efficient data flow within the system.
- WiFi (IEEE 802.11): Used by the ESP32S3 for the primary link to the internet gateway (mobile phone). Its high bandwidth supports the functionality of near real-time monitoring and data transmission to the cloud.
- Bluetooth Low Energy (BLE): Chosen for low-power, short-range communication between the ESP32S3 and local electrical sensors (BT-1 for DC, Atorch for AC). Its minimal energy consumption is vital for the efficiency of the solar-powered system.
- MQTT (Message Queuing Telemetry Transport): Adopted as the lightweight, publish-subscribe protocol for cloud data transmission. Its low overhead minimizes bandwidth use, facilitating scalability by efficiently handling data from many devices.
- NTP (Network Time Protocol): Integrated to synchronize the ESP32S3 clock. Accurate timestamping ensures data integrity and is fundamental for reliable functionality and time-series analysis.
The cloud infrastructure provides the necessary tools for data management, processing, and visualization.
- Google Cloud Platform (GCP)—Google Sheets: Used for centralized, accessible data storage via MQTT. It provides a cost-effective repository, supporting scalability and easy archiving of large datasets.
- Firebase: Selected as the real-time backend for dynamic data visualization and mobile app synchronization. Its low-latency synchronization ensures instantaneous access to operational status, which is key for efficiency through proactive fault detection and enhanced operator functionality.
2.4. Prototype Development
The development follows a methodology that combines theoretical and experimental research in several phases: needs identification (load analysis, photovoltaic selection), environmental study (panel tilt, using OrientSol 3.0 [27] and PVSYST [28]), electrical characterization, development of the control and sensing system, implementation of IoT data transmission systems, and final field testing (Figure 4). The system integrates subsystems to meet the requirements for renewable energy generation, data acquisition, processing, and intuitive visualization.
3. Results
This section provides a detailed performance evaluation of the charging station, comparing the measured operational output under real-world conditions with the predicted energy generation obtained from simulation models. The purpose of this analysis is to validate the design and sizing assumptions, as well as to identify potential limitations of the prototype within its intended educational context.
3.1. Charging Station Testing Method
The testing approach was designed to assess the battery’s energy independence, how effectively it charges, and how its charge level changes in three primary scenarios:
- Outdoor application: designed for use in direct sunlight, mimicking the conditions of an outdoor classroom setting, such as a school garden.
- Indoor application: no solar exposure, simulating usage in a typical classroom setting.
- Interleaved load-use: simulation of routines with alternating consumption and photovoltaic generation.
Prior to each test, the initial SOC of the stationary battery and the internal batteries of the laptops were registered. In the most unfavorable tests (winter), the initial SOC was set to the minimum recommended value according to previous calculations (Table 2).
Figure 5.
Charging station testing workflow.
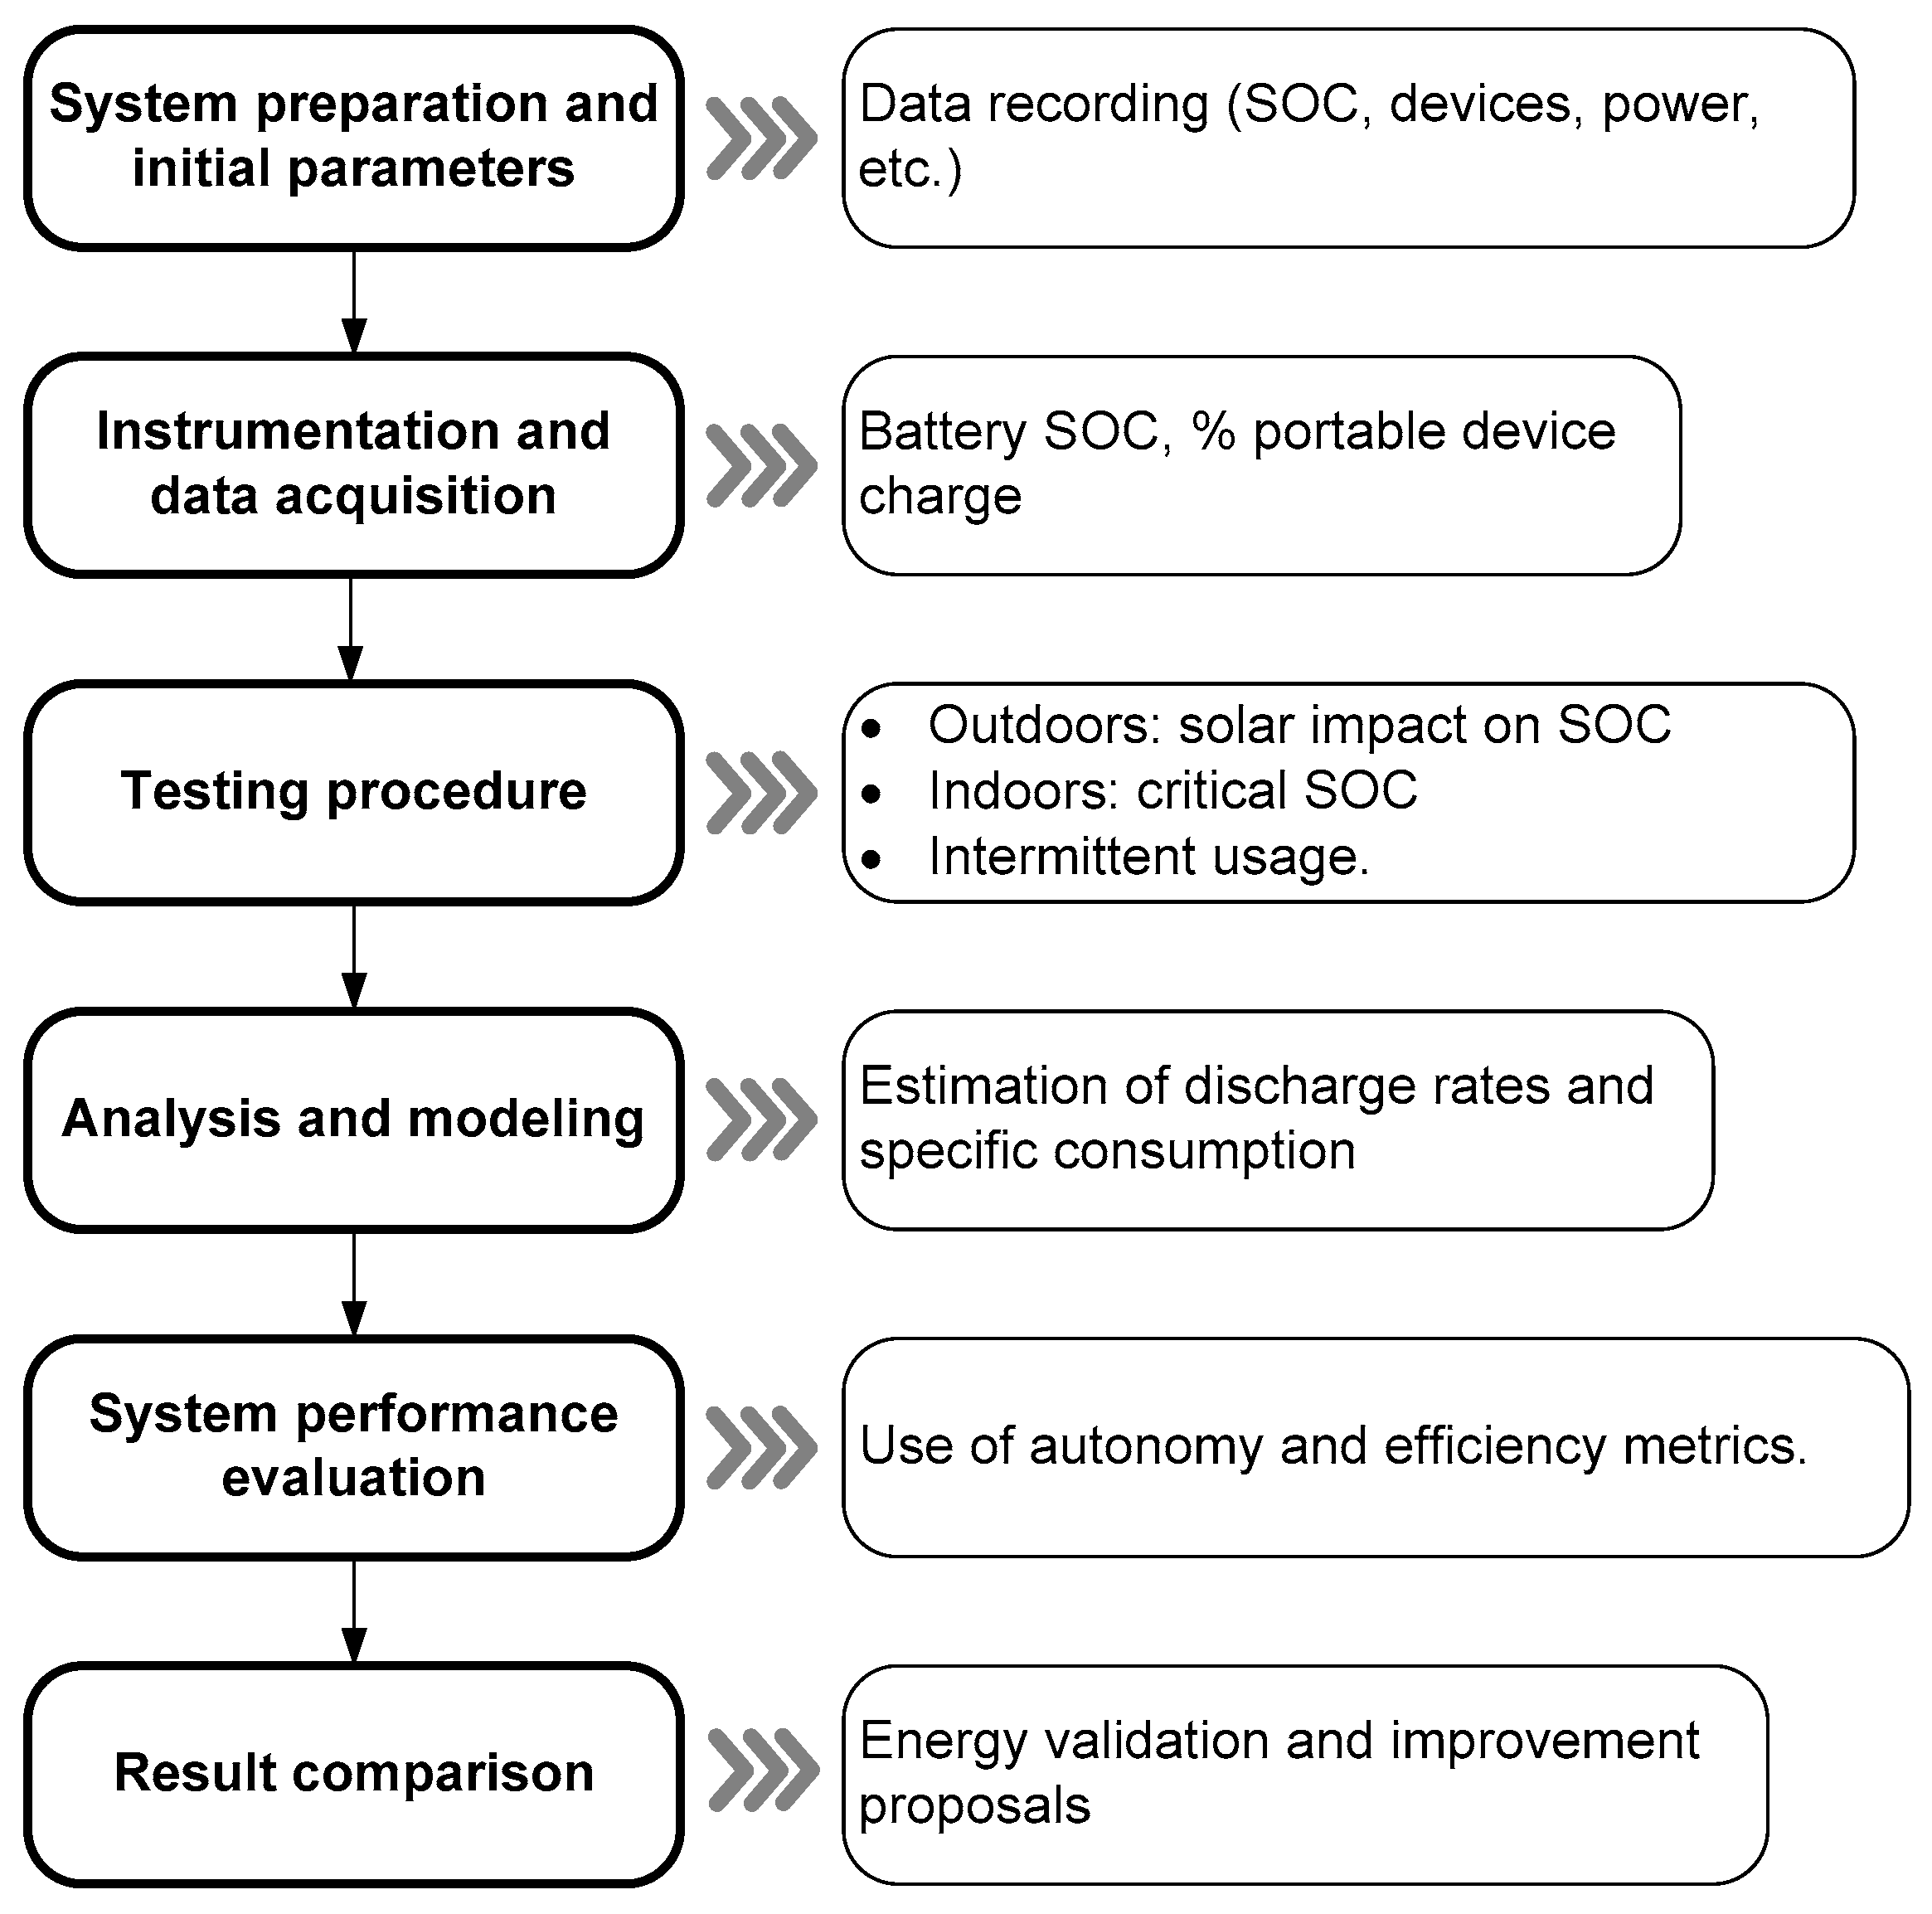
- 1.
- System preparation and initial parameters. In the preparation of the tests, the minimum recommended battery state of charge (SOC) was established as the initial condition, based on the values estimated in Table 2. This decision was derived from prior energy calculations required to power the three laptops during the target hours of each month. The following criterion was applied: since months with lower solar irradiance—such as December—represent the most unfavorable conditions, the battery was ensured to start at a SOC sufficient to cover the expected energy demand of the laptops. This approach provided a uniform and comparable starting point for all tests, avoiding the influence of variations in the initial battery charge on the results. Table 2 shows the estimated SOC percentages required at 08:30 h to maintain operation of the three laptops until the target hours. For instance, in December, at least 36% SOC is required at 08:30 h to operate until 09:30 h, and 72% SOC to reach 10:30 h, reflecting the lower solar availability during this month. In months with higher irradiance, such as June or July, the required initial SOC is lower, highlighting that the energy reserve directly depends on the expected solar radiation. This approach ensures that the tests faithfully represent the system’s ability to power the laptops under the most critical conditions, allowing for a reliable assessment of the battery and solar system performance throughout the year.
Table 2.
Estimated minimum battery percentage (SOC) required at 08:30h to power the 3 laptops for each target hour.
Table 2.
Estimated minimum battery percentage (SOC) required at 08:30h to power the 3 laptops for each target hour.
| Month | 08:30h | 09:30h | 10:30h | 12:00h | 13:00h | 14:00h |
|---|---|---|---|---|---|---|
| Jan | 0.0% | 35% | 70% | 123% | — | — |
| Feb | 0.0% | 33% | 66% | 108% | — | — |
| Mar | 0.0% | 28% | 56% | 86% | 110% | — |
| Apr | 0.0% | 25% | 49% | 75% | 99% | — |
| May | 0.0% | 22% | 44% | 65% | 87% | 110% |
| June | 0.0% | 20% | 40% | 59% | 76% | 94% |
| July | 0.0% | 20% | 39% | 58% | 75% | 92% |
| Aug | 0.0% | 22% | 43% | 64% | 84% | 100% |
| Sept | 0.0% | 26% | 52% | 80% | 104% | — |
| Oct | 0.0% | 31% | 62% | 95% | 122% | — |
| Nov | 0.0% | 34% | 69% | 100%+ | — | — |
| Dec | 0.0% | 36% | 72% | 100%+ | — | — |
- 2.
-
Instrumentation and Data Logging. The system was continuously monitored, minute by minute, using the charge controller and IoT system sensors. The key parameters recorded were
- Station battery SOC.
- Charge percentage of each laptop
- Current and voltage on the charging bus (panels and consumption).
- Power delivered by and consumed by the station
This data was used to calculate the accumulated energy (Wh) and the charge/discharge rates (SOC/min).
- 3.
-
Testing Procedure. The prototype evaluation protocol was designed to replicate the main usage conditions expected in educational environments, both outdoors with sunlight and indoors without direct irradiance. To this end, three complementary test modalities were established, allowing the system’s performance to be analyzed from different perspectives:
- a.
- Outdoors: full workdays were conducted with two work periods (8:30–11:30 and 12:00–15:00) and a 30-minute break for charging. The three laptops started at 100% charge (≈210 Wh), and the charging station at 288 Wh plus the usable portion of the additional 960 Wh battery (recommended SOC ≥60%). In the first period (630 Wh), 94.6 Wh was supplied by the solar panel, 210 Wh by the internal batteries, and 325.4 Wh by the charging station. During the break, the solar panel supplied 15.3 Wh and the charging station 14.7 Wh. In the second period (630 Wh), the solar panel supplied another 94.6 Wh, the internal batteries 30 Wh, and the charging station 505.4 Wh. Total consumption is 1290 Wh over 6.5 hours: 16% from the panel, 18.6% from the internal batteries, and 65.5% from the station, confirming the need to start with a high charge in the auxiliary battery on days with low irradiance. The analysis compared with theoretical estimates (Table 2 and Table 3) evaluates the monthly autonomy with solar input, the possibility of reaching energy class changes (“Yes/No/Partial”), and the minimum State of Charge (SOC) required at 8:30 a.m. to guarantee one-hour sessions. These tables allow for planning usage and adjusting the number of devices or storage capacity.
- b.
- Interiores: the students carried out continuous download sessions until reaching critical SOC (0–20%), determining the actual autonomy by number of laptops connected (1, 2 or 3) and validating the expected inverse proportionality.
- c.
- Interleaved load-use: routines were simulated with alternating periods of consumption and photovoltaic charging, modeling the evolution of the SOC and verifying if the system could maintain sustained operation throughout a school day.
- 4.
- Linear SOC-time models were used to estimate average discharge rates and the specific power consumption of each laptop, in order to predict how the state of charge would evolve throughout the day. In scenarios with solar generation, the hourly Production-Consumption balance was integrated to detect when energy surpluses or deficits would occur and to anticipate possible power outages. Furthermore, the actual system efficiency (85–90%) was considered to adjust the autonomy forecasts, and the initial SOC required to meet the duration targets was calculated in the worst-case scenario.
- 5.
-
The charging station’s performance was evaluated using the following metrics:
- a.
- Effective autonomy (h) per scenario and number of devices
- b.
- Relative charging efficiency (Wh usable / %SOC consumed).
- c.
- Minimum SOC required to cover the day without interruptions.
- 6.
- Finally, a comparison was made between actual results and simulations to validate the energy model.
This testing process has allowed for a comprehensive diagnosis of the system, the identification of energy bottlenecks, and the proposal of operational and sizing improvements, ensuring the reproducibility of the tests and the consistency between field data and theoretical calculations.
3.2. Expected Results
3.2.1. Trial Conditions
The experimental trials were designed and conducted to replicate, under controlled conditions, the expected operating environment of the charging station in a typical educational setting. Two types of usage scenarios were evaluated: indoor operation, without direct solar input and continuous use throughout the full school day; and outdoor operation, subject to variable irradiance and divided into two 3-hour working periods separated by a 30-minute mid-day charging interval. Figure 6 illustrates a group of students interacting with the station during outdoor testing.
3.2.2. Energy Modeling and Autonomy Assessment
Previous simulations determined the autonomy required to support a full school day, assuming an overall system efficiency of approximately 80% (corresponding to energy losses in the range of 15–30%). The modeling results, which compare both the achievable operating time and the minimum initial SOC needed across different usage scenarios, are summarized in Figure 7.
- Viability in summer: It was projected that in months with high radiation (e.g., June and July, 7.6 kWh/m2 day), the station could sustain the continuous operation of three portable units for more than 4 hours, reaching the morning usage period (08:30–12:30) with an initial SOC of 60%.
-
Critical limitation indoors or in winter outdoors: Simulations anticipated insufficient performance under unfavorable conditions:
- ○
- In winter (e.g., December, 2.4 kWh/m²/day), the maximum autonomy would be reduced to 2.8–3 hours, limiting service to the first half of the day. To meet demand, an initial State of Customer (SOC) greater than 100% of current capacity would be required.
- ○
- In indoor scenarios, the current battery bank (24 Ah, approximately 288 Wh nominal) was considered barely sufficient for one hour of continuous use with three laptops, confirming that the current capacity is insufficient for academic sessions without external support.
The comparison between scenarios revealed a structural energy deficit in winter. To guarantee supply for a full day (6.5 hours in the most unfavorable month (December), the simulation showed that the solution is the addition of an extra battery (e.g., 12 V 100 Ah LiFePO4). With this addition, autonomy is increased to 6.5 hours, and the required State of Charge (SOC) remains at a viable level of 70%.
3.3. Obtained Results
Field tests carried out in both indoor and outdoor environments enabled a direct comparison between the simulated projections and the actual operating performance of the charging station. Overall, the system successfully powered multiple laptops simultaneously in an outdoor classroom setting; however, the attainable autonomy proved to be highly dependent on seasonal irradiance conditions and the initial state of charge (SOC) of the batteries.
3.3.1. Experimental Evaluation of Energy Parameters
The key findings obtained during the experimental trials are summarized below:
- Supplied energy: he station provided between 180 Wh and 220 Wh during a typical class session of approximately 4 hours, values that closely match the demand estimated in the simulations (~200 Wh).
- Outdoor autonomy (summer): The station sustained the operation of three laptops for more than 4 continuous hours, confirming the system’s viability under average summer irradiance conditions of approximately 7.6 kWh/m²·day.
- Outdoor autonomy (winter): Maximum runtime decreased to approximately 2.5–3 hours, which is insufficient to support a full school day without additional energy sources, consistent with the projections from the simulations.
- Indoor conditions: With an initial SOC of 70%, the battery supported operation for slightly more than 1 hour with three laptops connected, confirming the limited capacity of the current battery bank (24 Ah).
- Measured SOC: On favorable days, an initial SOC of around 60% was sufficient to support operation during the morning period, whereas in December, an SOC close to the full usable capacity (~100%) was required, reinforcing the need for increased storage capacity.
- Conversion losses: Losses between 15% and 25% were observed, values consistent with the theoretical assumptions used in the simulations.
Table 10.
Overview of Experimentally Measured Energy Parameters.
| Scenario | Initial SOC | Provided energy (Wh) | System autonomy | Required SOC |
|---|---|---|---|---|
| Outdoor—summer | 60% | 200–220 | 4–4,2 h w/ 3 portable computers | ≥ 60% |
| Outdoor—winter | 100% | 180–190 | 2,5–3 h w/ 3 portable computers | ≥ 95–100% |
| Indoor | 70% | 70–90 | 1–1,2 h w/ 3 portable computers | ≥ 70% |
| W/Backup battery LiFePO₄ 100 Ah | 70% + FV | 1450 | Full time (≈ 6,5 h) |
≥ 70% |
3.3.2. Verification of the System Design Assumptions
The design of the charging station was grounded on three main operational hypotheses:
- The battery would start each day with a sufficient minimum State of Charge (SOC) to support the simultaneous operation of three laptops for at least one hour..
- Direct solar energy input would partially compensate the load demand, thereby reducing the net discharge rate of the battery bank.
- The theoretical energy balance model (SOC–time relationship) would remain valid when extrapolated to different seasonal irradiance conditions (e.g., summer vs. winter).
Field tests enabled a direct comparison between the theoretical projections and the actual performance of the prototype, confirming the system’s strong dependence on seasonal irradiance. Under high summer irradiance conditions (average of 317 W/m²), the results validated the minimum sizing hypothesis, demonstrating that the station is capable of supporting the intended load within the expected autonomy limits.
- Viability confirmed: The theoretical minimum SOC of 18% proved sufficient. With an initial SOC of 53%, the system maintained a remaining 36% after the first hour of continuous operation with three laptops..
- Session limit: The combined contribution of the battery (750 Wh total capacity) and solar input (~66 Wh/h) was sufficient to meet the peak demand of 171 Wh. However, for extended operation beyond 10:00 h, a marked decline in SOC was observed, indicating the need for active energy management when aiming for longer sessions
Moreover the tests conducted during winter and in indoor conditions (without solar input) revealed a significantly more restrictive operating scenario, fully consistent with the limitations anticipated in the simulations:
- Substantial reduction in battery life: with the current battery bank (28 Ah, 336 Wh nominal), the measured autonomy dropped to 2.3 hours with one laptop, 1.2 hours with two laptops, and barely 47 minutes with three laptops connected..
- Hypothesis not fulfilled: In winter conditions, the reduced solar input combined with the limitations of the PWM charge controller was insufficient to meet the load demand. The SOC fell to critical levels in under one hour, invalidating the assumption that the system could continuously power three laptops throughout a full school day.
Figure 8 summarizes the extent to which the initial design hypotheses were satisfied. The experimental results clearly demonstrate the need to expand the storage capacity and improve conversion efficiency (e.g., replacing the PWM controller with an MPPT system and adopting DC–DC charging) in order to ensure robust operation and guarantee year-round service availability.
3.3.3. Comparison with Previous Studies
Specific studies on solar-powered charging stations for low-power electronic devices in educational environments have significantly expanded in recent years, although the approaches and evaluation metrics remain highly heterogeneous [5,13,14,15,22,24,25]. Prior developments range from photovoltaic classrooms and laboratory infrastructures [5,13] to portable units and campus-wide installations [14,15,22,24,25]. In contrast, the prototype described in this study is specifically tailored to real classroom operation: a photovoltaic charging station capable of simultaneously powering three laptops, complemented by seasonal (summer/winter) field measurements and an IoT-based monitoring system that enables continuous tracking of state of charge (SOC), power flow, and solar irradiance..
In terms of design and sizing, the proposed prototype occupies an intermediate position between low-power portable solutions and larger shared-use charging stations. Whereas previous studies typically employ PV arrays ranging from 200 to 600 W and battery capacities between 0.3 and 1 kWh [22,24,25], or focus on individual personal-use packs [14], this system is explicitly conceived to supply power concurrently to three laptops, with autonomy quantified under real school operating conditions. The seasonal validation carried out—confirming viable performance in summer (SOC ≥ 18% and autonomy ≥ 1 hour with three devices) but identifying clear limitations in winter due to the reduced capacity of the current 24 Ah battery bank—constitutes a relevant contribution, as most related works evaluate performance only under typical or favorable irradiance scenarios, without seasonal contrast [22,24,25]. Moreover, the integration of PV simulations [27,28] aligned with the solar resource available in Spain [3] provides a solid and replicable basis for future system optimization, such as scaling storage with 12 V–100 Ah LiFePO₄ batteries to ensure adequate autonomy during winter operation.
Regarding power electronics, previous studies show heterogeneous configurations: while some incorporate pure sine wave inverters and MPPT controllers to maximize energy harvesting [22,25], others rely on simpler—but less efficient—PWM-based architectures. In our case, the field results confirm that conversion losses (15–25%) and the limitations inherent to PWM regulation significantly reduce operational autonomy under low irradiance conditions. These findings reinforce the need to migrate to MPPT controllers and to adjust the charging strategy to account for seasonal performance penalties [27,28]. Furthermore, the incorporation of load-management practices inspired by electric mobility research [6,7,8,9,10] supports the operational guidelines derived from this work: shift-based usage scheduling, reduction of concurrent loads when required, and expansion of the storage system where seasonal irradiance conditions demand it.
Finally, the integration of real-time data acquisition and IoT connectivity [11,12] introduces an additional pedagogical dimension to the system. Beyond monitoring energy variables, the station transforms these data streams into educational resources, enabling students to directly relate SOC evolution, power output, and conversion losses to practical decisions about device usage. Although previous photovoltaic initiatives in education emphasize the instructional benefits of renewable energy technologies [5,13,26], few have established such a direct link between system performance and the organization and management of learning activities.
Overall, the proposed prototype constitutes a meaningful step forward compared with previous initiatives, as it combines portability, real-world deployment in school environments, seasonal performance assessment, IoT-based monitoring, and clear pedagogical applicability. In addition to demonstrating technical feasibility, this work establishes design and operational guidelines tailored to educational institutions, identifying optimal operating conditions (summer use, SOC ≥ 18%, morning schedules) and defining upgrades required to guarantee year-round service—namely, increased storage capacity (≈ 100 Ah LiFePO₄ battery), migration to MPPT charge regulation, and more efficient load-management strategies. These recommendations are consistent with the national solar resource available in Spain [3] and aligned with best-practice approaches in PV simulation [27,28].
4. Discussion
Field tests confirm the validity of the initial design of the solar charging station while also highlighting structural limitations related to the seasonality of solar resources and the sizing of the battery bank. Performance aligned closely with simulation results under summer irradiance conditions; however, substantial deviations were observed in winter and low-light conditions, where the available autonomy decreased sharply. These findings are consistent with previous studies on solar-powered charging systems and energy management for portable devices [13,14,15].
- 1.
-
Viability under high irradiance conditions (summer):
- ○
- ○
- ○
- 2.
-
Critical limitation under low irradiance (winter or indoor conditions):
- ○
- Autonomy was insufficient in winter and indoor scenarios. Maximum operation times dropped to 2.5–3 hours, well below the required 6.5 hours, and fell to around 1 hour under indoor conditions. This aligns with AEMET solar irradiance data showing a strong seasonal reduction in available solar energy in northern and central Spain [3].
- ○
- ○
- Low solar contribution combined with the relatively low efficiency of the PWM regulator (15–25% losses) under these conditions did not compensate for the demand, highlighting a key limitation in design that mirrors findings from prior research on solar charging stations and zero-energy buildings [5,6].
These results indicate that while the system performs adequately under favorable solar conditions, its design requires careful consideration of seasonal variability and battery sizing to ensure year-round reliability. Accordingly, future improvements could include:
- ○
- ○
- ○
5. Conclusions
The results confirm the structural deficit anticipated in the simulations, demonstrating that the station cannot sustain a full school day during the most unfavorable months.
- Need for expansion: The simulation confirms that an additional battery (12 V–100 Ah–LiFePO4) is required to achieve daily operational robustness.
- Efficiency optimization: The low efficiency of the PWM regulator underscores the recommendation to incorporate MPPT controllers to maximize solar energy harvesting.
- Added value of IoT. Real-time IoT monitoring was essential to validate the energy model and served as a pedagogical tool for load management.
Overall, the system functions effectively as a prototype in outdoor environments under favorable conditions. However, to ensure year-round performance, it is essential to implement technical improvements aimed at: increasing storage capacity, integrating MPPT controllers, and establishing load management protocols adapted to seasonal variations.
Appendix A. Glossary
IoT (Internet of Things): a network of interconnected physical objects (sensors, controllers, devices) that collect, transmit, and process data to optimize processes or services.
MQTT (Message Queuing Telemetry Transport): a lightweight messaging protocol based on the “publish–subscribe” model, used in IoT applications to transmit real-time data with minimal bandwidth consumption.
Photovoltaic module: a device that converts solar radiation into electrical energy through the photovoltaic effect; also known as a solar panel.
NTP (Network Time Protocol): a time synchronization protocol that enables networked devices to maintain the same system time, essential for time-series data analysis.
PWM (Pulse Width Modulation): an electronic control technique that regulates the power supplied to a device by modulating the width of electrical pulses.
MPPT (Maximum Power Point Tracking): a control method that optimizes solar energy conversion by continuously adjusting the operating point to achieve maximum power output from the photovoltaic panel.
SOC (State of Charge): the percentage indicating the current charge level of a battery relative to its total capacity. It is a key indicator of energy autonomy.
LiFePO₄ (Lithium Iron Phosphate): a type of rechargeable lithium-ion battery offering high thermal stability, long lifespan, and enhanced safety—ideal for photovoltaic systems.
Inverter: an electronic device that converts direct current (DC) from batteries or solar panels into alternating current (AC), suitable for powering standard equipment.
Charge Controller: a device that regulates the energy flow between the solar panel, the battery, and the load, preventing overcharging or deep discharging.
WiFi (IEEE 802.11): a wireless communication standard that enables devices to connect to a local network or the Internet without physical cables.
Firebase: a Google platform providing cloud services for real-time data storage and synchronization, commonly used in IoT and mobile applications.
Google Cloud Platform (GCP): a suite of cloud-based services that allows for data processing, storage, and visualization, integrating tools such as Google Sheets for remote monitoring.
Hybrid systems: energy configurations that combine multiple renewable sources (such as solar and wind) to enhance overall reliability and performance.
Conversion efficiency: the ratio between the useful energy obtained and the total energy captured, expressed as a percentage. In photovoltaic systems, it reflects losses due to conversion or regulation.
Energy autonomy: the duration during which a system can operate independently without receiving additional energy from an external source.
Photovoltaic prototype: an experimental model of a solar-based system, developed to validate its operation and efficiency before final implementation.
Appendix B. Acknowledgments
The authors would like to express their sincere gratitude to the teaching staff who guided, advised, and directly contributed to the development of this project, with special recognition for the first prize awarded in the Secondary Education category at the XV International Congress on Technology, Learning, and Teaching of Electronics, held in Málaga in June 2024. We also acknowledge the support of the University of Jaén for providing access to its facilities and educational resources. This project benefited from financial and material support provided by the “Actuación en Innovación Educativa” and “Investiga y Descubre” programs of the Junta de Andalucía. Additionally, we thank colleagues and previous research studies on solar-powered charging systems and energy management, which were essential for guiding the experimental design and analysis.
References
- International Energy Agency, World Energy Outlook 2023, pp. 17, 20, 48, 90, 2023.
- Observatorio de la Movilidad Eléctrica, “Informe OBS Movilidad Eléctrica 2024,” pp. 4-7, 18, 63-77, 2024.
- Agencia Estatal de Meteorología (AEMET), Atlas de radiación solar en España usando datos del SAF de Clima de EUMETSAT, Madrid, España: AEMET, 2012. Disponible en: https://www.aemet.es/documentos/es/serviciosclimaticos/datosclimatologicos/atlas_radiacion_solar/atlas_de_radiacion_24042012.pdf.
- Hernández Arauzo, A., Puente Peinador, J., González, M. A., Varela Arias, J. R., & Sedano Franco, J. (2013). Dynamic scheduling of electric vehicle charging under limited power and phase balance constraints. In Proceedings of SPARK 2013-Scheduling and Planning Applications woRKshop. Association for the Advancement of Artificial Intelligence.
- Iqbal, M.T., “A feasibility study of a zero energy home in Newfoundland” Renewable Energy, vol. 29, no. 2, pp. 277–289, 2004.
- M. R. Hajidavalloo, F. A. Shirazi, y M. J. Mahjoob, “Performance of different optimal charging schemes in a solar charging station using dynamic programming,” Optimal Control Applications and Methods, vol. 41, no. 6, May 2020. [CrossRef]
- N. Chen, T. Q. S. Quek and C. W. Tan, “Optimal charging of electric vehicles in smart grid: Characterization and valley-filling algorithms,” 2012 IEEE Third International Conference on Smart Grid Communications (SmartGridComm), Tainan, Taiwan, 2012, pp. 13-18. [CrossRef]
- Sedano, J., Portal, M., Hernández-Arauzo, A., Villar, J. R., Puente, J., & Varela, R. (2013). Sistema inteligente de recarga de vehículos eléctricos: diseño y operación. Dyna, 88(6), 644-651.
- International Renewable Energy Agency (IRENA), Innovation Outlook: Electric Vehicles and Smart Charging, 2019.
- Timpner, J., & Wolf, L. (2012, March). A back-end system for an autonomous parking and charging system for electric vehicles. In 2012 IEEE International Electric Vehicle Conference (pp. 1-8). IEEE.
- Nouali, O., Moussaoui, S., & Derder, A. (2015, November). A BLE-based data collection system for IoT. In 2015 First International Conference on New Technologies of Information and Communication (NTIC) (pp. 1-5). IEEE.
- DeBell, T., Goertzen, L., Larson, L., Selbie, W., Selker, J., & Udell, C. (2019). Opens hub: Real-time data logging, connecting field sensors to google sheets. Frontiers in Earth Science, 7, 137.
- Cao, H., Gonzales, J., Dimetry, N., Cate, J., Huynh, R., & Le, H. T. (2019). A solar-based versatile charging station for consumer ac-dc portable devices. International Journal of Education and Learning Systems, 4.
- Akankpo, A. O., Adeniran, A. O., Ayedun, F., Anyanor, O. O., & Ebong, G. (2023). Development and Construction of Portable Solar Power Packs for Laptops and Small Devices. Journal of Research in Environmental and Earth Sciences, 9(1), 5-63.
- Oliveira, S., Pessoa, M. S. P., & de Alencar, D. B. A Solar Powered Electronic Device Charging Station. 2019.
- Espressif Systems. (n.d.). ESP32-S3-DevKitC-1. Espressif Systems Documentation. https://docs.espressif.com/projects/esp-dev-kits/en/latest/esp32s3/esp32-s3-devkitc-1/index.html.
- Vishay Intertechnology. (n.d.). SUF268J001 datasheet [Hoja de datos]. Digi-Key. https://www.digikey.com/es/htmldatasheets/production/1812215/0/0/1/suf268j001-datasheet.
- Aosong Electronics Co., Ltd. (n.d.). DHT11 Technical Data Sheet [Hoja de datos]. Mouser Electronics. https://www.mouser.com/datasheet/2/758/DHT11-Technical-Data-Sheet-Translated-Version-1143054.pdf.
- Atorch. (n.d.). Atorch S1 manual [Manual]. Manualslib. https://www.manualslib.com/manual/3065332/Atorch-S1.html.
- Renogy. (n.d.). WND10 datasheet [Hoja de datos]. Renogy. https://www.renogy.com/content/RNG-CTRL-WND10/WND10-Datasheet.pdf.
- Renogy. (n.d.). WND10 datasheet [Hoja de datos]. Renogy. https://www.renogy.com/content/RNG-CTRL-WND10/WND10-Datasheet.pdf.
- Tran, B., Ovalle, J., Molina, K., Molina, R., & Le, H. T. (2021). Solar-powered convenient charging station for mobile devices with wireless charging capability. WSEAS Transactions on Systems, 20, 260-271.
- Ravichandran, S., Kaliaperumal, G., & Nesaian, M. L. (2024, August). Green energy powered portable charging station. In AIP Conference Proceedings (Vol. 3044, No. 1, p. 030003). AIP Publishing LLC.
- Chowdhury, O. R., Rahman, M. M., & Hossain, M. F. (2021). Establishment of solar powered green canopy smart device charging station. International Journal of Progressive Sciences and Technologies, 29(2), 323–330. [CrossRef]
- Singh, S., Avhad, J., Thakur, R., Dham, A. S., & Parve, K. (2024). Solar powered mobile charging unit. International Journal of Innovative Research in Electrical, Electronics, Instrumentation and Control Engineering, 12(2). [CrossRef]
- Rus-Casas, C., Hontoria, L., Jiménez-Torres, M., Muñoz-Rodríguez, F. J., & Almonacid, F. (2014). Virtual laboratory for the training and learning of the subject solar resource: OrientSol 2.0. In 2014 XI Tecnologías Aplicadas a la Enseñanza de la Electrónica (TAEE) (pp. 1–6). Bilbao, Spain. [CrossRef]
- Kandasamy, C. P., Prabu, P., & Niruba, K. (2013, December). Solar potential assessment using PVSYST software. In 2013 International Conference on Green Computing, Communication and Conservation of Energy (ICGCE). [CrossRef]
- PVSYST, Design and simulation software for your photovoltaic systems. https://www.pvsyst.com/.
Figure 1.
(a). External design of the solar charging station. (b). Internal layout of the solar charging station.
Figure 1.
(a). External design of the solar charging station. (b). Internal layout of the solar charging station.
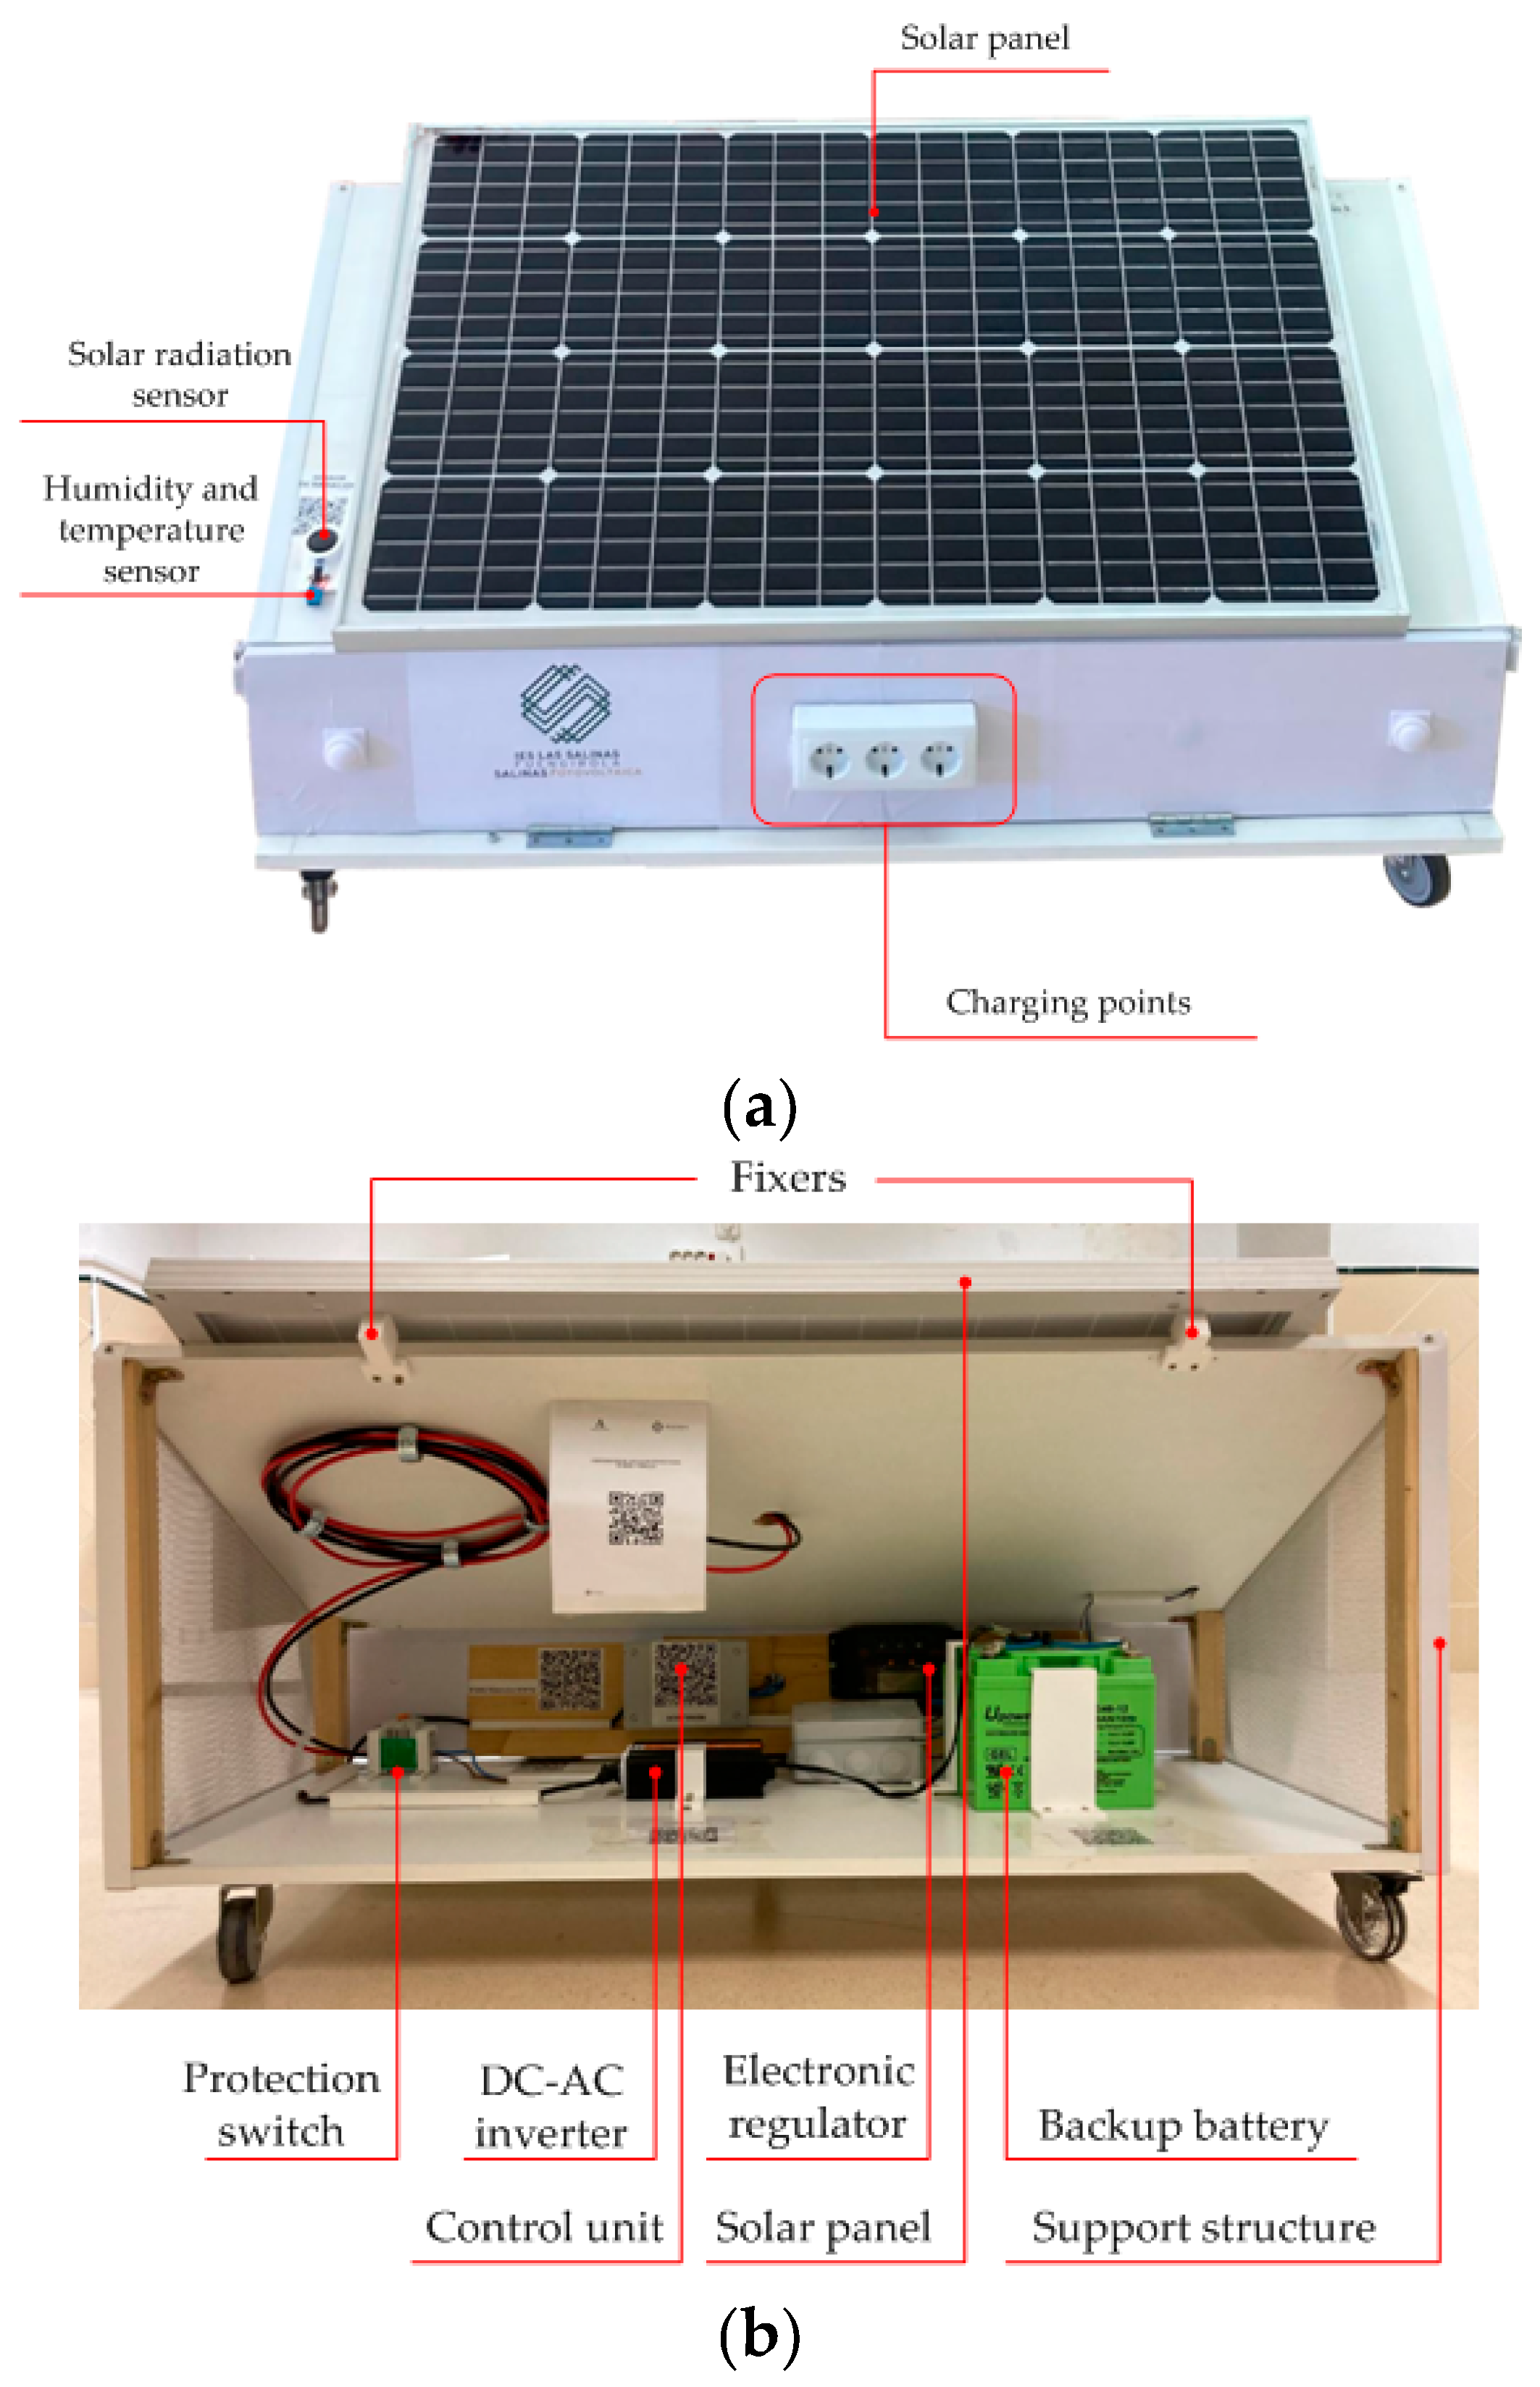
Figure 2.
Energy and Data Flow.
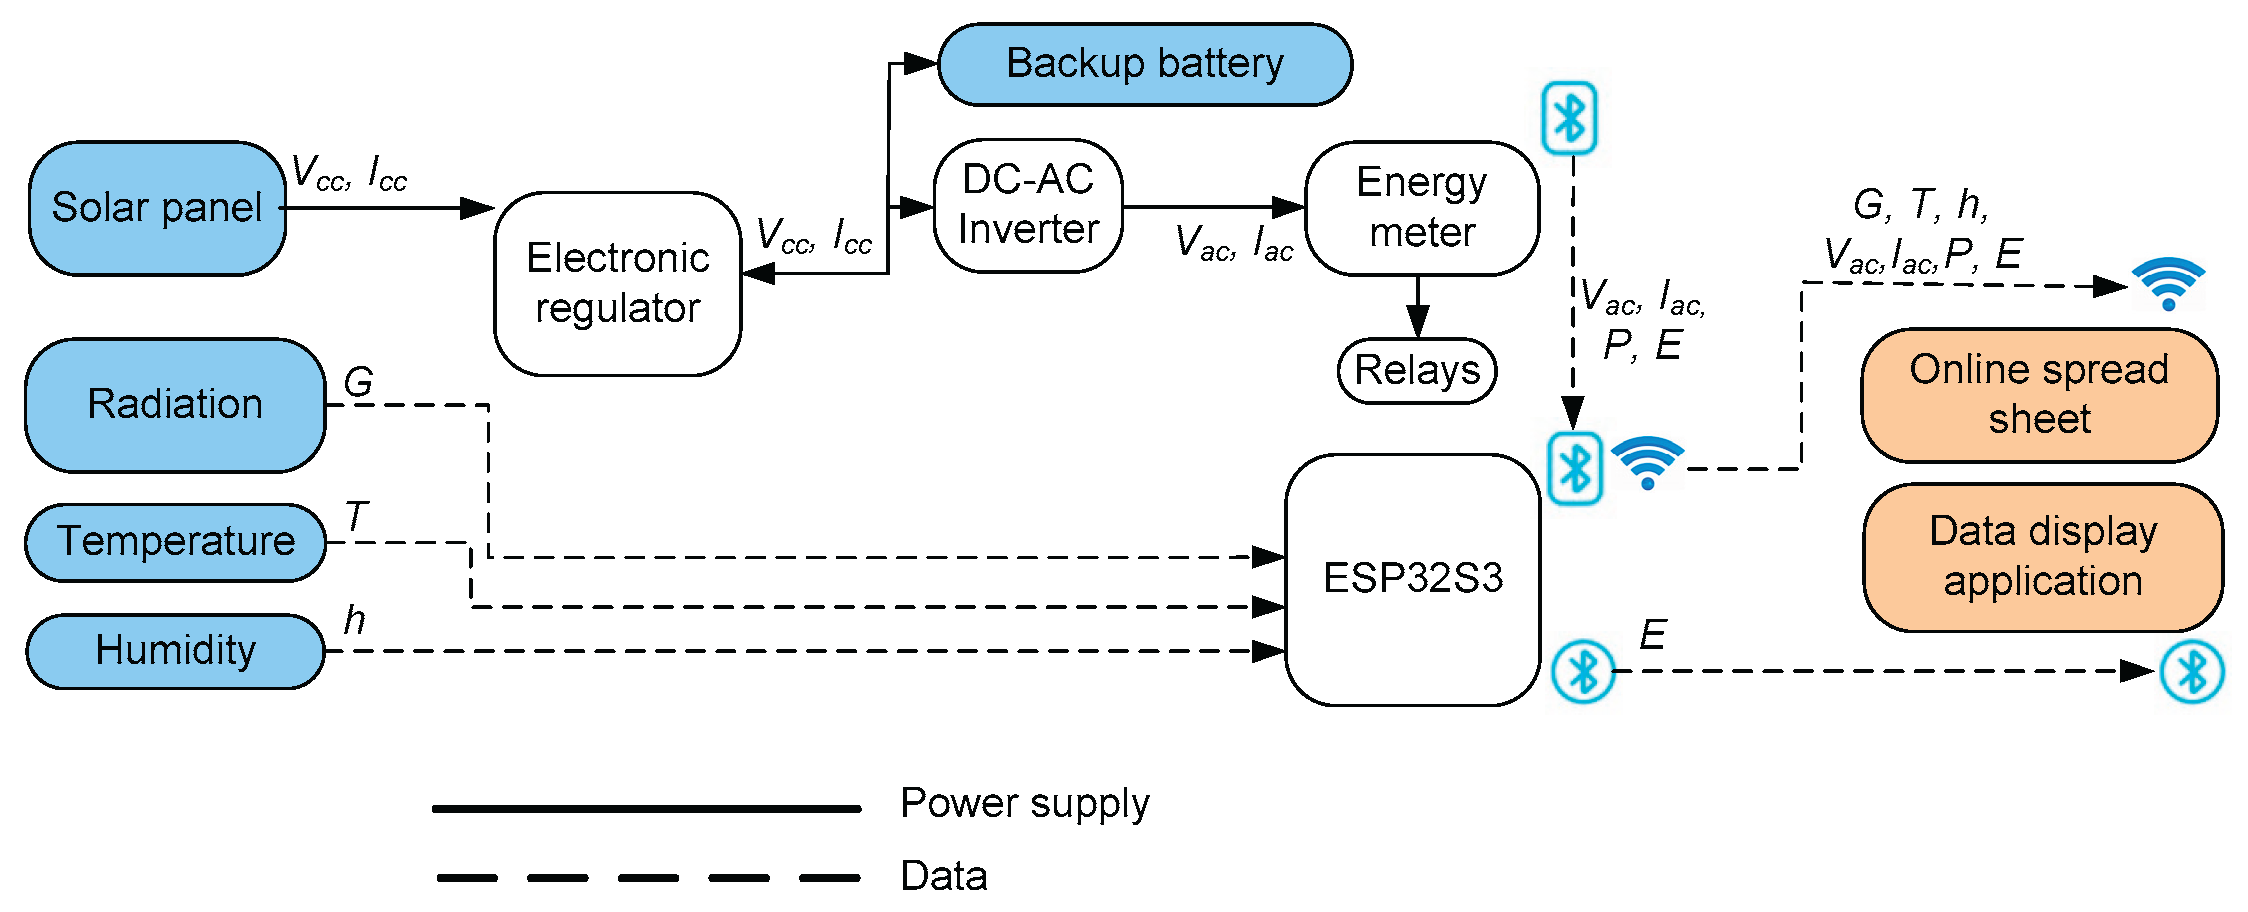
Figure 3.
System architecture.
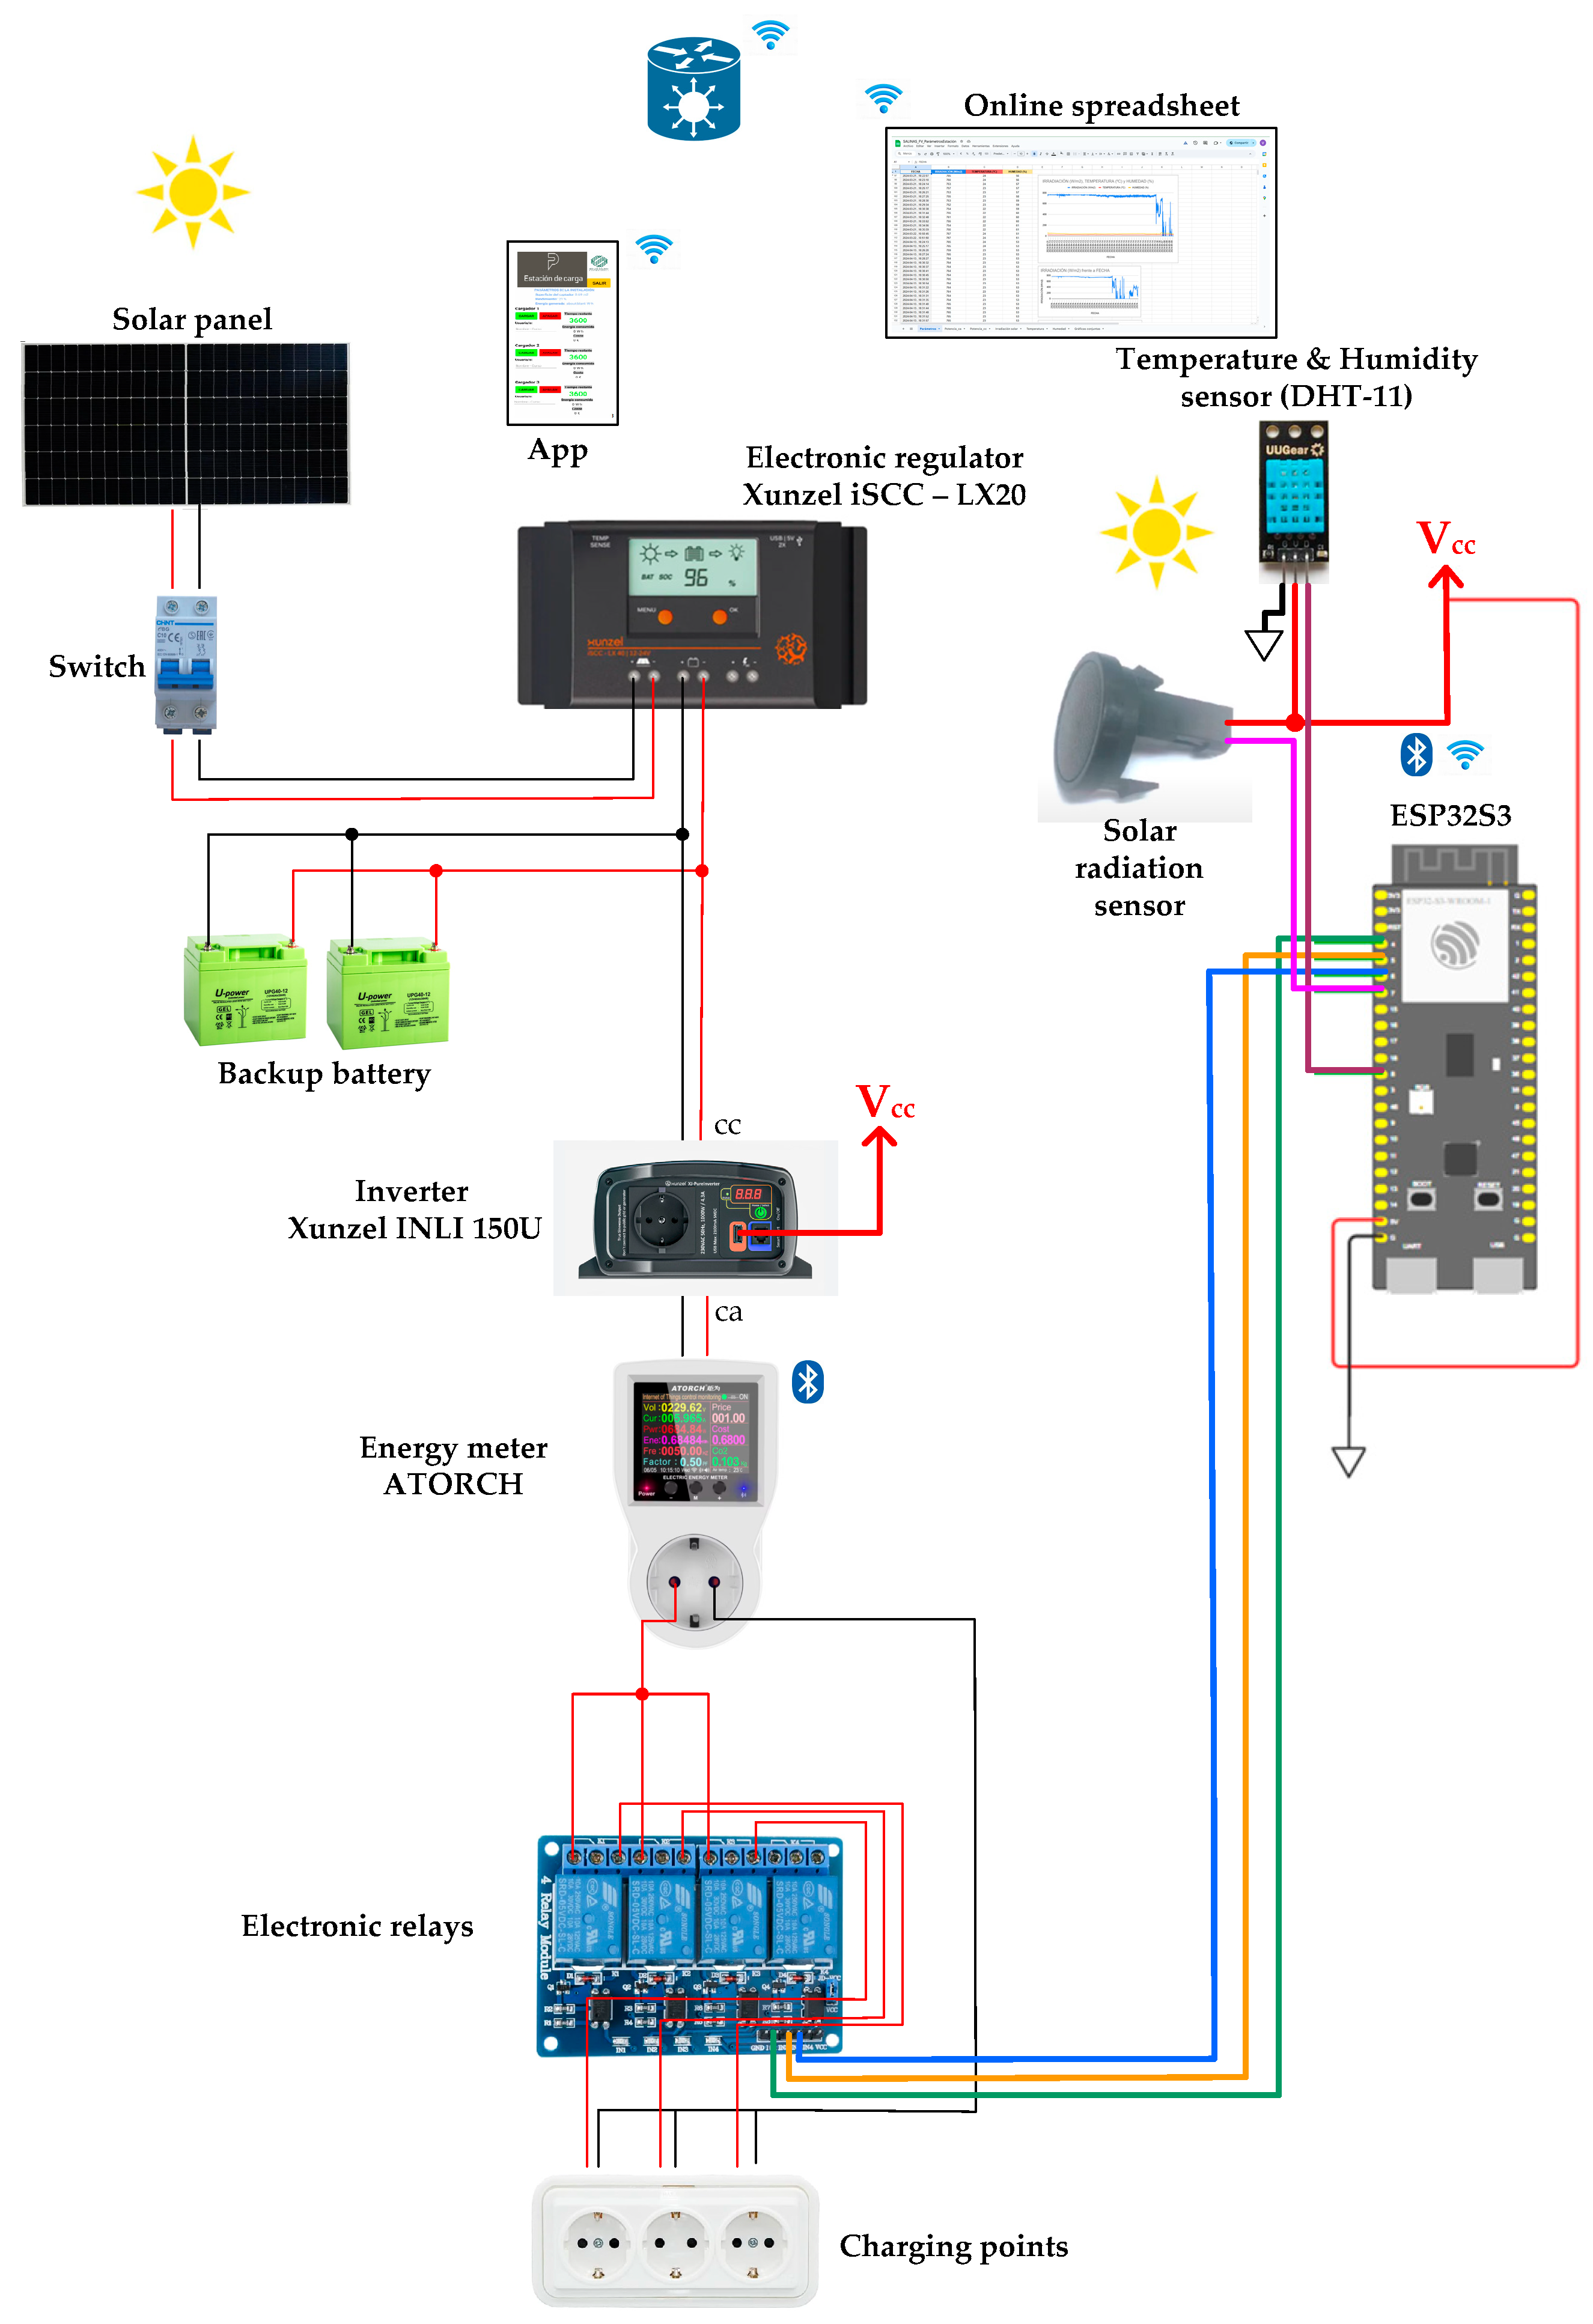
Figure 4.
Charging station design stages.
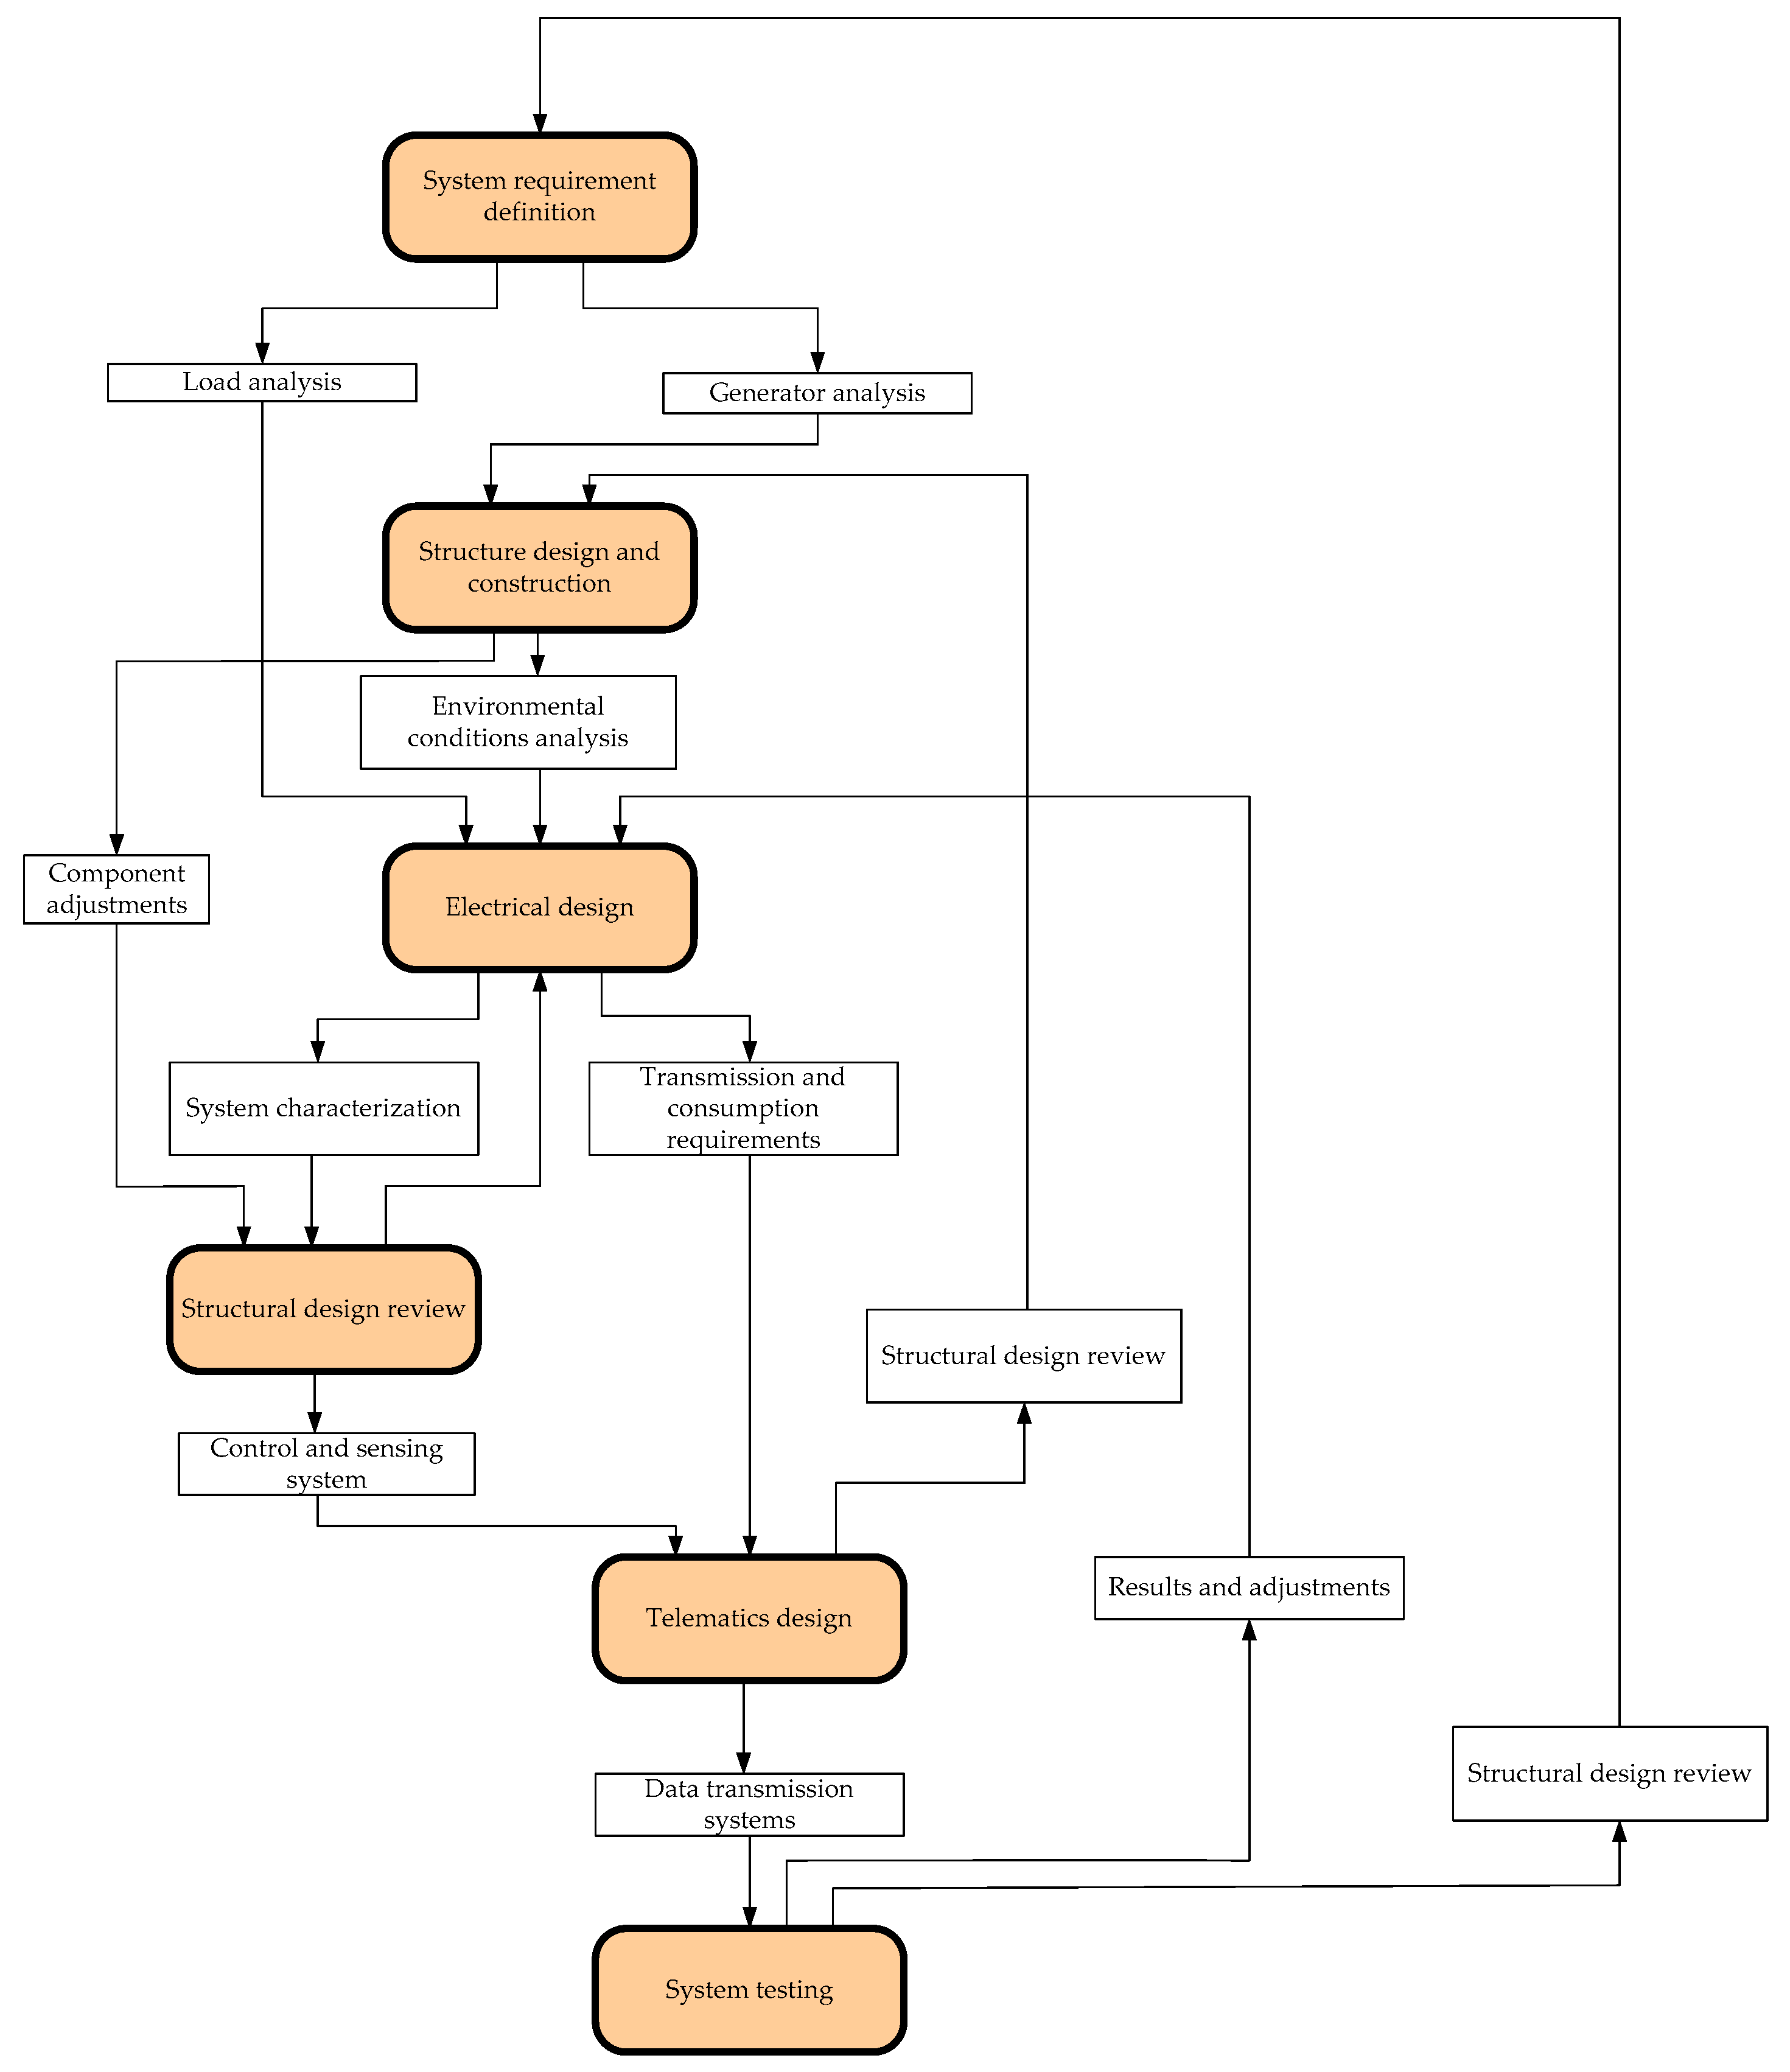
Figure 6.
Use of the charging station in outdoor classrooms.
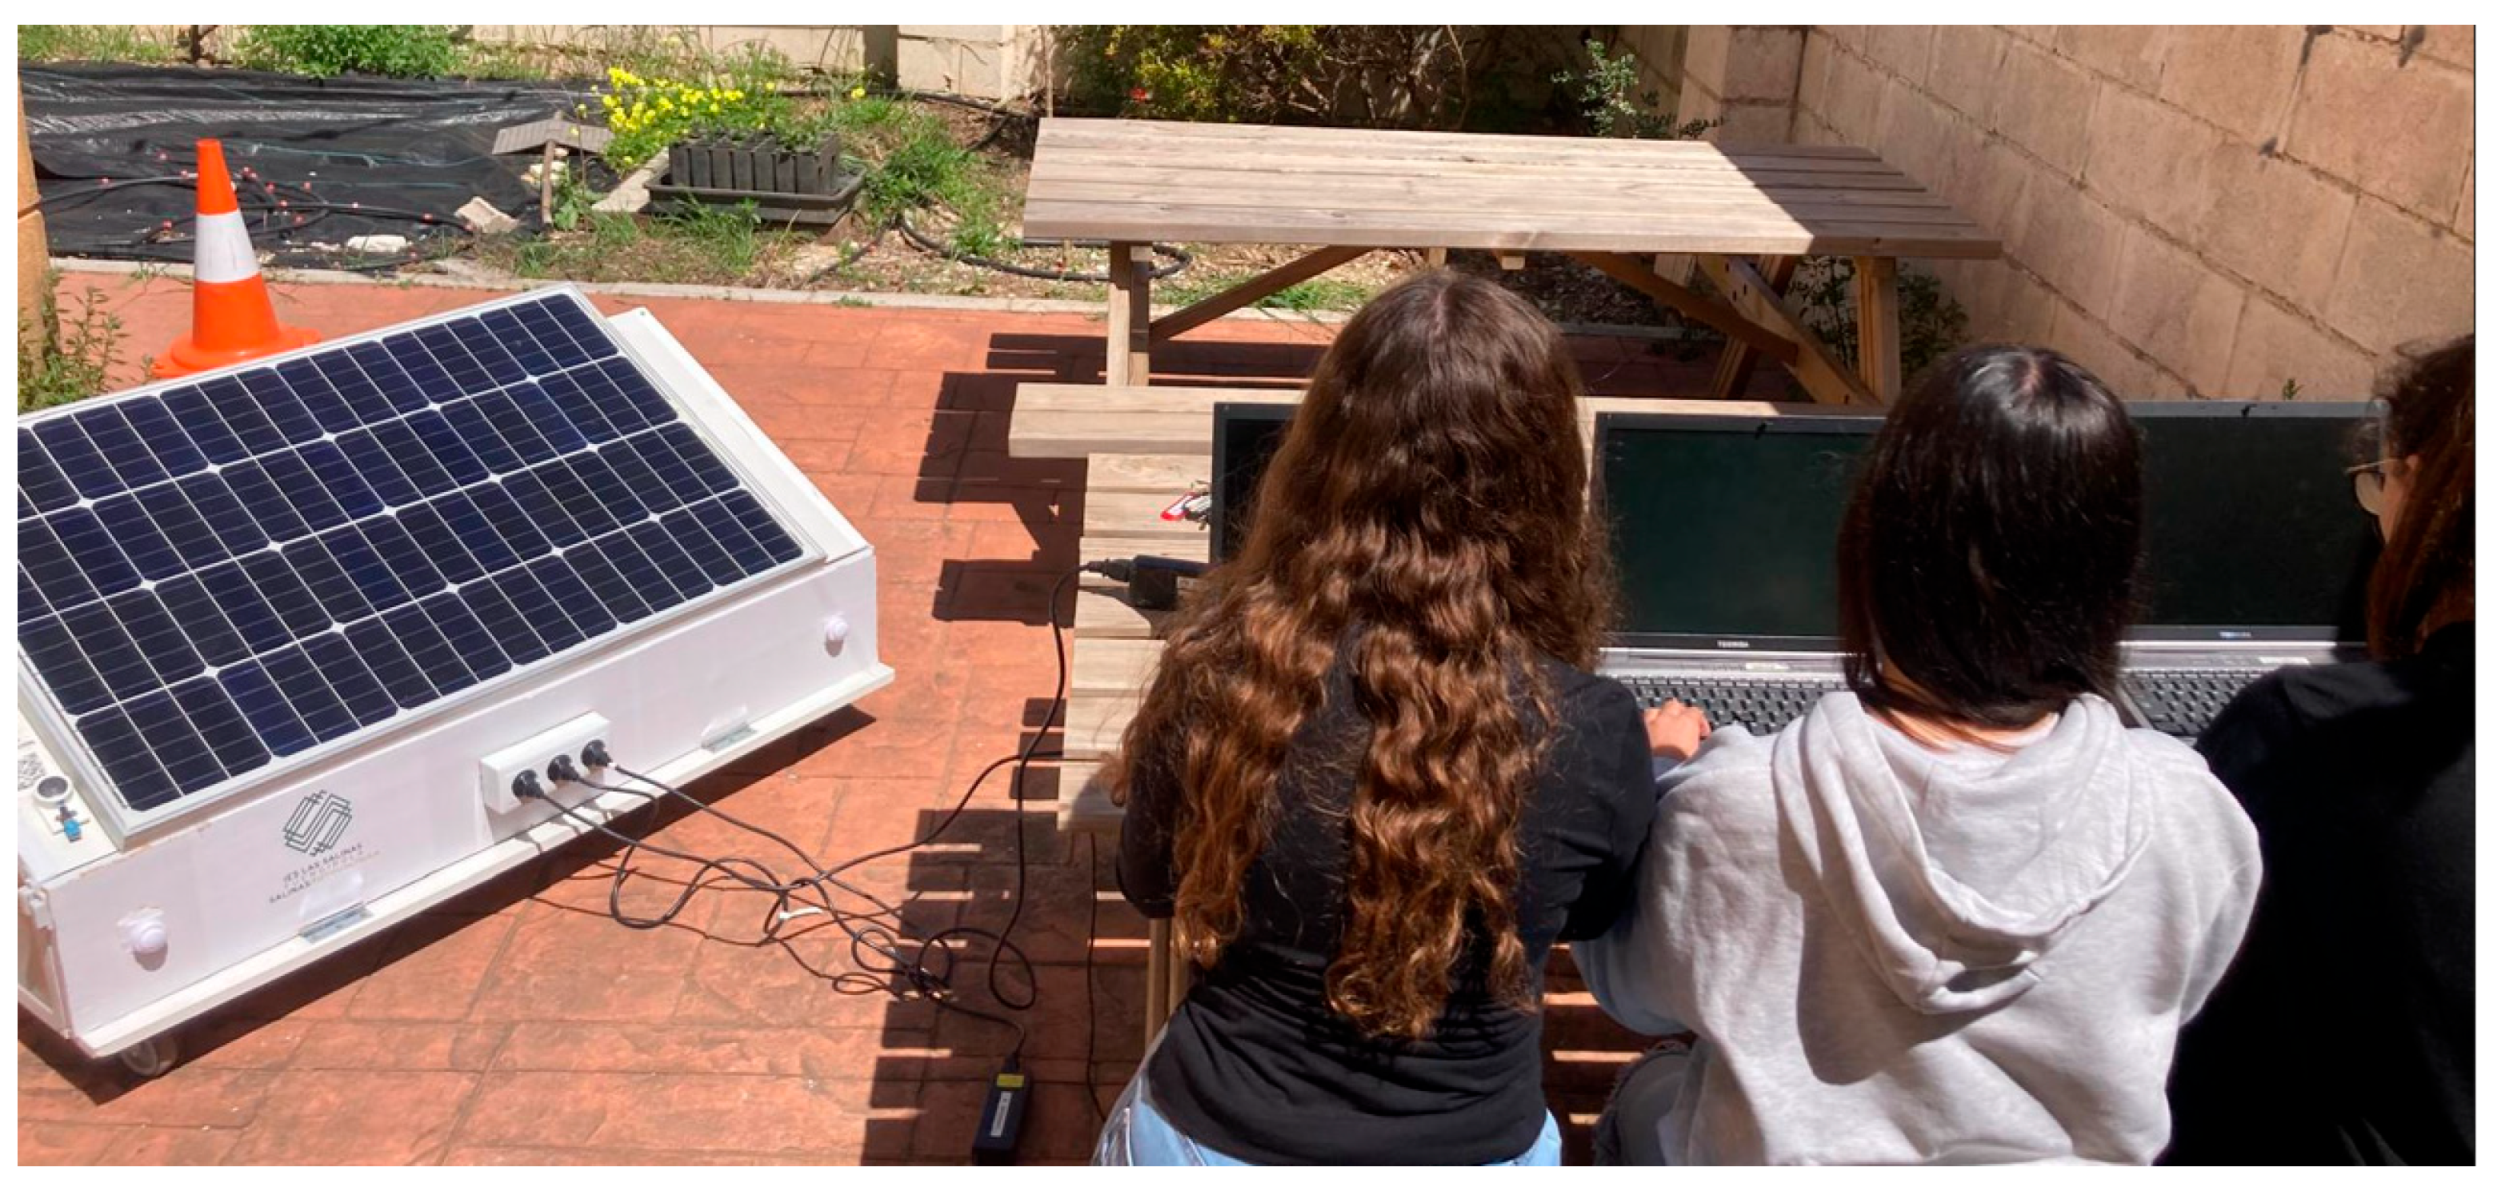
Figure 7.
Autonomy of the photovoltaic system and required SOC. Comparison of scenarios according to simulations.
Figure 7.
Autonomy of the photovoltaic system and required SOC. Comparison of scenarios according to simulations.
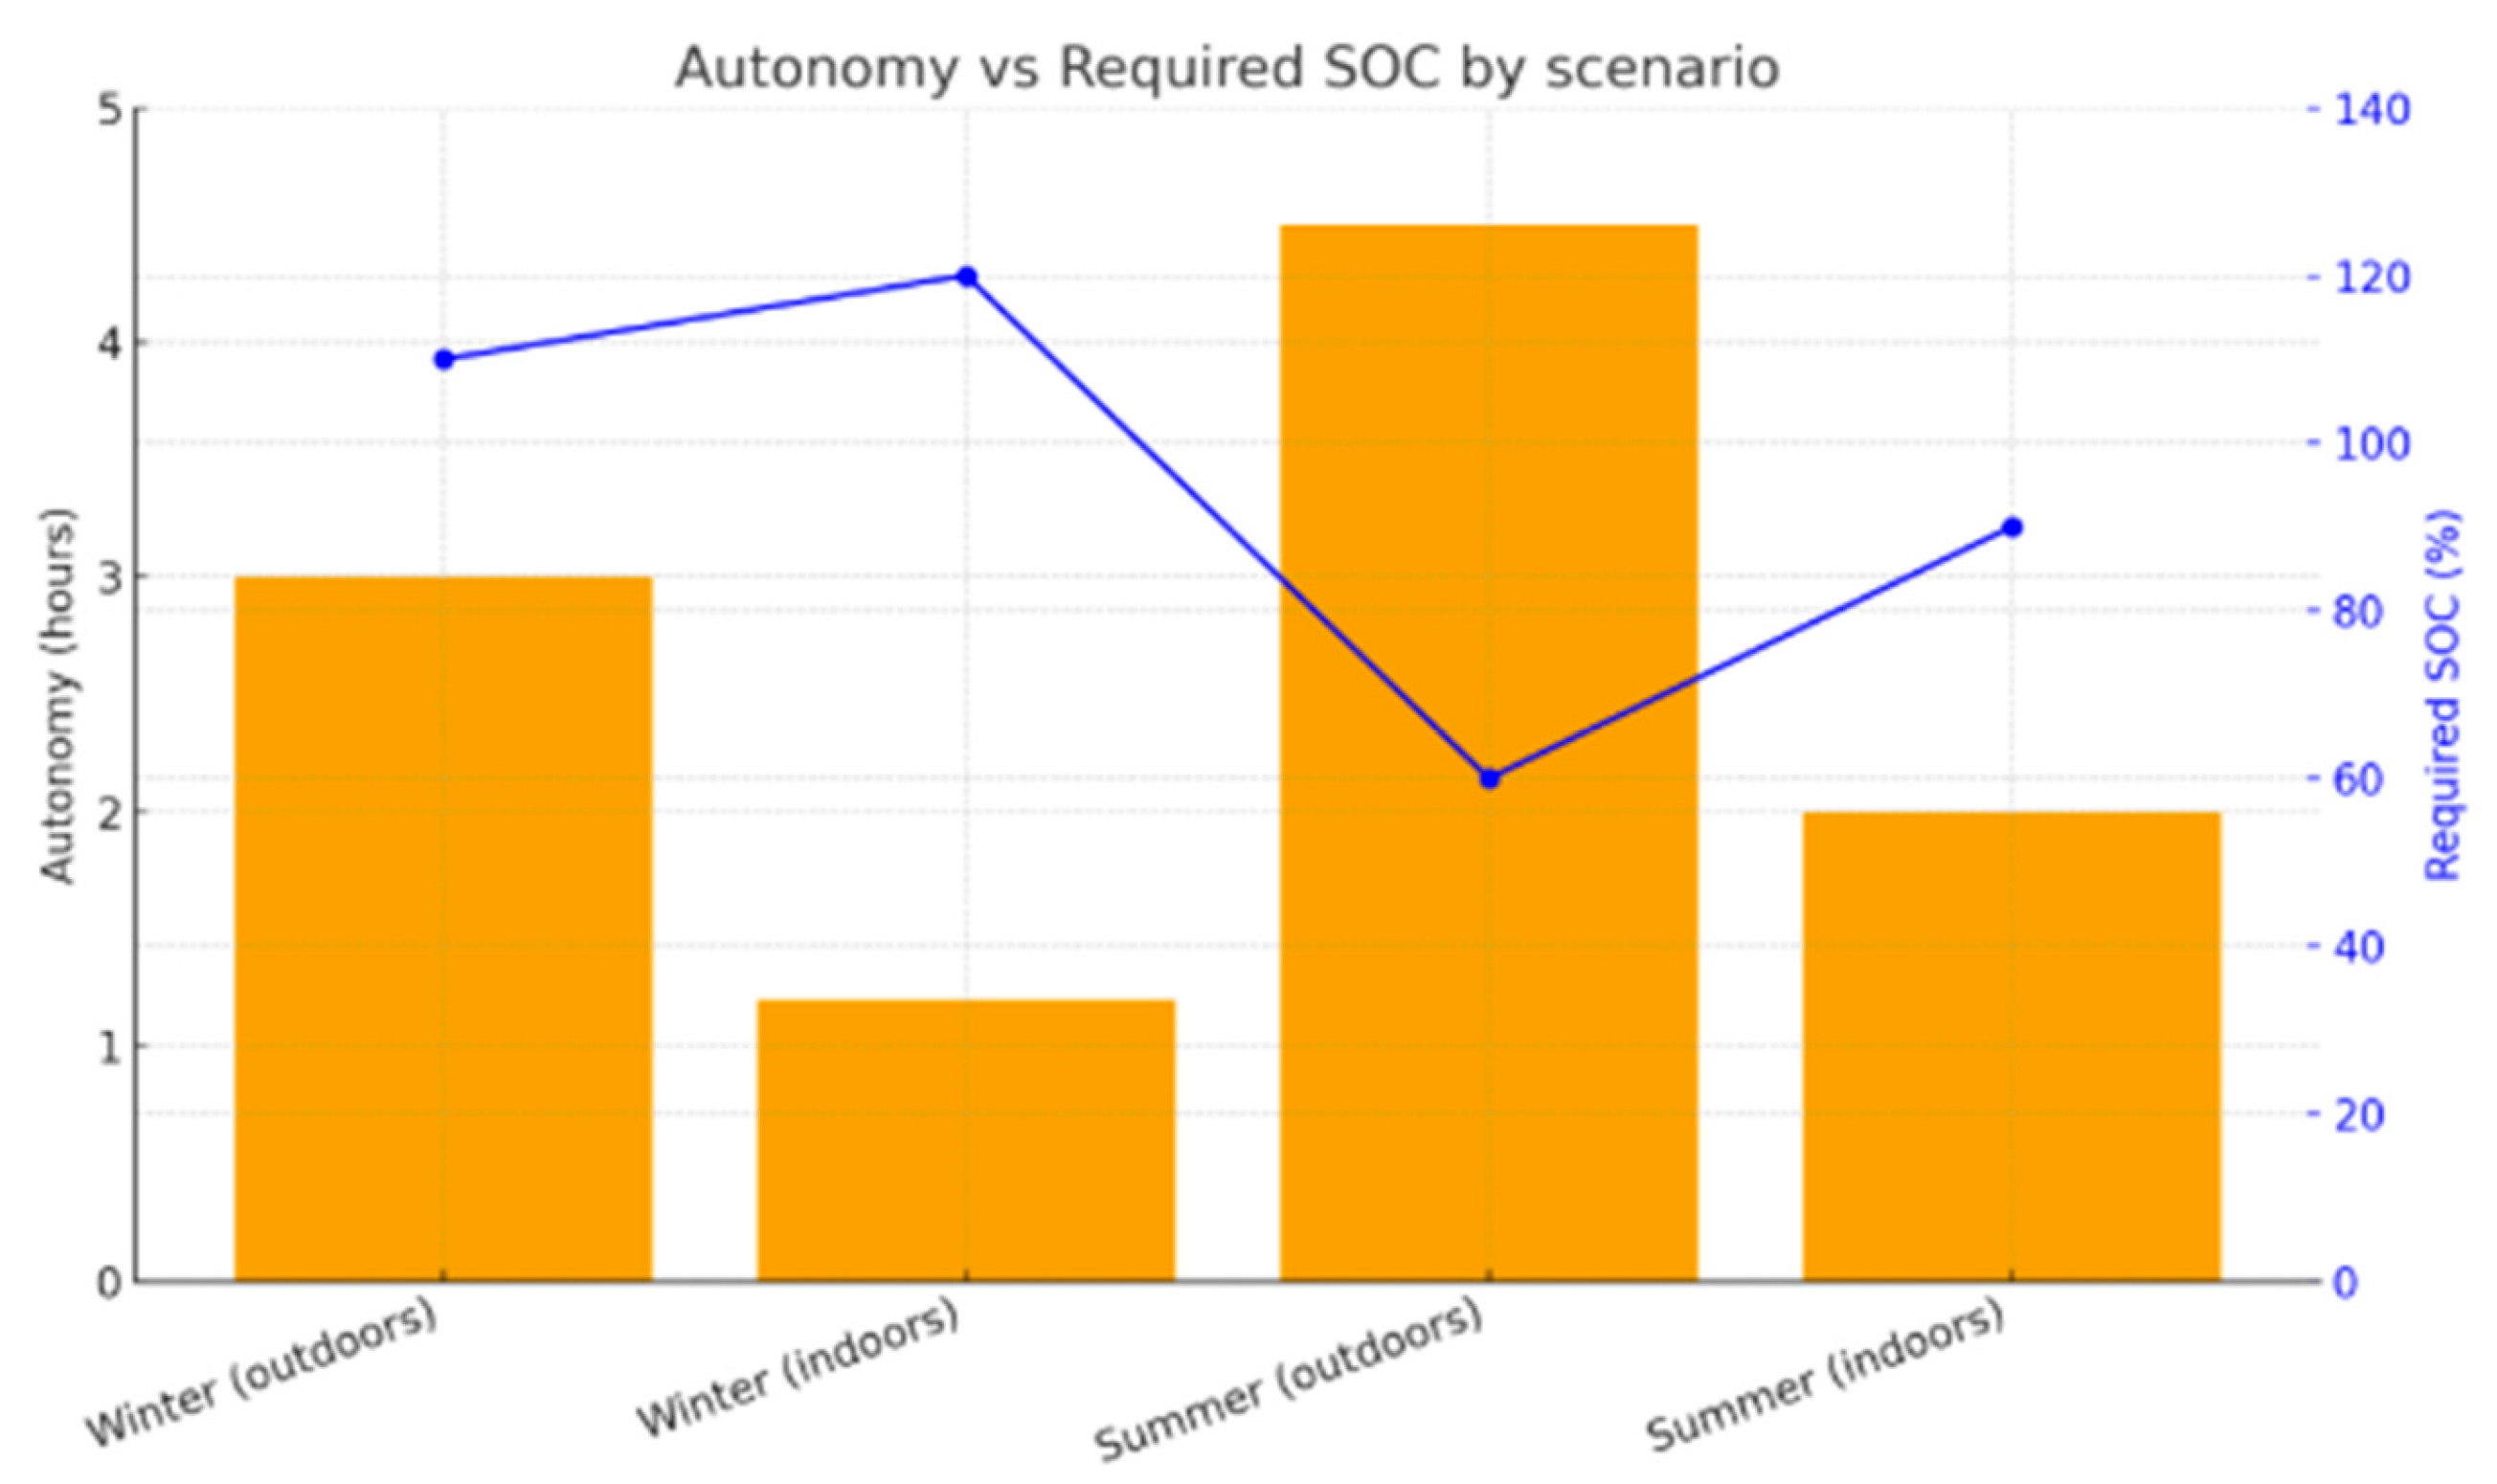
Figure 8.
Impact of seasonal conditions on the validation of system design assumptions.
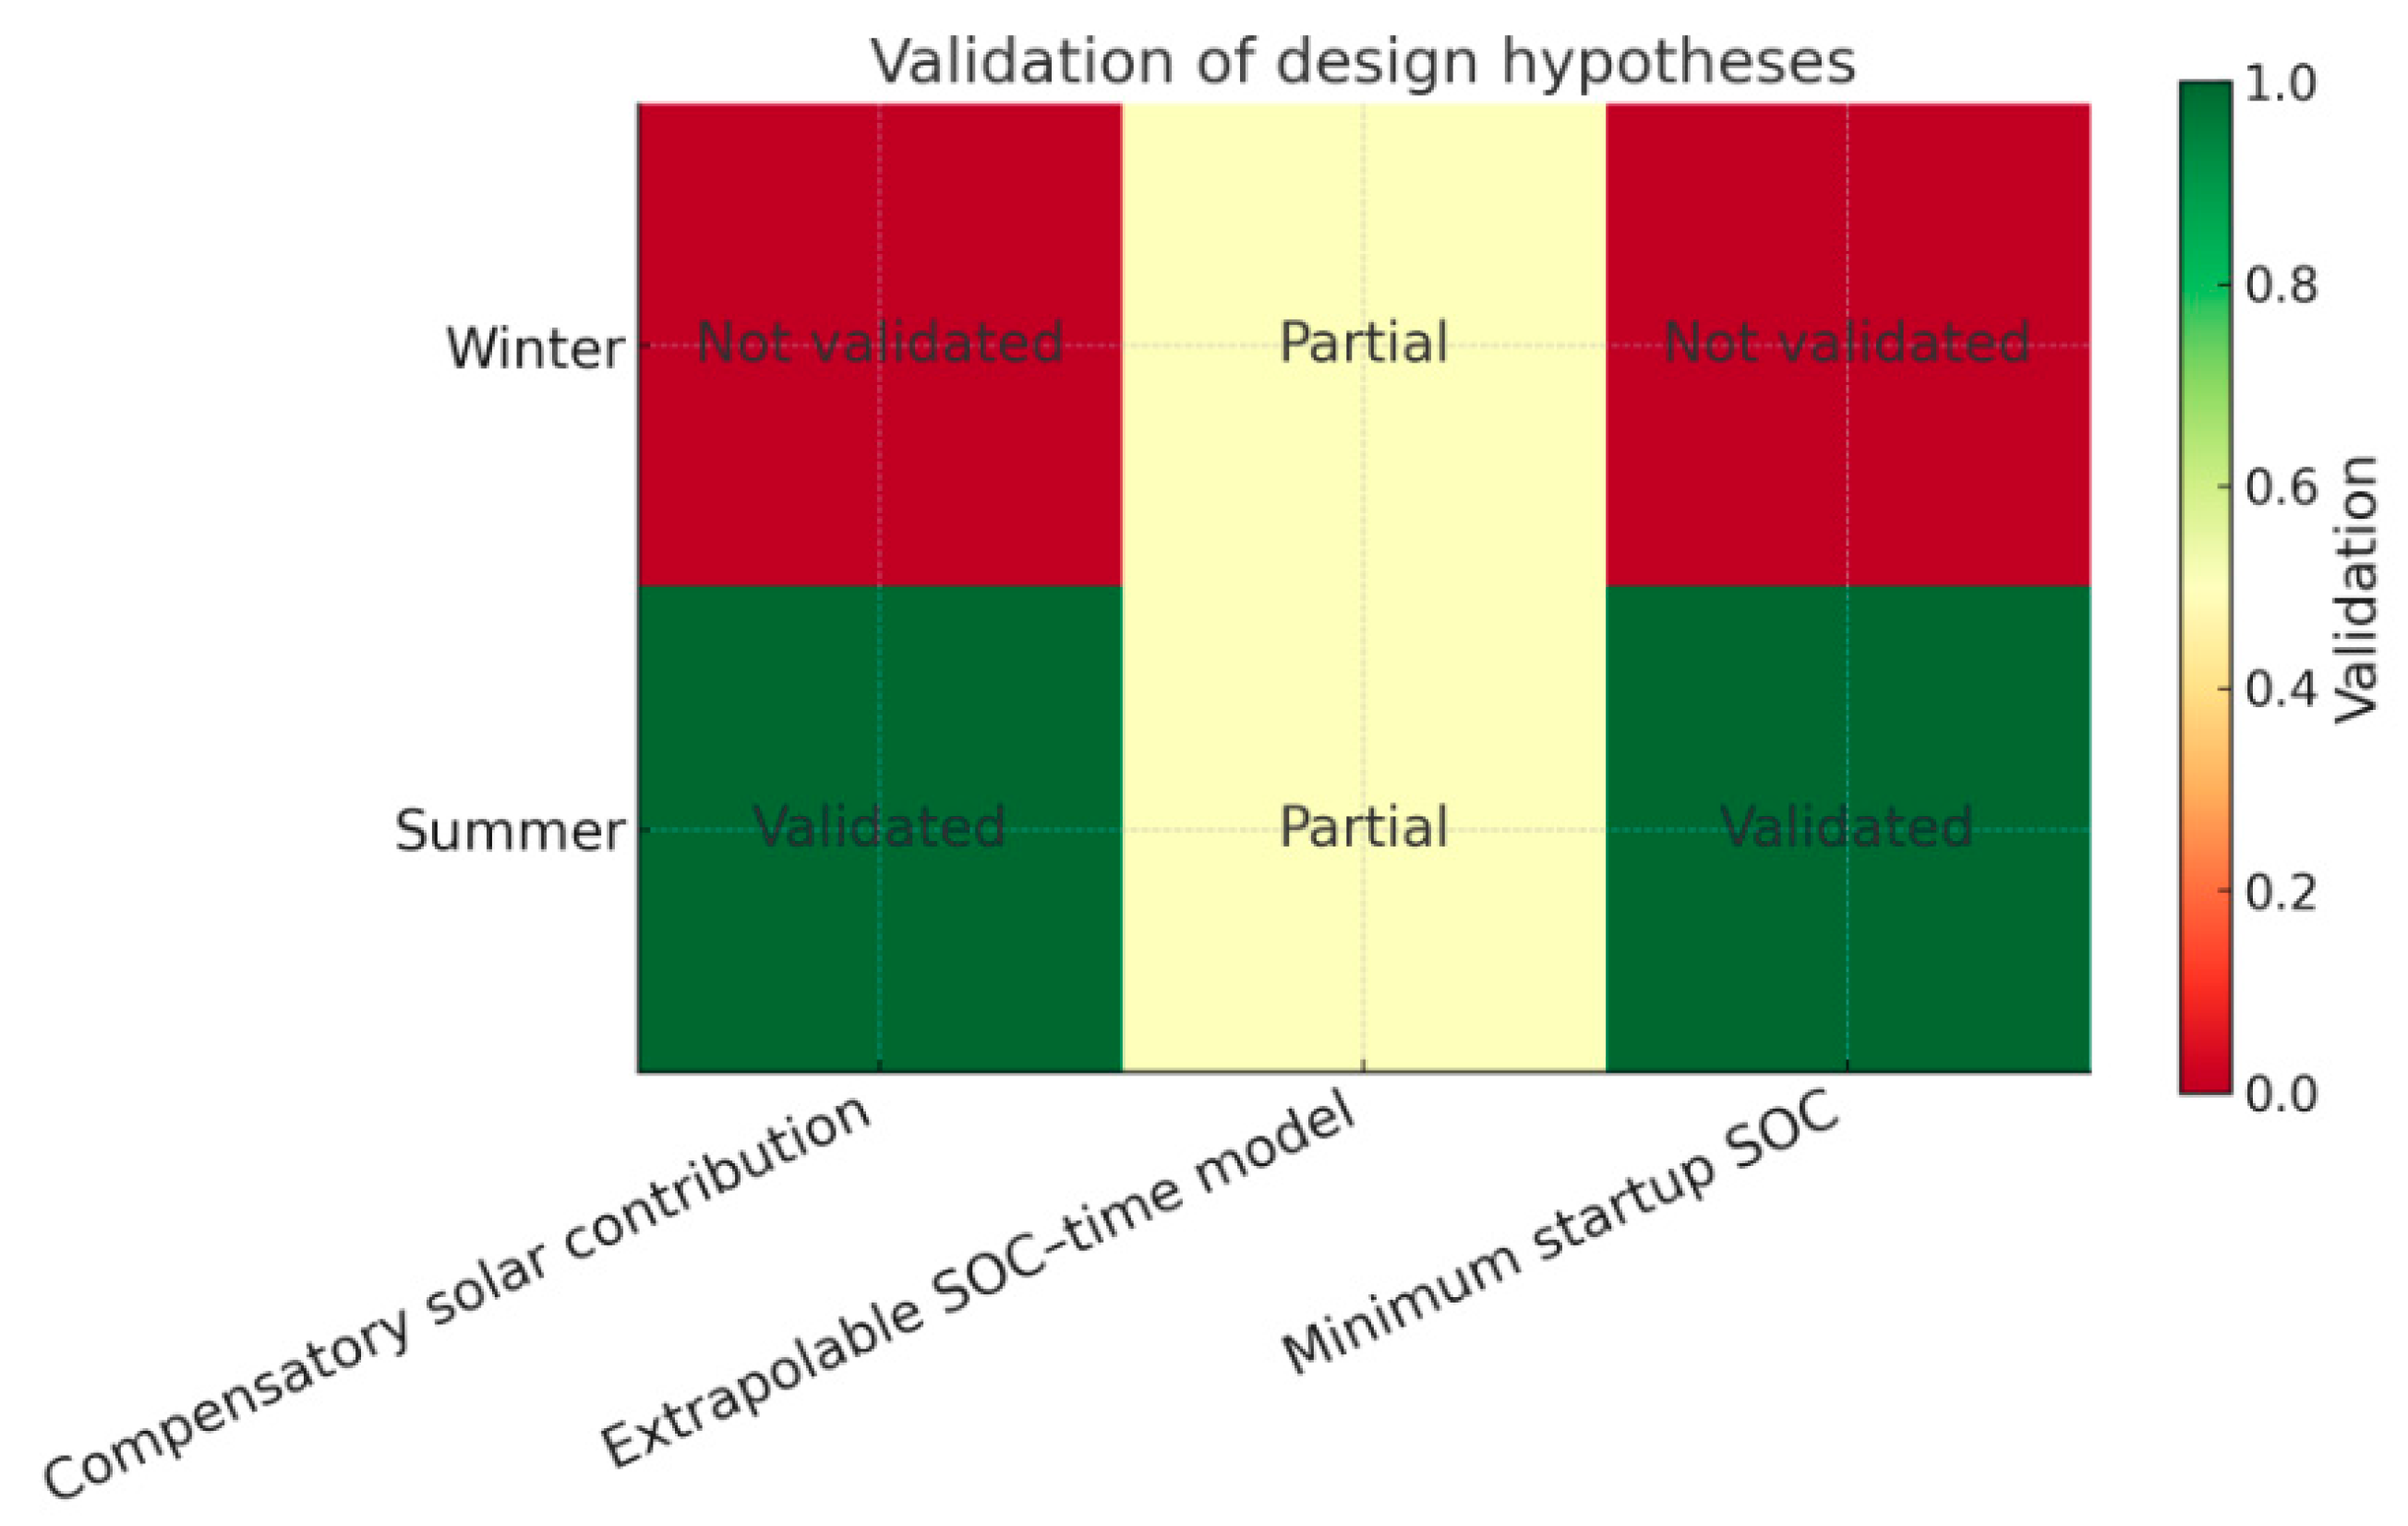
Table 1.
Electrical Parameters of the Photovoltaic Generator.
| Parameter | Value |
|---|---|
| Maximum Power (Pmax) | 120 W |
| Open-Circuit Voltage (Voc) | 23,80 V |
| Voltage at Maximum Power Point (Vpmáx) | 20,10 V |
| Shotcircuit current (Isc) | 6,36 A |
| Current at Maximum Power Point (Ipmáx) | 5,98 A |
Table 3.
Electrical Parameters of the Regulator.
| Parameter | Value |
|---|---|
| Nominal Voltage (VN) | 12 / 24V |
| Maximum Power (Pmax) | 360 Wp (12V) 720 Wp (24V) |
| Maximum Charging Current (ILmáx) | 20A |
| Pulse Shaping Technology | PWM |
Table 4.
Power Inverter Electrical Parameters.
| Parameter | Value |
|---|---|
| Nominal Power (PN) | 500 W |
| Maximum power (Pmax) | 1000 W |
| Waveform Type | Modified Sine Wave |
Table 5.
Solar radiation sensor parameters.
| Parameter | Values |
|---|---|
| Lighting Source | Tª = 2856 K, 767.4 W/m² or 17,359 LUX. |
| Measurement Range | 0–2000 W/m². |
| Response Time | < 10 secs. |
| Electrical Output | Analog signal (tipically 0-2.5 V or 4-20 mA, depending on the model). |
Table 6.
Humidity sensor parameters.
| Parameter | Range | Accuracy | Resolution |
|---|---|---|---|
| Relative humidity | 20%–90% | ±5% | 1% |
| Temperature | 0 °C–50 °C | ±2 °C | 1 °C |
Table 7.
Atorch energy meter parameters.
| Parameter | Values |
|---|---|
| Input voltage | 85Vac– 265Vac. |
| Maximum current | 16A |
| Maximum power | 3680W |
| Standards | GB/T12116-2012 and GB/T6587-2012 |
Disclaimer/Publisher’s Note: The statements, opinions and data contained in all publications are solely those of the individual author(s) and contributor(s) and not of MDPI and/or the editor(s). MDPI and/or the editor(s) disclaim responsibility for any injury to people or property resulting from any ideas, methods, instructions or products referred to in the content. |
© 2026 by the authors. Licensee MDPI, Basel, Switzerland. This article is an open access article distributed under the terms and conditions of the Creative Commons Attribution (CC BY) license.
Copyright: This open access article is published under a Creative Commons CC BY 4.0 license, which permit the free download, distribution, and reuse, provided that the author and preprint are cited in any reuse.


