Submitted:
14 January 2026
Posted:
15 January 2026
Read the latest preprint version here
Abstract
Bacterial panicle blight (BPB) of rice, a disease caused by Burkholderia glumae and B. gladioli, threatens global rice yields and has recently emerged in Bangladesh. We analyzed 300 BPB-infected samples from 20 Bangladesh districts using S-PG medium and gyrB PCR amplification, identifying 46 B. gladioli and 5 B. glumae isolates. Twenty of these isolates were chosen for in-depth characterization. Pathogenicity tests identified B. glumae BD_21g as the most virulent strain, followed by B. gladioli BDBgla132A. Disease severity on rice strongly correlated with onion bulb assays, validating the assay as a rapid virulence-screening tool. Phenotypic characterization of the 20 isolates revealed substantial variation in toxoflavin production, lipase activity, polygalacturonase activity, motility, and type III secretion system. Comparative genomic analysis of virulence-associated genes between BDBgla132A and BD_21g showed high protein sequence identity, particularly in toxoflavin biosynthesis and transport genes, while genes encoding lipase (lipA/lipB), polygalacturonase (pehA/pehB), and those involved in motility, displayed moderate to high identity. Both strains retained virulence-related genes that are homologous to those of B. cepacia but displayed distinct pathogenic mechanisms. Real time RT-qPCR revealed significantly higher expression of toxoflavin and lipase-encoding genes in BD_21g compared with BDBgla132A, consistent with its elevated enzymatic activities. Conversely, BD_21g showed reduced expression of pectinolytic and flagellar genes over BDBgla132A, consistent with the enhanced pectinolytic activity and motility observed in BDBgla132A. These findings reveal that B. glumae BD_21g and B. gladioli BDBgla132A employ distinct virulence strategies to infect rice, providing critical insights for developing targeted BPB management approaches in Bangladesh.
Keywords:
1. Introduction
2. Materials and Methods
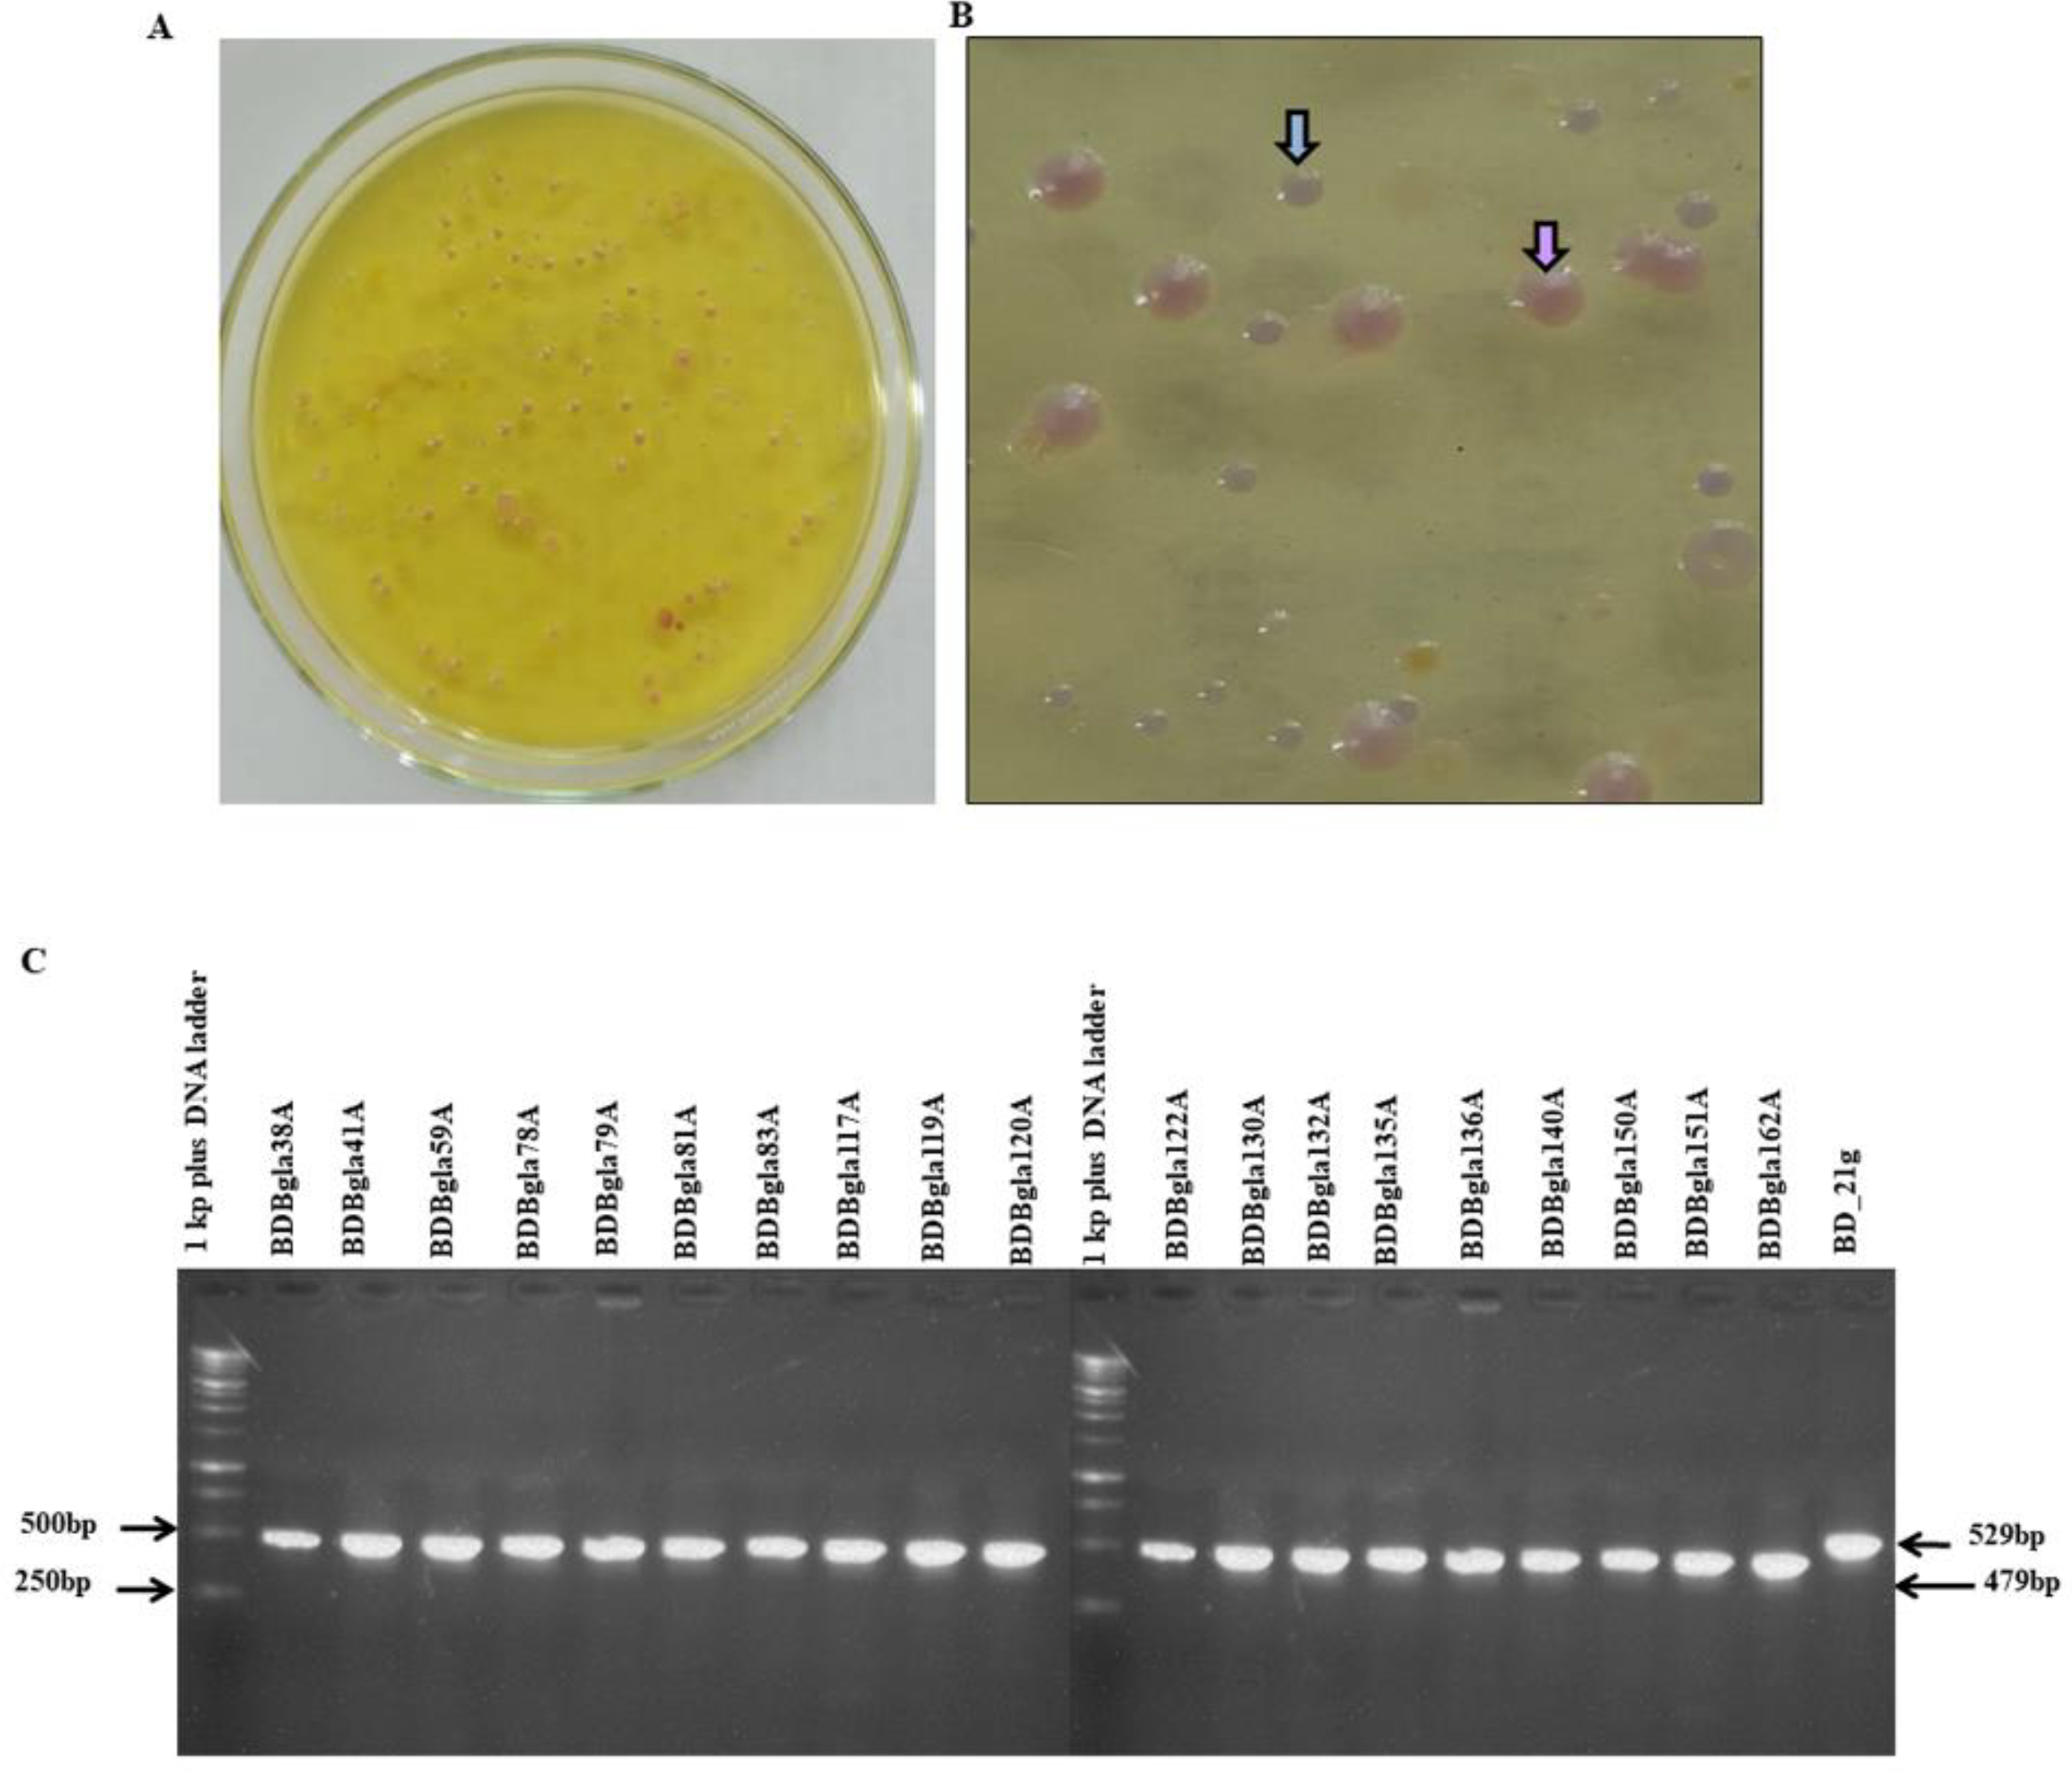
2.1. Sample Collection, Isolation and Molecular Identification of Burkholderia Strains
2.2. Pathogenicity Tests
2.3. Onion Assay for Pathogenicity Testing
2.4. Hypersensitive Response (HR) Assay
2.5. Determination of Toxoflavin Production and Quantitative Analysis
2.6. Assessment and Quantitative Evaluation of Lipase Activity
2.7. Qualitative and Quantitative Analysis of Polygalacturonase Activity
2.8. Bacterial Swarming Motility Assay
2.9. Transcript Level Determination
2.10. Genomic and Evolutionary Analysis of Gene Sequences
3. Results
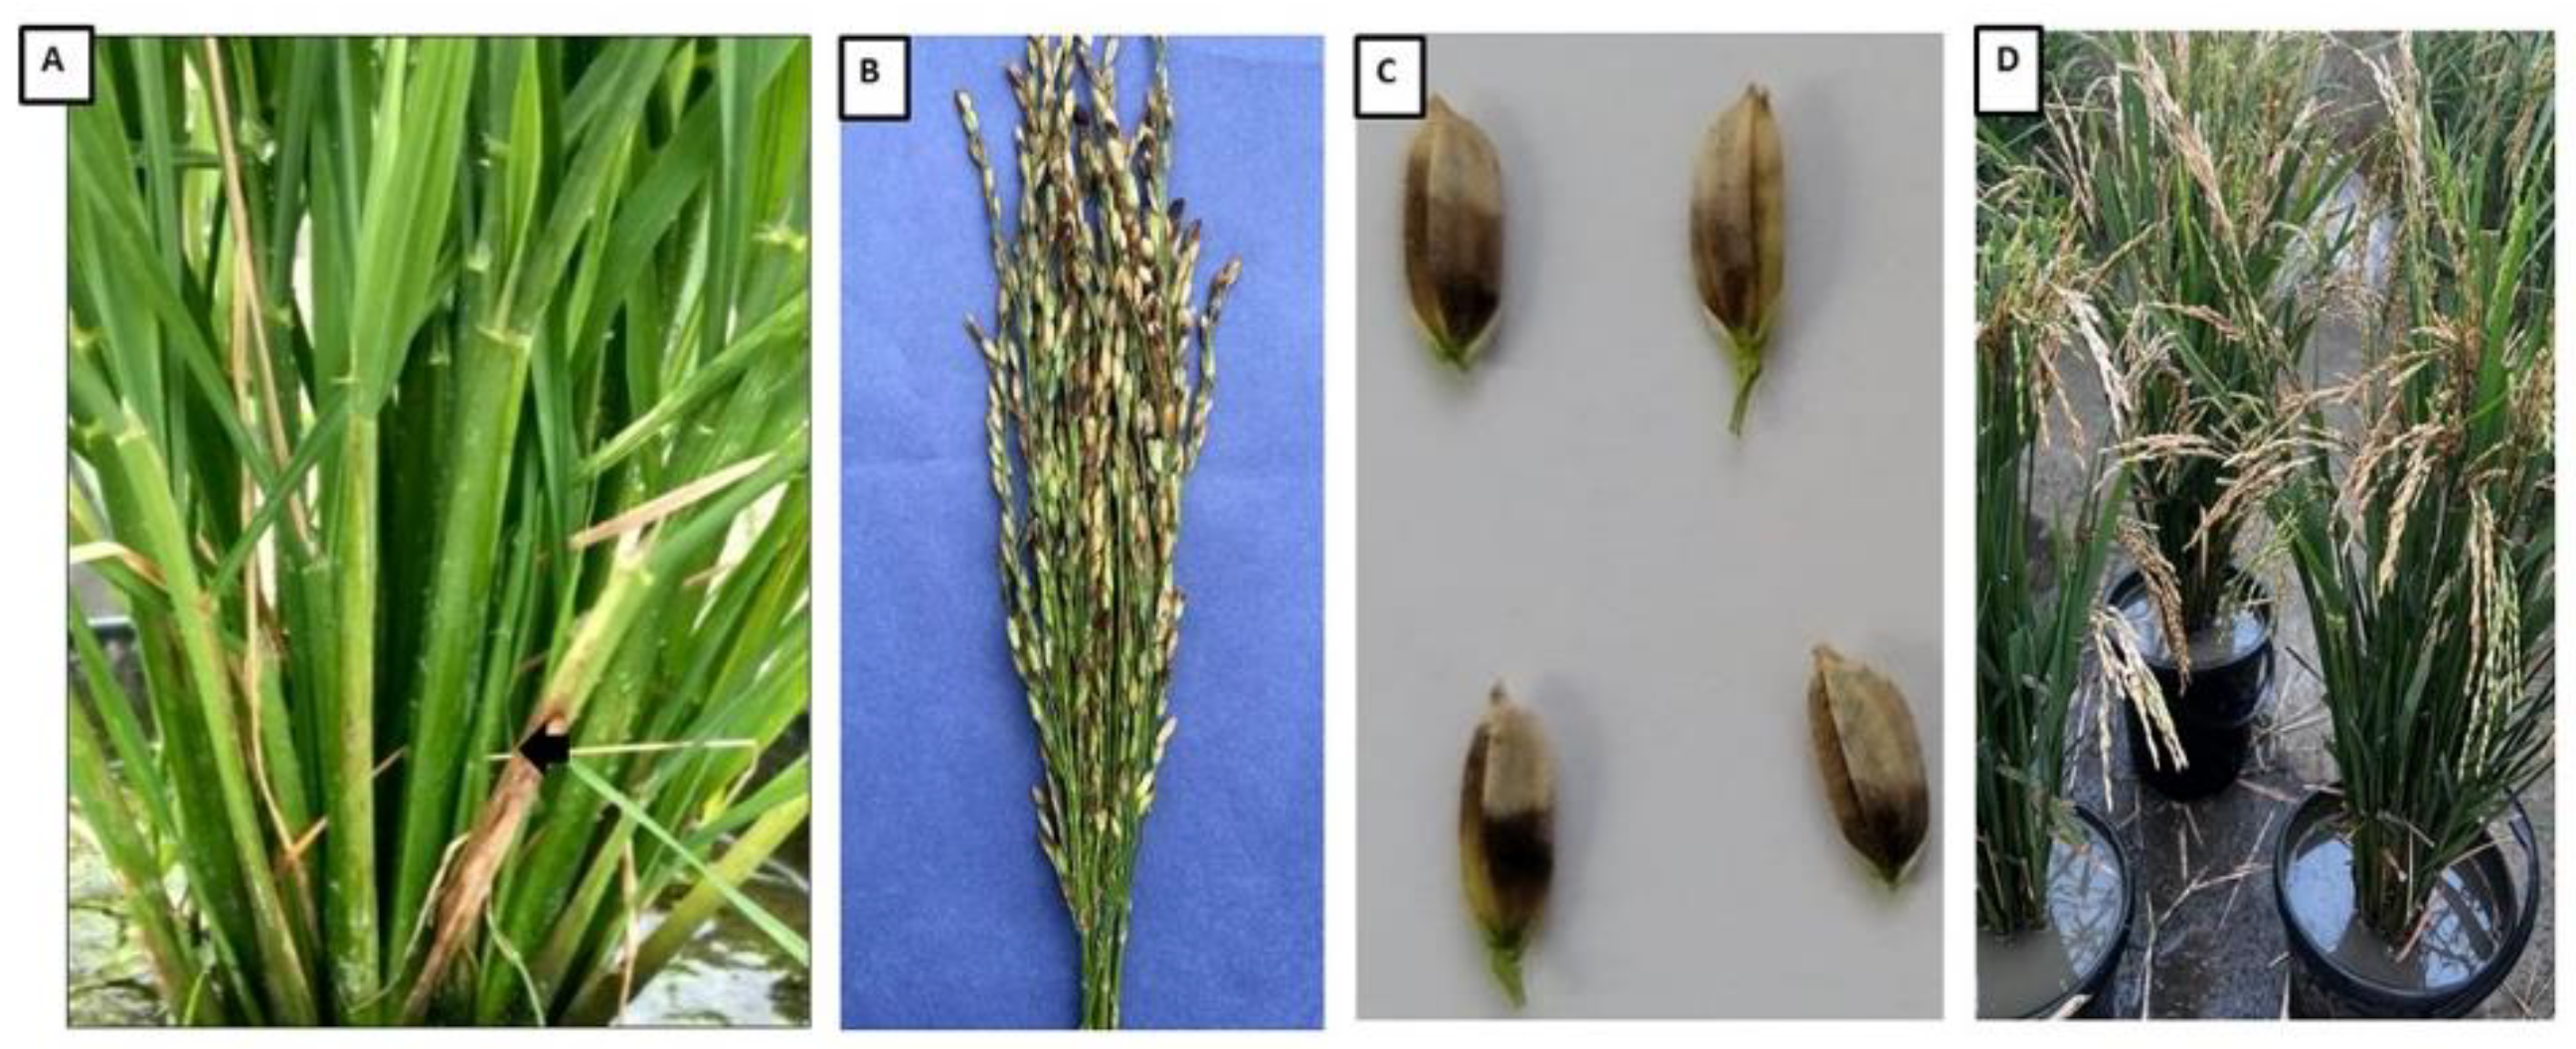
3.1. Isolation and Molecular Identification of Burkholderia Strains from Rice Panicles
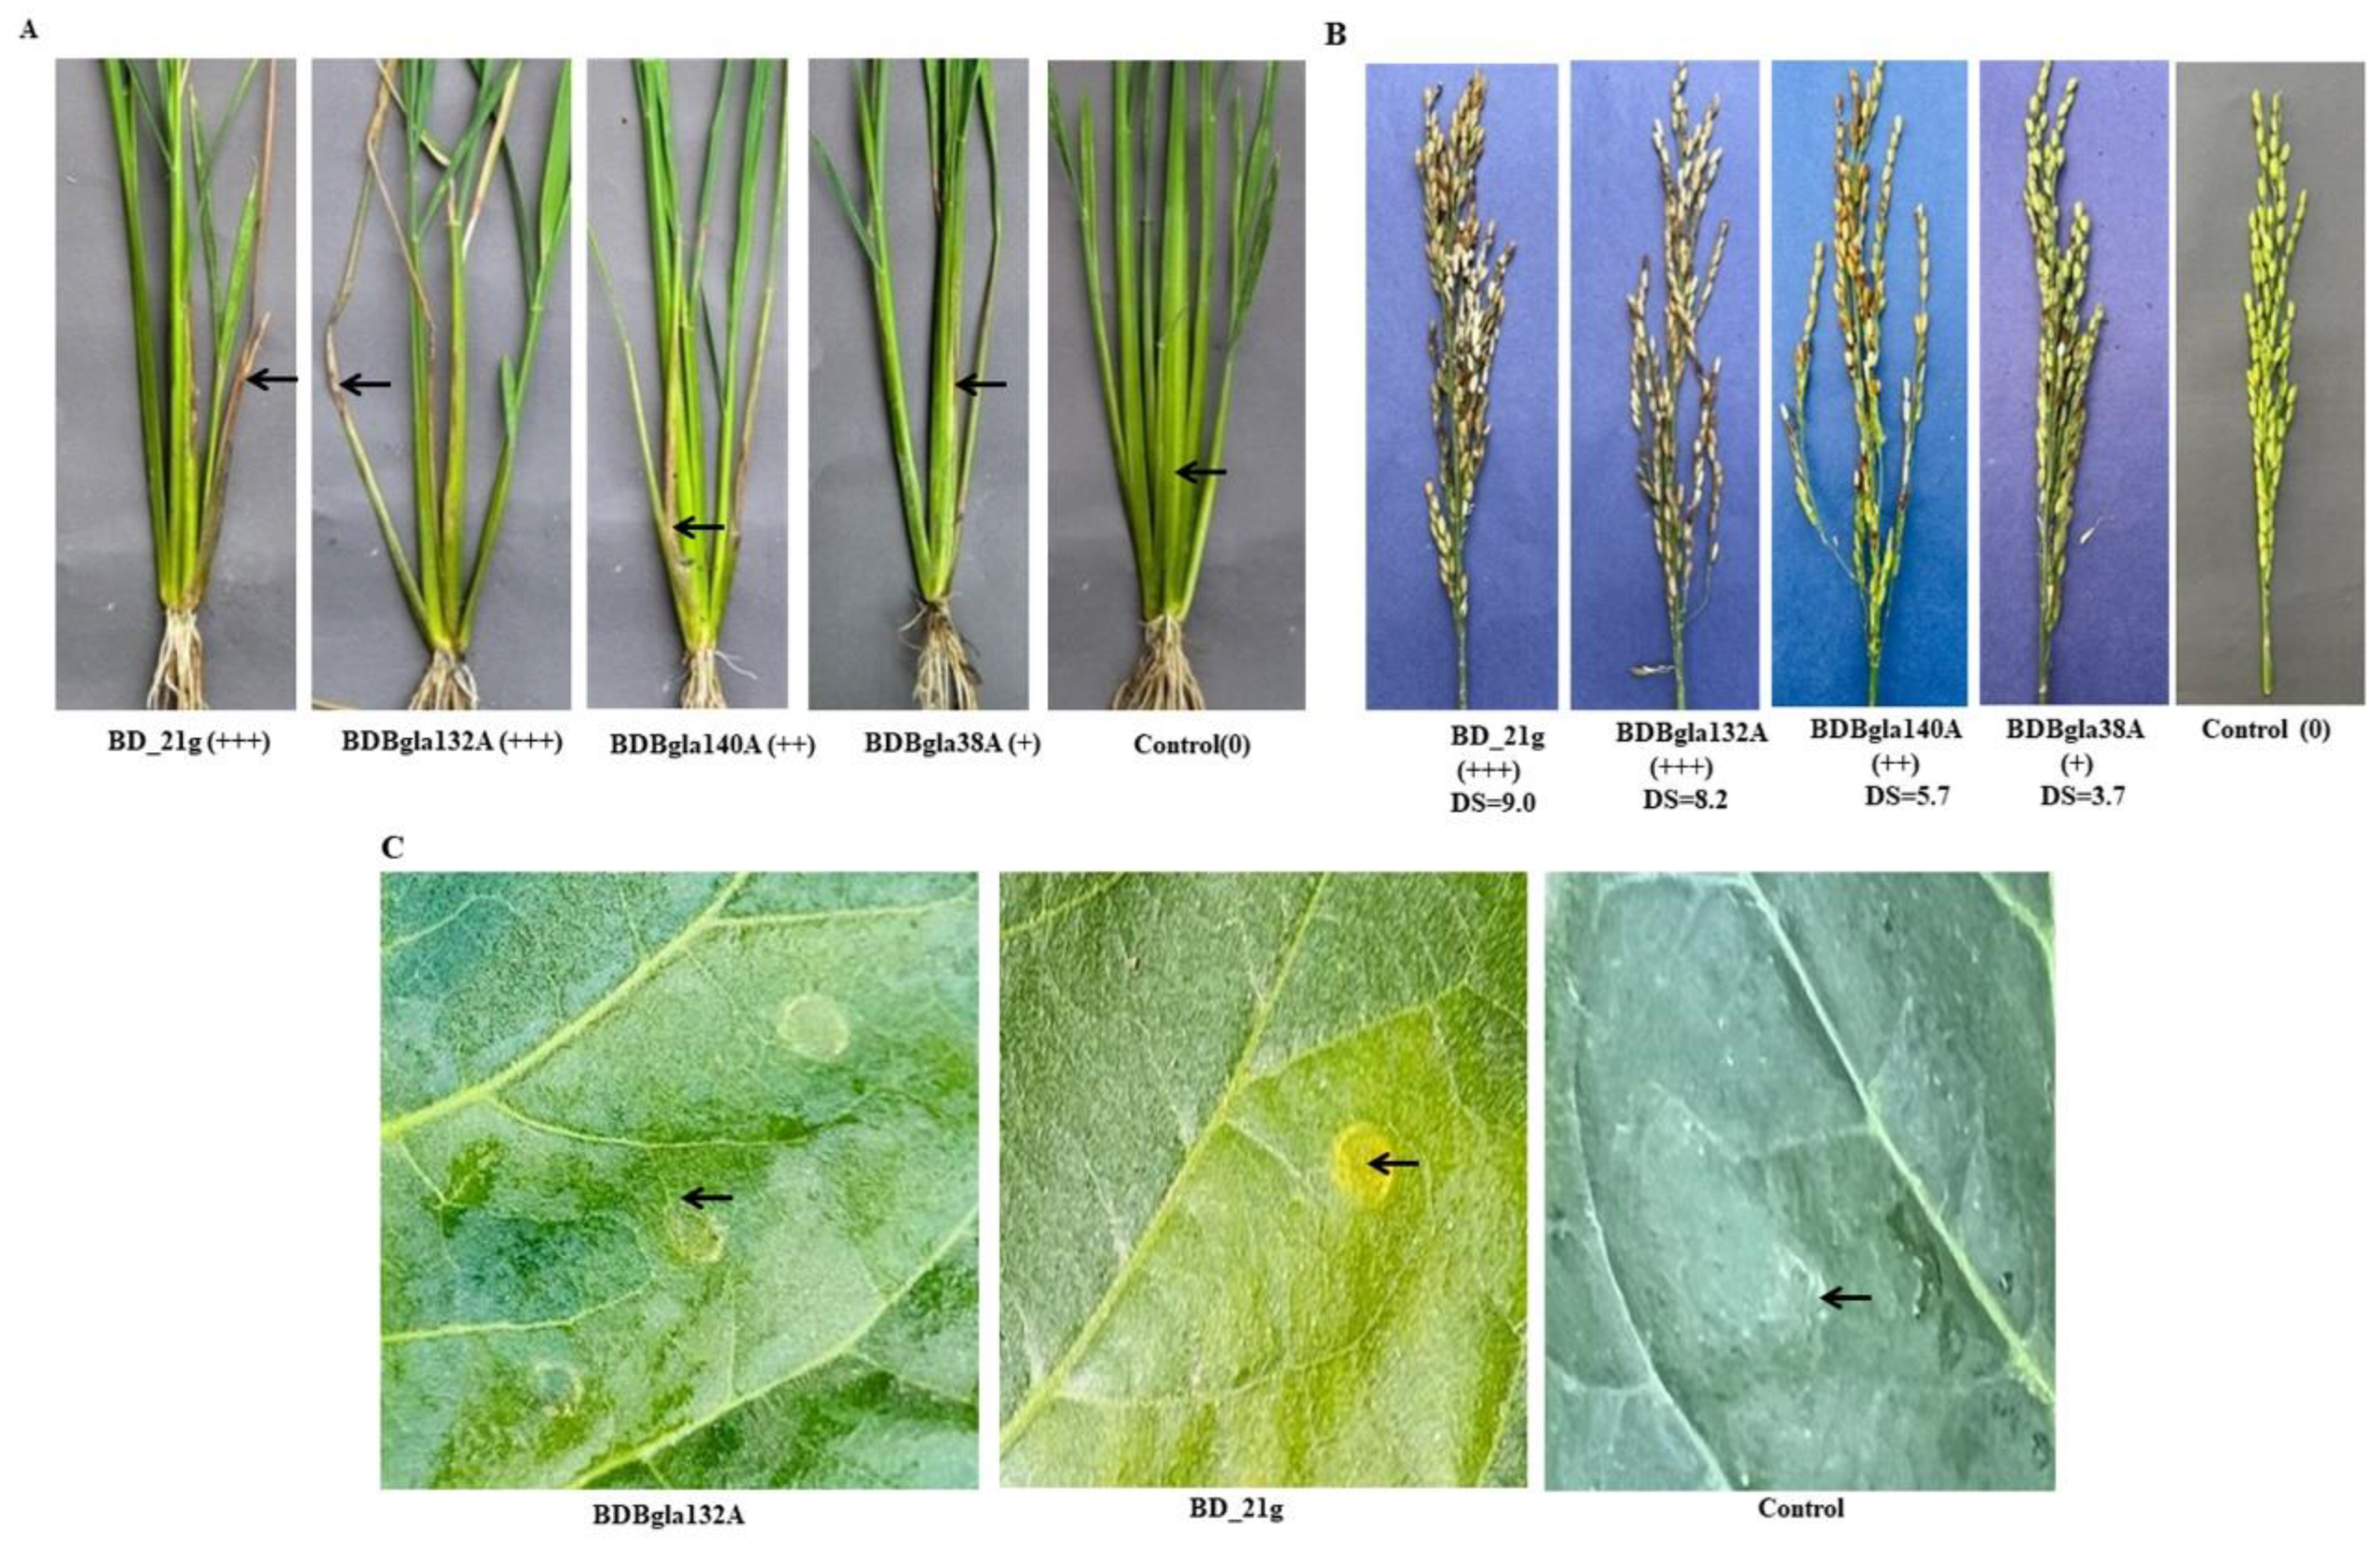
3.2. Pathogenicity Assessment on Rice Plants
3.3. Hypersensitive Response Elicitation
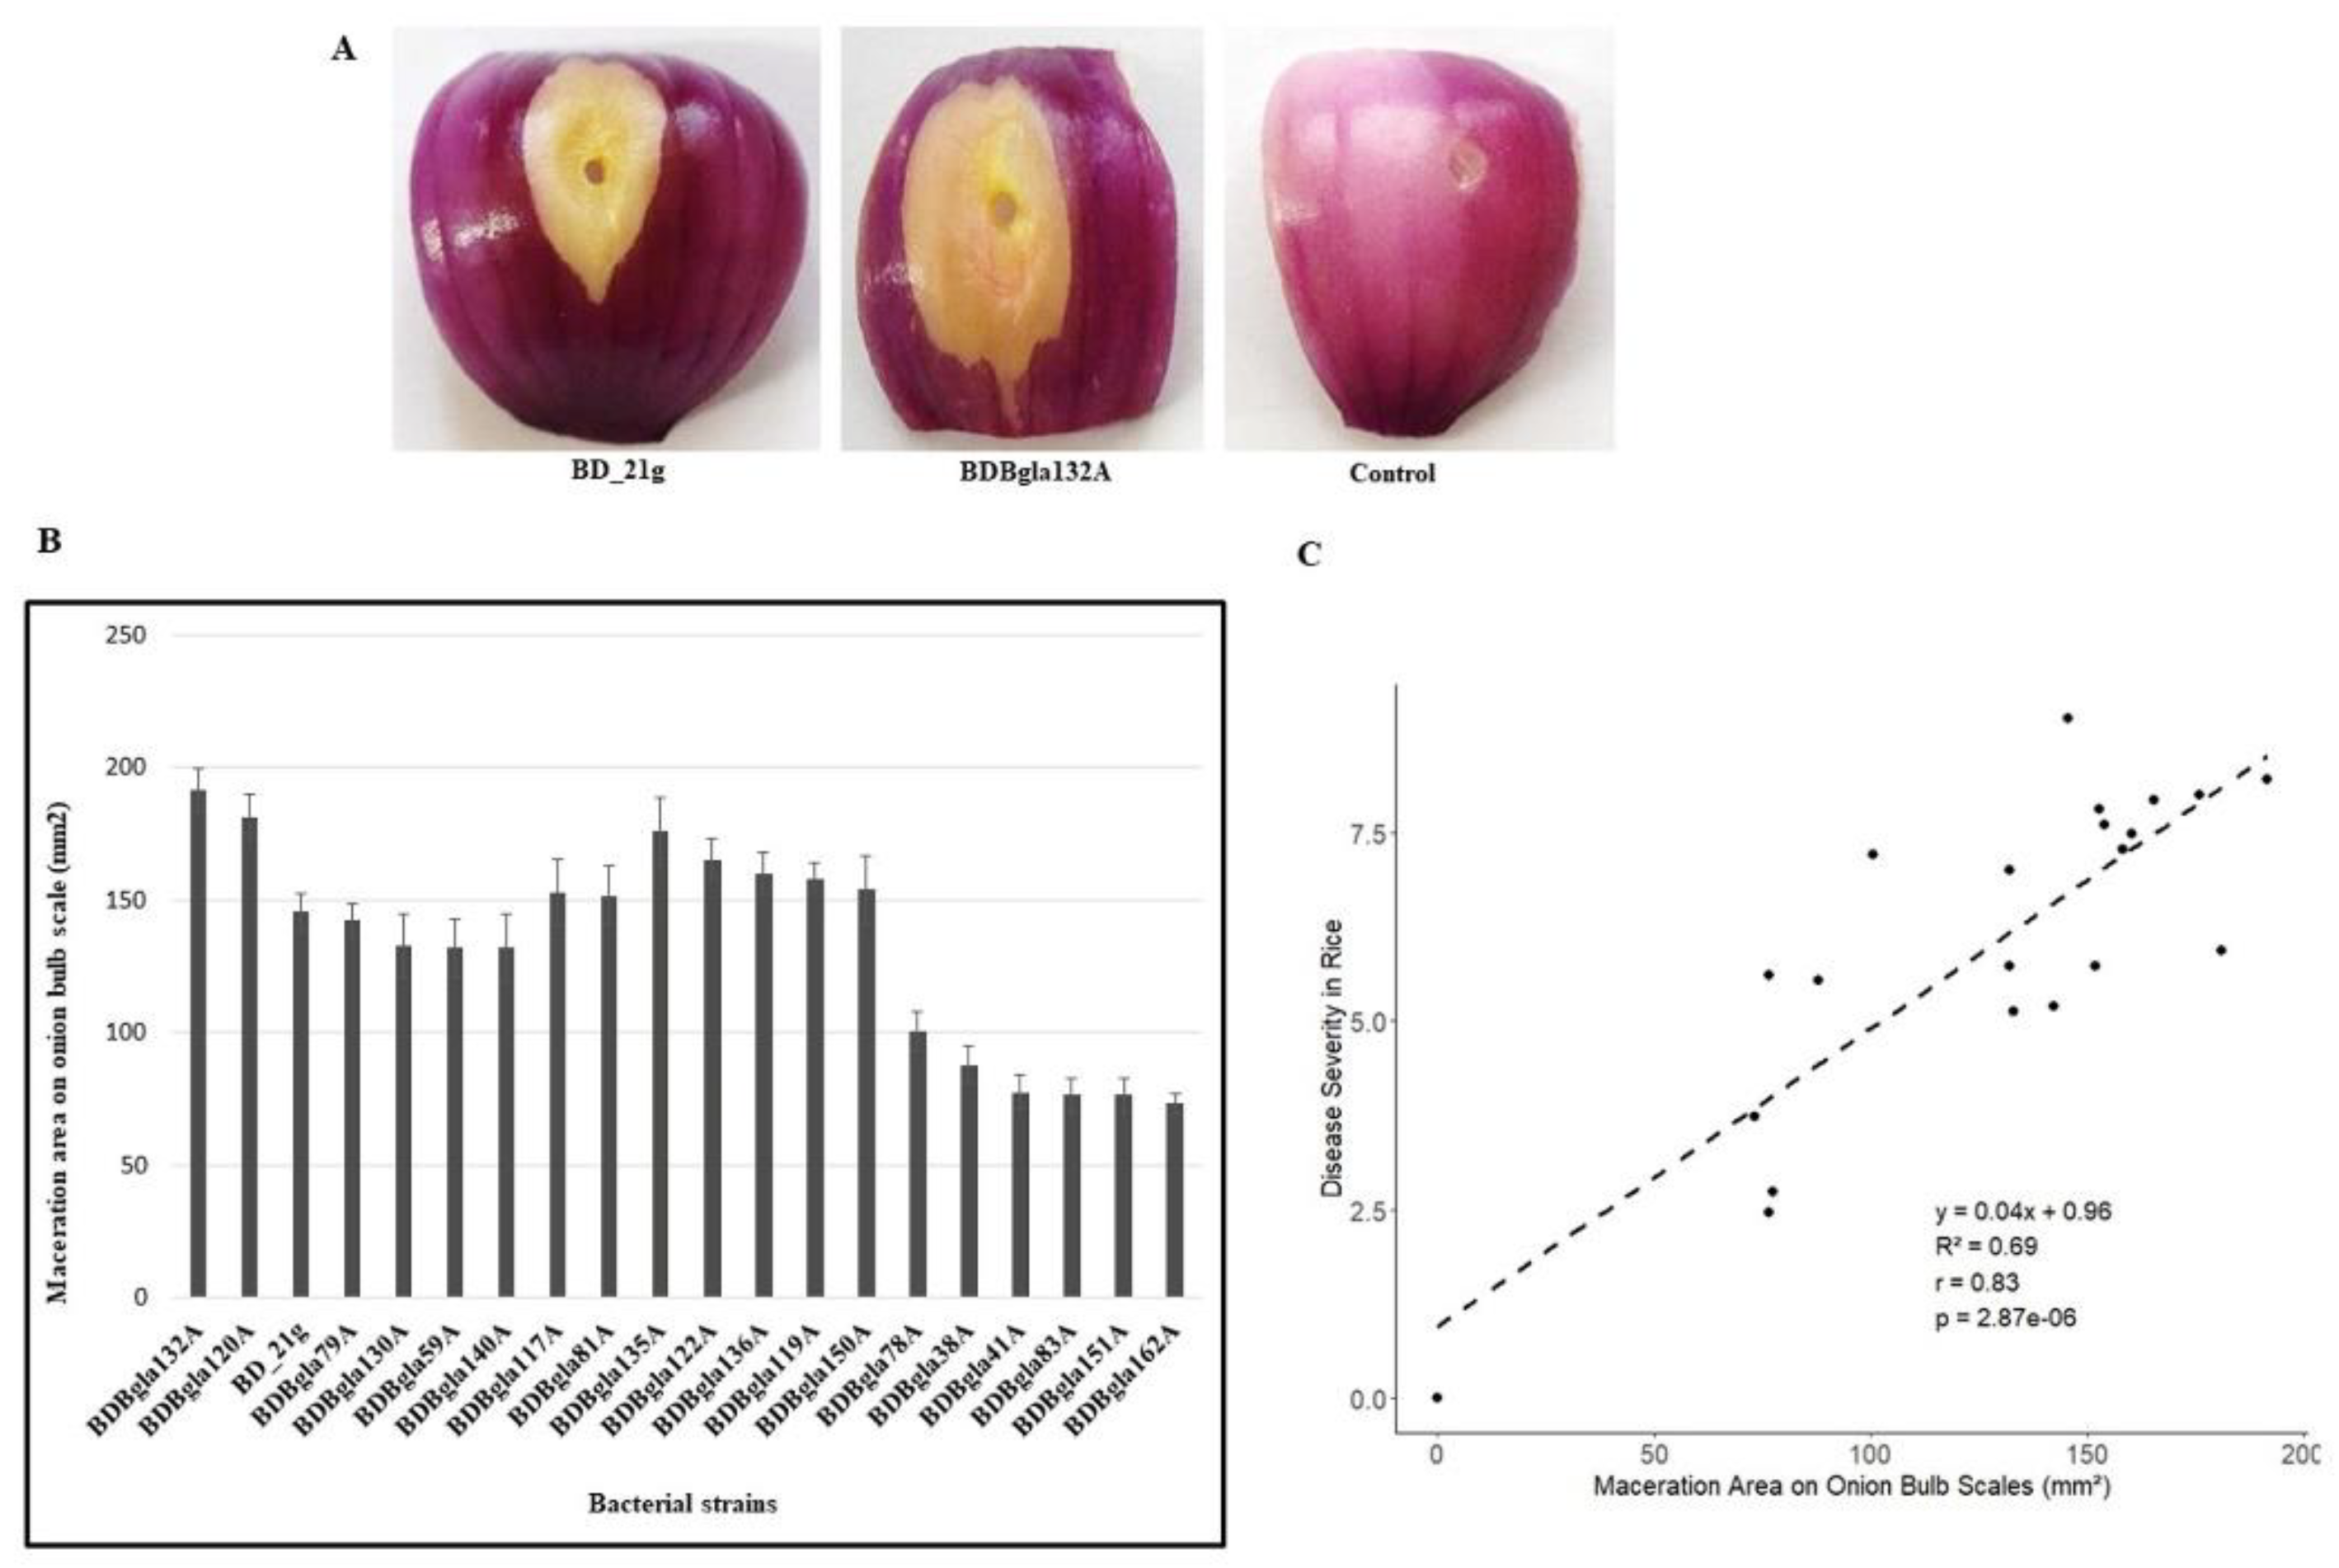
3.4. Onion Assays for Virulence Testing
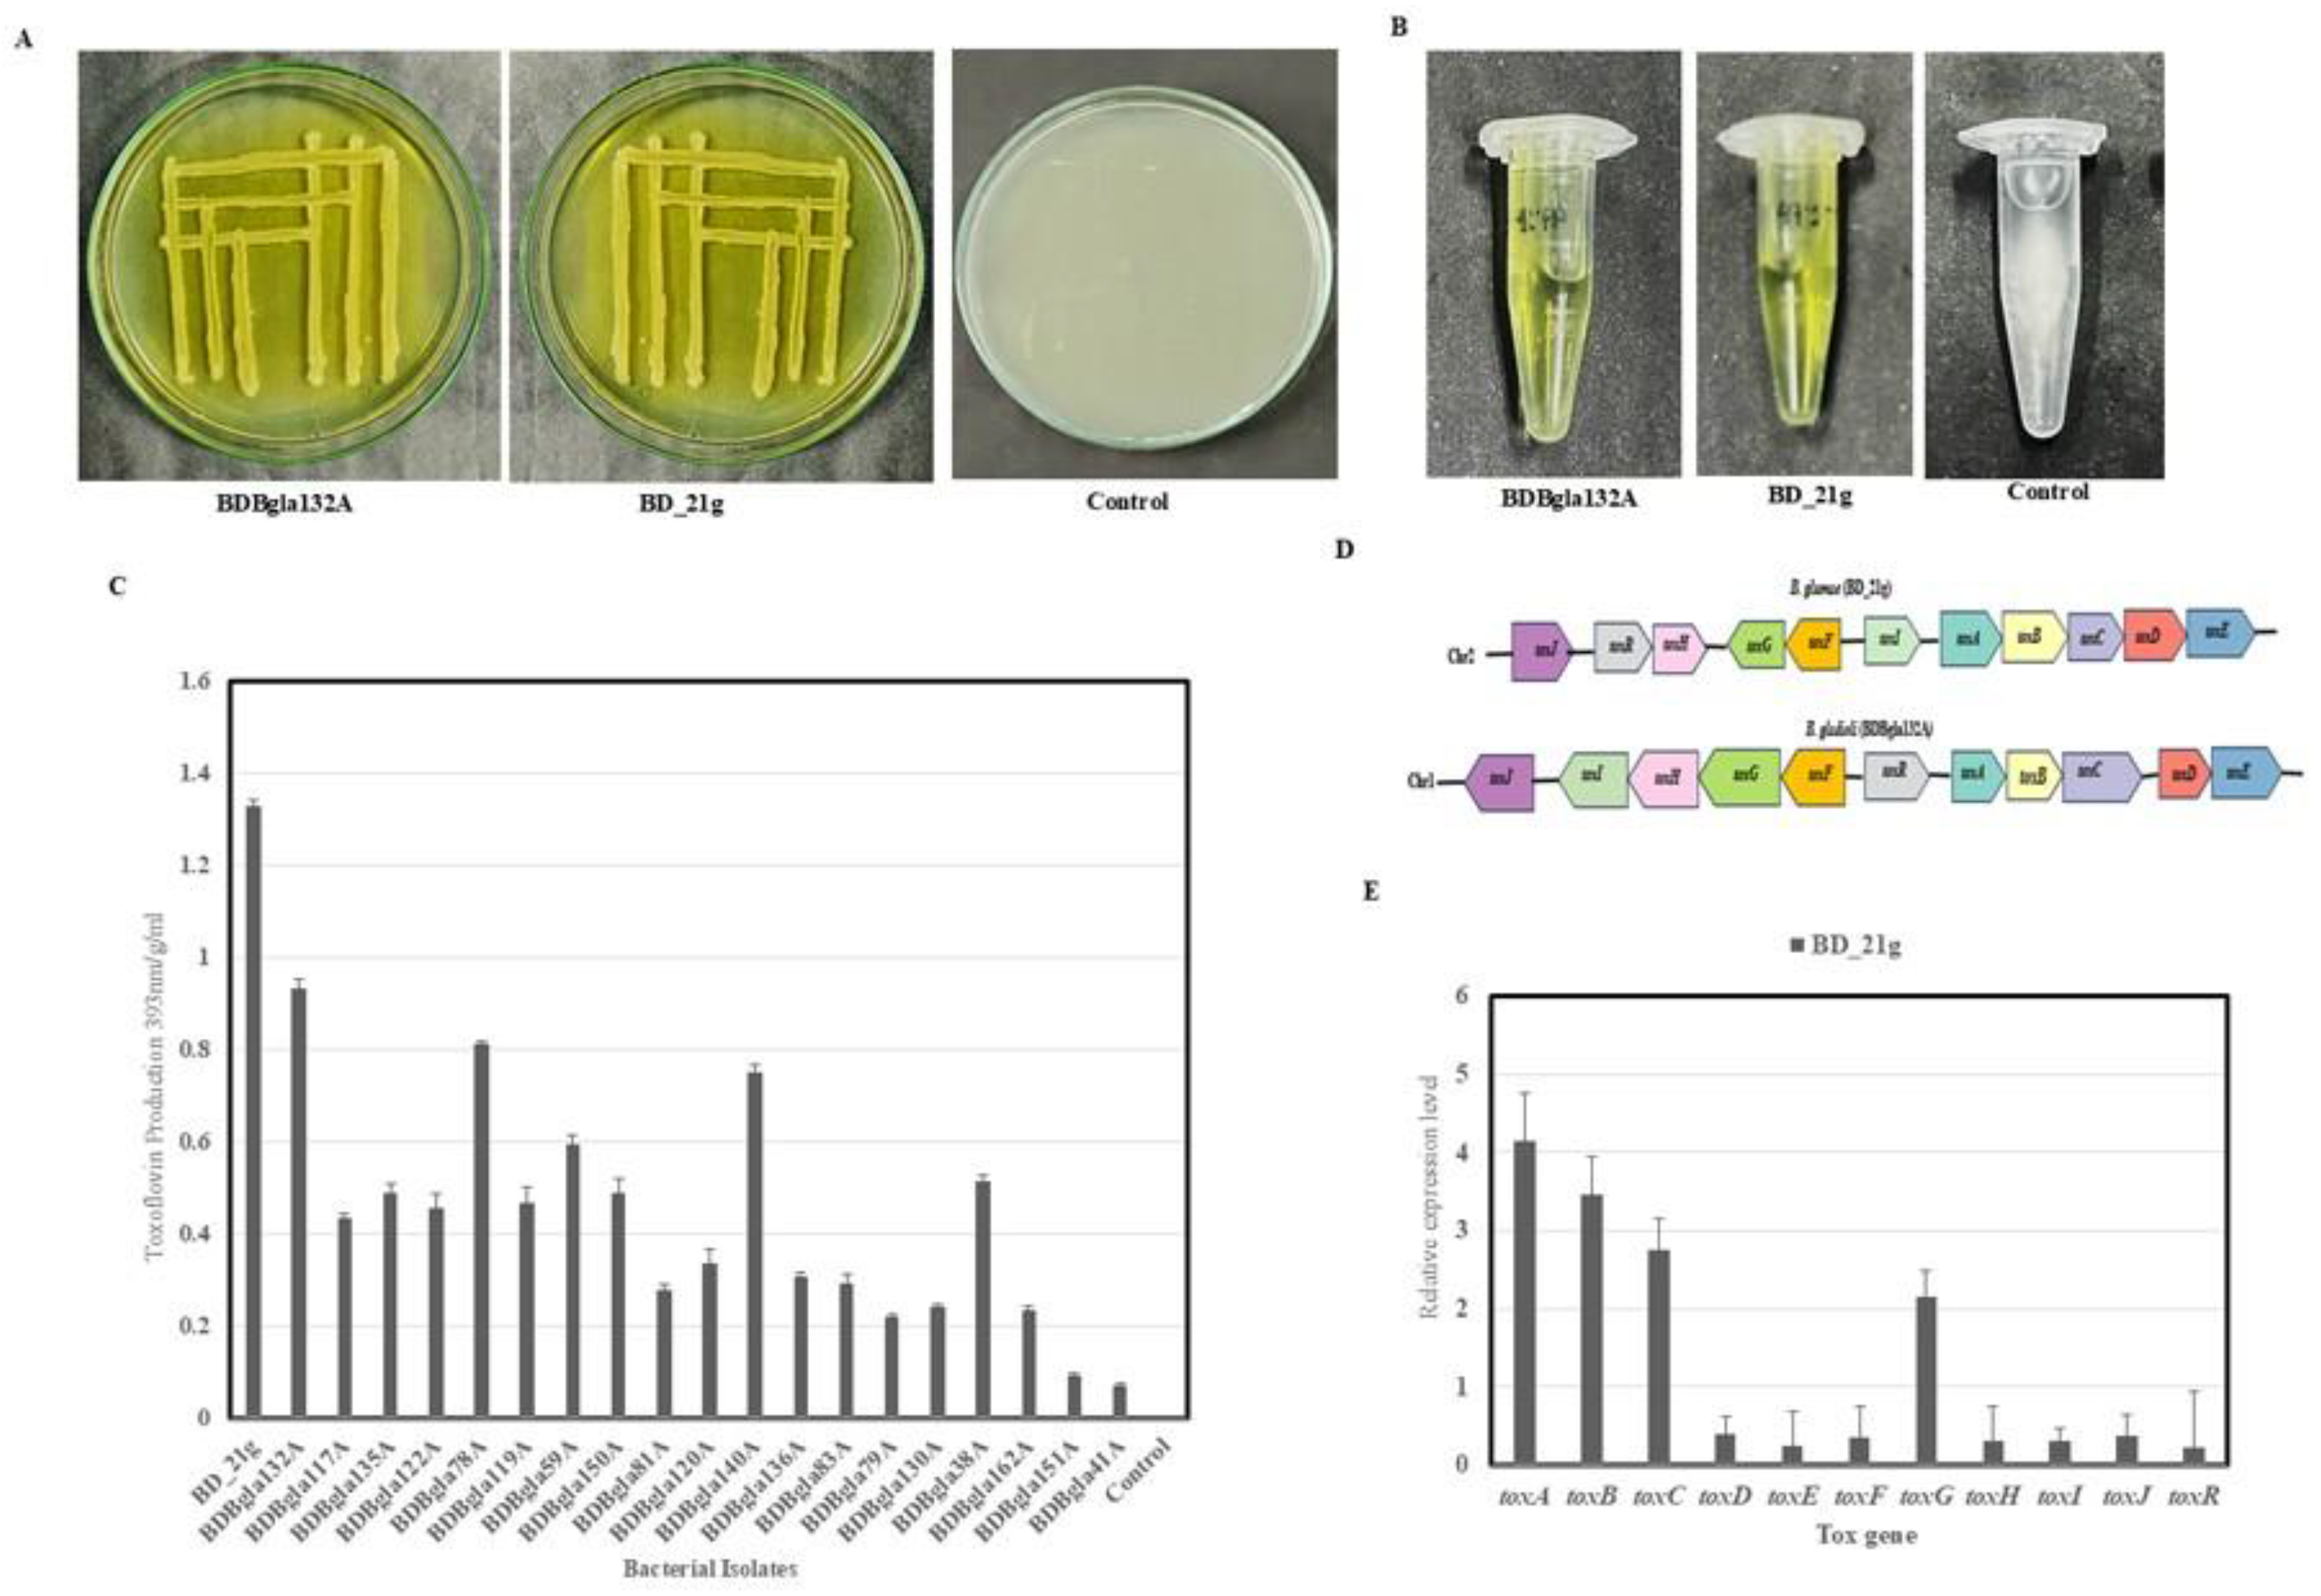
3.5. Toxoflavin Production and Quantification
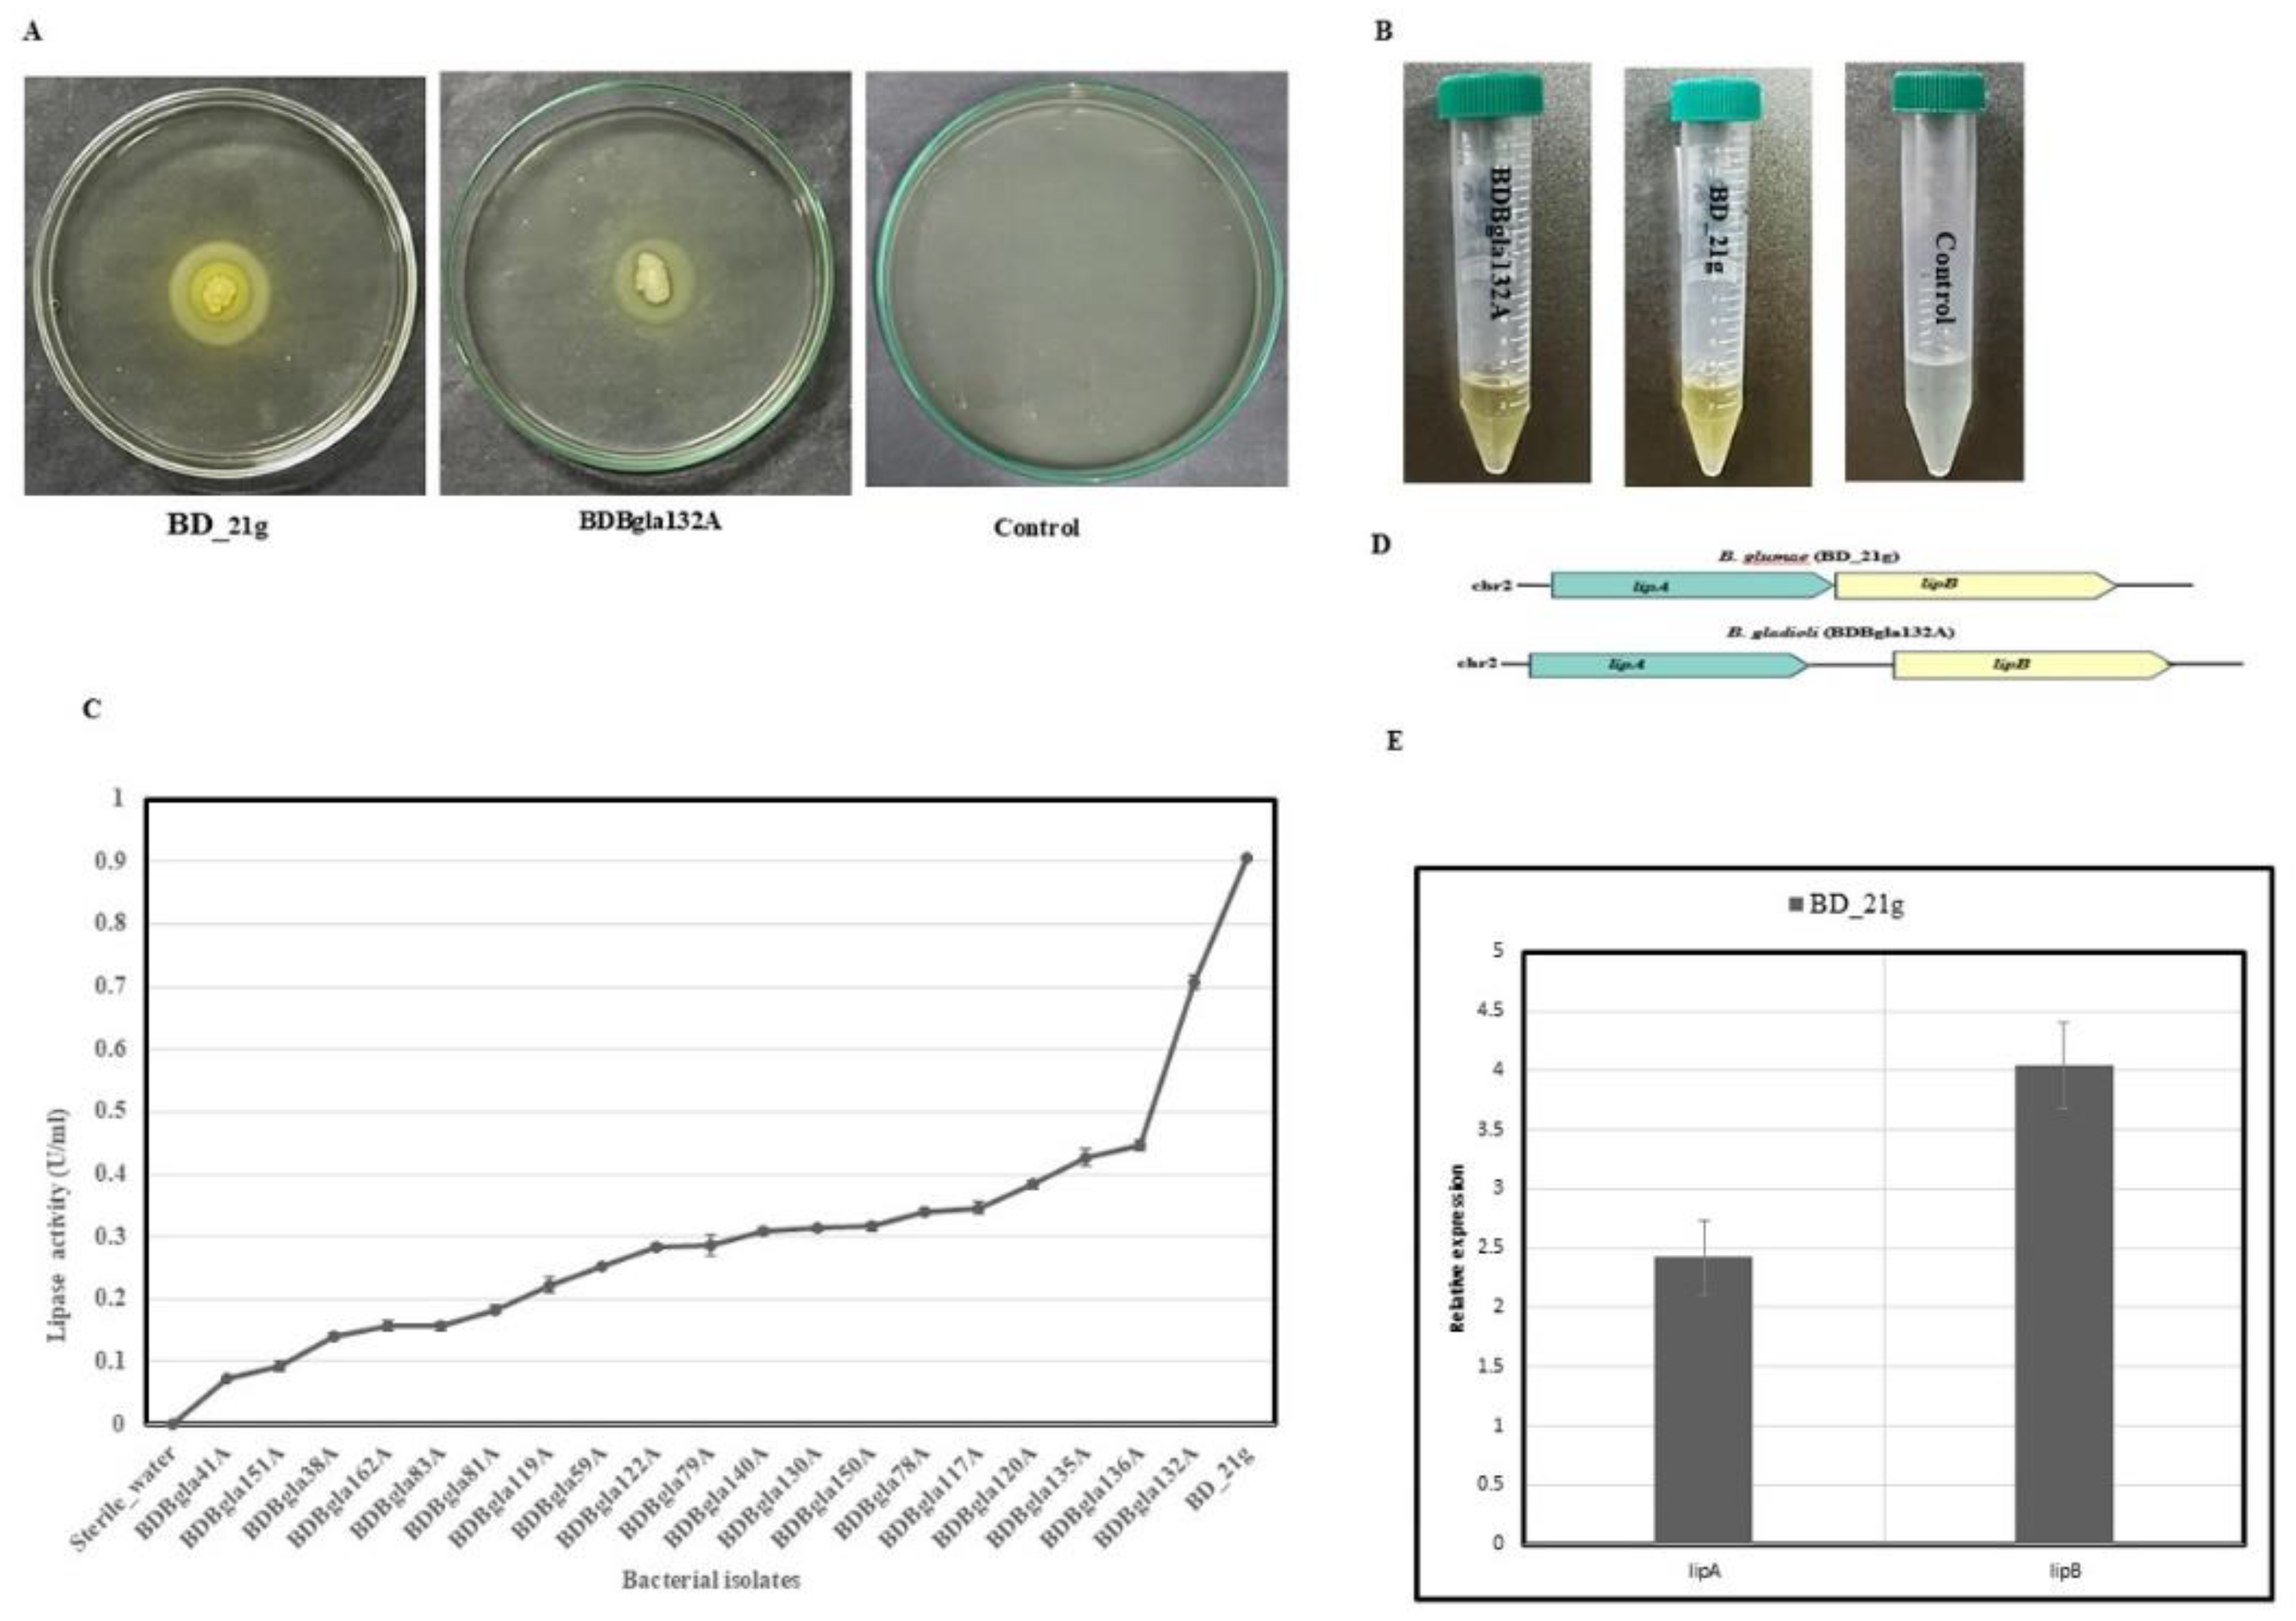
3.6. Lipase Activity Assessment and Quantification
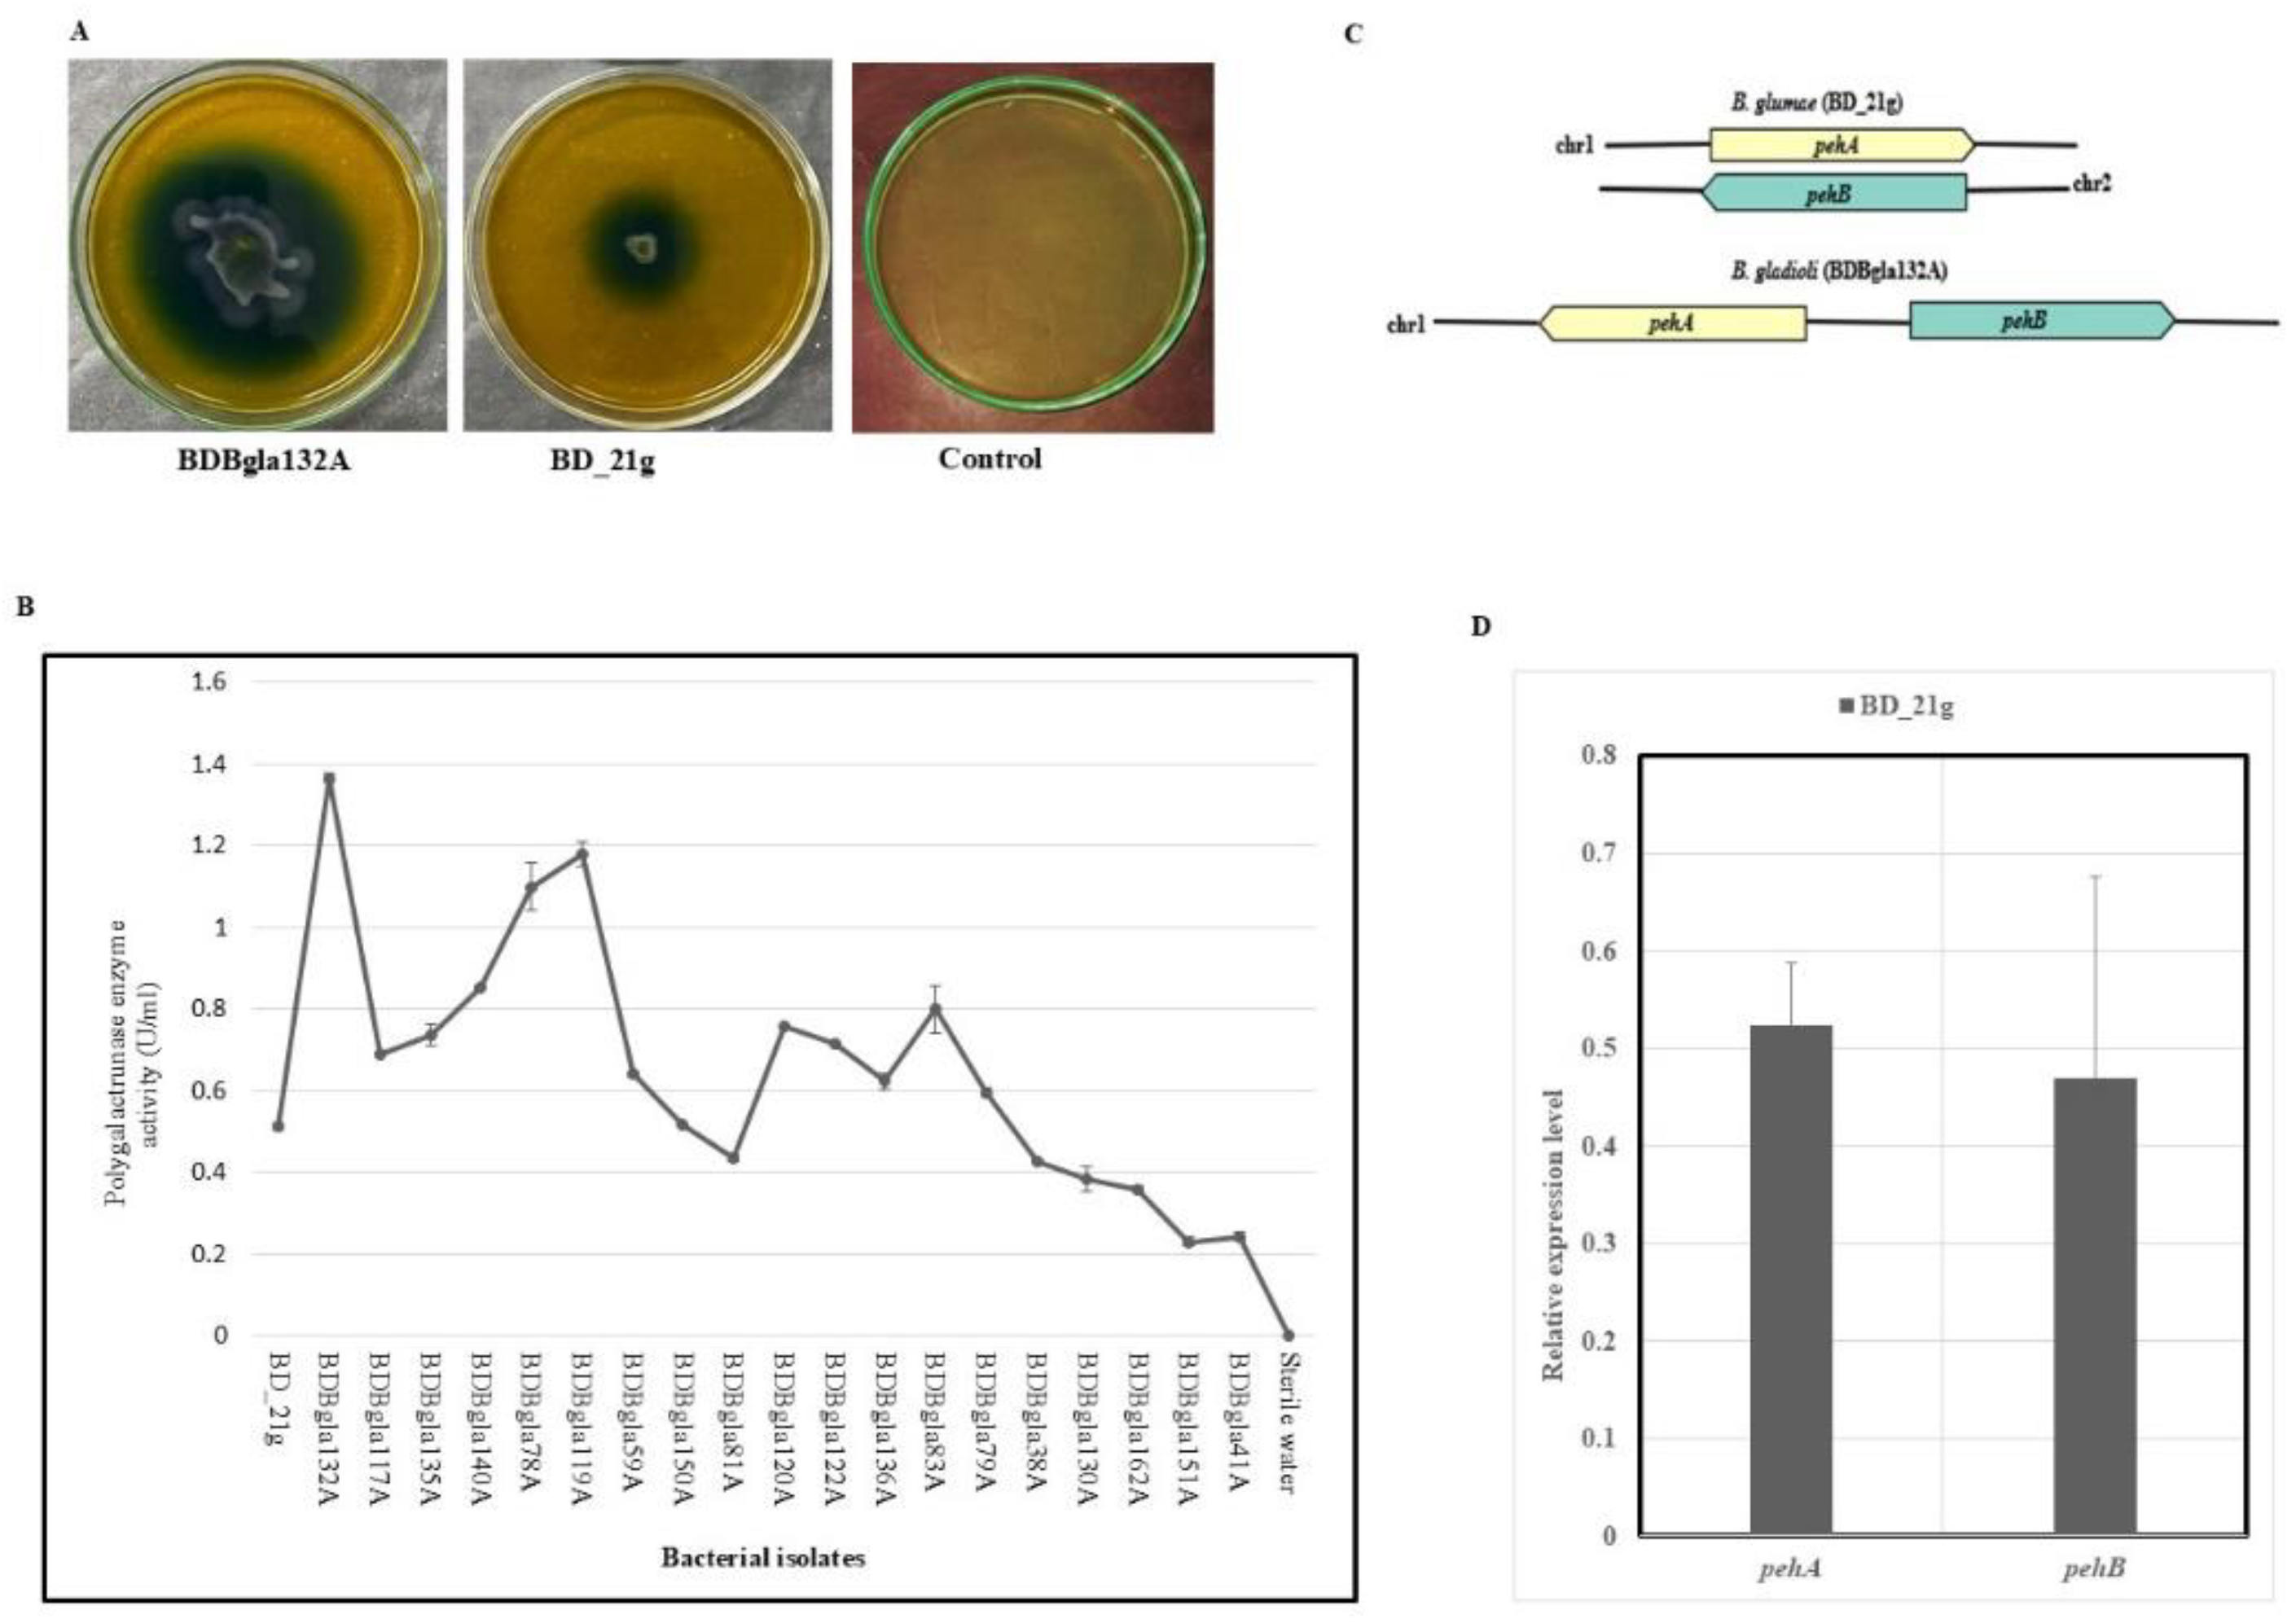
3.7. Qualitative and Quantitative Evaluation of Polygalacturonase Activity
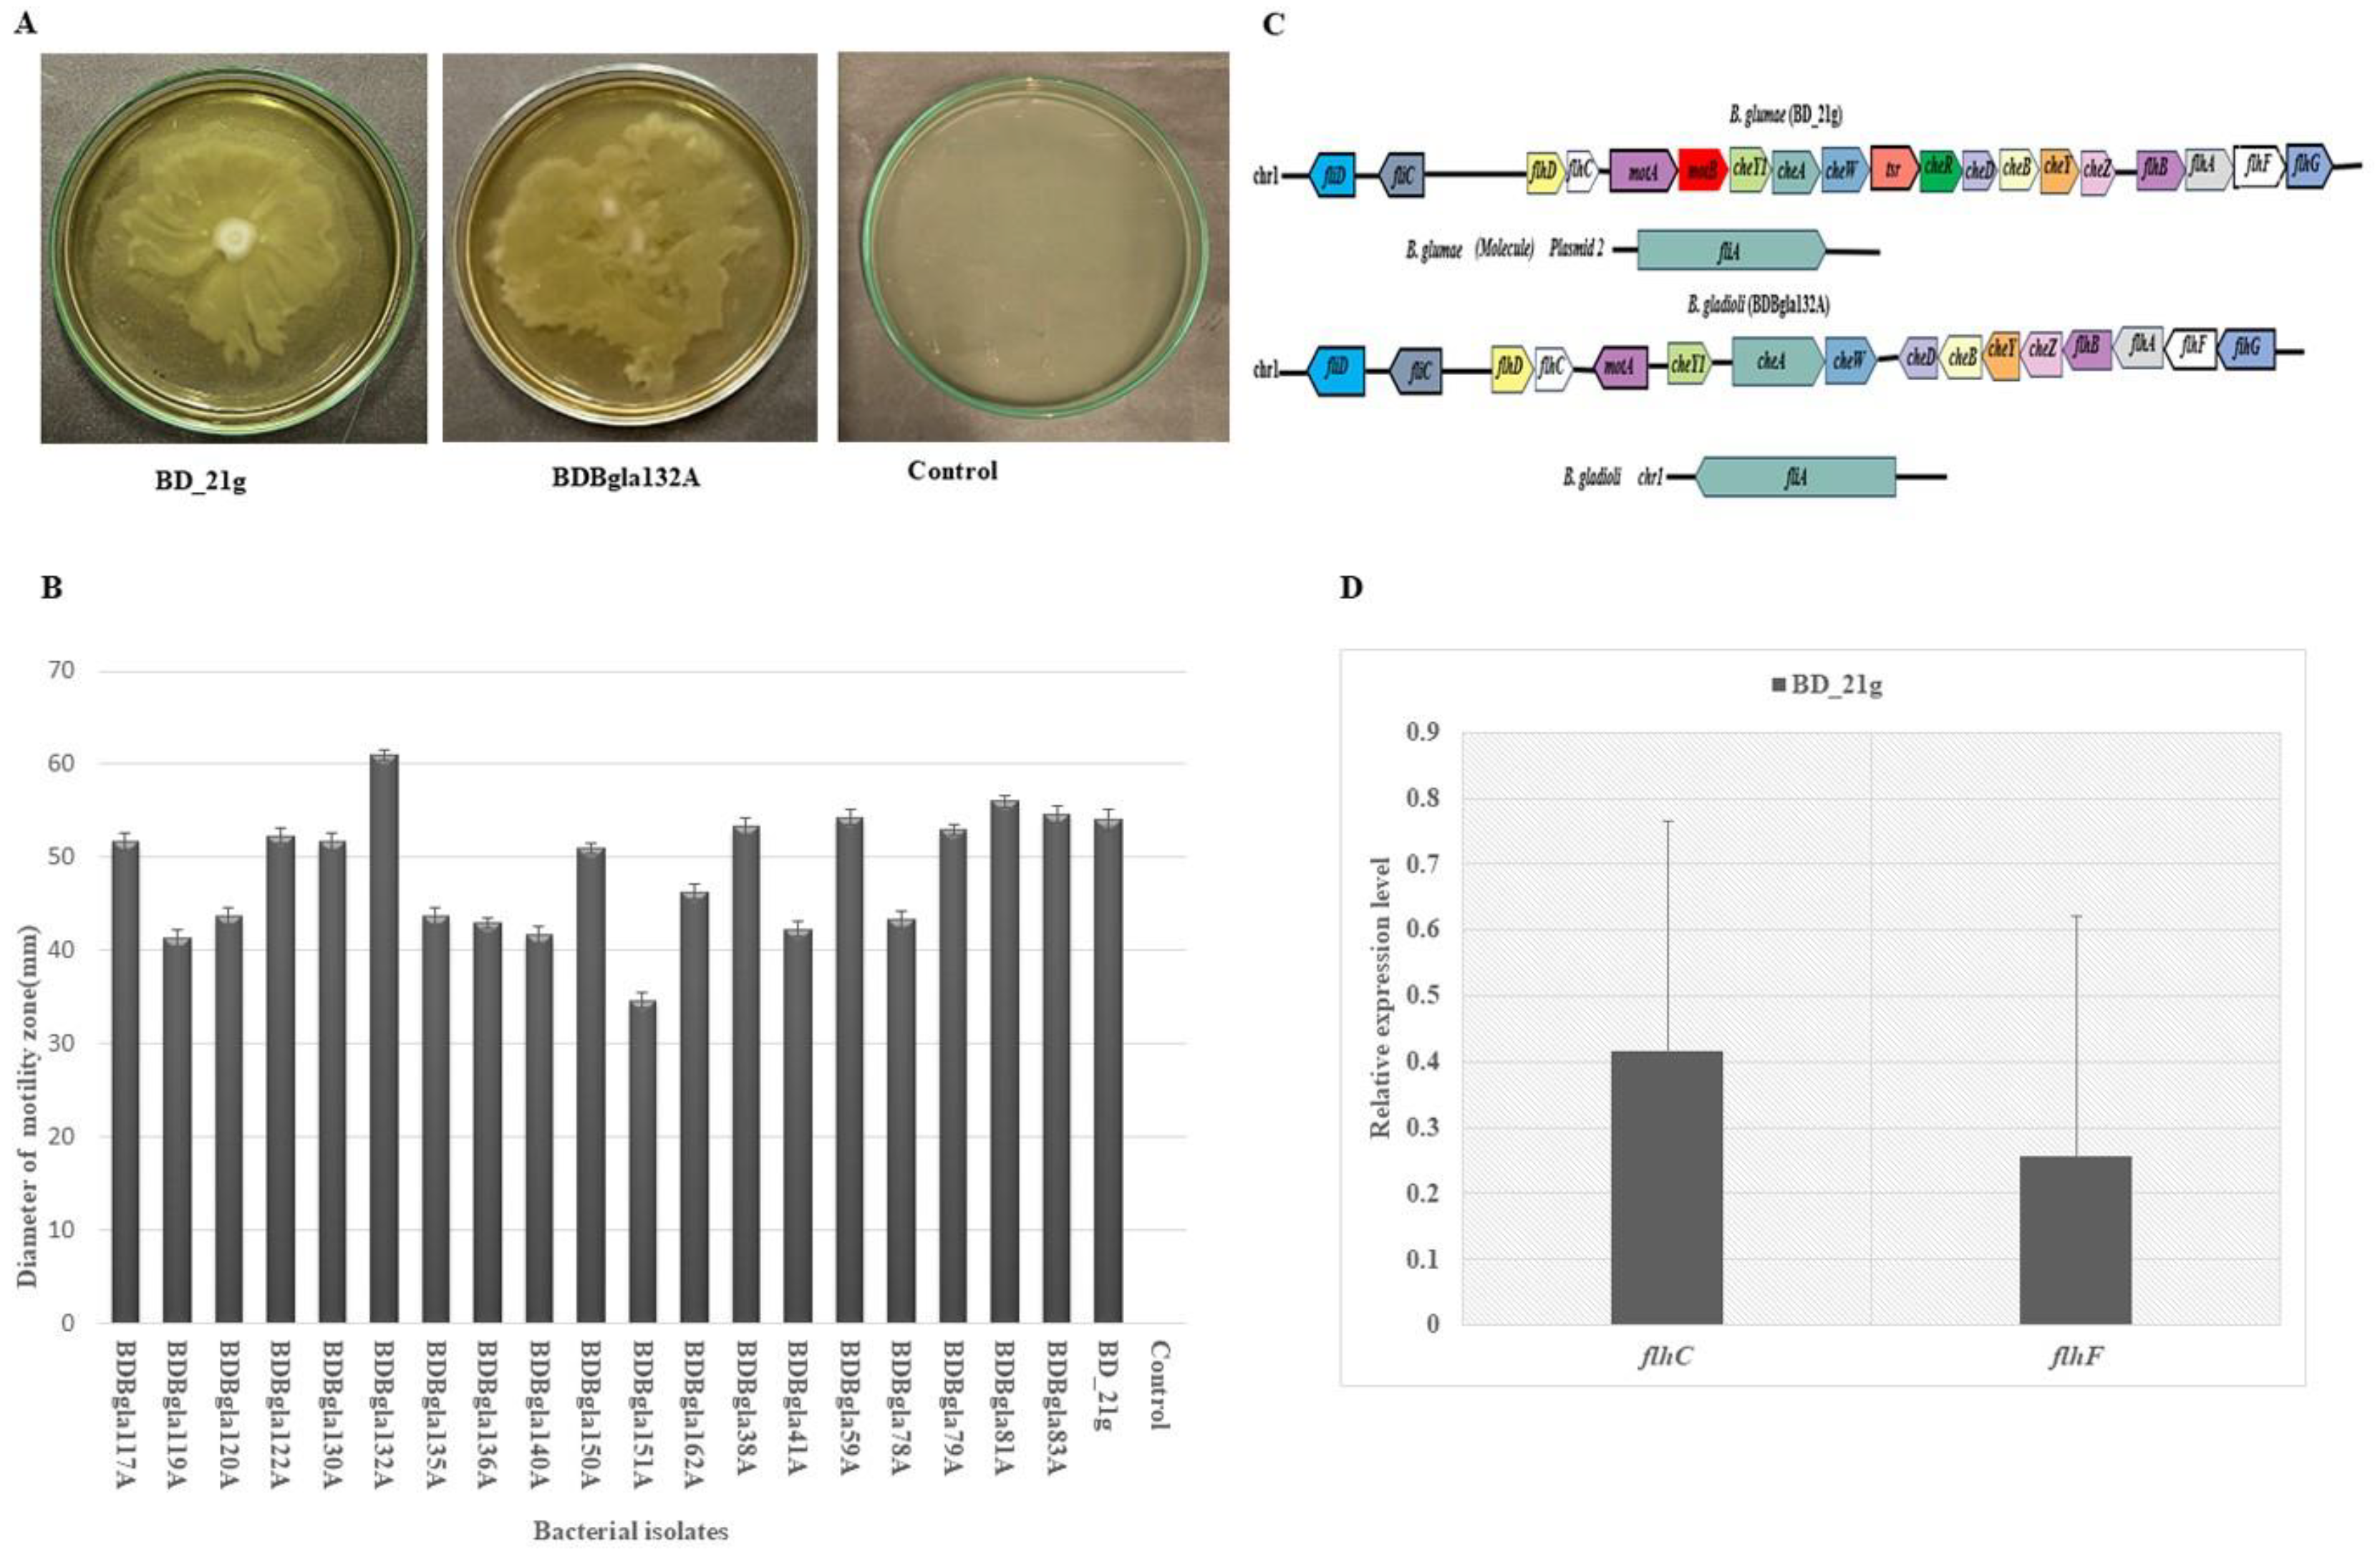
3.8. Swarming Motility Assessment
3.9. Differential Expression of Virulence-Associated Genes
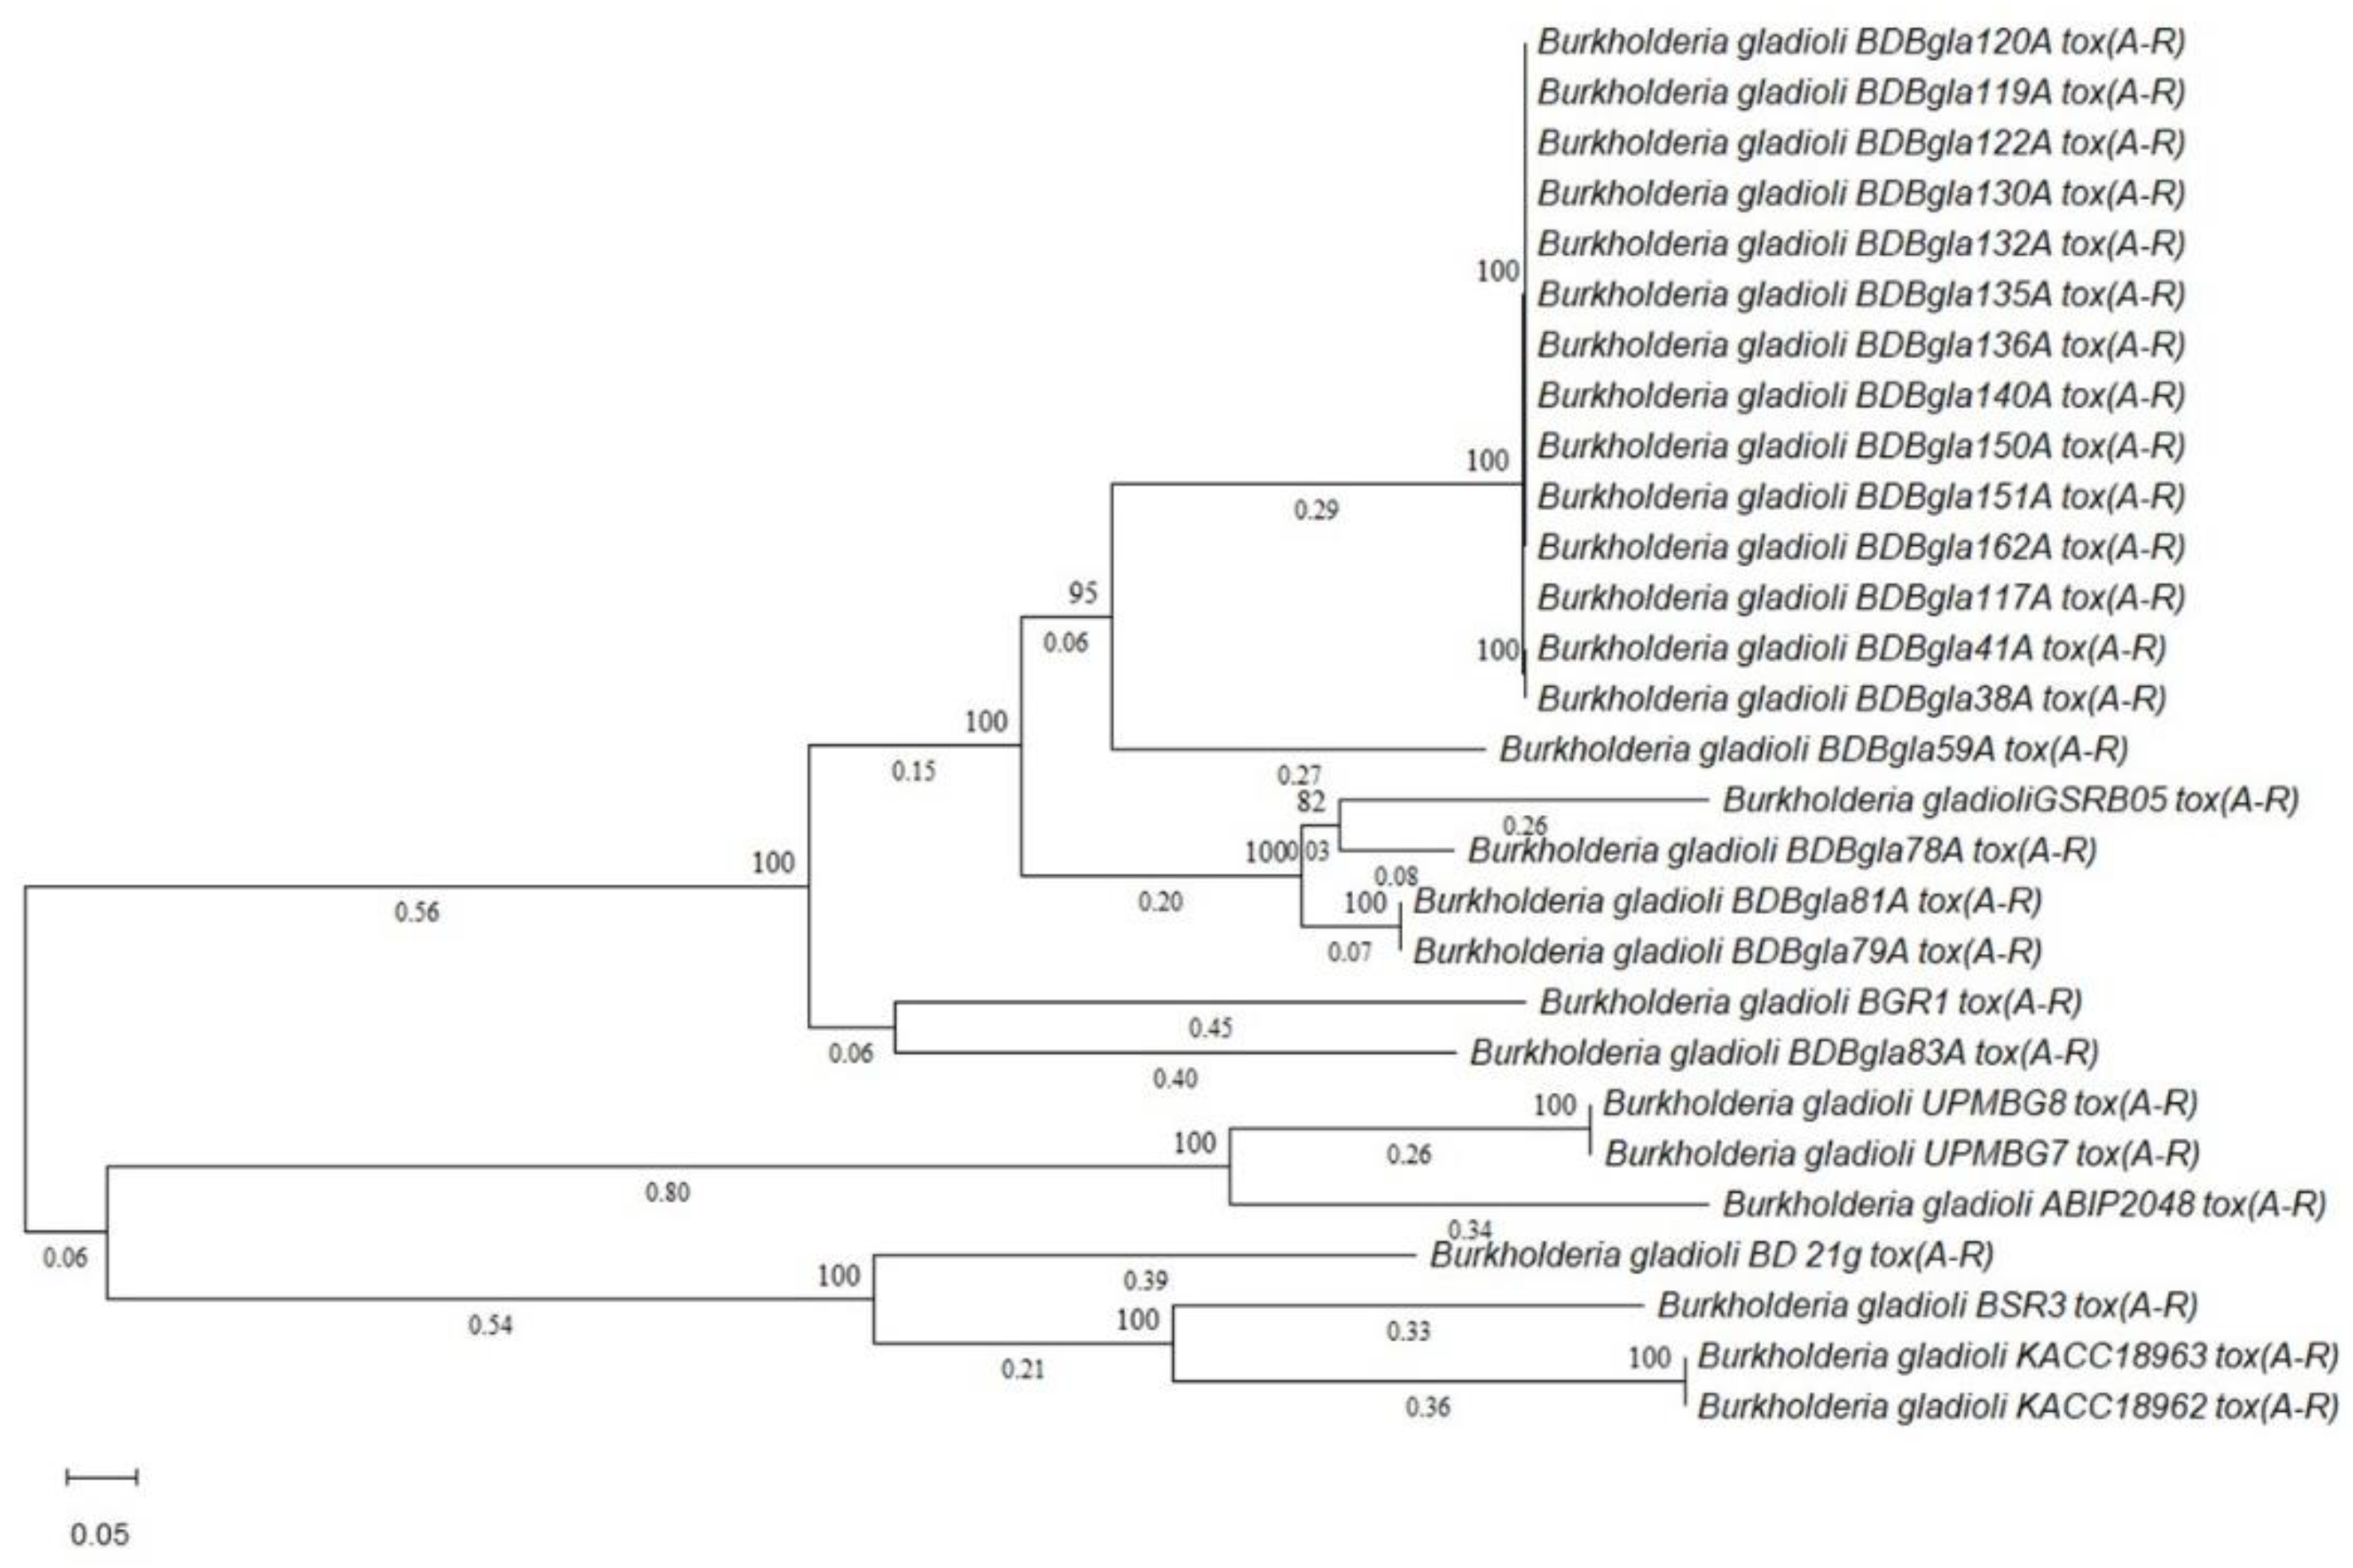
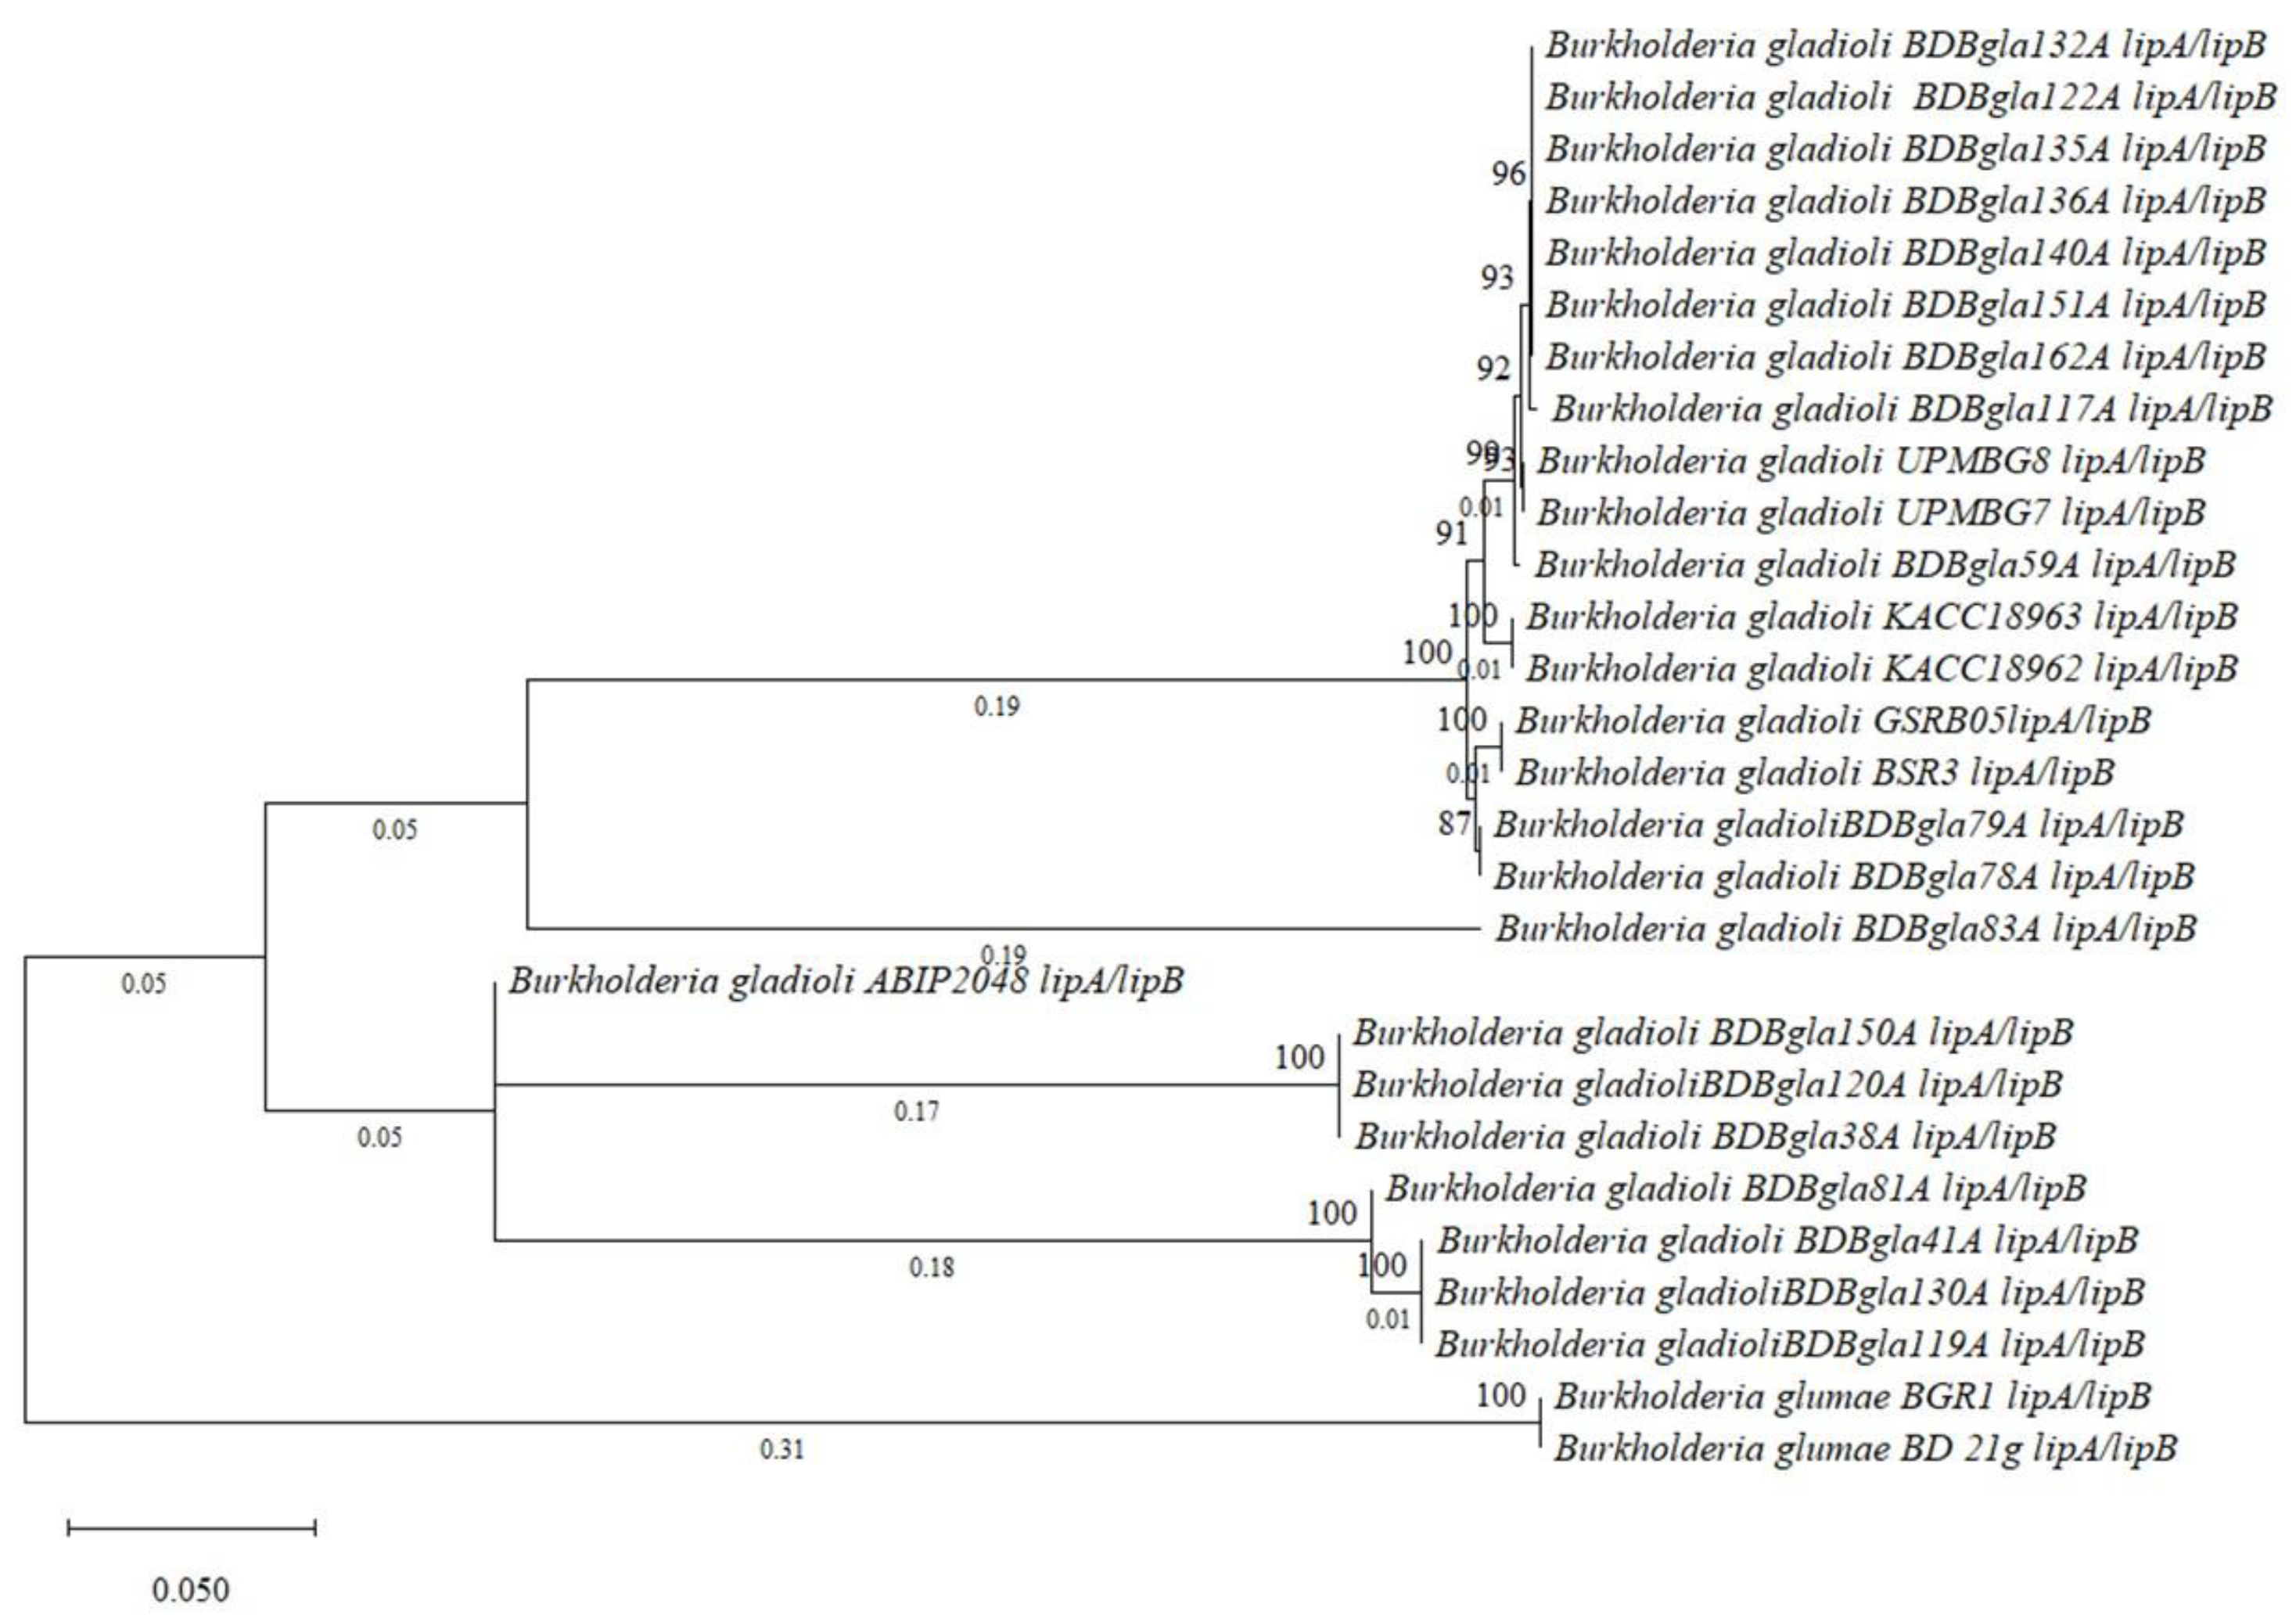
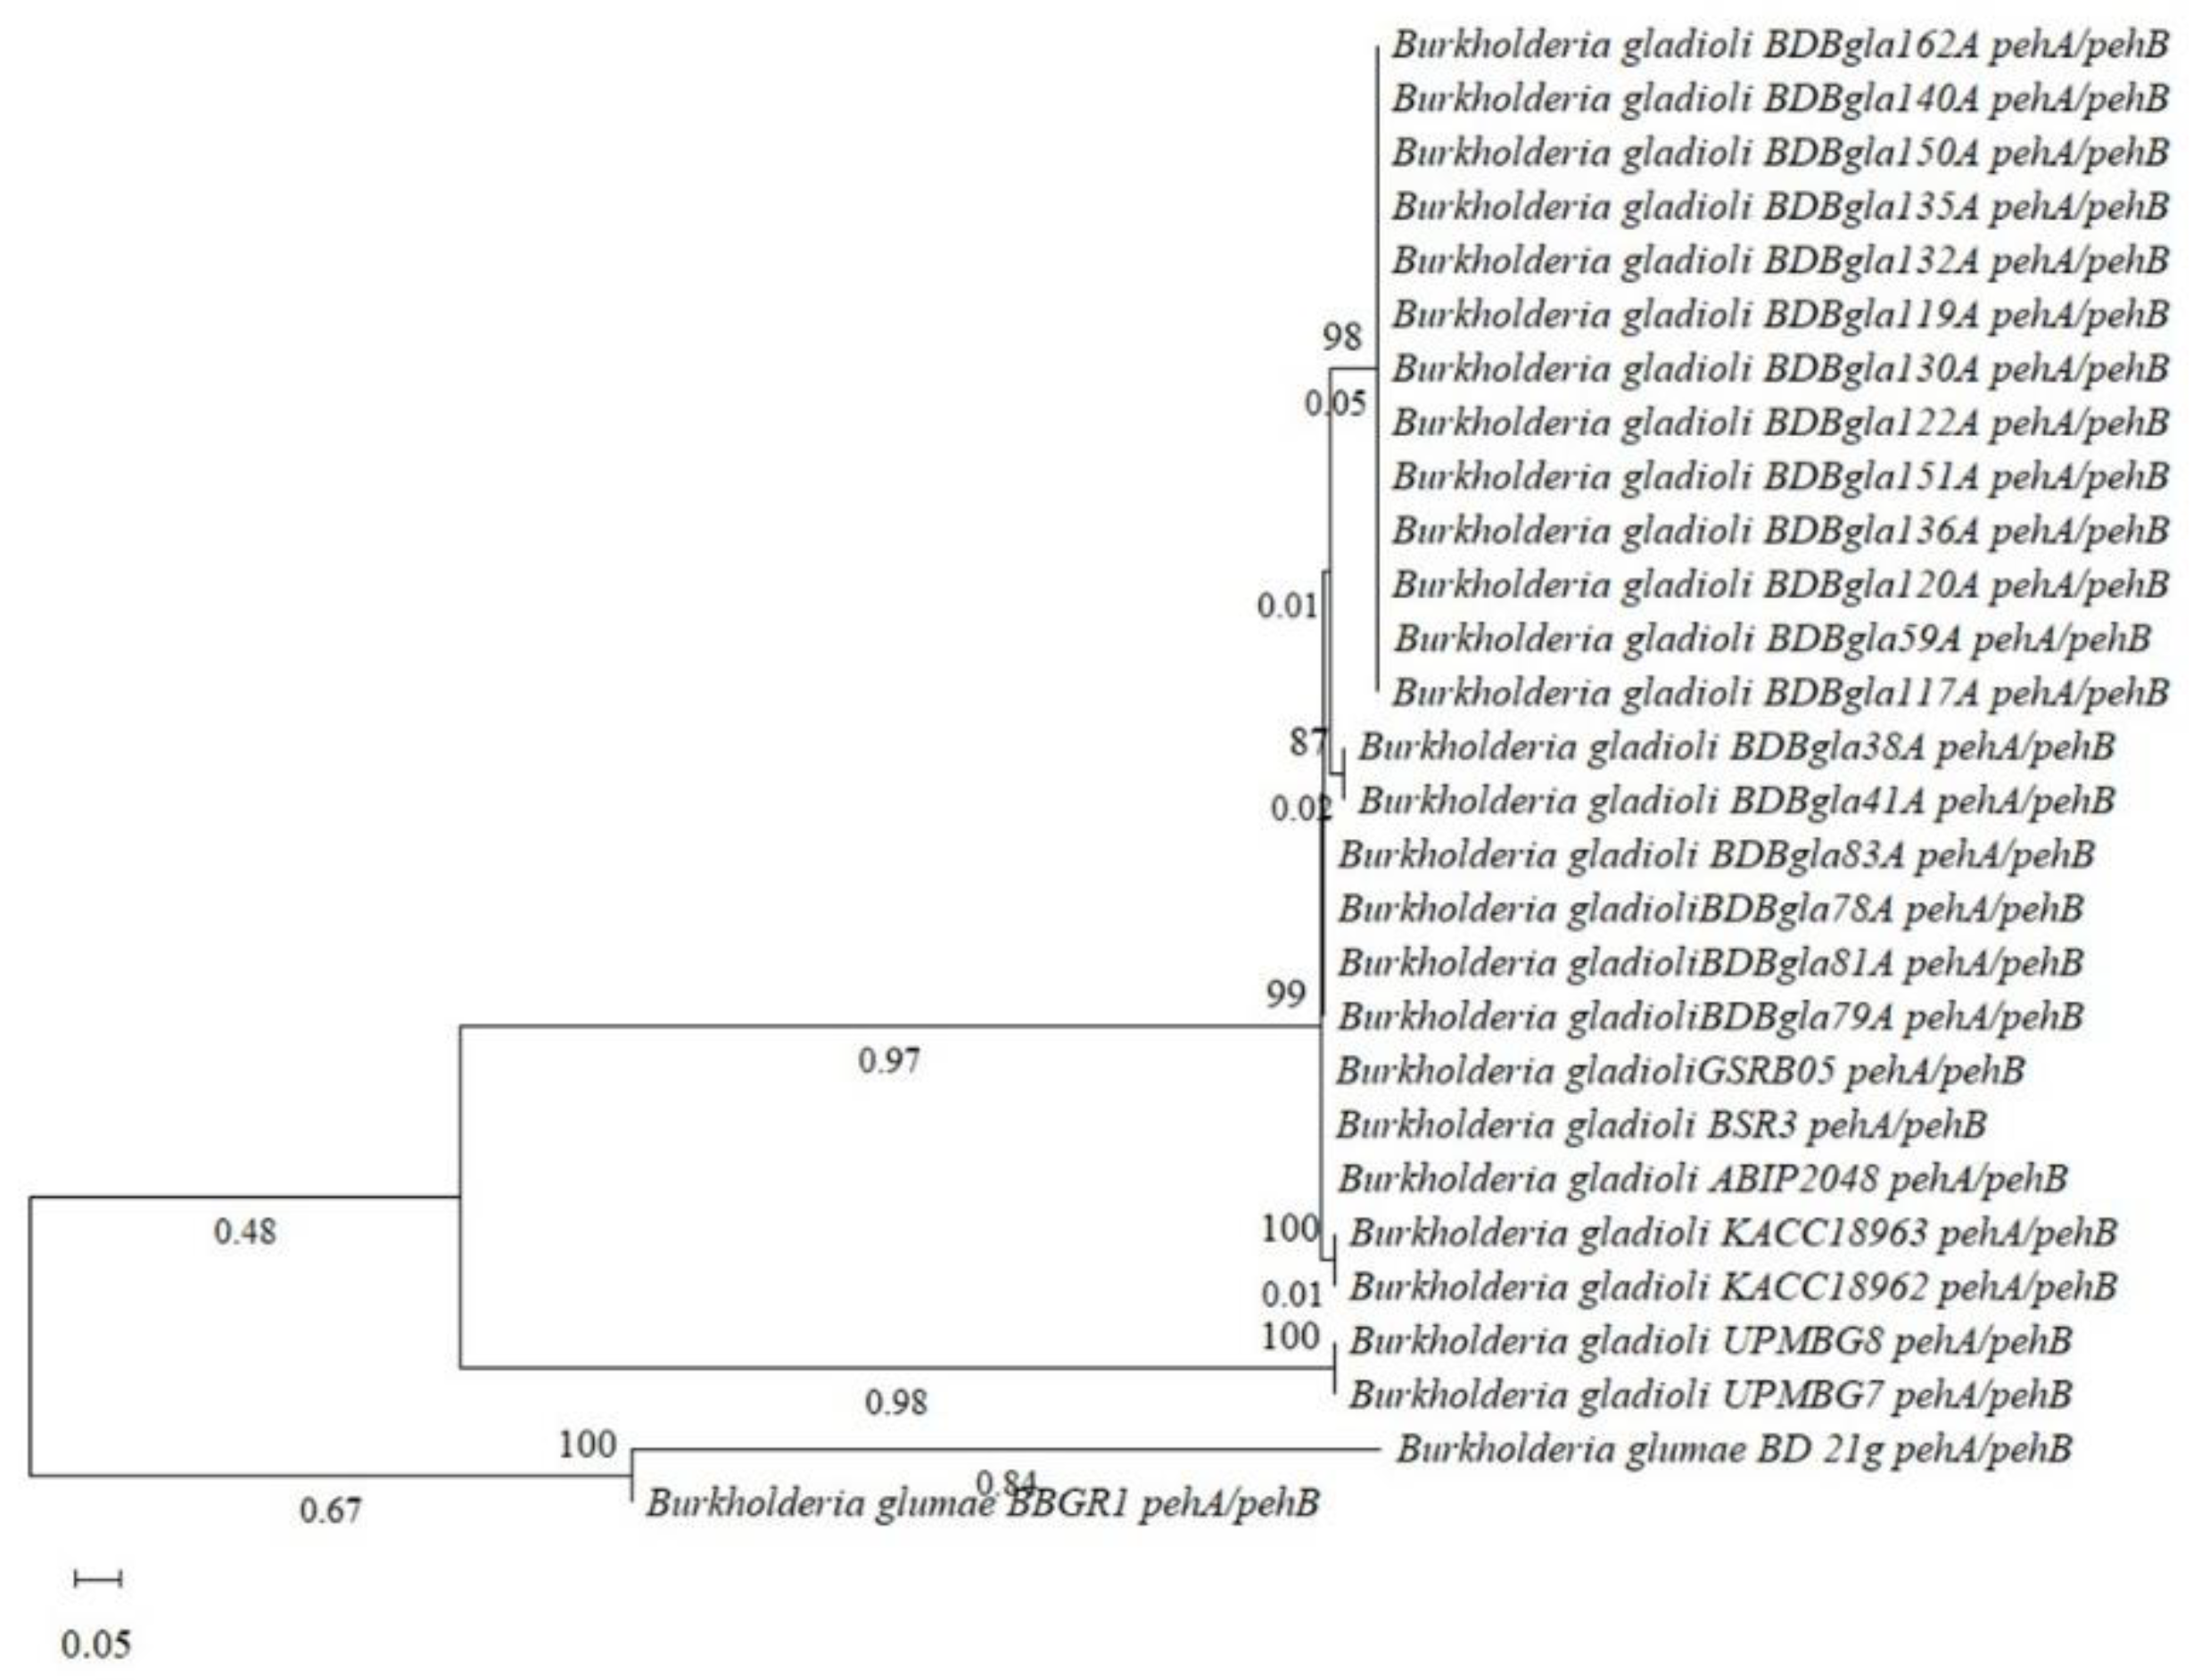
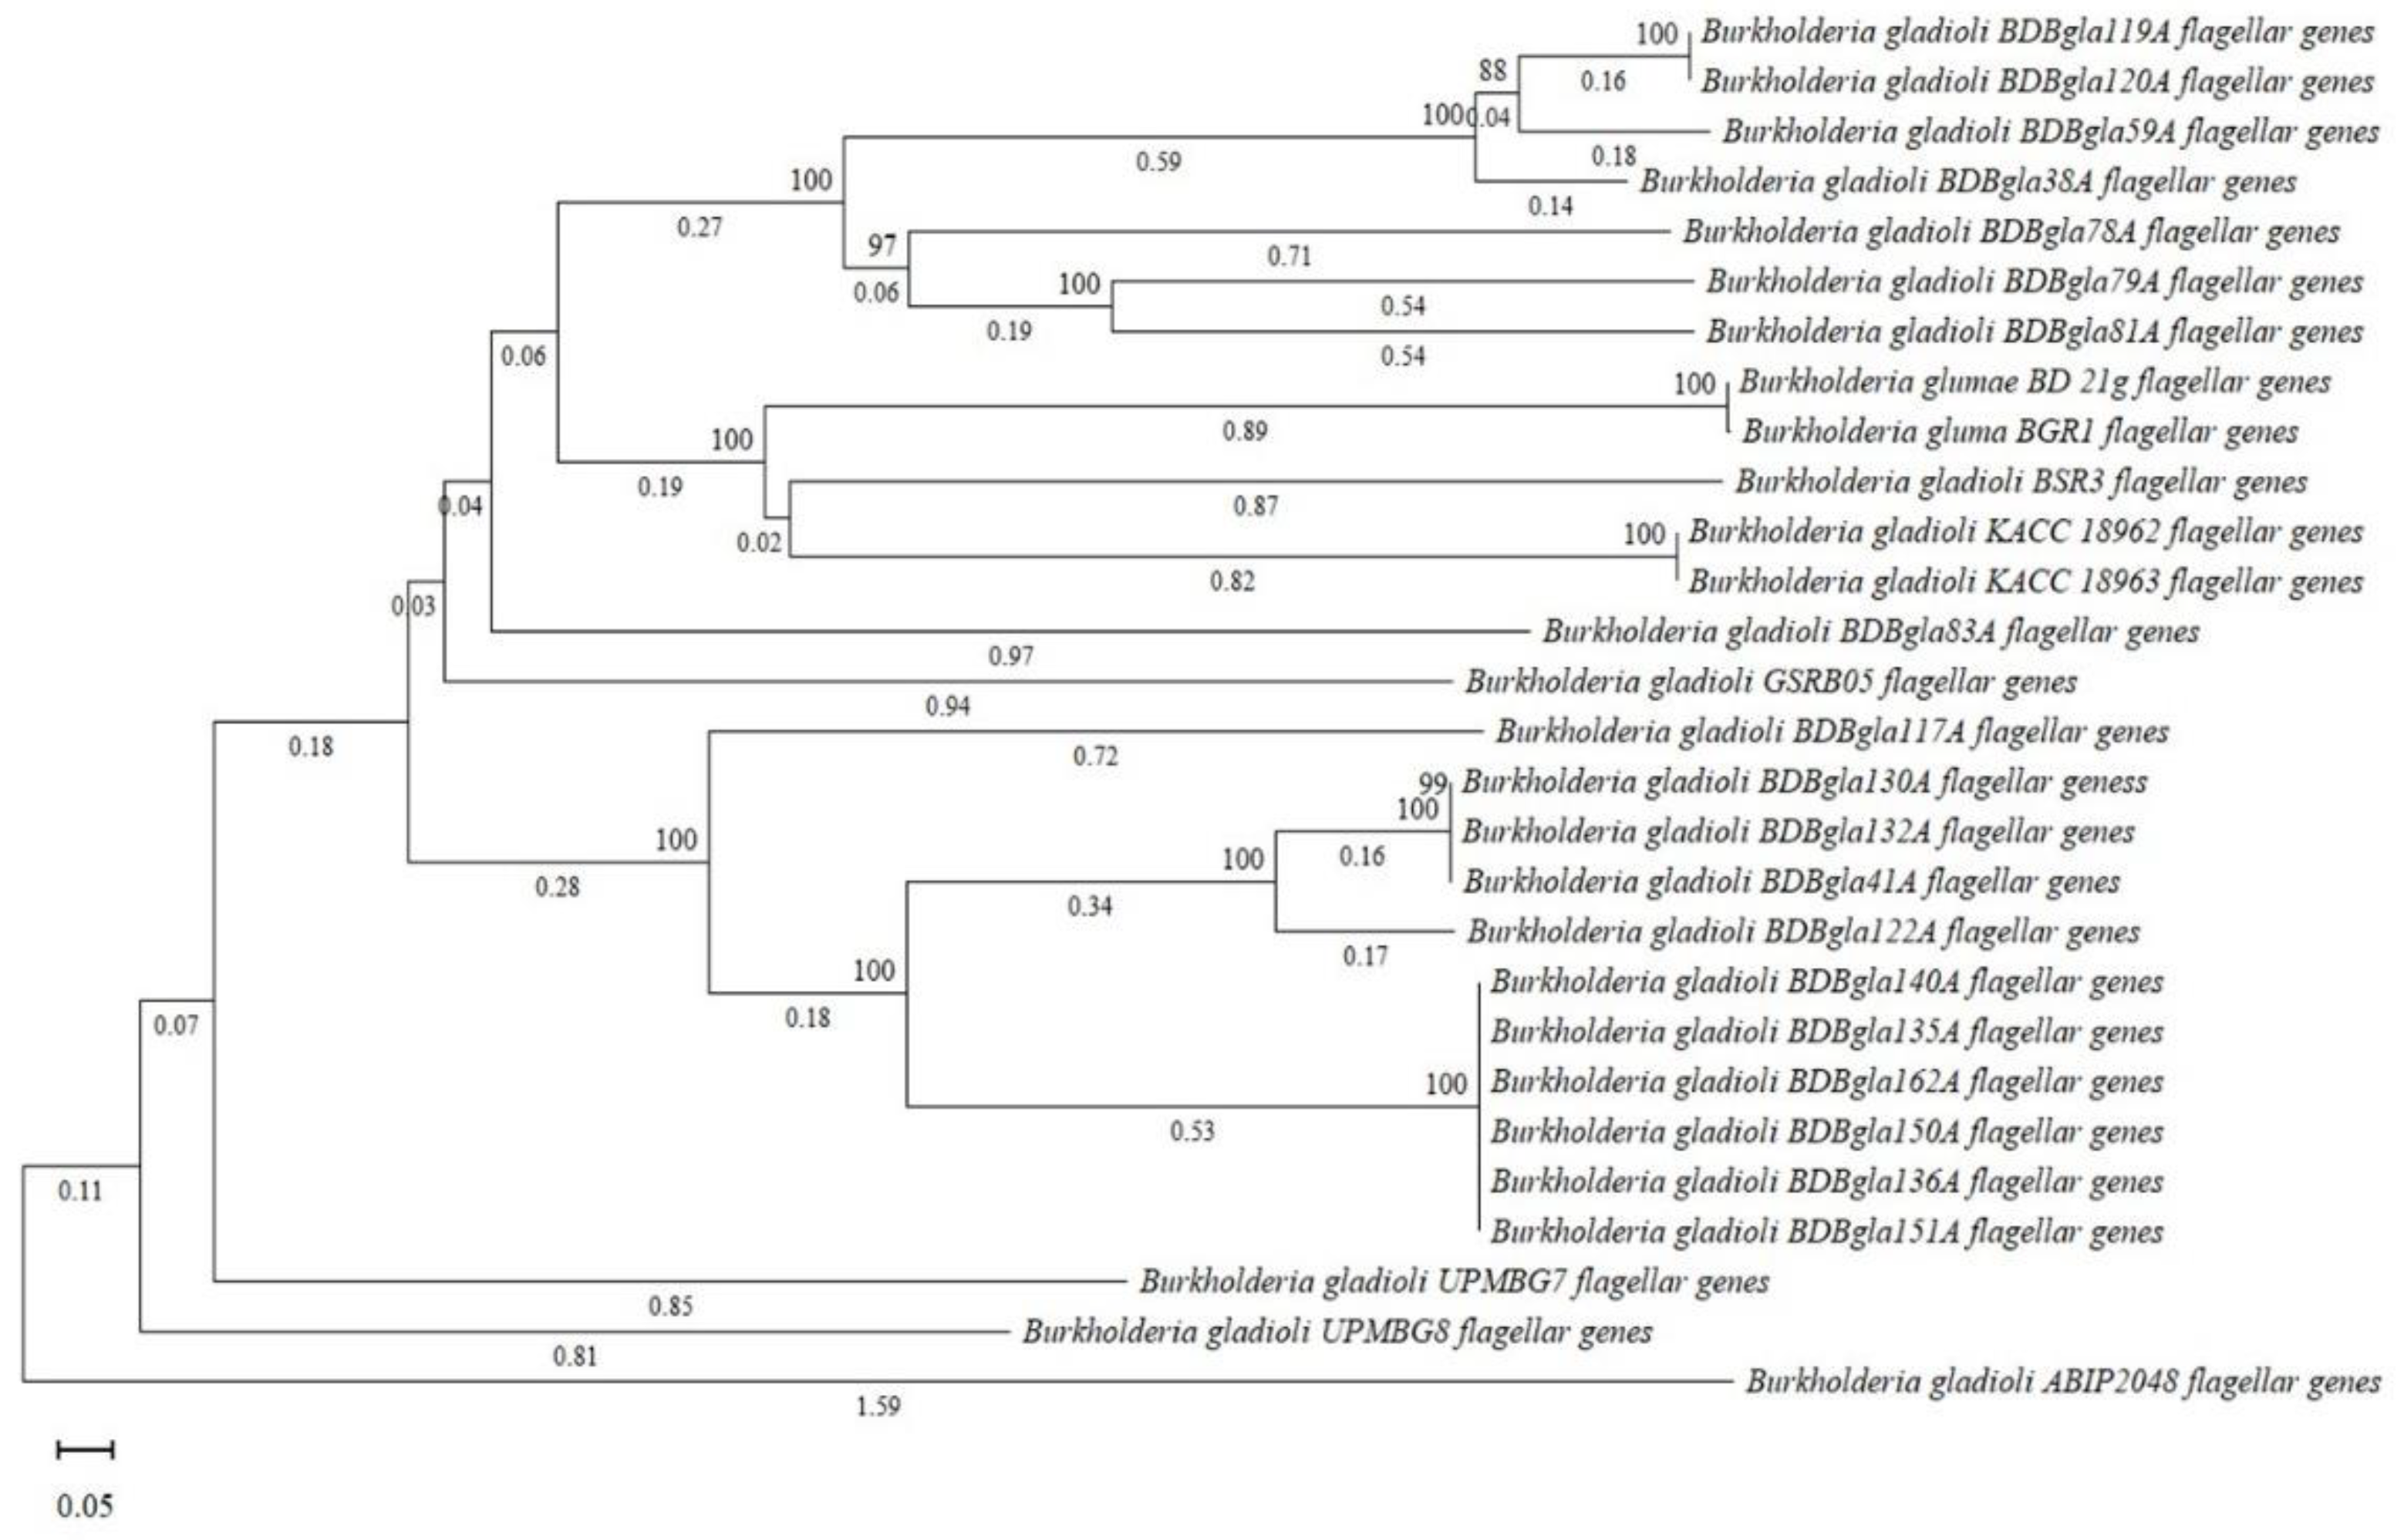
3.10. Comparative Genomic and Evolutionary Analysis of Virulence-Associated Gene Clusters
4. Discussion
5. Conclusions
Supplementary Materials
Author Contributions
Funding
Institutional Review Board Statement
Informed Consent Statement
Data Availability Statement
Acknowledgments
Conflicts of interest
Abbreviations
| S-PG | Sucrose-Peptone-Glutamate |
| BPB | Bacterial Panicle Blight |
| Bcc | Burkholderia cepacia complex |
| KBA | King’s B agar |
| LB | Luria Broth or Luria–Bertani |
| PGA | Polygalacturonic acid |
| T2SS | type II secretion system |
| T3SS | type III secretion system |
| HR | Hyper-sensitive response |
| BLASTp | Basic Local Alignment Search Tool-protein |
| NCBI | National Center for Biotechnology Information |
References
- Islam, M.R.; Jannat, R.; Protic, I.A.; Happy, M.N.A.; Samin, S.I.; Mita, M.M.; et al. First report of bacterial panicle blight in rice caused by Burkholderia gladioli in Bangladesh. Plant Dis. 2023, 107, 2837. [Google Scholar] [CrossRef]
- Ham, J.H.; Melanson, R.A.; Rush, M.C. Burkholderia glumae: next major pathogen of rice? Mol Plant Pathol. 2011, 12, 329–39. [Google Scholar] [CrossRef] [PubMed]
- Nandakumar, R.; Shahjahan, A.K.M.; Yuan, X.L.; Dickstein, E.R.; Groth, D.E.; Clark, C.A.; et al. Burkholderia glumae and B. gladioli cause bacterial panicle blight in rice in the southern United States. Plant Dis. 2009, 93, 896–905. [Google Scholar] [CrossRef] [PubMed]
- Cui, Z.Q.; Zhu, B.; Xie, G.L.; Li, B.; Huang, S.W. Research status and prospect of Burkholderia glumae, the pathogen causing bacterial panicle blight. Rice Sci. 2016, 23, 111–18. [Google Scholar] [CrossRef]
- Goto, K.; Ohata, K. New bacterial disease of rice (brown stripe and grain rot). Ann Phytopathol Soc Jpn. 1956, 21, 46–47. [Google Scholar]
- Zhou, X.G. Sustainable strategies for managing bacterial panicle blight of rice. In Protecting Rice Grains in the Post-Genomics Era; Jia, Y., Ed.; InTech Open: London, 2019. [Google Scholar]
- Uddin, M.N.; Protic, I.A.; Tushar, A.S.M.; Hasan, M.; Saha, P.; Singha, U.R.; et al. First report of Burkholderia glumae causing bacterial panicle blight in rice in Bangladesh. Plant Dis. 2025, 109, 491. [Google Scholar] [CrossRef]
- Schaad, N.W.; Jones, J.B.; Chun, W. Laboratory guide for identification of plant pathogenic bacteria., 3rd ed.; American Phytopathological Society: St. Paul, 2001. [Google Scholar]
- Maeda, Y.; Hikichi, Y.; Tsuchiya, K.; Ura, H.; Minami, K. Multiplex PCR method for the simultaneous detection of Burkholderia glumae and B. gladioli. Int J Syst Evol Microbiol. 2006, 56, 1031–5. [Google Scholar] [CrossRef]
- Nandakumar, R.; Rush, M.C.; Shahjahan, A.K.M.; O’Reilly, K.M.; Groth, D.E. Bacterial panicle blight of rice in the southern United States caused by Burkholderia glumae and B. gladioli as determined by PCR and pathogenicity tests. Phytopathology. 2005, 95, S73. [Google Scholar]
- Shahjahan, A.K.M.; Rush, M.C.; Groth, D.E.; Clark, C.A. Panicle blight. Rice J. 2000, 15, 26–29. [Google Scholar]
- Aviv, Y.; Gal-Mor, O. Real-time reverse transcription PCR as a tool to study virulence gene regulation in bacterial pathogens. Curr Protoc Microbiol. 2018, 45, e61. [Google Scholar]
- Degrassi, G.; Devescovi, G.; Solis, R.; Steindler, L.; Venturi, V. Functional analysis of the plant beneficial Burkholderia cepacia strain R-25018 reveals the presence of new secretion systems. Planta. 2008, 227, 1201–13. [Google Scholar]
- Kang, Y.; Kim, J.; Kim, S.; Kim, H.; Lim, J.Y.; Kim, M.; et al. Proteomic analysis of the proteins regulated by HrpB from the plant pathogenic bacterium Burkholderia glumae BGR1. Proteomics. 2008, 8, 106–21. [Google Scholar] [CrossRef] [PubMed]
- Kim, J.; Kim, J.G.; Kang, Y.; Jang, J.Y.; Jog, G.J.; et al. Quorum sensing and the LysR-type transcriptional activator ToxR regulate toxoflavin biosynthesis and transport in Burkholderia glumae. Mol Microbiol. 2004, 54, 921–34. [Google Scholar] [CrossRef] [PubMed]
- Suzuki, F.; Sawada, H.; Azegami, K.; Tsuchiya, K. Molecular characterization of the tox operon involved in toxoflavin biosynthesis of Burkholderia glumae. J Gen Plant Pathol. 2004, 70, 97–107. [Google Scholar] [CrossRef]
- Matsuda, I.; Sato, Z. Studies on the toxin of Pseudomonas glumae, the causal agent of grain rot disease. Ann Phytopathol Soc Jpn. 1988, 54, 482–8. [Google Scholar]
- Kim, J.; Oh, J.; Choi, O.; Kang, Y.; Kim, H.; Goo, E.; Ma, J.; Nagamatsu, T.; Moon, J.S.; Hwang, I. Biochemical evidence for ToxR and ToxJ binding to the tox operons of Burkholderia glumae and mutational analysis of ToxR. J Bacteriol. 2009, 191, 4870–4878. [Google Scholar] [CrossRef]
- Frenken, L.G.; de Groot, A.; Tommassen, J.; Verrips, C.T. Role of the lipB gene product in the folding of the secreted lipase of Pseudomonas glumae. Mol Microbiol. 1993, 9, 579–89. [Google Scholar] [CrossRef]
- El Khattabi, M.; Van Gelder, P.; Bitter, W.; Tommassen, J. Role of the lipase-specific foldase of Burkholderia glumae as a steric chaperone. J Biol Chem. 2000, 275, 26885–91. [Google Scholar] [CrossRef]
- Davey, M.E.; O’Toole, G.A. Microbial biofilms: From ecology to molecular genetics. Microbiol Mol Biol Rev. 2000, 64, 847–867. [Google Scholar] [CrossRef]
- Kim, J.; Kang, Y.; Choi, O.; Jeong, Y.; Jeong, J.E.; Lim, J.Y.; et al. Regulation of polar flagellum genes is mediated by quorum sensing and FlhDC in Burkholderia glumae. Mol Microbiol. 2007, 64, 165–79. [Google Scholar] [CrossRef]
- Jang, M.S.; Goo, E.; An, J.H.; Kim, J.; Hwang, I. Quorum sensing controls flagellar morphogenesis in Burkholderia glumae. PLoS One. 2014, 9, e84831. [Google Scholar] [CrossRef]
- Abbott, D.W.; Boraston, A.B. Structural biology of pectin degradation by Enterobacteriaceae. Microbiol Mol Biol Rev. 2008, 72, 301–16. [Google Scholar] [CrossRef] [PubMed]
- Huang, Q.; Allen, C. An exo-poly-alpha-D-galacturonosidase, PehB, is required for wild-type virulence of Ralstonia solanacearum on tomato. J Bacteriol. 1997, 179, 7369–78. [Google Scholar] [CrossRef] [PubMed]
- Gonzalez, C.F.; Pettit, E.A.; Valadez, V.A.; Provin, E.M. Mobilization, cloning, and sequence determination of a plasmid-encoded polygalacturonase from a phytopathogenic Burkholderia (Pseudomonas) cepacia. Mol Plant Microbe Interact. 1997, 10, 840–51. [Google Scholar] [CrossRef] [PubMed]
- Cornelis, G.R.; Van Gijsegem, F. Assembly and function of type III secretory systems. Annu Rev Microbiol. 2000, 54, 735–74. [Google Scholar] [CrossRef]
- Lindgren, P.B. The role of hrp genes during plant-bacterial interactions. Annu Rev Phytopathol. 1997, 35, 129–52. [Google Scholar] [CrossRef]
- Protic, I.A.; Uddin, M.N.; Tushar, A.S.M.; Auyon, S.T.; Alvarez-Ponce, D.; Islam, M.R. First complete genome sequence of a bacterial panicle blight-causing pathogen, Burkholderia glumae, isolated from symptomatic rice grains from Bangladesh. BMC Genomic Data. 2024, 25, 73. [Google Scholar] [CrossRef]
- Protic, I.A.; Uddin, M.N.; Gorzalski, A.; et al. Comparative genomic analyses shed light on the introduction routes of rice-pathogenic Burkholderia gladioli strains into Bangladesh. BMC Genomics 2026. [Google Scholar] [CrossRef]
- Mirghasempour, S.A.; Huang, S.; Xu, W.; et al. First report of Burkholderia gladioli causing rice panicle blight and grain discoloration in China. Plant Dis. 2018, 102, 2635. [Google Scholar] [CrossRef]
- Tsushima, S.; Wakimoto, S.; Mogi, S. Selective medium for detecting Pseudomonas glumae Kurita et Tabei, the causal bacterium of grain rot of rice. Ann Phytopathol Soc Jpn. 1986, 52, 253–259. [Google Scholar] [CrossRef]
- Echeverri-Rico, J.; Restrepo, S.; Guerra-Sierra, A.; Escobar, C. Understanding the complexity of disease-climate interactions driving bacterial panicle blight of rice caused by Burkholderia glumae in Colombia. PLoS ONE. 2021, 16, e0252061. [Google Scholar] [CrossRef]
- Jacobs, J.L.; Fasi, A.C.; Ramette, A.; Smith, J.J.; Hammerschmidt, R.; et al. Identification and onion pathogenicity of Burkholderia cepacia complex isolates from the onion rhizosphere and onion field soil. Appl Environ Microbiol. 2008, 74, 3121–9. [Google Scholar] [CrossRef] [PubMed]
- Furuya, N.; Tsushima, S.; Kodama, M.; et al. Virulence variability of Burkholderia glumae isolates assessed by hypersensitive reaction and pathogenicity on rice and tobacco. J Phytopathol. 1997, 145, 121–128. [Google Scholar]
- Jung, W.S.; Lee, J.; Kim, M.I.; Ma, J.; Nagamatsu, T.; Goo, E.; et al. Structural and functional analysis of phytotoxin toxoflavin-degrading enzyme. PLoS One. 2011, 6, e22443. [Google Scholar] [CrossRef] [PubMed]
- Sierra, G. A simple method for the detection of lipolytic activity of microorganisms and some observations on the influence of the contact between cells and fatty substrates. Antonie Van Leeuwenhoek. 1957, 23, 15–22. [Google Scholar] [CrossRef]
- Winkler, U.K.; Stuckmann, M. Glycogen, hyaluronate, and some other polysaccharides greatly enhance the formation of exolipase by Serratia marcescens. J Bacteriol. 1979, 138, 663–70. [Google Scholar] [CrossRef]
- Starr, M.P.; Chatterjee, A.K.; Starr, P.B.; Buchanan, G.E. Enzymatic degradation of polygalacturonic acid by Yersinia and Klebsiella species in relation to clinical laboratory procedures. J Clin Microbiol. 1977, 6, 379–86. [Google Scholar] [CrossRef]
- Sambrook, J.; Fritsch, E.F.; Maniatis, T. Molecular Cloning: A Laboratory Manual., 2nd ed.; Cold Spring Harbor Laboratory Press, 1989. [Google Scholar]
- Bernfeld, P. Amylase β and α. In Methods in Enzymology; Colowick, S.P., Kaplan, N.O., Eds.; Academic Press: New York, 1955; Vol. 1, pp. 149–54. [Google Scholar]
- Lee, J.Y.; Park, J.W.; Kim, S.Y.; Park, I.M.; Seo, Y.S. Differential regulation of toxoflavin production and its role in the enhanced virulence of Burkholderia gladioli. Mol Plant Pathol. 2016, 17, 65–76. [Google Scholar] [CrossRef]
- Livak, K.J.; Schmittgen, T.D. Analysis of relative gene expression data using real-time quantitative PCR and the 2(-Delta Delta C(T)) method. Methods. 2001, 25, 402–8. [Google Scholar] [CrossRef]
- Kumar, S.; Stecher, G.; Suleski, M.; Sanderford, M.; Sharma, S.; Tamura, K. MEGA12: Molecular evolutionary genetic analysis version 12 for adaptive and green computing. Mol Biol Evol. 2024, 41, msae263. [Google Scholar] [CrossRef]
- Tamura, K.; Nei, M. Estimation of the number of nucleotide substitutions in the control region of mitochondrial DNA in humans and chimpanzees. Mol Biol Evol. 1993, 10, 512–26. [Google Scholar]
- Jungkhun, N.; de Farias, A.; Watcharachaiyakup, J.; Kositcharoenkul, N.; Ham, J.; Patarapuwadol, S. Phylogenetic characterization and genome sequence analysis of Burkholderia glumae strains isolated in Thailand as the causal agent of rice bacterial panicle blight. Pathogens. 2022, 11, 676. [Google Scholar] [CrossRef]
- Luo, B.; He, Y.Q.; Xu, Y.C.; Xie, G.L.; Li, B.; Lihui, X.; et al. Detection of Burkholderia glumae in asymptomatic rice seed in China. J Plant Pathol. 2007, 89, 309–312. [Google Scholar]
- Chien, C.C.; Chang, P.C. Bacterial panicle blight of rice in Taiwan. Plant Dis. 1987, 71, 938–941. [Google Scholar]
- Tsushima, S.; Naito, H.; Koitabashi, M. Population dynamics of Pseudomonas glumae, the causal agent of bacterial grain rot of rice, on leaf sheaths of rice plants in relation to disease development in the field. Ann Phytopathol Soc Jpn. 1996, 62, 108–13. [Google Scholar] [CrossRef]
- Burkholder, W.H. Sour skin, a bacterial rot of onion bulbs. Phytopathology. 1950, 40, 115–117. [Google Scholar]
- Sotokawa, M.; Takikawa, Y. Soft rot symptoms caused by Burkholderia spp. in onion bulbs. Plant Dis. 2004, 88, 1085–1090. [Google Scholar]
- Karki, H.S.; Kim, K.S.; Park, J.H.; et al. Diversities in virulence, antifungal activity, pigmentation, and DNA fingerprints among strains of Burkholderia glumae. Plant Pathol J. 2012, 28, 352–366. [Google Scholar] [CrossRef]
- Sato, Y.; Iiyama, K.; Shinjo, F. Phytotoxins produced by Burkholderia species: toxoflavin and tropolone. J Gen Plant Pathol. 1989, 55, 315–322. [Google Scholar]
- Iiyama, K.; Matsuda, I.; Tsushima, S.; et al. Toxoflavin production and virulence of Burkholderia glumae. Phytopathology. 1995, 85, 444–449. [Google Scholar]
- Chen, Q.; Lee, J.H.; Park, Y.W.; et al. Dissection of quorum-sensing genes in Burkholderia glumae reveals non-canonical regulation and the new regulatory gene tofM for toxoflavin production. PLoS ONE. 2012, 7, e52150. [Google Scholar] [CrossRef]
- Lee, J.H.; Paudel, S.; Kim, H.; et al. A membrane protein of the rice pathogen Burkholderia glumae, DbcA, is required for quorum sensing by regulating cellular pH. Mol Plant Pathol. 2023, 24, 1153–1165. [Google Scholar]
- Voget, S.; Bolchi, A.; Li, W.; et al. Mutations improving production and secretion of extracellular lipase by Burkholderia glumae PG1. Appl Microbiol Biotechnol. 2016, 100, 1265–1273. [Google Scholar] [CrossRef]
- Hwang, I.S.; Hwang, B.K. Characterization of an extracellular lipase and its role in the virulence of Pseudomonas syringae pv. syringae. Mol Plant Microbe Interact. 2011, 24, 767–779. [Google Scholar]
- Lee, H.H.; Kim, J.; Park, H.; Kang, J.; Lee, J. Pan-genome analysis reveals host-specific functional diversification in Burkholderia gladioli. Microorganisms. 2021, 9, 1062. [Google Scholar] [CrossRef]
- Nickzad, A.; Lépine, F.; Déziel, E. Quorum sensing controls swarming motility of Burkholderia glumae through regulation of rhamnolipids. PLoS ONE. 2015, 10, e0128509. [Google Scholar] [CrossRef]

| Isolate IDa | Species | Pathogenicity testb | Disease severityc (0-9 scale) |
|
|---|---|---|---|---|
| Seedling | Panicle | |||
| BD_21g | B. glumae | +++ | +++ | 9.0 ± 0a*** |
| BDBgla132A | B. gladioli | +++ | +++ | 8.2 ± 0.23ab*** |
| BDBgla117A | B. gladioli | +++ | +++ | 7.8 ± 0.23ab*** |
| BDBgla135A | B. gladioli | +++ | +++ | 8.0 ± 0.31ab*** |
| BDBgla122A | B. gladioli | +++ | +++ | 7.9 ± 0.27ab*** |
| BDBgla78A | B. gladioli | ++ | +++ | 7.2 ± 0.12ab*** |
| BDBgla119A | B. gladioli | ++ | +++ | 7.3 ± 0.18b*** |
| BDBgla136A | B. gladioli | ++ | +++ | 7.5 ± 0.58de*** |
| BDBgla59A | B. gladioli | ++ | +++ | 7.0 ± 0.12bc*** |
| BDBgla150A | B. gladioli | + | ++ | 7.6 ± 0.31bc*** |
| BDBgla81A | B. gladioli | + | ++ | 5.7 ± 0.24bcd*** |
| BDBgla120A | B. gladioli | + | ++ | 5.9 ± 0.58cde*** |
| BDBgla140A | B. gladioli | + | ++ | 5.7 ± 0.29de*** |
| BDBgla83A | B. gladioli | + | ++ | 5.6 ± 0.31de*** |
| BDBgla79A | B. gladioli | + | ++ | 5.2 ± 0.12e*** |
| BDBgla130A | B. gladioli | + | ++ | 5.1 ± 1.16e*** |
| BDBgla38A | B. gladioli | + | ++ | 5.5 ± 0.35e*** |
| BDBgla162A | B. gladioli | 0 | + | 3.7 ± 0.29f*** |
| BDBgla151A | B. gladioli | 0 | + | 2.5 ± 0.73f*** |
| BDBgla41A | B. gladioli | 0 | + | 2.7 ± 0.87f*** |
| Control | Sterile water | 0 | 0 | 0.0 ± 0g |
| Virulence factor | Gene | Gene accession (BDBgla132A) |
Gene accession (BD_21g) |
Protein identity (%) |
|---|---|---|---|---|
| Toxoflavin | toxA | WP_047837656.1 | WP_230674340.1 | 96.23 |
| toxB | WP_013696509.1 | WP_042967738.1 | 98.11 | |
| toxC | WP_186032113.1 | WP_012733473.1 | 97.51 | |
| toxD | WP_186146217.1 | WP_012733474.1 | 96.63 | |
| toxE | WP_186044336.1 | WP_017922993.1 | 71.07 | |
| toxF | WP_186146218.1 | WP_012733469.1 | 92.67 | |
| toxG | WP_186012765.1 | WP_012733468.1 | 92.08 | |
| toxH | WP_439968039.1 | WP_251107611.1 | 97.48 | |
| toxI | WP_439967532.1 | WP_230674341.1 | 44.35 | |
| toxJ | WP_047838500.1 | WP_012733464.1 | 77.50 | |
| toxR | WP_047837657.1 | WP_012733470.1 | 96.01 | |
| Lipase | lipA | WP_047838330.1 | WP_012733585.1 | 88.55 |
| lipB | WP_440015440.1 | WP_251107590.1 | 80.71 | |
| Polygalacturonase | pehA | WP_186012903.1 | WP_017922174.1 | 84.53 |
| pehB | WP_439967530.1 | WP_017423921.1 | 87.35 | |
| Chemotaxis and flagella | cheA | WP_440017944.1 | WP_251107216.1 | 97.22 |
| cheB | WP_047836241.1 | WP_012734288.1 | 96.06 | |
| cheD | WP_036029515.1 | WP_012734287.1 | 93.07 | |
| cheR | Absent | - | - | |
| cheW | WP_043219446.1 | WP_012734284.1 | 92.57 | |
| cheY | WP_013696282.1 | WP_012734289.1 | 96.18 | |
| cheY1 | WP_013696275.1 | WP_302074279.1 | 80.80 | |
| cheZ | WP_047836242.1 | WP_012734290.1 | 84.52 | |
| flhA | WP_036038249.1 | WP_012734295.1 | 95.86 | |
| flhB | WP_013696287.1 | WP_100556214.1 | 89.72 | |
| flhC | WP_013696272.1 | WP_012734279.1 | 96.72 | |
| flhD | WP_025099997.1 | WP_043226645.1 | 96.23 | |
| flhF | WP_440017650.1 | WP_251107218.1 | 93.19 | |
| flhG | WP_013696290.1 | WP_012734297.1 | 84.39 | |
| fliA | WP_013696291.1 | WP_017433111.1 | 95.67 | |
| fliC | WP_186011140.1 | WP_100556208.1 | 90.10 | |
| fliD | WP_047836234.1 | WP_012734272.1 | 66.92 | |
| motA | WP_013696273.1 | WP_012734280.1 | 96.50 | |
| motB | Absent | - | - | |
| tsr | Absent | - | - |
Disclaimer/Publisher’s Note: The statements, opinions and data contained in all publications are solely those of the individual author(s) and contributor(s) and not of MDPI and/or the editor(s). MDPI and/or the editor(s) disclaim responsibility for any injury to people or property resulting from any ideas, methods, instructions or products referred to in the content. |
© 2026 by the authors. Licensee MDPI, Basel, Switzerland. This article is an open access article distributed under the terms and conditions of the Creative Commons Attribution (CC BY) license (http://creativecommons.org/licenses/by/4.0/).


