Submitted:
14 January 2026
Posted:
14 January 2026
You are already at the latest version
Abstract
DNA methylation is a conserved regulatory mechanism of gene expression, genome stability, and development. DNA methylation modifications relate to effective induc-tion of defense responses for plant priming. In the Green Deal era, using plant defense inducers, compounds that activate defense and prime plants against imminent patho-gens attacks, is a safe and environmentally sustainable approach to support plants against pathogens. Here, salicylic acid loaded in chitosan nanoparticles, influenced hypomethylation on specific genomic regions that corresponded to defense-related genes, such as pectin lyases, defensins and leucine-rich repeat transmembrane protein kinases against the biotrophic fungal pathogen Podosphaera xanthii. A genomic region of the promoter of SKP1A, a core member of the SCF E3 ubiquitin ligase complex, was found to be a significantly hypomethylated DMR. Examination of this DMR revealed the presence of salicylic acid-, auxin-, and defense-related cis-elements. Investigation of proteins associated with the above cis-elements showed significant expression upreg-ulation after salicylic acid application. Moreover, association of the identified DMR with transcriptomics showed significant enrichment of the salicylic acid pathway. Overall, these findings shed light on the epigenetic mechanisms that underly salicylic acid- re-lated defense priming in plants.
Keywords:
biotrophic pathogens
; differentially methylated regions
; plant defense inducer
; priming
; salicylic acid
; ubiquitination
; whole genome bisulfite sequencing (WGBS)
1. Introduction
DNA methylation is a highly conserved epigenetic mechanism across eukaryotes controlling numerous biological processes such as imprinting, tissue-specific gene expression, inactivation of transposable elements (TEs), paramutation, and stress responses [1]. DNA methylation involves the insertion of a methyl-group at the 5th position of a cytosine residue (5mC) and is a heritable and fundamental epigenetic modification, without altering the DNA nucleotide sequence but influencing the phenotype [2]. In eukaryotes, DNA methylation plays crucial roles in gene regulation and various biological processes that affect plant growth, development and adaptation [2]. While in mammals DNA methylation is predominately occurring in the symmetric CG context and non-CG methylation is prevalent in embryonic stem cells, in plants, DNA methylation occurs at symmetric CG and CHG and asymmetric CHH sites (where H is A, C, or T) [3,4]. The level of DNA methylation notably influences the structure and functionality of the plant genome. A considerable number of molecular mechanisms are affected by DNA methylation, such as transposable element silencing, gene expression regulation and genome stability maintenance, highlighting the importance of this process in the plant cell [5].
The dynamic and tight regulation of DNA methylation occurs by the interconnected action of DNA methyltransferases and demethylases. In plants, de novo DNA methylation can be established by the process of RNA-directed DNA methylation (RdDM) [6]. The RdDM is an RNA interference pathway where 24-nucleotide (24-nt) small interfering RNAs (siRNAs) target complementary DNA sequences and direct DNA methyltransferases to the marked region, directing DNA methylation and gene silencing. On the contrary, DNA demethylation exercises two distinct mechanisms. The first is passive DNA demethylation and is reported during gametophyte development in flowering plants, while the second mechanism is active DNA demethylation that involves the enzymatic removal of methylated cytosine and is initiated by a family of DNA glycosylases. DNA glycosylases remove the 5-methylcytosine base and subsequently cleave the DNA backbone at the abasic site, initiating a base excision repair (BER) pathway [7]. Active DNA demethylation is not only crucial for genome-wide epigenetic reprogramming but also mediates locus-specific gene activation during plant development [8].
A critical molecular result of DNA methylation is the regulation of gene expression. Usually, due to the promoter region methylation, the binding of transcription activators is prevented, leading to the inactivation or reduction of transcription [9]. In addition, regulation of gene expression can be associated with the cooperation of different epigenetic mechanisms that influence each other, for example, DNA methylation and histone modifications. The N-terminal tails of histones undergo numerous modifications that are promoted by specific enzymes. Some of these modifications, such as histone acetylation or H3 lysine 4 [9,10mono-methylation (H3K4me1), relax the chromatin, thus facilitating the transcription [9,10].
Plants, being sessile organisms, must deal with constantly changing environmental conditions in their habitat. For this purpose, plants possess a sophisticated network of response mechanisms that are functioning during exposure to external stimuli. Defense mechanisms are a major part of this network and are activated in response to pathogen attack [11]. This innate immune response operates through conserved signaling mechanisms, such as the recognition of microbe- or damage-associated molecular patterns (MAMPs or DAMPs), production of reactive oxygen and nitrogen species, and activation of the production of plant defense hormones, such as salicylic acid (SA) and jasmonic acid (JA) [11]. Together, these signaling events lead to a coordinated transcriptional response that regulates the production of defense signals, pathogenesis related proteins and antimicrobial metabolites [12].
Plants deploy several strategies to defend themselves against pests and pathogens. Key mechanisms are the default response of pattern-triggered immunity (PTI), that responds to microbial molecular patterns, and the evolutionary response of effector-triggered immunity (ETI), which is based on intracellular receptors that recognize immune-suppressive virulence effectors [13]. PTI and ETI are important layers of defense, but plants require additional strategies to survive in hostile environments. A key strategy is the development of acquired or induced resistance, that is forged when plants successfully repel initial assaults by pests or diseases, including immunological stress memory [14,15,16]. This phenomenon enhances stress resilience and is called “defense priming” involving the finely tuned regulation of phytohormone signaling, elevated levels of pattern recognition receptors or dormant defense regulatory elements, and chromatin modifications [17,18].
The memory of previous responses primes plants for forthcoming stress conditions, thereby triggering an earlier, faster and/or stronger reaction, leading to enhanced defense response [19]. Regulation of priming, by timing and amplitude of gene activation, is crucial for effective induction of defense responses. Evidence shows that priming is controlled by epigenetic changes, such as reduced transposon methylation and trimethylation of lysine 4 of histone subunit H3 (H3K4me3) at defense gene promoters. Recently, evidence has emerged showing that defense priming could be regulated by DNA methylation and chromatin modifications [20]. In Arabidopsis, mutants with impaired DNA methylation showed increased resistance to hemi-biotrophic pathogens and, in addition, infection by the hemi-biotrophic pathogen P. syringae pv. tomato (Pst) DC3000 reduced DNA methylation in Arabidopsis [21], revealing the interconnection between defense response and altered methylation landscape. Additionally, differential histone modifications have been shown to regulate the expression of NRPD2, a gene that encodes for the second largest subunit of the plant-specific RNA Polymerases IV and V, in Arabidopsis mutants with varying levels of immune response during infection by Pst DC3000 [22].
Priming of defense responses can be effectively acquired by the exogenous application of natural or synthetic compounds. There is a plethora of evidence in the literature showing that hormones such as salicylic acid (SA), and jasmonic acid (JA), chemical compounds such as β-aminobutyric acid (BABA), benzothiadiazole (BTH) and acibenzolar-S-methyl (ASM), many volatile organic compounds (VOCs) and chitosan, can effectively stimulate and prime defense responses against various plant pathogens (reviewed in [14,15,19]. Among these, SA applications have been shown to positively correlate with methylation changes for gene activation. Treatment of Vitis amurensis cell cultures with SA selectively reduced the cytosine DNA methylation of stilbene synthase (STS) genes and stimulated resveratrol production [23], while SA application in tobacco decreased pectin methylation leading to reduced cell wall Cd accumulation [24].
Until today, even though there is information about the mechanisms by which DNA methylation regulates plant immunity, the knowledge on the methylation changes that govern the activation of defense priming by exogenous application of bioactive compounds is limited. In this work, we analyzed the DNA methylation response of Arabidopsis thaliana plants after inoculation with the biotrophic fungal pathogen Podosphaera xanthii, the application of salicylic acid applied by a chitosan nanoparticle delivery system, and the combination of both treatments. In previous work, we have seen that salicylic acid loaded in chitosan nanoparticles (SA-CNPs) can significantly positively regulate both transcriptome and proteome in favor of inducing defense against P. xanthii and upregulate the salicylic acid defense pathway [25]. Here, our results revealed that SA-CNPs treatment caused targeted hypomethylation that varied both in methylation context (CpG or CHG) and in intensity with and without pathogen infection. Moreover, integration of the Whole Genome Bisulfite Sequencing (WGBS) results with previous proteomic and transcriptomic data, functionally analyzed the genes corresponding to the identified Differentially Methylated cytosines (DMCs).
This study expands our knowledge on the underlying molecular mechanisms governing defense priming, shows how enhancement of the immune responses in infected plants can be achieved through epigenetic changes, and provides candidates for their exploitation in crop biotechnological strategies.
2. Results
2.1. SA-CNPs Formulation Alters Specific Methylation Contexts in Arabidopsis with and Without Pathogen Inoculation
Previously, we have seen that SA-CNPs can efficiently induce defense responses and prime plants against P. xanthii at the very low concentration of 5ppm [25], while empty CNPs or chitosan showed reduced or similar effects in much higher concentrations (data not shown). Additionally, these results showed that SA-CNPs cause distinct changes both at transcriptional and at translational level compared to pathogen infection, indicating a defined To explore the underlying mechanism associated with gene activation after SA-CNPs, WGBS was performed in Arabidopsis plants treated with SA-CNPs, P. xanthii or a combination of both. An average of 23,481,495 million paired-end alignments corresponding to unique best hits were produced (Supplementary Table S1). To characterize global changes in DNA methylation which are indicative of the transcriptional activity status, examination of methylation enrichment around transcription start site (TSS) was performed using DeepTools [26]. The hypomethylation around TSS of Arabidopsis plants following the different treatments showed relative increase, especially after SA-CNPs, compared to control conditions, that could indicate transcription activation (Figure 1A). To evaluate methylation profiles between treatments, pair wise comparisons of interest were performed for each cytosine methylation context (CpG, CHG or CHH). The results showed that in the Px vs control comparison only the CHG methylation context differed between treatments, in SA-CNPs vs control was the CpG context, in SA-CNPs vs Px was the CHG context and in SA-CNPs/Px vs Px was the CHG methylation context (Figure 1B; Supplementary Figure S2).
To identify significant alterations in DNA methylation between treatments, we performed paired t-tests, and cytosines were considered significantly differentially methylated if q (FDR corrected p-value) <0.05 and absolute differential methylation percentage was more than 20%. In the Px vs control comparison, 11,453 DMCs were hypomethylated and only 325 DMCs were hypermethylated, while in the SA-CNPs vs control comparison, 9,434 DMCs were hypermethylated and 7,538 DMCs were hypermethylated, indicating a 96% increase in hypermethylation caused by the SA-CNPs, compared to pathogen inoculation (Figure 1C, D). A profound difference between the two treatments was the level of differential cytosine methylation. Pathogen inoculation caused methylation changes up to 60% in hypo- and 35% in hypermethylation, while after SA-CNPs the changes reached 100% in both contexts (Figure 1C, D, Supplementary Figure S3), indicating high influence of the formulation on the epigenetic landscape of the plants. On the other hand, in the SA-CNPs/Px vs Px and SA-CNPs vs Px comparisons hypomethylated DMCs were similar in both number and percentage level. Particularly, hypomethylated DMCs were 261 and 292 in number respectively with 43% differential methylation level, and hypermethylated DMCs were 3,435 and 6,254 respectively with 55% differential methylation level (Figure 1E, F, Supplementary Figure S3). The 1.8-fold increased numbers of hypermethylated DMCs in SA-CNPs vs Px compared to SA-CNPs/Px vs Px, corroborated the potent effect that the formulation exerted in plant’s epigenetic background.
2.2. Distinct Genomic Regions Have Altered Methylation Imprint After SA-CNPs or P. xanthii
Genome-wide distribution analysis of the DMCs showed that each treatment caused both similar and distinct hypomethylation patterns in different genomic regions of the Arabidopsis plants. P. xanthii infection-induced hypomethylation changes involved promoters (42%) and intergenic regions (32%), while exons and introns followed with 24% and 2% respectively (Figure 2A). Application of SA-CNPs enhanced hypomethylation in exons reaching 42% and in introns reaching 8%, presenting a 1.75-fold and a 4-fold increase compared to the corresponding values after P. xanthii infection, respectively (Figure 2A). Moreover, promoter and intergenic regions containing DMCs were 34% and 15% hypomethylated, respectively, producing decreased 0.2-fold and 0.5-fold differences with the corresponding values after P. xanthii infection (Figure 2A). On the other hand, at SA-CNPs/Px vs Px and SA-CNPs vs Px comparisons, the regions containing DMCs showed almost identical hypomethylation (Figure2A). Hypermethylated DMCs were also observed after the treatments in the different genomic regions, following a similar pattern as hypomethylated DMCs (Supplementary Figure S4).
Counting the associated retrotransposons that were identified in DMCs, revealed that P. xanthii induced cytosine hypomethylation in 99 retrotransposons, while after SA-CNPs only 7 were identified (Figure 2B, Supplementary Table S2), demonstrating a targeted action of SA-CNPs on plant’s epigenome.
2.3. SA-CNPs Increase Hypomethylation of Defense-Related Genes Compared to P. xanthii
In depth analysis of the hypermethylated DMCs did not show any methylation enrichment in regions associated with functional genes after pathogen infection (Supplementary Table S3). On the other hand, SA-CNPs application induced cytosine hypermethylation in genomic regions associated with 10 genes (Supplementary Table S3). Among them were CAX9 (CATION CALCIUM EXCHANGER 3), an S-adenosyl-L-methionine-dependent methyltransferases superfamily protein (AT1G31850), ETL1 (CHROMATIN REMODELING 19) and LCR69, a defensin-like protein. Hypomethylated DMCs gave more prominent results. Annotation of the functional genes associated with the significant hypomethylated DMCs revealed 56 associated genes with more than 15 DMCs after SA-CNPs application and 23 associated genes after pathogen infection (Supplementary Table S4). Among these were many defense-related genes such as leucine-rich repeat transmembrane protein kinases, pentatricopeptide repeat (PPR) superfamily proteins, pectin-related genes, ubiquitin-related genes and a defensin that were influenced by SA-CNPs, while P. xanthii caused moderate response of a ubiquitin-related gene, a pectin-lyase, two defensins and four Ulp1 proteases (Supplementary Table S4).
The hypomethylated DMCs were present in the promoter, the gene body or both of the associated identified genes (Figure 2C, D). Notably, the number of DMCs associated with genes was higher in SA-CNPs vs control, reaching even 92 hypomethylated DMCs in the promoter region of AT1G75950, corresponding to SKP1-like 1A, an E3 ubiquitination ligase protein involved in the SCF E3 ubiquitin ligase complex for subsequent proteasomal degradation of target proteins. The same genomic region showed only 29 hypomethylated DMCs after pathogen infection, indicating a mild effect of P. xanthii to the methylated marks on this region, compared to SA-CNPs application (Figure 2C, D, Supplementary Table S4). The second more hypomethylated gene present in both treatments was AT4G32375, a pectin lyase-like superfamily protein with 69 DMCs after SA-CNPs and 28 after P. xanthii treatments (Figure 2C, D, Supplementary Table S4).
2.4. Hypomethylated DMR that is Associated with SKP1A Contains Defense-Related Cis-Elements
Search for differentially methylated regions (DMRs) after SA-CNPs treatment that would contain the identified DMCs, revealed four hypomethylated DMRs with mC / totalC ratio more than 0.2 that were related with defense responses (Supplementary Table S5).The DMRs were the promoter region of SKP1A gene, the gene body of a defensin-like (AT2G22805), the promoter region of a shikimate kinase like 2 (SKL2) that enhances resistance under stress conditions, and a disease resistance protein of the TIR-NBS-LRR class (AT4G08450) that acts as an immune receptor against pathogens. Among these, only the corresponding SKP1A gene showed prominent differential expression after SA-CNPs treatment (Supplementary Figure S5), and specifically at the protein level, and it was analyzed further.
Use of SeqMonk (https://www.bioinformatics.babraham.ac.uk/projects/seqmonk/) for visualization of DNA methylation distribution and examination by PlantCARE (https://bioinformatics.psb.ugent.be/webtools/plantcare/html/) for cis-elements annotation, revealed the presence of 27 cis-element groups in the 1,091 bp genomic region of SKP1A (Supplementary Figure S6). Among these, important defense related cis-elements such as the SA-responsive TCA- element, the auxin-response AuxRR-core- regulatory element and the TC-rich repeats element, involved in defense and stress responsiveness, were present in the promoter of SKP1A (Figure 3A, Supplementary Figure S6). Quantification of the DNA methylation by SeqMonk showed high methylation under control conditions, significantly reduced methylation after SA-CNPs application or P. xanthii infection and even more reduced methylation after combination of both treatments (Figure 3B).
Examination of SKP1A and other E3 ubiquitin ligases in protein expression profiles from all treatments (control, P. xanthii, SA-CNPs application, combination of P. xanthii and SA-CNPs application) showed upregulated expression of 10 out of 16 of the identified proteins (62.5%) after SA-CNPs application, including SKP1A (Figure 3C, Supplementary Table S6). Additionally, 8 out of the 16 identified proteins (50%) are components of the SCF E3 ubiquitin ligase complex or direct mediators of the complex to the proteasome (Supplementary Table S6).
2.5. Up-Regulation of Proteins Involved with Defense-Related Cis-Elements
Protein expression profiles from all treatments (control, P. xanthii, SA-CNPs application, combination of P. xanthii and SA-CNPs application) showed prominent correlation of proteins associated with the above identified cis-regulatory elements in the analyzed DMR and other defense related protein groups. The examined proteins were associated with functions related to SA, auxin, defense response, methyl jasmonate, elicitors, and abscisic acid (ABA) (Figure 4). Remarkably, almost all protein groups displayed a similar expression pattern between treatments were at control conditions proteins showed the lowest expression levels, followed by P. xanthii, the application of SA-CNPs and finally the combination of P. xanthii and SA-CNPs application showed the higher expression levels (Figure 4A-E). ABA related proteins showed similar expression patterns also except from an inverted pattern between P. xanthii and SA-CNPs application (Figure 4F).
2.6. Hypomethylation After SA-CNPs Application Is Associated with SA-Related Up-Regulated Gene Expression
Integration of the genes corresponding to hypomethylated DMCs, in the SA-CNPs vs control comparison (>5 DMCs and >25% differential hypomethylation), with the upregulated differentially expressed genes (DEGs) previously identified in this comparison [25] under the same experimental conditions, revealed 40 genes common in both gene groups (Figure 5A). Among these was AT1G35230 coding for AGP5 (ARABINOGALACTAN PROTEIN 5) with 40 DMCs and 5.1-fold change (FC), AT4G04540 coding for CRK39 (CYSTEINE-RICH RECEPTOR-LIKE PROTEIN KINASE 39) with 13 DMCs and 8.7 FC, and AT1G51800 coding for IOS1, an LRR receptor-like serine/threonine-protein kinase, with 8 DMCs and 4.2 FC (Figure 5B, Supplementary Table S7). Interestingly, gene ontology (GO) enrichment analysis of the common genes group in Cytoscape (Shannon et al., 2003) at medium to global network specificity and pathway P value ≤ 0.05, showed that THI2.1 (THIONIN2.1), GRP-3 (GLYCINE-RICH PROTEIN 3), EDS5 (ENHANCED DISEASE SUSCEPTIBILITY 5), PXMT1 (1,7-PARAXANTHINE METHYLTRANSFERASE) and CRK34 (CYSTEINE-RICH RECEPTOR-LIKE PROTEIN KINASE), representing 12.5% of the examined genes, enriched the GO term ‘response to salicylic acid’ (Figure 5C).
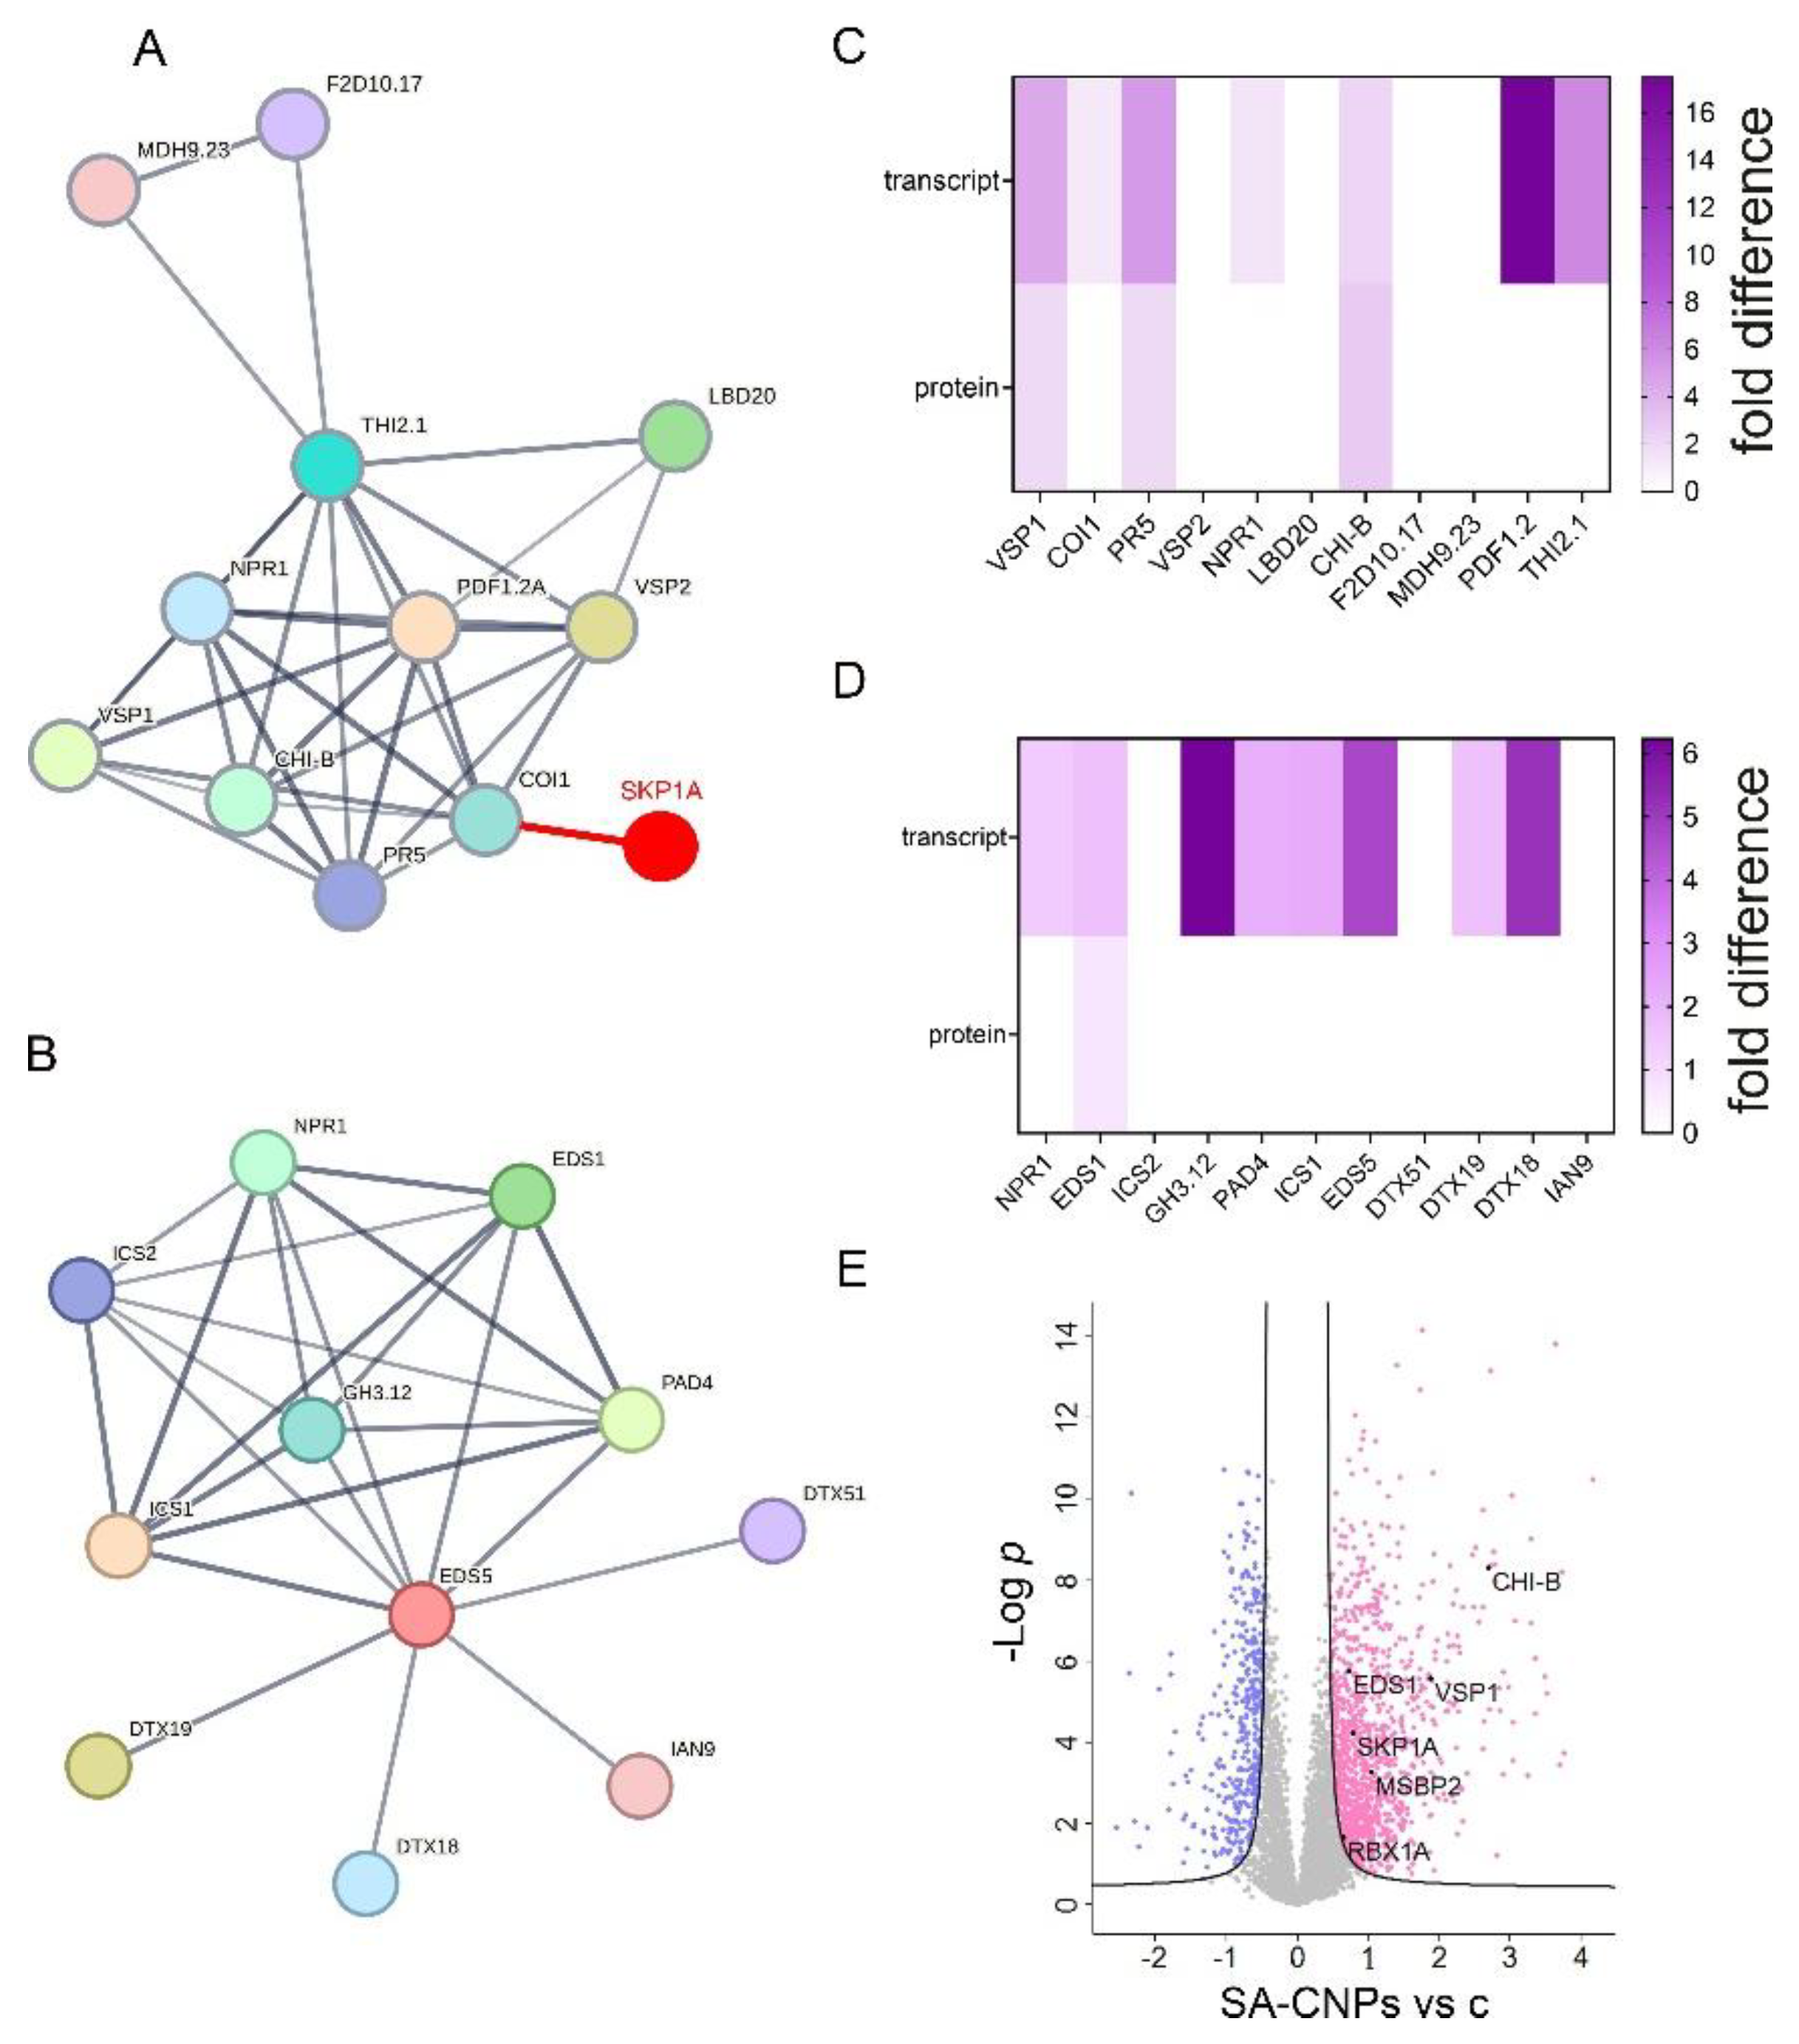
Subjecting individually these five genes to functional protein association network analysis by the STRING platform (https://string-db.org/), showed that only THI2.1 and EDS5 could construct a protein-protein interaction network with 10 highly significant primary protein interactors (Figure 6A, B, Supplementary Figure S7), indicating that their expression is greatly associated with the expression of the interacting proteins. Among these, were proteins highly related to salicylic acid, such as the key SA immune regulator NPR1, PATHOGENESIS-RELATED PROTEIN 5 (PR5), ENHANCED DISEASE SUSCEPTIBILITY 1 (EDS1) and PHYTOALEXIN DEFICIENT 4 (PAD4). In the same context, searching for interacting proteins of the SKP1A protein that corresponds to the hypomethylated DMR, we found that among the primary 10 interactors were COI1 (CORONATINE-INSENSITIVE PROTEIN 1) that is shown to interact with THI2.1 (Figure 6A, Supplementary Figure S8). Expression analysis of the interacting proteins in both groups at transcriptional and translational level demonstrated enhanced transcript accumulation to almost all genes between groups and high protein expressions in only VSP1 (VEGETATIVE STORAGE PROTEIN 1), PR5, CHI-B (BASIC ENDOCHITINASE B) and EDS1 (Figure 6C, D). Notably, in this examined SA-CNPs vs control comparison, SKP1A along with one of its primary interactors RBX1A (Supplementary Figure S8), showed significantly upregulated protein expression (Figure 6E).
3. Discussion
In this study, we aimed to characterize the DNA methylation response to an inducer of resistance and to the biotrophic pathogen P. xanthii in Arabidopsis thaliana using whole-genome bisulfite sequencing and associate these findings with proteomic and transcriptomic data. By identifying specific DNA hypomethylation changes in response to application of salicylic acid conjugated to chitosan nanoparticles and demonstrating connection with gene and protein expression, we provide new insights into the integration of methylome plasticity with priming of defense responses. Our evaluation of the Arabidopsis methylome plasticity upon induction of resistance and pathogen infection allowed the discovery of distinctive loci participating in shaping defense responses. Moreover, we identified significant hypomethylation in SKP1A locus, a member of the SCF E3 ubiquitin ligase complex, to be associated with upregulated salicylic acid-related gene and protein expression. Our study highlights the importance of the DNA methylation landscape in defense response mechanisms and its functional implications in induced resistance.
3.1. The Arabidopsis Methylome Marks Respond to Treatments
The effect of pathogen infection on DNA methylation has been examined in Arabidopsis and other species especially for bacterial pathogens, such as the hemi-biotrophic bacterium Pseudomonas syringae, showing that promoters of defense-related genes can be hypomethylated leading to gene activation and resistance upregulation [27,28,29,30]. Studies on fungal pathogens such as Fusarium oxysporum and the necrotrophic fungus Botrytis cinerea, mainly focused on DNA demethylase or RdDM Arabidopsis mutants respectively, showing increased susceptibility to pathogen infection [22,31]. Additionally, there are evidence in citrus plants that DNA methylation changes are associated with defense mechanisms against gummosis caused by the oomycete Phytophthora citrophthora [32]. Our evidence presenting hypomethylation in Arabidopsis after infection by the obligate biotrophic fungal pathogen P. xanthii are in accordance with results in wheat progenitor Aegilops tauschii where Blumeria graminis f. sp. tritici infection caused also hypomethylation in DMRs [33], demonstrating similar response against powdery mildew disease.
Plant defense inducers (PDIs) mimic pathogen attack inducing common defense mechanisms indicating that DNA methylation could also be a key mechanism of PDIs in facilitating plants to induce resistance against pathogen infections by altering gene expression. Some PDIs have been identified to enhance plant resistance by altering methylome. In rice, application of 5-azadeoxycytidine, a DNA de-methylating agent, enhances plant resistance to the bacterial pathogen Xanthomonas [34]. Additionally, the chemical SAR inducer β-aminobutyric acid (BABA) was shown to enhance resistance to various pathogens, including P. syringae DC3000, B. cinerea, and the oomycete pathogen Peronospora parasitica, through affecting histone modifications and inducing expression of defensive genes [35,36,37]. These results are consistent with our findings where the exploration of the altered methylation landscape by WGBS after the application of SA-CNPs, that function as PDI, has broadened our knowledge of the hypomethylated DMRs and the activated genes during defense priming identifying new constituents of defense priming, such as SKP1A, at the methylation level.
3.2. Treatments Generate Specific Modifications of Methylation Marks on Arabidopsis Genomic Regions
Experiments have shown that promoters of defense-related genes may become hypomethylated, which could activate the genes and increase resistance [27,38]. Other examples of characteristic epigenomic alterations is after P. syringae infection in Arabidopsis thaliana, where H3K9 and H3K14 acetylation marks are deposited at promoters of defense-related genes [39,40]. In another work with the same P. syringae - A. thaliana system, elevated H3K4me3 marks have been found near the promoters of salicylic acid (SA)-responsive genes, representing a critical mechanism for systemic acquired resistance [41].
Studies on DNA methylation in Oryza sativa have shown hypomethylation of a long terminal repeat (LTR) region in the promoter of the rice blast resistance gene Pit that may be needed for higher Pit expression against the hemi biotrophic fungal pathogen Magnaporthe grisea [42]. Moreover, in another study in Oryza sativa the presence of hypomethylated regions that were predominantly associated with gene promoter regions were observed after the infection with the nematode Meloidogyne graminicola [43]. Our approach of estimation of cytosine methylation by WGBS suggests that defense responses to the biotrophic fungal pathogen P. xanthii may also be the result of methylation responses, in specific genomic regions. Evidence across crop varieties have shown that intergenic regions possess several regulatory regions of defense-responsive genes [44] and could include both junk DNA and functional elements, such as enhancers, the proximal promoter region or the untranslated region (UTR) of a gene [45].
Comparable methylation responses have been observed after the application of flg22, a well-studied peptide corresponding to the most conserved domain of the N-terminus epitope of the bacterial protein flagellin from Pseudomonas aeruginosa, that acts as a potent inducer of resistance in plants [43,46]. In this study, similar hypomethylation patterns in promoter, intergenic, exon or intron regions were induced after the application of SA-CNPs, P. xanthii infection or the combination of both, highlighting a universal regulatory effect of the methylome on Arabidopsis responses to the treatments.
3.3. SA-CNPs Application Enhances Hypomethylation in Defense-Related Cis Elements Associated with Ubiquitination and Cell Wall Modification Genes
The hypomethylated DMR in SA-CNPs samples was the promoter region of SKP1A (S-Phase Kinase-Associated Protein 1), core subunit of the SCF E3 ubiquitin ligase complex that is formed with CUL1 (CULLIN 1) and RBX1 (RING-BOX 1) to ubiquitinate and signal for proteasomal degradation F-box protein targets. The SCF complex plays a critical role in regulating plant immune responses through the ubiquitination pathway by regulating the degradation of negative regulators of plant defense responses [47,48]. There are examples reporting the involvement of SCF complex in plant immune responses against various pathogens, such as Tobacco mosaic virus (TMV) [49], F. oxysporum [50], Alternaria brassicicola [51] and Plectosphaerella cucumerina [52]. In these cases, the SCF complex was associated with auxin transport, salicylic or jasmonate signaling, or SAR responses assisting in host defense against the pathogen. In this study, we found that cis elements related to the abovementioned defense pathways were present on the promoter of SKP1A gene, indicating a direct activation mechanism of SKP1A for defense. In depth analysis of the hypomethylation patterns between treatments showed that SA-CNPs increased the level of hypomethylated DMCs and this increase correlated with upregulated expression of protein groups corresponding to the identified cis elements, substantiating the connection between defense and SKP1A hypomethylation. Moreover, increased expression of SKP1A protein after SA-CNPs application validated the positive regulation of its expression by induced hypomethylation on its promoter. These findings in combination with the observed RBX1 protein upregulation could suggest a direct connection of the SCF complex with induced defense mechanisms.
SA-CNPs-induced hypomethylation in DMRs is linked with the SA defense pathway
Salicylic acid is a multifaceted plant hormone that acts as a key signaling molecule priming plant defenses against biotrophic and hemibiotrophic pathogens. Biotic stresses induce the accumulation of SA in the nucleus as a defense signal [53], and its exogenous application has been observed to significantly enhance plant defense pathways [25,54]. Moreover, plant defense at the methylome and other epigenomic regulatory levels is influenced by SA, as it is shown to influence demethylation in pearl millet [55,56], increase H3Ac, H4Ac, H3K4me2, and H3K4me3 marks at the PR1 promoter facilitating its expression [57,58] and generate DNA methylation changes within repetitive sequences and transposons that can regulate neighboring genes in Arabidopsis [28].
Notably, SKP1A, the corresponding gene in the hypomethylated DMR after SA-CNPs application and component of the SCF (SKP1-CUL1-Fbox) E3 ubiquitin ligase complex, interacts with COI1 to negatively regulate the JA in favor of SA pathway by ubiquitinating COI1 and regulating its degradation [59]. So, even though SKP1A does not function directly within the SA pathway, it influences its activation by competing the JA pathway [60]. At the base of this, one could speculate that the induced SA pathway, after SA-CNPs application, activates SKP1A by hypomethylating its promoter to negatively regulate components of the JA pathway and antagonizes JA production in the crosstalk of these two hormones for better and enhanced defense responses against biotrophic pathogens. However, further work is needed to determine mechanistically how these pathways integrate under the prism of the methylation landscape and define the roles of the differentially expressed identified proteins.
4. Materials and Methods
4.1. Plant Material and Growth Conditions
A. thaliana Col-0 (wild-type) seeds were obtained from the Arabidopsis Stock Center and used in the experiments. The seeds were sterilized for 20 sec in 70% ethanol, followed by 1.5 min in 20% bleach solution, and rinsed five times with sterile water. The seeds were sown on half-strength Murashige and Skoog (MS) medium with 1% sucrose and 0.7% agar, stratified at 4 °C in the dark for 2 days, and transferred to a 23 °C growth chamber under long day (16 h light/8 h dark) conditions.
4.2. Chitosan Nanoparticles Application
Chitosan nanoparticles loaded with salicylic acid used in this study have been previously characterized [25]. A. thaliana Col-0 (wild-type) seeds were grown for 5 days in half-strength MS medium petri dishes and then transferred to half-strength MS medium square plates supplemented with 5ppm of SA-CNPs.
4.3. Pathogen Challenge Accompanied by Hormone Treatment
Pathogen artificial inoculation was performed with a 5μl high pressure spore suspension (107 spore/ml) of P. xanthii. The spore suspension was dropped onto the leaves of 12-d-old Arabidopsis plants grown on half-strength MS medium square plates supplemented with and without 5ppm SA-CNPs. All inoculated plants were incubated at 23 °C with a 16-h light:8-h dark photoperiod and 65% relative humidity. For WGBS analyses, treated and non-treated 14-d-old plants, with root excision, were collected in liquid nitrogen and stored in -80oC until use.
4.4. BS-Seq Library Construction and Genome Bisulfite Sequencing
Per sample, frozen plant tissue was grounded with liquid nitrogen and genomic DNA was isolated using the SDS procedure of the NucleoSpin Plant II DNA isolation kit (MachereyNagel, Germany). A NanoPhotometer® spectrophotometer (IMPLEN, CA, USA) and agarose gel electrophoresis were used to determine DNA concentration and integrity after the genomic DNA extraction. Next, DNA libraries were prepared for bisulfite sequencing using the NEBNext® Enzymatic Methyl-seq kit (NEB, Ipswich, MA, USA). All sequencing experiments were performed at Biomedical Research Foundation Academy of Athens on an Illumina NovaSeq 6000 sequencing system. Libraries were sequenced with 2 × 150 bp paired end reads at 30× coverage. According to NIH Roadmap Epigenomics Project the use of two biological replicates with a combined total coverage of 30× in sufficient for unbiased genome-wide DNA methylation profiling [61], as it is performed in this study.
4.5. Processing of Bisulfite-Treated Reads and Methylation Calling
The raw paired end reads were filtered for low quality reads (Q < 30) and adapter using Trimmomatic [62]. The quality filtered reads of each individual sample were aligned to Arabidopsis thaliana reference genome (https://www.ncbi.nlm.nih.govdatasets/ genome/GCF_000001735.4/) using bowtie 2 [63]. The reference genome was first converted in silico into bisulfite converted genome using Bismark tool [64] (https://www.bioinformatics.babraham.ac.uk/projects/bismark/). To maintain stringency only uniquely mapped reads were considered for further analysis. The reads mapping to the same start and end coordinates were considered duplicates and were removed using perl script deduplicate_bismark provided with the Bismark tool. The mapping file was examined to identify the presence of methylation bias (M-bias). If M-bias was detected, reads were trimmed for biased sequences (~ 10 bases from 5’ end) to eliminate M-bias. After mapping of the reads, the absolute methylation profile was obtained using Bismark Methyl Extractor and whole genome cytosine report was obtained using option –cytosine_report. A binomial test was executed on the comprehensive genome cytosine report, derived from the Bismark Methyl Extractor, to identify cytosines that were significantly methylated across the entire genome (Q < 0.05) for each sample. This analysis considered the computed non-conversion rate and a 5% false-positive sequencing error rate. The mCs represent the absolute profile of methylation per sample. The methylation level of each cytosine was defined as percentage of reads supporting methylation call to total number of reads covering that cytosine. These methylated cytosines were identified as cytosine having methylation percentage of at least 25% and covered by at five reads and were converted to bedGraph format for visualization. These methylated cytosines were further annotated against the Arabidopsis thaliana gene annotation file using BEDTools [65]. The detailed pipeline of bisulfite sequencing is shown in Supplementary Figure S1. The summary statistics of methylation data are shown in Supplementary Table S1.
4.6. Differential Methylation Analysis
The mapped files generated using Bismark were used to call for differential profiles in terms of differentially methylated cytosines (DMCs). To identify the differential methylation profile between the samples, pair wise comparison was performed for each cytosine methylation context (CpG, CHG or CHH) using four datasets: pathogen inoculation versus control (XvsC), nanoparticle application versus control (CNPs-SAvsC), pathogen inoculation and nanoparticle application versus pathogen inoculation (CNPs-SA/XvsX) and nanoparticle application versus pathogen inoculation (CNPs-SAvsΧ). The differential methylation annotation and analysis was performed using the R package methylKit [66]. Only those mCs which were covered by a minimum of 5 reads with Q > 30 in each comparison set were considered for analysis. The coverage of each cytosine was normalized using option ‘normalizeCoverage’ to ensure accuracy in comparisons. The differential methylation was then called using logistic regression controlling for overdispersion (variability among samples). The significance of the differential methylation was assessed using Fisher’s exact test (P < 0.05) and corrected for multiple comparisons. Methylation percentage was estimated as: 100*(methylated cytosine/ (methylated cytosine + unmethylated cytosine)) for every cytosine in each of the three methylation contexts. The sites that had methylation percentage difference greater than 25% and an FDR < 0.05 were considered as differentially methylated. The DMCs were identified and analyzed separately for each cytosine methylation context. For DMR identification, only regions with a minimum of fifteen (15) cytosines and a frequency (number of methylated cytosines per total cytosines on DMR length) higher than 0.2 were kept for further analysis.
4.7. Protein Differential Expression
The protein extraction, digestion and identification has been previously described [25]. The results generated were processed statistically and visualized in the Perseus software (1.6.15.0) [67]. Values were log2 transformed, a threshold of 70% of valid values in at least one group was applied and the missing values were replaced from normal distribution. For statistical analysis, Student’s t-test was performed, and permutation-based FDR was calculated.
Supplementary Materials
The following supporting information can be downloaded at the website of this paper posted on Preprints.org, Figure S1. Bisulfite sequencing pipeline. Figure S2. Pair wise comparisons for each cytosine methylation context (CpG, CHG or CHH) between treatments. Figure S3. Levels of differential cytosine methylation after pathogen infection or SA-CNPs application. Figure S4. Hypermethylated DMCs results after the treatments in the different identified genomic regions. Figure S5. Protein expression levels of SKP1A in the SA-CNPs versus control comparison. Figure S6. PlantCARE analysis for cis-elements annotation in the identified DMR genomic region of the SKP1A gene. Figure S7. Protein-protein association networks of the CRK34, GRP-3 and PXMT1 protein. Figure S8. Protein-protein association network of the SKP1A protein. Table S1. Summary statistics of methylation mapping. Table S2. List of identified retrotransposons in the Px vs control and SA-CNPs vs control comparisons. Table S3. Annotation of the functional genes associated with hypermethylated DMCs. Table S4. Annotation of the functional genes associated with hypomethylated DMCs. Table S5. List of the genes corresponding to the genomic regions containing the identified DMCs and the statistical results for DMR annotation. Table S6. List of identified E3 ubiquitin ligase proteins in the Arabidopsis protein pool. Table S7. List of genes common in hypomethylated DMCs, in the SA-CNPs vs control comparison, and in upregulated differentially expressed genes.
Author Contributions
TM, and EM: conceptualization. TM, SF, and MS: formal analysis. TM: performed experiments, visualization, and data curation. SF and GV: performed whole genome bisulfite sequencing. TM: data interpretation. TM: writing—original draft. TM, SF, MS, GV and EM writing—review and editing. TM and EM supervised the entire research. EM acquired the funding and administered the project.
Funding
This work was funded by the Nanoshield project (Τ2ΕDΚ-02113) of the Operational Program “Competitiveness, Entrepreneurship and Innovation” (NSRF 2014-2020) and Benaki Phytopathological Institute.
Data Availability Statement
All data produced in this study can become available upon request.
Acknowledgments
We acknowledge support of this work by the project “The Greek Research Infrastructure for Personalized Medicine (pMedGR)” (MIS 5002802) which is implemented under the Action “Reinforcement of the Research and Innovation Infrastructure”, funded by the Operational Program “Competitiveness, Entrepreneurship and Innovation” (NSRF 2014-2020) and co-financed by Greece and the European Union (European Regional Development Fund).
Conflicts of Interest
The authors declare no conflicts of interest.
References
- Qiao, S.; Song, W.; Hu, W.; Wang, F.; Liao, A.; Tan, W.; Yang, S. The role of plant DNA methylation in development, stress response, and crop breeding. Agronomy 2024, 15((1)), 94. [Google Scholar] [CrossRef]
- He, X.-J.; Chen, T.; Zhu, J.-K. Regulation and function of DNA methylation in plants and animals. Cell research 2011, 21((3)), 442–465. [Google Scholar] [CrossRef]
- Lister, R.; Pelizzola, M.; Dowen, R. H.; Hawkins, R. D.; Hon, G.; Tonti-Filippini, J.; Nery, J. R.; Lee, L.; Ye, Z.; Ngo, Q.-M. Human DNA methylomes at base resolution show widespread epigenomic differences. nature 2009, 462((7271)), 315–322. [Google Scholar] [CrossRef] [PubMed]
- Zhang, X.; Yazaki, J.; Sundaresan, A.; Cokus, S.; Chan, S. W.-L.; Chen, H.; Henderson, I. R.; Shinn, P.; Pellegrini, M.; Jacobsen, S. E. Genome-wide high-resolution mapping and functional analysis of DNA methylation in Arabidopsis. Cell 2006, 126((6)), 1189–1201. [Google Scholar] [CrossRef] [PubMed]
- Lucibelli, F.; Valoroso, M. C.; Aceto, S. Plant DNA methylation: an epigenetic mark in development, environmental interactions, and evolution. International Journal of Molecular Sciences 2022, 23((15)), 8299. [Google Scholar] [CrossRef]
- Chinnusamy, V.; Zhu, J.-K. RNA-directed DNA methylation and demethylation in plants. Science in China Series C: Life Sciences 2009, 52((4)), 331–343. [Google Scholar] [CrossRef]
- Li, Y.; Kumar, S.; Qian, W. Active DNA demethylation: mechanism and role in plant development. Plant cell reports 2018, 37((1)), 77–85. [Google Scholar] [CrossRef] [PubMed]
- Hsieh, T.-F.; Ibarra, C. A.; Silva, P.; Zemach, A.; Eshed-Williams, L.; Fischer, R. L.; Zilberman, D. Genome-wide demethylation of Arabidopsis endosperm. Science 2009, 324((5933)), 1451–1454. [Google Scholar] [CrossRef]
- Medvedeva, Y. A.; Khamis, A. M.; Kulakovskiy, I. V.; Ba-Alawi, W.; Bhuyan, M. S. I.; Kawaji, H.; Lassmann, T.; Harbers, M.; Forrest, A. R.; Bajic, V. B. Effects of cytosine methylation on transcription factor binding sites. BMC genomics 2014, 15((1)), 119. [Google Scholar] [CrossRef]
- Wang, Z.; Ren, B. Role of H3K4 monomethylation in gene regulation. Current opinion in genetics & development 2024, 84, 102153. [Google Scholar]
- Saijo, Y.; Loo, E. P. i.; Yasuda, S. Pattern recognition receptors and signaling in plant–microbe interactions. The Plant Journal 2018, 93((4)), 592–613. [Google Scholar] [CrossRef]
- Shiade, S. R. G.; Zand-Silakhoor, A.; Fathi, A.; Rahimi, R.; Minkina, T.; Rajput, V. D.; Zulfiqar, U.; Chaudhary, T. Plant metabolites and signaling pathways in response to biotic and abiotic stresses: Exploring bio stimulant applications. Plant Stress 2024, 12, 100454. [Google Scholar] [CrossRef]
- Yuan, M.; Ngou, B. P. M.; Ding, P.; Xin, X.-F. PTI-ETI crosstalk: an integrative view of plant immunity. Current opinion in plant biology 2021, 62, 102030. [Google Scholar] [CrossRef]
- Martinez-Medina, A.; Flors, V.; Heil, M.; Mauch-Mani, B.; Pieterse, C. M.; Pozo, M. J.; Ton, J.; van Dam, N. M.; Conrath, U. Recognizing plant defense priming. Trends in plant science 2016, 21((10)), 818–822. [Google Scholar] [CrossRef] [PubMed]
- Mauch-Mani, B.; Baccelli, I.; Luna, E.; Flors, V. Defense priming: an adaptive part of induced resistance. Annual review of plant biology 2017, 68, 485–512. [Google Scholar] [CrossRef] [PubMed]
- Conrath, U.; Beckers, G. J.; Flors, V.; García-Agustín, P.; Jakab, G.; Mauch, F.; Newman, M.-A.; Pieterse, C. M.; Poinssot, B.; Pozo, M. J. Priming: getting ready for battle. Molecular plant-microbe interactions 2006, 19((10)), 1062–1071. [Google Scholar] [CrossRef]
- Conrath, U.; Beckers, G. J.; Langenbach, C. J.; Jaskiewicz, M. R. Priming for enhanced defense. Annual review of phytopathology 2015, 53((1)), 97–119. [Google Scholar] [CrossRef] [PubMed]
- Hannan Parker, A.; Wilkinson, S. W.; Ton, J. Epigenetics: a catalyst of plant immunity against pathogens. New Phytologist 2022, 233((1)), 66–83. [Google Scholar] [CrossRef]
- Hönig, M.; Roeber, V. M.; Schmülling, T.; Cortleven, A. Chemical priming of plant defense responses to pathogen attacks. Frontiers in Plant Science 2023, 14, 1146577. [Google Scholar] [CrossRef]
- López Sánchez, A.; Stassen, J. H.; Furci, L.; Smith, L. M.; Ton, J. The role of DNA (de) methylation in immune responsiveness of Arabidopsis. The Plant Journal 2016, 88((3)), 361–374. [Google Scholar] [CrossRef]
- Yu, A.; Lepère, G.; Jay, F.; Wang, J.; Bapaume, L.; Wang, Y.; Abraham, A.-L.; Penterman, J.; Fischer, R. L.; Voinnet, O. Dynamics and biological relevance of DNA demethylation in Arabidopsis antibacterial defense. Proceedings of the National Academy of Sciences 2013, 110((6)), 2389–2394. [Google Scholar] [CrossRef]
- Lopez, A.; Ramírez, V.; García-Andrade, J.; Flors, V.; Vera, P. The RNA silencing enzyme RNA polymerase V is required for plant immunity. PLoS genetics 2011, 7((12)), e1002434. [Google Scholar] [CrossRef]
- Kiselev, K.; Tyunin, A.; Karetin, Y. Salicylic acid induces alterations in the methylation pattern of the VaSTS1, VaSTS2, and VaSTS10 genes in Vitis amurensis Rupr. cell cultures. Plant cell reports 2015, 34((2)), 311–320. [Google Scholar] [CrossRef] [PubMed]
- Jia, H.; Wang, X.; Wei, T.; Wang, M.; Liu, X.; Hua, L.; Ren, X.; Guo, J.; Li, J. Exogenous salicylic acid regulates cell wall polysaccharides synthesis and pectin methylation to reduce Cd accumulation of tomato. Ecotoxicology and environmental safety 2021, 207, 111550. [Google Scholar] [CrossRef]
- Margaritopoulou, T.; Kotsaridis, K.; Samiotaki, M.; Nastos, S.; Maratos, M.; Zoidakis, I.; Tsiriva, D.; Pispas, S.; Markellou, E. Antagonistic manipulation of ER-protein quality control between biotrophic pathogenic fungi and host induced defense. Plant Stress 2024, 14, 100693. [Google Scholar] [CrossRef]
- Ramírez, F.; Ryan, D. P.; Grüning, B.; Bhardwaj, V.; Kilpert, F.; Richter, A. S.; Heyne, S.; Dündar, F.; Manke, T. deepTools2: a next generation web server for deep-sequencing data analysis. Nucleic acids research Web Server issue. 2016, 44, W160. [Google Scholar] [CrossRef]
- Lee, S.; Choi, J.; Park, J.; Hong, C. P.; Choi, D.; Han, S.; Choi, K.; Roh, T.-Y.; Hwang, D.; Hwang, I. DDM1-mediated gene body DNA methylation is associated with inducible activation of defense-related genes in Arabidopsis. Genome biology 2023, 24((1)), 106. [Google Scholar] [CrossRef]
- Dowen, R. H.; Pelizzola, M.; Schmitz, R. J.; Lister, R.; Dowen, J. M.; Nery, J. R.; Dixon, J. E.; Ecker, J. R. Widespread dynamic DNA methylation in response to biotic stress. Proceedings of the National Academy of Sciences 2012, 109((32)), E2183–E2191. [Google Scholar] [CrossRef] [PubMed]
- Zhang, H.; Lang, Z.; Zhu, J.-K. Dynamics and function of DNA methylation in plants. Nature reviews Molecular cell biology 2018, 19((8)), 489–506. [Google Scholar] [CrossRef]
- Pavet, V.; Quintero, C.; Cecchini, N. M.; Rosa, A. L.; Alvarez, M. E. Arabidopsis displays centromeric DNA hypomethylation and cytological alterations of heterochromatin upon attack by Pseudomonas syringae. Molecular Plant-Microbe Interactions 2006, 19((6)), 577–587. [Google Scholar] [CrossRef]
- Le, T.-N.; Schumann, U.; Smith, N. A.; Tiwari, S.; Au, P. C. K.; Zhu, Q.-H.; Taylor, J. M.; Kazan, K.; Llewellyn, D. J.; Zhang, R. DNA demethylases target promoter transposable elements to positively regulate stress responsive genes in Arabidopsis. Genome biology 2014, 15((9)), 458. [Google Scholar] [CrossRef] [PubMed]
- da Silva, A. R.; da Costa Silva, D.; dos Santos Pinto, K. N.; Santos Filho, H. P.; Coelho Filho, M. A.; dos Santos Soares Filho, W.; Ferreira, C. F.; da Silva Gesteira, A. Epigenetic responses to Phytophthora citrophthora gummosis in citrus. Plant Science 2021, 313, 111082. [Google Scholar] [CrossRef]
- Geng, S.; Kong, X.; Song, G.; Jia, M.; Guan, J.; Wang, F.; Qin, Z.; Wu, L.; Lan, X.; Li, A. DNA methylation dynamics during the interaction of wheat progenitor Aegilops tauschii with the obligate biotrophic fungus Blumeria graminis f. sp. tritici. New Phytologist 2019, 221((2)), 1023–1035. [Google Scholar] [CrossRef]
- Akimoto, K.; Katakami, H.; Kim, H.-J.; Ogawa, E.; Sano, C. M.; Wada, Y.; Sano, H. Epigenetic inheritance in rice plants. Annals of botany 2007, 100((2)), 205–217. [Google Scholar] [CrossRef]
- Martínez-Aguilar, K.; Ramírez-Carrasco, G.; Hernández-Chávez, J. L.; Barraza, A.; Alvarez-Venegas, R. Use of BABA and INA as activators of a primed state in the common bean (Phaseolus vulgaris L.). Frontiers in Plant Science 2016, 7, 653. [Google Scholar] [CrossRef]
- Zimmerli, L.; Métraux, J.-P.; Mauch-Mani, B. β-Aminobutyric acid-induced protection of Arabidopsis against the necrotrophic fungus Botrytis cinerea. Plant Physiology 2001, 126((2)), 517–523. [Google Scholar] [CrossRef] [PubMed]
- Zimmerli, L.; Jakab, G.; Métraux, J.-P.; Mauch-Mani, B. Potentiation of pathogen-specific defense mechanisms in Arabidopsis by β-aminobutyric acid. Proceedings of the national academy of sciences 2000, 97((23)), 12920–12925. [Google Scholar] [CrossRef]
- Lu, X.; Liu, Y.; Xu, J.; Liu, X.; Chi, Y.; Li, R.; Mo, L.; Shi, L.; Liang, S.; Yu, W. Recent progress of molecular mechanisms of DNA methylation in plant response to abiotic stress. Environmental and Experimental Botany 2024, 218, 105599. [Google Scholar] [CrossRef]
- Jiang, J.; Ding, A. B.; Liu, F.; Zhong, X. Linking signaling pathways to histone acetylation dynamics in plants. Journal of Experimental Botany 2020, 71((17)), 5179–5190. [Google Scholar] [CrossRef]
- Kumar, S.; Mohapatra, T. Dynamics of DNA methylation and its functions in plant growth and development. Frontiers in plant science 2021, 12, 596236. [Google Scholar] [CrossRef]
- Liu, Y.; Wang, J.; Liu, B.; Xu, Z. Y. Dynamic regulation of DNA methylation and histone modifications in response to abiotic stresses in plants. Journal of Integrative Plant Biology 2022, 64((12)), 2252–2274. [Google Scholar] [CrossRef]
- Hayashi, K.; Yoshida, H. Refunctionalization of the ancient rice blast disease resistance gene Pit by the recruitment of a retrotransposon as a promoter. The Plant Journal 2009, 57((3)), 413–425. [Google Scholar] [CrossRef]
- Atighi, M. R.; Verstraeten, B.; De Meyer, T.; Kyndt, T. Genome-wide DNA hypomethylation shapes nematode pattern-triggered immunity in plants. New Phytologist 2020, 227((2)), 545–558. [Google Scholar] [CrossRef]
- Tonnessen, B. W.; Bossa-Castro, A. M.; Martin, F.; Leach, J. E. Intergenic spaces: a new frontier to improving plant health. New Phytologist 2021, 232((4)), 1540–1548. [Google Scholar] [CrossRef] [PubMed]
- Galli, M.; Feng, F.; Gallavotti, A. Mapping regulatory determinants in plants. Frontiers in Genetics 2020, 11, 591194. [Google Scholar] [CrossRef] [PubMed]
- Mishina, T. E.; Zeier, J. Pathogen-associated molecular pattern recognition rather than development of tissue necrosis contributes to bacterial induction of systemic acquired resistance in Arabidopsis. The Plant Journal 2007, 50((3)), 500–513. [Google Scholar] [CrossRef]
- Duplan, V.; Rivas, S. E3 ubiquitin-ligases and their target proteins during the regulation of plant innate immunity. Frontiers in plant science 2014, 5, 42. [Google Scholar] [CrossRef] [PubMed]
- Marino, D.; Peeters, N.; Rivas, S. Ubiquitination during plant immune signaling. Plant physiology 2012, 160((1)), 15–27. [Google Scholar] [CrossRef]
- Liu, Y.; Schiff, M.; Serino, G.; Deng, X.-W.; Dinesh-Kumar, S. Role of SCF ubiquitin-ligase and the COP9 signalosome in the N gene–mediated resistance response to Tobacco mosaic virus. The Plant Cell 2002, 14((7)), 1483–1496. [Google Scholar] [CrossRef]
- Papathoti, N. K.; Saengchan, C.; Daddam, J. R.; Thongprom, N.; Tonpho, K.; Thanh, T. L.; Buensanteai, N. Plant systemic acquired resistance compound salicylic acid as a potent inhibitor against SCF (SKP1-CUL1-F-box protein) mediated complex in Fusarium oxysporum by homology modeling and molecular dynamics simulations. Journal of Biomolecular Structure and Dynamics 2022, 40((4)), 1472–1479. [Google Scholar] [CrossRef]
- Thomma, B. P.; Eggermont, K.; Penninckx, I. A.; Mauch-Mani, B.; Vogelsang, R.; Cammue, B. P.; Broekaert, W. F. Separate jasmonate-dependent and salicylate-dependent defense-response pathways in Arabidopsis are essential for resistance to distinct microbial pathogens. Proceedings of the National Academy of Sciences 1998, 95((25)), 15107–15111. [Google Scholar] [CrossRef] [PubMed]
- Llorente, F.; Muskett, P.; Sanchez-Vallet, A.; López, G.; Ramos, B.; Sanchez-Rodriguez, C.; Jorda, L.; Parker, J.; Molina, A. Repression of the auxin response pathway increases Arabidopsis susceptibility to necrotrophic fungi. Molecular plant 2008, 1((3)), 496–509. [Google Scholar] [CrossRef]
- Gao, Q.-M.; Zhu, S.; Kachroo, P.; Kachroo, A. Signal regulators of systemic acquired resistance. Frontiers in plant science 2015, 6, 228. [Google Scholar] [CrossRef]
- Zehra, A.; Meena, M.; Dubey, M. K.; Aamir, M.; Upadhyay, R. Synergistic effects of plant defense elicitors and Trichoderma harzianum on enhanced induction of antioxidant defense system in tomato against Fusarium wilt disease. Botanical Studies 2017, 58((1)), 44. [Google Scholar] [CrossRef]
- Ngom, B.; Sarr, I.; Kimatu, J.; Mamati, E.; Kane, N. A. Genome-wide analysis of cytosine DNA methylation revealed salicylic acid promotes defense pathways over seedling development in pearl millet. Plant Signaling & Behavior 2017, 12((9)), e1356967. [Google Scholar] [CrossRef]
- Ngom, B.; Mamati, E.; Goudiaby, M. F.; Kimatu, J.; Sarr, I.; Diouf, D.; Kane, N. A. Methylation analysis revealed salicylic acid affects pearl millet defense through external cytosine DNA demethylation. Journal of Plant Interactions 2018, 13((1)), 288–293. [Google Scholar] [CrossRef]
- Mosher, R. A.; Durrant, W. E.; Wang, D.; Song, J.; Dong, X. A comprehensive structure–function analysis of Arabidopsis SNI1 defines essential regions and transcriptional repressor activity. The Plant Cell 2006, 18((7)), 1750–1765. [Google Scholar] [CrossRef] [PubMed]
- van den Burg, H. A.; Takken, F. L. Does chromatin remodeling mark systemic acquired resistance? Trends in Plant Science 2009, 14((5)), 286–294. [Google Scholar] [CrossRef] [PubMed]
- Yan, J.; Li, H.; Li, S.; Yao, R.; Deng, H.; Xie, Q.; Xie, D. The Arabidopsis F-box protein CORONATINE INSENSITIVE1 is stabilized by SCFCOI1 and degraded via the 26S proteasome pathway. The Plant Cell 2013, 25((2)), 486–498. [Google Scholar] [CrossRef]
- Van der Does, D.; Leon-Reyes, A.; Koornneef, A.; Van Verk, M. C.; Rodenburg, N.; Pauwels, L.; Goossens, A.; Körbes, A. P.; Memelink, J.; Ritsema, T. Salicylic acid suppresses jasmonic acid signaling downstream of SCFCOI1-JAZ by targeting GCC promoter motifs via transcription factor ORA59. The Plant Cell 2013, 25((2)), 744–761. [Google Scholar] [CrossRef]
- Ziller, M. J.; Hansen, K. D.; Meissner, A.; Aryee, M. J. Coverage recommendations for methylation analysis by whole-genome bisulfite sequencing. Nature methods 2015, 12((3)), 230–232. [Google Scholar] [CrossRef]
- Bolger, A. M.; Lohse, M.; Usadel, B. Trimmomatic: a flexible trimmer for Illumina sequence data. Bioinformatics 2014, 30((15)), 2114–2120. [Google Scholar] [CrossRef] [PubMed]
- Langmead, B.; Salzberg, S. L. Fast gapped-read alignment with Bowtie 2. Nature methods 2012, 9((4)), 357–359. [Google Scholar] [CrossRef]
- Krueger, F.; Andrews, S. R. Bismark: a flexible aligner and methylation caller for Bisulfite-Seq applications. bioinformatics 2011, 27((11)), 1571–1572. [Google Scholar] [CrossRef] [PubMed]
- Quinlan, A. R.; Hall, I. M. BEDTools: a flexible suite of utilities for comparing genomic features. Bioinformatics 2010, 26((6)), 841–842. [Google Scholar] [CrossRef] [PubMed]
- Akalin, A.; Kormaksson, M.; Li, S.; Garrett-Bakelman, F. E.; Figueroa, M. E.; Melnick, A.; Mason, C. E. methylKit: a comprehensive R package for the analysis of genome-wide DNA methylation profiles. Genome biology 2012, 13((10)), R87. [Google Scholar] [CrossRef]
- Tyanova, S.; Temu, T.; Sinitcyn, P.; Carlson, A.; Hein, M. Y.; Geiger, T.; Mann, M.; Cox, J. The Perseus computational platform for comprehensive analysis of (prote) omics data. Nature methods 2016, 13((9)), 731–740. [Google Scholar] [CrossRef]
Figure 1.
Genome-wide DNA methylation variation in Arabidopsis after pathogen infection and/or SA-CNPs application. (A) Heatmap of WGBS signals upstream and downstream of the gene body. Scale regions were 4,000 bp upstream of the translation starting site (TSS), 2,000 bp downstream of the translation end site (TES), and a 5,000 bp region on the gene body. Length was plotted using computeMatrix and plotHeatmap tools in deepTools. (B) Principal component analysis (PCA) of genome-wide methylation showing separation between the tested treatments in specific methylation (CHG or CpG) contexts. (C-F) Volcano plots showing the distributions of DMCs in the significantly different treatments. The blue and turquoise dots represent the significantly hypo- and hypermethylated DMCs. Genome-wide significance is determined by false discovery rate (FDR) less than 5% (horizontal dotted line). Vertical dotted lines show > 25% hypermethylation and > 25% hypomethylation between treatments.
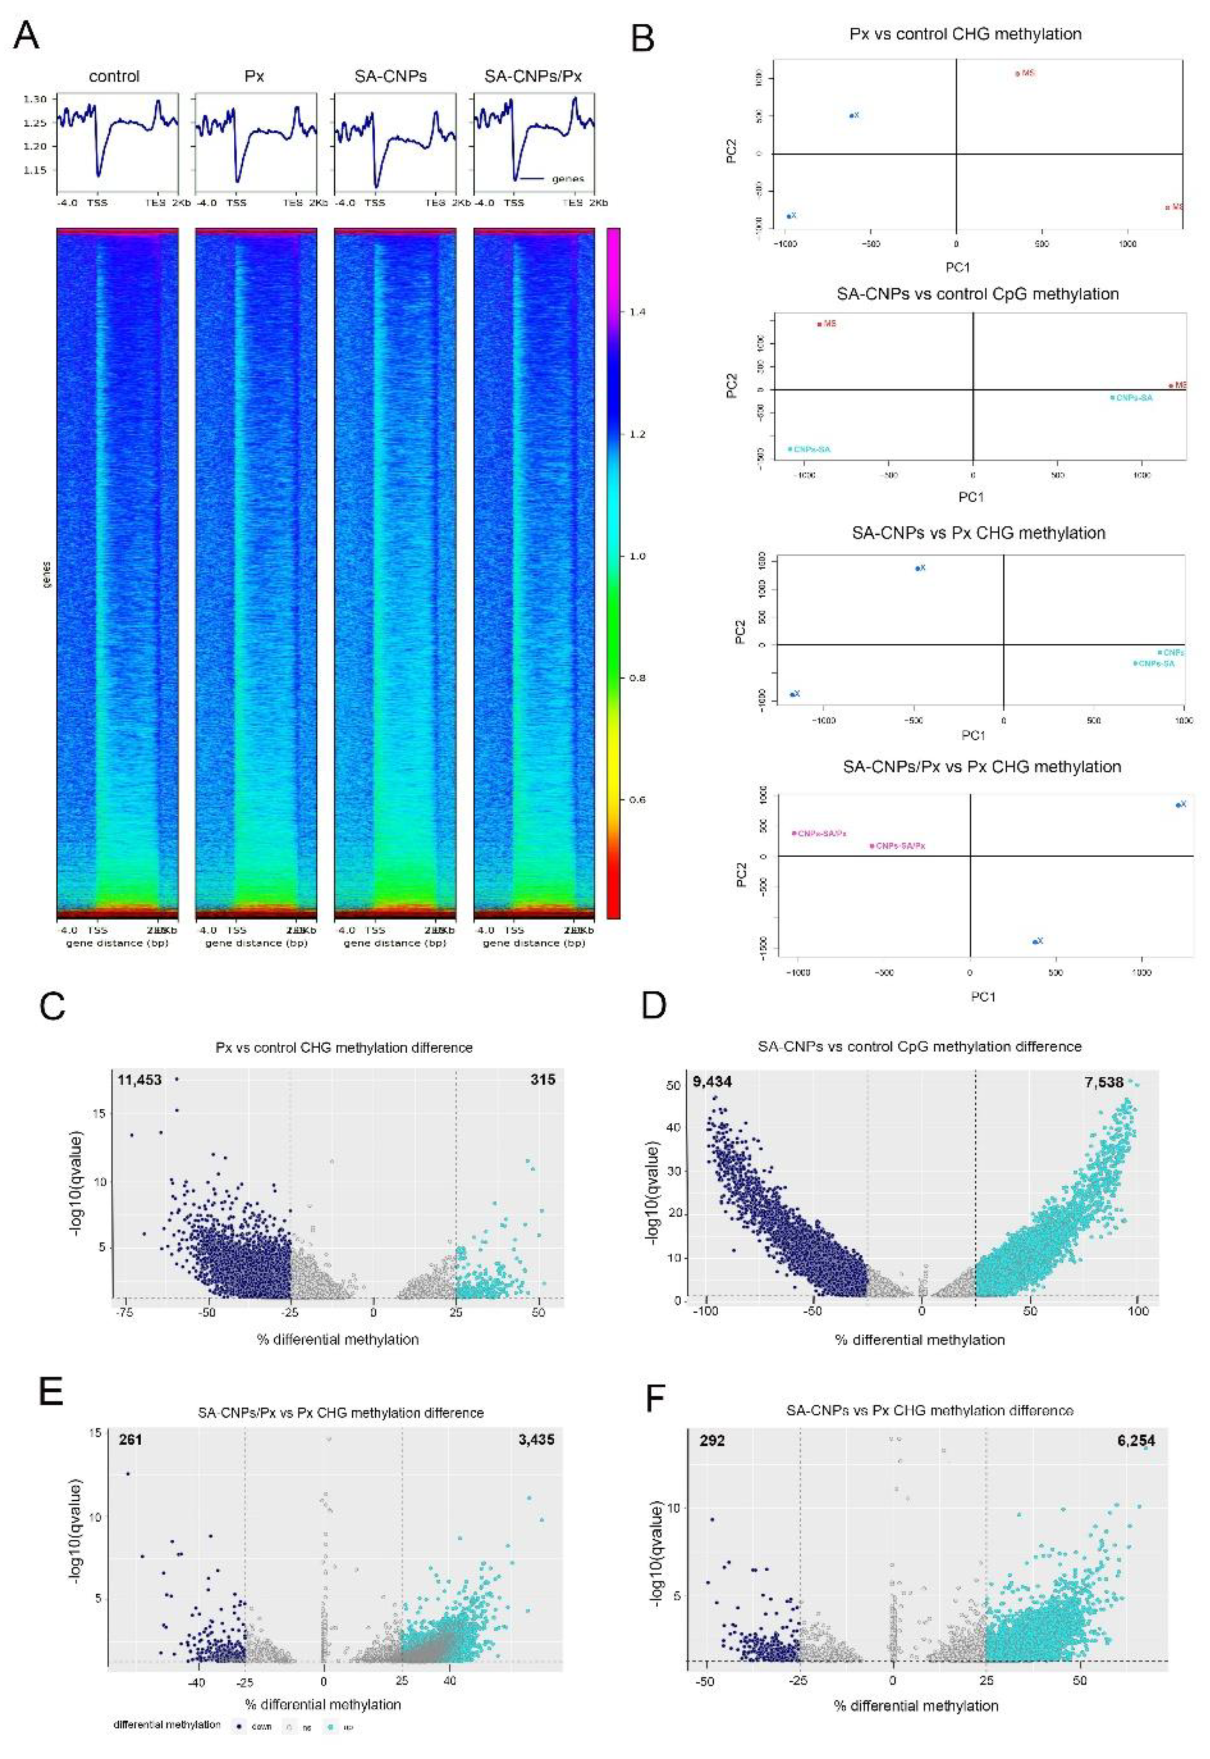
Figure 2.
Altered methylation imprints in specific genomic regions between treatments. (A) Stratification of differentially methylated cytosines (DMCs) into hypo and hypermethylated segments representing the promoter, exon, intron or intergenic regions based on their genomic location indicating frequency of DMCs per location in the differential significant methylation contexts between treatments. (B) Bar plot representing the average number of transposons that were annotated in the hypomethylated segment of the DMCs between Px or SA-CNPs treatments compared to control. (C,D) Enrichment of gene-associated DMCs that are counted in the Px or SA-CNPs treatments compared to control. The DMCs are grouped according to their genomic location (promoter or gene body).
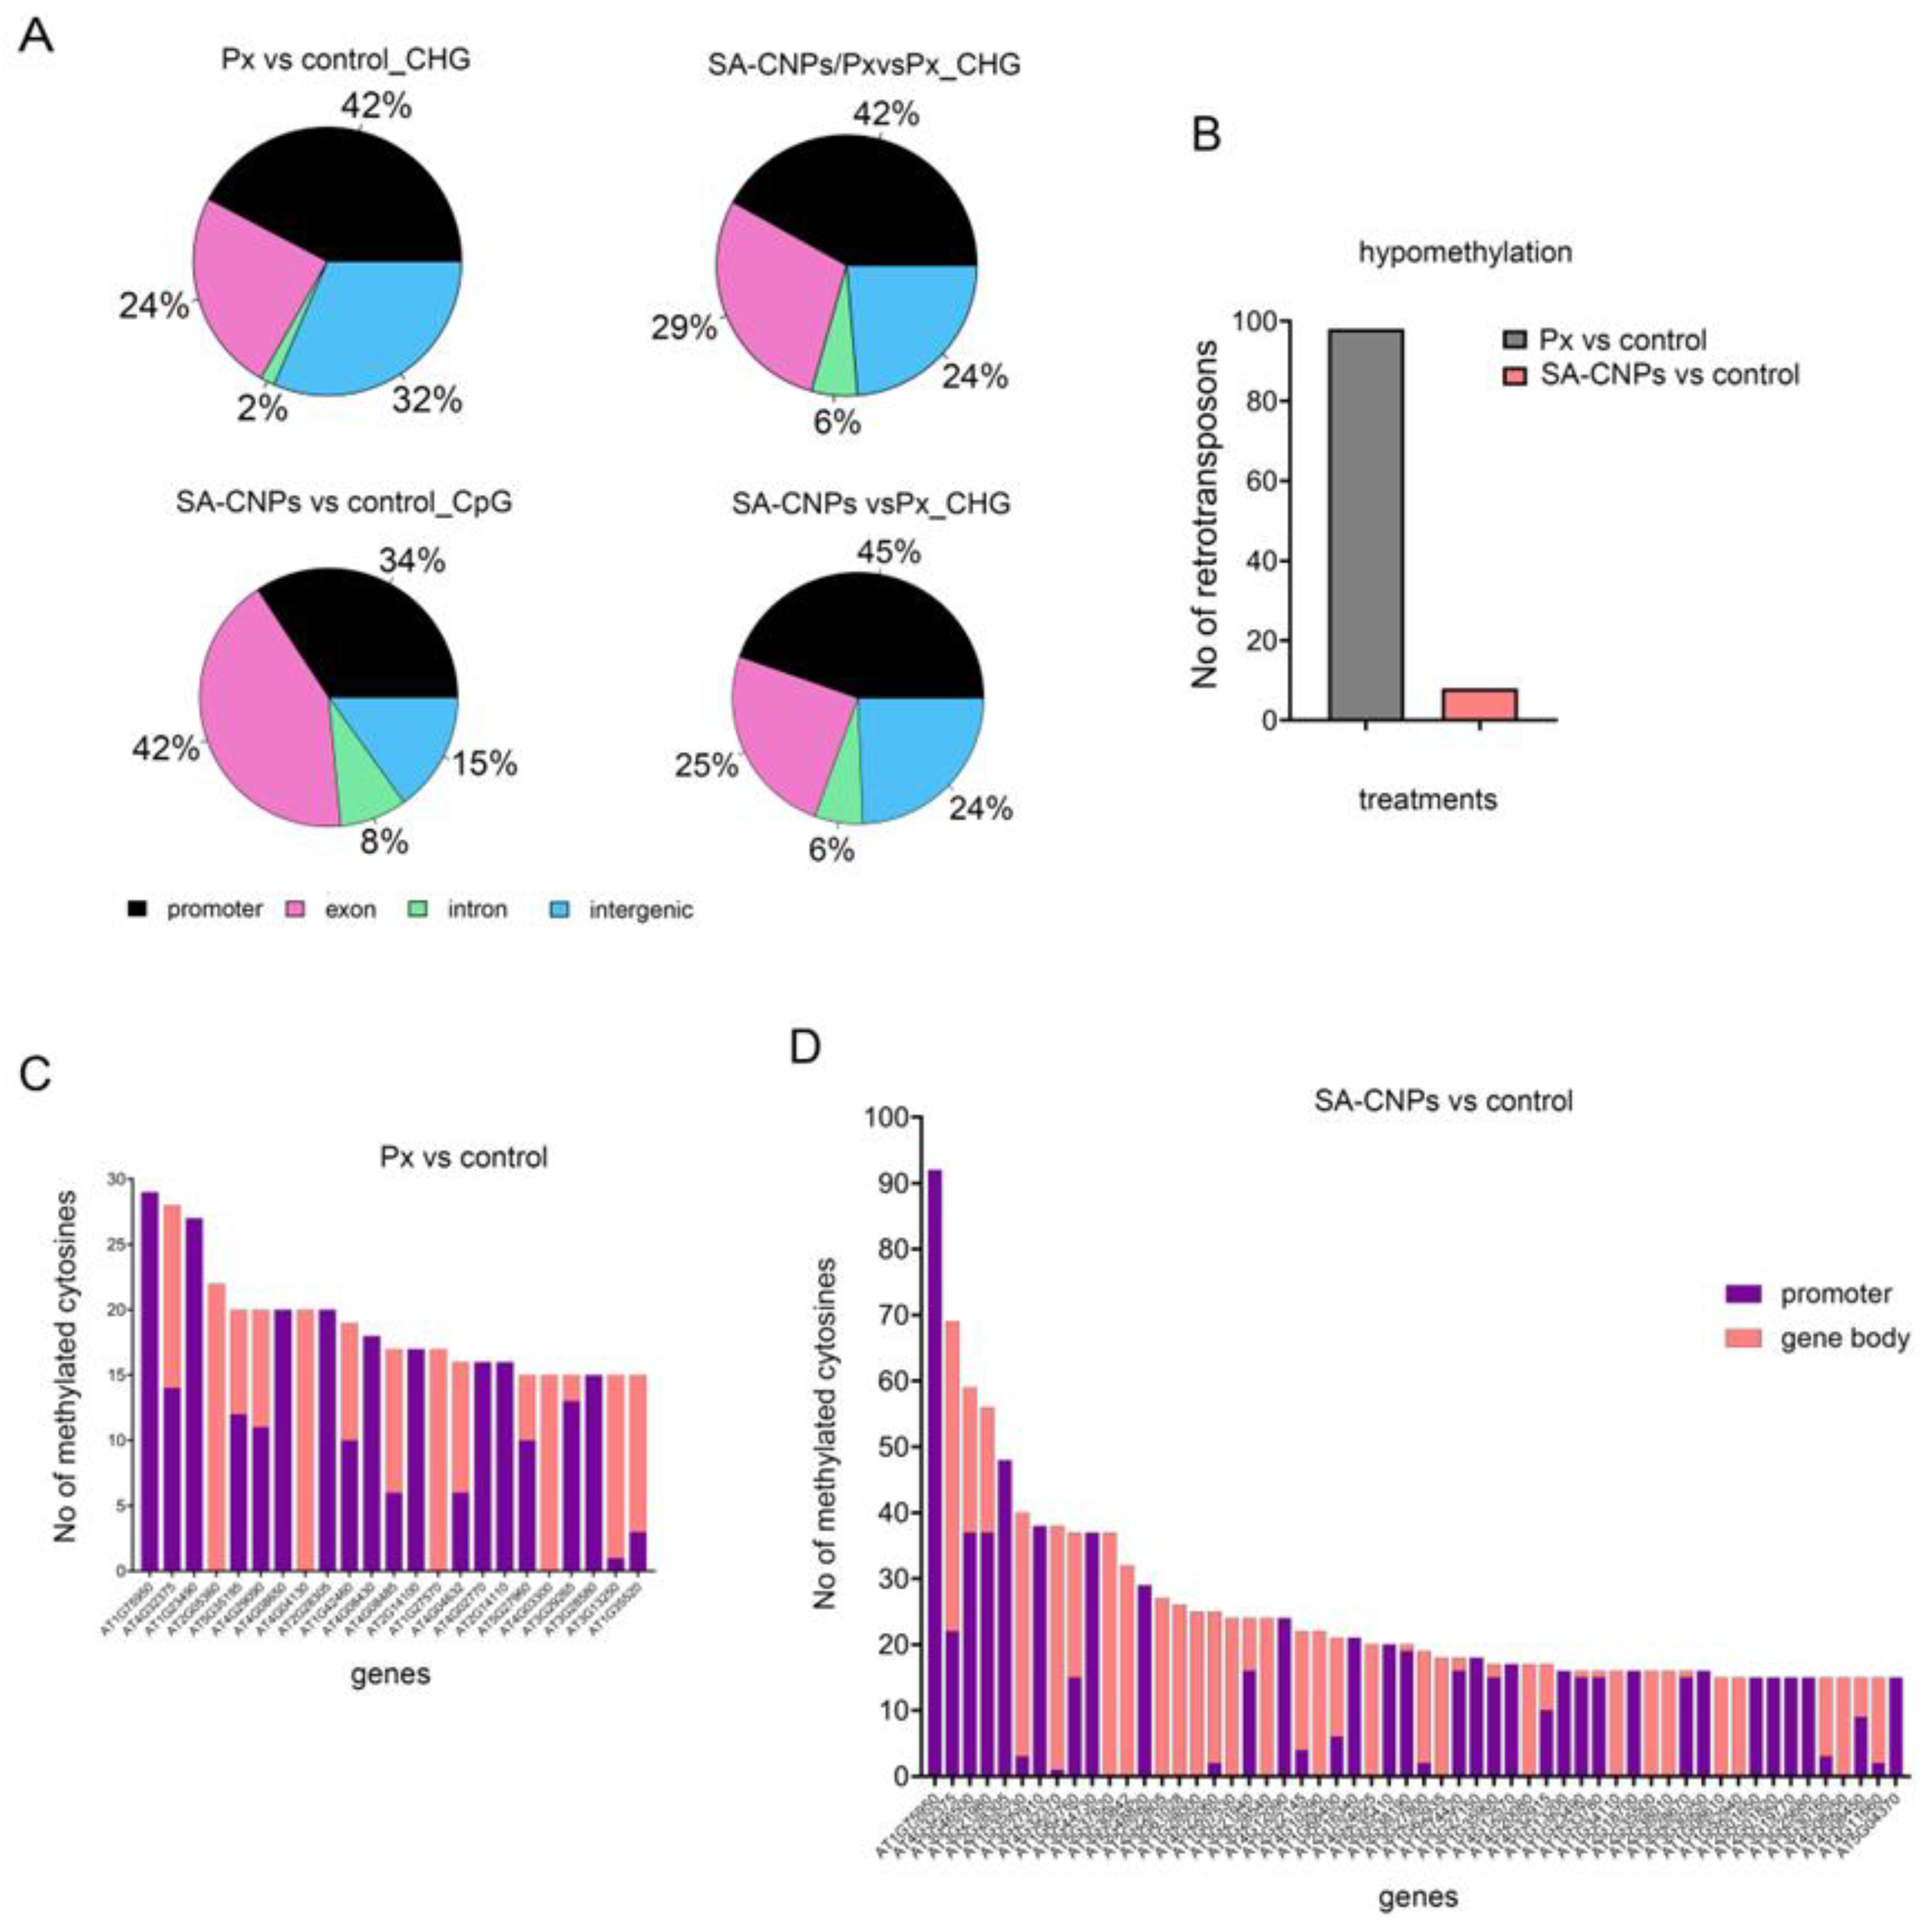
Figure 3.
Distribution of DNA methylation and cis-element annotation of the hypomethylated SKP1A DMR across treatments and relative protein expression. (A) Up: SeqMonk screenshot of a 1.5 Mb region of Arabidopsis chromosome 1 depicting the methylated cytosines. Genes and mRNA are shown in red or blue depending on their direction of transcription (forward and reverse, respectively). The SKP1A examined gene is shown in pink. Each color-coded vertical bar in the screenshot represents the methylation value of each methylated cytosine. Down: The zoomed-in view shows methylation over the 1.4 Kb promoter region of SKP1A gene. Each vertical bar represents a single cytosine on the array. The colored boxes on the horizontal black line represent the identified defense-related cis-elements in the selected region. (B) Box and whisker plots showing total DNA methylation percentages of the SKP1A examined promoter region. The line across the middle of the box shows the median, the upper and lower extremities of the box show the 25th and 75th percentile of the set of data, and the upper and lower black whiskers show the median plus/minus the interquartile (25–75%) range multiplied by 2. Individual points which fall outside this range are shown as filled circles and represent single outlier tiles. (C) Heatmap plot, generated with Perseus software, of the indicated expressions of proteins related to E3 ubiquitination. The vertical-colored bar on the right of each plot indicates the value intensity depicting the direction of protein expression as upregulated or downregulated.
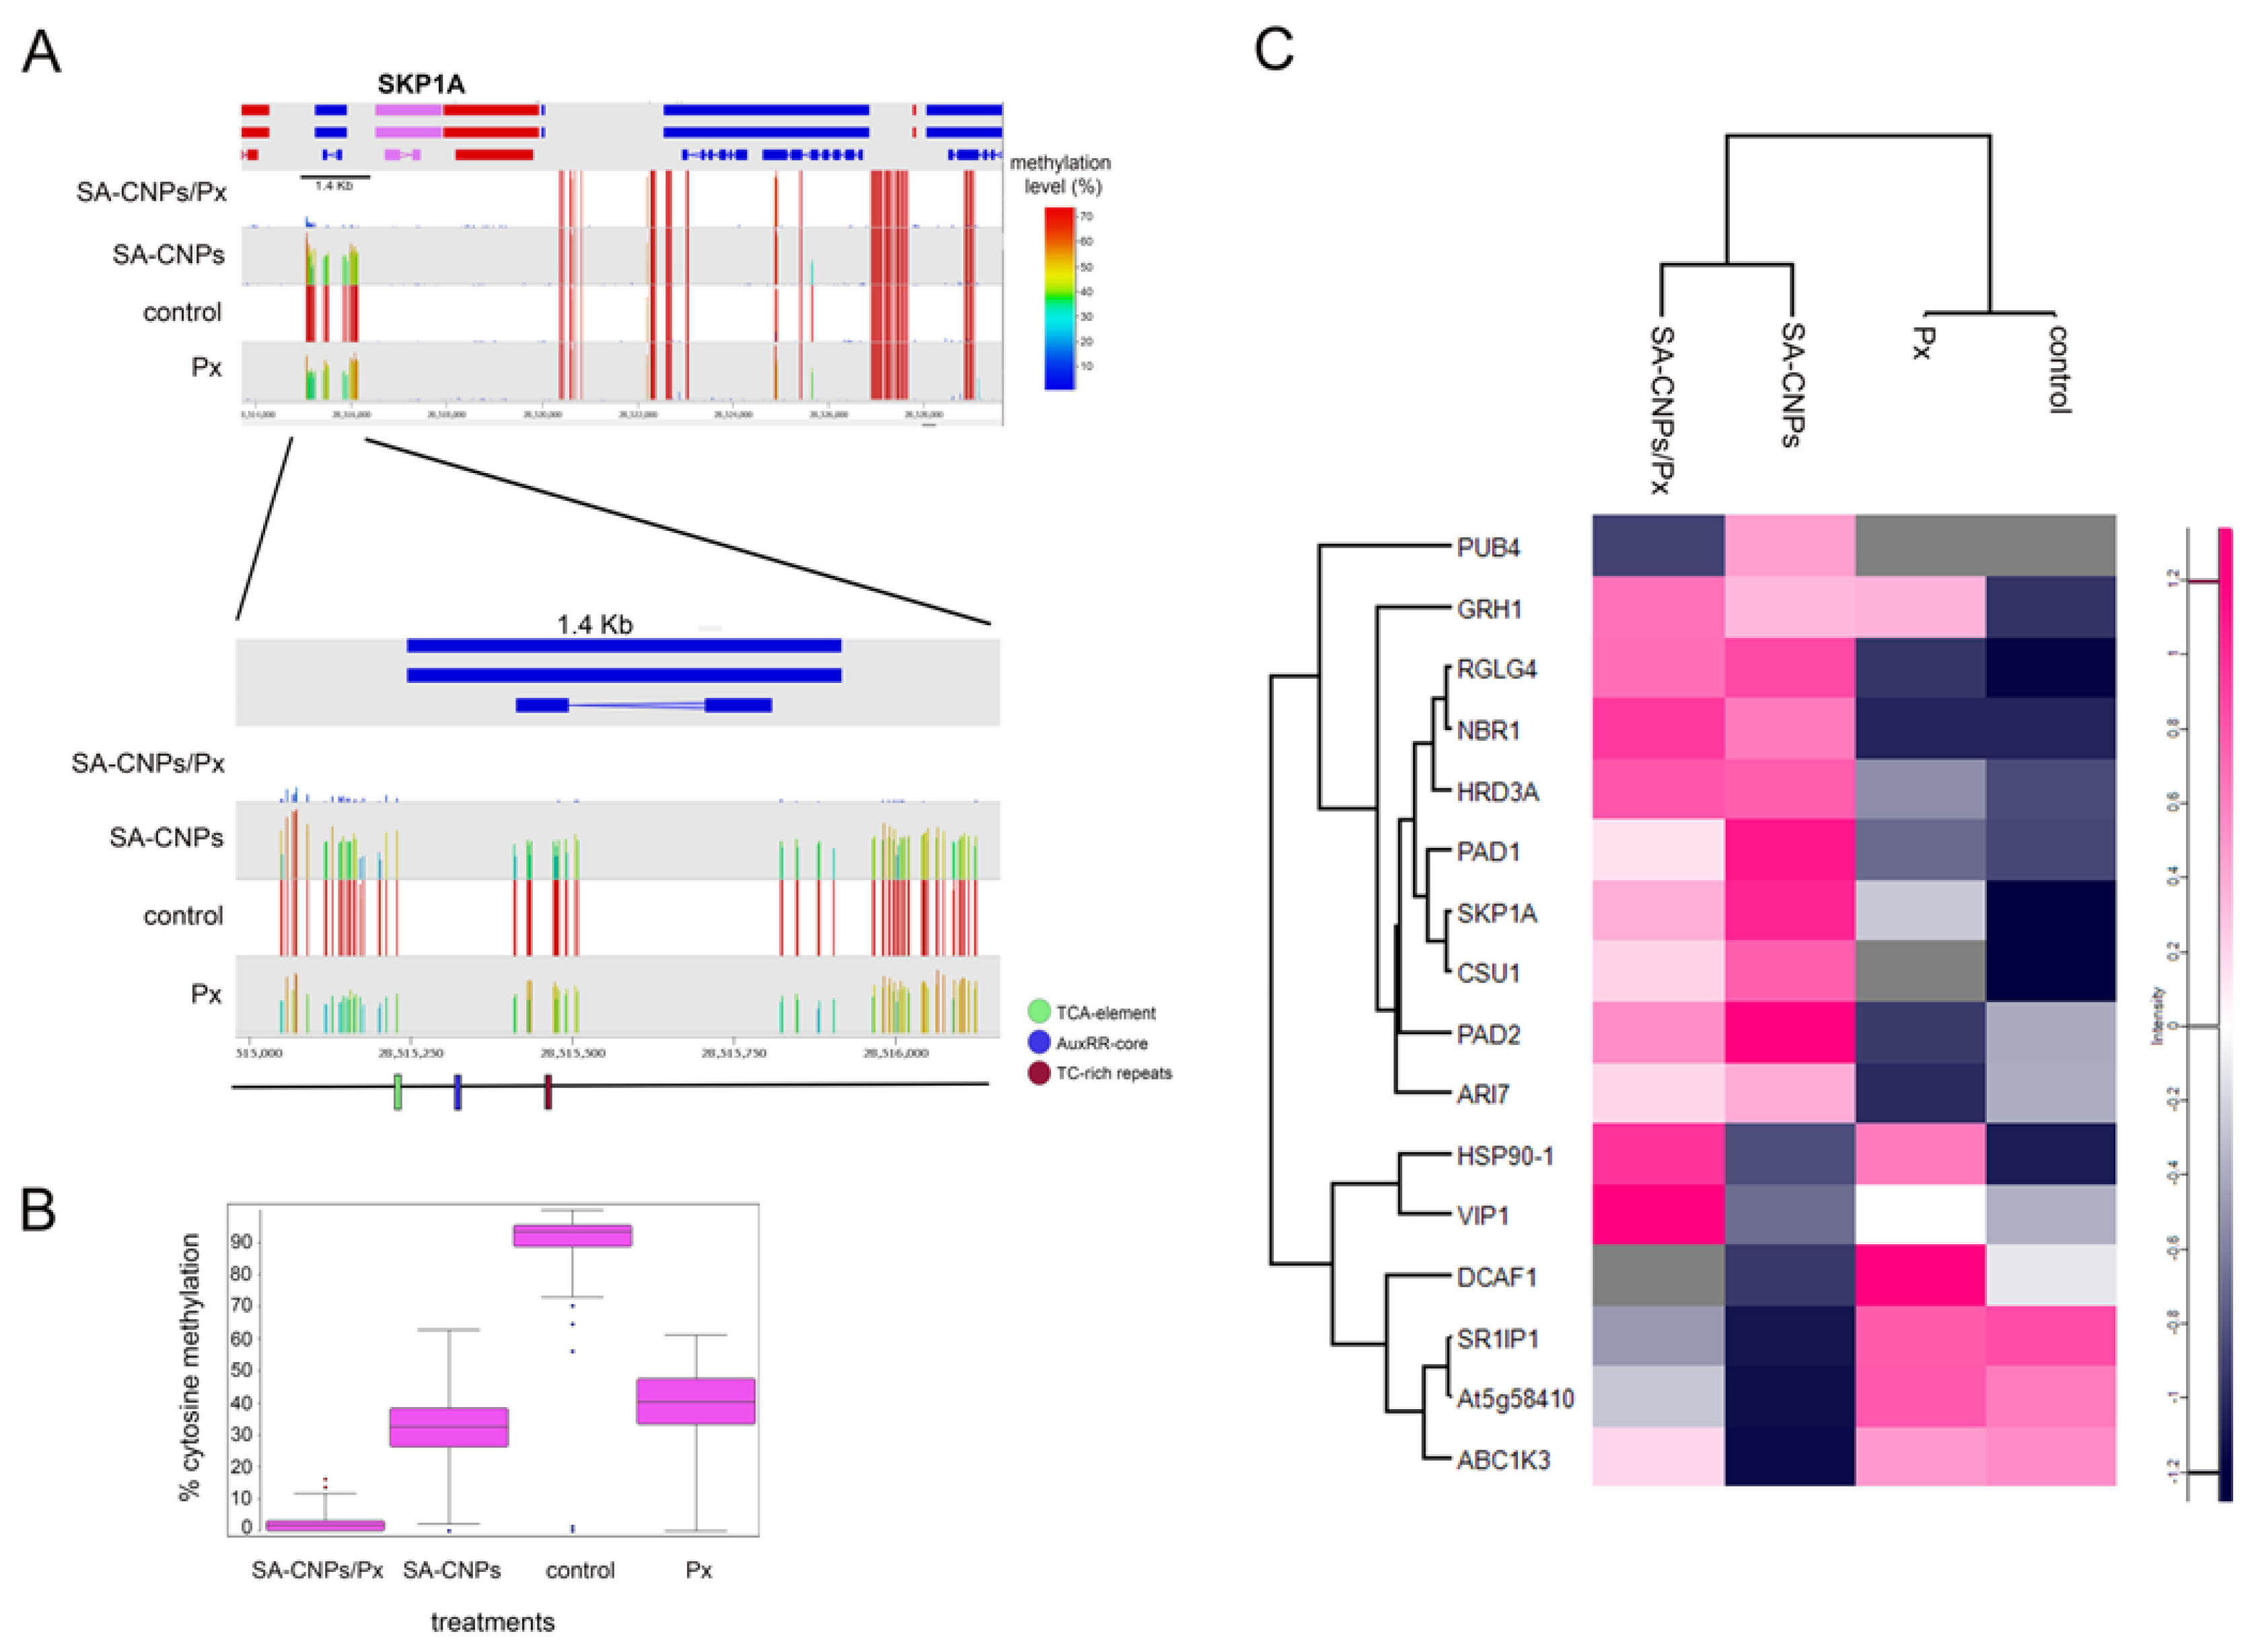
Figure 4.
Differential expressions of identified defense-related protein groups between treatments. (A-F) Heatmap plots, generated with Perseus software, of the indicated expressions of defense-related protein groups. The vertical-colored bar on the right of each plot indicates the value intensity depicting the direction of protein expression as upregulated or downregulated.
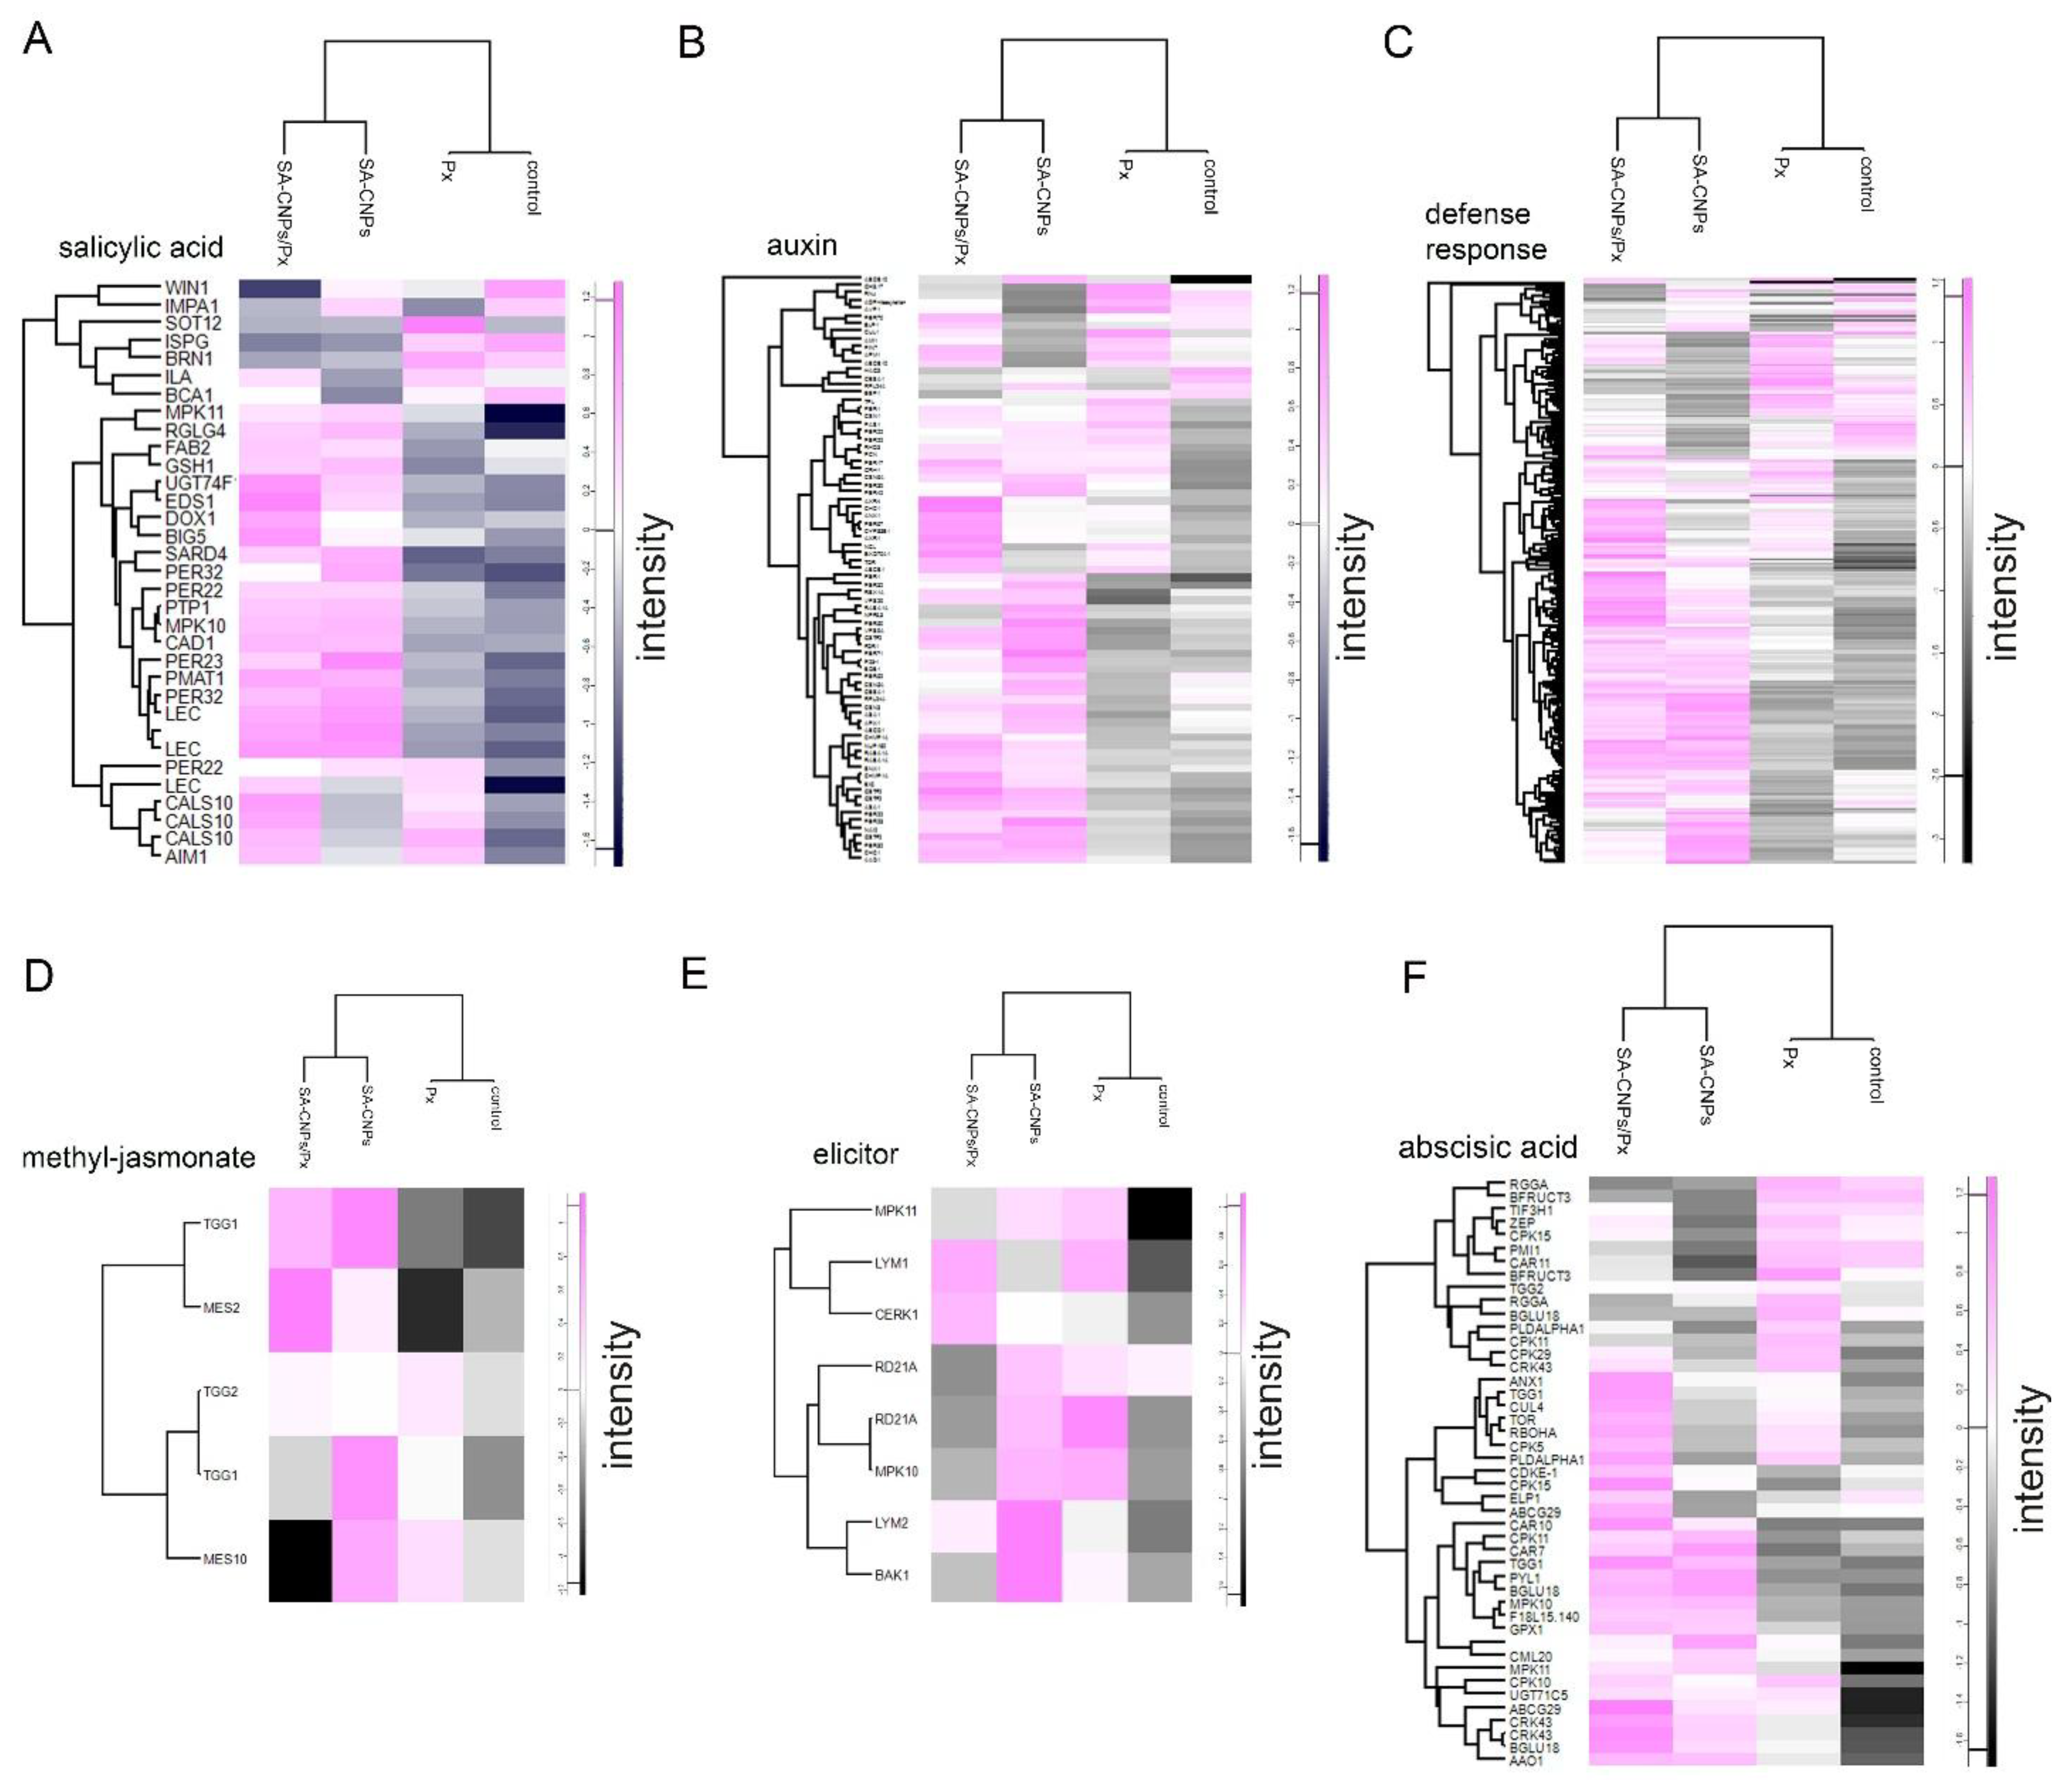
Figure 5.
(A) Venn diagram displaying shared genes between upregulated gene expression and enriched hypomethylation in the Arabidopsis SA-CNPs treated samples compared to control. (B) Bar plot indicating the number of hypomethylated cytosines and fold change in each of the identified shared genes. (C) Illustration depicting the significant enrichment of a functional category identified by ClueGO Cytoscape plugin and the corresponding genes.
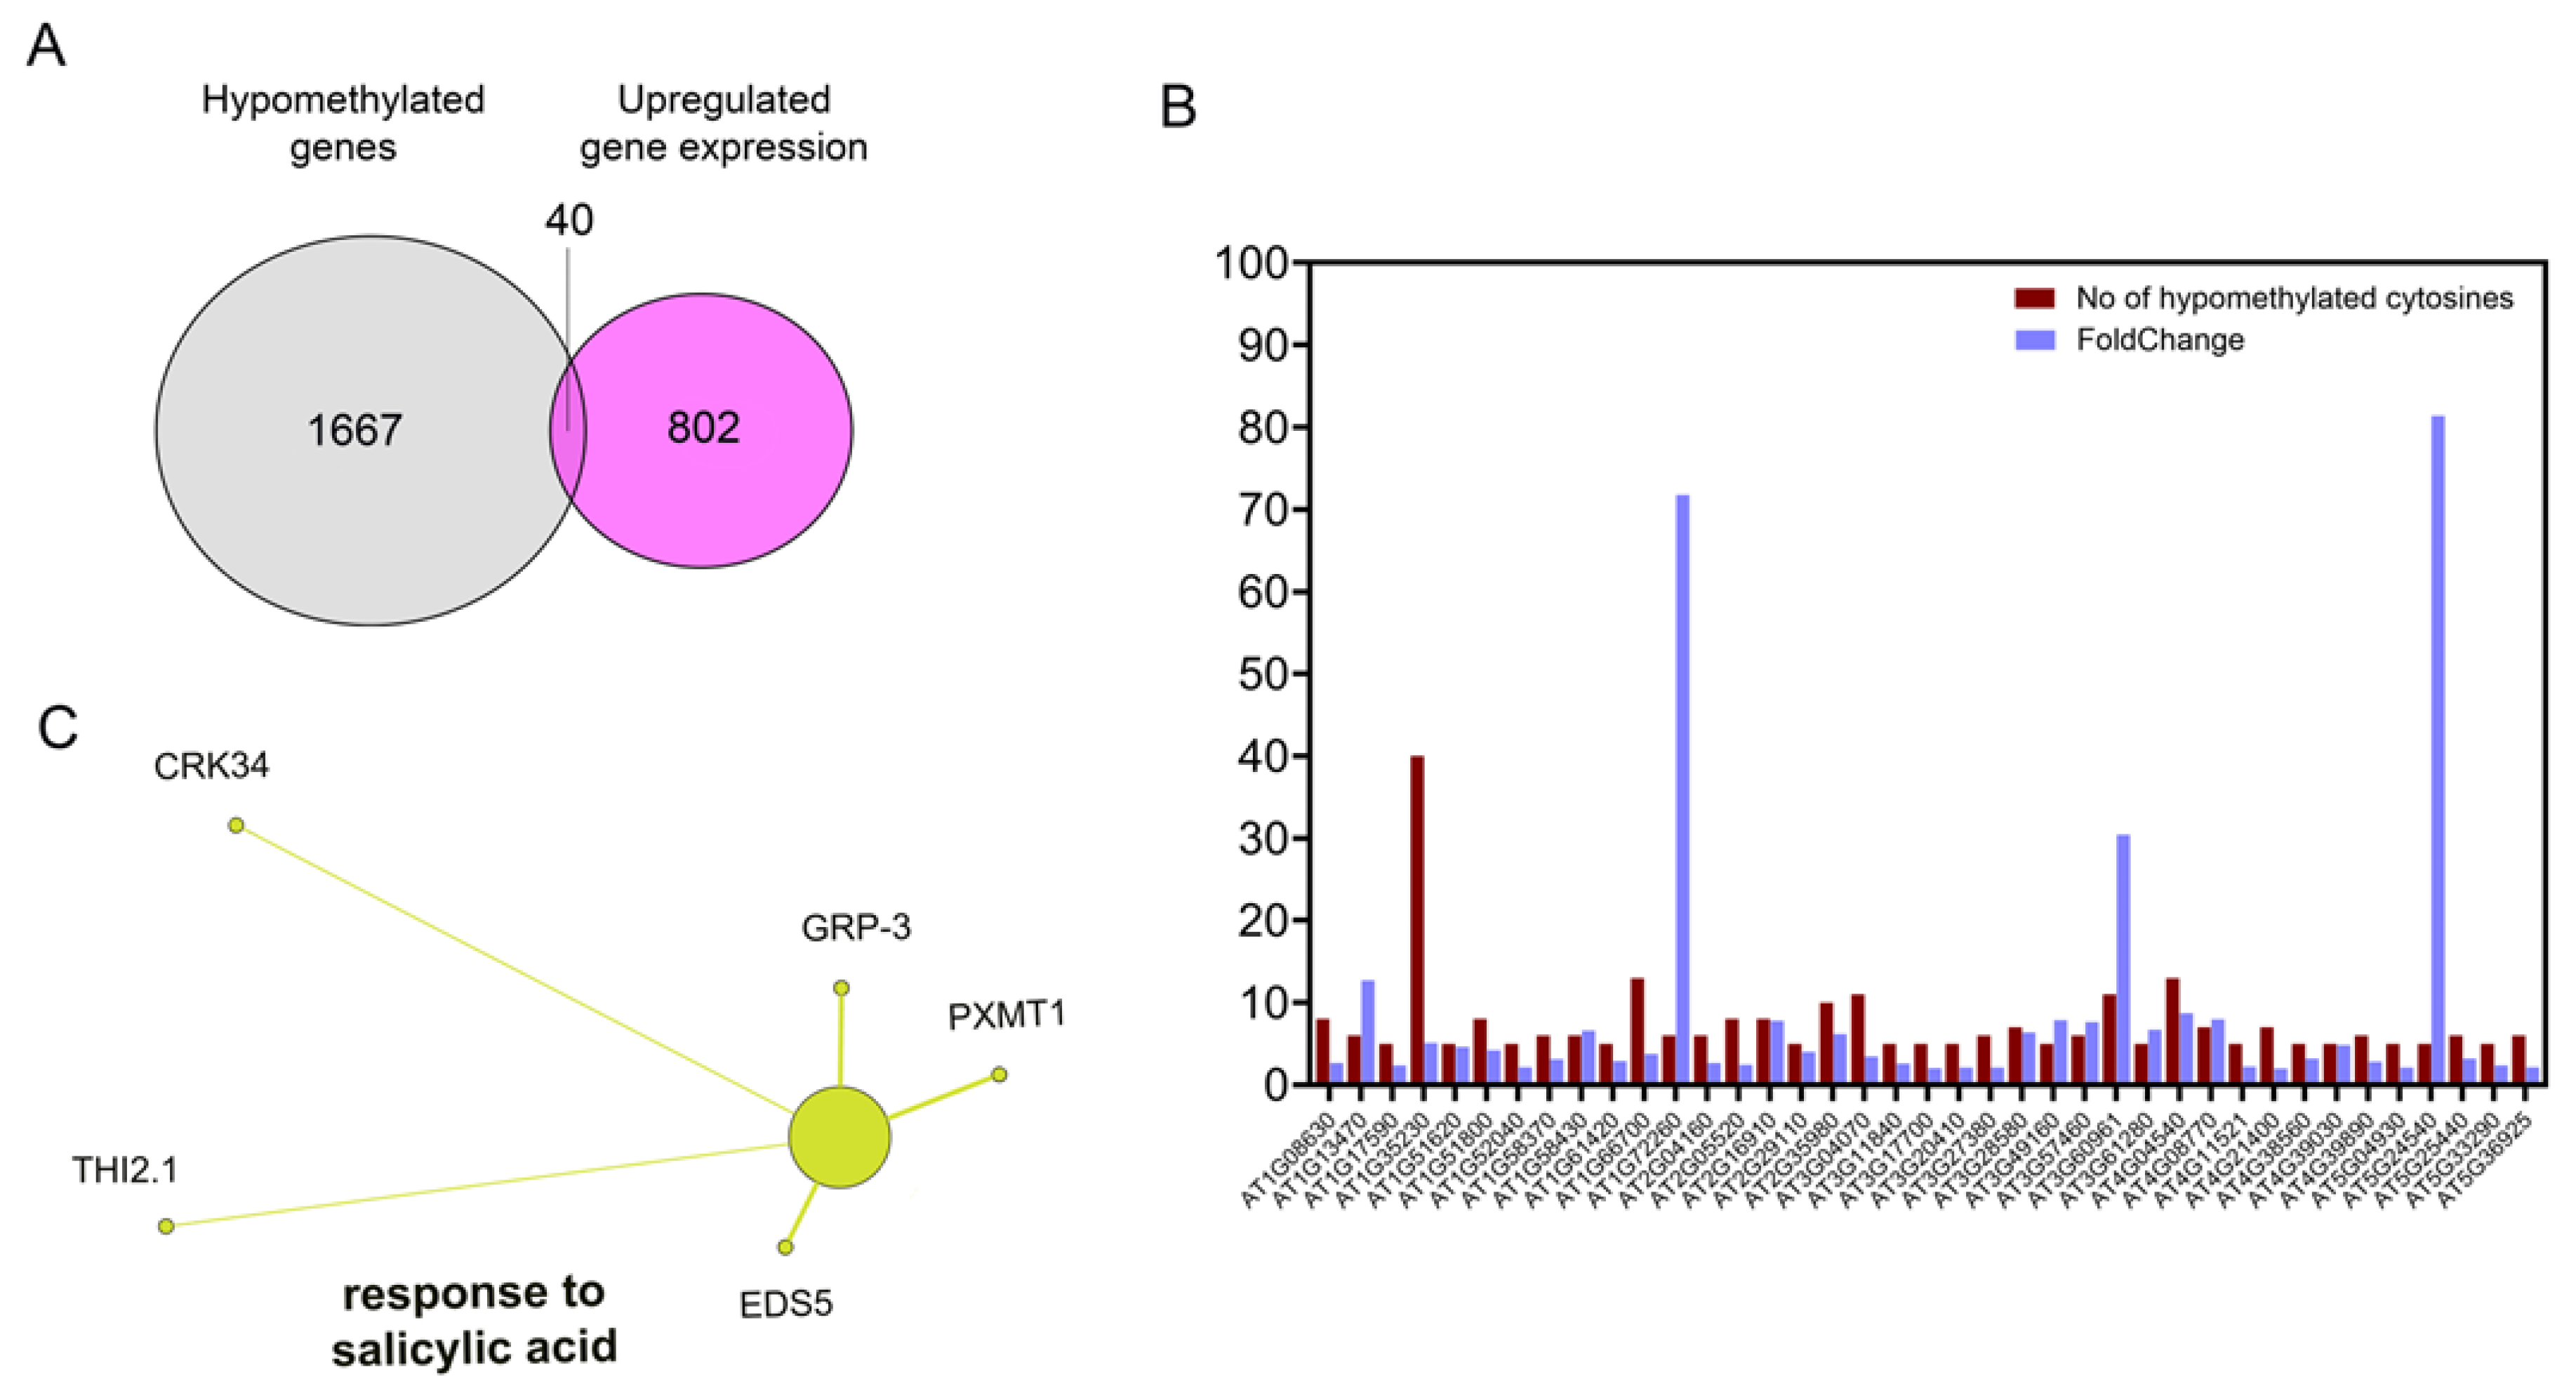
Figure 6.
(A, B) STRING protein-protein interaction (PPI) networks of Arabidopsis THI2.1 (A) and EDS5 (B) with nine primary associating interactors. Each PPI showed enrichment p-value: < 1.0e-16. The network nodes are proteins. The edges represent the predicted functional associations; darker edge color represents stronger interaction. The red node and edge in (A) show the interaction of SKP1A with COI1 of the network. (C, D) Heatmap plots, indicating the expressions of the examined genes at transcript and protein level. The vertical-colored bar on the right of each plot indicates the value intensity depicting the direction of expression as upregulated or downregulated. (E) Volcano plot, generated with Perseus software, of the differentially expressed proteins (DEPs). The log fold change is plotted on the x-axis (down-regulated proteins with blue color, up-regulated with pink) and the negative log10 P-value is plotted on the y-axis.
Disclaimer/Publisher’s Note: The statements, opinions and data contained in all publications are solely those of the individual author(s) and contributor(s) and not of MDPI and/or the editor(s). MDPI and/or the editor(s) disclaim responsibility for any injury to people or property resulting from any ideas, methods, instructions or products referred to in the content. |
© 2026 by the authors. Licensee MDPI, Basel, Switzerland. This article is an open access article distributed under the terms and conditions of the Creative Commons Attribution (CC BY) license (http://creativecommons.org/licenses/by/4.0/).
Copyright: This open access article is published under a Creative Commons CC BY 4.0 license, which permit the free download, distribution, and reuse, provided that the author and preprint are cited in any reuse.


