
Submitted:
13 January 2026
Posted:
14 January 2026
You are already at the latest version
Abstract
Raisin syrup sourdough is a popular traditional leavening method in Japan, yet its specific impact on bread aroma evolution and shelf-life stability remains scientifically underex-plored. This study characterized the fermentation dynamics and volatile profiles of raisin syrup sourdough bread compared to a commercial yeast control over a 3-day shelf life, utilizing comprehensive two-dimensional gas chromatography–mass spectrometry (GC×GC-TOFMS) and primary metabolite profiling of sugars, amino acids, and organic acids. The analysis resolved over 760 volatiles and revealed a fundamental kinetic divergence: while the yeast control exhibited a 24-hour metabolic lag, the raisin sourdough achieved rapid activation, establishing a higher initial volatile load immediately post-baking. Driven by Lactic Acid Bacteria dominance and extensive proteolysis, the sourdough’s acidic environment facilitated the retention of fruity esters and malty branched-chain aldehydes while effectively suppressing lipid oxidation markers like 9,17-Octadecadienal. Key aromatic markers, including Benzenepropanol and Octanoate , were significantly elevated and stabilized in the sourdough group. These findings demonstrate that raisin syrup fermentation generates a superior, stable aromatic profile, providing a scientific basis for optimizing clean-label artisan bread production in the Japanese market.
Keywords:
GC×GC-TOFMS
; bread aroma
; shelf life
; sourdough
; volatile organic compounds
; functional group profiling
; chemometric analysis
1. Introduction.
Sourdough fermentation is a multifunctional bioprocess that enhances the sensory, nutritional, and shelf-life attributes of bread. By utilizing a stable symbiosis of lactic acid bacteria (LAB) and yeasts, sourdough improves dough rheology and flavor complexity compared to conventional yeast fermentation [1]. These benefits stem from metabolic activities that produce organic acids, exopolysaccharides, and a wide array of volatile organic compounds (VOCs), positioning sourdough as a sustainable, clean-label alternative to chemical improvers [2].
In Japan, the bread market which is traditionally dominated by commercial yeast-based shokupan (white pan bread) is shifting. Evolving consumer preferences for diverse, naturally derived flavor profiles are driving interest in artisanal products [3] prompting bakeries to explore sourdough for novel aroma and texture characteristics. This changing landscape has been driving locally adapted practices, most notably raisin syrup sourdough. This method involves the spontaneous fermentation of raisins in syrup to cultivate a consortium of indigenous wild yeasts and LAB from raisin skins [4].
Despite its popularity as a simple yet effective starter in artisanal and home baking, scientific understanding of its specific fermentation and storage dynamics remains limited, particularly regarding the influence of how Japanese environmental factors, such as flour variations, temperature, and microbial ecology, influence fermentation outcomes. Furthermore, while certain aromatic aspects of conventional sourdough have been identified, these studies rely primarily on one-dimensional gas chromatography (1D-GC) and headspace solid-phase microextraction (HS-SPME), few studies have characterized the comprehensive flavor and quality evolution during the shelf life of raisin syrup sourdough-based white bread.
To deconstruct this chemical complexity, comprehensive two-dimensional coupled with time-of-flight MS (GC × GC -TOFMS) offers transformative potential. By employing orthogonal columns and thermal modulation, GC × GC-TOFMS achieves a peak capacity 5–10 times higher than conventional 1D-GC and HS-SPME, resolving intricate co-eluting compounds and trace-level analytes [5]. While this approach has revolutionized metabolomics in complex plant and biofluid matrices [6,7,8], its analytical power remains untapped for characterizing the fermentation dynamics of raisin syrup starters. Specifically, the comprehensive volatile spectra and functional group distributions governing the reactivity and sensory impact of this “efficient aroma-catalyst” remain unclassified. Clarifying these distributions is essential to elucidating the biochemical pathways of this novel aromatic leavening system.
To address these gaps, this study aims to comprehensively characterize raisin syrup sourdough fermentation through a multi-omics approach by GC × GC -TOFMS. This investigation focuses on profiling the dynamic shifts in volatile organic compounds. To provide auxiliary insights into the observed aromatic transformations, these findings are supplemented by an analysis of primary metabolites including sugars, amino acids, and organic acids. By mapping these complex aromatic changes during storage, this research ultimately intends to provide a scientific basis for controlling and optimizing the production of high-quality Japanese raisin syrup sourdough bread.
2. Materials and Methods
2.1. Sample Preparation
The raisin syrup starter was developed based on a traditional artisanal formulation [9]. Specific ratios and parameters of the ingredients detailed in Table 1. High-quality organic raisins were combined with water (30 °C), sugar, and malt syrup. The mixture was stirred thoroughly in a clean container. Fermentation was conducted at 27 °C for a duration of 4 to 5 days. To ensure consistent fermentation and prevent mold growth on the surface, the mixture was agitated at least once daily. Completion of the starter was identified when all raisins floated to the surface and active bubbling was observed. Upon completion, the solids were filtered out, and the resulting fermented liquid was refrigerated for subsequent use in dough preparation.
Two types of French-style white bread were prepared to evaluate the impact of different leavening agents on aroma evolution during shelf life, including a control bread leavened with commercial fresh yeast and an experimental bread leavened with raisin syrup sourdough starter. The bread-making process followed the method of TSUMUGI bakery [9]. The specific formulations for both dough types are detailed in Table 2. The specific formulations for both dough types are detailed in Table 2.
The mixing process followed a standardized regime involving 2 min at low speed followed by 8–9 min at medium speed to achieve a target dough temperature of 25.2–25.9 °C. Following mixing, the dough underwent a 60-min floor time, with a degassing punch performed at the 30-min mark. Fermentation was conducted in two distinct stages that began with an initial 4-h cold fermentation at 2 °C, followed by an 8-h bulk fermentation at 27 °C and 75% relative humidity.
After bulk fermentation, the dough was divided into 200 g portions and subjected to a 40-min bench time. The loaves were then shaped using a molder into a baton configuration and proofed on cloth for 70 min at 32 °C and 75% RH. Prior to baking, a saucisson style cut was applied to the surface to maintain crumb uniformity. Baking was performed for 27 min with an initial temperature of 250 °C (top) and 225 °C (bottom), which was subsequently reduced to 225 °C and 210 °C, respectively. Following baking, loaves were cooled and stored under controlled conditions to monitor the evolution of VOCs and metabolic precursors such as amino acids, organic acids, and oligosaccharides throughout the designated shelf life.
2.2. Primary Metabolites Analysis
Primary metabolites, including free amino acids, sugars, and organic acids, were analyzed to provide chemical context for the volatile profiles. All bread samples were processed into a uniform freeze-dried powder prior to analysis. Methanol, chloroform, ribitol, and pyridine were obtained from Wako Pure Chemical Industries, Ltd. (Osaka, Japan). Methoxyamine hydrochloride, 2-isopropylmalic acid, and alkane standard solution were purchased from Merck KGaA (Darmstadt, Germany). N-methyl-N-(trimethylsilyl)trifluoroacetamide (MSTFA) was sourced from GL Science, Inc. (Tokyo, Japan) [10].
2.2.1. Free Amino Acid Profiling via HPLC
Free amino acids were extracted by dissolving 100 mg of the freeze-dried bread powder in 1 mL of 75% ethanol. This mixture underwent 5 minutes of sonication followed by 30 minutes of shaking at 4 °C to ensure thorough extraction. Following centrifugation at 16,000 × g for 20 min at 4 °C, the resulting supernatant was dried using a centrifugal evaporator (Tokyo Rikakikai Co., Ltd. Tokyo, Japan). The dried residue was subsequently redissolved in 200 µL of 10 mM HCl. For detection, the extract was derivatized using an AccQ-Tag Ultra Derivatization Kit (Waters Corporation, Milford, MA, USA) and analyzed with an Acquity UPLC H-Class amino acid analyzer (Waters Corporation, Milford, MA, USA) according to the manufacturer’s protocol.
2.2.2. Sugar and Organic Acid Profiling via GC-MS
Sugars and organic acids were analyzed using a modified gas chromatography-mass spectrometry method as described previously [11]. The process began by dissolving 25 mg of the bread powder in a methanol:water:chloroform (2.5:1:1, v/v/v) solution. Ribitol and 2-isopropylmalic acid were introduced as internal standards during this stage. The samples were homogenized for 2 min at 30 Hz using a TissueLyser II (Qiagen, Hilden, Germany) and incubated at 37 °C for 30 min. After centrifugation at 16,000 × g for 5 min at 4 °C, 800 µL of the supernatant was partitioned with water and centrifuged again to separate the polar phase. A 800 µL aliquot of the supernatant was then transferred to a new tube and partitioned by adding 400 µL of water. After brief mixing and a second centrifugation (16,000 × g, 5 min, 4 °C), the resulting polar phase was collected, concentrated in a centrifugal evaporator for approximately 90 min, and subsequently freeze-dried for further analysis.
For derivatization, 50 µL of methoxyamine hydrochloride in pyridine (20 mg/mL) was added to the freeze-dried samples and incubated at 37 °C for 90 min. Subsequently, 50 µL of MSTFA was added, followed by further incubation at 37 °C for 30 min. The resulting derivatized samples were then subjected to GC-MS analysis. GC-MS analysis was conducted using a GCMS-QP2010 system (Shimadzu Corporation, Kyoto, Japan) equipped with an AOC-20i/s autosampler and a CP-Sil 8 CB column (30 m × 0.25 mm i.d., 0.25 µm film thickness; Agilent Technologies, Inc., Santa Clara, CA, USA). Samples were injected in split mode, utilizing a 100:1 ratio for sugar analysis and a 20:1 ratio for organic acid analysis, with an injection temperature of 230 °C. Helium served as the carrier gas at a constant flow rate of 1.0 mL/min.
The oven temperature program commenced at 80 °C (held for 2 min), increased at a rate of 10 °C/min to a final temperature of 325 °C, and was maintained for an additional 10 min. The interface and ion source temperatures were set to 250 °C and 200 °C, respectively. Ions were generated via electron ionization at 0.93 kV, with data recorded at a scan rate of 20 scans/s over a mass range of m/z 85–500.
Metabolite data were processed in Rstudio version 4.4.0 (Posit PBC, Boston, MA, USA) using the pheatmap package. Heatmaps were generated to visualize row-scaled relative abundances of metabolite group means, employing a navy-white-red color gradient to represent low, mean, and high values, respectively. Statistical significance was determined via one-way ANOVA followed by Tukey’s HSD test (P < 0.05), with significant differences indicated by letter annotations directly on the heatmap tiles.
2.3. Strain-Based Comparative Analysis
A strain-based comparative strategy was adopted based on limited literature addressing the specific impact of raisin syrup sourdough on white bread aroma and shelf life. Dominant microorganisms typical of raisin syrup/grape fermentations were first identified via literature synthesis. These microbial profiles were subsequently utilized as a reference framework to correlate specific sourdough microbial compositions with the observed changes in aroma development and shelf-life stability.
2.4. Aroma Capture and Volatile Extraction
To analyze the VOCs and aromatic profile during the shelf-life period (D0–D3), bread crumb samples (inner part) were prepared by cutting into 5 mm cubes followed by homogenization. Subsequently, 2 g of the prepared sample was hermetically sealed in 20 mL precision-thread headspace vials equipped with PTFE/silicone septa to maintain an airtight environment. The analysis was performed using a sequential dual-step Dynamic Headspace–Multi-Volatile Method (DHS–MVM) implemented on a GERSTEL Multipurpose Sampler (MPS) RoboticPro System (GERSTEL GmbH & Co. KG, Mülheim an der Ruhr, Germany), a methodology specifically suited for the analysis of high-ethanol and high moisture samples [12]

Table 3.
Operation parameter of Dynamic Headspace–Multi-Volatile Method for aroma capturing.
| Parameter | Step 1: Adsorbent Carbopack BX (Top/Middle) | Step 2: Adsorbent Tenax TA (Middle/Base) |
|---|---|---|
| Incubation Temp | 25 °C | 80 °C |
| Trapping Volume | 650 mL | 3500 mL |
| Trapping Flow | 100 mL/min | 100 mL/min |
| Trap Temp | 30 °C | 40 °C |
| Drying Volume | 300 mL | 0 mL |
| Transfer Heater | 150 °C | 150 °C |
The DHS–MVM approach capture the aroma profile utilizing the distinct affinities of two specialized adsorbents with operation parameters detailed in Table 1. The volatile collection proceeds in a two-stage process. In the first stage, Carbopack BX is employed to trap highly volatile and polar constituents, including low-boiling compounds that represent top-to-middle notes. This stage involves a low-temperature incubation followed by a dedicated drying phase, which effectively removes ethanol and residual moisture to prevent column saturation. Subsequently, Tenax TA is used in the second stage to capture mid-range to high-boiling point volatiles, specifically targeting middle-to-base notes and heavier semi-volatile aroma compounds [12]. By elevating the incubation temperature and increasing the trapping volume, the system facilitates the release and collection of less volatile, higher molecular weight compounds to achieve a more comprehensive aroma capture. Following these sequential collection phases, the volatiles accumulated on both adsorbents were thermally desorbed, concentrated, and injected into the GC system for analysis.
2.5. GC × GC-TOFMS Analysis
Volatile compounds were analyzed using a LECO Pegasus BT 4D GC × GC–TOFMS (LECO Corporation, St. Joseph, MI, USA). The system utilized an automated injection sequence where desorbed analytes were transferred to the chromatographic interface. The injector temperature was maintained at 230 °C, while the transfer line and ion source temperatures were held at 250 °C and 255 °C, respectively.
Chromatographic separation was achieved using a two-dimensional setup consisting of a polar primary column (InertCap Pure-Wax, GL Sciences Inc., Tokyo, Japan) [13] to facilitate polar separation, followed by a non-polar secondary column (InertCap 5MS, GL Sciences Inc., Tokyo, Japan) [14] for boiling point separation. The primary column oven was programmed to start at 40 °C (held for 1 min), increased to 100 °C at a rate of 10 °C min⁻¹, and finally ramped to 250 °C at 5 °C min⁻¹ with a final hold time of 10 min.
A modulation period of 6.5 s was employed to ensure effective trapping and release of analytes between the two dimensions. High-purity helium served as the carrier gas, and the TOF-MS was operated with a mass range of m/z 35–600 and an acquisition rate of 200 spectra/sec. Relative abundances were obtained from total ion chromatograms (TIC) following standard metabolite-profiling practices. A blank extract was used to identify and eliminate system-derived artifacts. Peaks likely associated with column bleeding or instrument-related contaminants were reduced by excluding compounds containing terms such as “glycol”, “silan”, “siloxan” or “crown” from the dataset. In addition, compound names were manually reviewed to remove obvious duplicates or inconsistent entries. These steps were intended to minimize the inclusion of instrumental noise and improve the likelihood that the remaining chromatographic peaks represented meaningful VOC features.
2.6. Chromatographic Identification and Statistical Screening
Data acquisition and processing were conducted using ChromaTOF software (version 5.54.48.070156; LECO Corporation, St. Joseph, MI, USA). Qualitative identification of VOCs was achieved through a combination of external retention-index calibration and spectral-library matching. Specifically, a C9–C40 n-alkane mixture standard (cat. no. 1021-58325, GL Sciences Inc., Tokyo, Japan; 50 µg mL−1 each) was analyzed under identical GC × GC-TOF-MS conditions to establish reference 1D and 2D retention times. To maximize the discovery of low-abundance and previously unreported VOCs—thereby establishing a comprehensive baseline for future studies—mass spectra were matched against the NIST 20 Mass Spectral Library (National Institute of Standards and Technology, Gaithersburg, MD, USA) and Wiley 11 Mass Spectral Library (Wiley, Hoboken, NJ, USA). A similarity threshold of 650 was applied for these matches; consequently, all resulting identifications are considered tentative.
For data normalization, peak areas were calculated as a percentage of the total peak area within each sample. These relative abundance values are reported as the mean ± SD of three biological replicates, as no absolute quantification was performed. Statistical exploration was subsequently carried out using JMP Pro 17 (SAS Institute Inc., Cary, NC, USA), which included Principal Component Analysis (PCA), Hierarchical Clustering Analysis (HCA), and heatmap visualization. Initial indicators of potential differences between groups were assessed using Student’s t-test and one-way ANOVA, with a significance threshold set at p < 0.05.
To identify differentially expressed VOCs, volcano plot analyses were performed using Rstudio version 4.4.0 (Posit PBC, Boston, MA, USA) through a total of ten pairwise comparisons structured to capture the volatile profile across two distinct analytical dimensions (Table 2). Longitudinal analysis to track temporal changes within each group, and cross-sectional analysis to evaluate disparities in aroma profile at each sampling point. Within this framework, a feature was deemed a potentially differential marker only when it satisfied a dual-threshold criterion of statistical significance at p < 0.05 and a fold-change magnitude of |log_2(FC)|>=1.0. These thresholds were applied to filter the dataset, ensuring that only compounds with the most biologically and chemically relevance were retained for subsequent mechanistic interpretation.”
Table 4.
Experimental Design for Pairwise Differential Comparisons.
| Comparison Dimension |
Reference Group (Control) | Target Group (Experimental) |
Objective | Count |
|---|---|---|---|---|
| Longitudinal | Day 0 (Baseline) | Day 1, Day 2, Day 3 | To identify aroma profile shifts induced by storage time | 6 pairs |
| Cross-Sectional | Yeast Sourdough | Raisin Sourdough | To identify disparities of aroma profile at each specific time point. | 4 pairs |
2.7. Aroma Evolution Analysis via Dumbbell and Sparkline Plots
A backward-tracing approach, initiated from key volatile markers identified via volcano plot analysis, was employed to monitor the continuous evolution of selected key volatile markers. This method integrated dumbbell plots with sparkline-normalized trend lines to visualize temporal shifts from the post-baking starting point (Day 0) to the end of shelf life (Day 3). To facilitate a direct comparison between markers across varying concentration magnitudes (e.g., 105 vs.108), data were normalized to a unified scale. Day 3 served as the primary benchmark for assessing differences at the end of shelf life and tracing the aroma changes during storage.
Volatile markers were initially screened based on their -log10(P) values. To avoid selection bias from fold-change inflation in compounds with near-zero baselines, a stratified selection strategy was implemented. Components were categorized by their metabolic flux between Day 0 and Day 3 as either depletion-type (Day 3 < Day 0) or generation-type (Day 3 > Day 0). Representative markers from both categories were then retrieved from the significant regions of the volcano plots to ensure a balanced representation of the aroma transformations.
A manual quality control process was further applied to identify and exclude exogenous contaminants (e.g., plasticizers) via mass spectral library matching. The identified markers were categorized into two panels based on their abundance at Day 3. Panel A (Raisin-Dominant) consisted of compounds with significantly higher peak areas in the raisin sourdough group at the end of the shelf life. Conversely, Panel B (Yeast-Dominant) included markers that exhibited higher abundance in the commercial yeast control. This classification was employed to distinguish between the final aroma outcomes and the temporal changes of the samples.
To account for initial disparities in volatile levels, raw peak area intensities at Day 0 were analyzed alongside normalized data. This approach quantified the absolute baseline abundance of volatile compounds provided by the raisin sourdough, establishing a reference for evaluating subsequent flavor preservation throughout the shelf-life period.
3. Results and Discussion
3.1. Heatmap and Cluster Analysis
The total number of detected aroma compounds remained stable across all groups, fluctuating minimally between 760 and 765 throughout the shelf life. Specifically, counts for the Yeast and Raisin groups shifted only slightly from D0 to D3 (764 to 761 and 760 to 764, respectively). Despite this quantitative stability in the number of detected species, Hierarchical Cluster Analysis (HCA) revealed substantial qualitative shifts in relative abundance as fermentation progressed (Figure 1).
The HCA dendrogram exposed a critical divergence in the kinetic progression of the two groups. The first major cluster grouped the baseline samples (Raisin D0 and Yeast D0) alongside Yeast D1, indicating that the Yeast group experienced a pronounced metabolic lag, retaining a volatile profile virtually indistinguishable from the unfermented baseline during the first 24 hours. In sharp contrast, Raisin D1 bypassed this lag phase, clustering immediately with the advanced fermentation stages (Raisin D2/D3 and Yeast D2/D3). This distinct grouping pattern implies that the Raisin samples progressed significantly faster, undergoing a rapid compositional transition within the first day that the Yeast samples did not achieve until later stages, which showed the same trend as [15].
These temporal dynamics were visually corroborated by the heatmap, which displayed clearly defined data structures organized into two opposing metabolic blocks. An early-stage cluster consisted of compounds with high initial abundance at D0 that were depleted in later stages, likely representing substrate-derived precursors. Conversely, a distinct late-stage cluster—comprising metabolites absent at baseline—became highly abundant by D2 and D3, characterizing the establishment of a mature fermentation metabolome [16].
3.2. PCA Analysis
Principal Component Analysis (PCA) was employed to visualize metabolic trajectories, with the first two components accounting for 67.8% of the total variance (Figure 2). PC2 clearly delineated the samples by biological origin—Yeast in the positive region and Raisin in the negative—indicating that both groups maintain intrinsically distinct chemical signatures throughout fermentation.
Simultaneously, PC1 captured the temporal progression from baseline (D0) to maturity (D2/D3). While both groups followed a synchronized left-to-right trajectory reflecting shared fundamental reactions, their kinetic rates differed significantly. The Yeast samples exhibited a gradual progression with a metabolic lag at D1. In contrast, the Raisin sourdough displayed substantial spatial displacement within the first 24 hours. This rapid transit confirms that the Raisin sourdough undergoes an accelerated maturation process, achieving a stable volatile profile significantly earlier than the industrial yeast control, consistent with previous findings [17].
3.3. Primary Metabolites Analysis and Strain-Based Comparative Analysis
To provide necessary biochemical context for the evolution of functional groups and bread aroma during shelf life, key primary metabolites were briefly evaluated. This assessment, supplemented by a strain-based comparison with existing literature on dominant sourdough microorganisms, establishes a reference framework for interpreting the mechanisms driving aroma development. By defining substrate availability and the physiochemical environment, these data provide insights into how raisin sourdough fermentation reshapes the dough matrix, thereby contribute to a mechanistic basis for the aromatic shifts observed during storage.
The Raisin-Sourdough group exhibited a significant enrichment of total free amino acids compared to the Yeast control. This elevation is particularly pronounced in hydrophobic residues such as Phenylalanine, Leucine, and Isoleucine (Figure 3). Beyond indicating active proteolysis, these specific residues serve as critical substrates for the Ehrlich Pathway, fueling the synthesis of complex aroma-active compounds.
In terms of organic acids, the profiles differed markedly. The Raisin group is dominated by Lactic and Citric acids, whereas the Yeast group exhibits higher levels of Succinic acid (Figure 3). The substantial surge of Lactic acid in the Raisin group establishes a low-pH environment, which is the primary driver for acid-induced hydrolysis and chemical esterification within the bread.
Carbohydrate metabolism displayed a similarly contrast. The Yeast control displayed metabolic depletion, with consistently low sugar levels (Day 0–3) suggesting insufficient enzymatic activity or limiting retrogradation effects. Conversely, the Raisin-Sourdough group demonstrated a significant net accumulation of sugars (Figure 3), implying that acid hydrolysis driven by organic acids continued to degrade the starch matrix post-baking faster than the sugars were consumed. By enriching Hydroxyl (-OH) content and acting as a substrate for non-enzymatic browning, these retained sugars sustain the aromatic complexity that is depleted in the control group
Overall, these metabolic shifts confirm that the Raisin substrate generates a distinct acidic environment enriched with flavor precursors and residual sugars. This abundant reservoir of non-volatile metabolites likely contributes to the sustained complexity of the aroma profile observed during the shelf life.
Table 5.
Table 3. Dominant Microorganisms Identified in Raisin and Grape Sourdoughs.
Table 5.
Table 3. Dominant Microorganisms Identified in Raisin and Grape Sourdoughs.
| Strain Name | Species | Reference |
|---|---|---|
| Lactobacillus paracasei | LAB | [15,18] |
| Lactobacillus brevis | LAB | [1,19] |
| Pediococcus pentosaceus | LAB | [19,20] |
| Weissella cibaria | LAB | [19] |
| Lactobacillus plantarum | LAB | [1] |
| Lactobacillus sanfranciscensis | LAB | [4,21] |
| Candida krusei | Yeast | [22] |
| Torulaspora delbrueckii | Yeast | [22] |
| Hanseniaspora uvarum | Yeast | [22] |
| Hanseniaspora vineae | Yeast | [23] |
Alongside these metabolic characterizations, the potential dominant microorganisms from existing literature were categorized into Lactic Acid Bacteria (LAB)—such as L. paracasei, L. brevis, and W. cibaria—and Yeasts (e.g., C. krusei, H. uvarum) (Table 3). Primary metabolites analysis revealed that the raisin syrup sourdough group was characterized by a distinct accumulation of organic acids and free amino acids, contrasting with the depletion observed in the yeast control. This metabolic footprint is critical, as the combination of high lactic acid production and extensive amino acid release suggests the fermentation is driven primarily by the LAB identified in the reference table rather than the yeast species [24].
3.4. Functional Group Analysis
One of the most distinct metabolic signatures observed during the initial shelf life was a rapid shift in alcohols, a trend that directly mirrors the kinetic divergence identified in the HCA dendrogram. The Raisin group exhibited a marked reduction in the relative abundance of alcohols, decreasing by approximately 30% from Day 0 to Day 1, followed by a stabilization phase till Day 3 (22.71%). In contrast, reflecting the temporal lag in aroma profile evolution observed in the cluster analysis, the Yeast control showed a decrease by 7% Day1 and 16% by Day 2 and Day 3 respectively (Figure 4A).
This rapid shift in the Raisin group is likely driven by the specific organic acid profile produced during fermentation. The substantial surge of Lactic acid in the Raisin group establishes a low-pH environment, which serves as the primary driver for chemical esterification. In this acidic environment, acetic acid likely reacts with alcohols to form volatile acetate esters, thereby sequestering alcohols into a stable fruity equilibrium [21].
This chemical transition is supported by the observed ester profiles, which showed 12% higher abundance in the Raisin group compared to the control by Day3. The stability and higher abundance of esters also contribute to the differentiating the maturation profile of the Raisin sourdough from the yeast control observed in HCA and PCA analysis. While the Yeast control exhibited a discernible reduction in esters of nearly 5% (13.09% to 12.44%), the Raisin group remained remarkably stable, showing only a marginal 1% decrease (Figure 4A).
Beyond esterification, the reduction in alcohol content was closely coupled with a significant increase in aldehydes. The Raisin samples showed a consistent enrichment of aldehydes, which maintained a relative abundance of 7.18%–7.68% (D1–D3) after a sharp increase by 40% by Day 1 compared to the lower and more consistent levels in the Yeast control (4.15%–5.63%) (Figure 4A). This inverse correlation suggests chemical oxidative conversion, where the biochemical environment and residual enzymatic potential established by the sourdough fermentation facilitate the transformation of alcohol precursors into branched-chain aldehydes [3].
Complementing these shifts in alcohol and aldehyde profiles, sourdough fermentation significantly enriched the pool of total free amino acids as pointe out in the primary metabolite analysis. While the active Ehrlich pathway ceases upon baking, the high retention of these specific amino acids serves as a critical precursor reservoir during storage. Instead of biological metabolism, these residues likely participate in non-enzymatic Strecker degradation, a process converts branched-chain amino acids like leucine and valine into their corresponding Strecker aldehydes. This continuous generation explains why the sourdough samples maintained higher levels of these malty and nutty aldehyde markers compared to the control, effectively offsetting the loss of volatiles due to staling [25,26].
To further validate the nature of this aldehyde enrichment, it is essential to distinguish between desirable degradation and undesirable lipid oxidation. While aldehydes can originate from both pathways, functional group analysis confirms the positive nature of the aldehydes in the sourdough samples. This differentiation is likely modulated by the distinct acid hydrolysis mechanisms inherent to the sourdough process. Straight-chain hydrocarbons, established markers for lipid oxidation and rancidity, were 20% more abundant in the Yeast control (16.84%) compared to the Raisin bread (14.15%) at Day 3 (Figure 4A). This suppression in the Raisin group is attributable to the acidification caused by high Lactic and Citric acid content, which inhibits lipase enzyme activity [1]. By preventing the hydrolysis of fats, the acidic environment suppresses the formation of rancid straight-chain aldehydes typically associated with aging [4]. Therefore, the elevated aldehyde content in Raisin samples is not an indicator of rancidity, but rather a positive marker of the proteolytic and oxidative transformations facilitated by sourdough fermentation. The resulting abundance of branched-chain aldehydes stands in sharp contrast to the oxidative off-flavors associated with lipid degradation, aligning with the clear separation observed in the HCA and PCA analysis.
In the Raisin sourdough, cyclic heteroatomic compounds exhibited a marked surge within the first 24 hours (Figure 4B), more than doubling in relative abundance (2.92% to 6.60%), whereas the Yeast control showed a less pronounced increase (2.48% to 4.97%). This rapid enrichment aligns with the ‘fast-forwarded’ maturation profile observed in HCA and PCA analyses. Mechanistically, the accumulation of sugars and hydrophobic amino acids (Phenylalanine, Leucine) in the raisin sourdough fueled a more extensive Maillard reaction during baking. Consequently, the observed surge likely reflects the gradual release of these pre-formed cyclic structures from the crumb matrix, rather than active synthesis during storage [15].
Similarly, the accumulation of amides and phenols further clarifies the divergence between the two groups. By Day 3, amide levels in Raisin bread were 35% higher than in the Yeast control (Figure 4B), consistent with the rapid volatile evolution mapped in the HCA and PCA analysis. Simultaneously, phenols were 60% more abundant in the Raisin samples (1.48%) compared to the control (0.92%). These elevated concentrations suggest a more intensive maturation process and are likely driven by acid accumulation, which activates proteolytic enzymes and solubilizes bound phenolic acids effectively trapped within the starch-protein network [4], directly increasing the concentration of savory flavor compounds and complex aroma markers.
In summary, integrating these compositional details with the divergent shelf-life development highlights the superior aromatic quality established by the raisin syrup sourdough compared to the yeast control. This divergence offers a critical explanation for the stability noted in the HCA, where the total number of detected compounds remained virtually stable (~760–765) across both groups. While shelf-life progression typically implies a net loss of volatiles, the data suggest that the Yeast control likely maintained numerical stability through the accumulation of oxidative byproducts. In contrast, the Raisin group sustained the count by more actively preserving and generating desirable aroma compounds. Thus, the sourdough process effectively prioritized aromatic integrity and freshness over the oxidative deterioration observed in standard yeast bread.
3.5. Volcano Plot Analysis
To comprehensively map the metabolic shifts driving the observed separation, we performed a systematic differential analysis using volcano plots. The complete set of 10 pairwise comparison volcano plots are provided in Supplementary Figures S1–S10.
Among these comparisons, the longitudinal analysis revealed distinct aroma evolution between the two groups. In the Raisin sourdough (Figure 5B), the volatile profile underwent an immediate and extensive reconfiguration upon initial storage. A total of 182 differential metabolites were identified within the first 24 hours. This substantial aromatic development continued to evolve, with the number of differential features increasing to 200 by Day 2 and reaching 275 by Day 3.
In sharp contrast, the Yeast control (Figure 5A) exhibited a more gradual progression. Only 99 compounds were identified as significantly differential between D0 and D1. The extent of metabolic change progressively increased over time, with 150 differential metabolites identified at Day 2 and 230 by Day 3, confirming the staggered aromatic progression previously observed in the HCA and PCA results
These quantitative trends are corroborated by specific chemical markers aligned with previous research, primarily those employing HS-SPME-GC-MS or similar headspace extraction techniques. The sourdough profile is characterized by elevated levels of several volatiles documented in the literature: 2-heptanone (fruity and blue cheese notes), 2-furanmethanol (burnt sugar and caramel aromas), 2,4-decadienal (fatty and fried-onion scents), and 1-penten-3-ol (grassy and fresh tones). These findings are consistent with the studies of [15,17,27].
Conversely, the yeast control features 1-propanol, acetoin, and hexanoic acid, matching the metabolic profiles reported by Aponte et al. 2013 and Warburton et al. 2022. These compounds result in a traditional bakery scent profile. Specifically, 1-propanol introduces a peanut-like note, acetoin provides classic buttery and creamy notes, and hexanoic acid contributes a slightly sour or fatty undertone. This broad alignment with literature confirms that while yeast leavening follows a standard buttery progression, raisin sourdough rapidly develops a diverse metabolic profile defined by fruity, toasted, and green aromatic notes.
3.6. Dumbell Plot and Sparkline Analysis
While volcano plots are vital for identifying markers with high statistical reliability based on -log10 p values, they primarily function as static omics profiles that indicate whether a compound is significantly present or absent, rather than reflecting its absolute concentration or revealing dynamic development over time. To systematically evaluate the impact of raisin sourdough on bread aroma, dumbbell plots integrated with sparkline-normalized trend lines were employed. This approach visualizes temporal shifts from the post-baking baseline (Day 0) to the end of shelf life (Day 3), specifically focusing on the previously identified and selected key volatile markers.
At the end of shelf life (Day 3), the dumbbell spans in Figure 6 reveal a sharp stratification between the sourdough and control groups. This disparity is driven by the interplay between post-baking flavor baseline at Day 0 (Figure 7) and divergent kinetic rates during storage.
For the markers in Panel A, the dumbbell plot highlights a profound magnitude of difference, with the raisin sourdough (Red) maintaining significantly higher log10 peak areas than the yeast control (Blue) (Figure 6). This dominance is primarily underpinned by a massive initial flavor load established immediately post-baking (Day 0) (Figure 7), where the sourdough fermentation rapidly generated high concentrations of complex esters and alcohols, effectively enriching the bread with desirable aromas before storage began. Specifically, benzenepropanol, which showed >80% relative abundance in the raisin group at Day 0 (Figure 7), is noted for contributing fruity, floral, and balsamic aroma to the crumb [3]. Similarly, Octanoate <isopentyl->, also known as isopentyl octanoate, a marker solely dominant in the sourdough, is associated with a distinct fruity and banana-like flavor typical of non-conventional yeast fermentation [28]. 9-Decenoic acid, ethyl ester was also identified as another key contributor providing a sophisticated aromatic layer characterized by waxy, fruity, and milky notes [28].
Beyond these primary markers, 2-Ethyl-2-butenal was detected. Though not being reported a typical key aroma in traditional bread, this unsaturated aldehyde generally contributes to green, grassy, or pungent notes in sourdough [29]. Notably, our analysis also identified 2-Propanamine, N, 2-dimethyl-. While currently unreported in standard bread flavor databases, this amine is recognized as a potential VOCs in food products resulting from specific bacterial fermentation processes and may contribute to cheesy or pungent fermented nuances [30]. The detection of such trace, undocumented compounds highlighted the superior resolving power and innovation of the 2DGC method employed in this study, enabling the characterization of novel flavor contributors that traditional methods might miss.
Beyond this initial advantage, the kinetic data reveals a superior stability mechanism where these compounds exhibited a flat or shallow trajectory in the raisin group. Such trends indicate that the raisin sourdough not only produced these favorable aromas faster during fermentation but also stabilized them against volatilization to preserve the fruity and floral profile throughout the shelf life.
Conversely, Panel B characterizes the chemical signature of the yeast control, comprising a broader spectrum of compounds including isobutanol, acetoin, 2,3-Pentanedione, butanone <3-hydroxy-4-phenyl-2->, and 2-methyl-2-oxiranecarboxylic acid methyl ester, where the blue markers shift to the right side of the dumbbell plot (Figure 6). Unlike the stable preservation seen in Panel A, the dominance of this profile is driven by two distinct mechanisms: the accumulation of standard fermentation metabolites and, more critically, the active generation of oxidation products.
Regarding the metabolic baseline (Figure 7), the yeast control retained higher levels of simple alcohols and ketones. Isobutanol is a characteristic alcohol via the Ehrlich pathway during standard yeast fermentation and is known to contribute fruity, alcoholic, or malty aromas [25]. Similarly, 2,3-Pentanedione was prevalent in the control group where this metabolite, typically produced by Saccharomyces cerevisiae or Maillard reactions, imparts creamy, buttery, oily, or cheesy notes to the crumb [31]. The persistence of these compounds highlights that the yeast control followed a basic metabolic trajectory by retaining simple fermentation byproducts which were otherwise suppressed or chemically converted in the sourdough environment.
However, the most significant kinetic divergence is observed in the generation of off-flavor precursors. A prime example is 9,17-Octadecadienal, (Z)-, which is identified as an unsaturated aldehyde and a common biomarker of lipid oxidation associated with undesirable off-flavors [32]. The kinetic traces reveal a stark contrast in stability, implying while the raisin sourdough maintained this oxidation marker at a consistently low level in flat red line, the yeast control exhibited a distinct upward positive slope in blue from Day 0 to Day 3. This specific kinetic behavior serves as chemical evidence that the yeast control lacked the antioxidative capacity present in the sourdough system, leading to a faster and more progressive accumulation of lipid oxidation products over the shelf life.
In summary, the raisin sourdough achieved a superior aromatic profile by rapidly synthesizing and stabilizing desirable fruity, green and cheesy markers from Day 0. In contrast, the yeast control was characterized by a malty, buttery, and alcoholic profile typical of standard fermentation, but was kinetically compromised by a faster rate of lipid oxidation.
4. Conclusions
Utilizing comprehensive GC×GC-MS, this study resolved over 760 volatiles in Japanese raisin syrup sourdough, uncovering contributors typically masked by co-elution. Results revealed a kinetic divergence: commercial yeast exhibited a 24-hour metabolic lag, while the raisin syrup starter achieved rapid activation and complex flavor synthesis by Day 1. Specifically, the sourdough developed a sophisticated profile of esters and fruity volatiles, contrasting the standard fermentation notes of commercial yeast.
However, as chemical profiles do not fully reflect perceived flavor, sensory evaluation remains necessary. Furthermore, because resource constraints limited microbial characterization, identifying specific strains is essential to link microbial activity to flavor development and molecular activation mechanisms. This research promotes predictable artisanal practices, providing a blueprint for scaling this Potent flavor modulator. This framework empowers the bakery industry to meet Japanese demand for flavor-complex and clean-label products.
Supplementary Materials
The following supporting information can be downloaded at: Preprints.org.
Author Contributions
J.Z: Data curation; Formal analysis; Methodology; Software; Visualization; Investigation; Writing - original draft; T.M: Funding acquisition; Methodology; Project administration; Resources; Validation; Writing - review & editing; K.S.: Methodology; Resources; Investigation. I.Y.: Resources; Supervision; T.T.: Software; Methodology; S.I. Software; Methodology; K.H.: Resources; Supervision; T.A.: Project administration; Resources; Supervision.
Funding
The project was funded by the Iijima Tojuro Memorial Foundation for Food Science and Technology, Joint Research Grant, Registration Number 3 (FY2021).
Data Availability Statement
The original contributions presented in this study are included in the article. Further inquiries can be directed to the corresponding author.
Acknowledgments
The authors would like to express their sincere gratitude to Mr. Koji Takeya from TSUMUGI Bakery and Cafe for his expert guidance and technical support in bread production.
Conflicts of Interest
The authors declare that they have no known competing financial interests or personal relationships that could have appeared to influence the work reported in this paper.
Abbreviations
The following abbreviations are used in this manuscript:
| LAB | Lactic acid bacteria |
| GC×GC-TOFMS | Gas chromatography–mass spectrometry |
| VOCs | Volatile organic compounds |
References
- Fernández-Peláez, Juan, Candela Paesani, and Manuel Gómez. 2020. ‘Sourdough Technology as a Tool for the Development of Healthier Grain-Based Products: An Update’. Agronomy 10(12):1962. [CrossRef]
- Torreggiani, Andrea, Chiara Demarinis, Daniela Pinto, Angela Papale, Graziana Difonzo, Francesco Caponio, Erica Pontonio, Michela Verni, and Carlo Giuseppe Rizzello. 2023. ‘Up-Cycling Grape Pomace through Sourdough Fermentation: Characterization of Phenolic Compounds, Antioxidant Activity, and Anti-Inflammatory Potential’. Antioxidants 12(8):1521. [CrossRef]
- Lutter, Liis, Ivi Jõudu, and Helena Andreson. 2023. ‘Volatile Organic Compounds and Their Generation in Sourdough’. 573.9Kb. [CrossRef]
- Jean-Yu Hwang and Yung-Shin Shyu. 2015. ‘Influence of Raisin Starter Syrup Concentrations on the Properties of Sourdough and Sourdough Bread’. Journal of Marine Science and Technology 23(4). [CrossRef]
- Górecki, T.; Harynuk, J.; Panić, O. The evolution of comprehensive two-dimensional gas chromatography (GC×GC). J. Sep. Sci. 2004, 27, 359–379. [CrossRef]
- Dias, R.P.; Johnson, T.A.; Ferrão, L.F.V.; Munoz, P.R.; De La Mata, A.P.; Harynuk, J.J. Improved sample storage, preparation and extraction of blueberry aroma volatile organic compounds for gas chromatography. J. Chromatogr. Open 2023, 3, 100075. [CrossRef]
- Nam, S.; De La Mata, A.; Harynuk, J. Automated Screening and Filtering Scripts for GC×GC-TOFMS Metabolomics Data. Separations 2021, 8, 84. [CrossRef]
- Sorochan Armstrong, M.D.; Arredondo Campos, O.R.; Bannon, C.C.; De La Mata, A.P.; Case, R.J.; Harynuk, J.J. Global metabolome analysis of Dunaliella tertiolecta, Phaeobacter italicus R11 Co-cultures using thermal desorption—Comprehensive two-dimensional gas chromatography—Time-of-flight mass spectrometry (TD-GC×GC-TOFMS). Phytochemistry 2022, 195, 113052. [CrossRef]
- Editorial Committee of “Hakkotane to Pan.” (2023) Hakkotane to pan: Kagaku kara ōyō made [Fermented starters and bread: From science to application]. Japan: Asahiya Publishing.
- GL Sciences. (n.d.). https://www.glsciences.com/.
- Pongsuwan, Wipawee, Eiichiro Fukusaki, Takeshi Bamba, Tsutomu Yonetani, Toshiyaki Yamahara, and Akio Kobayashi. 2007. ‘Prediction of Japanese Green Tea Ranking by Gas Chromatography/Mass Spectrometry-Based Hydrophilic Metabolite Fingerprinting’. Journal of Agricultural and Food Chemistry 55(2):231–36. [CrossRef]
- Tsunokawa, Jun, Nobuo Ochiai, Kikuo Sasamoto, and Andreas Hoffmann. n.d. ‘2-Step Multi-Volatile Method (2-Step MVM) for Characterization of Aroma Compounds in Bread’.
- InertCap WAX-HT|Products|GL Sciences. Glsciences.com. 2025. Available online: https://www.glsciences.com/product/gc_capillary_columns/inertcap/00142.html?utm_source (accessed on 20 June 2025).
- InertCap 5MS/NP. GL Science. 2021. Available online: https://www.glsciences.eu/gc-columns/InertCap_5MS-NP_Technical_Information.pdf?utm_source (accessed on 20 June 2025).
- Chiavaro, Emma, Elena Vittadini, Marilena Musci, Federica Bianchi, and Elena Curti. 2008. ‘Shelf-Life Stability of Artisanally and Industrially Produced Durum Wheat Sourdough Bread (“Altamura Bread”)’. LWT - Food Science and Technology 41(1):58–70. [CrossRef]
- Bianchi, Alessandro, Francesca Venturi, Carmelo Palermo, Isabella Taglieri, Luciana Gabriella Angelini, Silvia Tavarini, and Chiara Sanmartin. 2024. ‘Primary and Secondary Shelf-Life of Bread as a Function of Formulation and MAP Conditions: Focus on Physical-Chemical and Sensory Markers’. Food Packaging and Shelf Life 41:101241. [CrossRef]
- Lafuente, Carla, Tiago De Melo Nazareth, Victor Dopazo, Giuseppe Meca, and Carlos Luz. 2024. ‘Enhancing Bread Quality and Extending Shelf Life Using Dried Sourdough’. LWT 203:116379. [CrossRef]
- Aplevicz, Krischina Singer, Jaciara Zarpellon Mazo, Eunice Cassanego Ilha, Andréia Zilio Dinon, and Ernani Sebastião Sant’Anna. 2014. ‘Isolation and Characterization of Lactic Acid Bacteria and Yeasts from the Brazilian Grape Sourdough’. Brazilian Journal of Pharmaceutical Sciences 50(2):321–27. [CrossRef]
- Gordún, Elena, Luis J. Del Valle, Marta Ginovart, and Rosa Carbó. 2015. ‘Comparison of the Microbial Dynamics and Biochemistry of Laboratory Sourdoughs Prepared with Grape, Apple and Yogurt’. Food Science and Technology International 21(6):428–39. [CrossRef]
- Maino, Maria-Luissa, Alina Romina Marc, and Carmen Crina Mureșan. 2024. ‘Functional Plant Substrates in Sourdough Fermentation: Hops, Kombucha, and Grape Pomace’. Hop and Medicinal Plants 32(1–2):35–55. [CrossRef]
- Warburton, Andrea, Patrick Silcock, and Graham T. Eyres. 2022. ‘Impact of Sourdough Culture on the Volatile Compounds in Wholemeal Sourdough Bread’. Food Research International 161:111885. [CrossRef]
- Liu, Yen-Chih, Pei-Shan Wu, Shih-Hua Teng, and Ming-Jiuan Wu. 2023. ‘Identification of Dominant Microbes and Functional Analysis of Sourdough Starters Made of Dried Longan and Raisin’. P. 17 in 2023 IEEE 5th Eurasia Conference on Biomedical Engineering, Healthcare and Sustainability. MDPI.
- Takaya, Masahiro, Takuji Ohwada, and Yuji Oda. 2019. ‘Characterization of the Yeast Hanseniaspora Vineae Isolated from the Wine Grape “Yamasachi” and Its Use for Bread Making’. Food Science and Technology Research 25(6):835–42. [CrossRef]
- Kaseleht, Kristel, Toomas Paalme, Anna Mihhalevski, and Inga Sarand. 2011. ‘Analysis of Volatile Compounds Produced by Different Species of Lactobacilli in Rye Sourdough Using Multiple Headspace Extraction’. International Journal of Food Science & Technology 46(9):1940–46. [CrossRef]
- Xu, Dan, Yao Zhang, Kaixing Tang, Ying Hu, Xueming Xu, and Michael G. Gänzle. 2019. ‘Effect of Mixed Cultures of Yeast and Lactobacilli on the Quality of Wheat Sourdough Bread’. Frontiers in Microbiology 10:2113. [CrossRef]
- Plessas, S., A. Bekatorou, J. Gallanagh, P. Nigam, A. A. Koutinas, and C. Psarianos. 2008. ‘Evolution of Aroma Volatiles during Storage of Sourdough Breads Made by Mixed Cultures of Kluyveromyces Marxianus and Lactobacillus Delbrueckii Ssp. Bulgaricus or Lactobacillus Helveticus’. Food Chemistry 107(2):883–89. [CrossRef]
- Birch, Anja N., Mikael A. Petersen, and Åse S. Hansen. 2013. ‘The Aroma Profile of Wheat Bread Crumb Influenced by Yeast Concentration and Fermentation Temperature’. LWT - Food Science and Technology 50(2):480–88. [CrossRef]
- Pradal, Inés, Stefan Weckx, and Luc De Vuyst. 2025. ‘The Production of Esters by Specific Sourdough Lactic Acid Bacteria Species Is Limited by the Precursor Concentrations’ edited by D. Ercolini. Applied and Environmental Microbiology 91(3):e02216-24. [CrossRef]
- Narisawa Tomoyuki, Ebara Masato, Harada Masanori, Umino Marie, Kaneko Masaaki, and Nakajima Hideo. 2024. ‘The effects of high-ash stream flour on the sourdough properties and the taste and flavor of bread’. Nippon Shokuhin Kagaku Kogaku Kaishi 71(7):231–49. [CrossRef]
- ANTIGEN Co. LTD, Kazakhstan, A. Kondybayev, A. Zhakupbekova, ANTIGEN Co. LTD, Kazakhstan, F. Amutova, ANTIGEN Co. LTD, Kazakhstan, A. Omarova, ANTIGEN Co. LTD, Kazakhstan, M. Nurseitova, ANTIGEN Co. LTD, Kazakhstan, Sh. Akhmetsadykova, ANTIGEN Co. LTD, Kazakhstan, N. Akhmetsadykov, Kazakh National Agrarian University, Kazakhstan, G. Konuspayeva, ANTIGEN Co. LTD, Kazakhstan, B. Faye, and UMR Selmet, Cirad, Montpellier, France. 2018. ‘Volatile Organic Compounds Profiles in Milk Fermented by Lactic Bacteria’. International Journal of Biology and Chemistry 11(2):57–67. [CrossRef]
- Maeda, Tatsuro, Shoko Kikuma, Tetsuya Araki, Gakuro Ikeda, Koji Takeya, and Yasuyuki Sagara. 2009. ‘The Effects of Mixing Stage and Fermentation Time on the Quantity of Flavor Compounds and Sensory Intensity of Flavor in White Bread’. Food Science and Technology Research 15(2):117–26. [CrossRef]
- Quílez, J., J. A. Ruiz, and M. P. Romero. 2006. ‘Relationships Between Sensory Flavor Evaluation and Volatile and Nonvolatile Compounds in Commercial Wheat Bread Type Baguette’. Journal of Food Science 71(6). [CrossRef]
Figure 1.
Heatmap and hierarchical clustering analysis of aroma compounds in Yeast and Raisin samples across four time points (D0–D3). The dendrogram on the left illustrates the clustering of sample groups based on similarity in their profiles. The dendrogram at the bottom represents the clustering of individual compounds. The color scale represents the relative abundance of each compound with red indicating high intensity and blue indicating low intensity. Samples are labeled by group (Yeast/Raisin) and day (D0, D1, D2, D3).
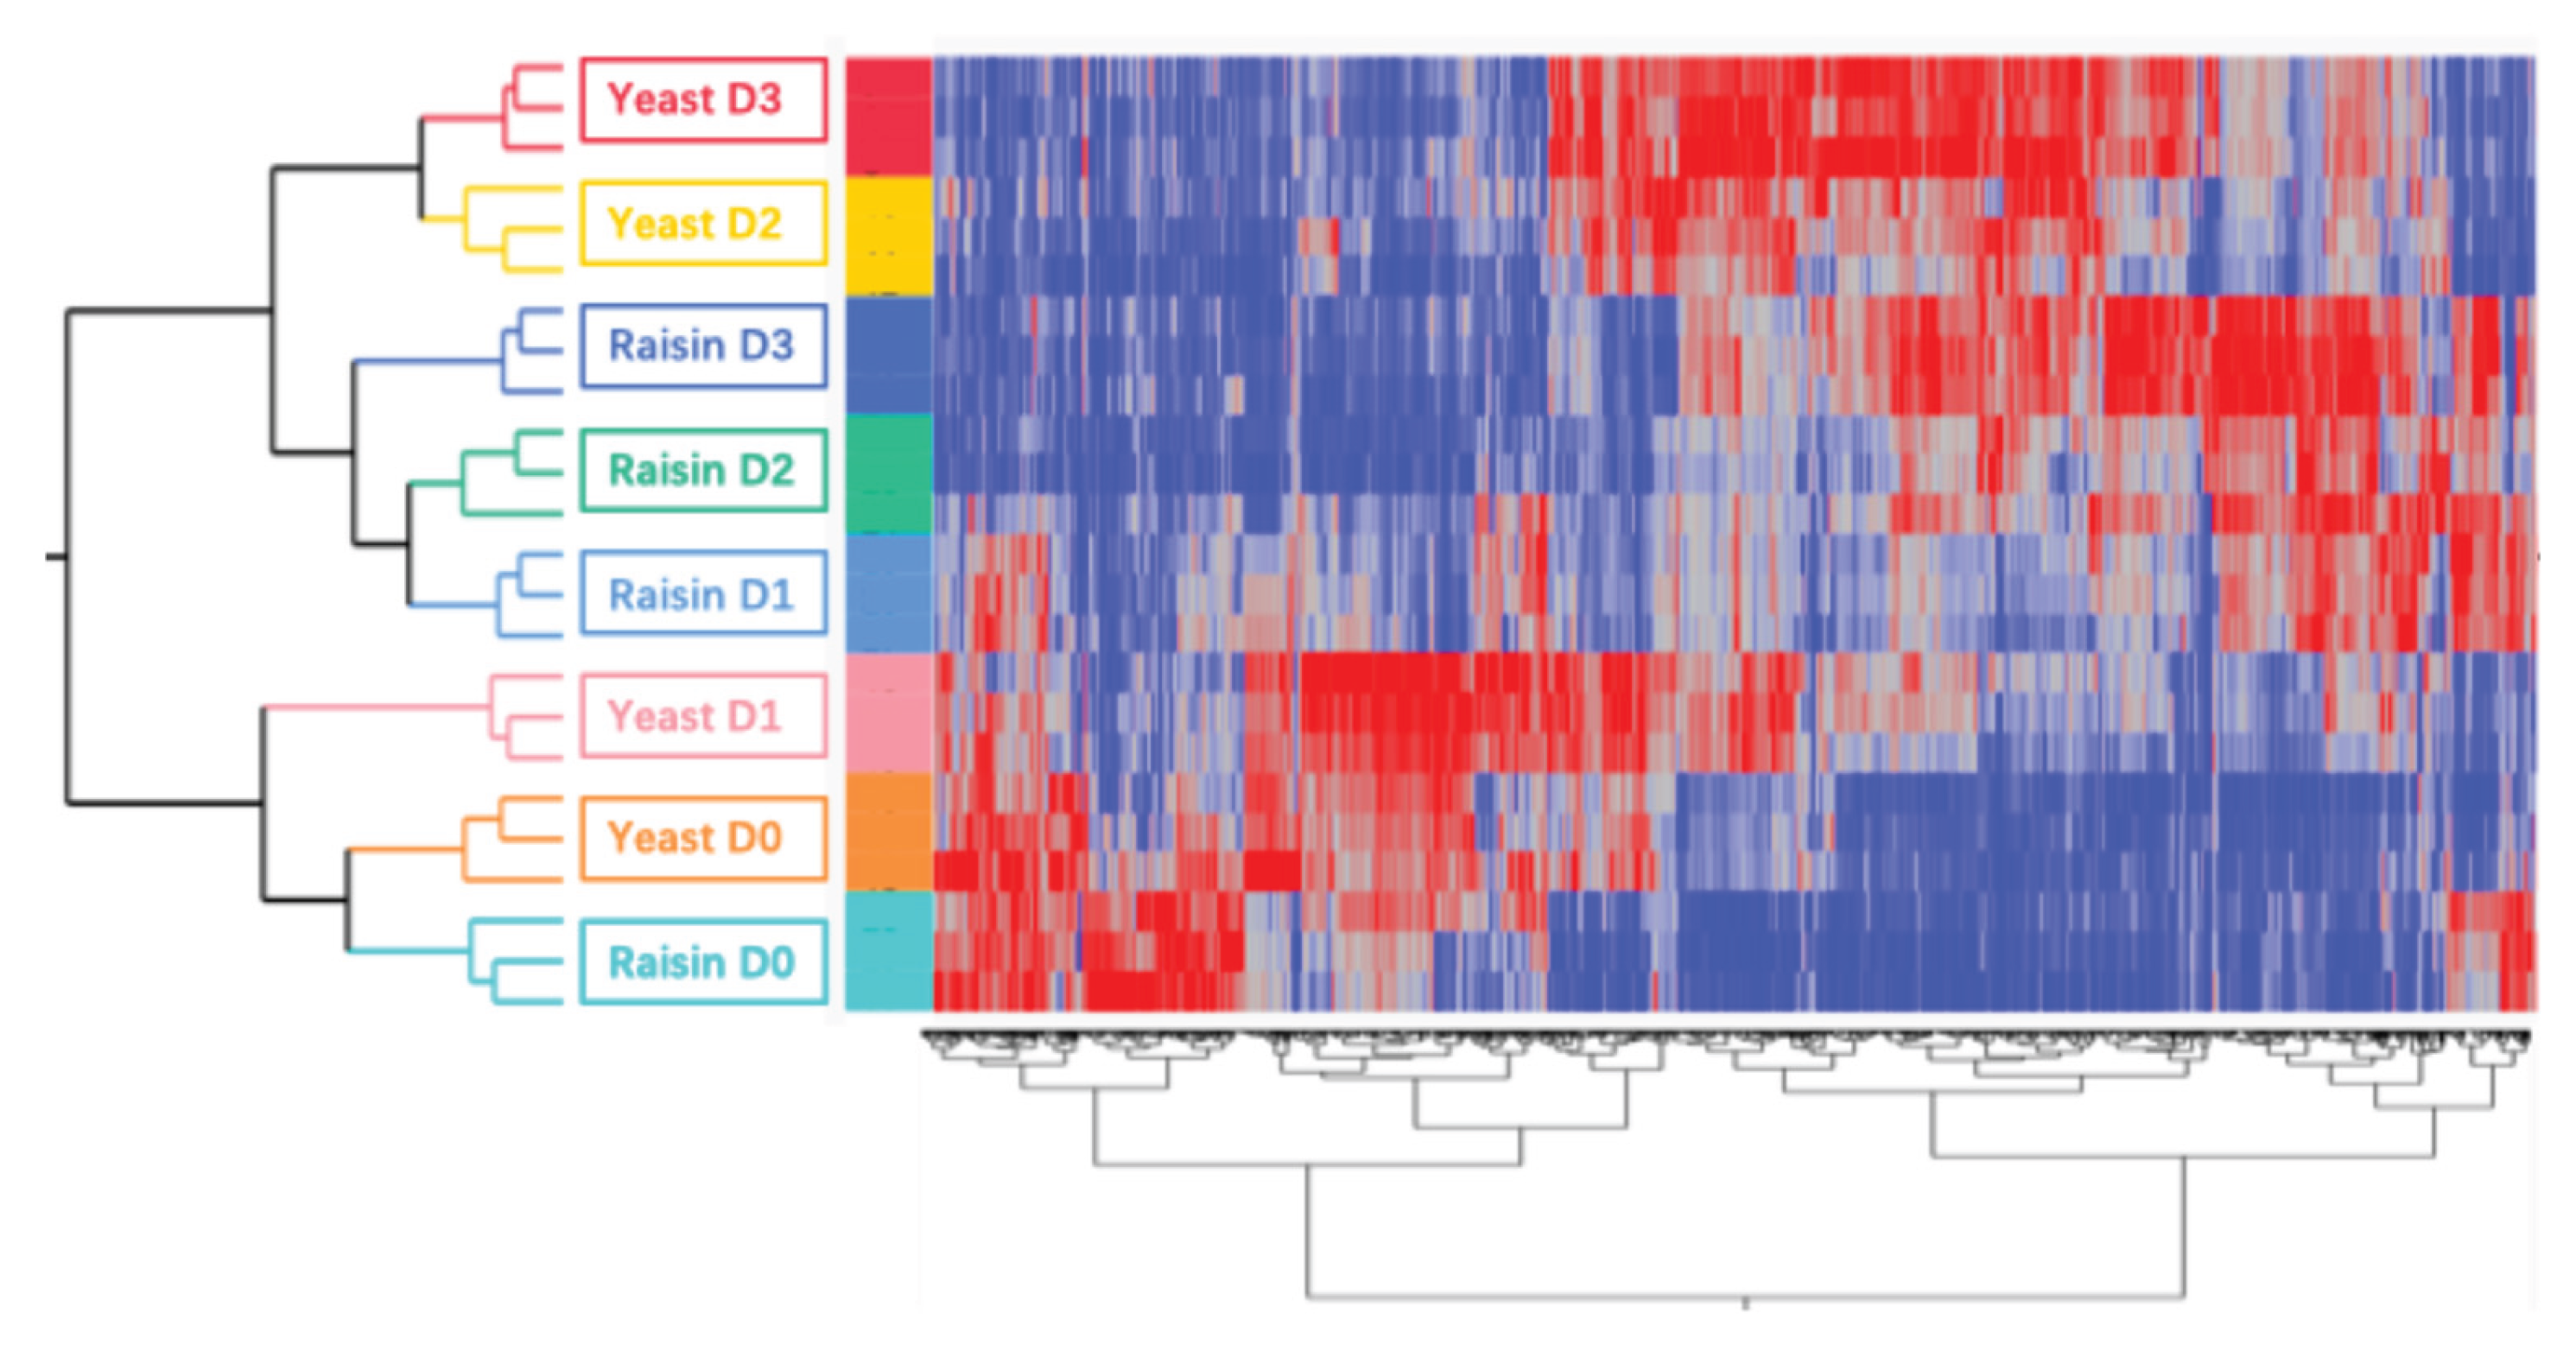
Figure 2.
Principal Component Analysis (PCA) score plot of aroma compounds in Yeast and Raisin samples during fermentation. The plot displays the distribution of samples along the first two principal components, PC1 and PC2. The X-axis (PC1) explains 47.2% of the total variance, while the Y-axis (PC2) explains 20.6%. Samples are colored by group and fermentation day: Yeast samples (shades of orange/red) are located in the upper quadrant, while Raisin samples (shades of blue) are located in the lower quadrant. The progression from D0 to D3 corresponds to a shift along the PC1 axis.
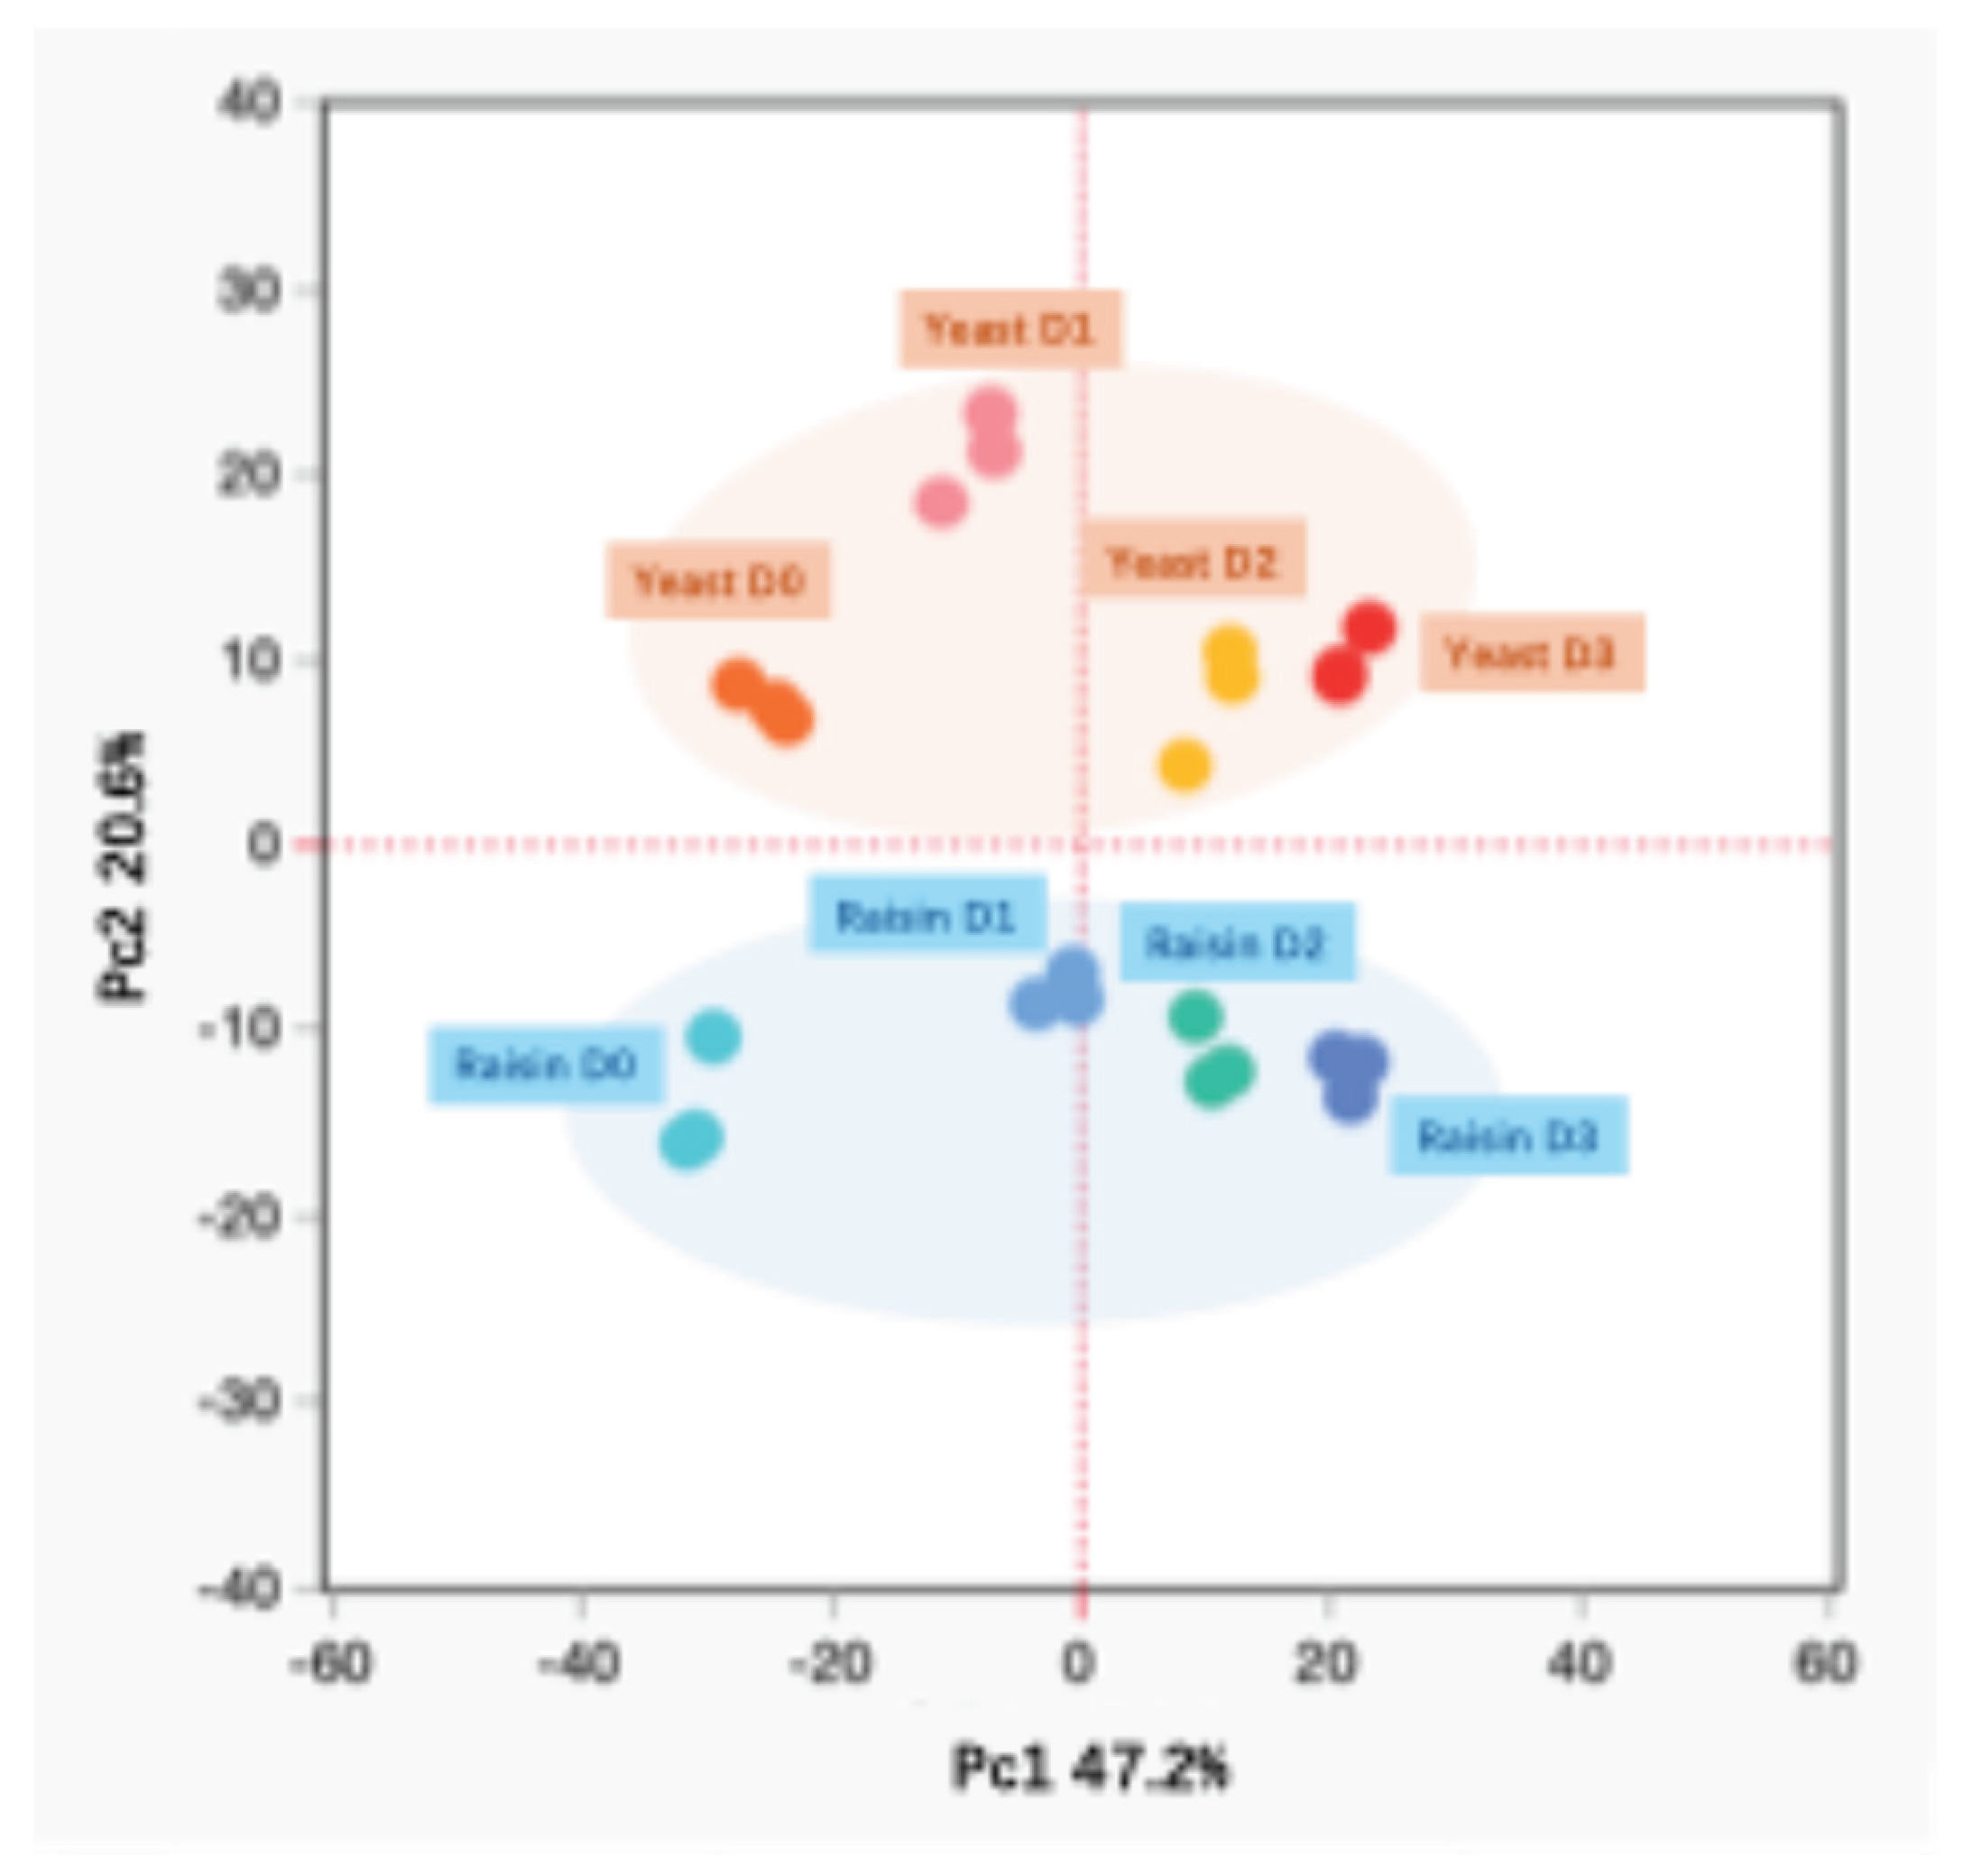
Figure 3.
Heatmap visualization of metabolite profiles in Yeast and Raisin groups during shelf life (D0 vs. D3). The color scale represents the relative abundance of each metabolite, normalized by row (Z-score); red indicates higher relative content, and blue indicates lower relative content. The colored bars on the left classify metabolites into Amino acids (green), Organic acids (purple), and Oligosaccharides (orange). Statistical analysis was performed using one-way ANOVA followed by Tukey’s HSD post hoc test. Different lowercase letters (a–d) within each row indicate statistically significant differences between groups (p < 0.05). Groups sharing the same letter are not significantly different. Data are presented as means (n=3).
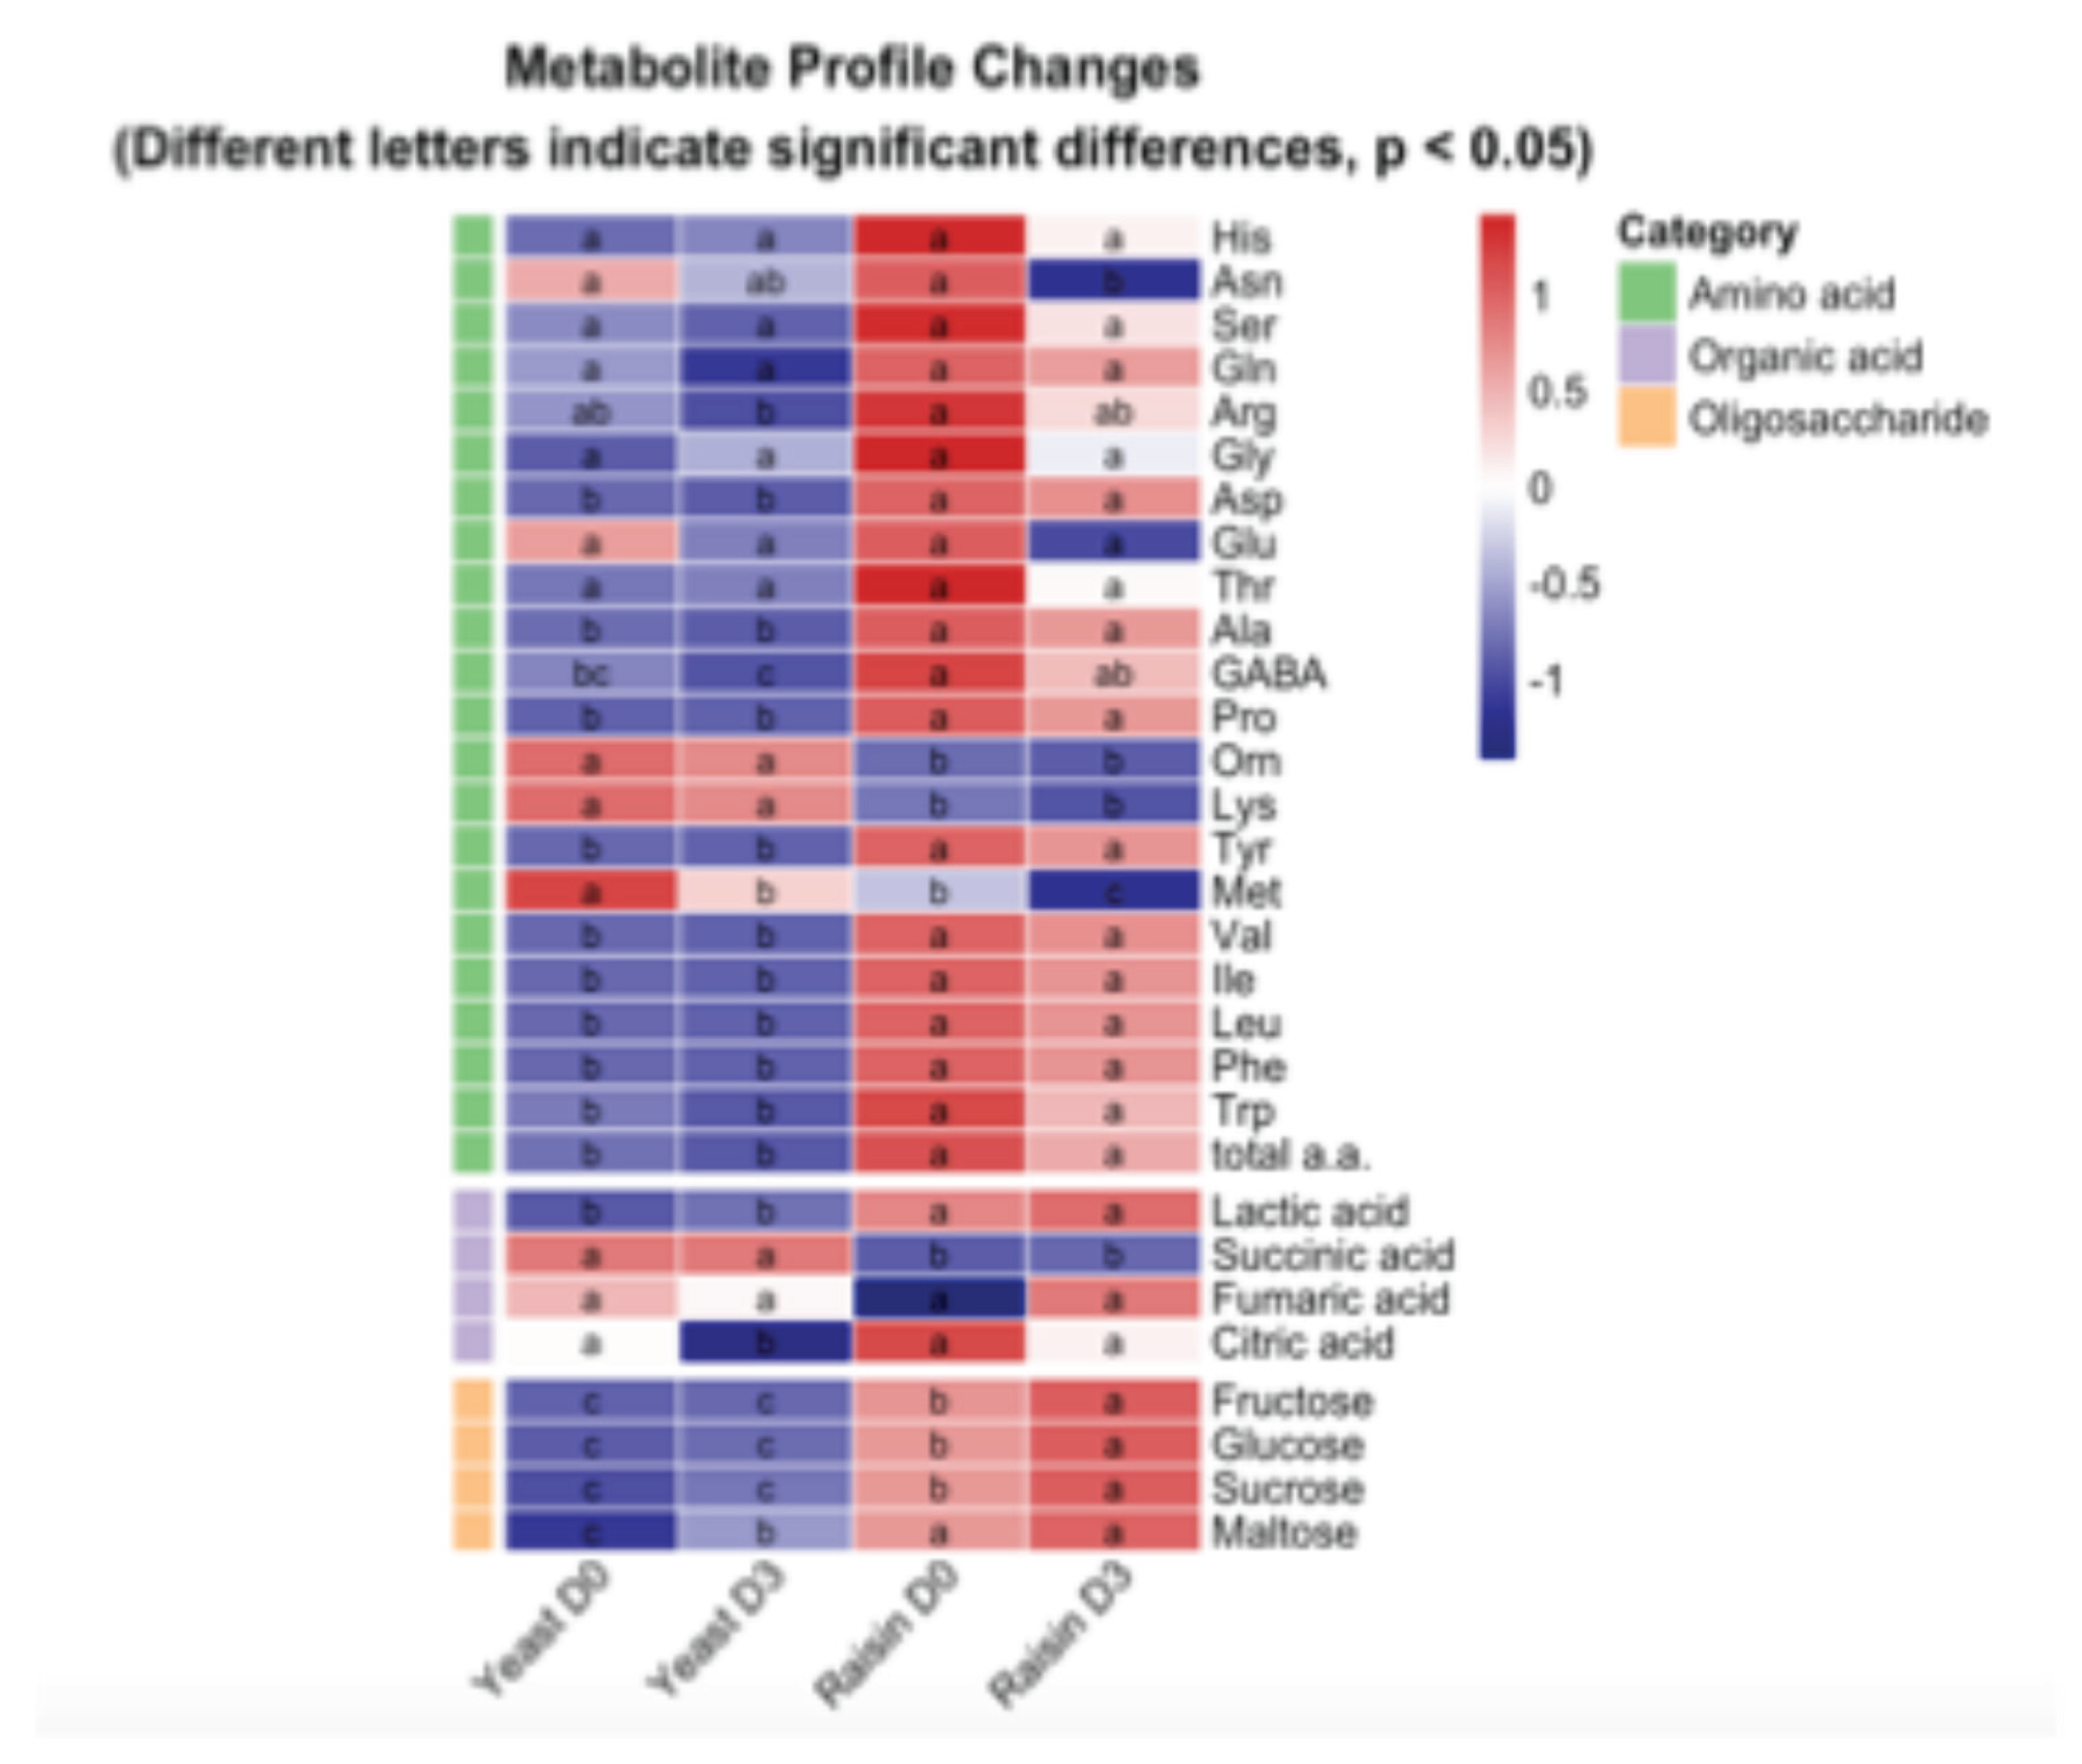
Figure 4.
Relative abundance of volatile functional groups in Raisin and Yeast bread during shelf-life storage. (A) Distribution of major functional groups (high relative abundance), including alcohols, aldehydes, and esters. (B) Distribution of minor functional groups (low relative abundance), including amides, amines, and phenols. The stacked bars represent the percentage of the total peak area for each functional group across four time points (D0–D3).
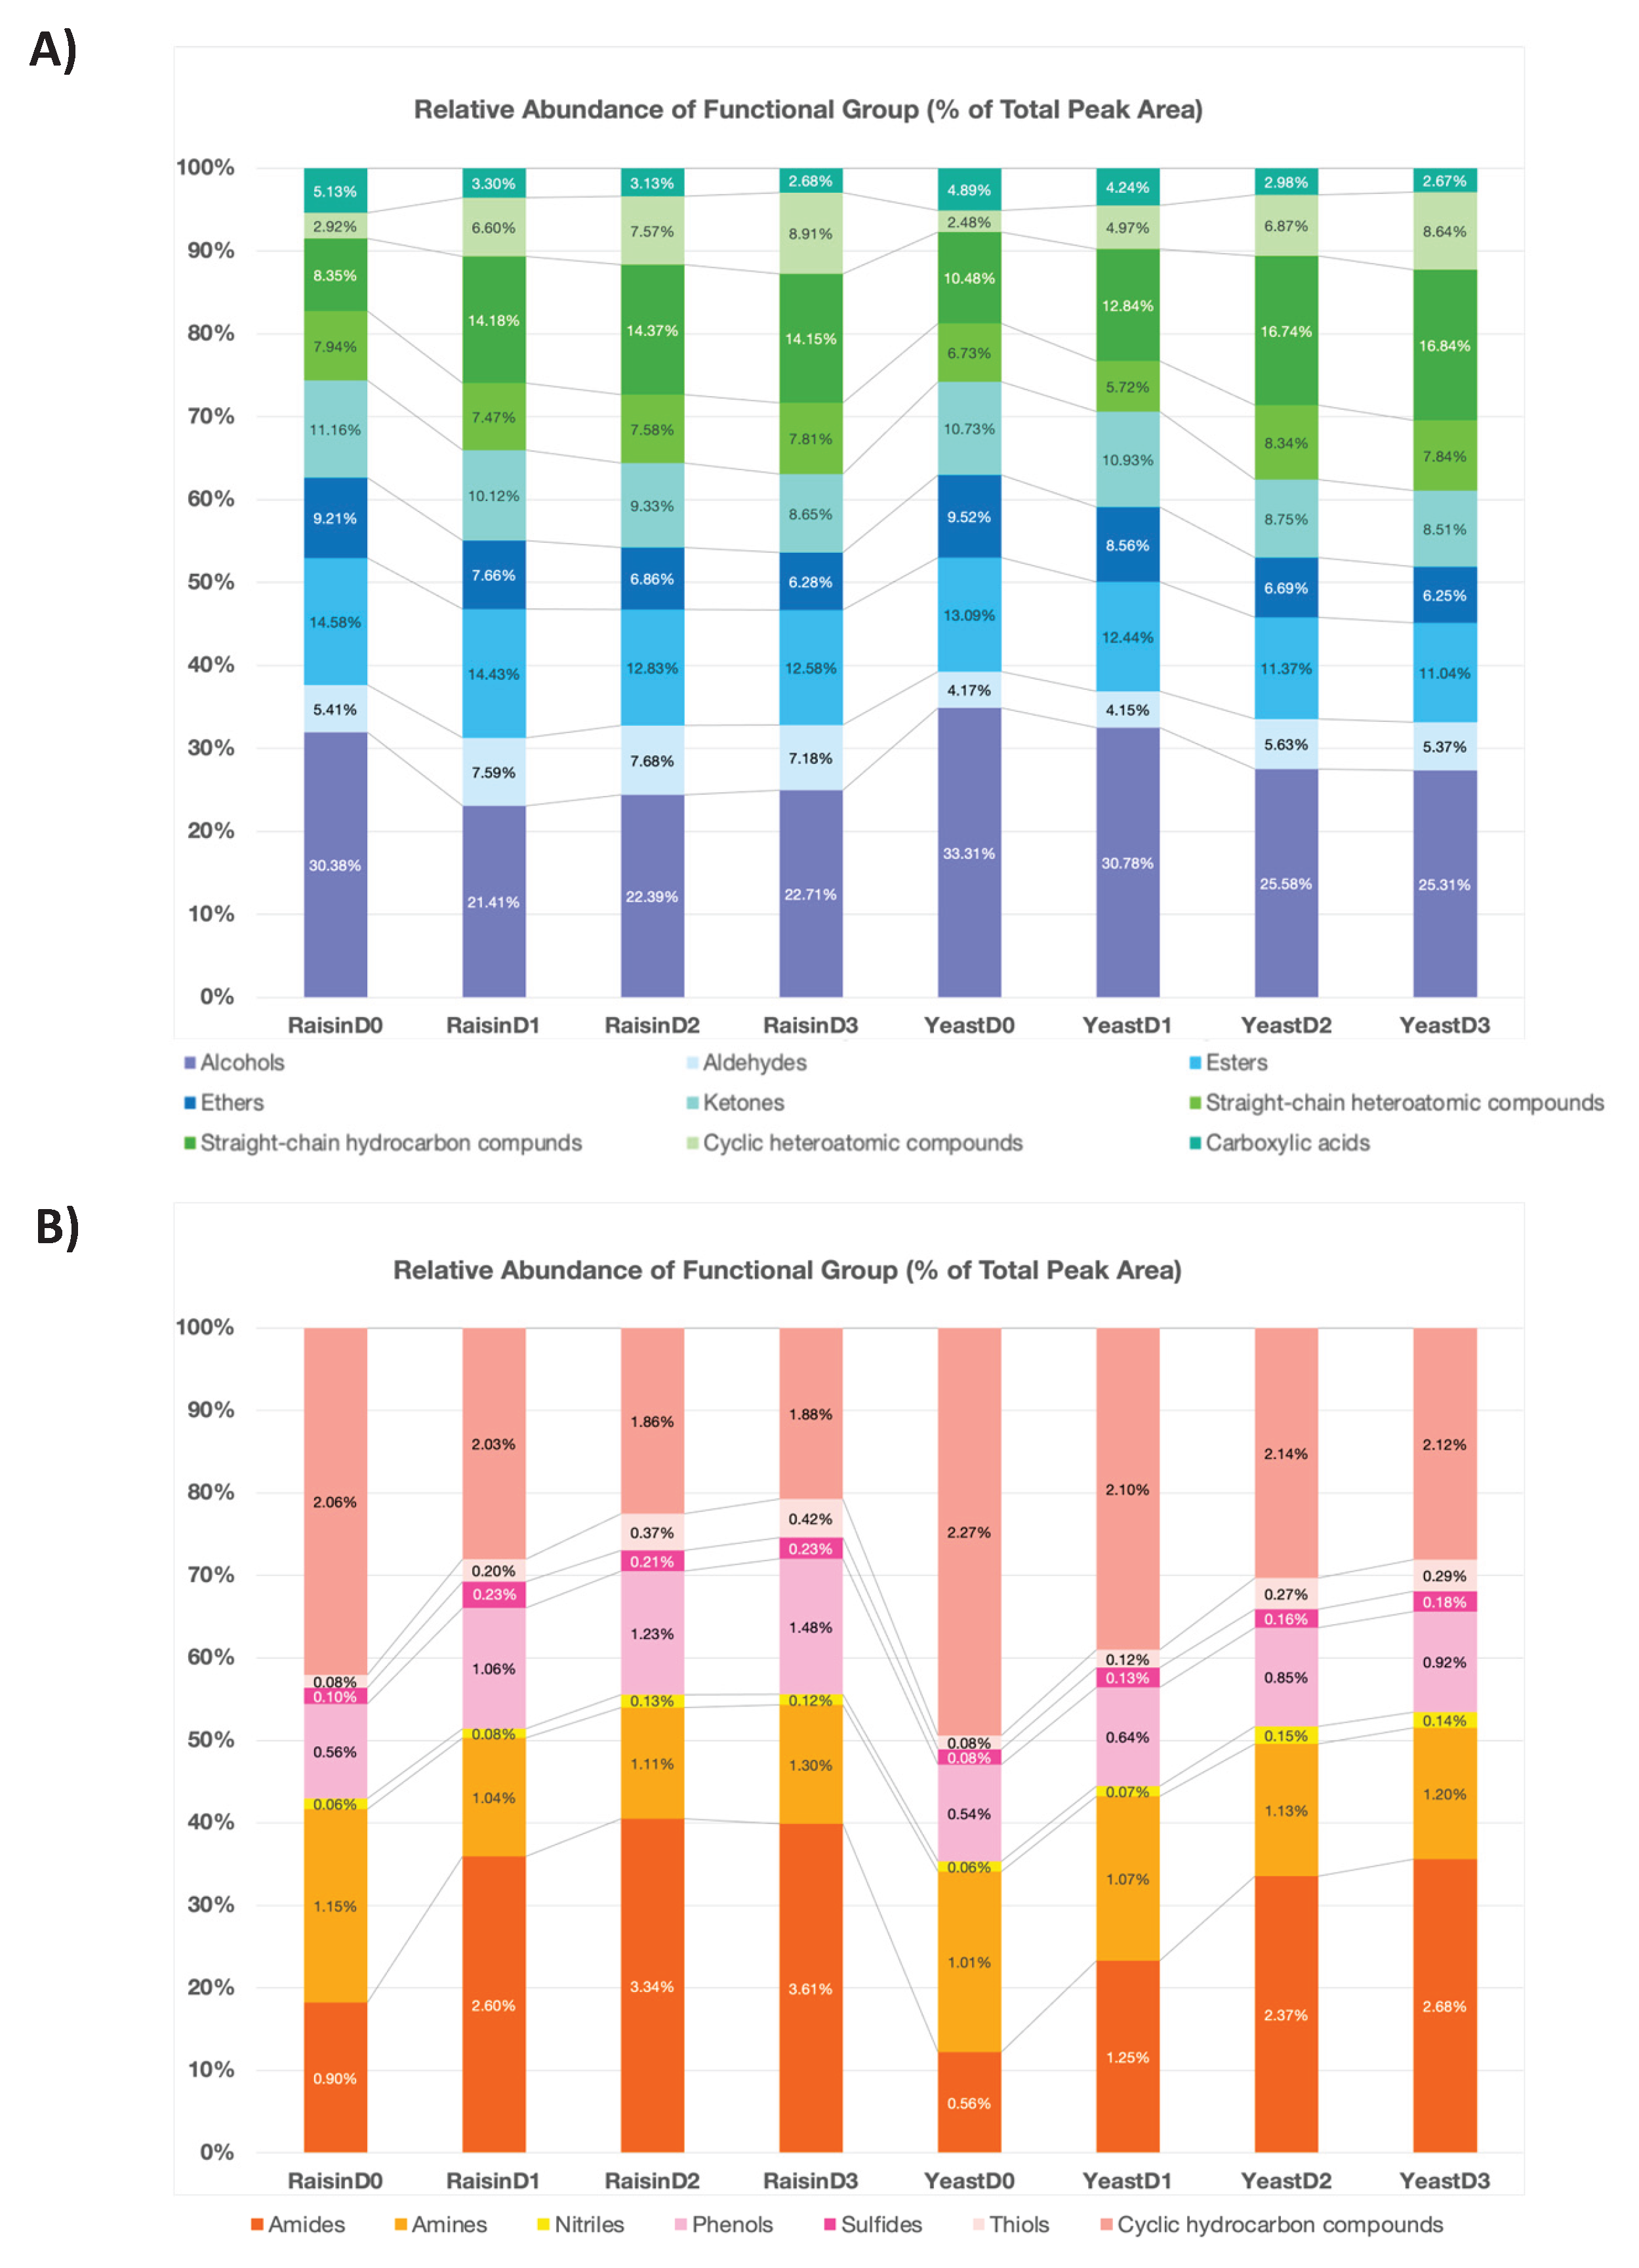
Figure 5.
Volcano plot analysis of volatile metabolites across fermentation stages. (A) Pairwise comparisons of Yeast (Control) relative to baseline: D0 vs D1 (top), D0 vs D2 (middle), and D0 vs D3 (bottom). (B) Pairwise comparisons of Raisin sourdough relative to baseline: D0 vs D1 (top), D0 vs D2 (middle), and D0 vs D3 (bottom). Each point represents a single volatile feature. Red dots denote significantly up-regulated compounds (log2FC >= 1, P < 0.05); Blue dots denote significantly down-regulated compounds (log2FC =< -1, P < 0.05); Black dots indicate no statistical significance.
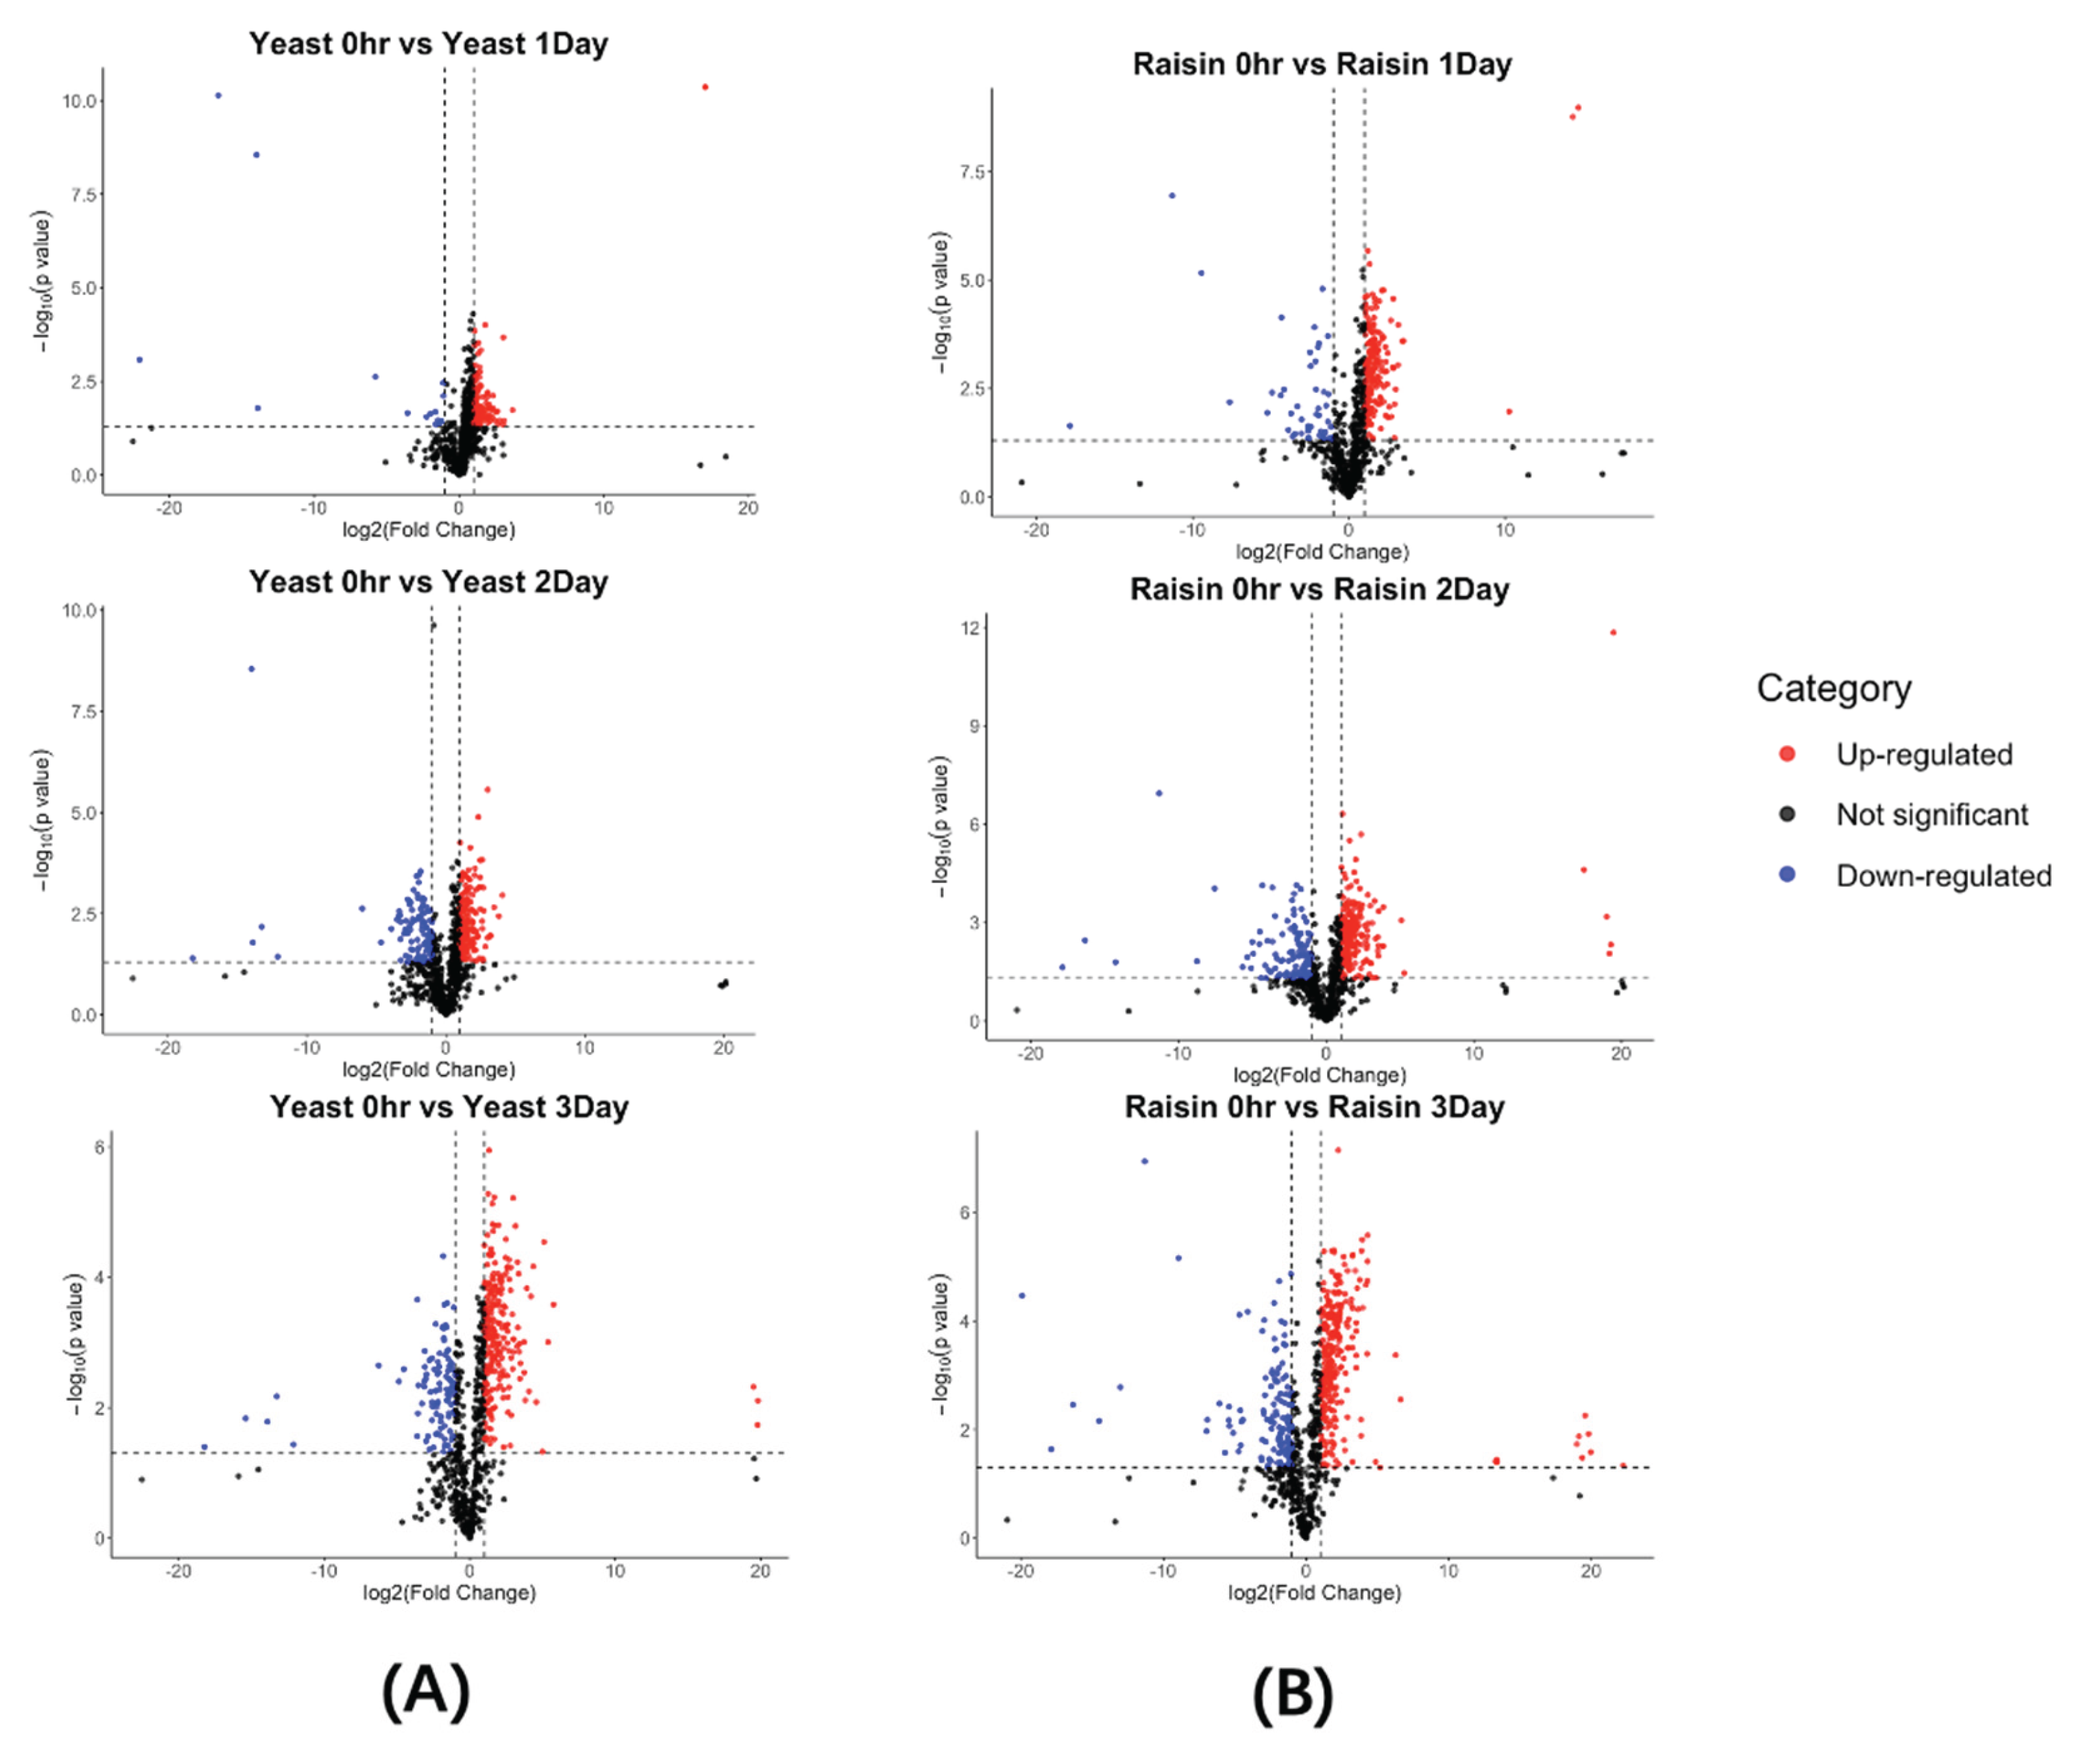
Figure 6.
Temporal trends and endpoint dominance of characteristic aroma compounds during shelf life. The figure categorizes key volatile markers into two profiles at Day 3: (A) Raisin-Dominant Profile, comprising markers where the raisin sourdough (Red) maintained higher abundance than the yeast control (Blue) at the end of shelf life; and (B) Yeast-Dominant Profile, comprising markers where the yeast control exhibited predominant intensity at Day 3. The left side of each panel traces the kinetic trajectory from D0 to D3. The right side visualizes the endpoint disparity using log 10 transformed peak areas, where the length of the connecting line signifies the magnitude of the difference between the two groups—a wider span indicates a more pronounced divergence in flavor intensity.
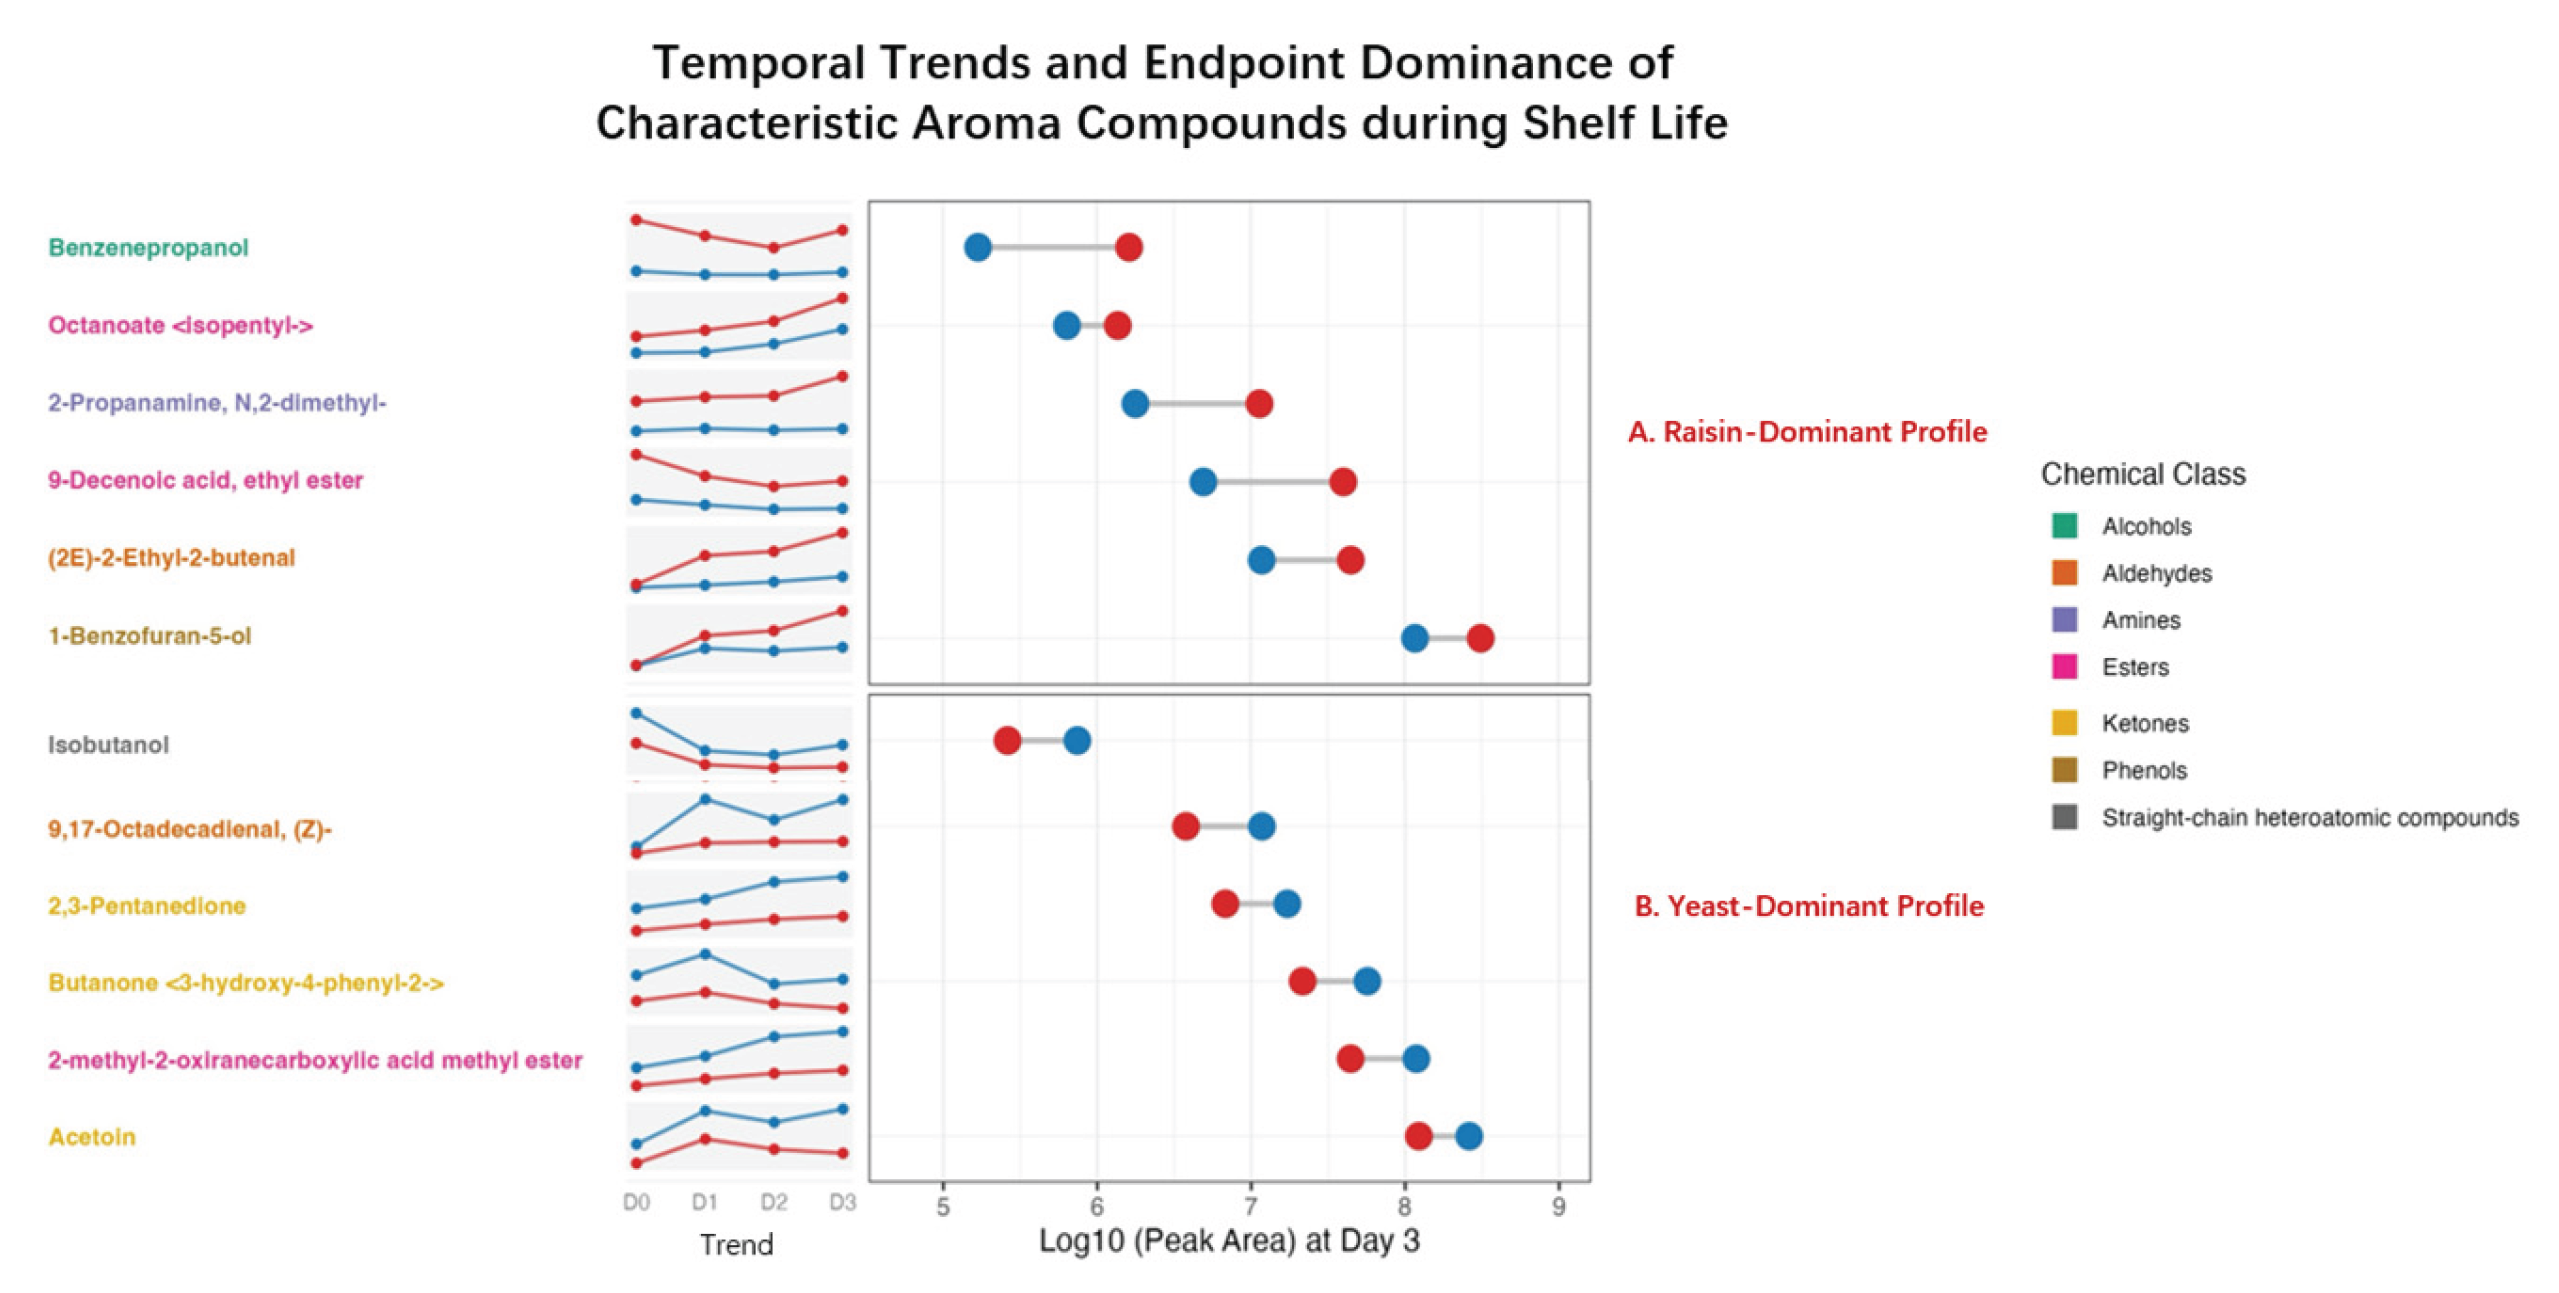
Figure 7.
Quantification of initial flavor capital showing baseline aromatic disparities at Day 0. The chart illustrates the relative abundance of characteristic aroma compounds immediately after baking (Day 0). Data represents the percentage contribution of Raisin Sourdough (Red) versus Yeast Control (Blue) to the total raw peak area intensity for each marker.
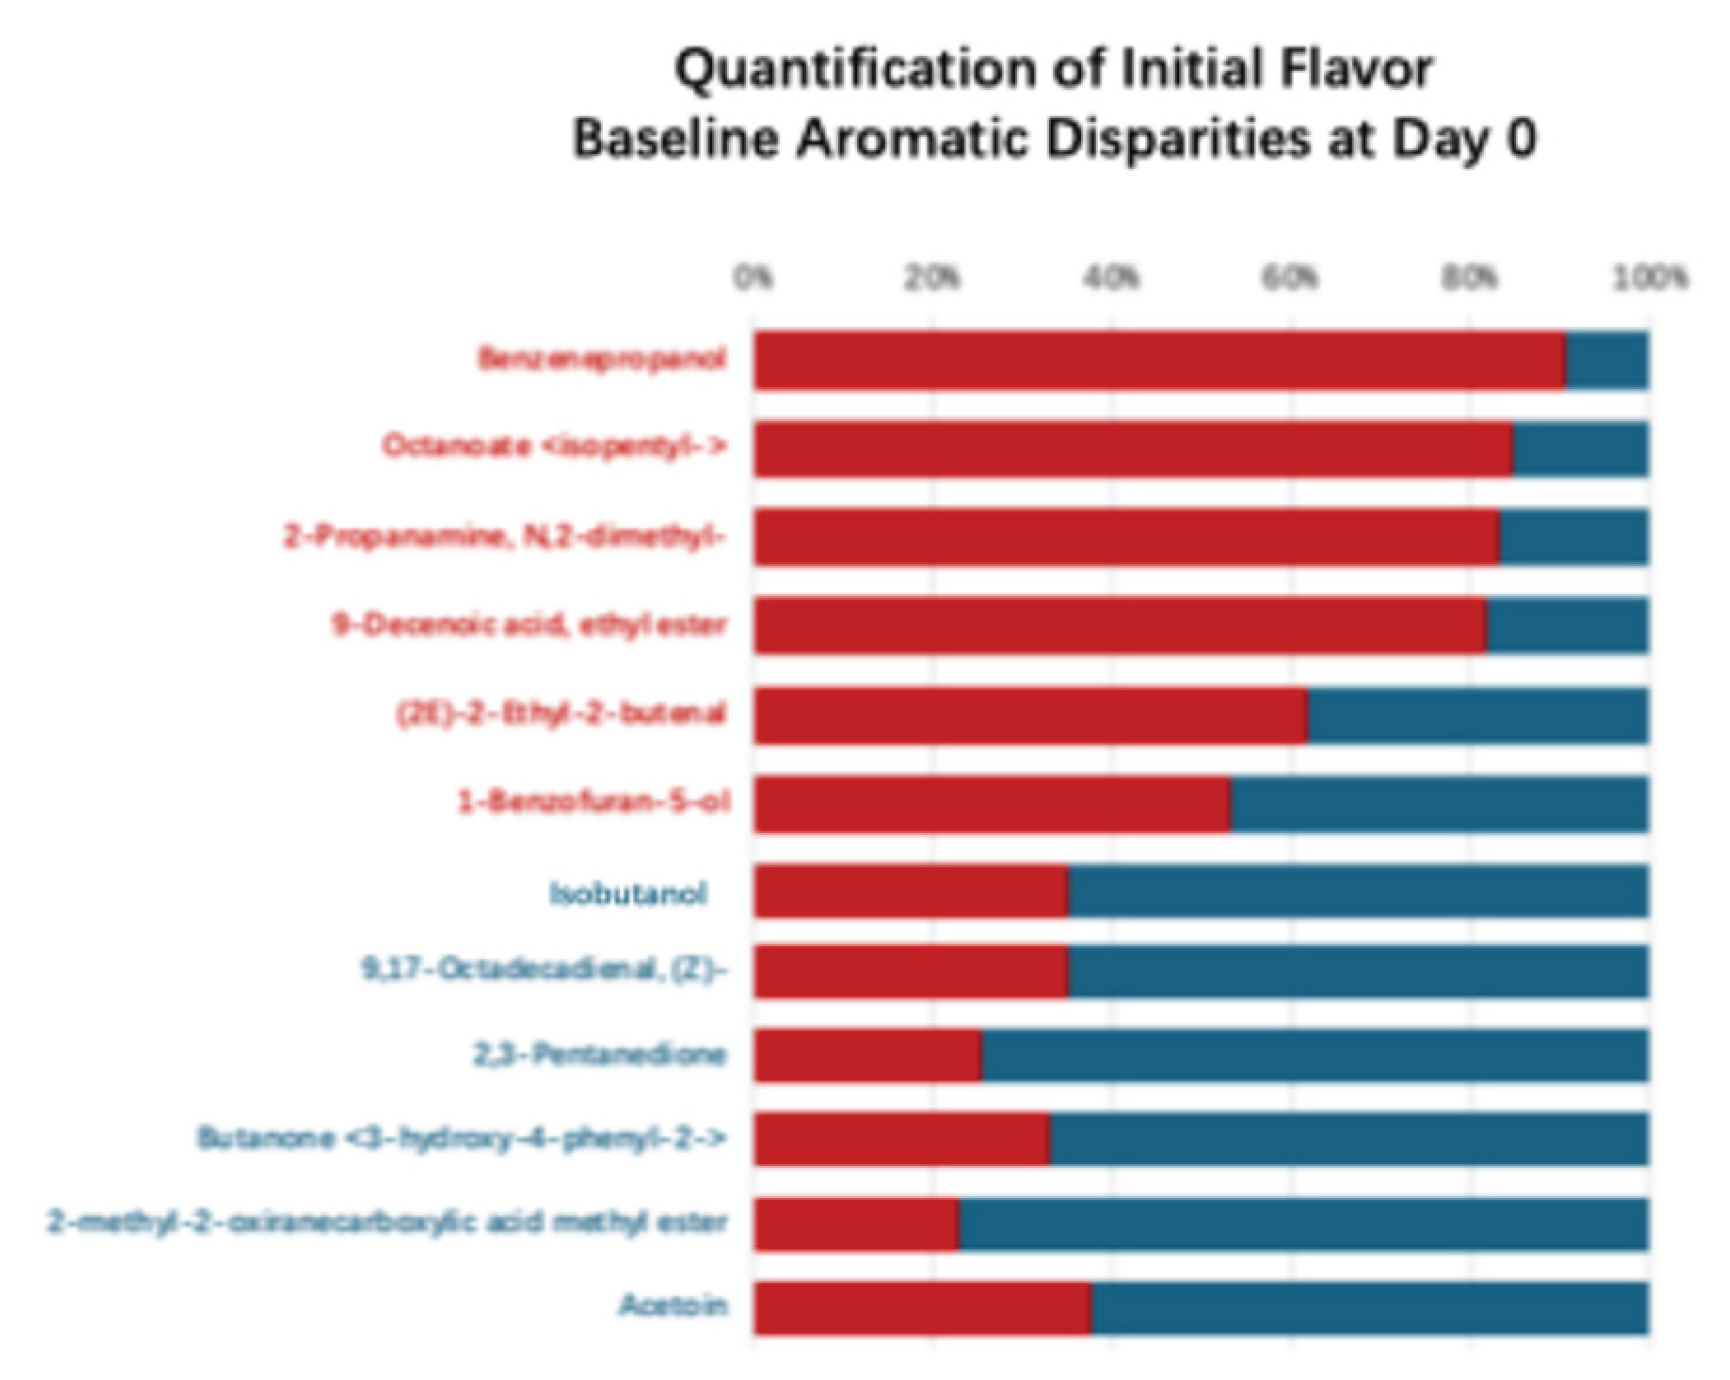
Table 1.
Formulation of Raisin Syrup Starter.
| Ingredient | Ratio (%) |
|---|---|
| Water (30 °C) | 100 |
| Raisins | 50 |
| Caster Sugar (Johakuto) | 25 |
| Malt Syrup (2x dilution) | 2 |
| Total | 177 |
Table 2.
Formulations for Control (Yeast) and Raisin (Sourdough) Breads.
| Ingredients | Control | Sourdough |
|---|---|---|
| Wheat Flour (Soledore) | 100% (3000 g) | 100% (3000 g) |
| Commercial Yeast | 0.5% (15 g) | — |
| Raisin Sourdough Starter | — | 8% (240 g) |
| Malt (2x dilution) | 0.6% (18 g) | 0.6% (18 g) |
| Salt | 2% (60 g) | 2% (60 g) |
| Water | 70% (2100 g) | 63% (1890 g) |
| Total Weight | 173.1% (5193 g) | 173.6% (5208 g) |
Disclaimer/Publisher’s Note: The statements, opinions and data contained in all publications are solely those of the individual author(s) and contributor(s) and not of MDPI and/or the editor(s). MDPI and/or the editor(s) disclaim responsibility for any injury to people or property resulting from any ideas, methods, instructions or products referred to in the content. |
© 2026 by the authors. Licensee MDPI, Basel, Switzerland. This article is an open access article distributed under the terms and conditions of the Creative Commons Attribution (CC BY) license (http://creativecommons.org/licenses/by/4.0/).
Copyright: This open access article is published under a Creative Commons CC BY 4.0 license, which permit the free download, distribution, and reuse, provided that the author and preprint are cited in any reuse.


