
Submitted:
12 January 2026
Posted:
14 January 2026
You are already at the latest version
Abstract
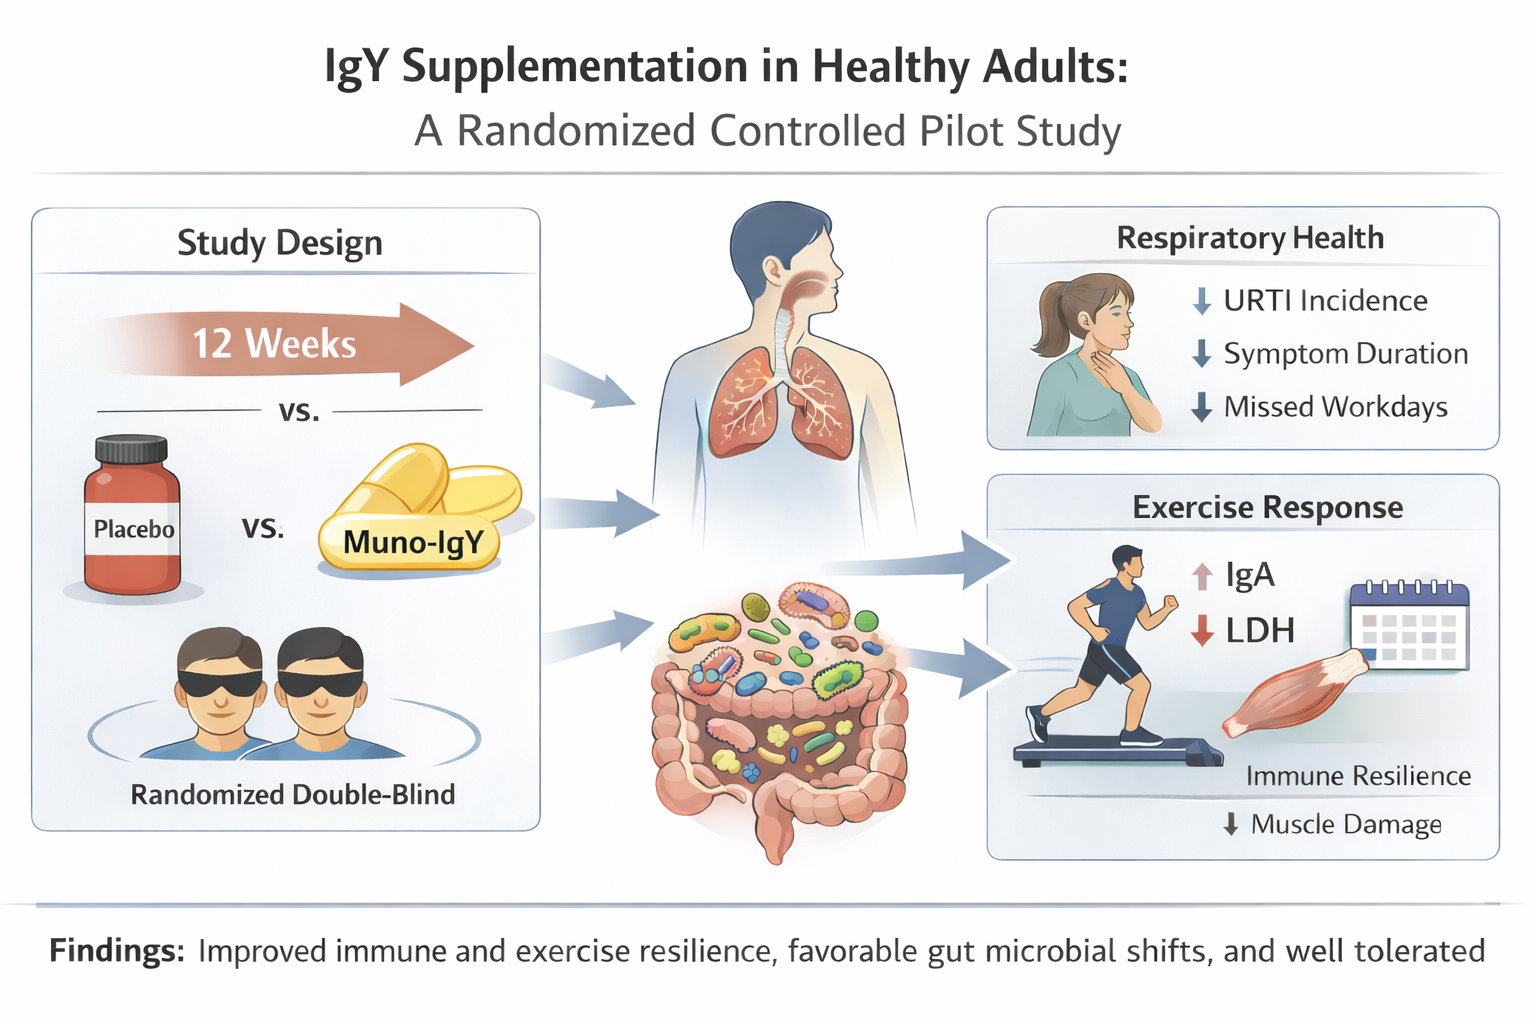
Background/Objectives: Upper respiratory tract infections (URTIs) and exercise-induced immune perturbations are common in adults and may adversely affect quality of life, productivity, and physical performance. Immunoglobulin Y (IgY), a food-derived antibody with broad antimicrobial activity, has demonstrated immunomodulatory potential in preclinical and limited clinical studies. This study evaluated the effects of a multi-pathogen-specific IgY supplement (Muno-IgY) on respiratory health, immune and inflammatory markers, exercise-induced physiological stress, and gut microbiome composition in healthy adults. Methods: in this 12-week, double-blind, placebo-controlled trial, 28 healthy adults with a history of URTI were randomly allocated to receive Muno-IgY or placebo. URTI incidence, duration, and severity were recorded daily. Serum immune and inflammatory biomarkers were assessed longitudinally and in response to a standardized exercise challenge. Gut microbiome composition was analyzed using shotgun metagenomic sequencing at baseline and week 12. Safety and tolerability were assessed throughout the study. Results: URTI incidence was numerically lower in the Muno-IgY group compared with placebo (14.3% vs. 35.7%), with shorter average duration and fewer missed workdays (p > 0.05). Following an acute exercise challenge, Muno-IgY supplementation resulted in a significant increase in serum IgA at 24 h post-exercise (p = 0.022) and a significantly greater reduction in lactate dehydrogenase at 1 h post-exercise compared with placebo (p < 0.0001). Exploratory gut microbiome analyses revealed favorable directional shifts in microbial composition. Conclusions: In this exploratory pilot study, Muno-IgY supplementation was safe and associated with significant improvements in selected markers of exercise-induced immune response and muscle damage, alongside favourable trends in respiratory health and gut microbiome composition. These findings support further evaluation of Muno-IgY in larger, adequately powered clinical trials.
Keywords:
immunoglobulin Y
; gut microbiome
; nutritional immunology
; nutraceuticals
; quality of life
; immune response
; gut health
; gut–lung axis
; mucosal immunity
; inflammation
1. Introduction
Upper respiratory tract infections (URTIs), including laryngitis, pharyngitis, nasopharyngitis, and rhinitis, are among the most common conditions presenting in primary care. Patients are typically presented with symptoms including sore throat, nasal obstruction, cough, and headache. Though the condition is usually self-limiting, the symptoms significantly impair the quality of life and productivity of the patients [1], by delaying mental processing, reducing attentiveness, hedonic tone, and semantic memory reaction time, all of which significantly impact everyday tasks and professional duties [2], ultimately resulting in absence from school and work.
Respiratory illness also poses a significant burden in athletic populations. During the Winter Olympic Games 2010, a study reported that respiratory illnesses accounted for 62.8% of all illnesses in athletes. Although the frequency of URTIs in athletes is comparable to the general population, the episodes are frequently associated with increased training load and around competition, significantly affecting performance, muscular coordination, alertness and information processing [3] and are associated with suppressed mucosal and cellular immunity [4]. Conventional treatments largely address the symptoms of URTI rather than prevention. Hence, there is growing interest in safe, natural interventions that can support immune resilience.
In recent decades, research on the human microbiome has expanded substantially, providing strong evidence that host-associated microbes are critical for the development and maturation of the immune system and play a central role in both health and disease. The intestinal microbiota can influence immune homeostasis at distant mucosal sites, including the respiratory tract, through the integrated networks of the common mucosal immune system [5]. Furthermore, gut microorganisms contribute to the maintenance and differentiation of T-lymphocyte subsets residing in distal mucosal tissues, underscoring the importance of gut–immune crosstalk in shaping systemic and respiratory immunity [5,6].
Preclinical investigations further support the central role of the gut microbiota in respiratory health [7]. In murine models of pneumococcal pneumonia, depletion of the gut microbiota resulted in greater bacterial dissemination, heightened inflammation, increased organ damage, and higher mortality, which resolved through fecal microbiota transplantation. Whole-genome profiling of alveolar macrophages from microbiota-depleted mice revealed marked upregulation of metabolic pathways associated with impaired cellular responsiveness to microbial stimuli such as lipopolysaccharide and lipoteichoic acid, and reduced ability to phagocytose Streptococcus pneumoniae [7]. Collectively, these findings highlight the profound influence of the gut microbiota on pulmonary immune function and reinforce the importance of interventions that support gut–lung immune crosstalk. As a result, gut health interventions, particularly supplements modulating gut microbiome, have been widely explored for their potential to enhance mucosal immunity and lower URTI risk [5,8,9,10].
Immunoglobulin Y (IgY), the functional equivalent of mammalian IgG, is present in the serum of birds, reptiles, and amphibians, and transferred to the embryo through the egg yolk. IgY exhibits broad antibacterial and antiviral binding capabilities and does not activate mammalian Fc receptors or the complement system, enabling immunomodulation without triggering inflammatory cascades. Also, IgY does not induce specific resistance because it is directed against multiple antigenic targets [11]. The proposed mode of action of IgY is mediated through neutralization [12], opsonization [13,14], adherence blockade [13,15], and agglutination [11]. Previous studies have demonstrated the prophylactic and therapeutic effect of IgY in vitro and in vivo in murine models of respiratory infection, and the protective effects observed were comparable to those of the neuraminidase inhibitor oseltamivir [16,17].
However, most previous studies have focused on the effect of IgY derived from hens immunized against a single pathogen and were primarily evaluated using animal models. To address this gap, the present randomized double-blinded pilot study investigates the efficacy of a multi-pathogen-specific IgY product, Muno-IgY, on the URTI incidence, duration, and severity, evaluates its effects on inflammatory and immune biomarkers, evaluates its capacity to buffer exercise-induced inflammation and muscle damage, and assesses modulation of the gut microbiome. In addition, the study evaluated participant-reported quality of life, gastrointestinal tolerance, and overall safety, providing an initial integrated assessment of Muno-IgY’s impact on immune function, microbiota, and recovery from physiological stress.
2. Materials and Methods
2.1. Study Design, Participants and Data Collection
This 12-week study was conducted as a two-arm, double-blind, placebo-controlled trial with 1:1 computer-generated randomization at Apex Trials (formerly Nutrasource Pharmaceutical and Nutraceutical Services, Inc.) in Guelph, Ontario, Canada, between December 2022 and July 2023. Healthy adults who had self-reported at least one URTI in the previous six months were eligible for enrollment. A total of 28 participants aged 35–65 years who were employed or attending school for at least 20 hours per week were randomized to receive either Muno-IgY or placebo. Participants in the Muno-IgY group consumed two capsules daily, providing 100 mg of egg yolk protein (15 mg IgY per capsule), while those in the placebo group received two identically appearing capsules containing rice flour. The dose of Muno-IgY was chosen to evaluate the effects as well as product safety and tolerability. The study products were instructed to be consumed in the morning with or without food.
The Randomization Scheme was computer-generated by Nutrasource using SAS 9.4 PROC PLAN on 22NOV22:15:24:17, and study products were dispensed according to the randomization scheme. Both participants and study personnel, including the investigator, study team, sponsor representatives, data management staff, and statisticians, remained blinded to treatment allocation. Only designated unblinded personnel at the CRO, responsible for labelling, accountability, and reconciliation of study products, had access to treatment assignments. Unblinding was permitted only in emergencies or situations requiring knowledge of the study product, with all instances reported to the investigator, CRO, and sponsor. Planned unblinding occurred after database lock and completion of the blinded statistical analysis.
This study involved six clinic visits, including a screening visit, a baseline visit, three assessments during Week 4, and a final end-of-study visit at Week 12. Figure 1 illustrates the schedule of study visits, including the timing of baseline and post-exercise sample collections. Throughout the intervention period, participants were instructed to record the incidence, duration, and severity of any URTI symptoms using daily logs. A summary of demographic data, body measurements, pregnancy status, and vital signs, including diastolic and systolic blood pressure, heart rate, respiratory rate and body measurements, was obtained at screening. Participant withdrawals were not replaced.
Two questionnaires were used in this study to screen participants. The Physical Activity Readiness Questionnaire (PAR-Q) has been previously validated in clinical trials to assess whether participants were suitable to perform physical activity based on any existing medical conditions [18]. In addition, the International Physical Activity Questionnaire (IPAQ) was used to assess the current physical activity of participants [19].
The trial received ethical approval from the Sterling Institutional Review Board (Sterling IRB - Your Dedicated Institutional Review Board, Atlanta, GA; Approval Reference #10578, Approval date 12/12/2022) and authorization from Health Canada’s Natural and Non-Prescription Products Directorate (ISRCTN Registry #51932144). All participants provided written informed consent prior to enrollment, between December 2022 and July 2023.
2.2. Safety Assessments on Muno-IgY supplementation
2.2.1. Height, Weight, and Body Mass Index (BMI)
Height was measured at screening (Visit 1) in centimeters to one decimal place using a stadiometer, with participants barefoot and standing upright. Weight was measured at Visits 1, 2, 3, and 6 in light clothing using a beam scale, with participants wearing light clothing, and recorded in kilograms to one decimal place. Body mass index (BMI) was calculated as weight (kg) divided by the square of height (m) and recorded to one decimal place (kg/m²). All measurements were rounded to the nearest tenth following standard conventions.
2.2.2 Vital Signs
Vital signs, including blood pressure, heart rate, and respiratory rate, were measured in a seated position at Visits 1, 2, 3 (pre-exercise) and 6. All measurements were recorded in source documents and case report forms (CRFs).
2.2.3 Laboratory Assessments
Blood samples were collected for safety laboratory assessments at multiple time points. Non-fasted samples were obtained at Visit 1, and fasted samples were collected at Visits 2, 3 (pre-exercise), and Visit 6. Hematology parameters included hemoglobin, hematocrit, white blood cell count with differential (neutrophils, eosinophils, basophils, lymphocytes, monocytes), red blood cell count, red cell distribution width, red blood cell indices (mean corpuscular volume, mean corpuscular hemoglobin, mean corpuscular hemoglobin concentration), platelet count, and mean platelet volume. Clinical chemistry parameters included sodium, potassium, chloride, urea, creatinine, total protein, albumin, total bilirubin, glucose (serum; fasting except at screening), alanine transaminase, aspartate transaminase, alkaline phosphatase, estimated glomerular filtration rate (eGFR), and globulin.
2.2.3 Adverse Events and Safety Monitoring
Adverse events (AEs) were defined as any untoward medical occurrence in a participant receiving the study product, regardless of causality [20]. Symptoms of URTIs were recorded in participant diaries and could include cough, runny or congested nose, sore or scratchy throat, sneezing, hoarseness, lethargy, body aches, and fever. The investigator evaluated symptoms and may have made a clinical diagnosis of URTI based on these reports.
Only new or worsening medical occurrences after study product administration were recorded as AEs. Investigators and designated study staff documented all AEs, including those spontaneously reported, observed, or elicited through questioning, in the participant’s case report form. Participants were followed at subsequent visits for AE monitoring. Table 1 summarizes the key data elements collected for each AE.
Serious Adverse Events (SAEs) were defined as AEs resulting in death, life-threatening conditions, hospitalization, prolonged hospitalization, significant disability, congenital anomaly, or other medically important events [21]. SAEs were recorded in the same manner as AEs and followed until resolution, stabilization, or explanation.
SAEs were reported promptly to the CRO, sponsor, and regulatory authorities. Health Canada’s Therapeutic Products Directorate (TPD) was notified of all serious or unexpected adverse reactions using the Council for International Organizations of Medical Sciences (CIOMS) form, within 7 days if fatal or life-threatening, and within 15 days if neither fatal nor life-threatening, with follow-up reports as needed.
2.3. Effect of Muno-IgY on Immune Responses
2.3.1. Incidence, Severity, and Duration of Upper Respiratory Tract Infections
To evaluate the effects of Muno-IgY on immune function, participants self-reported the number of incidences of URTI, as well as the severity and duration of the episode, using a daily diary throughout the study. The duration of URTI was calculated by dividing the total duration of all URTI in a study group by the number of URTI experienced in that study group. The severity of URTI was calculated by dividing the total number of days of work or school missed due to URTI symptoms by the number of URTIs experienced in that study group. A comparison between the Muno-IgY and the placebo group was conducted to evaluate their effects on the number of incidences. No statistical analysis was performed on the duration and severity of URTIs due to the small number of participants who experienced URTIs.
2.3.2. Serum IgA concentration
The effect of Muno-IgY on immune response in participants was measured by serum IgA levels from whole blood samples collected under fasting conditions at Visits 2, 3 (pre-exercise), 4 and 6. Following blood collection, the whole blood samples were incubated for 30 - 120 minutes at room temperature, centrifuged at 1100-1300 g for 10-15 minutes at 18-25 °C, and shipped to an external laboratory (Dynacare, Ontario, Canada) at 2-8 °C for analysis. The value obtained from samples collected at Visit 2 was treated as baseline and used to calculate the change from baseline to Visits 3, 4 and 6. A comparison between the Muno-IgY and placebo groups was done on the change from baseline to differentiate between their effects on immune response.
2.3.3. Inflammatory Biomarkers
Inflammatory biomarkers such as C-reactive protein (CRP), Lipopolysaccharide Binding Protein (LBP), Cortisol, Tumor Necrosis Factor-α (TNF-α), Interleukin-6 (IL-6), Interleukin-10 (IL-10) and Interleukin-1-β (IL-1-β) were quantified using serum separated from whole blood samples collected under fasting conditions at Visits 2, 3 (pre-exercise), 4, 5 and 6. Following collection, the whole blood samples collected for LBP, TNF-α, IL-6, IL-10, and IL-1βwere incubated for 30 - 60 minutes at room temperature, centrifuged at 2000 g for 10 minutes at 2-8 °C, and shipped to an external laboratory at -80 °C for ELISA testing (Dynacare, Ontario, Canada). Similarly, the samples collected for CRP and cortisol were incubated for 30 - 120 minutes at room temperature, centrifuged at 1100-1300 g for 10-15 minutes at 18-25 °C, and shipped to an external laboratory at 2-8 °C for analysis (Dynacare, Ontario, Canada). The data from samples collected at Visit 2 were treated as baseline and used to calculate the change from baseline to Week 4 and Week 12 (Visit 6). A comparison between the Muno-IgY and placebo groups was made on the change from baseline to Weeks 4 and 12 to differentiate between their effects on inflammatory biomarkers.
2.4 Effect of Muno-IgY on Post-Exercise Inflammatory, Immunity and Muscle Damage Response
Inflammatory biomarkers such as CRP, Cortisol, TNF-α, IL-6, IL-10, and IL-1β, markers of muscle damage such as CPK and LDH, and IgA concentration were quantified using serum separated from whole-blood samples collected under fasting conditions at visit 3 (pre-exercise, and 1h ± 5min and 2h ± 5min post-exercise), 4 (24 ± 1h post-exercise) and 5 (72 ± 1h post-exercise). The exercise challenge consisted of a standardized quadriceps fatigue protocol performed on a leg-press machine [22] under certified trainer supervision. Samples collected before exercise at Visit 3 were used as the exercise baseline and were used to calculate the change from the exercise baseline to post-exercise. The samples were processed as described above and sent to an external laboratory for analysis (Dynacare, Ontario, Canada). The magnitude of change from baseline was compared between the Muno-IgY and placebo groups to evaluate differences in inflammatory, immune, and muscle-damage responses following the exercise challenge.
2.5 Effect of Muno-IgY supplementation on Gut Microbiome
Fecal samples were collected from study participants at Week 2 (baseline) and Week 12 (end of study). Samples were processed for shotgun metagenomic analysis by Microbiome Insights (Richmond, BC, Canada). Total genomic DNA was extracted using the Macherey–Nagel NucleoMag DNA Microbiome Kit (4 × 96 format), optimized for automated extraction on the Thermo Fisher Scientific KingFisher platform, in accordance with the manufacturer’s instructions[23]. DNA quality control was performed prior to library preparation.
Shotgun metagenomic libraries were generated from extracted DNA and sequenced using the Illumina NovaSeq platform with a high-output configuration (2 × 150 bp paired-end reads). Sequencing targeted an average depth of approximately 12 million reads per sample, with at least 90% of samples achieving a minimum of 5 million reads following quality control. Bioinformatic processing, taxonomic profiling, and report generation were conducted by Microbiome Insights using validated internal pipelines. Analyses were restricted to bacterial taxa; non-bacterial reads, including viral and other non-target organisms, were excluded prior to downstream analyses.
Changes in microbial abundance were evaluated by comparing relative abundance between Week 2 (baseline) and Week 12 (end of study) within each treatment group.
3. Statistical Analysis
All statistical analyses were performed using RStudio (R version 4.5.1). Incidence of URTIs was summarized as the number and percentage of participants experiencing an event per treatment group. Between-group differences in incidence were evaluated using Fisher’s exact test, and average URTI incidence per participant was compared using the Wilcoxon rank-sum test. No formal statistical analysis was performed for URTI severity due to the small number of affected participants.
Changes from baseline (pre-intervention or pre-exercise values) for serum markers of immunity, muscle damage, and inflammation were calculated for each parameter. Repeated measures analysis was conducted using linear mixed-effects models with Treatment and Time as fixed effects and Subject as a random effect to account for within-subject correlations. Type III ANOVA with Satterthwaite’s method was used to calculate F-statistics and p-values. Post-hoc pairwise comparisons at each time point were performed using estimated marginal means with Tukey adjustment for multiple comparisons. Results are presented as mean ± standard error of the mean (SEM). Statistical significance was defined as p < 0.05.
For microbiome analysis, mean relative abundances of the taxa were calculated per treatment group. Differential abundance analyses were performed using Kruskal–Wallis tests with false discovery rate (FDR) correction (Benjamini–Hochberg). LEfSe-style criteria were applied to flag taxa with absolute log₂ fold-change ≥ 2 and –log₁₀(p) > 1.3 as potentially relevant. Alpha (Shannon, Simpson) and beta diversity (Bray–Curtis) analyses were conducted, and PERMANOVA was used to assess group differences. All microbiome results are reported descriptively, as this study was exploratory and not powered for formal statistical significance at the species level.
4. Results
4.1. Study population and Baseline characteristics
A total of 45 participants were screened to achieve the target enrollment of 28 eligible participants. A Consolidated Standards of Reporting Trials (CONSORT) flow diagram of participant enrollment, allocation, follow-up, and analysis is illustrated in Figure 2. The enrolled cohort had a mean age of 47.8 years and an average baseline BMI of 25.58 kg/m2. The randomized participant population consisted of participants who identified as White (71.4%), Asian (7.1%) and Black or African American (7.1%). 14.3% of participants did not report their race. The female-to-male ratio was approximately 6:1 and was consistent between both study groups. Three participants voluntarily withdrew from the study.
At baseline, the average weight was 70.28 ± 10.186 kg, and the average diastolic and systolic blood pressure was 75.3 ± 6.12 and 112.1 ± 9.87 mmHg, respectively. The average heart rate was 66.3 ± 7.69 beats per minute, and the average respiratory rate was 14.1 ± 2.03 breaths per minute. There were no substantial differences in any vital signs or body measurements between the Muno-IgY and placebo groups at baseline. The baseline demographic and clinical characteristics of the participants in the Muno-IgY and placebo groups are given in Table 2.
Pregnancy tests for participants of childbearing potential conducted at Visits 2 and 6 were negative. Participants not of childbearing potential did not undergo testing.
Study product compliance was high, with a mean compliance rate of 98.79% across both treatment groups for the full study duration. No participant in either group demonstrated compliance below 80%.
For data analysis, the safety population included all participants who received at least one dose of the study product and was used for safety analysis. The full analysis set (FAS) population included all randomized participants who received at least one dose of the study product, had at least one baseline efficacy assessment, and one post-baseline efficacy assessment, and met all inclusion criteria. This population served as the primary data set for efficacy analysis. The per-protocol set (PPS), a subset of the FAS that included only participants who completed the study without major protocol deviations, was used to confirm the robustness of the FAS findings. The number of participants included or excluded in each analysis population is summarized in Table 3.
4.2. Effect of Muno-IgY on Anthropometrics, Vital Signs, and Clinical Laboratory Safety
No clinically meaningful changes in body weight, body mass index (BMI), or height were observed in either treatment group over the 12-week intervention period. Mean body weight and BMI remained stable from baseline to the end of the study in both the Muno-IgY and placebo groups, with no statistically significant between-group differences.
Vital signs, including systolic and diastolic blood pressure, heart rate, and respiratory rate, remained within normal physiological ranges throughout the study. No clinically relevant changes or treatment-related trends were observed at any assessment time point.
Hematology and clinical chemistry parameters remained stable across all visits. No participant demonstrated laboratory values outside clinically acceptable reference ranges that were considered related to the study product. There were no meaningful differences between treatment groups in hematological indices or clinical chemistry parameters, including liver and renal function markers.
4.3. Adverse Events and Safety Monitoring of Muno-IgY
A total of 16 participants experienced 28 treatment-emergent adverse events (TEAEs) during the study. In the Muno-IgY group, 7 participants (50.0%) reported 12 TEAEs, whereas in the placebo group, 9 participants (64.3%) reported 16 TEAEs. All TEAEs were mild in severity, and the majority (96.4%) were considered unrelated to the study products. Only one TEAE (ageusia) in the Muno-IgY group was suspected to be related to the study product. This event did not result in early termination; however, the participant withdrew three days after onset for reasons unrelated to the TEAE. The ageusia resolved after discontinuation, though the exact resolution time was not documented. Another participant reported dry mouth (unresolved), and one participant in the placebo group experienced a common cold with unknown outcome; both events were mild and deemed unrelated. All other TEAEs resolved by the end of the study.
The most frequently reported TEAE was flu-like symptoms, affecting four participants (14.3%, two in each group). Other commonly reported TEAEs included fatigue, upper respiratory infection, vasovagal reaction, headache, and loose stools. Three participants reported TEAEs consistent with upper respiratory tract infection (URTI) symptoms; however, none met the criteria for a clinical diagnosis of URTI by the QI. One Muno-IgY participant experienced transient rhinitis (1 h duration), and another had flu-like symptoms confounded by oral health issues, which were not classified as URTI.
No SAEs or deaths occurred during the study. A summary of TEAEs by study product group is presented in Table 4.
4.4. Effect of Muno-IgY on Immune Responses
4.4.1. Incidence, Severity, and Duration of Upper Respiratory Tract Infections
In the FAS population, a total of 9 URTI episodes were reported across both study groups during the 12-week intervention. URTI symptoms were documented daily by participants in study diaries and subsequently evaluated by the Qualified Investigator (QI) to confirm a clinical diagnosis. Three participants experienced a treatment-emergent adverse event (TEAE) of URTI. All other episodes were identified by the QI based on symptom reports.
Overall, 14.3% of participants in the Muno-IgY group (N=2) and 35.7% of participants in the placebo group (N=5) experienced at least one URTI during the study period. Similar proportions were observed in the PPS population. Although the incidence of URTIs was numerically lower in the Muno-IgY group (approximately 59.9% reduction), the between-group difference was not statistically significant in the FAS or PPS population (P>0.05). In the FAS population, the average incidence of URTI per participant over the 12-week study period was 0.1 ± 0.36 in the Muno-IgY group and 0.5 ± 0.85 in the placebo group, which was not statistically significant (P>0.05). A summary of URTI occurrence by study group for the FAS population is presented in Table 5.
The average number of days of work or school missed due to URTI symptoms over 12 weeks was 0.0 days in the Muno-IgY group and 0.6 days in the placebo group. The average duration of reported URTIs over 12 weeks was 54.75 ± 41.37 hours in the Muno-IgY group and 138.57 ± 205.43 hours in the placebo group. As the incidence of URTIs across the study population was small, no statistical between-group comparison was made.
4.4.2 Serum IgA concentration
In the FAS population, an analysis of the effect of Muno-IgY on serum IgY concentration revealed that there was no main effect of treatment (p = 0.334), time (p = 0.253), or Treatment × Time interaction (p = 0.805). These results indicate that changes in serum IgA over 12 weeks were similar between Muno-IgY and Placebo and did not vary significantly between Week 4 and Week 12 (Figure 3).
4.4.3 Inflammatory Biomarkers
In the FAS population, cortisol concentration, analyzed as change from baseline, showed no statistically significant differences between the Muno-IgY and placebo groups at Week 4 (p = 0.945) or Week 12 (p = 0.201). Within-group comparisons showed no significant changes over time in either the Muno-IgY group (p = 0.483) or the placebo group (p = 0.284). Furthermore, the treatment-by-time interaction was not statistically significant (p = 0.215). Although a numerically greater reduction was observed in the Muno-IgY group at Week 12, due to high variability and small sample size, statistical significance was not achieved (Figure 4).
The analysis of the effect of Muno-IgY on serum LBP concentration as a change from baseline over time (Week 4 and Week 12) revealed a significant main effect of treatment (p = 0.028) (Figure 5). Muno-IgY supplementation resulted in a significant overall reduction in serum LBP concentrations, expressed as change from baseline, compared with placebo. Mean LBP change from baseline was −729 ± 594 and −636 ± 607 at week 4 and week 12, respectively, in the Muno-IgY group, whereas placebo recipients exhibited increases of 674 ± 386 at week 4 and 2195 ± 1524 at week 12. This effect was independent of time (p = 0.504), with no significant treatment-by-time interaction (p = 0.446).
However, the effect of Muno-IgY supplementation on TNF-α over time revealed no significant treatment effect (p = 0.285), indicating that TNF-α levels did not differ between the Muno-IgY and placebo groups. Similarly, the time (p = 0.187) and treatment × time interaction (p = 0.187) effects were not significant, suggesting that TNF-α levels did not change significantly from Week 4 to Week 12 across all participants.
Similarly, for C-reactive protein (CRP), there was no significant effect of treatment (p = 0.504), time (p = 0.570), and treatment × time interaction (p = 0.154). IL-10 levels also showed no significant main effect of treatment (p = 0.983), time (p = 0.617), and treatment × time interaction (p = 0.598). No significant effect of treatment (p = 0.252), time (p = 0.522), or treatment × time interaction (p = 0.636) was observed for IL-1β concentration as well. IL-6 was not subjected to inferential statistical analysis due to a lack of within- and between-group variability across all study time points.
4.5. Effect of Muno-IgY on Post-Exercise Inflammatory, Immunity and Muscle Damage Response
4.5.1 Serum IgA concentration
Paired comparisons of serum IgA concentration before and 24 h after exercise showed a significant increase in the Muno-IgY group (mean change 0.125; p = 0.022), whereas the Placebo group showed a non-significant change (mean change 0.06; p = 0.197). This suggests that Muno-IgY supplementation may have attenuated exercise-induced decreases or supported maintenance of IgA levels following strenuous exercise.
The pre- and post-exercise line graph (Figure 6) displays the mean change from pre-exercise with SEM for both groups, highlighting the significant rise in IgA for Muno-IgY and relatively stable levels in Placebo.
4.5.2 Serum Markers of Muscle Damage
In the FAS population, a significant main effect of group was observed on LDH concentration (p = 0.0365), indicating overall differences between the Muno-IgY and placebo groups (Figure 7). Also, a significant Time × Group interaction effect was observed (p = 0.0079), suggesting that LDH responses over time differed between treatments. However, there was no significant main effect of time on LDH concentration (p = 0.730). Post hoc pairwise comparisons revealed that at 1-hour post-intervention, the Muno-IgY group exhibited a significantly greater reduction in LDH compared with placebo (p < 0.0001). This indicates an acute, time-specific effect of Muno-IgY on LDH levels.
For CK, no significant main effects of time (p = 0.246) or group (p = 0.513), and no significant interaction between time and group (p = 0.712) were observed. These results suggest that Muno-IgY supplementation did not have a significant influence on CK responses post-exercise.
4.5.3 Serum Markers of Inflammation
The analysis of serum IL-1β concentration revealed no significant effects of time (p = 0.790), group (p = 0.689), or their interaction (p = 0.530). Overall, IL-1β levels remained stable across time and were not significantly affected by Muno-IgY supplementation.
There were also no significant differences between groups in the change from pre-exercise to any post-exercise time point for any other marker of inflammation, including CRP (p = 0.37), IL-10 (p = 0.48), cortisol (p = 0.19), LBP (p = 0.74) and TNF-α (p = 0.25). There was no measurable effect of exercise on IL-6 at any post-exercise time point, as values remained constant across all subjects and time points.
4.6. Effect of Muno-IgY supplementation on Gut Microbiome
4.6.1. Alpha Diversity
No significant differences in within-sample microbial diversity were observed between the Muno-IgY and placebo groups. Mean Shannon and Simpson diversity indices were comparable between groups (Table 6), indicating similar microbial richness and evenness across treatments.
4.6.2 Beta Diversity
Between-group differences in overall microbial community composition, assessed using Bray–Curtis’s dissimilarity, were not statistically significant. PERMANOVA analysis showed that treatment explained approximately 3.4% of the total variance in microbiome composition (R² = 0.034), with no significant separation between groups (p = 0.114). Consistent with these findings, Principal coordinates analysis (PCoA) plots (Figure 8) demonstrated substantial overlap between the Muno-IgY and placebo groups, suggesting broadly similar global community structures.
4.6.3 Species-Level Gut Microbiome Changes
Relative abundances of the top 20 bacterial species in fecal samples were determined for participants receiving Muno-IgY or placebo (Figure 9). In the Muno-IgY group, Segatella copri, Phocaeicola vulgatus, and Bacteroides eggerthii were among the most abundant species, whereas in the placebo group, Phocaeicola dorei, Segatella copri, and Phocaeicola vulgatus predominated. Overall, the relative composition of the top species showed differences between treatment groups; however, no formal statistical comparisons were performed for individual species due to the exploratory nature of this study.
An exploratory analysis of the gut microbiome was performed to assess changes in the relative abundance of selected bacterial species between baseline and the end of the study. Overall, no statistically significant differences were observed in alpha or beta diversity, and species-level analyses are presented for descriptive purposes. Within the selected taxa, Muno-IgY supplementation was associated with numerically higher relative abundance of several Bacteroides species, including Bacteroides caccae, B. ovatus, B. stercoris, B. uniformis, and B. thetaiotaomicron, compared with placebo. Akkermansia muciniphila showed similar reductions in both groups, while Lacticaseibacillus rhamnosus decreased to a lesser extent in the Muno-IgY group (Figure 10).
Conversely, multiple opportunistic or potentially pathogenic species, including Clostridioides difficile, Clostridium perfringens, Fusobacterium nucleatum, Enterobacter spp., Citrobacter koseri, Klebsiella spp., Streptococcus spp., Enterococcus rotai, Yersinia spp., Staphylococcus spp., and Listeria monocytogenes, demonstrated numerically lower relative abundance in the Muno-IgY group relative to placebo (Figure 11). Similar directional trends were observed across other relevant gut microbiota, including butyrate-producing taxa such as Faecalibacterium prausnitzii, Roseburia spp., Anaerostipes hadrus, Coprococcus spp. and lactic acid bacteria such as Lactococcus and Leuconostoc spp., suggesting potential modulation of both commensal and opportunistic taxa with Muno-IgY supplementation. All findings are exploratory and descriptive, as no statistically significant differences were detected.
Also, to assess the effect of treatment on the gut microbiome in participants with at least one incidence of URTI during the study period, baseline and post-intervention samples were analyzed using within-subject fold-change and log2 fold-change calculations, followed by group-level summarization by infection status and treatment. Analyses were restricted to infected participants and taxa exhibiting a mean fold change ≥3. The summarized data are presented in Table 7, and the directional shifts in bacterial abundance are visualized in Figure 12.
Only two participants in the Muno-IgY group and five participants in the placebo group reported at least one incidence of URTI during the study period; the small number of affected participants in the Muno-IgY group may limit the generalizability and interpretation of the observed microbiome changes. In the placebo group, several bacterial taxa exhibited large mean fold increases, including Escherichia coli, Klebsiella grimontii, and Shigella flexneri; however, these changes were accompanied by pronounced discrepancies between mean and median values, with median log2 fold changes near or below zero. This pattern indicates substantial inter-individual variability and suggests episodic or outlier-driven microbial blooms rather than uniform shifts across subjects.
In contrast, Muno-IgY treatment was associated with consistent and reproducible enrichment across multiple bacterial taxa, as evidenced by identical mean and median fold-change and log2 fold-change values. Notably, taxa linked to anaerobic metabolism and gut ecosystem structure, including Segatella copri, Parabacteroides johnsonii, Alistipes indistinctus, and Butyricimonas virosa, demonstrated coordinated increases. Members of the Veillonella genus showed uniform enrichment exclusively in the Muno-IgY group. These findings suggest a stabilizing effect of Muno-IgY on the gut microbial community in participants reporting URTI, although the small sample size in the Muno-IgY group warrants cautious interpretation.
5. Discussion
This randomized, double-blind, placebo-controlled pilot study provides an integrated assessment of the effects of Muno-IgY supplementation on respiratory health, immune function, exercise-induced physiological stress, and gut microbiome composition in healthy adults. While many outcomes did not reach statistical significance, consistent directional trends across clinical, biochemical, and microbiome endpoints suggest potential biological effects of Muno-IgY that warrant further investigation.
In this study, participants receiving Muno-IgY experienced a numerically lower incidence of URTIs, shorter symptom duration, and fewer missed work or school days compared with placebo. Although these differences were not statistically significant, the approximately 60% relative reduction in URTI incidence aligns with prior studies demonstrating the protective potential of Muno-IgY, particularly in populations exposed to environmental or physiological stressors, as previously demonstrated in animal models [24,25,26]. The low overall number of URTI events, combined with the modest sample size, limited the statistical power to detect between-group differences. As this was an exploratory pilot study, the primary objective was to assess feasibility, safety, and signal directionality rather than definitive efficacy. The observed trends are biologically plausible given IgY’s known mechanisms of action, including pathogen neutralization, inhibition of microbial adhesion, and agglutination without activation of inflammatory Fc-mediated pathways in humans [15]. Unlike pathogen-specific IgY formulations studied previously, Muno-IgY contains antibodies directed against multiple pathogens, which may provide broader mucosal protection and partially explain the observed reduction in URTI burden.
Though there was a numerical reduction in the URTI incidence in subjects supplemented with Muno-IgY, no significant changes were observed in resting serum IgA concentrations or serum concentrations of inflammatory cytokines over the 12-week intervention period. This is consistent with previous nutritional intervention studies in healthy adults, where baseline immune markers often remain stable due to intact immune homeostasis [27]. In such populations, supplements may exert their effects primarily under conditions of immune challenge rather than at rest.
Interestingly, Muno-IgY supplementation resulted in a significant reduction in the serum concentration of LBP, an acute-phase reactant associated with gut-derived endotoxemia and systemic immune activation. Elevated LBP levels have been linked to increased intestinal permeability, chronic low-grade inflammation and inhibit the immuno-stimulatory effects of bacterial components [28]. The observed modulation of LBP suggests a potential role for Muno-IgY in supporting gut barrier integrity or reducing microbial translocation, which may indirectly influence systemic and respiratory immune responses through the gut–lung axis [29].
Exercise is a well-established physiological stressor that can transiently suppress immune function and increase susceptibility to infections, particularly through reductions in mucosal IgA [30]. In the present study, Muno-IgY supplementation was associated with a significant increase in serum IgA 24 hours post-exercise, whereas no significant change was observed in the placebo group. To our knowledge, there are no published human studies that have specifically examined the effect of oral IgY supplementation on serum IgA concentrations in athletes or healthy adults post-exercise, and exercise-related applications of IgY have thus far remained largely theoretical or confined to unrelated immune contexts. Nevertheless, the broader exercise immunology literature demonstrates that both acute and chronic physical exercise can independently modulate immunoglobulin levels, including IgA, particularly in physically active or high-training-load populations [30]. In this context, comparable patterns have been reported with other gut-targeted nutritional interventions. For example, a recent clinical study investigating probiotic supplementation in physically active individuals observed increases in serum IgA following exercise, despite minimal changes in systemic inflammatory markers [31]. Although probiotics and IgY act through distinct biological mechanisms, both interventions are thought to primarily influence gut microbiota and associated mucosal immune function, supporting immune resilience during periods of physiological stress. These observations provide a relevant framework for interpreting the immune biomarker responses observed in the present IgY intervention study.
Lactate dehydrogenase is a cytosolic enzyme that leaks into the circulation following mechanical and metabolic stress to muscle tissue. Its serum activity increases significantly in the setting of non-traumatic acute muscle injury and rhabdomyolysis, reflecting cellular membrane disruption and tissue stress rather than direct pathology [32]. In the present study, Muno-IgY supplementation was associated with a favorable acute reduction in LDH levels 1 hour post-exercise compared with the placebo, suggesting a potential attenuation of exercise-induced muscle stress or an enhancement of early recovery processes. While CK did not differ between groups, LDH has been reported to respond more rapidly to physiological stress and may provide complementary information about acute tissue perturbation following exertion [33]. Together, these findings suggest that Muno-IgY may buffer aspects of exercise-induced physiological strain, potentially through immune modulation or reduced inflammatory signaling that limits cellular leakage of LDH into the circulation.
The gut microbiome diversity metrics did not differ significantly between groups, which is consistent with prior findings in human intervention studies showing that short-term dietary or exercise interventions often do not yield large, statistically significant changes in overall gut microbial diversity, particularly in modestly sized cohorts [34]. However, exploratory analyses revealed consistent directional shifts in microbial composition associated with Muno-IgY supplementation. These included numerically higher relative abundances of commensal taxa such as Bacteroides species and reduced abundance of several opportunistic or potentially pathogenic taxa. Although studies of orally administered IgY and human microbiota remain limited, evidence from gut immunology demonstrates that mucosal immunoglobulins can interact directly with microbial communities, influencing the relative abundance of specific taxa without broadly disrupting beneficial commensal populations [34]. Such selective modulation is biologically plausible given IgA’s role in stabilizing host-microbiota symbiosis by binding microbial antigens and promoting niche adherence of commensals, with analogous effects potentially attributable to exogenous IgY at the mucosal surface [35]. The reduction of opportunistic taxa alongside preservation of beneficial microbes may support gut barrier integrity and facilitate immune regulation, aligning with models of gut–lung immune crosstalk wherein gut microbial composition influences systemic and distal mucosal immunity [36]. As this study was not powered for formal microbiome inference, these findings should be interpreted as hypothesis-generating and warrant further investigation in larger, mechanistically targeted trials.
Although the small number of participants reporting URTI, particularly in the Muno-IgY group, limits generalizability, the observed patterns suggest targeted modulation of the gut microbiome. Episodic blooms of opportunistic taxa in placebo participants are consistent with prior reports of transient Enterobacteriaceae expansions during immune stress [37]. In contrast, Muno-IgY supplementation appeared to stabilize key anaerobic and commensal taxa, supporting microbial ecosystem structure and potentially enhancing short-chain fatty acid production. These findings align with evidence that orally delivered immunoglobulins can selectively influence microbial composition without broadly disrupting diversity, analogous to IgA-mediated mucosal regulation [38]. Overall, these findings suggest that Muno-IgY may help support a stable and resilient gut microbiome during periods of immune stress, although this needs to be confirmed in larger studies.
As hypothesized, in this pilot study, Muno-IgY was well-tolerated, and the safety profile was favorable. A total of 16 participants reported 28 TEAEs, the majority of which were mild and deemed unrelated to the study products. Only one TEAE (ageusia) in the Muno-IgY group was suspected to be related to the study product, and it resolved after discontinuation. No SAEs or deaths occurred, and no participants discontinued due to adverse events. The most frequently reported TEAEs were flu-like symptoms, fatigue, upper respiratory infection, vasovagal reaction, headache, and loose stools, with similar distribution across the Muno-IgY and placebo groups. These findings demonstrate that Muno-IgY is safe and well-tolerated in healthy adults over 12 weeks.
Key strengths of this study include its comprehensive, systems-level approach integrating clinical outcomes, immune and inflammatory biomarkers, exercise physiology, and shotgun metagenomic analysis. The randomized, double-blind design and high compliance further strengthen the validity of the findings. Limitations include the small sample size, low incidence of URTIs, and the generally healthy study population, which may have reduced the likelihood of detecting large immune changes at rest. Microbiome analyses were exploratory and descriptive.
Despite these limitations, consistent directional trends across multiple domains suggest that Muno-IgY may support immune resilience, respiratory health, and recovery from physiological stress. These findings provide a strong rationale for larger, adequately powered trials in populations at higher risk of URTIs, such as athletes, older adults, or individuals under chronic stress. Future studies should explore longer intervention durations, pathogen-specific outcomes, and mechanistic links between IgY supplementation, gut barrier function, and immune regulation.
6. Conclusions
This pilot study demonstrates that Muno-IgY supplementation is safe, well-tolerated, and associated with consistent directional improvements in respiratory outcomes, immune markers, exercise-induced physiological stress, and gut microbial composition. While most effects did not reach statistical significance, the observed trends support the biological plausibility of IgY-mediated mucosal protection and systemic immune modulation. These results provide a foundation for future, larger-scale clinical trials to confirm efficacy, elucidate mechanisms, and explore the potential of Muno-IgY in populations at elevated risk of respiratory infections or physiological stress.
Author Contributions
Conceptualization, H.H.N. and P.E.K.; methodology, H.H.N., T.S., and Apex Trials as a Contract Research Organization.; writing—original draft preparation, S.F. and P.E.K.; data analysis, figures and tables, S.F.; writing—review and editing, H.H.N., T.S., N.S.
Funding
This research was funded by IGY Immune Technologies and Life Sciences Inc. The funding body provided financial support and was involved in experimental design, writing the manuscript and the decision to publish the results.
Institutional Review Board Statement
The study was conducted in accordance with the Declaration of Helsinki and approved by the Sterling Institutional Review Board (Atlanta, GA; Approval Reference #10578; 12/12/2022) and authorization from Health Canada’s Natural and Non-Prescription Products Directorate (ISRCTN Registry #51932144). All participants provided written informed consent before enrollment, between December 2022 and July 2023.
Informed Consent Statement
Informed consent was obtained from all subjects involved in the study.
Data Availability Statement
The original contributions presented in this study are included in the article. The raw data supporting the conclusions of this manuscript will be made available by the authors upon reasonable request. Further inquiries can b directed to the corresponding author.
Conflicts of Interest
The authors declare no conflicts of interest.
References
- Jin, X.; Ren, J.; Li, R.; Gao, Y.; Zhang, H.; Li, J.; Zhang, J.; Wang, X.; Wang, G. Global burden of upper respiratory infections in 204 countries and territories, from 1990 to 2019. EClinicalMedicine 2021, 37. [Google Scholar] [CrossRef] [PubMed]
- Dicpinigaitis, P. V.; Eccles, R.; Blaiss, M. S.; Wingertzahn, M. A. Impact of cough and common cold on productivity, absenteeism, and daily life in the United States: ACHOO Survey. Curr.Med.Res.Opin 2015, 31(8), 1519–1525. [Google Scholar]
- Engebretsen, L.; Steffen, K.; Alonso, J. M.; Aubry, M.; Dvorak, J.; Junge, A.; Meeuwisse, W.; Mountjoy, M.; Renström, P.; Wilkinson, M. Sports injuries and illnesses during the Winter Olympic Games 2010. Br.J.Sports Med. 2010, 44(11), 772–780. [Google Scholar] [CrossRef]
- Cicchella, A.; Stefanelli, C.; Massaro, M. Upper respiratory tract infections in sport and the immune system response. A review. Biology 2021, 10(5), 362. [Google Scholar] [CrossRef]
- Colbey, C.; Cox, A. J.; Pyne, D. B.; Zhang, P.; Cripps, A. W.; West, N. P. Upper respiratory symptoms, gut health and mucosal immunity in athletes. Sports Medicine 2018, 48 Suppl 1, 65–77. [Google Scholar] [CrossRef]
- Kang, W.; Kudsk, K. A. Is there evidence that the gut contributes to mucosal immunity in humans? J.Parenter.Enteral Nutr. 2007, 31(3), 246–258. [Google Scholar] [CrossRef] [PubMed]
- Schuijt, T. J.; Lankelma, J. M.; Scicluna, B. P.; e Melo, F. d. S.; Roelofs, J. J.; de Boer, J. D.; Hoogendijk, A. J.; de Beer, R.; de Vos, A.; Belzer, C. The gut microbiota plays a protective role in the host defence against pneumococcal pneumonia. Gut 2016, 65(4), 575–583. [Google Scholar] [CrossRef] [PubMed]
- Cox, A. J.; Pyne, D. B.; Saunders, P. U.; Fricker, P. A. Oral administration of the probiotic Lactobacillus fermentum VRI-003 and mucosal immunity in endurance athletes. Br.J.Sports Med. 2010, 44(4), 222–226. [Google Scholar]
- Clancy, R. L.; Gleeson, M.; Cox, A.; Callister, R.; Dorrington, M.; D’este, C.; Pang, G.; Pyne, D.; Fricker, P.; Henriksson, A. Reversal in fatigued athletes of a defect in interferon γ secretion after administration of Lactobacillus acidophilus. Br.J.Sports Med. 2006, 40(4), 351–354. [Google Scholar]
- Heinz, S. A.; Henson, D. A.; Austin, M. D.; Jin, F.; Nieman, D. C. Quercetin supplementation and upper respiratory tract infection: A randomized community clinical trial. Pharmacological research 2010, 62(3), 237–242. [Google Scholar] [CrossRef]
- Abbas, A. T.; El-Kafrawy, S. A.; Sohrab, S. S.; Azhar, E. I. A. IgY antibodies for the immunoprophylaxis and therapy of respiratory infections. Human vaccines & immunotherapeutics 2019, 15(1), 264–275. [Google Scholar]
- Wang, L.; Li, X.; Jin, L.; You, J.; Zhou, Y.; Li, S.; Xu, Y. Characterization of chicken egg yolk immunoglobulins (IgYs) specific for the most prevalent capsular serotypes of mastitis-causing Staphylococcus aureus. Vet.Microbiol 2011, 149(3-4), 415–421. [Google Scholar] [CrossRef] [PubMed]
- Lee, E. N.; Sunwoo, H. H.; Menninen, K.; Sim, J. S. In vitro studies of chicken egg yolk antibody (IgY) against Salmonella enteritidis and Salmonella typhimurium. Poult.Sci 2002, 81(5), 632–641. [Google Scholar]
- Zhen, Y.; Jin, L.; Guo, J.; Li, X.; Lu, Y.; Chen, J.; Xu, Y. Characterization of specific egg yolk immunoglobulin (IgY) against mastitis-causing Escherichia coli. Vet.Microbiol 2008, 130(1-2), 126–133. [Google Scholar] [CrossRef]
- Wang, Z.; Li, J.; Li, J.; Li, Y.; Wang, L.; Wang, Q.; Fang, L.; Ding, X.; Huang, P.; Yin, J. Protective effect of chicken egg yolk immunoglobulins (IgY) against enterotoxigenic Escherichia coli K88 adhesion in weaned piglets. BMC veterinary research 2019, 15(1), 234. [Google Scholar]
- Yang, Y.; Wen, J.; Zhao, S.; Zhang, K.; Zhou, Y. Prophylaxis and therapy of pandemic H1N1 virus infection using egg yolk antibody. J.Virol.Methods. 2014, 206, 19–26. [Google Scholar] [CrossRef] [PubMed]
- Nguyen, H. H.; Tumpey, T. M.; Park, H.; Byun, Y.; Tran, L. D.; Nguyen, V. D.; Kilgore, P. E.; Czerkinsky, C.; Katz, J. M.; Seong, B. L. Prophylactic and therapeutic efficacy of avian antibodies against influenza virus H5N1 and H1N1 in mice. PloS one 2010, 5(4), e10152. [Google Scholar] [CrossRef]
- Duncan, M. J.; Rosenkranz, R. R.; Vandelanotte, C.; Caperchione, C. M.; Rebar, A. L.; Maeder, A. J.; Tague, R.; Savage, T. N.; Van Itallie, A.; Mummery, W. K. What is the impact of obtaining medical clearance to participate in a randomised controlled trial examining a physical activity intervention on the socio-demographic and risk factor profiles of included participants? Trials 2016, 17(1), 580. [Google Scholar] [CrossRef]
- Hansen, A. W.; Grønbæk, M.; Helge, J. W.; Severin, M.; Curtis, T.; Tolstrup, J. S. Effect of a web-based intervention to promote physical activity and improve health among physically inactive adults: a population-based randomized controlled trial. Journal of medical Internet research 2012, 14(5), e2109. [Google Scholar] [CrossRef]
- Giuliano, F.; Jackson, G.; Montorsi, F.; Martin-Morales, A.; Raillard, P. Safety of sildenafil citrate: Review of 67 double-blind placebo-controlled trials and the postmarketing safety database. Int.J.Clin.Pract. 2010, 64(2), 240–255. [Google Scholar] [CrossRef]
- Moro, P. L.; Leung, J.; Marquez, P.; Kim, Y.; Wei, S.; Su, J. R.; Marin, M. Safety surveillance of varicella vaccines in the vaccine adverse event reporting system, United States, 2006–2020. J.Infect.Dis. 2022, 226 Supplement_4, S431–S440. [Google Scholar] [CrossRef] [PubMed]
- He, Z.; Sun, G.; Zhu, H.; Ye, B.; Zheng, Z.; He, X.; Pan, H. Effects of different peripheral fatigue protocol on lower limb biomechanical changes during landing and its impact on the risk of anterior cruciate ligament injury: a systematic review. Frontiers in Bioengineering and Biotechnology 2025, 13, 1587573. [Google Scholar] [CrossRef] [PubMed]
- Miraples, A.; McFadyen, B. J.; Khalaf, E. M.; Raizada, M. N. Pollen DNA Isolation Methods: Literature Review and Benefit of Adding Chloroform: Isoamyl Alcohol to Commercial DNA Kits. 2025. [Google Scholar] [CrossRef]
- Han, S.; Wen, Y.; Yang, F.; He, P. Chicken egg yolk antibody (IgY) protects mice against enterotoxigenic Escherichia coli infection through improving intestinal health and immune response. Frontiers in cellular and infection microbiology 2021, 11, 662710. [Google Scholar] [CrossRef]
- Nastasa, V.; Minea, B.; Pasca, A.; Bostanaru-Iliescu, A.; Stefan, A.; Gologan, D.; Capota, R.; Foia, L.; Mares, M. Long-Term Oral Administration of Hyperimmune Egg-Based IgY-Rich Formulations Induces Mucosal Immune Response and Systemic Increases of Cytokines Involved in Th2-and Th17-Type Immune Responses in C57BL/6 Mice. International Journal of Molecular Sciences 2024, 25(16), 8701. [Google Scholar] [CrossRef]
- Rehan, I. F.; Youssef, M.; Abdel-Rahman, M. A.; Fahmy, S. G.; Ahmed, E.; Ahmed, A. S.; Maky, M. A.; Diab, H. M.; Shanab, O.; Alkahtani, S. The impact of probiotics and egg yolk IgY on behavior and blood parameters in a broiler immune stress model. Frontiers in Veterinary Science 2020, 7, 145. [Google Scholar] [CrossRef]
- Munteanu, C.; Schwartz, B. The relationship between nutrition and the immune system. Frontiers in nutrition 2022, 9, 1082500. [Google Scholar] [CrossRef]
- Lim, P. S.; Chang, Y.; Wu, T. Serum lipopolysaccharide-binding protein is associated with chronic inflammation and metabolic syndrome in hemodialysis patients. Blood Purif. 2019, 47(1-3), 28–36. [Google Scholar] [CrossRef]
- Kong, Y.; Li, Z.; Tang, T.; Wu, H.; Liu, J.; Gu, L.; Zhao, T.; Huang, Q. The level of lipopolysaccharide-binding protein is elevated in adult patients with obstructive sleep apnea. BMC pulmonary medicine 2018, 18(1), 90. [Google Scholar] [CrossRef]
- Karalus, M.; Grodzicka, J. The Impact of Intense Physical Exercise on Humoral and Autoimmune Markers: Changes in IgG, IgA, and Anti-TPO Antibody Levels in Healthy Adults. Progress in Health Sciences 2025, 15(2), 1–6. [Google Scholar] [CrossRef]
- Abdukalykovna, I. Z.; Jamil, R. S.; Naji, H. A.; Jamal, Z. A.; Saleh, S.; Nurlanovna, O. A. Immune Response to Probiotics and Physical Activity: A Clinical Study. Trends in Immunotherapy 2025, 120–129. [Google Scholar] [CrossRef]
- Boukhris, O.; Trabelsi, K.; Abdessalem, R.; Hsouna, H.; Ammar, A.; Glenn, J. M.; Bott, N.; Irandoust, K.; Taheri, M.; Turki, M. Effects of the 5-m shuttle run test on markers of muscle damage, inflammation, and fatigue in healthy male athletes. International Journal of Environmental Research and Public Health 2020, 17(12), 4375. [Google Scholar] [CrossRef]
- Bessa, A. L.; Oliveira, V. N.; Agostini, G. G.; Oliveira, R. J.; Oliveira, A. C.; White, G. E.; Wells, G. D.; Teixeira, D. N.; Espindola, F. S. Exercise intensity and recovery: biomarkers of injury, inflammation, and oxidative stress. The Journal of Strength & Conditioning Research 2016, 30(2), 311–319. [Google Scholar]
- Cullen, J. M.; Shahzad, S.; Dhillon, J. A systematic review on the effects of exercise on gut microbial diversity, taxonomic composition, and microbial metabolites: Identifying research gaps and future directions. Frontiers in Physiology 2023, 14, 1292673. [Google Scholar] [CrossRef]
- Donaldson, G. P.; Ladinsky, M. S.; Yu, K. B.; Sanders, J. G.; Yoo, B. B.; Chou, W.; Conner, M. E.; Earl, A. M.; Knight, R.; Bjorkman, P. J. Gut microbiota utilize immunoglobulin A for mucosal colonization. Science 2018, 360(6390), 795–800. [Google Scholar] [CrossRef]
- Sey, E. A.; Warris, A. The gut-lung axis: the impact of the gut mycobiome on pulmonary diseases and infections. Oxford Open Immunology 2024, 5(1), iqae008. [Google Scholar] [CrossRef]
- Yin, Q.; da Silva, A. C.; Zorrilla, F.; Almeida, A. S.; Patil, K. R.; Almeida, A. Ecological dynamics of Enterobacteriaceae in the human gut microbiome across global populations. Nature Microbiology 2025, 10(2), 541–553. [Google Scholar] [CrossRef] [PubMed]
- Pabst, O.; Slack, E. IgA and the intestinal microbiota: the importance of being specific. Mucosal immunology 2020, 13(1), 12–21. [Google Scholar] [PubMed]
Figure 1.
Timeline of study visits and sample collection over 12 weeks.
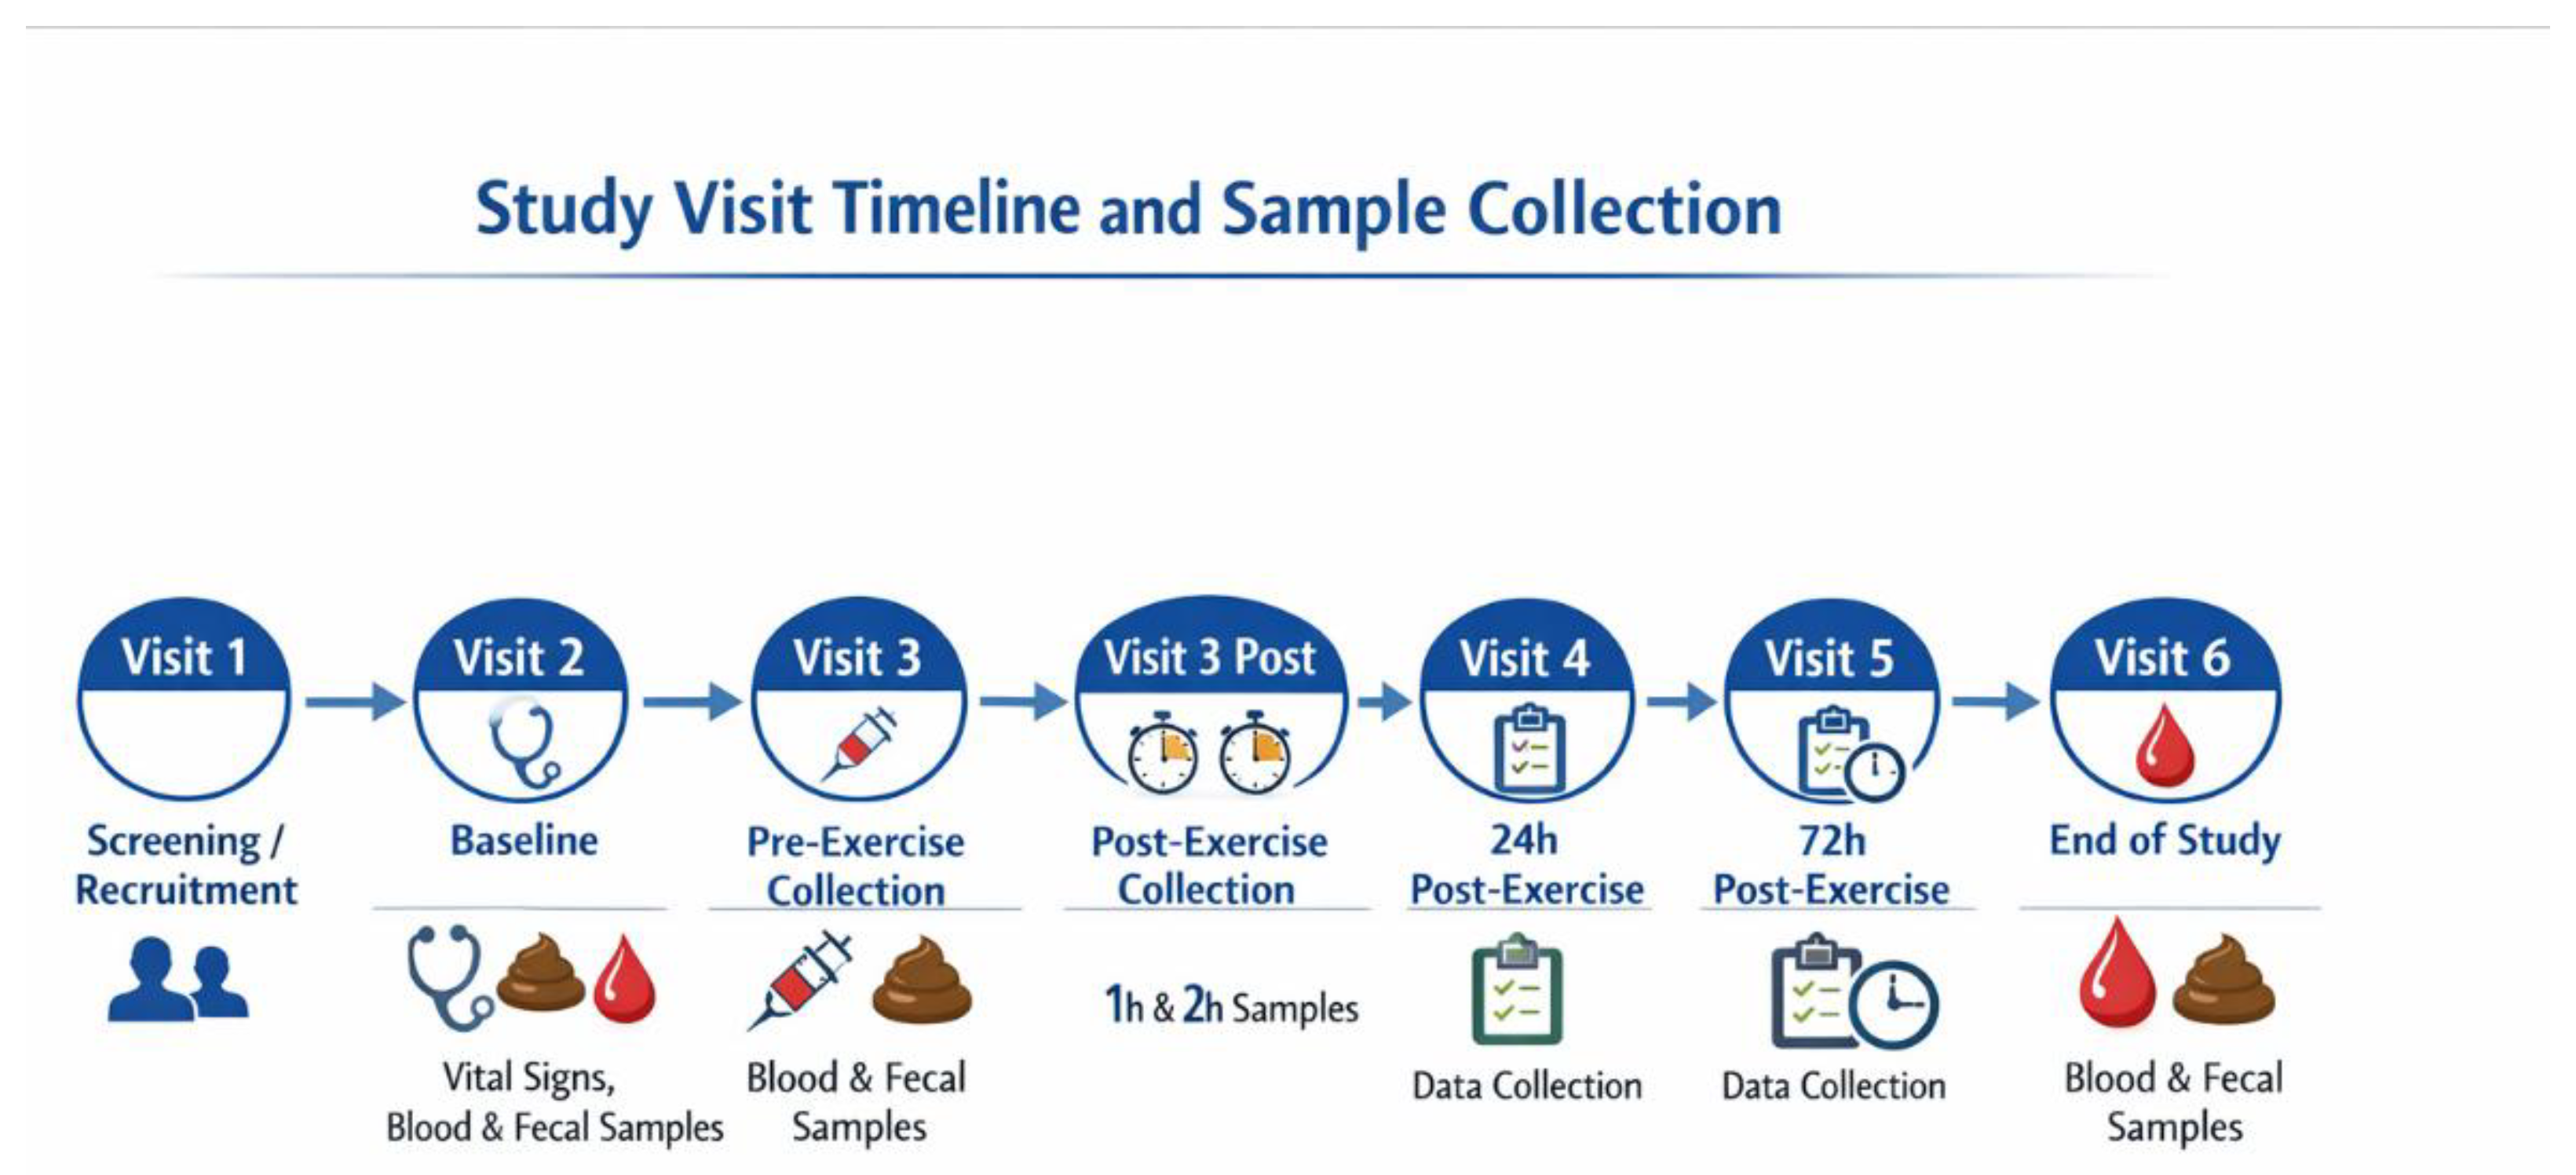
Figure 2.
CONSORT flow diagram illustrating participant enrollment, randomization, allocation, follow-up, and analysis in the two-arm, randomized, placebo-controlled 12-week study.
Figure 2.
CONSORT flow diagram illustrating participant enrollment, randomization, allocation, follow-up, and analysis in the two-arm, randomized, placebo-controlled 12-week study.
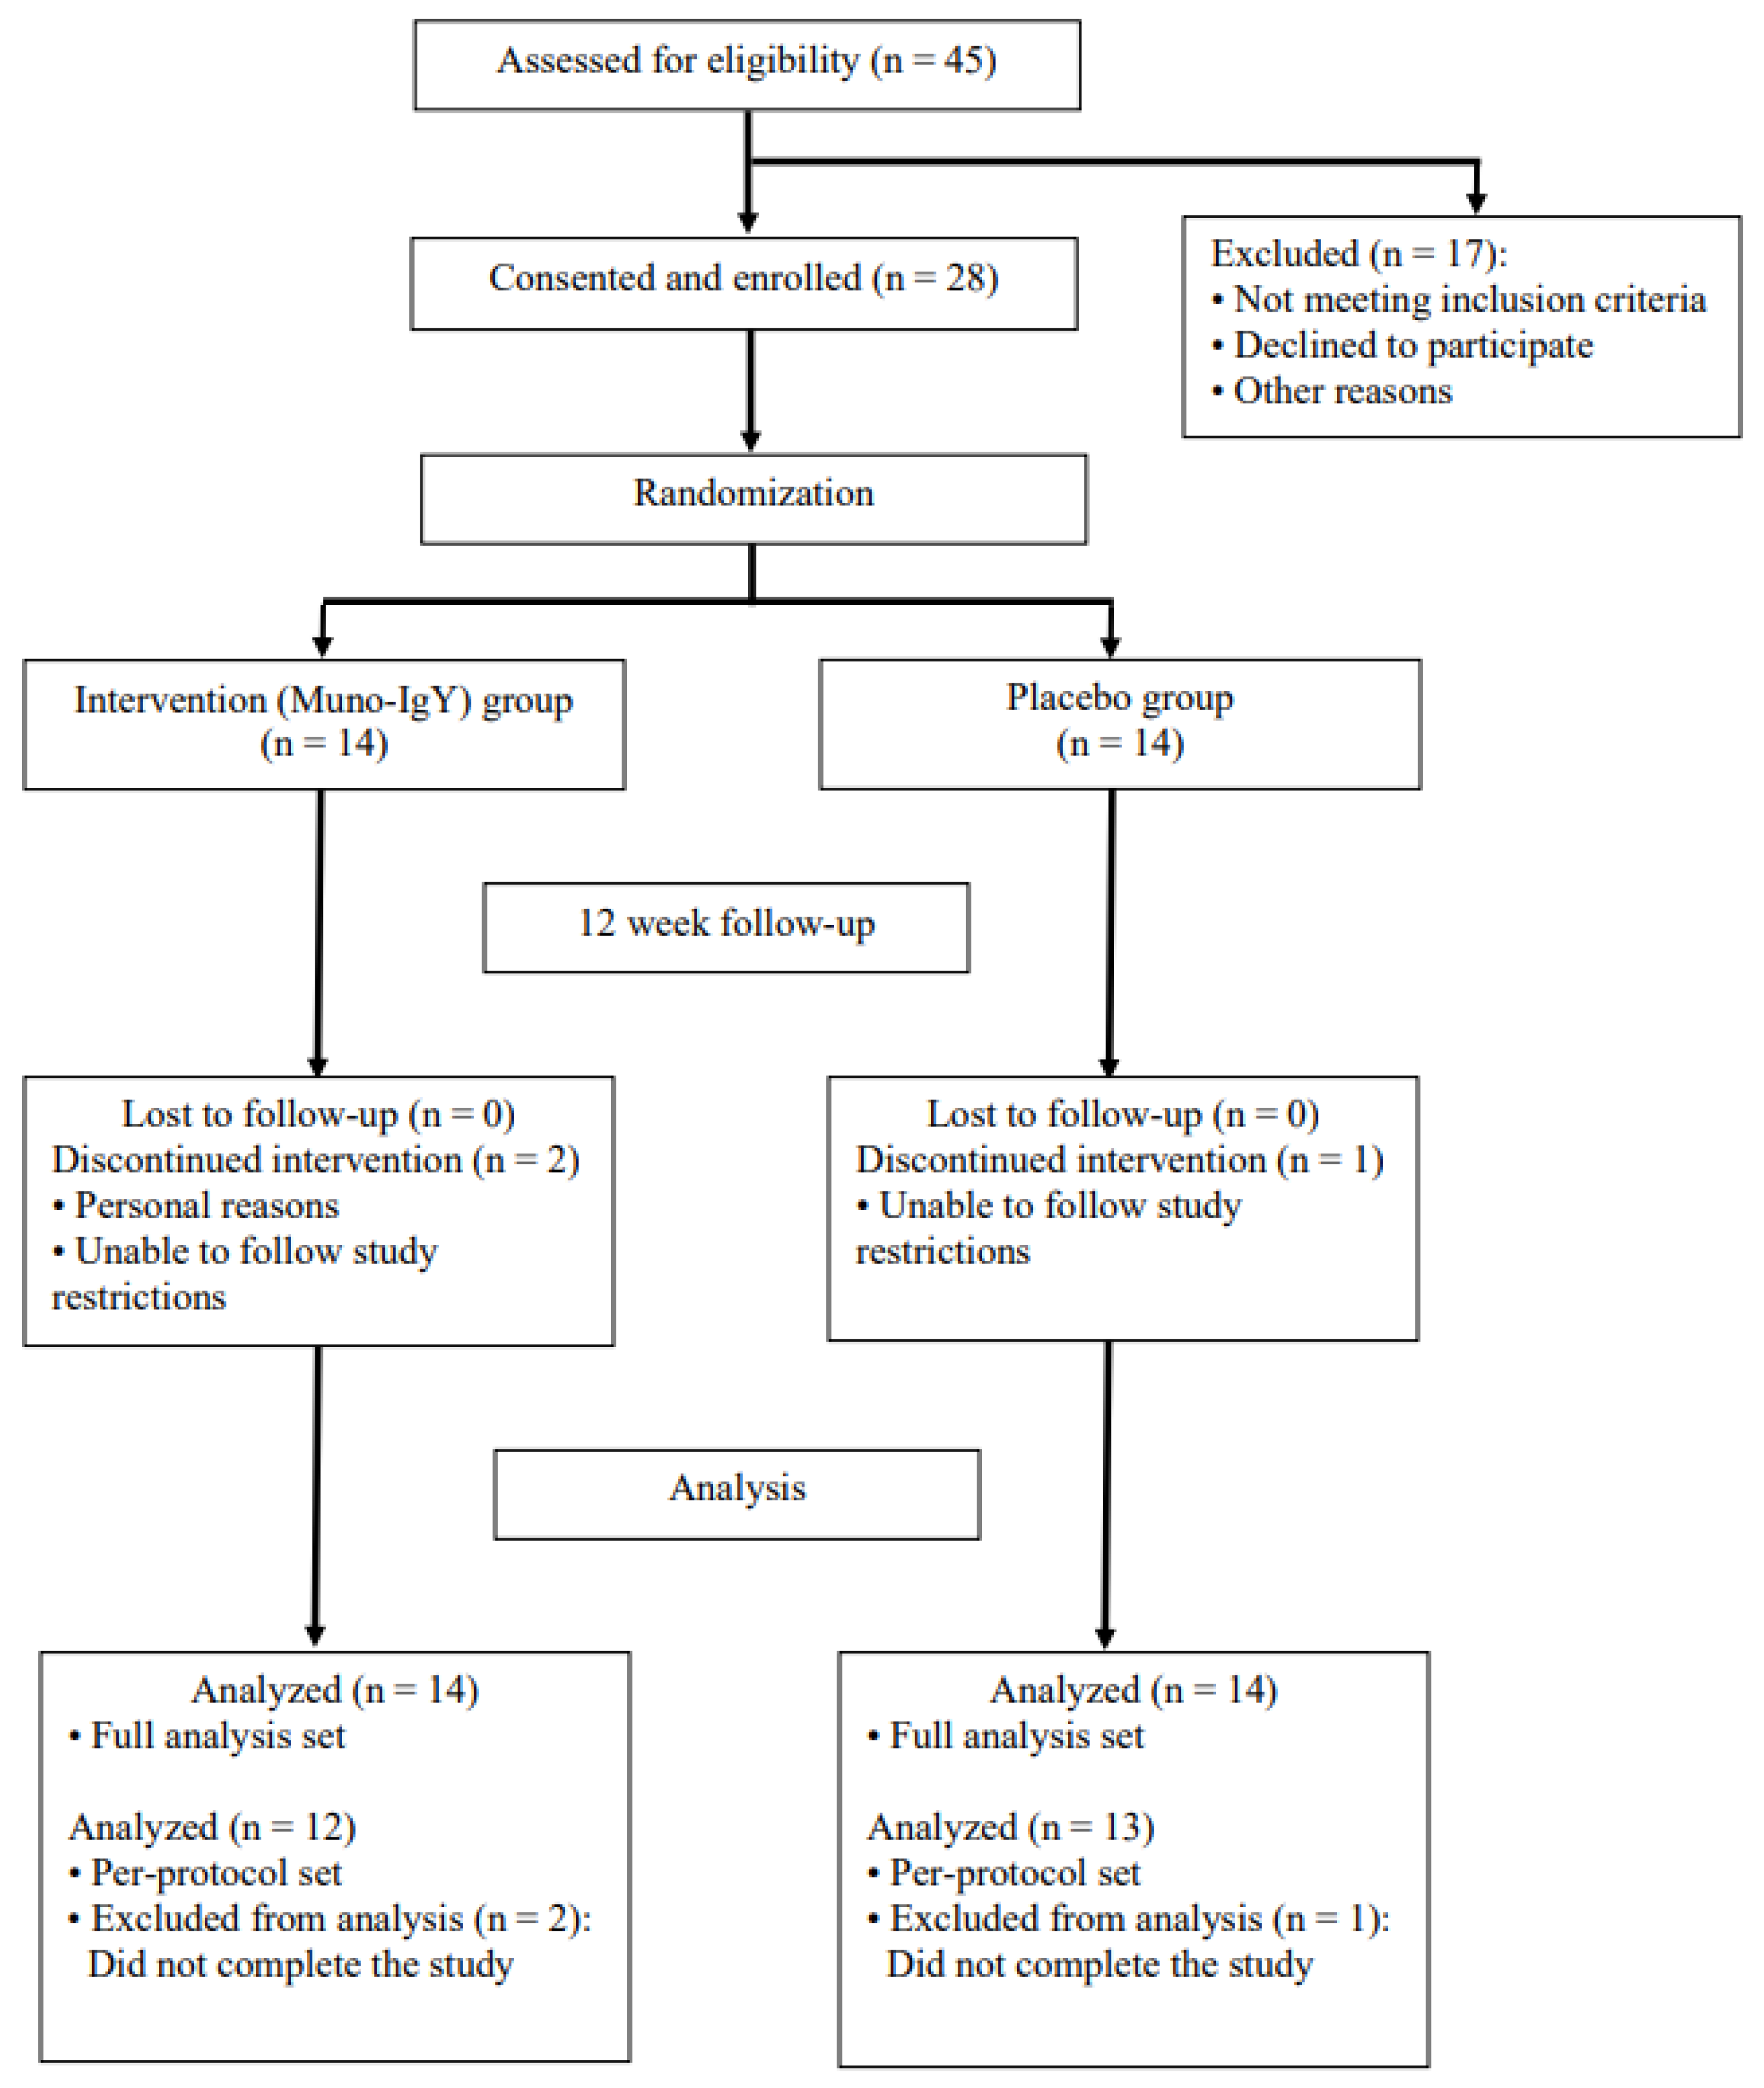
Figure 3.
Effect of Muno-IgY on serum IgA concentration at week 4 and week 12 of the study. Data represent mean ± SEM change from baseline. Repeated measures ANOVA showed no significant effect of treatment, time, or interaction.
Figure 3.
Effect of Muno-IgY on serum IgA concentration at week 4 and week 12 of the study. Data represent mean ± SEM change from baseline. Repeated measures ANOVA showed no significant effect of treatment, time, or interaction.
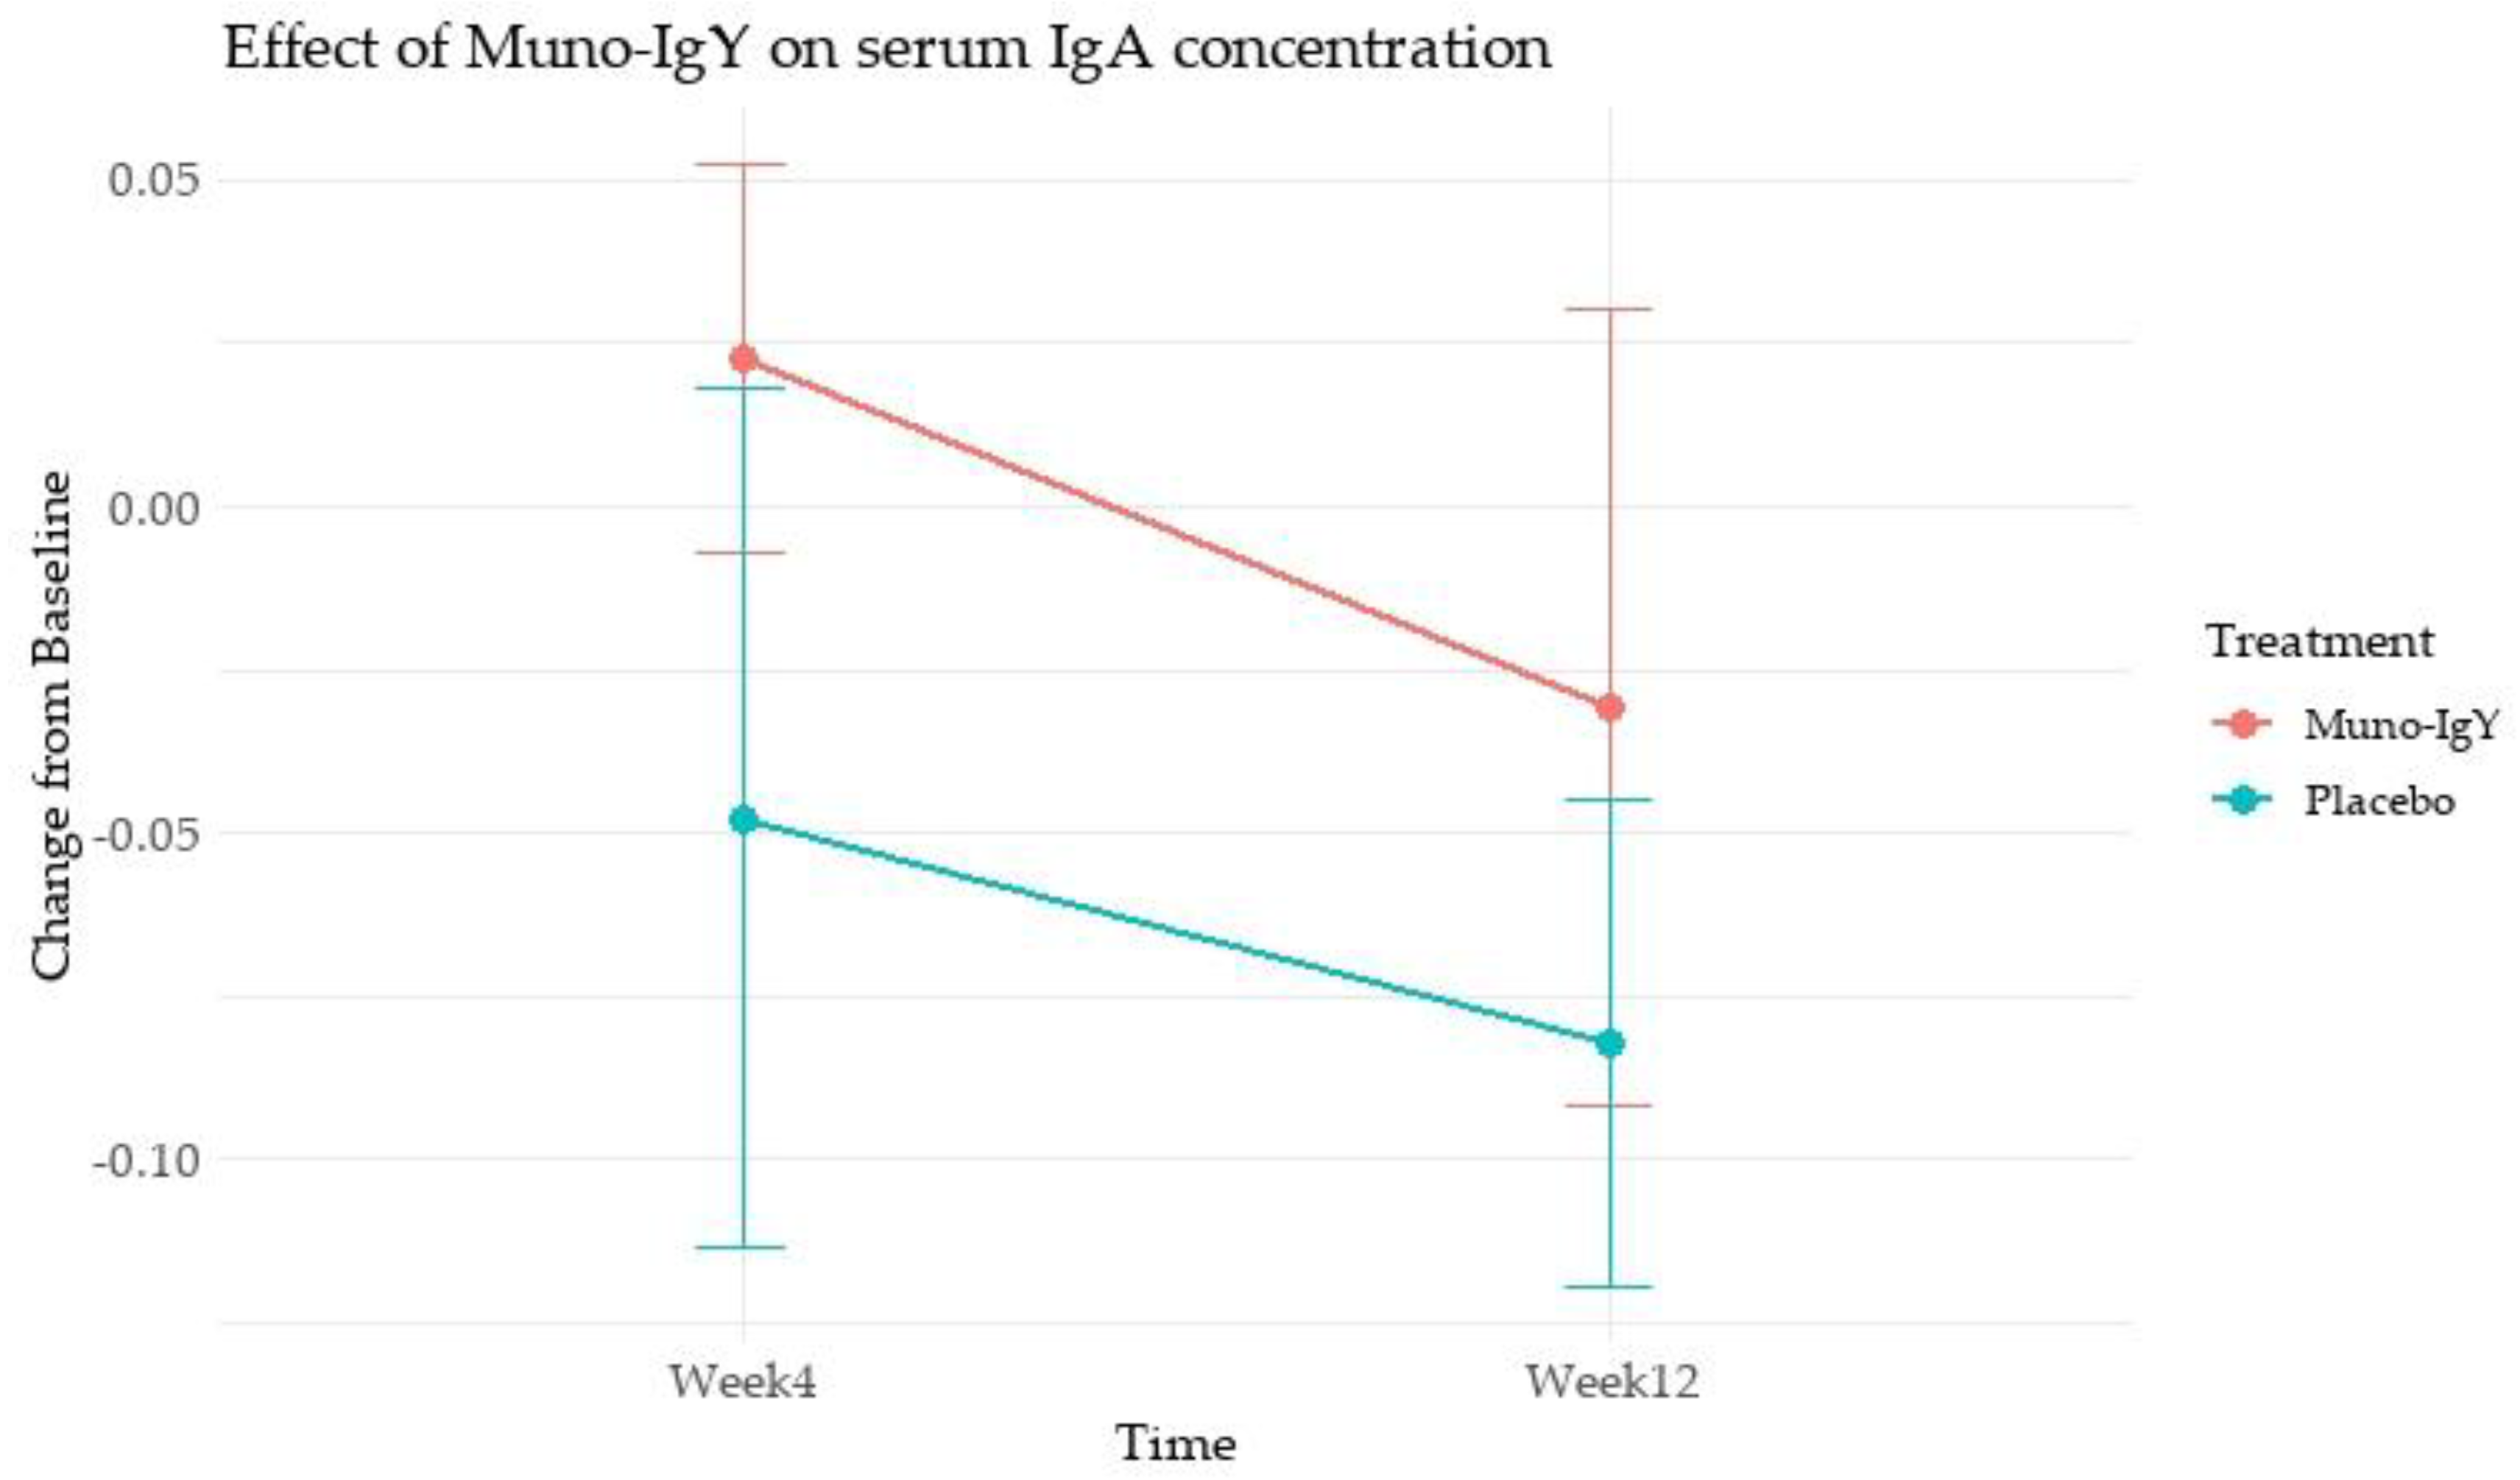
Figure 4.
Effect of Muno-IgY on serum cortisol concentration at Week 4 and Week 12. Data are presented as mean change from baseline ± SEM. Between-group comparisons were analyzed using a linear mixed-effects model with repeated measures.
Figure 4.
Effect of Muno-IgY on serum cortisol concentration at Week 4 and Week 12. Data are presented as mean change from baseline ± SEM. Between-group comparisons were analyzed using a linear mixed-effects model with repeated measures.
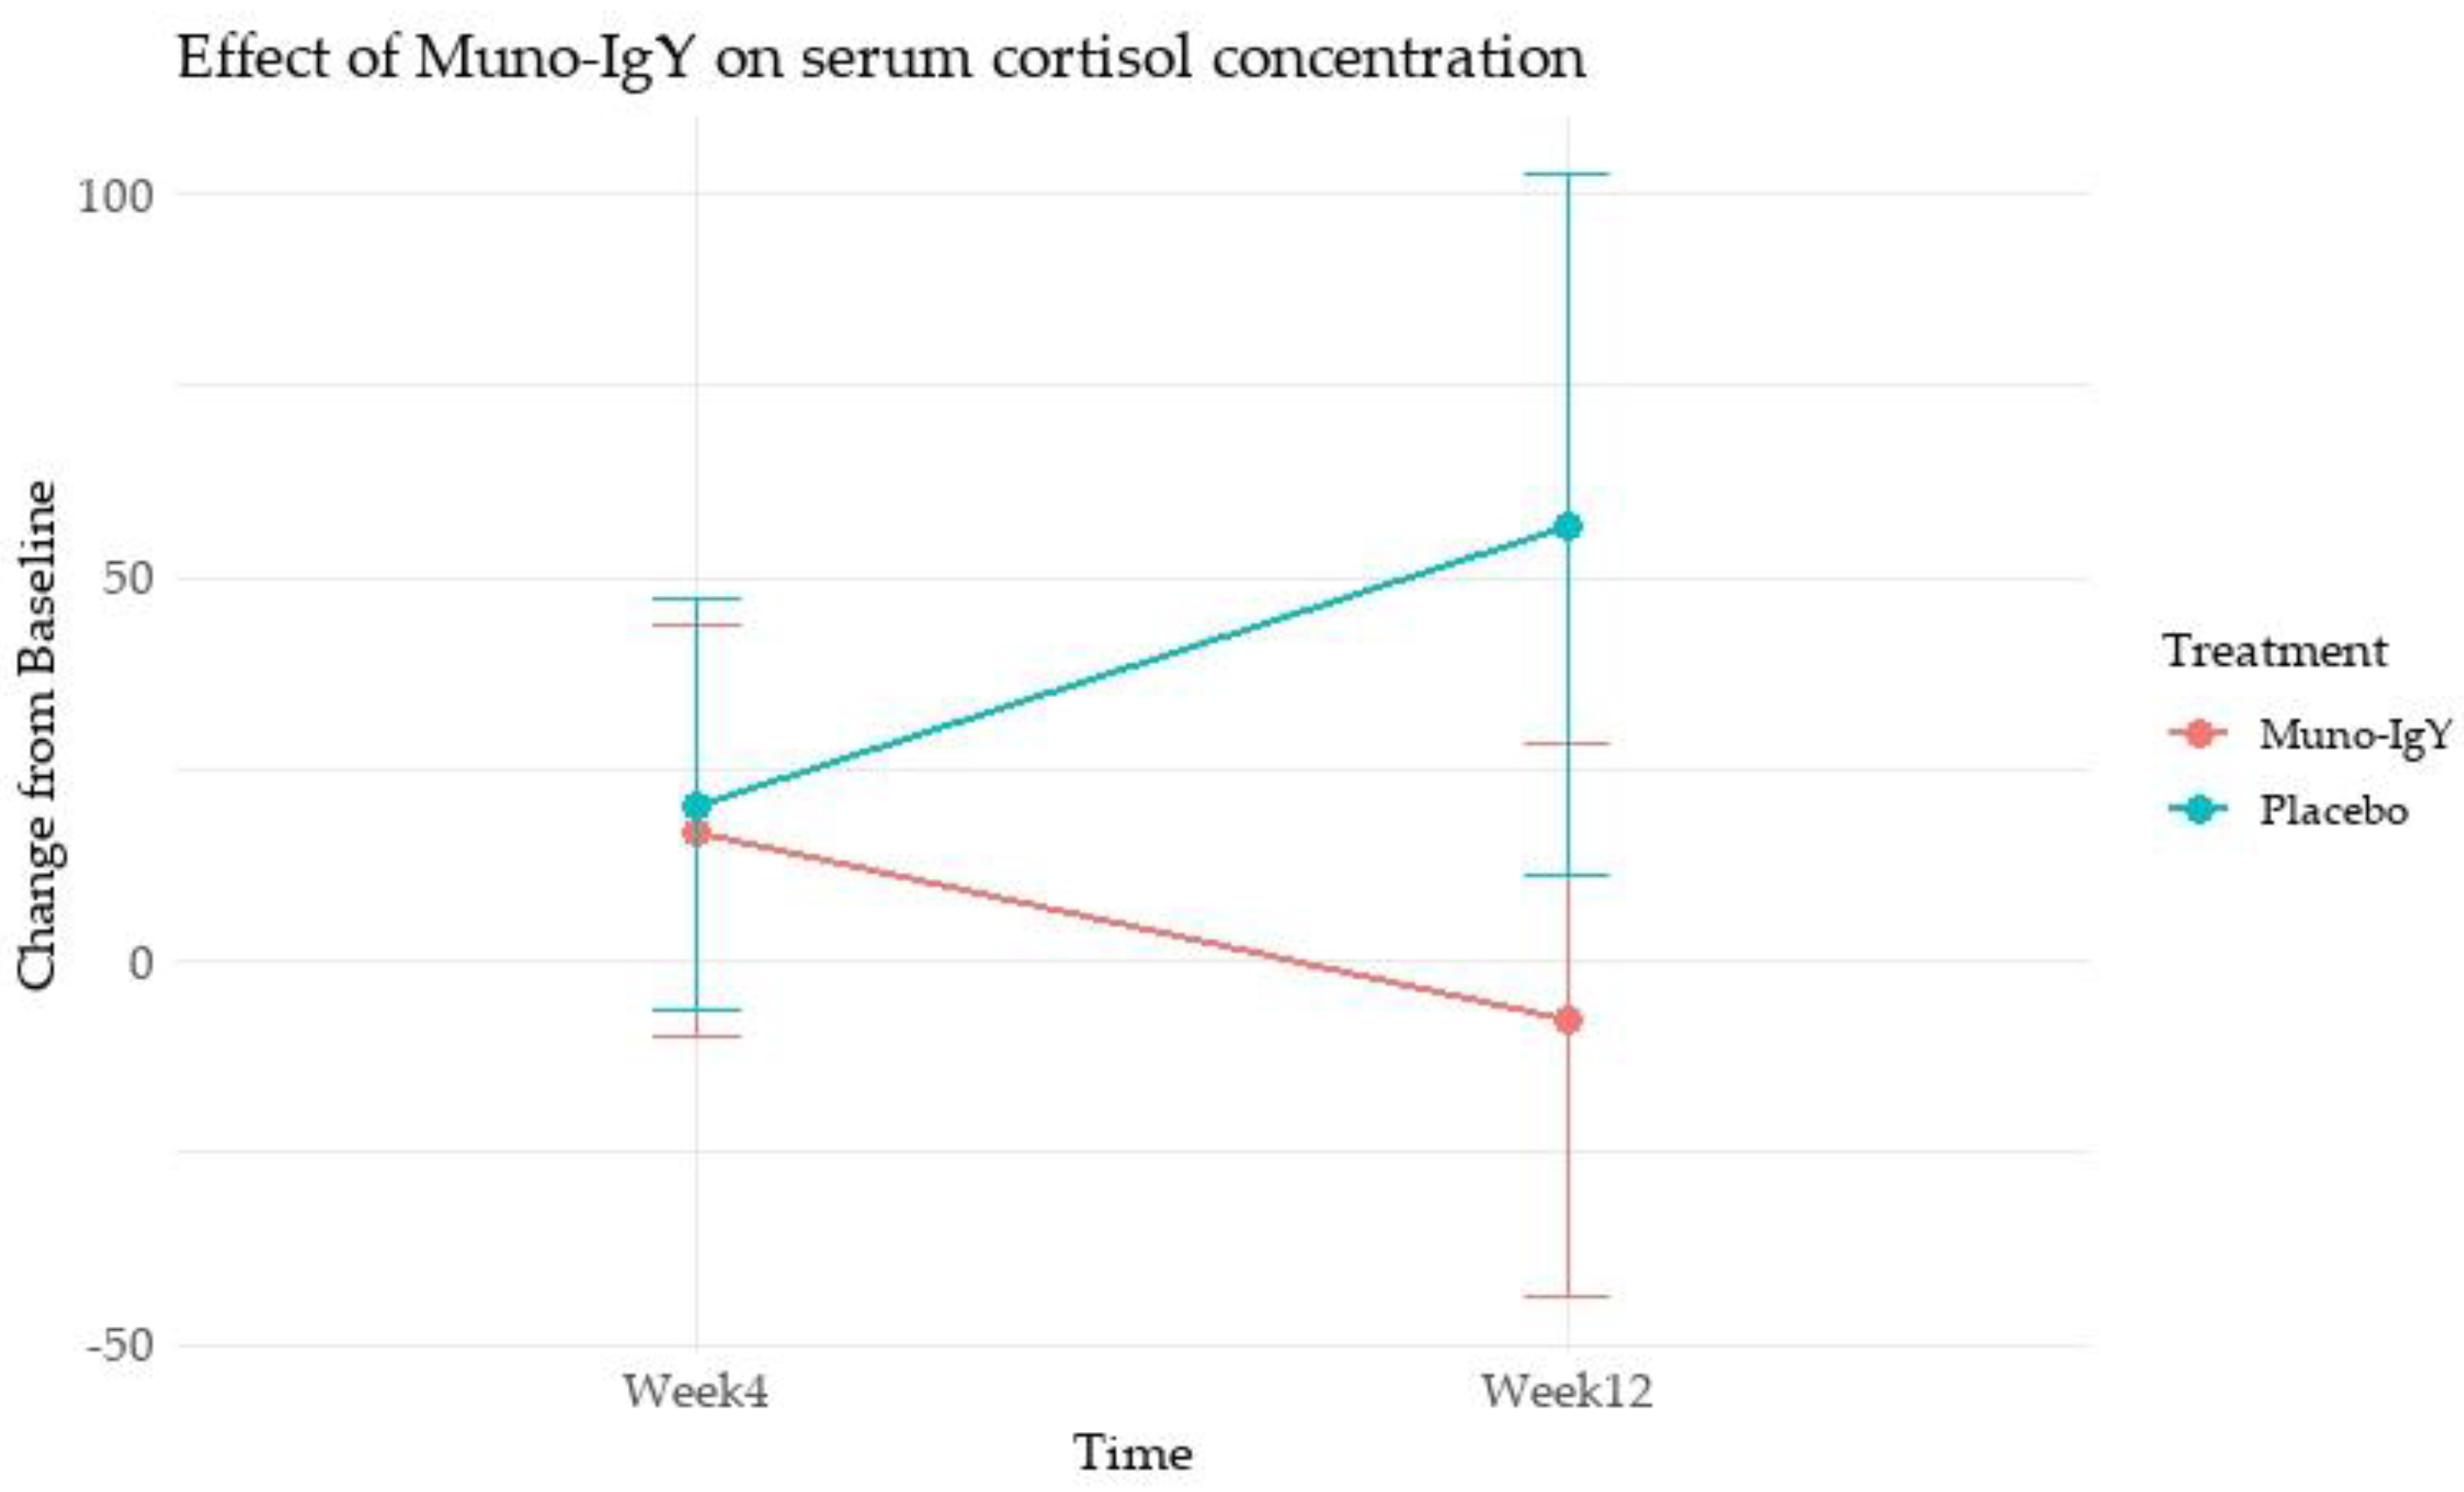
Figure 5.
Effect of Muno-IgY on serum LBP concentration at Week 4 and Week 12. Data are presented as mean change from baseline ± SEM. Between-group comparisons were analyzed using repeated-measures ANOVA with treatment as a between-subject factor and time as a within-subject factor.
Figure 5.
Effect of Muno-IgY on serum LBP concentration at Week 4 and Week 12. Data are presented as mean change from baseline ± SEM. Between-group comparisons were analyzed using repeated-measures ANOVA with treatment as a between-subject factor and time as a within-subject factor.
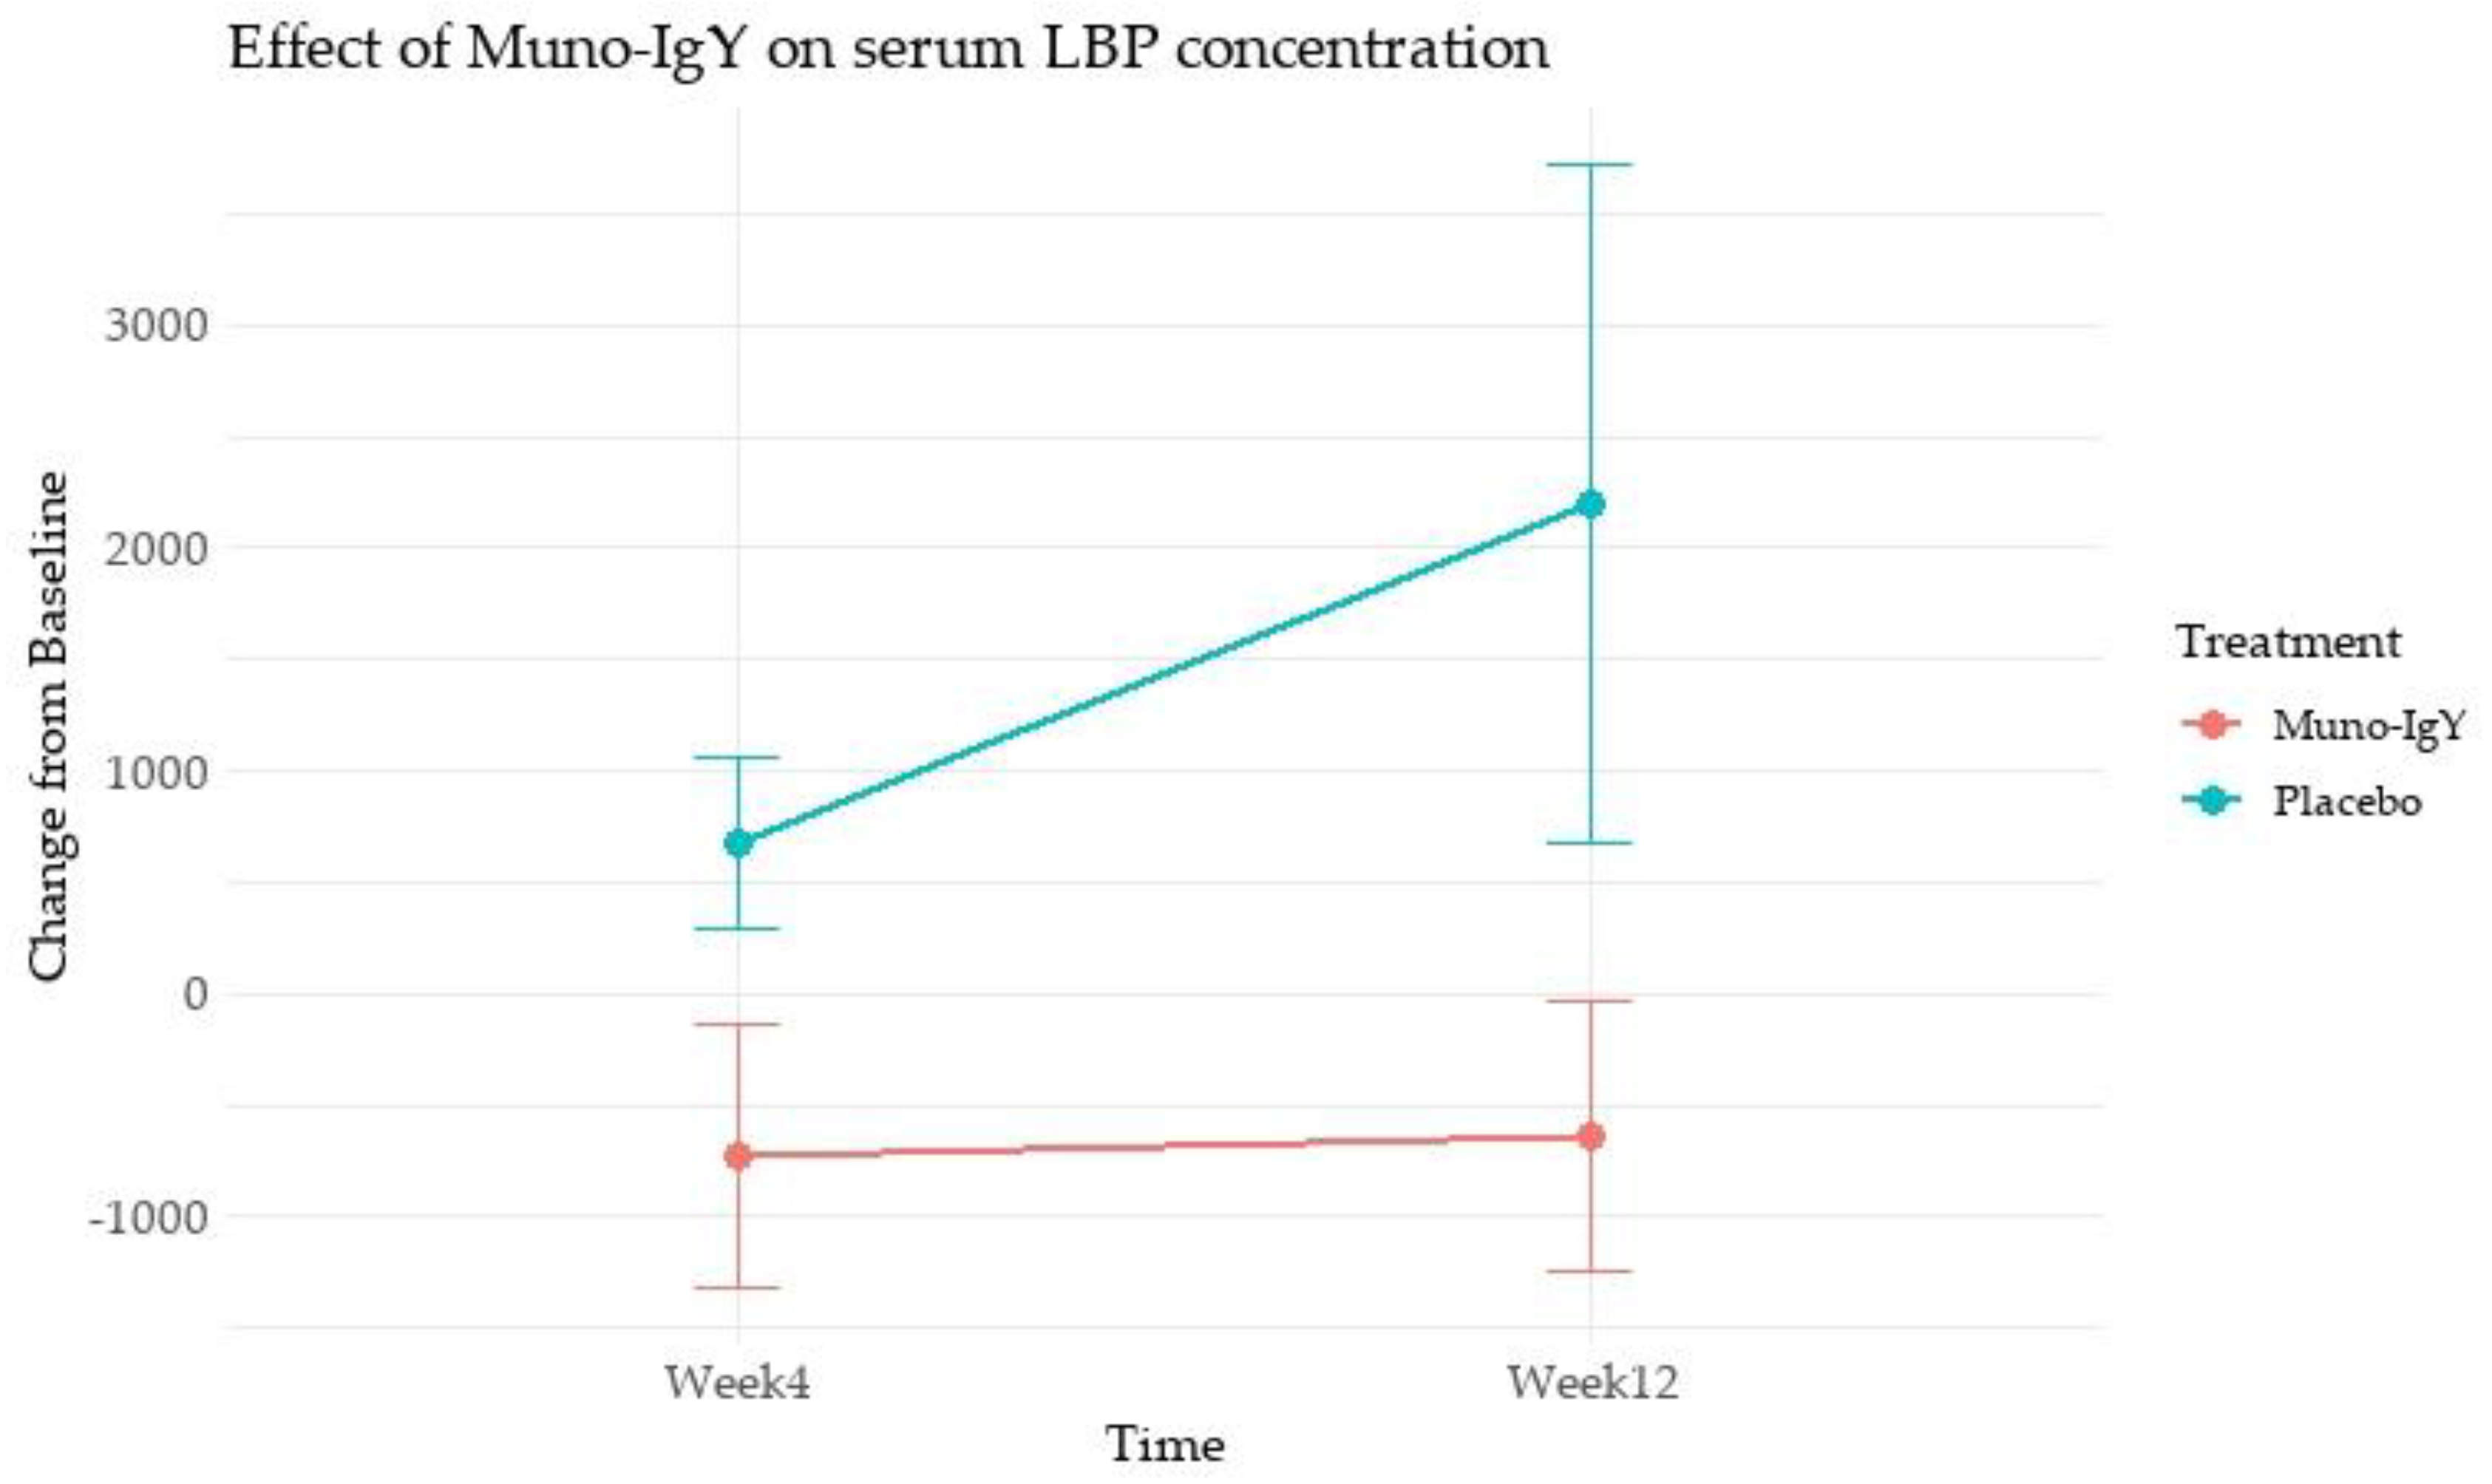
Figure 6.
Effect of Muno-IgY on serum IgA concentration pre- and post-exercise. Data represents the SEM change from pre-exercise. Statistical significance was assessed using a paired t-test; p < 0.05.
Figure 6.
Effect of Muno-IgY on serum IgA concentration pre- and post-exercise. Data represents the SEM change from pre-exercise. Statistical significance was assessed using a paired t-test; p < 0.05.
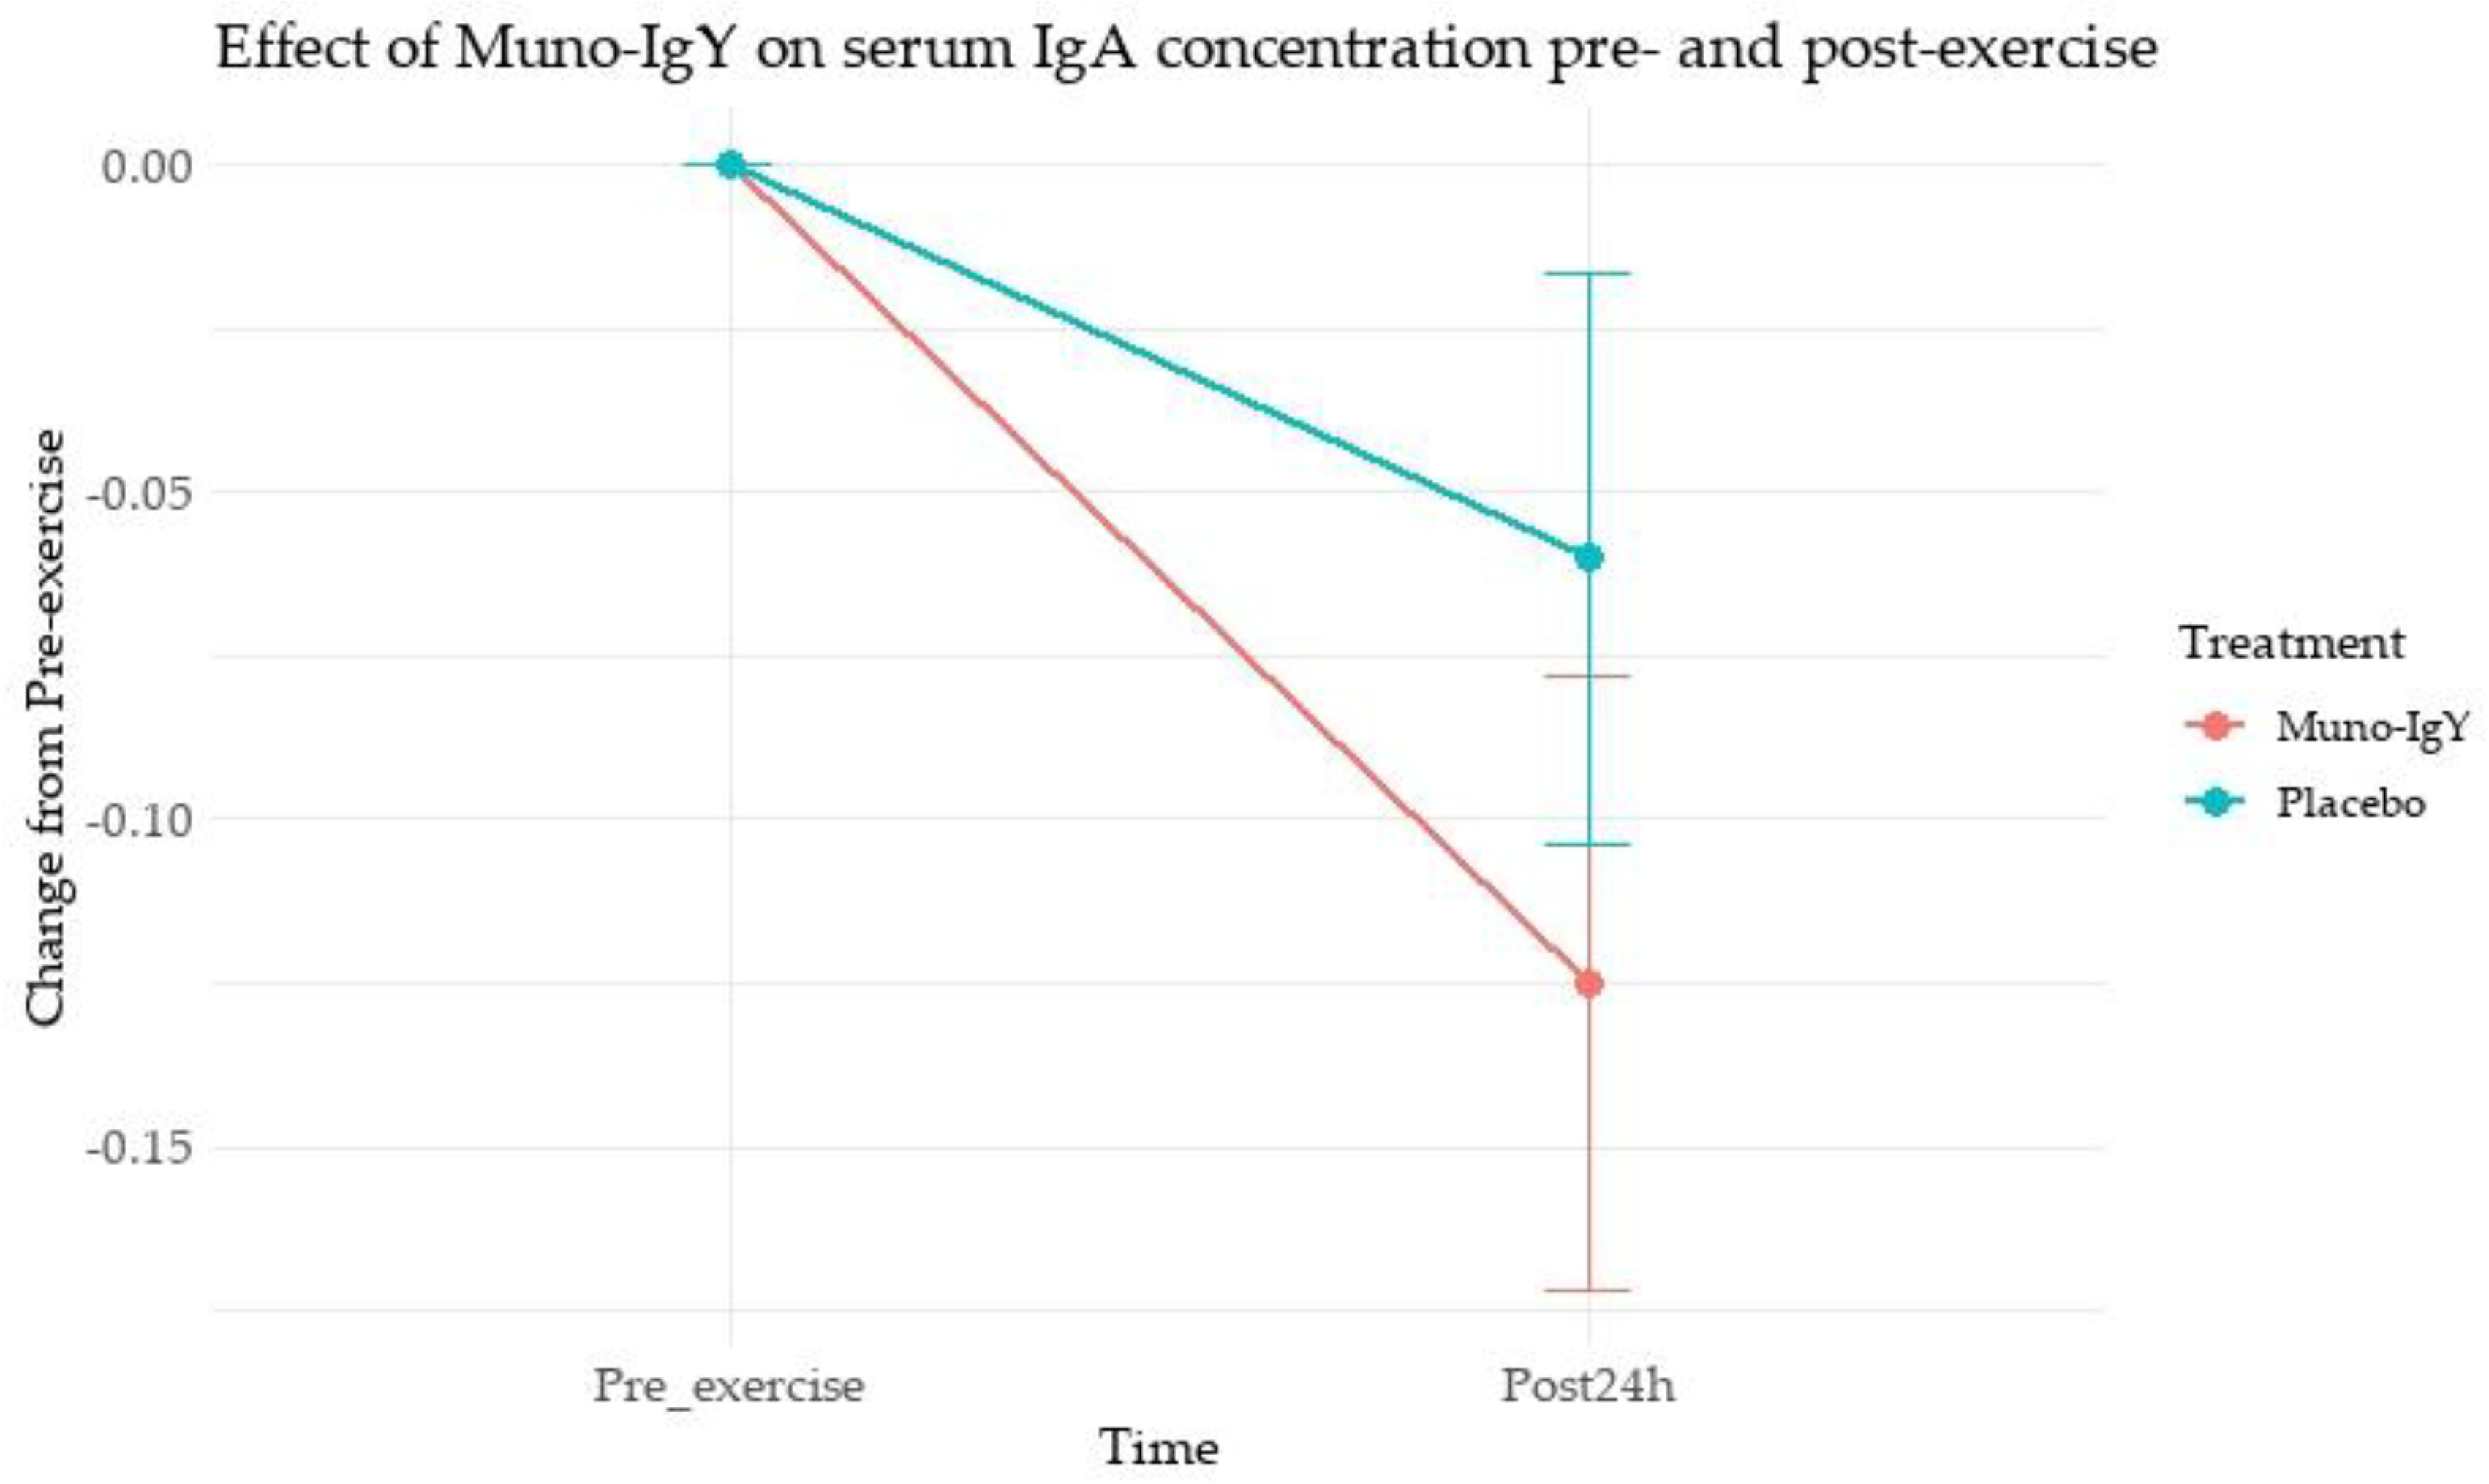
Figure 7.
Changes in lactate dehydrogenase (LDH) levels from baseline (pre-exercise) at 1 h, 2 h, 24 h, and 72 h post-exercise in participants receiving Muno-IgY or placebo. Data are presented as mean ± SEM.
Figure 7.
Changes in lactate dehydrogenase (LDH) levels from baseline (pre-exercise) at 1 h, 2 h, 24 h, and 72 h post-exercise in participants receiving Muno-IgY or placebo. Data are presented as mean ± SEM.
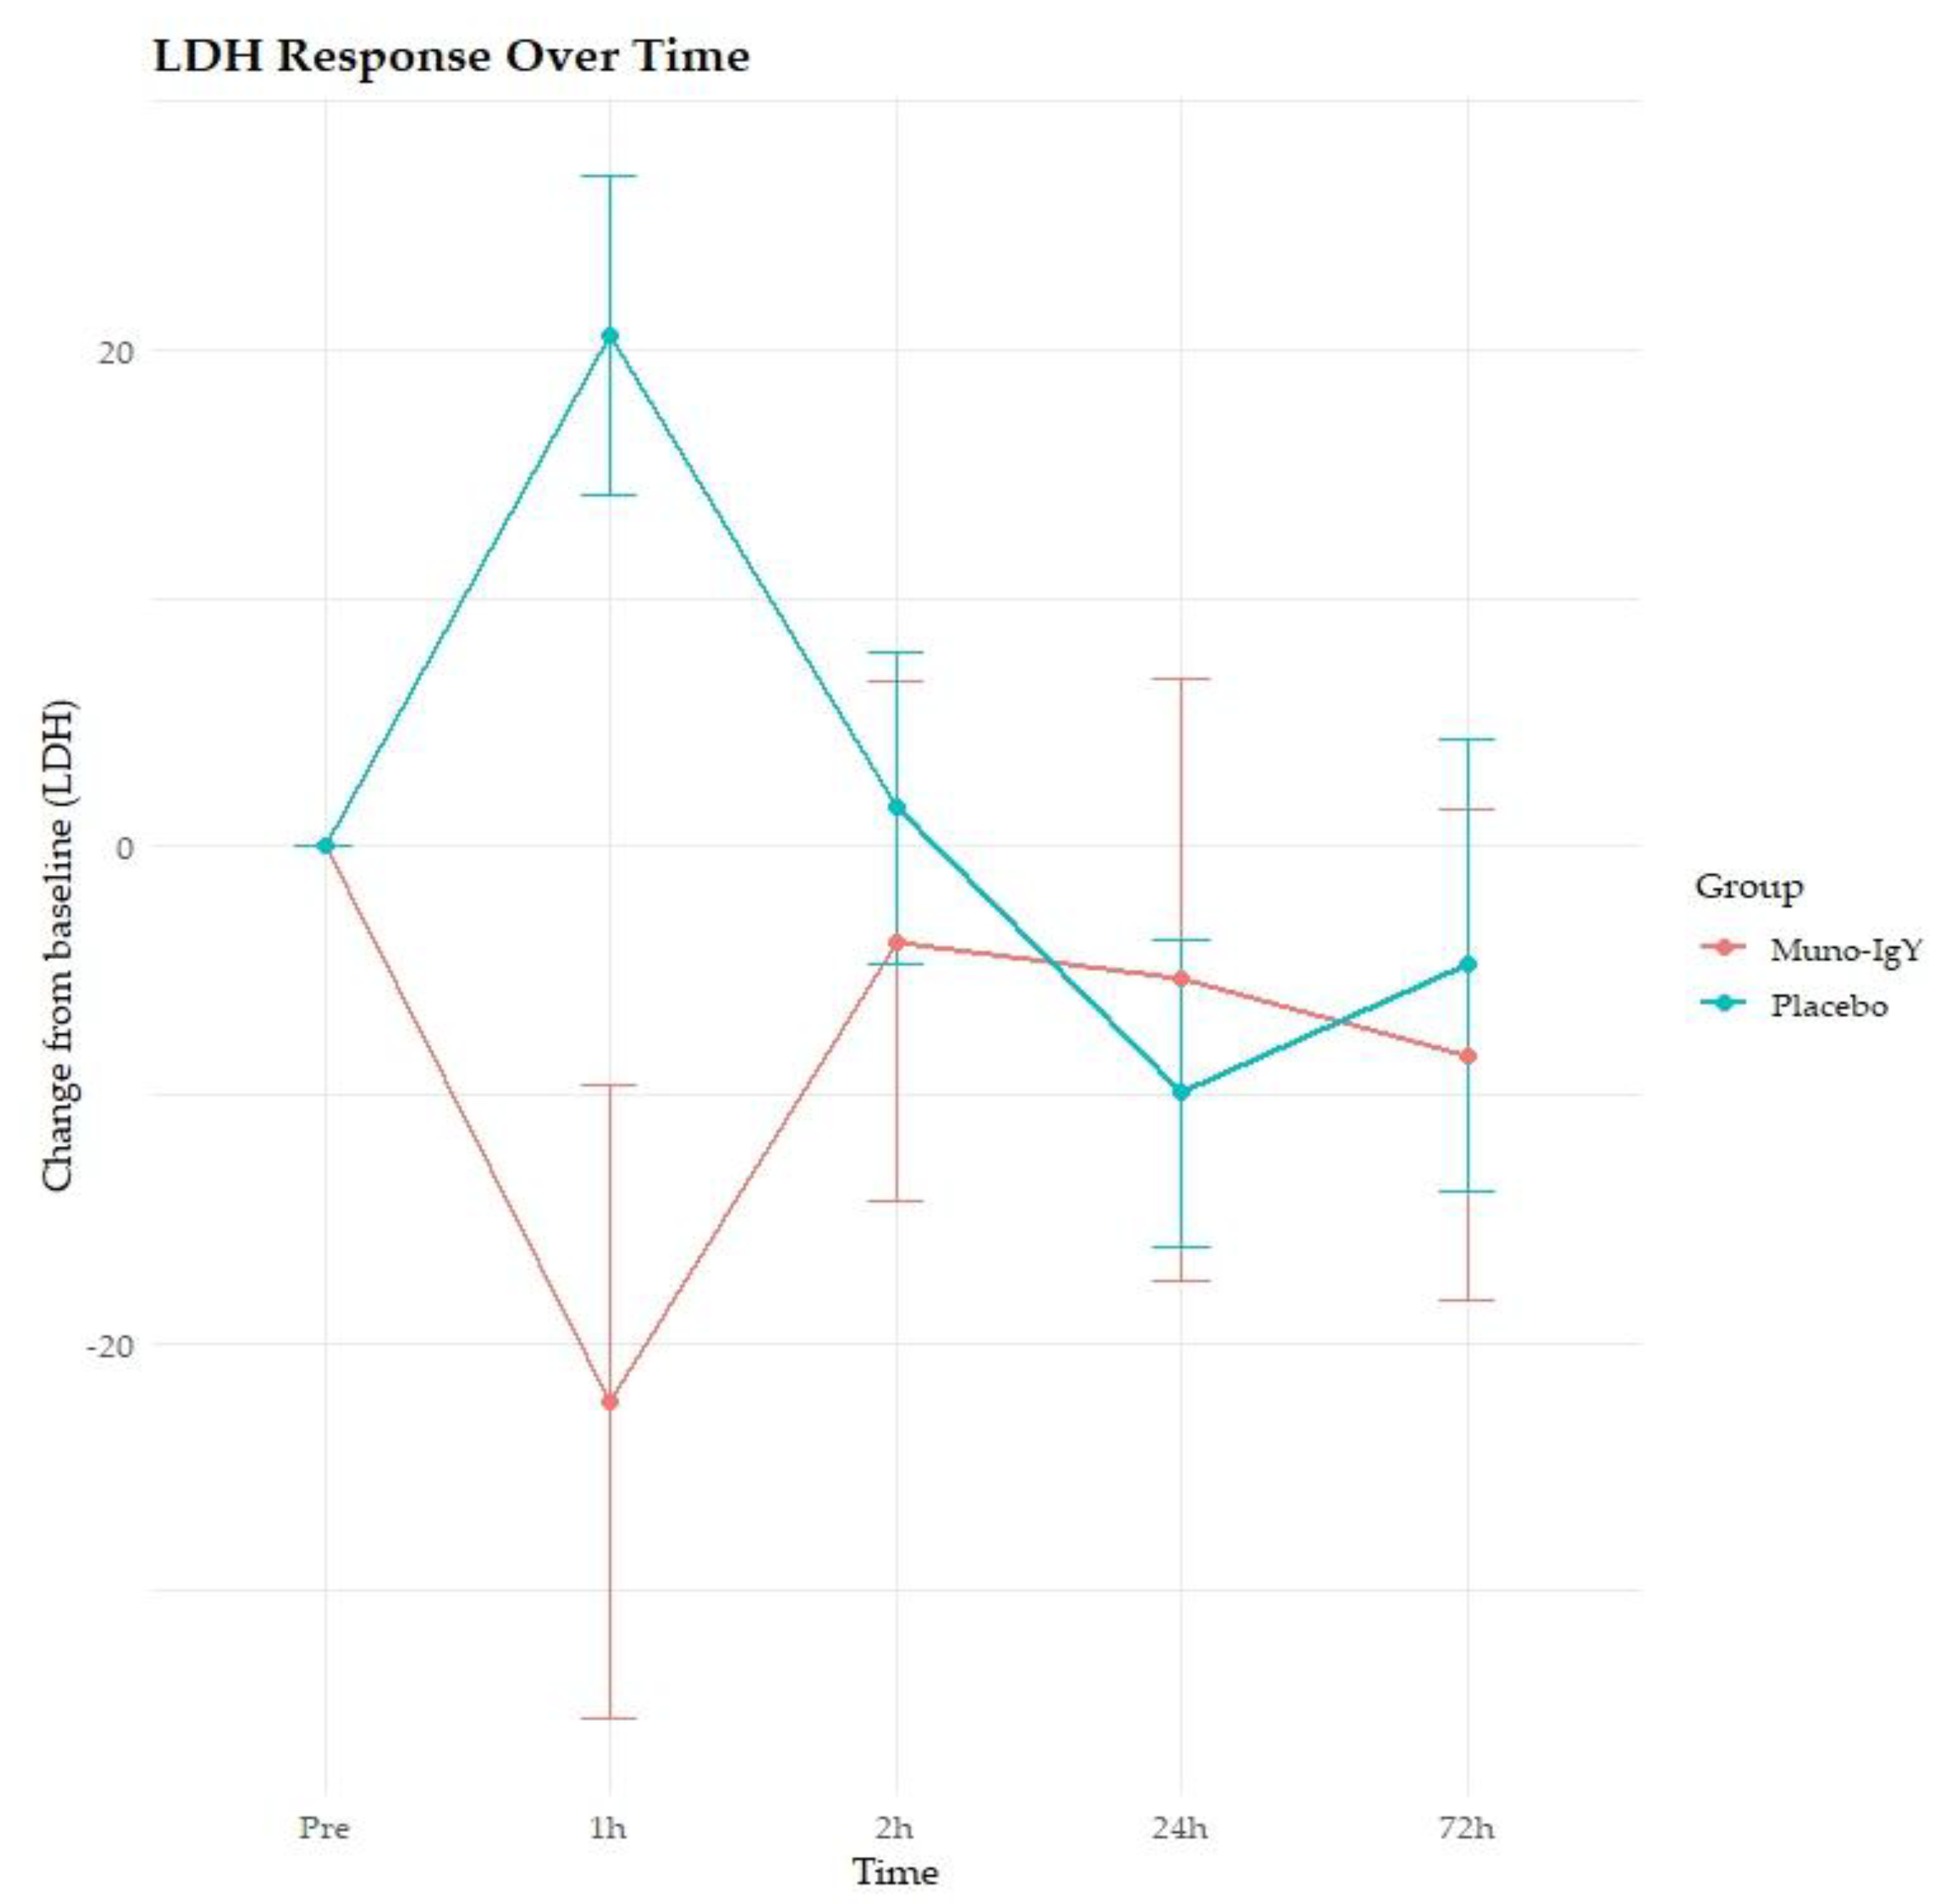
Figure 8.
Principal coordinates analysis (PCoA) based on Bray–Curtis dissimilarity of fecal microbiome profiles from participants receiving Muno-IgY or placebo. Each point represents an individual participant. No significant separation between treatment groups was observed (PERMANOVA, p = 0.114).
Figure 8.
Principal coordinates analysis (PCoA) based on Bray–Curtis dissimilarity of fecal microbiome profiles from participants receiving Muno-IgY or placebo. Each point represents an individual participant. No significant separation between treatment groups was observed (PERMANOVA, p = 0.114).
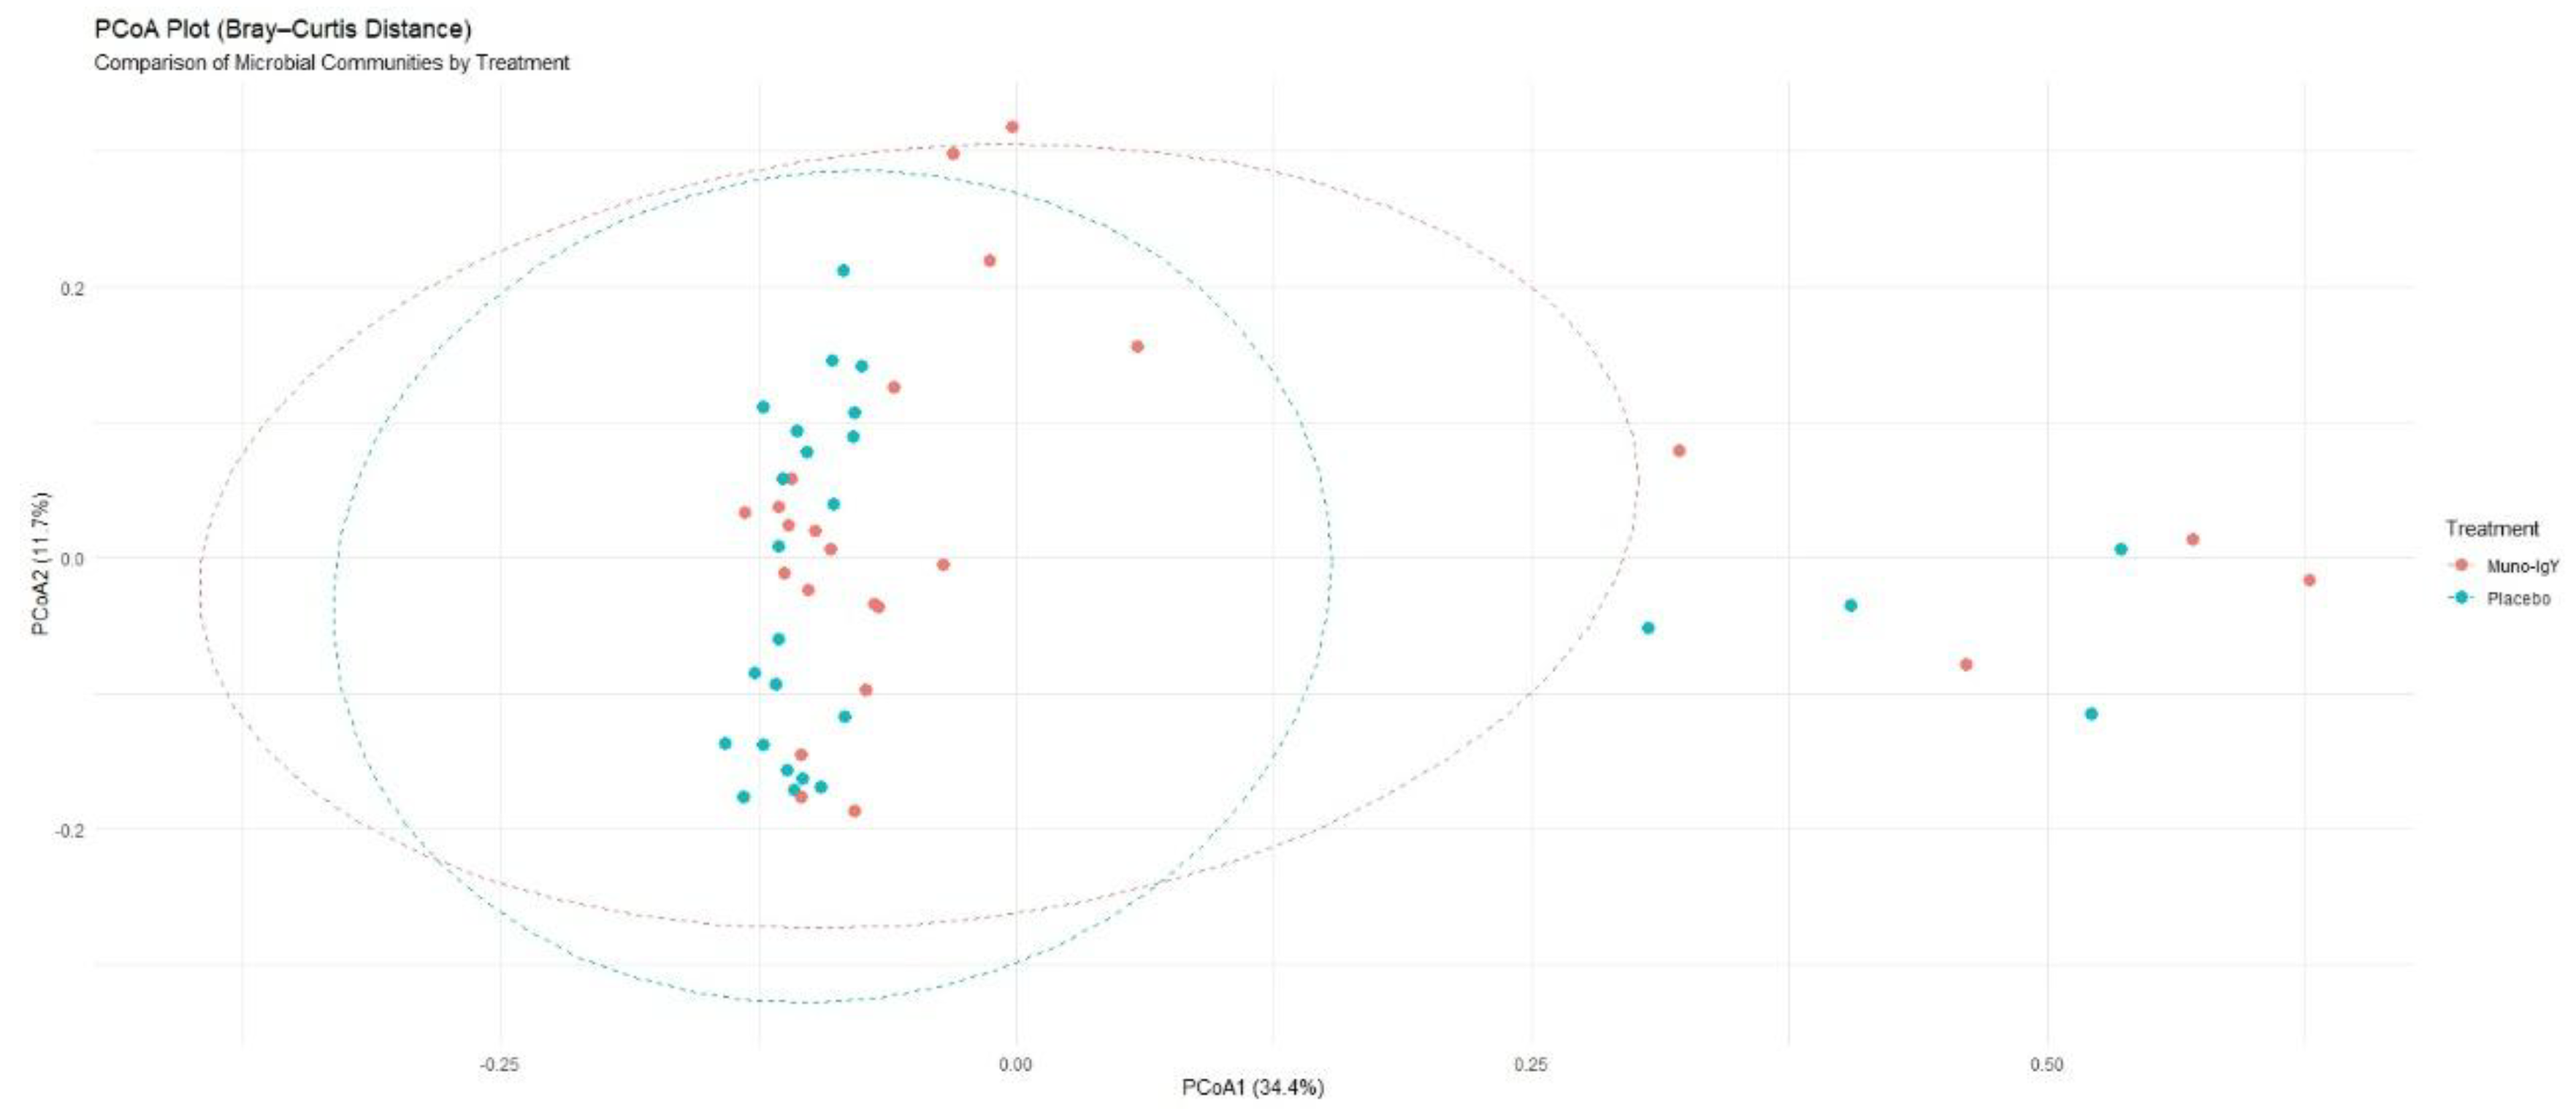
Figure 9.
Top 20 most abundant bacterial species in fecal samples from participants receiving Muno-IgY or placebo. Mean relative abundances are shown for each species.
Figure 9.
Top 20 most abundant bacterial species in fecal samples from participants receiving Muno-IgY or placebo. Mean relative abundances are shown for each species.
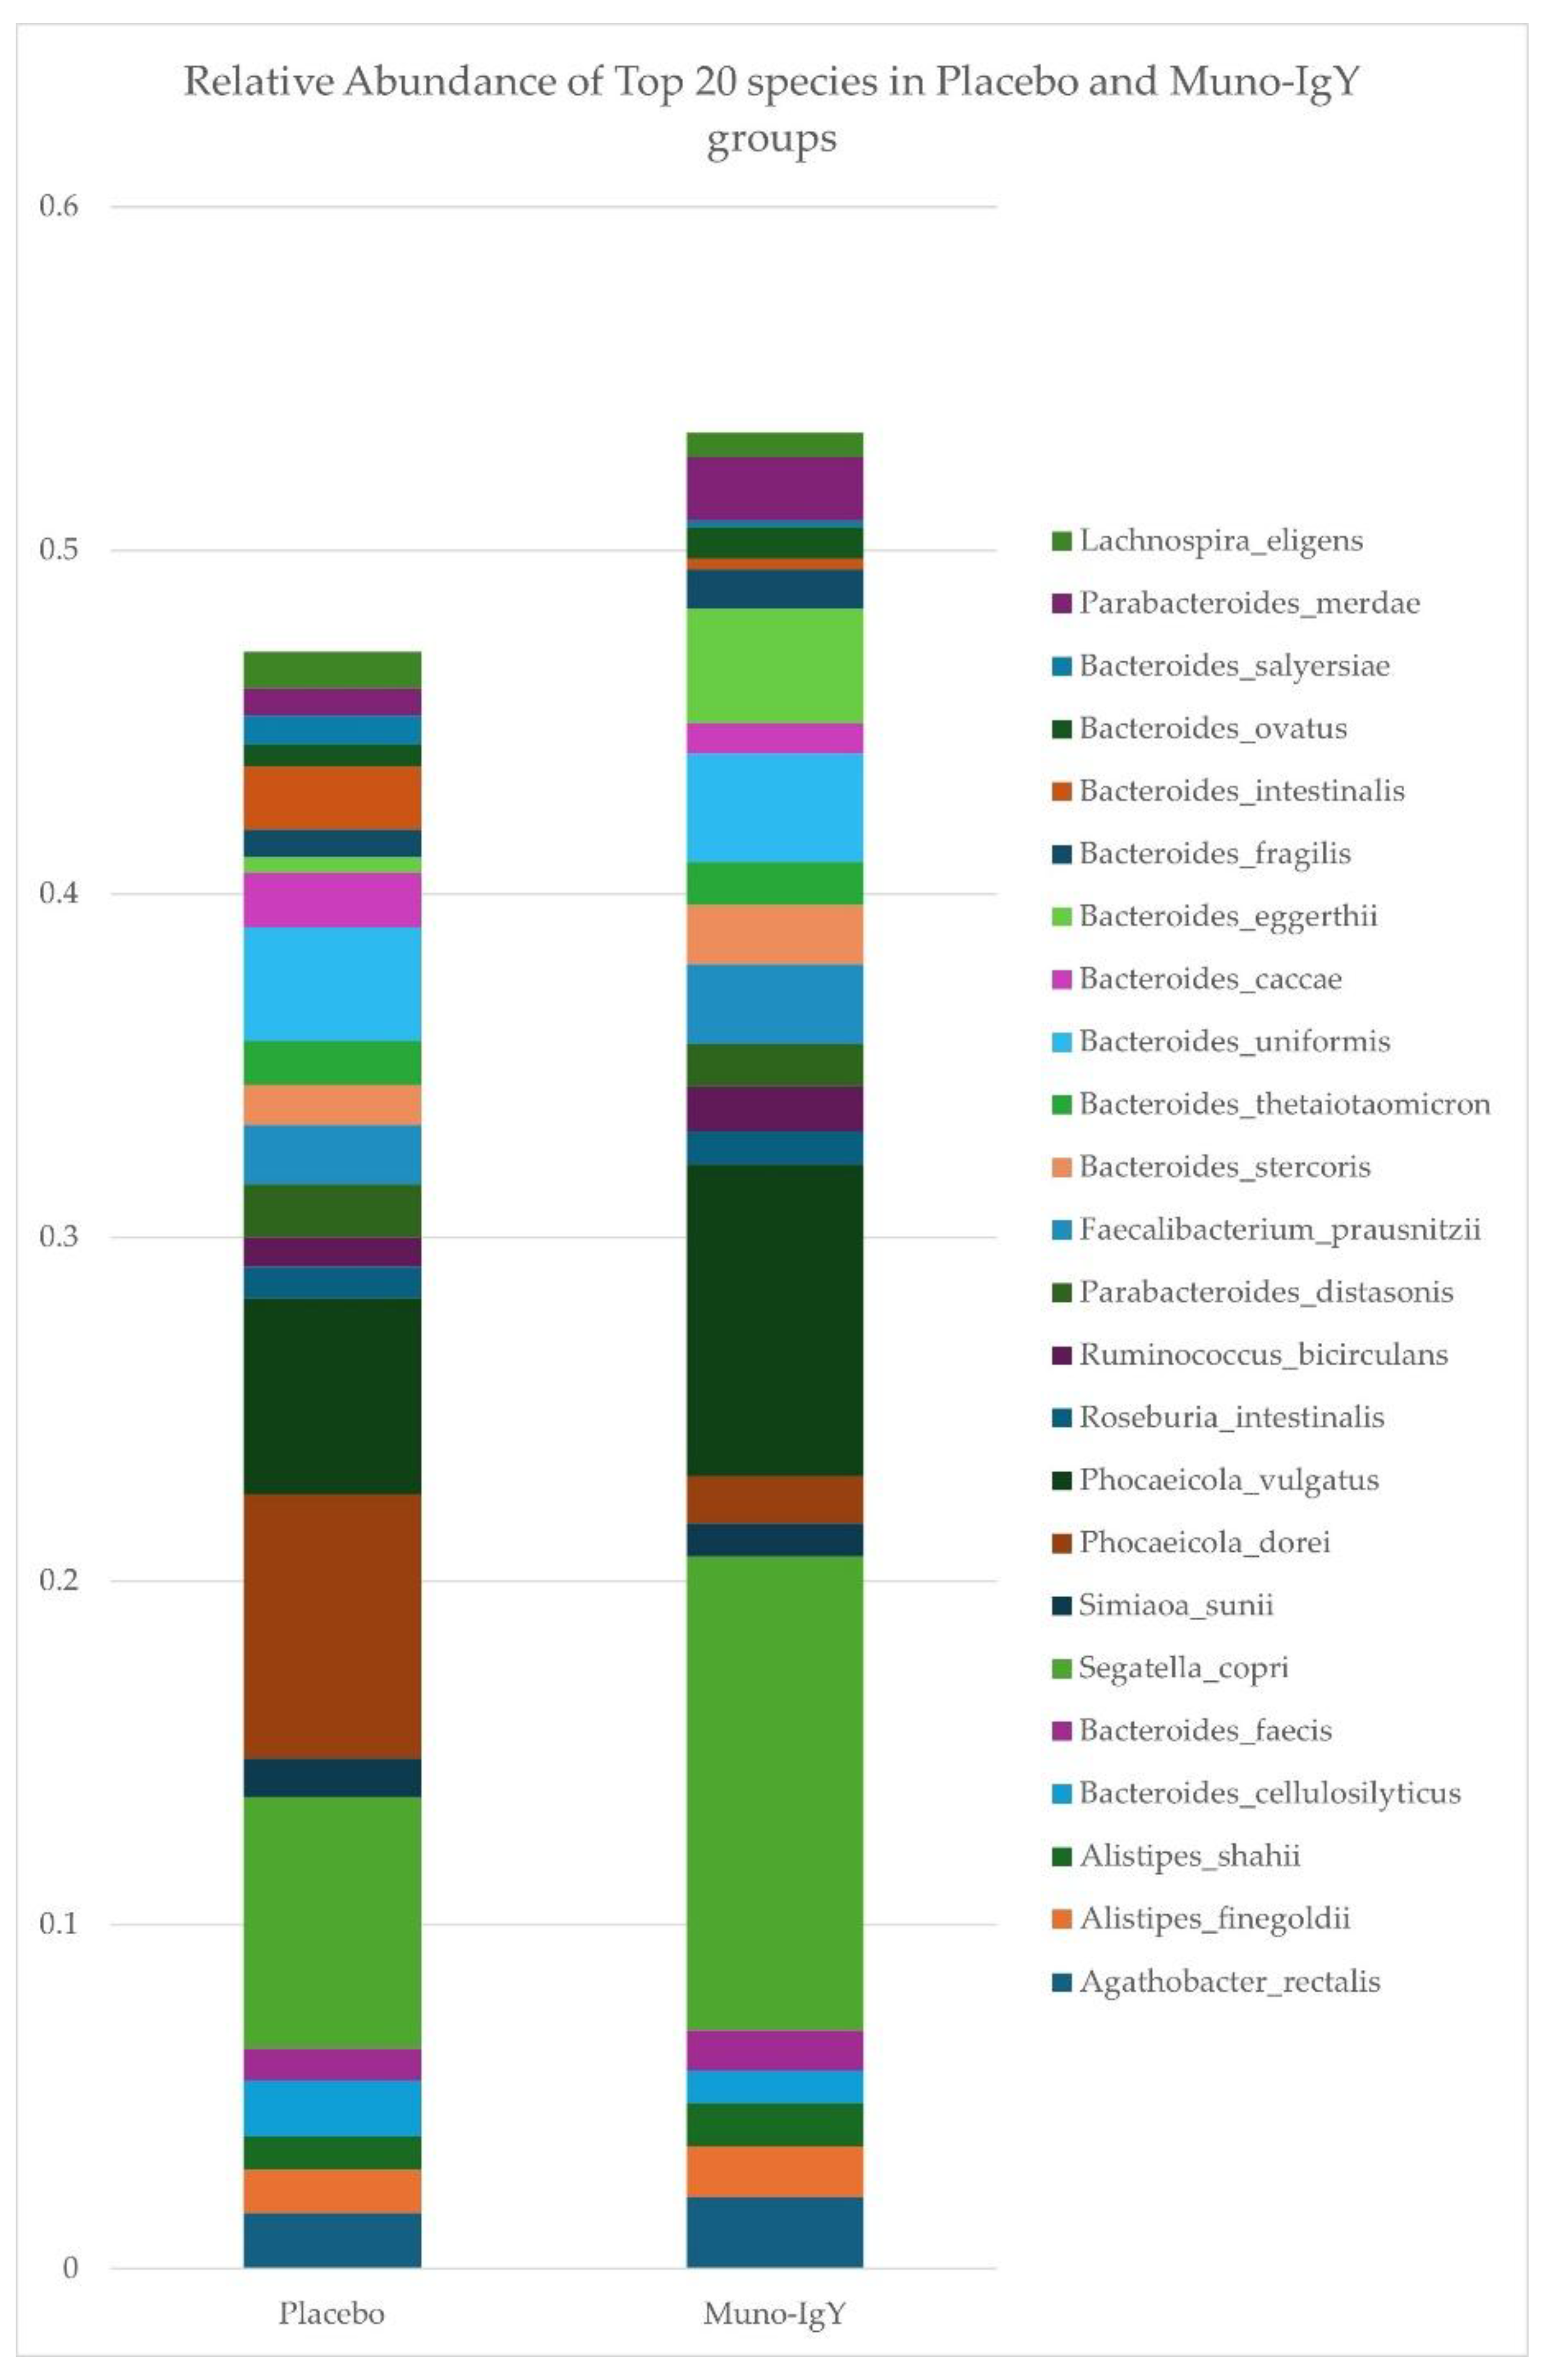
Figure 10.
Change in relative abundance (log fold change) of selected beneficial gut bacterial species between Week 2 (baseline) and Week 12 (end of study) in participants receiving Muno-IgY or placebo.
Figure 10.
Change in relative abundance (log fold change) of selected beneficial gut bacterial species between Week 2 (baseline) and Week 12 (end of study) in participants receiving Muno-IgY or placebo.
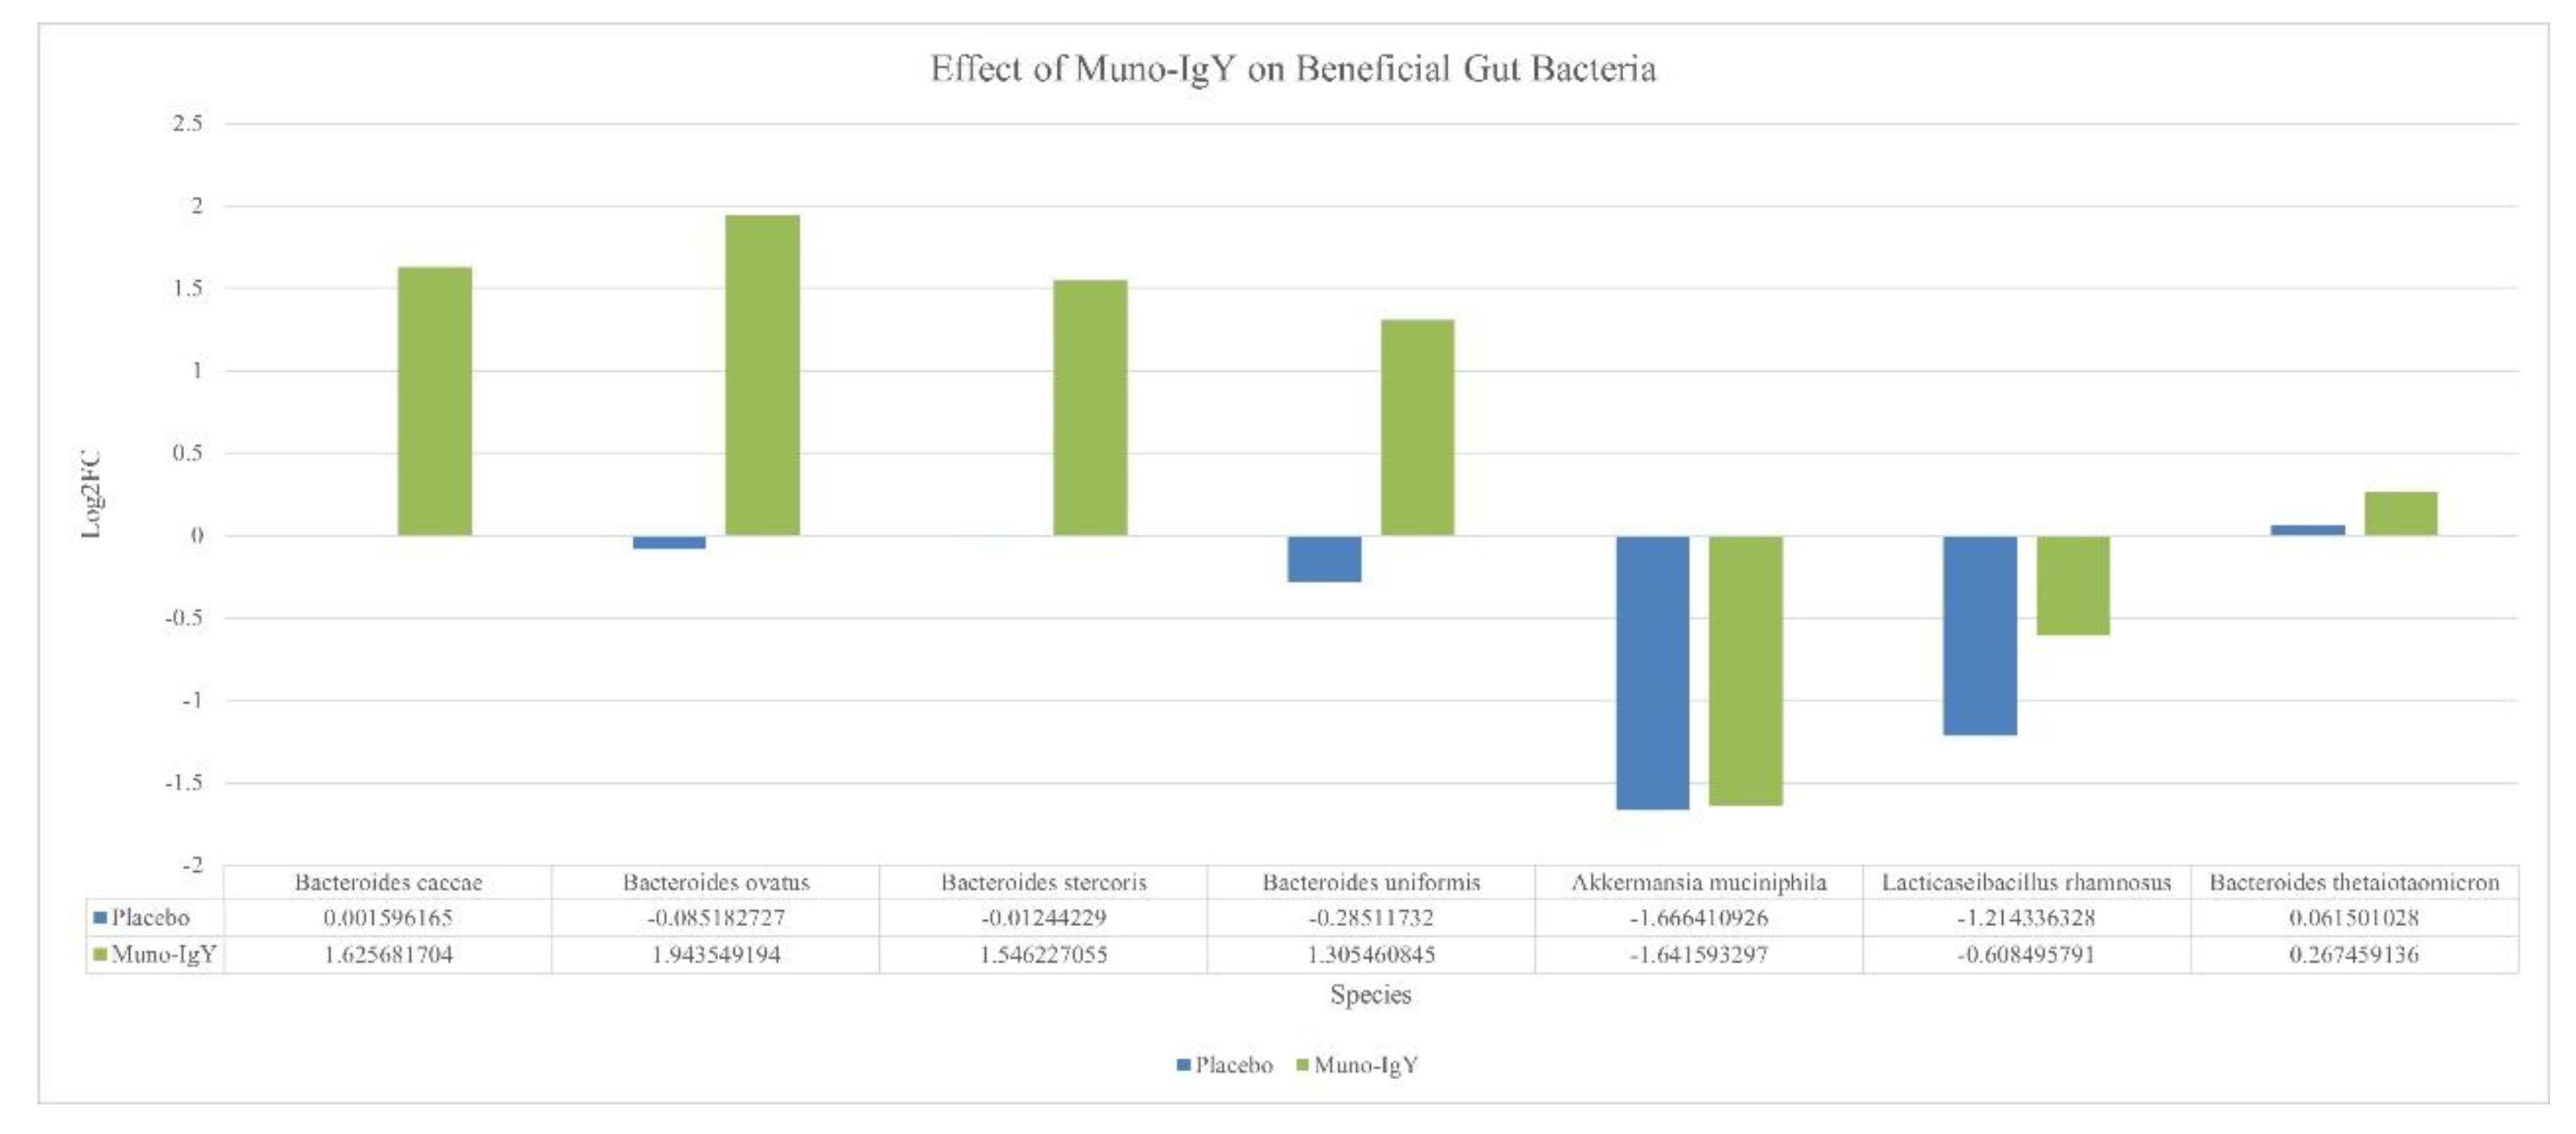
Figure 11.
Change in relative abundance (log fold change) of selected pathogenic and opportunistic gut bacterial species between Week 2 (baseline) and Week 12 (end of study) in participants receiving Muno-IgY or placebo.
Figure 11.
Change in relative abundance (log fold change) of selected pathogenic and opportunistic gut bacterial species between Week 2 (baseline) and Week 12 (end of study) in participants receiving Muno-IgY or placebo.
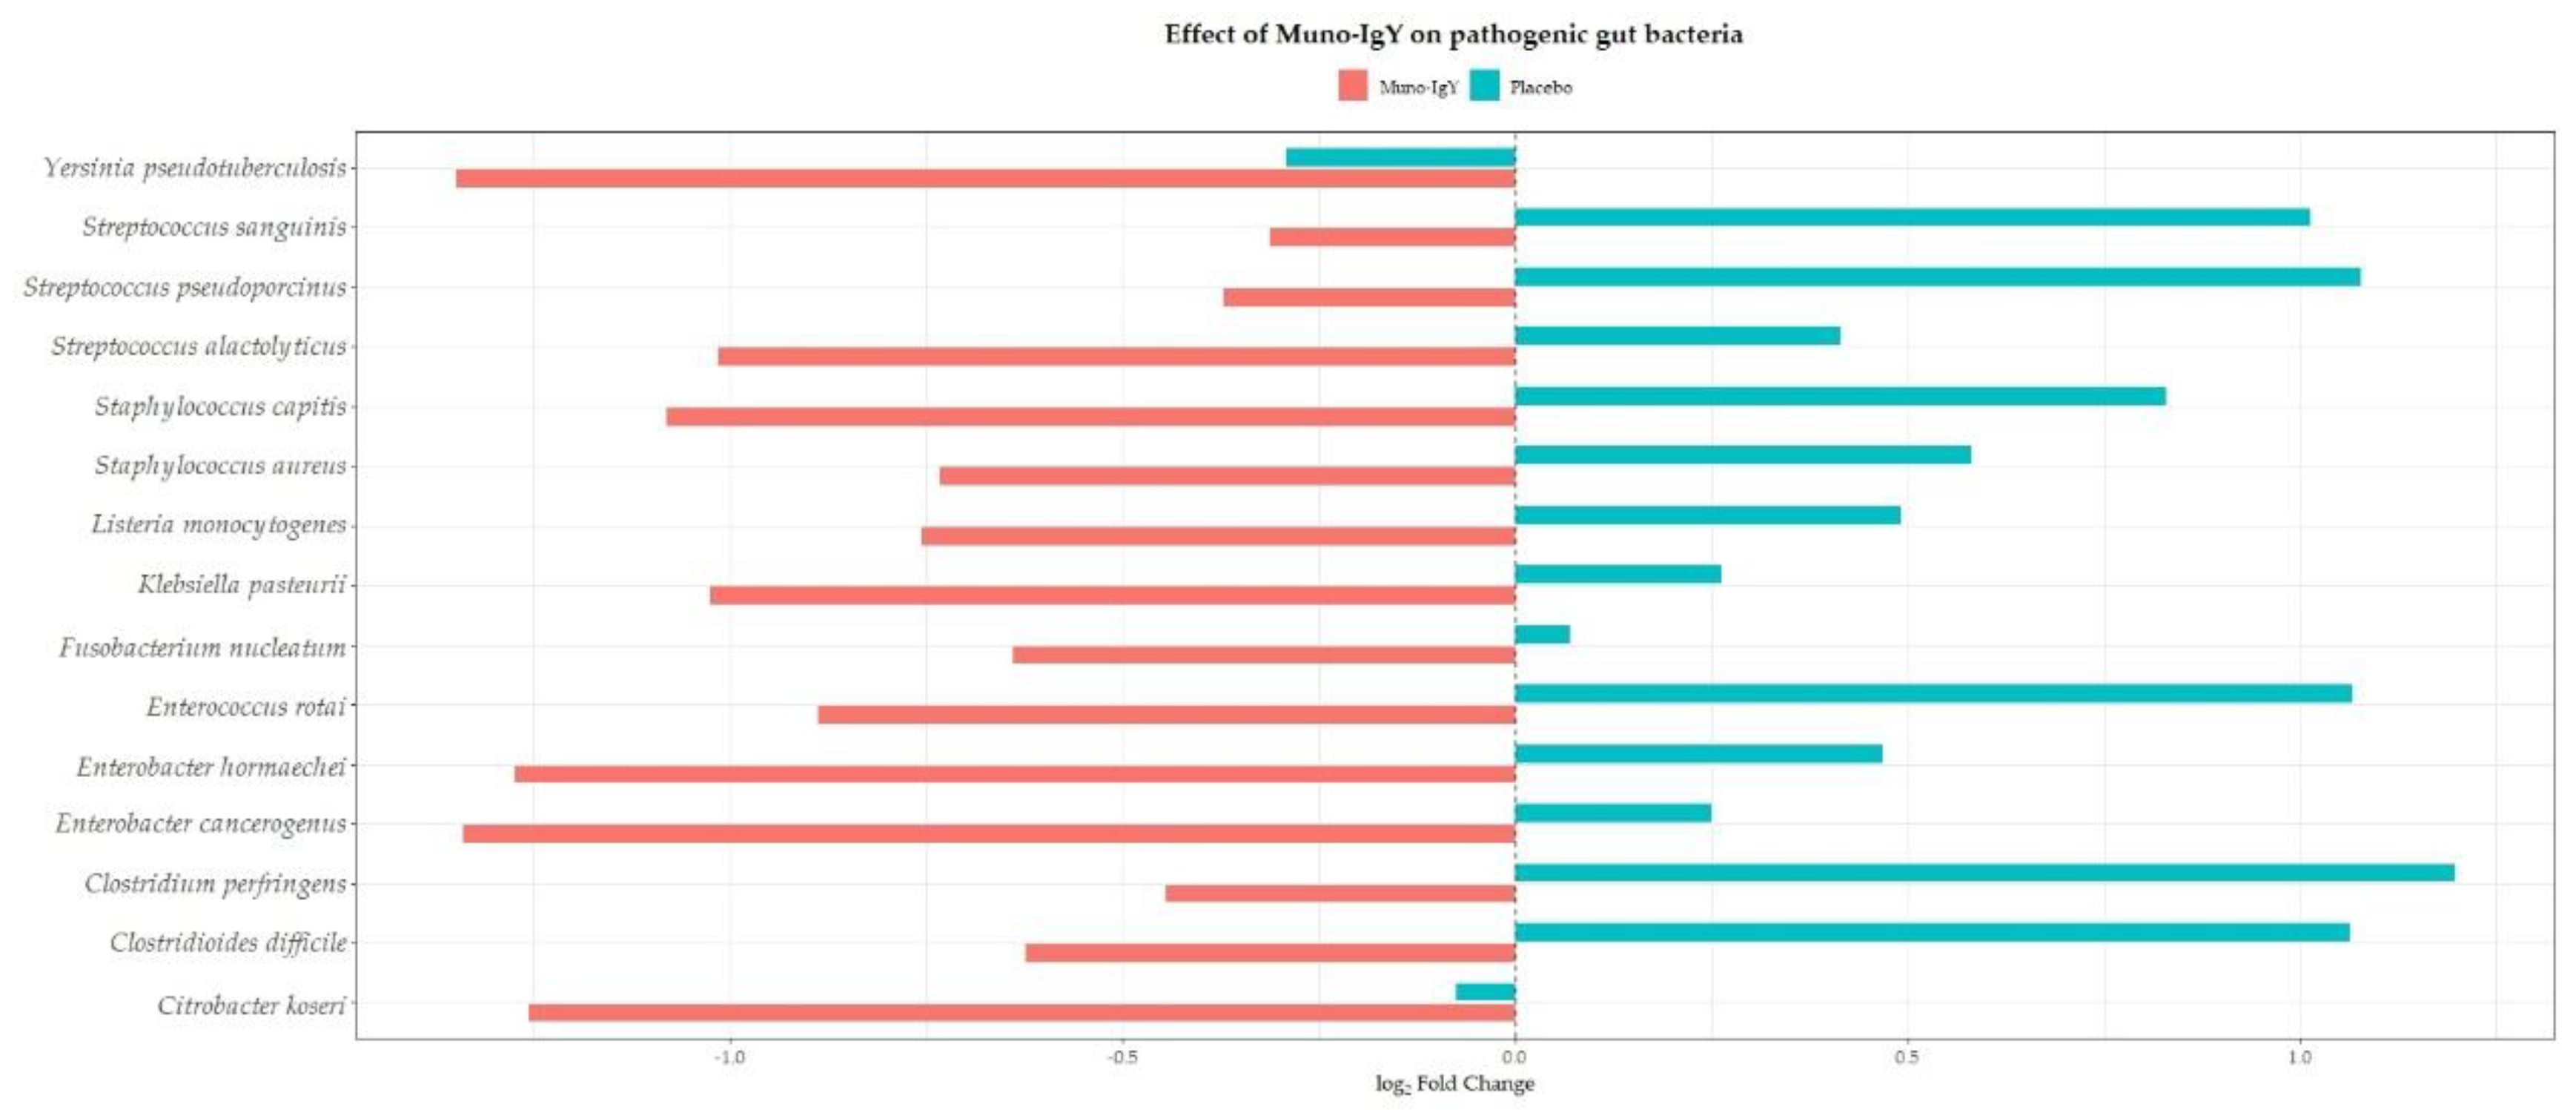
Figure 12.
Directional changes in bacterial abundance in infected participants receiving Muno-IgY or placebo. Horizontal bars represent mean log2 fold-change (V2 to V6) per taxon.
Figure 12.
Directional changes in bacterial abundance in infected participants receiving Muno-IgY or placebo. Horizontal bars represent mean log2 fold-change (V2 to V6) per taxon.
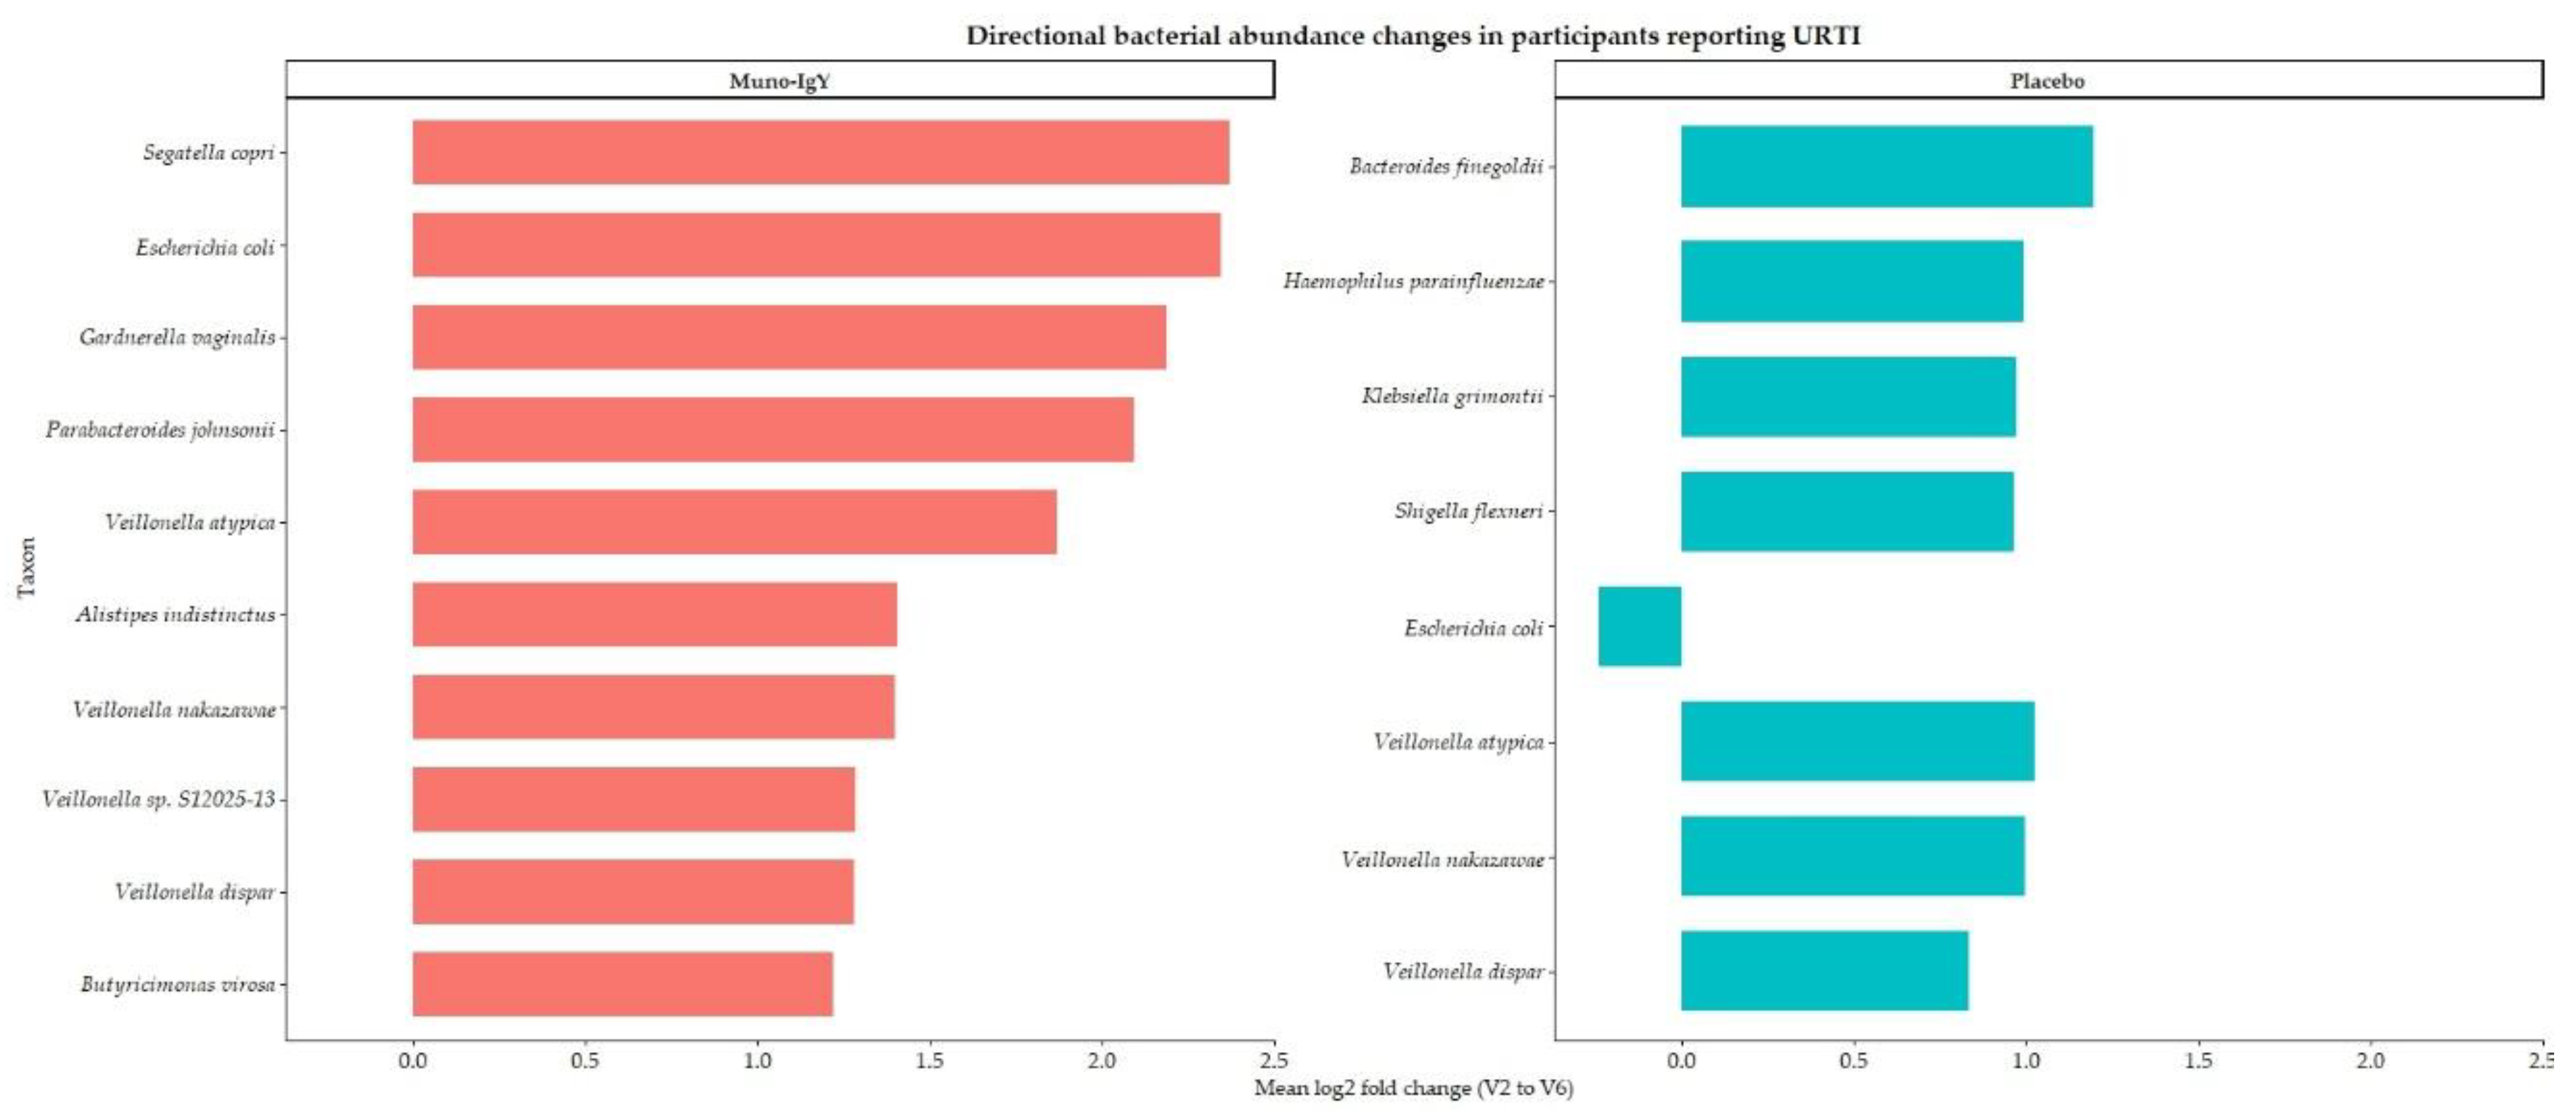

Table 1.
Data elements collected for each adverse event to support consistent documentation, safety evaluation, and regulatory reporting.
Table 1.
Data elements collected for each adverse event to support consistent documentation, safety evaluation, and regulatory reporting.
| Summary of Adverse Event Data Elements Collected During the Study | |
| Parameter | Description |
| Event description | Brief description of symptoms or diagnosis |
| Onset/End | Date and time of event start and resolution |
| Severity | Mild: no limitation; Moderate: some limitation; Severe: unable to perform usual activities |
| Action taken | Dose unchanged, reduced, interrupted, withdrawn, or other actions |
| Outcome | Fatal, recovered/resolved, recovered with sequelae, not resolved, unknown |
| Causality | Related, suspected, or not related to the study product |
| Pregnancy monitoring | Abnormal pregnancy outcomes were considered AEs/SAEs. Participants with pregnancy were withdrawn or followed to resolution. |
Table 2.
Baseline demographic and clinical characteristics of participants in the randomized controlled trial.
Table 2.
Baseline demographic and clinical characteristics of participants in the randomized controlled trial.
| Characteristic | Muno-IgY (n=14) | Placebo (n=14) | Total (N=28) |
| Age, years | |||
| Mean ± SD | 47.5 ± 7.1 | 48.1 ± 8.2 | 47.8 ± 7.6 |
| Range | 36-58 | 35-65 | 35-65 |
| Sex, n (%) | |||
| Female | 12 (85.7) | 12 (85.7) | 24 (85.7) |
| Male | 2 (14.3) | 2 (14.3) | 4 (14.3) |
| Race, n (%) | |||
| White | 10 (71.4) | 10 (71.4) | 20 (71.4) |
| Asian | 1 (7.1) | 1 (7.1) | 2 (7.1) |
| Black or African American | 1 (7.1) | 1 (7.1) | 2 (7.1) |
| Not reported | 2 (14.3) | 2 (14.3) | 4 (14.3) |
| Ethnicity, n (%) | |||
| Not Hispanic or Latino | 12 (85.7) | 12 (85.7) | 24 (85.7) |
| Hispanic or Latino | 2 (14.3) | 2 (14.3) | 4 (14.3) |
| BMI (kg/m²) | |||
| Mean ± SD | 25.4 ± 2.7 | 25.8 ± 2.3 | 25.6 ± 2.5 |
| Range | 20.2-29.5 | 21.3-29.8 | 20.2-29.8 |
| Vital signs | |||
| Systolic BP (mmHg), mean ± SD | 110.9 ± 10.4 | 113.3 ± 9.5 | 112.1 ± 9.9 |
| Diastolic BP (mmHg), mean ± SD | 74.9 ± 5.8 | 75.6 ± 6.6 | 75.3 ± 6.1 |
| Heart rate (bpm), mean ± SD | 65.4 ± 7.9 | 67.2 ± 7.6 | 66.3 ± 7.7 |
| Respiratory rate (breaths/min), mean ± SD | 14.4 ± 2.2 | 13.9 ± 1.9 | 14.1 ± 2.0 |
Table 3.
Disposition of Participants and Analysis Sets.
| Placebo | Muno-IgY | Total | |
| Screened | 45 | ||
| Met criteria but not randomized | 2 | ||
| Screening failure | 15 | ||
| Randomized | 14 (100%) | 14 (100%) | 28 (100%) |
| Included in the Safety population | 14 (100%) | 14 (100%) | 28 (100%) |
| Included in the FAS population | 14 (100%) | 14 (100%) | 28 (100%) |
| Included in the PPS population | 12 (85.7%) | 13 (92.9%) | 25 (89.3%) |
| Completed study | 12 (85.7%) | 13 (92.9%) | 25 (89.3%) |
| Excluded from PPS | 2 (14.3%) | 1 (7.1%) | 3 (10.7%) |
| Withdrawal by subject | 2 (14.3%) | 1 (7.1%) | 3 (10.7%) |
Table 4.
Summary of treatment-emergent adverse events in healthy adults during 12-week supplementation with Muno-IgY or placebo (Safety population, N=28).
Table 4.
Summary of treatment-emergent adverse events in healthy adults during 12-week supplementation with Muno-IgY or placebo (Safety population, N=28).
| Muno-IgY (N=14) | Placebo (N=14) |
Total (N=28) |
||
| Overall | 7 (50%) | 9 (64.3%) | 16 (57.1%) | |
| Relation | Related | 0 (0%) | 0 (0%) | 0 (0%) |
| Suspected | 1 (7.1%) | 0 (0%) | 1 (3.6%) | |
| Not related | 6 (42.9%) | 9 (64.3%) | 15 (53.6%) | |
| Severity | Severe | 0 (0%) | 0 (0%) | 0 (0%) |
| Moderate | 0 (0%) | 0 (0%) | 0 (0%) | |
| Mild | 7 (50%) | 9 (64.3%) | 16 (57.1%) | |
| Discontinuation | 0 (0%) | 0 (0%) | 0 (0%) | 0 (0%) |
Table 5.
URTI occurrence by study product over 12 weeks in the FAS population.
| Number of participants | Percentage of participants with URTI | |||||
| Muno-IgY | Placebo | Total | Muno-IgY | Placebo | Total | p-value |
| 2 | 5 | 7 | 14.3% | 35.7% | 25.0% | 0.38 |
Table 6.
Alpha diversity indices of fecal microbiota in the Muno-IgY and placebo groups. Values are presented as mean ± SD.
Table 6.
Alpha diversity indices of fecal microbiota in the Muno-IgY and placebo groups. Values are presented as mean ± SD.
| Diversity Index | Placebo | Muno-IgY | p-value |
| Shannon | 3.38 ± 0.57 | 3.43 ± 0.75 | 0.59 |
| Simpson | 0.86 ± 0.08 | 0.85 ± 0.12 | 0.53 |
Table 7.
Mean and median fold-change and log2 fold-change of bacterial taxa in infected participants (fold change ≥3). Values represent changes from baseline (Week 2) to post-intervention (Week 6) for participants receiving either Muno-IgY or placebo. Taxa are ordered by mean log2 fold change.
Table 7.
Mean and median fold-change and log2 fold-change of bacterial taxa in infected participants (fold change ≥3). Values represent changes from baseline (Week 2) to post-intervention (Week 6) for participants receiving either Muno-IgY or placebo. Taxa are ordered by mean log2 fold change.
| Taxon | Treatment | Mean fold change | Median fold change | Mean log2FC | Median log2FC |
| Escherichia coli | Placebo | 14.36 | 0.33 | -0.24 | -1.62 |
| Klebsiella grimontii | Placebo | 12.87 | 0.92 | 0.97 | -0.12 |
| Shigella flexneri | Placebo | 12.27 | 0.96 | 0.96 | -0.06 |
| Bacteroides finegoldii | Placebo | 3.59 | 1.99 | 1.20 | 0.99 |
| Haemophilus parainfluenzae | Placebo | 4.01 | 2.35 | 0.99 | 1.23 |
| Veillonella atypica | Placebo | 3.99 | 1.60 | 1.02 | 0.68 |
| Veillonella dispar | Placebo | 3.89 | 1.19 | 0.83 | 0.25 |
| Veillonella nakazawae | Placebo | 6.62 | 1.30 | 1.00 | 0.38 |
| Segatella copri | Muno-IgY | 11.47 | 11.47 | 2.37 | 2.37 |
| Parabacteroides johnsonii | Muno-IgY | 6.57 | 6.57 | 2.09 | 2.09 |
| Escherichia coli | Muno-IgY | 5.92 | 5.92 | 2.35 | 2.35 |
| Gardnerella vaginalis | Muno-IgY | 8.49 | 8.49 | 2.19 | 2.19 |
| Veillonella atypica | Muno-IgY | 4.39 | 4.39 | 1.87 | 1.87 |
| Veillonella dispar | Muno-IgY | 3.28 | 3.28 | 1.28 | 1.28 |
| Veillonella nakazawae | Muno-IgY | 4.38 | 4.38 | 1.40 | 1.40 |
| Veillonella sp. S12025-13 | Muno-IgY | 4.46 | 4.46 | 1.28 | 1.28 |
| Butyricimonas virosa | Muno-IgY | 3.20 | 3.20 | 1.22 | 1.22 |
| Alistipes indistinctus | Muno-IgY | 4.87 | 4.87 | 1.41 | 1.41 |
Disclaimer/Publisher’s Note: The statements, opinions and data contained in all publications are solely those of the individual author(s) and contributor(s) and not of MDPI and/or the editor(s). MDPI and/or the editor(s) disclaim responsibility for any injury to people or property resulting from any ideas, methods, instructions or products referred to in the content. |
© 2026 by the authors. Licensee MDPI, Basel, Switzerland. This article is an open access article distributed under the terms and conditions of the Creative Commons Attribution (CC BY) license (http://creativecommons.org/licenses/by/4.0/).
Copyright: This open access article is published under a Creative Commons CC BY 4.0 license, which permit the free download, distribution, and reuse, provided that the author and preprint are cited in any reuse.


