
Submitted:
13 January 2026
Posted:
14 January 2026
You are already at the latest version
Abstract
This study employed soybean meal as the substrate and systematically optimized its enzymatic hydrolysis process using a combination of single-factor experiments and response surface methodology. A predictive model based on the Box–Behnken design was established to improve protein hydrolysis efficiency and increase the yield of functional products. The optimal conditions identified were 1.45% enzyme addition, a reaction time of 62 h, a temperature of 36.5 °C, and a moisture content of 35%. Under these conditions, the small-peptide content increased by 16.33-fold. Structural analyses showed that enzymatic treatment markedly disrupted the compact surface of soybean meal, converting it into a loose and porous matrix. In addition, enzymolysis altered the protein secondary structure from ordered α-helices and folded conformations to more disordered and flexible forms, thereby improving the molecular-weight distribution. Composition analyses demonstrated a 114.2% increase in total free amino acids, including essential amino acids. Moreover, DPPH radical-scavenging activity increased from 18.37% to 57.99%. Overall, this study optimized the enzymatic hydrolysis conditions for soybean meal and provides valuable insights for the development of high-value protein-peptide products.
Keywords:
soybean meal
; enzymatic digestion
; response surface
; Fourier transform infrared spectroscopy (FTIR)
1. Introduction
Soybean meal (SBM) is widely recognized as the primary plant-based protein source in global livestock production because of its high protein content and balanced amino acid composition [1]. However, modern high-density and antibiotic-free production systems present substantial challenges regarding intestinal health and feed efficiency. Unprocessed SBM contains several antinutritional factors—such as trypsin inhibitors, antigenic proteins, and oligosaccharides—that impair protein digestion, trigger intestinal immune stress, and disrupt the intestinal barrier. These limitations collectively constrain the effective utilization of SBM in animal husbandry [2,3,4].
To improve the nutritional quality of SBM and reduce its antinutritional components, enzymatic hydrolysis has become a major focus in feed science research. This process effectively degrades large proteins into small peptides and free amino acids—particularly dipeptides and tripeptides—which represent the most efficiently absorbed forms [5].These low-molecular-weight products are rapidly transported across intestinal cells via specific peptide transporters, resulting in higher bioavailability than free amino acids. In addition, enzymatic treatment substantially decreases antinutritional factors and produces bioactive peptides with antioxidant and immunomodulatory functions [6], oth of which are important for reducing antibiotic use and promoting animal health. However, the efficiency of enzymatic hydrolysis is influenced by multiple parameters, including enzyme type, concentration, temperature, pH, and reaction time. The interactions among these variables create a complex optimization landscape. Conventional one-factor-at-a-time approaches are time-consuming and often fail to capture potential synergistic effects. In contrast, response surface methodology offers an effective strategy by using statistical modeling to evaluate multivariable interactions simultaneously and identify optimal processing conditions with fewer experimental trials [7].
This study systematically optimized the enzymatic digestion process of SBM using response surface methodology to increase the yield of small peptides. A mathematical model was further established to quantify the relationship between processing parameters and small-peptide content, thereby enabling the prediction of optimal hydrolysis conditions. The findings aim to provide a scientific basis and technical support for the development of highly digestible, functional SBM-derived peptide feed ingredients.
2. Materials and Methods
2.1. Materials
Soybean meal (CP ≥ 46%; Xinjiang Taikun Inc., China) and a protease complex (60,000 U/g; Hebei Haotong Biotechnology Inc., China) were used as the primary experimental materials.
2.2. Preparation of Enzymatic Protein Feed
A total of 500 g of SBM was weighed into a beaker, followed by the addition of an appropriate amount of water and the protease complex. The mixture was stirred thoroughly and allowed to stand. Three parallel replicates were prepared for each treatment. Enzymatic hydrolysis was conducted in a constant-temperature incubator. After hydrolysis, the samples were dried at 65 °C to constant weight, ground, and subsequently stored at −20 °C for analysis.
2.3. Single Factor Extraction
SBM was used as the substrate for enzymatic hydrolysis. Four parameters—enzyme addition, hydrolysis temperature, hydrolysis time, and moisture content—were examined to evaluate their effects on water-soluble protein and small-peptide contents. Enzyme addition levels of 0.5%, 1.0%, 1.5%, 2.0%, and 2.5% were tested. Hydrolysis temperatures were set to 30, 35, and 40 °C. Hydrolysis durations were 24, 48, and 72 h. Moisture content was adjusted from 25% to 45% at 5% intervals.
2.4. Optimization of Response Surface
Based on the results of the single-factor experiments, four factors—enzyme addition, hydrolysis temperature, hydrolysis time, and moisture content—were selected for further optimization. Response surface analysis was performed using a Box–Behnken design with four factors and three levels, implemented in Design-Expert 13.0.1 (Stat-Ease Inc., USA). Experimental runs were conducted according to the combinations generated by the software, and corresponding data were collected. Statistical significance was set at P<0.05. The experimental data were subsequently subjected to analysis of variance and quadratic regression fitting to construct a predictive model describing the effects of linear, interaction, and quadratic terms. This model was used to evaluate the relationships among the factors and small-peptide content and to identify the optimal hydrolysis conditions.
2.5. Measurement of Water-Soluble Protein Levels
Water-soluble protein content was determined according to the method described by Fu Sheng Chen et al. [8]. Briefly, 0.1 g of enzymatic hydrolysate powder was placed into a 250 mL conical flask, followed by the addition of 40 mL of distilled water and vortex mixing. The mixture was centrifuged at 2750 × g for 5 min. A total of 100 μL of the resulting supernatant was transferred to a tube, mixed with 5 mL of Coomassie Brilliant Blue solution, vortexed, and incubated at room temperature in the dark for 2 min. The absorbance was immediately measured at 595 nm using a UV-1800 spectrophotometer. A bovine serum albumin standard curve was generated with the regression equation y = 0.0365x + 0.5543 (R² = 0.9993). Water-soluble protein content (mg/g) was calculated based on the standard curve.
2.6. Identification of Free Amino Acids
A total of 1.0 g of sample was placed in a 50 mL volumetric flask, dissolved in water, and thoroughly mixed. The mixture was allowed to stand at 4 °C for 24 h. Subsequently, 2 mL of the supernatant was transferred into a 50 mL centrifuge tube and mixed with an equal volume of 5% sulfosalicylic acid, followed by centrifugation at 6000 × g for 10 min. A 2 mL aliquot of the resulting supernatant was concentrated using a rotary evaporator (RE-52). The concentrate was dissolved in 1 mL of sodium citrate buffer and filtered through a 0.45 μm membrane. Free amino acids were quantified using a Biochrom 30+ automatic amino acid analyzer (Biochrom Inc., England).
2.7. DPPH Free Radical Scavenging Assay
A total of 0.1 g of sample was mixed with 1 mL of pre-cooled 80% methanol and homogenized in an ice–water bath. The mixture was centrifuged at 12,000 r/min for 10 min, and the resulting supernatant was collected. All reagents were equilibrated to room temperature prior to analysis. The DPPH radical-scavenging activity was determined according to the instructions provided with the commercial assay kit. The calculation formula was as follows:
A: experimental group; B: control group; C: blank control;
2.8. Scanning Electron Microscopy
The surface morphology of SBM before and after enzymatic hydrolysis was examined using scanning electron microscopy (SEM). Conductive tape was affixed to the specimen stage, and a small amount of sample was carefully placed onto the tape. The sample was evenly spread and gently blown to remove unattached particles prior to SEM observation.
2.9. Determining the Secondary Structure of Proteins
Protein secondary structures were analyzed using a Thermo Fisher Nicolet iS50 Fourier transform infrared (FTIR) spectrometer (Thermo Fisher Scientific Inc., USA) at a spectral resolution of 4 cm⁻¹ over a range of 800–4000 cm⁻¹. Each sample was scanned eight times, and the resulting spectra were recorded. Spectral data were processed using OMNIC 9.2 (Omnicom Inc., USA) for smoothing, baseline correction, and deconvolution.
2.10. Estimation of Protein Relative Molecular Weight
Protein molecular-weight distribution was analyzed using a Waters 2695 high-performance liquid chromatography (HPLC) system (Waters Inc., USA) equipped with a 487 UV detector and Empower GPC workstation software. The chromatographic conditions were as follows: TSKgel 2000SWxl column (300 mm × 7.8 mm), mobile phase consisting of acetonitrile/water/trifluoroacetic acid (40:60:0.1, v/v), UV detection at 220 nm, flow rate of 0.5 mL/min, and column temperature maintained at 30 °C.
2.11. Statistics Analysis
Free amino acid data were analyzed using SPSS 19.0 (SPSS Inc., USA) by one-way ANOVA and paired-sample t-tests. Results were expressed as mean ± standard deviation. Statistical significance was defined as P<0.05, and high significance as P<0.01. Data processing and plotting were performed using Origin 2024 (OriginLab Inc., USA).
3. Results
3.1. Single Factor Test Results
Figure 1a shows that when hydrolysis time, moisture content, and temperature are held constant, the levels of water-soluble protein and small peptides in SBM initially increase and then decrease with increasing enzyme addition. The maximum values were obtained at 1.5% enzyme addition, reaching 90.97 mg/g for water-soluble protein and 11.98% for small peptides. As shown in Figure 1b, when hydrolysis time, enzyme addition, and moisture content were kept constant, water-soluble protein and small-peptide contents increased and then declined with increasing temperature, with peak values observed at 35 °C (90.28 mg/g and 11.92%, respectively). According to Figure 1c, when enzyme addition, moisture content, and temperature were fixed, hydrolysis time exhibited a positive relationship with both water-soluble protein and small-peptide contents. These values increased continuously and reached their maximum at 48 h (95.14 mg/g and 13.86%, respectively). The rapid increase between 24 and 48 h indicates strong enzymatic activity and efficient hydrolysis of SBM proteins. As shown in Figure 1d, when hydrolysis time, enzyme addition, and temperature were fixed, water-soluble protein and small-peptide contents first increased and then decreased with rising moisture levels. The highest water-soluble protein content was observed at 40% moisture (90.90 mg/g), whereas the highest small-peptide content occurred at 30% moisture (12.74%).
3.2. Optimizing the Process Conditions for Enzymatic Digestion of Soybean Meal Through Response Surface Methodology
Based on the single-factor results, which identified small-peptide content as the response variable, clear interactions among the hydrolysis parameters were observed. Therefore, four factors—enzyme addition, temperature, time, and moisture content—were selected for response surface optimization. Multiple regression models were constructed and response surface plots were generated from the fitted equations to determine optimal hydrolysis conditions. This approach finalized the experimental design for the four-factor Box–Behnken response surface analysis. The factors and their levels are summarized in Table 1, and the experimental design and results are presented in Table 2.
The equation illustrates how the small peptide content varies after enzymatic digestion of SBM and the factors that influence it. Response surface analysis revealed a model P<0.01, demonstrating high significance (P<0.01). With a correlation coefficient of R² = 0.9701, the model explains 97% of the variation in the response. These results confirm the reliability of the experimental method, enabling analysis through the regression model rather than individual experimental data.
3.3. Response Surface Result Analysis
The effects of enzyme addition, hydrolysis time, temperature, and moisture content on small-peptide production were analyzed using Design-Expert 13. The corresponding contour plots and three-dimensional response surfaces are shown in Figure 2. Variations in surface height reflect changes in peptide content in response to the two interacting factors, with peaks and valleys indicating the magnitude of the response. Color gradients ranging from green (low) to red (high) further assist in visualizing these differences [9]. In the contour plots, the distribution and spacing of contour lines illustrate the rate of change in peptide content. As shown in Figure 2, most interaction surfaces display dome-shaped contours with closed elliptical patterns, indicating significant quadratic effects and suggesting that the optimal conditions lie within the experimental range.
Figure 2a shows a slightly arched surface centered within the response plot, while Figure 2a1 presents a regular concentric ellipse, indicating that factors A and B cause the response to increase initially and then decrease, with only a weak interaction between them. Figure 2b displays a pronounced dome-shaped surface, and Figure 2b1 exhibits a slightly tilted ellipse, suggesting a moderate interaction between factors A and C. Figure 2c shows an upward arch, whereas Figure 2c1 contains a rounded ellipse with slight tilt, indicating a weak interaction between A and D. Figure 2d presents a vaulted peak, and the symmetrical ellipse in Figure 2d1 suggests limited interaction between B and C. In Figure 2e, a distinct undulating surface is observed, and the flattened, tilted ellipse in Figure 2e1 indicates a strong interaction between B and D. Finally, Figure 2f presents a gentle peak with a well-defined symmetrical ellipse in Figure 2f1, indicating that the interaction between C and D is very weak.
Based on the regression model, the predicted optimal conditions for SBM enzymatic hydrolysis were 1.42% enzyme addition, 61.30 h of hydrolysis time, a temperature of 36.0 °C, and a moisture content of 34.90%. Under these conditions, the predicted small-peptide content ranged from 20% to 60%. Considering practical feasibility, the optimized operational conditions were adjusted to 1.45% enzyme addition, 62 h hydrolysis time, 36.5 °C, and 35% moisture content. Under these adjusted conditions, the predicted small-peptide content was 19.73%, with an absolute deviation of less than 5% from the theoretical value, confirming the reliability of the model.
3.4. Scanning Electron Microscope Results
Figure 3a,b show that, prior to enzymatic hydrolysis, the surface of SBM exhibited clearly defined plant cell structures with a dense and intact morphology typical of natural plant proteins. The tightly bound cell wall encapsulated internal nutrients such as proteins and lipids, with only minor surface debris present. This dense barrier restricted enzyme accessibility and penetration, resulting in limited nutrient bioavailability. Following enzymatic hydrolysis, substantial structural disruption was observed on the SBM surface. As illustrated in Figure 3a1,b1, the previously smooth and compact surface became eroded and fragmented, displaying numerous microscopic pores and fissures, many of which showed honeycomb-like or sponge-like patterns.
3.5. Infrared Spectra of Proteins Before and After Enzymatic Digestion of Soybean Meal
The FTIR spectra of SBM before and after enzymatic hydrolysis are presented in Figure 4. In the amide I region, the major absorption peak shifted from 1633.412 to 1634.858 cm⁻¹ following hydrolysis, indicating alterations in hydrogen bonding and changes in the microenvironment surrounding the carbonyl groups. This upward shift suggests an increase in flexible or disordered secondary structures, such as β-turns and random coils. In addition, the amide II peak shifted from 1534.578 to 1531.685 cm⁻¹, reflecting modifications in the coupling of N–H bending and C–N stretching vibrations.
3.6. Variations in Protein Secondary Structure Before and After Enzymatic Hydrolysis of Soybean Meal
As shown in Table 3 and Figure 5, enzymatic hydrolysis markedly altered the secondary structure of SBM proteins. The amide I band shifted upward, while the amide II band shifted downward, indicating changes in carbonyl environments and hydrogen-bonding patterns. Overall, both peak area and peak height increased, and the area-to-height ratio also rose, suggesting increased exposure of peptide bonds and reorganization of the secondary structure. Structurally, although the absolute α-helix content increased, its relative proportion decreased. The β-sheet content remained relatively unchanged, whereas β-turn and random-coil structures increased. The elevated β/α ratio indicates a transition from ordered helical conformations to more flexible and disordered structures such as turns and coils, reflecting the loosening of internal hydrogen bonds and the overall protein architecture.

Table 4.
Secondary Structural Parameters Before and After Digestion of Soybean Meal.
| Items | Group | SEM | |
| SBM | EHSBM | ||
| Initial analysis of the amide I region | 1580.065-1708.877 | 1583.292-1691.659 | |
| 1.079 | 2.055 | 0.488 | |
| Amide I center | 1633.412 | 1634.858 | |
| The amide I region reaches a high peak | 0.065 | 0.096 | 0.031 |
| Initial analysis of the amide II region | 1481.530-1580.065 | 1484.772-1583.292 | |
| Peak area of amide II | 0.448 | 0.569 | 0.061 |
| Amide II zone center | 1534.578 | 1531.685 | |
| The amide II region reaches a high peak | 0.034 | 0.035 | 0.001 |
| Peak area of amide I region /Peak area of amide II region | 2.408 | 3.612 | 0.602 |
| Peak height in the amide I region/Peak height in the amide II region | 1.912 | 2.743 | 0.416 |
| β-sheet area | 0.361 | 0.638 | 0.014 |
| Proportion of β-sheet peak area | 0.335 | 0.311 | 0.001 |
| Random coil area | 0.184 | 0.492 | 0.154 |
| Proportion of random coil peak area | 0.171 | 0.239 | 0.034 |
| α-helix area | 0.324 | 0.438 | 0.057 |
| Proportion of α-helix peak area | 0.300 | 0.213 | 0.044 |
| β-turn area | 0.144 | 0.392 | 0.124 |
| Proportion of β-turn peak area | 0.133 | 0.191 | 0.029 |
| β-turn area/α-helix area | 0.111 | 0.146 | 0.018 |
3.7. Relative Molecular Weight Distribution
The relative molecular-weight distributions of SBM and EHSBM are shown in Figure 6. Enzymatic hydrolysis markedly altered the molecular-weight profile, reducing the weight-average molecular weight from 9544 Da to 5817 Da—a decrease of 39%. The proportion of high–molecular-weight proteins (>10,000 Da) decreased from 47.95% to 26.80%, whereas the abundance of low–molecular-weight peptides (180–2000 Da) increased substantially. Specifically, the proportions of peptides in the 2000–1000 Da, 1000–500 Da, and 500–180 Da ranges increased by approximately 6.3-, 9.2-, and 1.6-fold, respectively. These results demonstrate that enzymatic hydrolysis effectively cleaves large protein molecules into smaller, more digestible, and more readily absorbed peptide fragments.
3.8. Free Amino Acids
Table 5 and Figure 7 show that enzymatic hydrolysis markedly altered the free amino acid profile of SBM. Total free amino acid content increased from 5.862 mg/g before hydrolysis to 12.546 mg/g after hydrolysis (P<0.001), representing a 114.2% increase. This confirms that enzymatic hydrolysis effectively cleaved peptide bonds and released free amino acids. Composition analysis revealed significant differences among individual amino acids following hydrolysis. Essential amino acids increased from 2.631 mg/g to 7.883 mg/g (P<0.001), a 199.6% rise, which was markedly higher than the 44.3% increase in non-essential amino acids. Aromatic amino acids, such as tyrosine and phenylalanine, exhibited large increases (tyrosine: 0.325 → 2.320 mg/g; phenylalanine: 0.229 → 1.862 mg/g; both P<0.001). Branched-chain amino acids (leucine, isoleucine, valine) and sulfur-containing amino acids (methionine, cysteine) also showed significant increases (P<0.001).
3.9. DPPH Free Radical
Figure 8 shows the DPPH radical-scavenging activity of SBM before and after enzymatic hydrolysis. The scavenging activity increased from 18.37% to 57.99%, an improvement of 39.62%. These results indicate that enzymatic hydrolysis substantially enhances the antioxidant capacity of SBM by improving its ability to quench DPPH free radicals.
4. Discussion
4.1. Improving the Soybean Meal Enzymatic Hydrolysis Process
The efficiency of enzymatic hydrolysis depends on appropriate enzyme preparations and precise control of processing parameters, including enzyme and substrate concentrations, temperature, time, and pH [10,11]. In practical applications, selecting suitable single or combined enzyme preparations requires consideration of the substrate's chemical composition and antinutritional factors [12]. For SBM, combined protease hydrolysis is commonly used to break down large proteins into small peptides and free amino acids, thereby improving digestibility [4], For cereal- or bran-based substrates, enzymes such as xylanase and β-mannanase are applied to degrade non-starch polysaccharides and disrupt cell-wall structures [13]. Proper regulation of hydrolysis parameters—such as temperature, pH, substrate concentration, and reaction duration—is essential [14], as these factors directly affect hydrolysis efficiency and product stability. Previous studies have shown [15] tthat applying soybean meal–specific hydrolyzing enzymes increased the degree of hydrolysis to 48% and achieved a protein extraction rate of 81.2%. Similarly, Zhang et al. [16] eported that Alcalase treatment effectively degraded SBM proteins into small peptides. In their study, hydrolysis parameters including enzyme dosage, temperature, duration, and moisture content were optimized using single-factor experiments followed by Box–Behnken response surface methodology, identifying optimal conditions of 45% enzyme addition, 62 h, 36 °C, and 35% moisture. Under these conditions, small-peptide content reached 19%, representing a 16.31-fold increase. These findings demonstrate that combined protease preparations effectively hydrolyze high–molecular-weight soybean proteins, modify structural characteristics, and substantially increase small-peptide content.
4.2. Microstructure Analysis
Structural changes at the microlevel are closely associated with nutrient release and digestibility [17] .In SBM, the densely compacted surface encapsulates internal nutrients such as proteins and lipids, limiting contact with external enzymes and substantially reducing nutrient utilization [18,19]. Enzymatic hydrolysis disrupts and degrades this compact cell-wall structure, generating a loose and porous matrix¹⁰ that exposes additional nutrients and enhances enzyme–substrate interactions, thereby improving protein hydrolysis and increasing nutritional value [20]. Wang et al. [21] reported that enzymatically hydrolyzed SBM exhibited a fibrous surface and a markedly loosened internal structure, which increased the contact area between enzymes and substrates. SEM analysis confirmed that enzymatic treatment effectively disrupted the compact cell wall, producing a porous and open structure. This transition from a “dense and closed” to a “loose and porous” state exposes previously inaccessible nutrients and facilitates subsequent hydrolysis. As a consequence, more protein molecules become available for enzymatic action, significantly enhancing the nutritional properties of SBM.
4.3. Analysis of FTIR
Infrared spectroscopy is a widely used analytical technique for characterizing molecular structures because of its sensitivity to chemical composition and molecular vibrations [22]. Each functional group exhibits characteristic absorption peaks [23],with their approximate positions determined by vibrational mass and bond type (single, double, or triple). The precise locations of these peaks are further influenced by the electron-withdrawing or electron-donating effects of the surrounding chemical environment and by vibrational coupling.
For proteins, the major infrared features arise from peptide-bond vibrations, commonly referred to as the amide bands. Among them, the amide I (1600–1700 cm⁻¹) and amide II (1480–1580 cm⁻¹) bands are the most informative for secondary-structure analysis, as they are highly sensitive to α-helix, β-sheet, β-turn, and random-coil conformations. Approximately 80% of the amide I signal originates from C=O stretching vibrations²⁴, while the amide II band primarily reflects N–H bending and C–N stretching. These two bands are therefore widely used to evaluate protein structural composition and conformational changes [24]. Previous studies have shown that hydrolysis of SBM using alkaline protease results in noticeable shifts in both amide I and amide II bands, attributed to the disruption of hydrogen bonds and the unfolding of helical structures [25]. In this experiment, the amide I band shifted upward from 1633.412 cm⁻¹ to 1634.858 cm⁻¹, while the amide II band shifted from 1534.578 cm⁻¹ to 1531.685 cm⁻¹ following enzymatic hydrolysis of SBM. Structurally, the relative proportion of α-helix decreased, whereas β-sheet, β-turn, and random-coil structures increased after hydrolysis. These changes are likely attributable to the disruption of internal hydrogen bonds, which converts the compact secondary structure of SBM into a looser and more disordered conformation that is more susceptible to further degradation, digestion, and absorption. These findings align with the microstructural observations obtained from SEM.
4.4. Analysis of Protein Relative Molecular Mass Distribution
Protein molecular weight distribution is an important indicator of the effectiveness of enzymatic hydrolysis [14]. During hydrolysis, complex high–molecular-weight proteins are cleaved into smaller peptides that are more readily absorbed, as these low–molecular-weight fragments exhibit faster and more efficient uptake than intact proteins [26]. n this study, molecular weight analysis before and after enzymatic treatment demonstrated clear protease activity. The hydrolysis process markedly altered the protein size profile of SBM, reducing the weight-average molecular mass by 39%, decreasing the proportion of high–molecular-weight proteins, and increasing the abundance of smaller peptide fragments. This substantial reduction in high–molecular-weight fractions indicates that the protease effectively cleaved large protein chains into smaller units, corroborating the structural changes observed in the SEM and FTIR analyses.
4.5. Analysis of Free Amino Acid
Among plant-derived protein sources, soybean is considered one of the most biologically valuable due to its amino acid profile, which closely resembles that of animal proteins, particularly in terms of essential amino acid composition [27]. Studies have shown that soybean protein content exceeds that of hemp seeds and exhibits a more favorable amino acid balance [28]. SBM, a major by-product of soybean processing, is similarly rich in essential amino acids, especially lysine, which is typically limited in cereal grains [29]. Enzymatic hydrolysis of SBM using enzymes produced by Aspergillus oryzae has been reported to significantly increase glutamic and aspartic acid levels [30]. Amino acids, as the fundamental building blocks of proteins, directly affect the composition and quality of animal tissues and play indispensable roles in growth, development, reproduction, immunity, and other physiological processes [31]. Therefore, dietary protein requirements are essentially determined by the need for specific amino acids—particularly essential amino acids that animals cannot synthesize adequately and must obtain from feed [32]. A Deficiencies in protein or amino acids impair immune function and elevate susceptibility to infectious diseases in both animals and humans [33,34]. In this study, enzymatic hydrolysis markedly increased the free amino acid content of SBM. Essential amino acids nearly doubled, and aromatic as well as branched-chain amino acids also showed pronounced increases. Furthermore, DPPH radical-scavenging assays demonstrated a substantial improvement in antioxidant activity fol*owing enzymatic treatment, consistent with findings reported by Da et al. [35]. These results indicate that enzymatic hydrolysis effectively disrupts the dense structure of SBM, releases previously inaccessible components, partially converts them into free amino acids, enhances their bioavailability, and improves the antioxidant capacity of SBM.
5. Conclusions
The microstructure and physicochemical properties of SBM were substantially improved under optimal enzymatic hydrolysis conditions. The enzymatic process effectively disrupted the surface integrity and compact structure of SBM, generating honeycomb- or sponge-like porous formations. Correspondingly, the protein secondary structure shifted from an ordered conformation to a looser and more disordered state, exposing additional peptide bonds. After hydrolysis, the average molecular weight decreased markedly from 9544 Da to 5817 Da (a 39% reduction), accompanied by a substantial increase in small peptide fragments within the 180–2000 Da range. Component analysis further showed that the total free amino acid content increased sharply from 5.862 mg/g to 12.546 mg/g (a 114.2% increase), with essential amino acids exhibiting a 199.6% rise. Additionally, the DPPH radical-scavenging activity of SBM improved by 39.62%. These findings demonstrate that enzymatic hydrolysis effectively disrupts the structural organization of SBM and enhances its nutritional value, providing a theoretical basis and data support for the development of high-value protein-peptide products.
Author Contributions
Conceptualisation, X.Z. and F.L.; methodology, X.Z., J.L. and Q.H.; validation, Y.Z. and J.L.; formal analysis, X.Z., Q.H. and C.Z.; investigation, X.Z., Q.H. and J.Y.; data curation, X.Z. and Q.H.; software, C.Z.; visualization, Q.H., Y.Z. and C.Z.; resources, J.L. and J.Y.; supervision, J.Y. and F.L.; project administration, J.Y. and F.L.; funding acquisition, F.L.; writing—original draft preparation, X.Z.; writing—review and editing, J.L., Y.Z., C.Z. and F.L. All authors have read and agreed to the published version of the manuscript.
Funding
This work was supported the Key R&D Tasks Special Program of Xinjiang Uygur Autonomous Region (2024B02016) and Tingzhou Science and Technology Innovation Team Project (2023CT13)
Institutional Review Board Statement
This experiment adheres to the ‘Regulations on the Administration of Laboratory Animals’ issued by the Science and Technology Commission of the People’s Republic of China.
Informed Consent Statement
Not applicable.
Data Availability Statement
The data for this study are provided upon request by the corresponding author.
Acknowledgments
The authors acknowledge the financial support from the Key R&D Tasks Special Program of Xinjiang Uygur Autonomous Region (2024B02016). We thank Xinjiang Taikun Inc. (China) for providing soybean meal samples and Hebei Haotong Biotechnology Inc. (China) for providing the protease preparation. We also appreciate the technical assistance of the analytical facilities at the authors’ institution for instrument access and support during sample characterization.
Conflicts of Interest
The authors declare no conflicts of interest.
Abbreviations
The following abbreviations are used in this manuscript:
| SBM | Sybean meal |
| EHSBM | Ezymatically hydrolyzed soybean meal |
| RSM | Rsponse surface methodology |
| BBD | Box–Behnken design |
| SEM | Scanning electron microscopy |
| FTIR | Fourier transform infrared spectroscopy |
| BBD | Box–Behnken design |
References
- Lambo, M.T.; Ma, H.; Zhang, H.; Song, P.; Mao, H.; Cui, G.; Dai, B.; Li, Y.; Zhang, Y. Mechanism of action, benefits, and research gap in fermented soybean meal utilization as a high-quality protein source for livestock and poultry. Animal Nutrition 2024, 16, 130–146. [Google Scholar] [CrossRef]
- Dong, J.; Sun, Y.; Yu, Y.; Li, Q.; Zuo, Y.; Li, J.; Zhang, L. The combined treatments for breaking down microstructural barriers in highly denatured soybean meal to improve soybean protein concentrate processing. Innovative Food Science & Emerging Technologies 2025, 101, 103953. [Google Scholar] [CrossRef]
- Abdel-Raheem, S.M.; Mohammed, E.S.Y.; Mahmoud, R.E.; El Gamal, M.F.; Nada, H.S.; El-Ghareeb, W.R.; Marzok, M.; Meligy, A.M.; Abdulmohsen, M.; Ismail, H. Double-fermented soybean meal totally replaces soybean meal in broiler rations with favorable impact on performance, digestibility, amino acids transporters and meat nutritional value. Animals 2023, 13, 1030. [Google Scholar] [CrossRef]
- Cao, Y.; Xu, M.; Lu, J.; Cai, G. Simultaneous Microbial Fermentation and Enzymolysis: A Biotechnology Strategy to Improve the Nutritional and Functional Quality of Soybean Meal. Food Reviews International 2023, 40, 1296–1311. [Google Scholar] [CrossRef]
- Flaibam, B.; Meira, C.S.; Nery, T.B.R.; Galland, F.; Pacheco, M.T.B.; Goldbeck, R. Low-cost protein extracts and hydrolysates from plant-based agro-industrial waste: Inputs of interest for cultured meat. Innovative Food Science & Emerging Technologies 2024, 93, 103644. [Google Scholar] [CrossRef]
- Bi, H.; Zhao, H.; Lu, F.; Zhang, C.; Bie, X.; Lu, Z. Improvement of the Nutritional Quality and Fibrinolytic Enzyme Activity of Soybean Meal by Fermentation of Bacillus subtilis. Journal of Food Processing and Preservation 2014, 39, 1235–1242. [Google Scholar] [CrossRef]
- Myers, R.H.; Montgomery, D.C.; Anderson-Cook, C.M. Response surface methodology: process and product optimization using designed experiments; John Wiley & Sons, 2016. [Google Scholar]
- Fusheng, C.; Xiaoli, C.; Lite, L. Effects of different extracting methods on functional properties of soybeam protein isolate. China Food Additives 2009, 131–135. [Google Scholar]
- Mu, Y.; Nguyen, P.H.; Stock, G. Energy landscape of a small peptide revealed by dihedral angle principal component analysis. Proteins: Structure, Function, and Bioinformatics 2005, 58, 45–52. [Google Scholar] [CrossRef]
- Kumari, P.; Khatik, A.G.; Patil, P.D.; Tiwari, M.S.; Nadar, S.S.; Jain, A.K. Recent immobilization techniques for ketoreductases: Its design and their industrial application. Biocatalysis and Agricultural Biotechnology 2024, 56, 103027. [Google Scholar] [CrossRef]
- Lei, Z.; Chen, X.; Cao, F.; Guo, Q.; Wang, J. Efficient saccharification of Lycium barbarum leaf biomass by using enzyme cocktails produced by a novel fungus Aspergillus costaricensis LS18. Journal of Environmental Management 2022, 321, 115969. [Google Scholar] [CrossRef]
- Wang JiHui, W.J.; Tian YaLing, T.Y.; Hou Na, H.N.; Geng YangYang, G.Y.; Hu BoKai, H.B.; Liang Mei, L.M.; He JiaLi, H.J. Factors affecting the preparation of walnut polypeptide by simultaneous enzymolysis of walnut cake with compound enzyme. Food Research and Development 2018, 39, 47–52. [Google Scholar] [CrossRef]
- de Oliveira Simas, A.L.; Glienke, N.N.; de Melo Santana, Q.; Vargas, I.P.; Galeano, R.M.S.; Kiefer, C.; de Souza Nascimento, K.M.R.; Masui, D.C.; Zanoelo, F.F.; Giannesi, G.C. Biochemical characterization of phytase and xylanase produced by Aspergillus japonicus using alternative carbon sources and in vitro hydrolysis of animal feed by the enzyme cocktail. Biocatalysis and Agricultural Biotechnology 2025, 103621. [Google Scholar] [CrossRef]
- Wang, M.; Ettelaie, R.; Sarkar, A. Enzymatic hydrolysis of legume proteins: lessons on surface property outcomes. Current Opinion in Food Science 2025, 62, 101259. [Google Scholar] [CrossRef]
- Yanyan, H.; Ping, Z.; Junming, M. Study on Technique Optimization of Enzymatic Hydrolysis of Soybean Meal Response Surface Methodology. China Food Additives 2018, 73–79. [Google Scholar]
- Zhang, X.; Hao, J.; Ma, D.; Li, Z.; Zhang, S.; Li, Y. Alcalase-hydrolyzed insoluble soybean meal hydrolysate aggregates: Structure, bioactivity, function properties, and influences on the stability of oil-in-water emulsions. International Journal of Biological Macromolecules 2024, 265, 131014. [Google Scholar] [CrossRef]
- Zahir, M.; Fogliano, V.; Capuano, E. Effect of soybean processing on cell wall porosity and protein digestibility. Food & Function 2020, 11, 285–296. [Google Scholar] [CrossRef]
- Liu, Y.; Wang, Y.; Zhang, M.; Qi, Z.; Zeng, J.; Tian, N.; Li, Q. A new insight into formation of 3D porous biomaterials. Journal of Materials Science 2020, 56, 3404–3413. [Google Scholar] [CrossRef]
- Grundy, M.M.L.; Moughan, P.J.; Wilde, P.J. Bioaccessibility and associated concepts: Need for a consensus. Trends in Food Science & Technology 2024, 145, 104373. [Google Scholar] [CrossRef]
- Senanayake, D.; Torley, P.J.; Chandrapala, J.; Terefe, N.S. Microbial Fermentation for Improving the Sensory, Nutritional and Functional Attributes of Legumes. Fermentation 2023, 9, 635. [Google Scholar] [CrossRef]
- Wang, D.; Du, H.; Dang, X.; Zhao, Y.; Zhang, J.; Liu, R.; Ge, Z.; Zhong, Q.; Sun, Z. Enzymatic hydrolysis processing of soybean meal altered its structure and in vitro protein digestive dynamics in pigs. Frontiers in Veterinary Science 2024, 11. [Google Scholar] [CrossRef]
- Barth, A. Infrared spectroscopy of proteins. Biochimica et Biophysica Acta (BBA)-Bioenergetics 2007, 1767, 1073–1101. [Google Scholar] [CrossRef]
- Seica, A.F.; Iqbal, M.H.; Carvalho, A.; Choe, J.-y.; Boulmedais, F.; Hellwig, P. Study of membrane protein monolayers using surface-enhanced infrared absorption spectroscopy (SEIRAS): critical dependence of nanostructured gold surface morphology. ACS sensors 2021, 6, 2875–2882. [Google Scholar] [CrossRef]
- Pan, W.; Li, W.; Wu, H.; Xie, X.; Xie, M.; Nie, Q.; Liu, Z.; Cai, S. Aging-accelerated mouse prone 8 (SAMP8) mice experiment and network pharmacological analysis of aged Liupao tea aqueous extract in delaying the decline changes of the body. Antioxidants 2023, 12, 685. [Google Scholar] [CrossRef]
- Altan, C.O.; Kocatepe, D.; Çorapcı, B.; Köstekli, B.; Turan, H. A Comprehensive Investigation of Tenderization Methods: Evaluating the Efficacy of Enzymatic and Non-Enzymatic Methods in Improving the Texture of Squid Mantle — A Detailed Comparative Study. Food and Bioprocess Technology 2024, 17, 3999–4024. [Google Scholar] [CrossRef]
- Vermeirssen, V.; Van Camp, J.; Verstraete, W. Bioavailability of angiotensin I converting enzyme inhibitory peptides. British Journal of Nutrition 2004, 92, 357–366. [Google Scholar] [CrossRef]
- Kudełka, W.; Kowalska, M.; Popis, M. Quality of soybean products in terms of essential amino acids composition. Molecules 2021, 26, 5071. [Google Scholar] [CrossRef]
- Arango, S.; Kojić, J.; Perović, L.; Đermanović, B.; Stojanov, N.; Sikora, V.; Tomičić, Z.; Raffrenato, E.; Bailoni, L. Chemical characterization of 29 industrial hempseed (Cannabis sativa L.) varieties. Foods 2024, 13, 210. [Google Scholar] [CrossRef]
- Kumar, M.; Panesar, P.S.; Bangar, S.P. Oilseed Meal as a Sustainable Contributor to Plant-Based Protein; Springer, 2024. [Google Scholar]
- Mu, Y.; Kang, H.; Song, X.; Cao, C.; Sun-Waterhouse, D.; Waterhouse, G.I.N.; Zhao, M.; Su, G. Soybean protein isolate hydrolysate addition during fermentation of soybean meal with Aspergillus oryzae enhances the release of umami components in subsequent hydrolysis process. Food Bioscience 2025, 71, 107105. [Google Scholar] [CrossRef]
- Wu, G.; Bazer, F.W.; Dai, Z.; Li, D.; Wang, J.; Wu, Z. Amino acid nutrition in animals: protein synthesis and beyond. Annu. Rev. Anim. Biosci. 2014, 2, 387–417. [Google Scholar] [CrossRef]
- Hou, Y.; Yin, Y.; Wu, G. Dietary essentiality of “nutritionally non-essential amino acids” for animals and humans. Experimental Biology and Medicine 2015, 240, 997–1007. [Google Scholar] [CrossRef]
- Sans, M.D.; Crozier, S.J.; Vogel, N.L.; D’Alecy, L.G.; Williams, J.A. Dietary protein and amino acid deficiency inhibit pancreatic digestive enzyme mRNA translation by multiple mechanisms. Cellular and Molecular Gastroenterology and Hepatology 2021, 11, 99–115. [Google Scholar] [CrossRef] [PubMed]
- Li, P.; Yin, Y.-L.; Li, D.; Kim, S.W.; Wu, G. Amino acids and immune function. British journal of nutrition 2007, 98, 237–252. [Google Scholar] [CrossRef]
- da Silva Crozatti, T.T.; Miyoshi, J.H.; Tonin, A.P.P.; Tomazini, L.F.; Oliveira, M.A.S.; Maluf, J.U.; Meurer, E.C.; Matioli, G. Obtaining of bioactive di-and tripeptides from enzymatic hydrolysis of soybean meal and its protein isolate using Alcalase® and Neutrase®. International Journal of Food Science and Technology 2023, 58, 1586–1596. [Google Scholar] [CrossRef]
Figure 1.
a) Effect of enzyme addition amount on water-soluble protein and small peptide content; b) Effect of enzymatic temperature on water-soluble protein and small peptide content; c) Effect of enzymatic time on water-soluble protein and small peptide content; d) Effect of moisture on water-soluble protein and small peptide content.
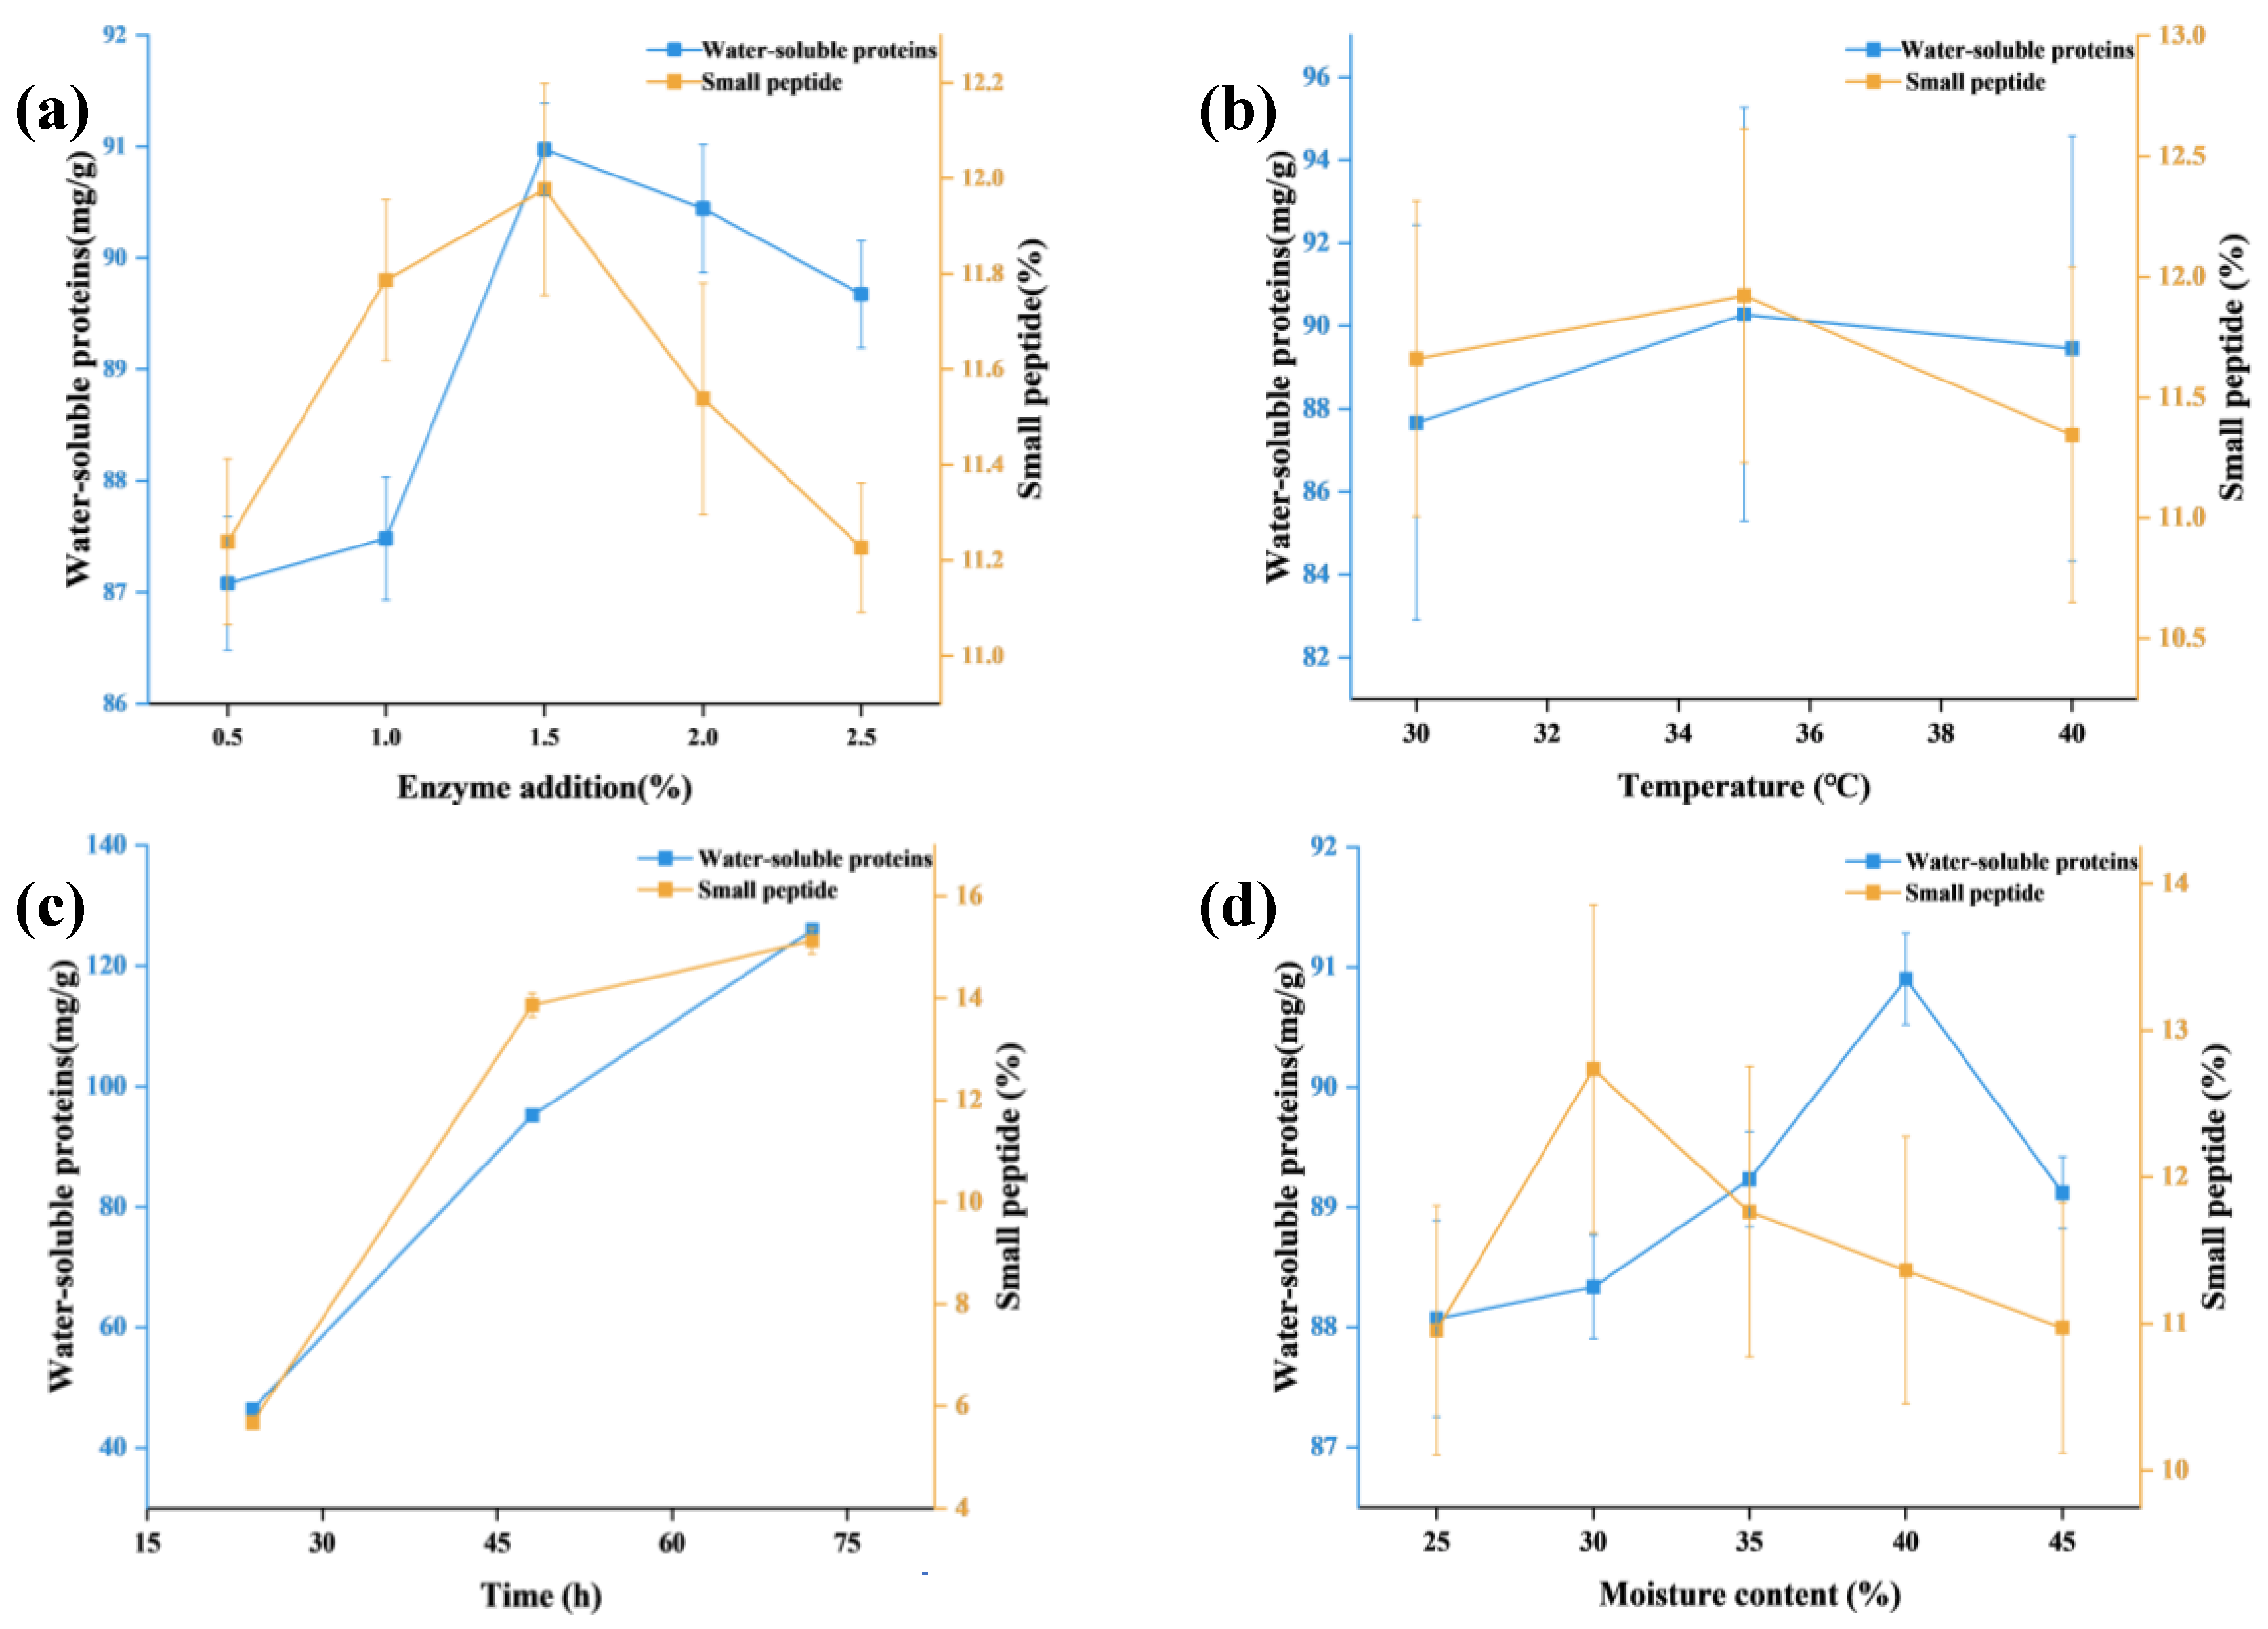
Figure 2.
3D Response Surface Plot and Contour Map. Note: a, a1 represent the 3D and contour maps of enzyme addition over time; b, b1 show the 3D and contour maps of enzyme addition versus temperature; c, c1 display the 3D and contour maps of enzyme addition versus moisture; d, d1 illustrate the 3D and contour maps of time against temperature; e, e1 depict the 3D and contour maps of time versus moisture; f, f1 present the 3D and contour maps of temperature versus moisture.
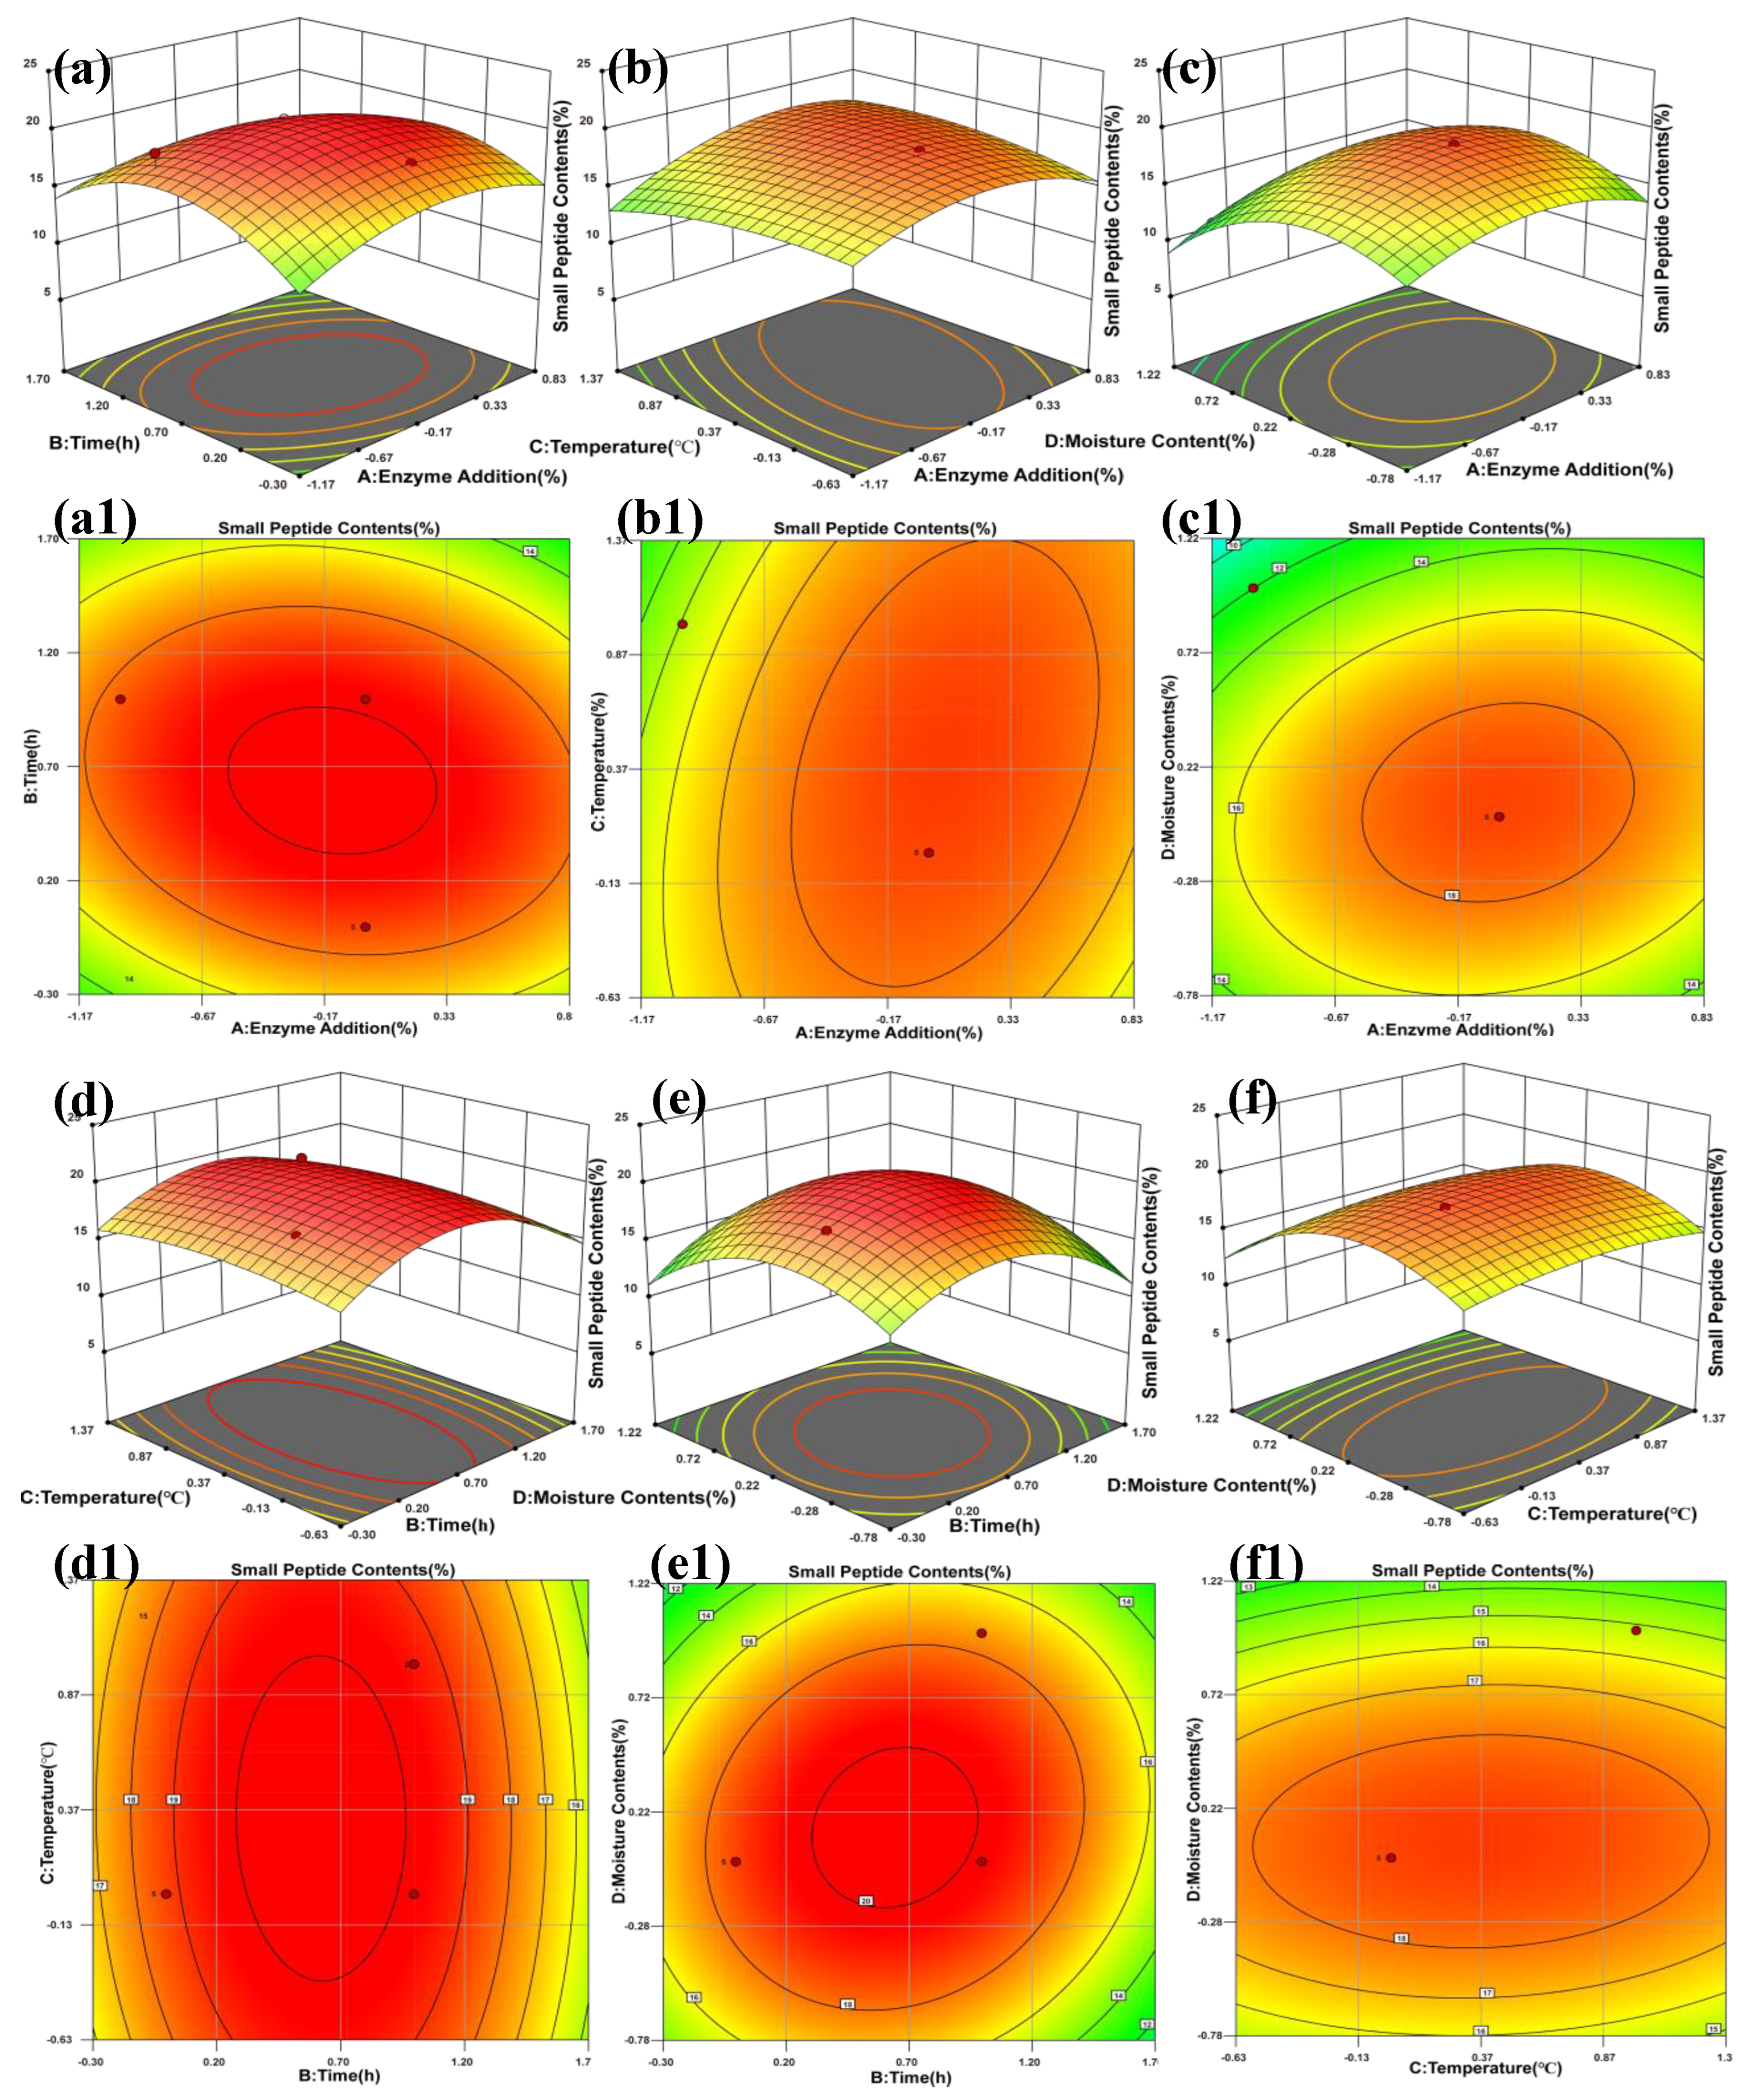
Figure 3.
SEM images of soybean meal before and after enzymatic hydrolysis. Note: EHSBM: After enzymatic hydrolysis of soybean meal, similarly, hereinafter, a:SEM image of SBM, magnification ×3000. Scale bar = 10.0 μm; b: SEM image of SBM, magnification ×10000. Scale bar=5.0 μm; a1: SEM image of EHSBM, magnification ×5000. Scale bar = 10.0 μm; b1 SEM image of EHSBM, magnification ×10000. Scale bar = 5.0 μm.
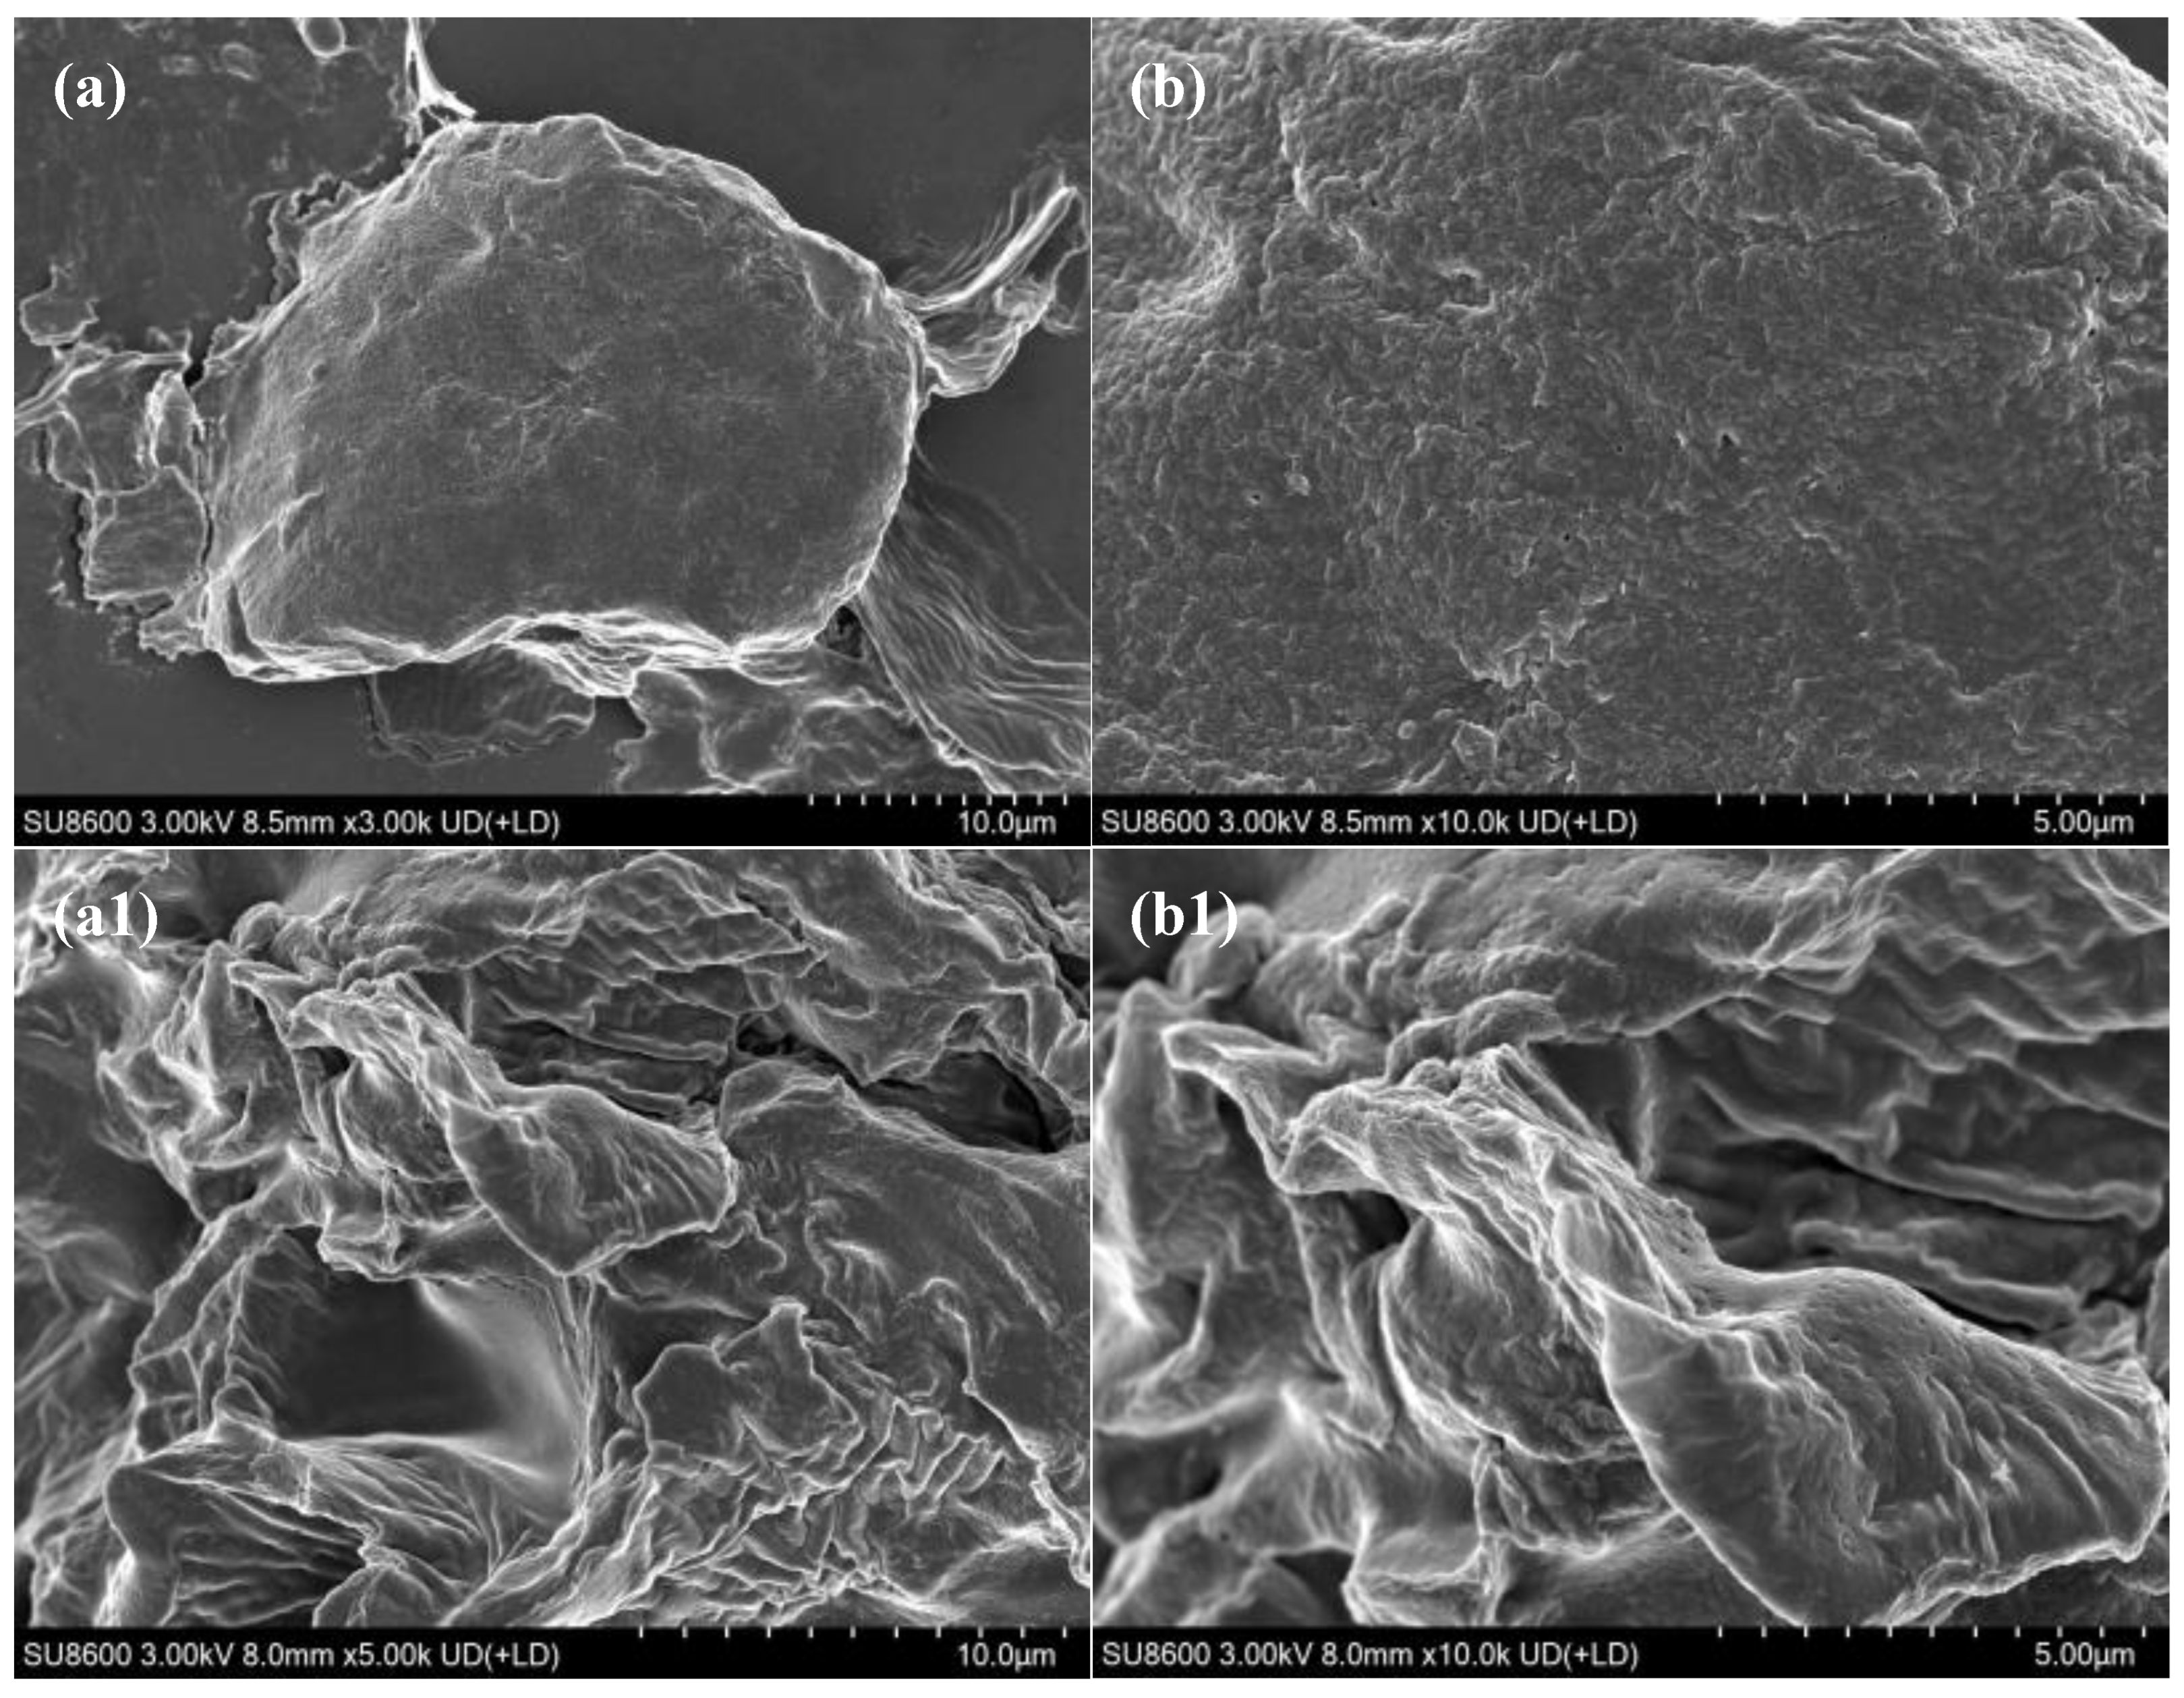
Figure 4.
Infrared Spectrum from Fourier Transform.
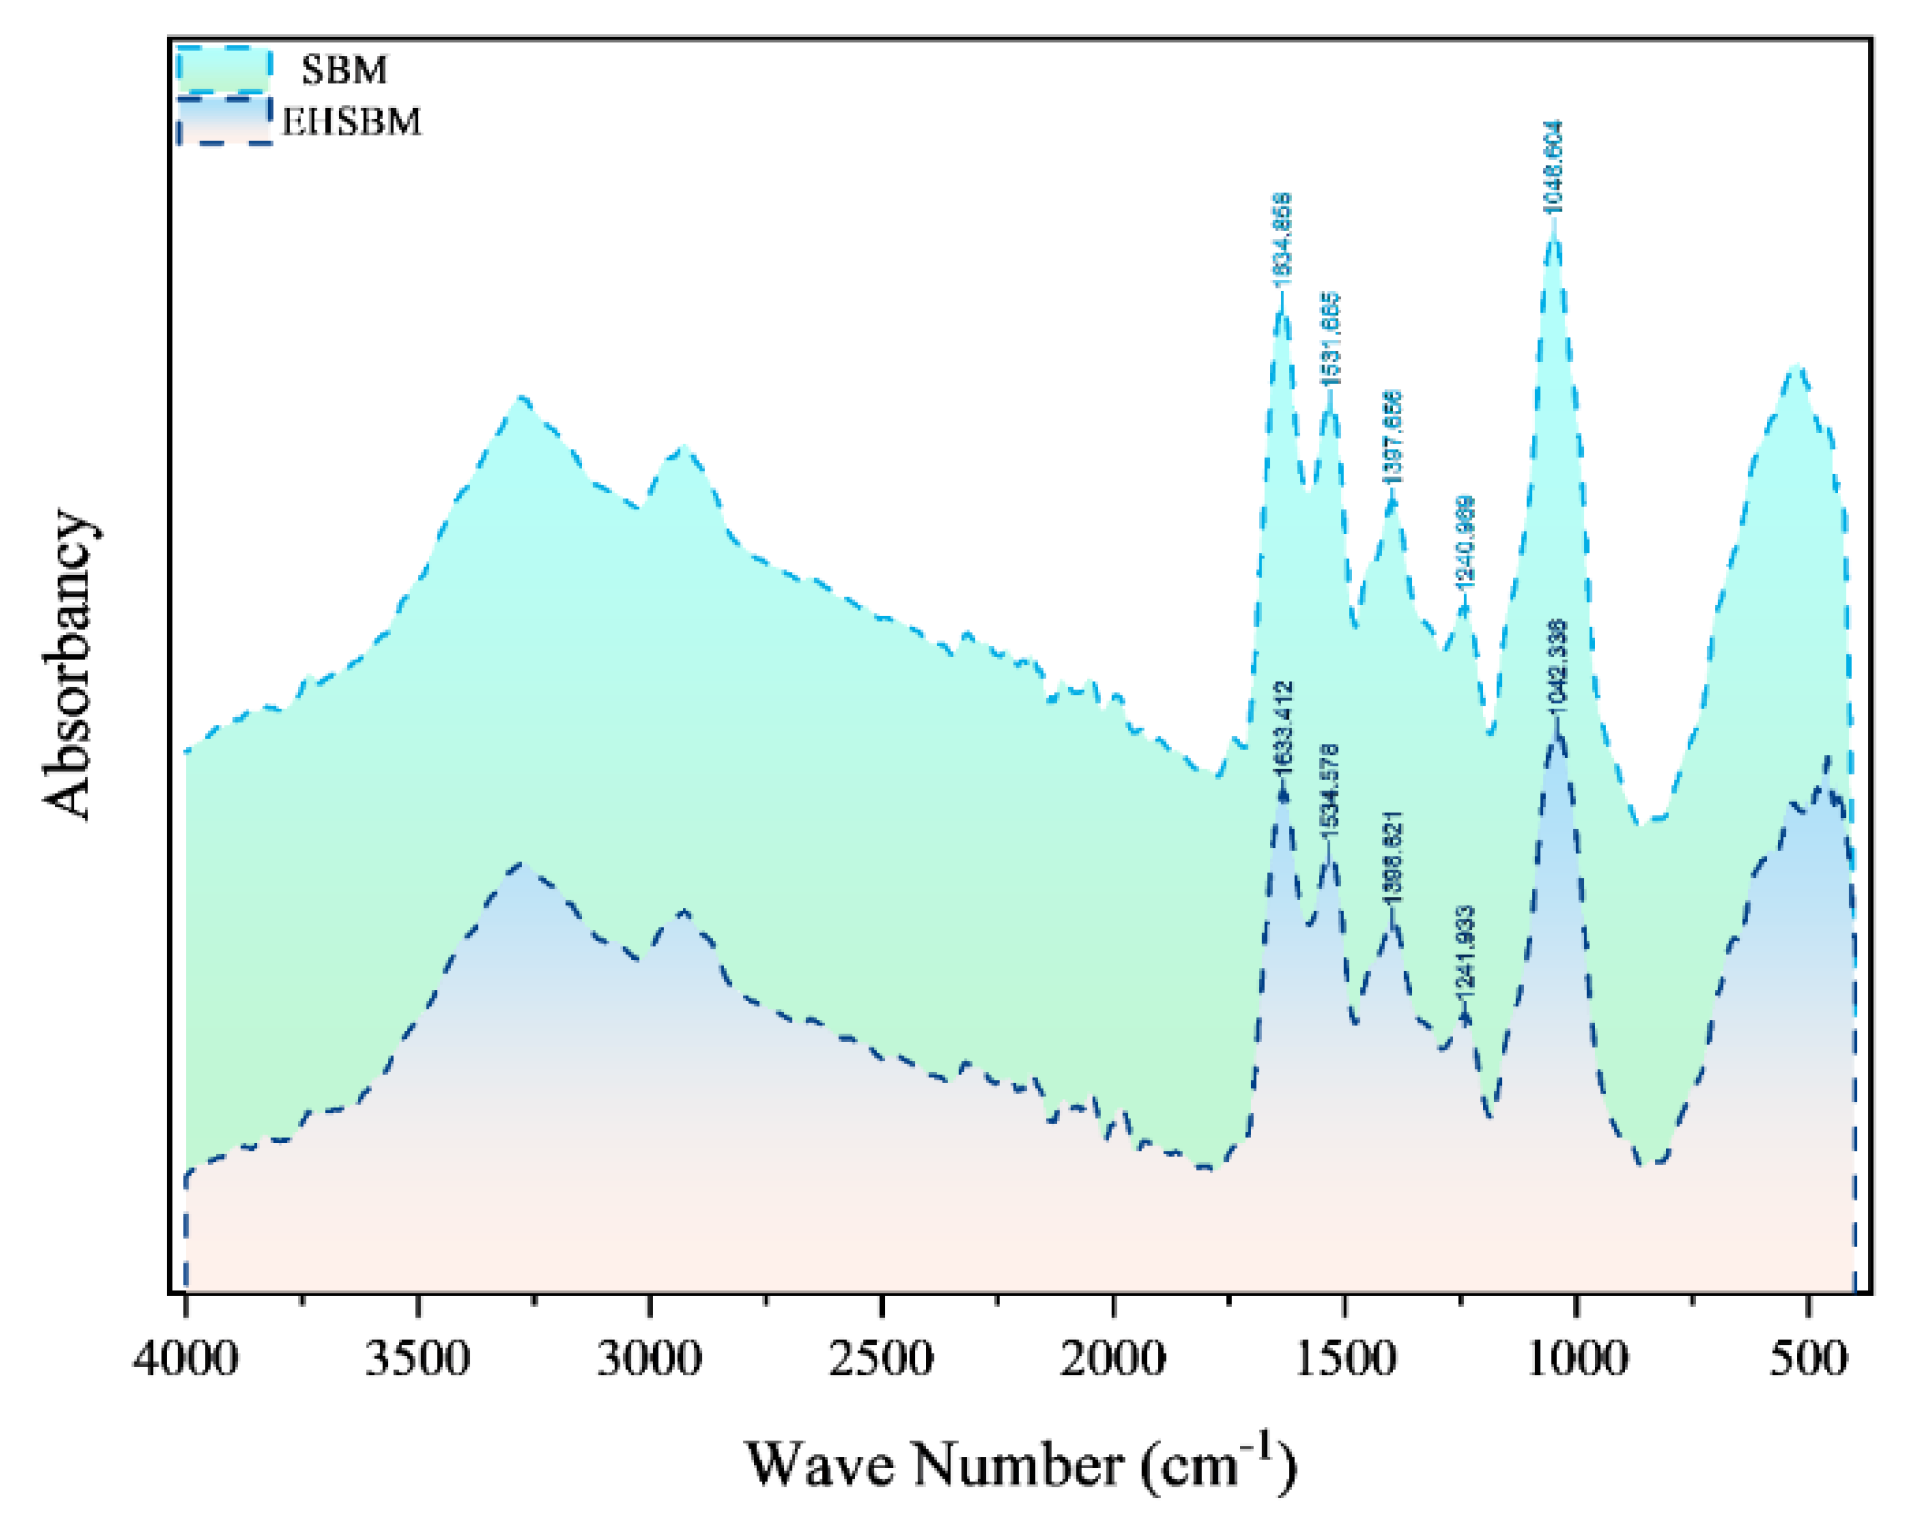
Figure 5.
Comparison of Protein Secondary Structure in Soybean Meal Before and After Enzymatic Hydrolysis.
Figure 5.
Comparison of Protein Secondary Structure in Soybean Meal Before and After Enzymatic Hydrolysis.
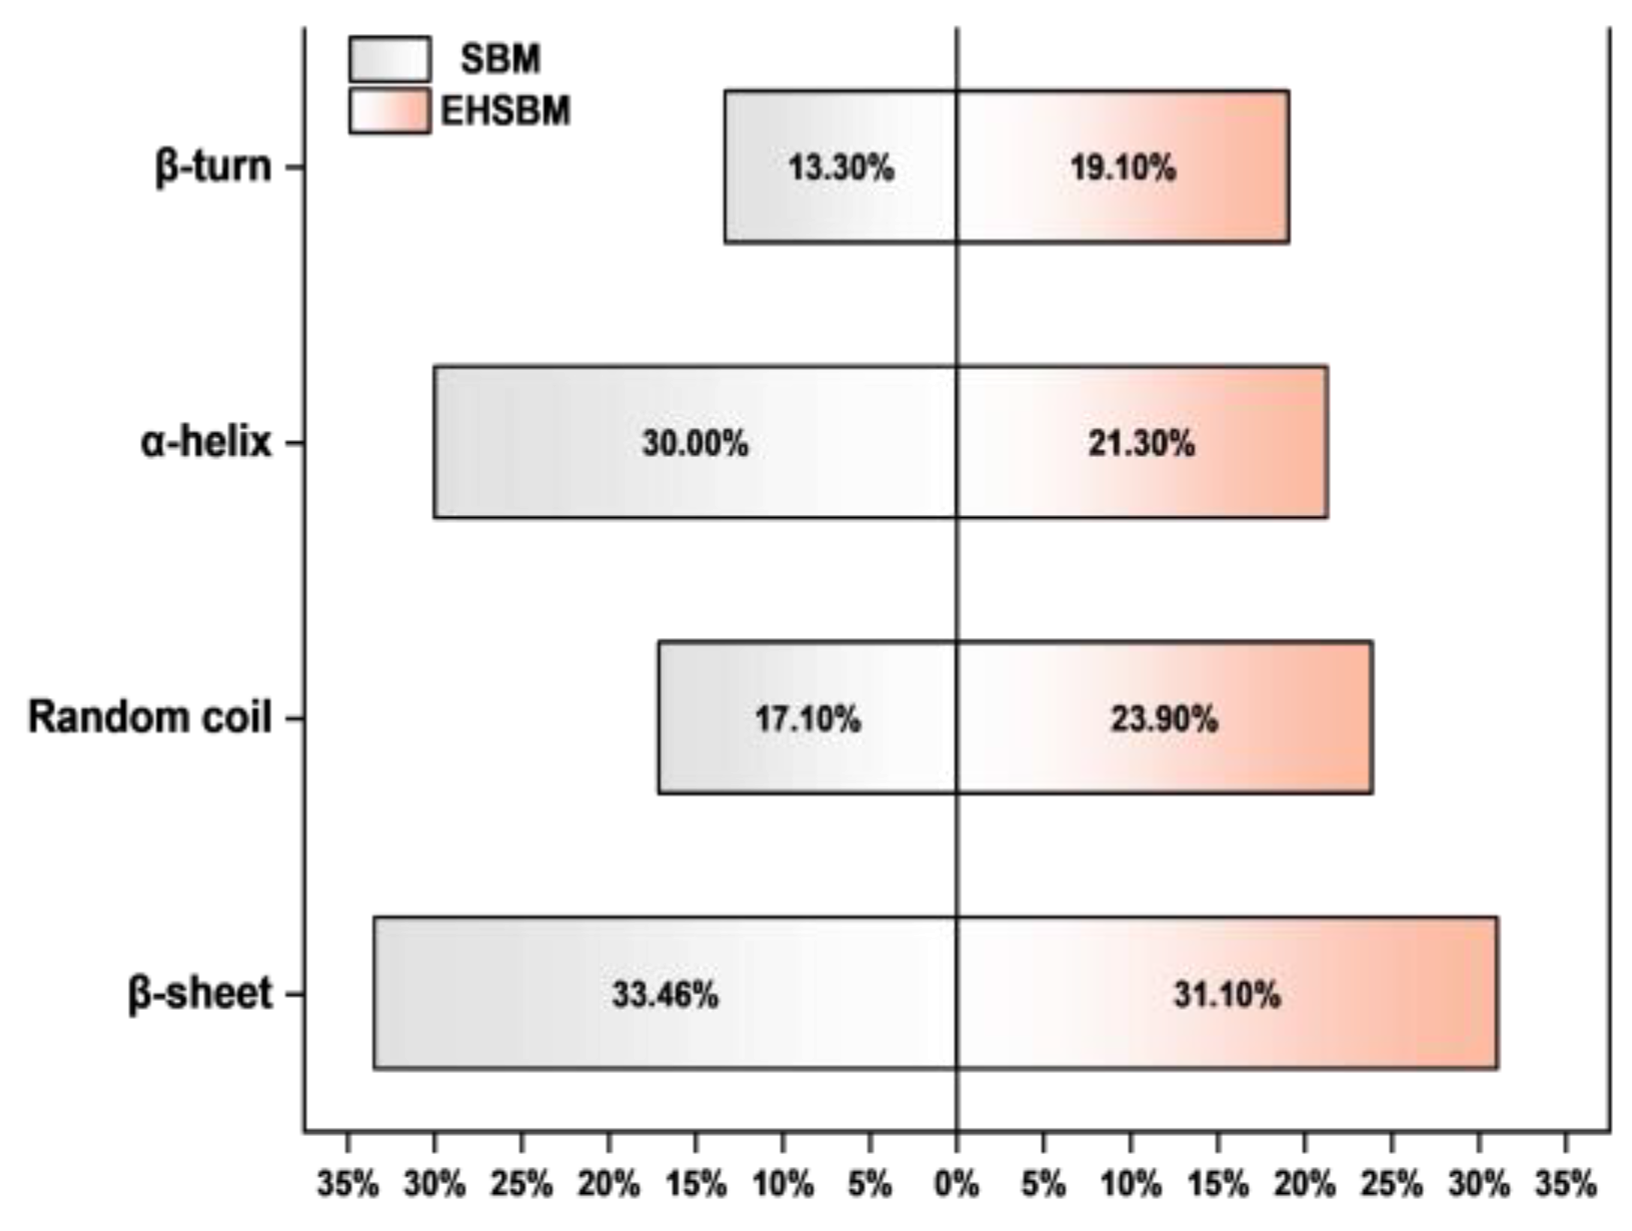
Figure 6.
a): Relative molecular weight distribution; b): Weight-average molecular weight (Mw) and peak area percent (PAP).
Figure 6.
a): Relative molecular weight distribution; b): Weight-average molecular weight (Mw) and peak area percent (PAP).
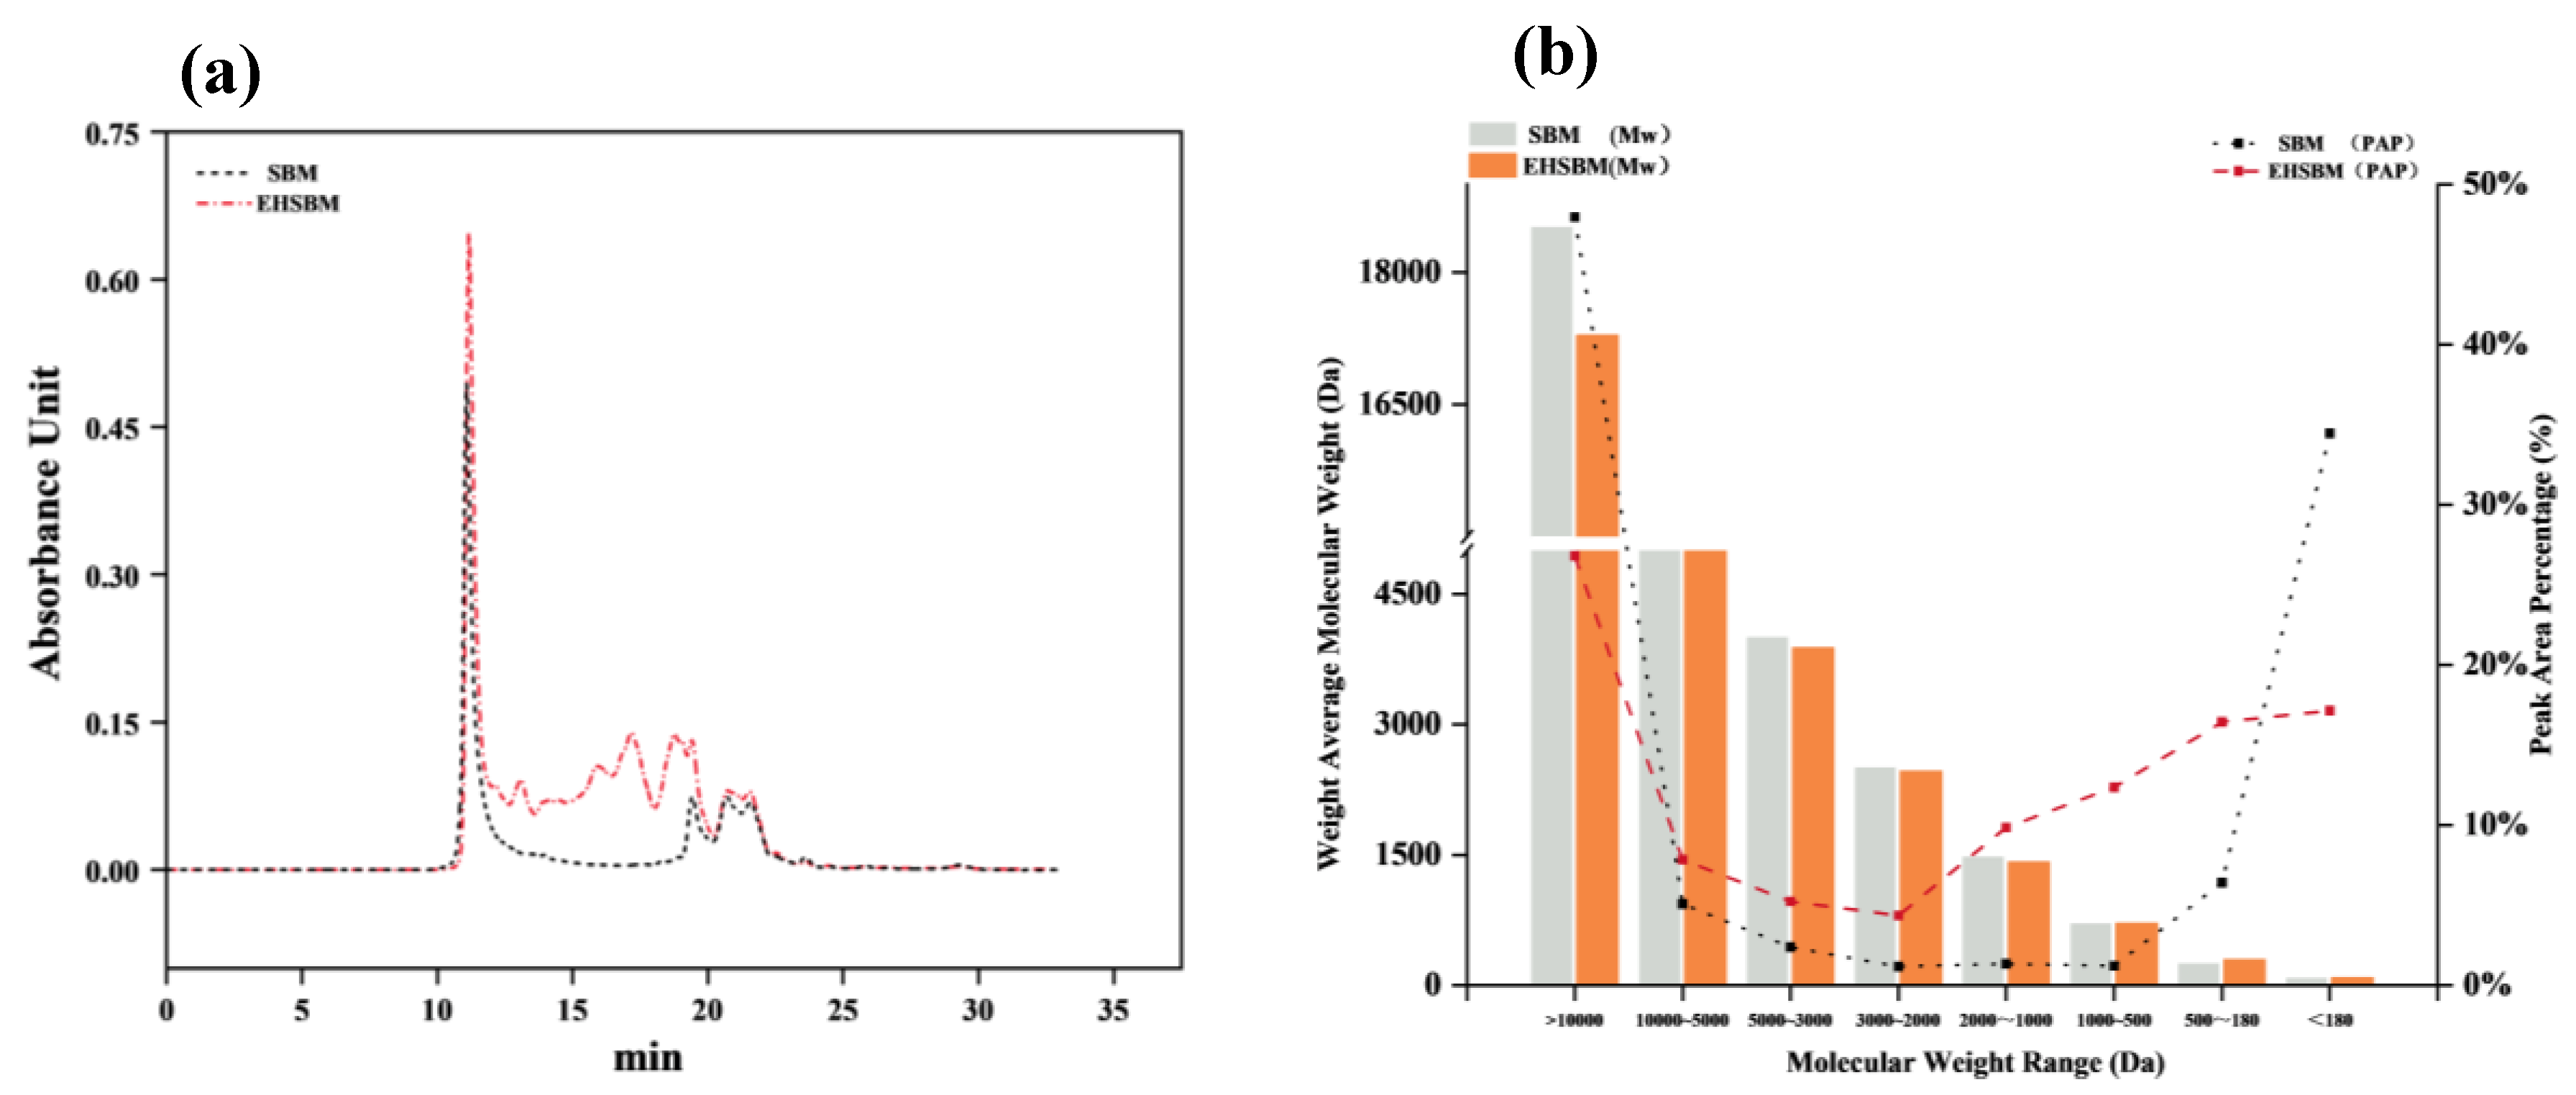
Figure 7.
Free Amino Acid Composition Before and After Enzymatic Hydrolysis of Soybean Meal.
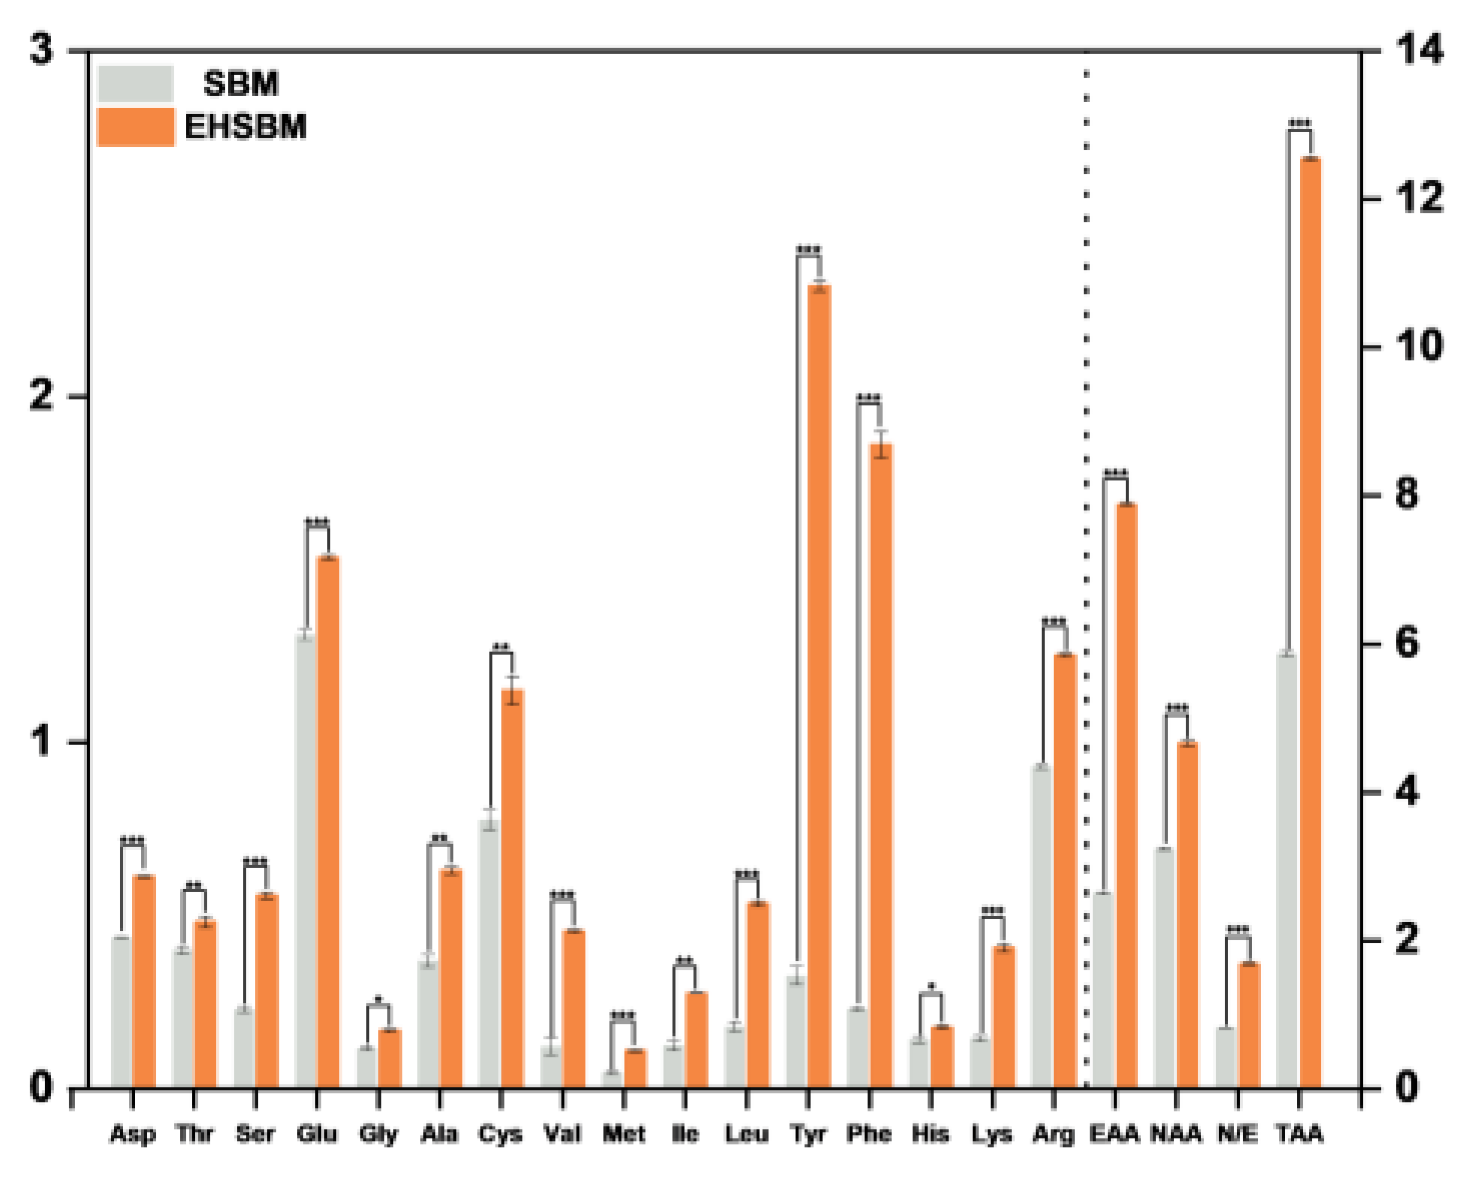
Figure 8.
DPPH Scavenging Rate.
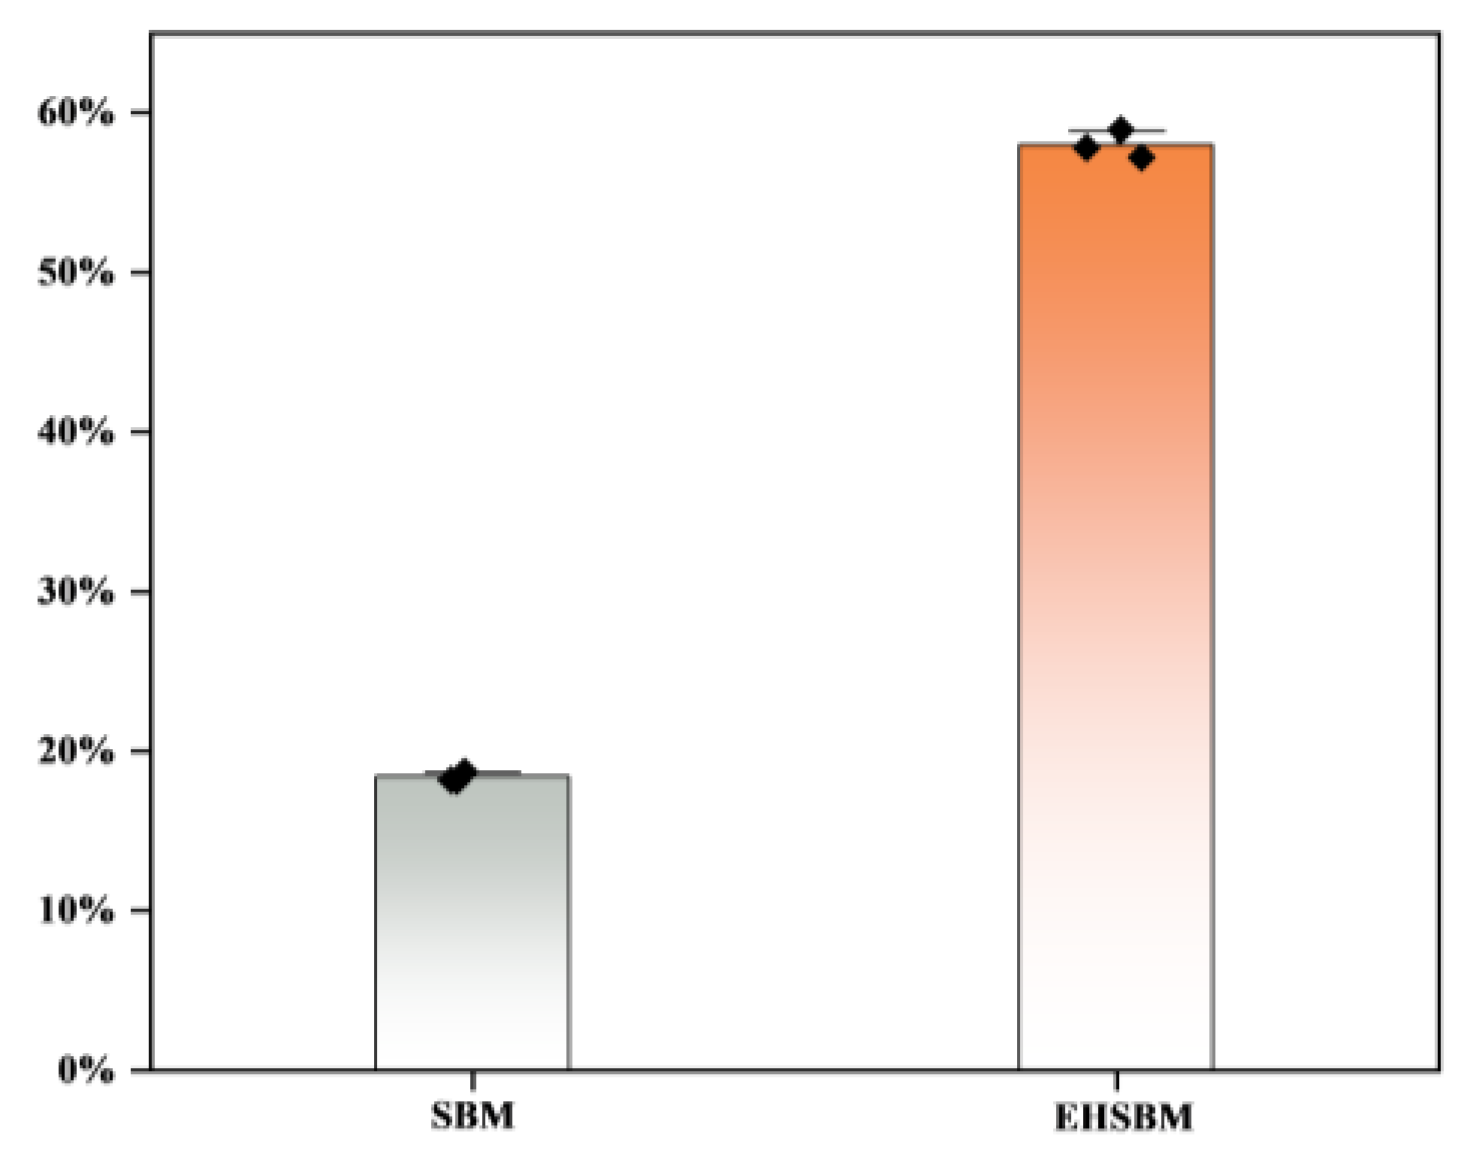
Table 1.
Factors And Levels of the Box-Behnken Test.
| Level | Factor | |||
| Enzyme Addition (%) | Temperature (℃) | Time (h) | Moisture (%) | |
| -1 | 1 | 30 | 24 | 30 |
| 0 | 1.5 | 35 | 48 | 35 |
| 1 | 2 | 40 | 72 | 40 |
Table 2.
Response Surface Design and Test Results.
| No. | Enzyme Addition (%) | Moisture (%) | Time (h) | Temperature (℃) | Small peptide(%) |
| 1 | 0 | 0 | 0 | 0 | 18.80 |
| 2 | 0 | 1 | 1 | 0 | 19.680 |
| 3 | 0 | 1 | 1 | 0 | 19.68 |
| 4 | 0 | -1 | -1 | -1 | 5.58 |
| 5 | 0 | 0 | 0 | 0 | 18.80 |
| 6 | 0 | 0 | 1 | -1 | 13.86 |
| 7 | 0 | 0 | 0 | 0 | 18.80 |
| 8 | 1 | 0 | 0 | 0 | 17.36 |
| 9 | 0 | 0 | 1 | 1 | 13.58 |
| 10 | 0 | 0 | -1 | 1 | 13.10 |
| 11 | -1 | 0 | -1 | 0 | 15.42 |
| 12 | 0 | 1 | -1 | 0 | 18.37 |
| 13 | 0 | 1 | 0 | 1 | 17.04 |
| 14 | -1 | 1 | 0 | 0 | 19.63 |
| 15 | 1 | 0 | -1 | 0 | 13.60 |
| 16 | 1 | -1 | 0 | 0 | 5.55 |
| 17 | 0 | 0 | 0 | 0 | 18.80 |
| 18 | -1 | -1 | 1 | 0 | 5.19 |
| 19 | -1 | 0 | 0 | -1 | 11.37 |
| 20 | 0 | -1 | -1 | 0 | 6.11 |
| 21 | 0 | 0 | 0 | 0 | 18.80 |
| 22 | 0 | -1 | 0 | 1 | 5.68 |
| 23 | 1 | 1 | 0 | 0 | 14.96 |
| 24 | 1 | 0 | 0 | 1 | 15.07 |
| 25 | 0 | 1 | 0 | 0 | 19.67 |
| 26 | 1 | 0 | 1 | 0 | 17.66 |
| 27 | -1 | -1 | 0 | 0 | 6.09 |
| 28 | -1 | 0 | 1 | 0 | 14.88 |
| 29 | -1 | 0 | 0 | 1 | 11.88 |
Table 3.
Variance Analysis and Significance Tests.
| Source | Sum of Squares | df | Mean Square | F-value | P | |
| Model | 703.59 | 14 | 50.26 | 32.50 | < 0.0001 | ** |
| A | 0.0709 | 1 | 0.0709 | 0.0459 | 0.8335 | |
| B | 270.48 | 1 | 270.48 | 174.90 | < 0.0001 | ** |
| C | 5.69 | 1 | 5.69 | 3.68 | 0.0756 | |
| D | 1.38 | 1 | 1.38 | 0.8911 | 0.3612 | |
| AB | 3.52 | 1 | 3.52 | 2.28 | 0.1537 | |
| AC | 4.51 | 1 | 4.51 | 2.92 | 0.1097 | |
| AD | 2.01 | 1 | 2.01 | 1.30 | 0.2735 | |
| BC | 0.0382 | 1 | 0.0382 | 0.0247 | 0.8773 | |
| BD | 2.16 | 1 | 2.16 | 1.40 | 0.2567 | |
| CD | 0.1349 | 1 | 0.1349 | 0.0872 | 0.7720 | |
| A2 | 34.97 | 1 | 34.97 | 22.61 | 0.0003 | |
| B2 | 111.30 | 1 | 111.30 | 71.97 | < 0.0001 | ** |
| C2 | 6.33 | 1 | 6.33 | 4.10 | 0.0625 | |
| D2 | 62.53 | 1 | 62.53 | 40.44 | < 0.0001 | ** |
| Residual | 21.65 | 14 | 1.55 | |||
| Lack of Fit | 21.65 | 9 | 2.41 | |||
| Pure Error | 0.0000 | 5 | 0.0000 | |||
| Total | 725.24 | 28 |
Note: *Significant, indicates P≤0.05; **Extremely significant, indicates P≤0.01.
Table 5.
Effects of Enzymatic Hydrolysis of Soybean Meal on Amino Acid Content.
| Items | SBM | EHSBM | t |
| Aspartic acid | 0.435±0.001 | 0.614±0.002 | -310.037*** |
| Threonine | 0.399±0.011 | 0.483±0.016 | -20.176** |
| Serine | 0.228±0.008 | 0.560±0.009 | -75.366*** |
| Glutamic acid | 1.311±0.015 | 1.536±0.006 | -34.997*** |
| Glycine | 0.115±0.007 | 0.169±0.004 | -8.509* |
| Alanine | 0.368±0.018 | 0.632±0.010 | -16.474** |
| Cystine | 0.775±0.029 | 1.152±0.041 | -17.385** |
| Valine | 0.120±0.023 | 0.456±0.004 | -26.149*** |
| Methionine | 0.043±0.004 | 0.111±0.002 | -44.516*** |
| Isoleucine | 0.123±0.014 | 0.277±0.001 | -13.029** |
| Leucine | 0.178±0.014 | 0.535±0.008 | -29.214*** |
| Tyrosine | 0.325±0.026 | 2.320±0.016 | -131.493*** |
| Phenylalanine | 0.229±0.004 | 1.862±0.037 | -84.071*** |
| Histidine | 0.140±0.009 | 0.178±0.006 | -6.588* |
| Lysine | 0.143±0.007 | 0.408±0.011 | -90.963*** |
| Arginine | 0.929±0.007 | 1.253±0.005 | -46.286*** |
| Essential Amino Acid | 2.631±0.014 | 7.883±0.017 | -375.143*** |
| Non-Essential Amino Acid | 3.231±0.016 | 4.663±0.038 | -83.754*** |
| E/N | 0.814±0.001 | 1.691±0.017 | -92.228*** |
| Total | 5.862±0.030 | 12.546±0.022 | -524.938*** |
Note: *** indicates extremely significant differences (P≤0.001); ** indicates highly significant differences (0.001<P≤0.01); * indicates significant differences (0.01<P≤0.05).
Disclaimer/Publisher’s Note: The statements, opinions and data contained in all publications are solely those of the individual author(s) and contributor(s) and not of MDPI and/or the editor(s). MDPI and/or the editor(s) disclaim responsibility for any injury to people or property resulting from any ideas, methods, instructions or products referred to in the content. |
© 2026 by the authors. Licensee MDPI, Basel, Switzerland. This article is an open access article distributed under the terms and conditions of the Creative Commons Attribution (CC BY) license (http://creativecommons.org/licenses/by/4.0/).
Copyright: This open access article is published under a Creative Commons CC BY 4.0 license, which permit the free download, distribution, and reuse, provided that the author and preprint are cited in any reuse.


