Submitted:
13 January 2026
Posted:
13 January 2026
You are already at the latest version
Abstract
Swimming crab (Portunus trituberculatus) is a commercially valuable species in the Yellow Sea, where recent fluctuations in resource levels have raised concerns about sustainable management. This study aimed to enhance the estimation of the carapace length at 50% maturity (L₅₀) through machine learning techniques, offering a more objective alternative to traditional visual inspection. Using geometric image augmentation (e.g., rotation, flipping, brightness adjustment), Hue-Saturation-Value (HSV) color segmentation, and algorithms such as Extreme Gradient Boosting (XGB), Support Vector Machine (SVM), Random Forest (RF), and ensemble models, we classified the maturity of female crabs based on gonad color features. Model performance was evaluated using Accuracy, AUC, and TSS, with the ensemble model showing the highest predictive capability. The machine learning-based L₅₀ was estimated at 64.63 mm (±1.73 mm), which was more precise than the visually derived L₅₀ of 65.47 mm (±2.89 mm). These results suggest that machine learning techniques can serve as reliable tools for developing science-based management strategies, ultimately supporting sustainable fisheries resource management.
Keywords:
length at first maturity
; swimming crab
; fisheries management
; machine learning
; Geometric augmentation
; HSV
1. Introduction
Swimming crab (Portunus trituberculatus) belongs to the phylum Arthropoda, Malacostraca, order Decapoda, and family Portunidae. This species exhibits seasonal migratory behavior, moving to shallow coastal waters to spawn and grow. It plays an essential role not only in the coastal ecosystem as a key component of the marine food web, but also in regional economies as a major target of coastal fisheries [1]. The Yellow Sea of Korea, with its wide tidal flats and productive estuarine environment, serves as a crucial habitat for the life cycle of this species, functioning as a primary spawning and nursery ground [2,3,4].
In South Korea, the catch of swimming crab (Portunus trituberculatus) in the Yellow Sea has shown a notable decline since 2011, following a recorded harvest of 14,077 tons in 2010. Recent annual catches were 4,500 tons in 2020, 7,565 tons in 2021, 7,473 tons in 2022, 7,373 tons in 2023, and 4,049 tons in 2024 [6]. Previous studies on this species have focused on survival and post-release behavior [7,8], spatial distribution and abundance along the western coastal waters [9], and genetic diversity [10,11,12]. Research on reproductive biology has also been conducted, including studies on gonadal maturity and spawning characteristics [13]. However, studies specifically addressing the maturity characteristics of female crabs, which are crucial for understanding the population structure and life cycle, remain limited. Such information is essential, as biological indicators such as length at first maturity and timing of spawning play a critical role in designing resource management strategies, including seasonal protection zones and size-based harvesting regulations [14,15,16].
Accurate discrimination of reproductive maturity has traditionally relied on macroscopic methods and histological methods. Although macroscopic methods are simple and cost-effective direct observation techniques, they are often criticized for their low accuracy and frequent confusion between similar maturity stages, due to their heavy reliance on the subjective judgment of the observer [17,18]. Histological methods, on the other hand, enable more reliable determination of maturity stages [19], although they are also noted for requiring considerable time and cost [20,21].
Recent machine learning techniques have shown high performance in analyzing biological data and estimating patterns [22,23], and there has been research using machine learning in the field of fisheries [24]. Studies involving geometric data enhancement, HSV (Hue, Saturation, Value) color analysis, and machine learning techniques include relieving color variation in multi-pathology slide classification [25], combination effect analysis [26], case study on fisheries resource management in the Korean coastal region using machine learning [24] and fish maturity prediction using machine learning [27].
Based on these previous studies, this study aims to determine the maturity of swimming crab (Portunus trituberculatus) in the Yellow Sea near Incheon and estimate the maturity length by combining geometric image augmentation, HSV-based gonad color analysis, and machine learning techniques. This approach is expected to contribute to the development of fisheries resource management policies by improving the accuracy of size-based management and reinforcing the scientific foundation of sustainable fisheries.
2. Materials and Methods
2.1. Data Collection and Configuration
The dataset used in this study consisted of morphological measurements and gonad images collected from a total of 3,422 swimming crabs (Portunus trituberculatus) sampled from the coastal waters of Incheon, South Korea, between January 2023 and December 2024. The sampled individuals were sexed and measured for carapace length (CL) and carapace width (CW) to the nearest 0.01 mm using digital vernier calipers (Mitutoyo Co., Kawasaki, Japan). Body weight (BW) and gonad weight (GW) were recorded to the nearest 0.01 g. Gonad images were obtained with smartphone cameras and maturity stages were assigned by macroscopic observation based on gonad size, color, and oocyte characteristics.
For machine-learning analyses, only image-derived features were used as predictors; morphometric measurements (CL, CW, BW, GW) were recorded for biological context but not included as inputs to the classifiers. Labeled images (mature vs. immature) were randomly split into 80% for training and 20% for internal validation. In addition, an independent external test set comprising images collected in 2024 (months selected based on GSI patterns) was prepared and used to report final generalization performance metrics (Accuracy, AUC, TSS). This external set was not used for model training or threshold selection.
2.2. Data Analysis Tools
Data analysis was conducted using Python 3.10, primarily within the Visual Studio Code (Microsoft, USA) development environment and Jupyter Notebook. Image preprocessing, HSV (Hue, Saturation, Value) color space conversion, and ROI (Region of Interest) extraction were performed using the OpenCV package (version 4.5.5). In addition, OpenAI’s ChatGPT (GPT-4-based interactive prompt) was used as a supplementary tool throughout the experimental design and analysis process. ChatGPT assisted with repeated coding tasks such as syntax checks for Python-based code, error debugging, implementation of data visualization functions, and suggestions for analytical strategies.
2.3. Data Pretreatment and Feature Extraction
To ensure diversity of the training data and reduce overfitting, we applied geometric data augmentation to training images: random small-angle rotation within [−15°, +15°], random horizontal or vertical flipping (or none), scaling with a factor in [0.8, 1.2], random translation up to ±10% of image width/height, and random cropping of 5–15% followed by bicubic resizing to the original size. To preserve biologically relevant color information, no brightness jitter or Gaussian noise was applied.
For isolating the orange gonad region, we generated a binary mask in HSV space following OpenCV’s convention (H ∈ [0,180], S, V ∈ [0,255]). Pixels were retained if H ∈ [5,25], S ∈ [80,255], and V ∈ [50,255]. The mask was refined with one erosion followed by one dilation using a 3×3 kernel to remove small artifacts and merge adjacent components.
Within the masked ROI, we computed mean H, S, and V and additionally a normalized 10-bin histogram of the H channel (covering H ∈ [0,180]). The final feature vector for each image therefore consisted of [H_MEAN, S_MEAN, V_MEAN] plus a 10-bin Hue histogram, which was used to classify maturity stages and to support the estimation of the 50% maturity length (L₅₀).
2.4. Machine Learning Model Training and Evaluation
Using the features derived from preprocessing and augmentation, we performed binary classification of gonad maturity (mature = 1, immature = 0). Three algorithms—Extreme Gradient Boosting (XGBoost), Support Vector Machine (SVM, with probability outputs enabled), and Random Forest (RF)—were applied, and a soft-voting ensemble that averages the predicted class probabilities was additionally constructed to compare performance.
During training, initial models for each algorithm were fitted on the training dataset (80%), and stratified k-fold cross-validation was used to search and optimize hyperparameters. The optimal models were selected by combining cross-validation results with performance on the internal validation dataset (20%). The ensemble’s binary decision threshold was then selected on the internal validation dataset by scanning 0.00–1.00 in 0.01 increments and choosing the value that maximized TSS. With the model and threshold fixed, final generalization performance was evaluated on an independent external test dataset (2024 images).
Classification performance was assessed using Accuracy, Area Under the ROC Curve (AUC), and True Skill Statistic (TSS). Accuracy, defined as the proportion of correctly classified samples, is
Accuracy= (TP+TN)/(TP+TN+FP+FN)
AUC is the area under the ROC curve computed from predicted probabilities, representing the integral of the true-positive rate (TPR) with respect to the false-positive rate (FPR) across thresholds [28]:
TPR is defined as the True Positive Rate, and FPR as the False Positive Rate, respectively.
The True Skill Statistic (TSS) is a metric that considers both sensitivity (True Positive Rate, TPR) and specificity (True Negative Rate, TNR) and is calculated by subtracting the false positive rate from the sensitivity. TSS values range from –1 to 1, where values closer to 1 indicate higher predictive performance of the model [29].
In this study, the final model was selected based on a composite performance score, which was calculated using the accuracy, AUC, and TSS values obtained from the independent test data. The final score was determined by assigning a weight of 20% to accuracy, 40% to AUC, and 40% to TSS, as defined by the following formula:
The model that achieved the highest final score was selected as the optimal model for this study.
2.5. GSI (Gonadosomatic Index)
To estimate the spawning season of female swimming crabs (Portunus trituberculatus) in the Yellow Sea near Incheon, the monthly changes in the Gonadosomatic Index (GSI) were calculated using the following equation:
where GW is the gonad weight (moist weight, g), and BW is the body weight (moist weight, g).
2.6. Logistic Regression for L₅₀ Estimating
To estimate the 50% maturity length (L₅₀) of female swimming crabs (Portunus trituberculatus) in the Yellow Sea near Incheon, logistic regression analysis was performed using maturity data in relation to carapace length (CL). The analysis was conducted separately for maturity data derived from visual identification and from machine learning-based classification, both determined through GSI assessment. The logistic regression model used is as follows:
represents the probability that an individual is mature at a given carapace length (CL), and L₅₀ is the parameter indicating the carapace length at which 50% of the population is expected to be mature, serving as the inflection point of the logistic curve. In this study, the standard error (SE) and the 95% confidence interval (95% CI) of the estimated L₅₀ were calculated using the bootstrap method. The bootstrap approach involved 1,000 resampling iterations with replacement, and the distribution of L₅₀ estimates derived from logistic regression was used to compute the confidence intervals [30].
3. Results
3.1. Data Pretreatment and Feature Extraction Results
In this study, geometric augmentation was first applied to generate approximately 2,000 augmented images to enhance the diversity of the original dataset (Figure 1). Subsequently, the gonad region in each processed image was extracted using binary masking based on HSV color information (Figure 2). The area marked in red was designated as the actual ROI (Region of Interest) used for analysis (Figure 3). Based on these results, HSV (Hue, Saturation, Value) threshold values were defined for each maturity stage, as summarized in Table 1. Immature individuals showed an HSV range of H = 15–18, S = 120–145, and V = 110–125, whereas mature individuals exhibited H = 14–17, S = 170–187, and V = 135–141.
3.2. Machine Learning Model Training and Evaluation Results
Based on the results of gonad color analysis, four different machine learning algorithms were trained and evaluated for performance. Figure 4 shows the Receiver Operating Characteristic (ROC) curves for each model.
The ensemble model demonstrated the best performance, maintaining a significantly higher true positive rate with a lower false positive rate compared to the other models. The AUC of the ensemble model was the highest at 0.99, followed by SVM (0.93), XGBoost (0.90), and Random Forest (0.88). These quantitative results are summarized in Table 2.
The ensemble model achieved the highest values across all metrics, with an accuracy of 0.97, AUC of 0.99, and TSS of 0.94, resulting in the highest final score of 0.97. Although SVM showed a relatively high AUC (0.93), its TSS was low (0.70), leading to a lower final score of 0.82. Therefore, the soft voting ensemble model was selected as the final classification model in this study.
3.3. GSI Estimation Results
The GSI slightly decreased to 4.63, then increased to 6.31 in July. From August onward, it declined sharply, dropping to 0.98 in August, 1.76 in September, and 1.43 in October. In November and December, the GSI showed a slight increase again, reaching 3.12 and 3.55, respectively (Figure 5.).
3.4. Estimating Length at First Maturity Results
A logistic regression analysis was conducted to estimate the length at first maturation (L₅₀), and the results are summarized in Table 3. Figure 6. presents logistic curves based on the maturity ratios derived from (a) macroscopic and (b) the machine learning ensemble model. The L₅₀ estimated from visual observation was 65.47 mm (standard error ± 2.89 mm; 95% confidence interval: 59.81–71.13 mm), while the L₅₀ estimated using the ensemble model was 64.63 mm (standard error ± 1.73 mm; 95% confidence interval: 61.25–68.02 mm).
4. Discussion
In this study, four machine learning classification algorithms (XGBoost, SVM, Random Forest and an ensemble model) were trained using features derived from geometric augmentation and HSV (Hue, Saturation, Value) color space transformation. The experimental workflow is illustrated in Figure 7.
There are also various augmentation techniques through color transformation, random cropping (Crop), and generative model (GAN), but the geometric augmentation techniques utilized in this study play a key role in increasing the training data in balance by varying the spatial structure of images and increasing the training efficiency of models, and preventing overfitting and improving the performance of models by artificially expanding the size and diversity of training data [31,32,33]. Prior studies in hand gesture recognition and video classification have also demonstrated the effectiveness of geometric augmentation in improving CNN performance and robustness under varying conditions [33]. This highlights its applicability in biological image processing where labeled data is often limited. The HSV (Hue, Saturation, Value) color space was chosen due to its closer alignment with human color perception and its robustness under changes in lighting conditions [34,35,36]. Unlike RGB or CMY models, HSV separates chromatic content from intensity, making it suitable for identifying biological structures such as gonads. In this study, the immature gonads exhibited a color range of H = 15–18, S = 120–145, and V = 110–125, while mature gonads showed a shift toward H = 14–17, S = 170–187, and V = 135–141. These findings are consistent with previous reports indicating that gonads tend to become more vivid and darker orange in color as maturity progresses, reflecting lower hue values and increases in saturation and brightness [37,38]. Among the classification models tested, the soft voting ensemble model achieved the highest predictive performance, with an AUC of 0.99, and was selected as the final model. Ensemble learning techniques such as soft voting integrate probabilistic predictions from multiple classifiers to reduce variance and bias while enhancing generalization [39]. Compared to hard voting and weighted voting, soft voting is particularly effective when handling uncertain or noisy biological data, as it averages decision probabilities rather than discrete class outputs [40]. Prior studies have reported that soft voting ensemble models enhance reliability, reduce prediction error, and provide more stable outputs across datasets [41,42,43,44,45].
By integrating HSV-based color features and geometric augmentation, this study effectively trained robust classifiers for maturity prediction in swimming crabs. These findings support the applicability of ensemble models in biological image classification tasks, especially when data is complex and class boundaries are visually subtle. The methodology presented here may be extended to other fisheries applications where reliable and automated maturity classification is required.
Based on the GSI analysis conducted in this study, the monthly variation of the GSI in swimming crabs (Portunus trituberculatus) inhabiting the Yellow Sea near Incheon showed a rapid increase from March, reaching its peak in April, and maintaining a relatively high level until July. Based on this trend, the spawning period of female swimming crabs in the Yellow Sea near Incheon was estimated to range from March to July. Previous studies suggest that the spawning period may vary depending on the region, but generally, the spawning season of swimming crabs is estimated to occur from May to Augus [46]. In a study that estimated the spawning period of swimming crabs on the Yellow Sea based on three consecutive years of survey data, the main spawning season was estimated to be from April to July [47]. The results of this study were similar to those of previous research. The spawning period of crustaceans is greatly influenced by environmental factors such as water temperature, photo period, and salinity [48,49,50]. However, since most previous studies were based on one-year observations, it is deemed necessary to conduct multi-year variation analyses based on long-term data, such as the study by Oh, 2001.
The estimation of length at first maturity (L₅₀) serves as a key indicator in the assessment and management of fisheries resources, and accurate determination of maturity is essential. Traditional macroscopic methods are prone to subjective variability between observers, while histological methods provide higher accuracy but are limited by high time and cost requirements. In contrast, the machine learning-based classification technique proposed in this study offers a more objective, rapid, and cost-efficient approach for maturity assessment.
In this study, the L₅₀ estimated using the machine learning ensemble model was 64.63 mm (standard error ± 1.73 mm; 95% confidence interval: 61.25–68.02 mm), which showed a lower standard error and narrower confidence interval compared to the macroscopic method, which yielded an L₅₀ of 65.47 mm (standard error ± 2.89 mm; 95% confidence interval: 59.81–71.13 mm). Notably, the machine learning-based L₅₀ was closely aligned with the Korean legal minimum size limit for blue crab harvesting, which prohibits the capture of individuals smaller than 6.4 cm. These findings suggest that machine learning classification models can provide more reliable and policy-relevant estimates of maturity length.
As a limitation, this study did not incorporate histological maturity data for model training or direct comparison with histology-based L₅₀ results. Future research should consider including histological data to further enhance the accuracy of the algorithm and validate this approach through comparative analysis with conventional methods.
In this study, ChatGPT, a generative artificial intelligence model developed by OpenAI, was employed as a research assistant throughout various stages of the research process. It was utilized for code implementation, syntax checking of Python-based scripts, error debugging, data visualization, and interpretation of results. In particular, it proved helpful in enhancing productivity and generating creative ideas during complex code development, experimental design brainstorming, and scientific writing. As such, generative AI has the potential to increase efficiency in repetitive tasks, reduce the workload of researchers, and contribute to the overall advancement of research productivity [51]. However, responses generated by AI models are not always factually accurate and may carry biases, especially in underrepresented fields or minority datasets, due to limitations in training data [52,53]. Therefore, in this study, ChatGPT was regarded as a thinking support tool rather than a conclusive source of results. Its use was premised on rigorous verification of outputs and final interpretation by human experts. Moving forward, the development of robust information verification systems will be essential to ensure the responsible and effective integration of generative AI tools in scientific research.
Author Contributions
Conceptualization, Kim; methodology, Kim; software, Kwon; validation, Kim, Lee and Kwon; formal analysis, Kim and Lee; investigation, Kim; resources, Kim; data curation, Kim; writing—original draft preparation, Kim; writing—review and editing, Kim, Lee and Kwon; visualization, Kim; supervision, Lee; project administration, Lee. All authors have read and agreed to the published version of the manuscript.
Funding
The author(s) disclosed receipt of the following financial support for the research, authorship, and publication of this article. This work was supported by the Division of Fisheries Resources and Environmental Research, West Sea Fisheries Research(R2025010).
Data Availability Statement
The datasets generated and/or analysed during the current study are not publicly available due to institutional restrictions but are available from the corresponding author upon reasonable request. The data analysis code is available from the corresponding author upon reasonable request.
Acknowledgments
This study was supported by the Division of Fisheries Resources and Environmental Research, West Sea Fisheries Research Institute. The author would like to express sincere gratitude to the staff of the West Sea Fisheries Research Institute for their assistance in the experiments, and to Dr. Jae-bong Lee for their contributions to improving the clarity and readability of the manuscript. All necessary permissions for the use of the experimental site were obtained from the Division of Fisheries Resources and Environmental Research, West Sea Fisheries Research Institute prior to the experiments. During the preparation of this manuscript, the authors used ChatGPT (OpenAI, GPT-5.1) for language editing, text refinement, and improving clarity of the manuscript. The authors have reviewed and edited the generated content and take full responsibility for the final version of the publication.
Conflicts of Interest
The authors declare no conflicts of interest.
References
- Kwon, H. K.; Kwon, N.; Cho, Y. K.; Hwang, J.; Choi, Y.; Lim, W. A.; Kim, G. Difference in nutritional status and food sources for hard-and soft-shell crabs (Portunus trituberculatus) using amino acids and isotopic tracers. Scientific Reports 2025, 15(1), 15694. [Google Scholar] [CrossRef] [PubMed]
- Sakai, T. Studies on the crabs of Japan. IV. Brachygnatha, Brachyrhyncha; Tokyo, 1939; p. 741 pp. + plates. [Google Scholar]
- Kim, HS. Illustrated Encyclopedia of Fauna and of Korea; 1973; Volume 14, p. 1~289. [Google Scholar]
- Dai, A; Yang, S. Crabs of the China Seas; China Ocean Press Bijing, 1991; p. 682. [Google Scholar]
- Pyen, CK. Propagation of the blue crab, Portunus trituberculatus(Miers). Bull. Korean Fish. Soc. 1970, 3(3), 187~198. [Google Scholar]
- KOSIS(Korean Statistical Information Service). Fishery Production Survey. 2025. Available online: http://kosis.kr.
- Kang, JC; Song, JC; Chin, P. Combined Effects of hypoxia and hydrogen sulfide on survival, feeding activity and metabolic rate of blue crab, Portunus trituberculatus. Journal of the Korean Fisheries Society 1995, 28(5), 549~556. [Google Scholar]
- An, Y. K.; Choi, S. M.; Choi, S. D.; Yoon, H. S. A Characteristics of Biological Resources of Portunus trituberculatus (Miers, 1876) around the Chilsan Inland Younggwang, Korea. Journal of the Korean Society of Marine Environment & Safety 2012, 18(2), 115–122. [Google Scholar] [CrossRef]
- KOH, Su-Jin; YOUN, Byeong-Il; LEE, Seung-Hwan; KOO, Ja-Geun; KIM, Maeng-Jin. Distribution and Occurrence of Swimming Crab, Portunus trituberculatus Larvae in the Western water Coast of Korea. THE JOURNAL OF FISHERIES AND MARINE SCIENCES EDUCATION 2022, 34(5), 731–739. [Google Scholar] [CrossRef]
- Kim, SB; Yoo, BS; Lee, KS. Studies on the CNBr - peptide of Portunus trituberculatus hemocyanin. Biochemistry and Molecular Biology Reports 1989, 22(2), 113~117. [Google Scholar]
- Yeon, IJ; Song, MY; Shon, MH; Hwang, HJ.; Im, YJ. Possible new management measures for stock rebuilding of blue crab, Portunus trituberculatus (Miers), in western korean waters. proceedings of Korean Applied Industrial Sciences 2010, 5(2), 35. [Google Scholar]
- Yoon, JM. Genetic differences and variations in freshwater crab (Eriocheir sinensis) and swimming crab (Portunus trituberculatus). development and Reproduction 2006, 10(1), 19~32. [Google Scholar]
- Seo, H. C.; Jang, I. K.; Cho, Y. R.; Kim, J. S.; Kim, B. R. Gonad maturation and spawning of the bluecrab, Portunus trituberculatus (Miers, 1876) from the West Sea of Korea. Korean journal of Fisheries and aquatic sciences 2009, 42(1), 48–55. [Google Scholar] [CrossRef]
- Trippel, E. A.; Harvey, H. H. Comparison of methods used to estimate age and length of fishes at sexual maturity using populations of white sucker (Catostomus commersoni). Canadian Journal of Fisheries and Aquatic Sciences 1991, 48(8), 1446–1459. [Google Scholar] [CrossRef]
- Trippel, E. A. Age at maturity as a stress indicator in fisheries. Bioscience 1995, 45(11), 759–771. [Google Scholar] [CrossRef]
- Lowerre-Barbieri, S. K.; Ganias, K.; Saborido-Rey, F.; Murua, H.; Hunter, J. R. Reproductive timing in marine fishes: Variability, temporal scales, and methods. Mar. Coast. Fish. 2011b, 3, 71–91. [Google Scholar] [CrossRef]
- West, G. Methods of assessing ovarian development in fishes: a review. Marine and freshwater research 1990, 41(2), 199–222. [Google Scholar] [CrossRef]
- Tomkiewicz, J.; Tybjerg, L.; Jespersen, Å. Micro-and macroscopic characteristics to stage gonadal maturation of female Baltic cod. Journal of fish biology 2003, 62(2), 253–275. [Google Scholar] [CrossRef]
- Saborido-Rey, F.; Junquera, S. Histological assessment of variations in sexual maturity of cod (Gadus morhua L.) at the Flemish Cap (north-west Atlantic). ICES Journal of Marine Science 1998, 55(3), 515–521. [Google Scholar] [CrossRef]
- Frey, P. H.; Head, M. A.; Keller, A. A. Maturity and growth of darkblotched rockfish, Sebastes crameri, along the US west coast. Environmental Biology of Fishes 2015, 98, 2353–2365. [Google Scholar] [CrossRef]
- Head, M. A.; Cope, J. M.; Wulfing, S. H. Applying a flexible spline model to estimate functional maturity and spatio-temporal variability in aurora rockfish (Sebastes aurora). Environmental Biology of Fishes 2020, 103, 1199–1216. [Google Scholar] [CrossRef]
- Gladju, J.; Kamalam, B. S.; Kanagaraj, A. Applications of data mining and machine learning framework in aquaculture and fisheries: A review. Smart Agricultural Technology 2022, 2, 100061. [Google Scholar] [CrossRef]
- Rubbens, P.; Brodie, S.; Cordier, T.; Destro Barcellos, D.; Devos, P.; Fernandes-Salvador, J. A.; Irisson, J. O. Machine learning in marine ecology: an overview of techniques and applications. ICES Journal of Marine Science 2023, 80(7), 1829–1853. [Google Scholar] [CrossRef]
- Kang, H.; Yoon, S. C. Enhancing Length at First Maturity Estimation Using Machine Learning for Fisheries Resource Management: A Case Study on Small Yellow Croaker (Larimichthys polyactis) in South Korea. Fishes (MDPI AG) 2024, 9(10). [Google Scholar] [CrossRef]
- Tellez, D.; Litjens, G.; Bándi, P.; Bulten, W.; Bokhorst, J. M.; Ciompi, F.; Van Der Laak, J. Quantifying the effects of data augmentation and stain color normalization in convolutional neural networks for computational pathology. Medical image analysis 2019, 58, 101544. [Google Scholar] [CrossRef] [PubMed]
- Perez, F.; Avila, S.; Valle, E. Solo or ensemble? choosing a cnn architecture for melanoma classification. In Proceedings of the IEEE/CVF conference on computer vision and pattern recognition workshops, 2019; pp. 0–0. [Google Scholar]
- Flores, A.; Wiff, R.; Donovan, C. R.; Gálvez, P. Applying machine learning to predict reproductive condition in fish. Ecological Informatics 2024, 80, 102481. [Google Scholar] [CrossRef]
- Hanley, J. A.; McNeil, B. J. The meaning and use of the area under a receiver operating characteristic (ROC) curve. Radiology 1982, 143(1), 29–36. [Google Scholar] [CrossRef] [PubMed]
- Allouche, O.; Tsoar, A.; Kadmon, R. Assessing the accuracy of species distribution models: prevalence, kappa and the true skill statistic (TSS). Journal of applied ecology 2006, 43(6), 1223–1232. [Google Scholar] [CrossRef]
- Efron, B. T.; Tibshirani, R. J. An Introduction to the Bootstrap; Chapman & HallHall. CRC Monographs on Statistics & Applied Probability: New York, NY, 1994. [Google Scholar]
- Shorten, C.; Khoshgoftaar, T. M. A survey on image data augmentation for deep learning. Journal of big data 2019, 6(1), 1–48. [Google Scholar] [CrossRef]
- Khoh, W. H.; Pang, Y. H.; Teoh, A. B. J.; Ooi, S. Y. In-air hand gesture signature using transfer learning and its forgery attack. Applied Soft Computing 2021, 113, 108033. [Google Scholar] [CrossRef]
- Awaluddin, B. A.; Chao, C. T.; Chiou, J. S. Investigating Effective Geometric Transformation for Image Augmentation to Improve Static Hand Gestures with a Pre-Trained Convolutional Neural Network. Mathematics 2023. [Google Scholar] [CrossRef]
- Du, C. J.; Sun, D. W. Comparison of three methods for classification of pizza topping using different colour space transformations. Journal of food engineering 2005, 68(3), 277–287. [Google Scholar] [CrossRef]
- Chaves-González, J. M.; Vega-Rodríguez, M. A.; Gómez-Pulido, J. A.; Sánchez-Pérez, J. M. Detecting skin in face recognition systems: A colour spaces study. Digital signal processing 2010, 20(3), 806–823. [Google Scholar] [CrossRef]
- Ruiz-Ruiz, G.; Gómez-Gil, J.; Navas-Gracia, L. M. Testing different color spaces based on hue for the environmentally adaptive segmentation algorithm (EASA). Computers and Electronics in Agriculture 2009, 68(1), 88–96. [Google Scholar] [CrossRef]
- Sudana, O.; Witarsyah, D.; Putra, A.; Raharja, S. Mobile application for identification of coffee fruit maturity using digital image processing. International Journal on Advanced Science, Engineering and Information Technology 2020, 10(3), 980–986. [Google Scholar] [CrossRef]
- Saha, K. K.; Rahman, A.; Moniruzzaman, M.; Syduzzaman, M.; Uddin, M. Z.; Rahman, M. M.; Oliver, M. M. H. Classification of starfruit maturity using smartphone-image and multivariate analysis. Journal of Agriculture and Food Research 2023. [Google Scholar] [CrossRef]
- Rai, N.; Kaushik, N.; Kumar, D.; Raj, C.; Ali, A. Mortality prediction of COVID-19 patients using soft voting classifier. International Journal of Cognitive Computing in Engineering 2022, 3, 172–179. [Google Scholar] [CrossRef]
- Jani, R.; Shanto, M. S. I.; Kabir, M. M.; Rahman, M. S.; Mridha, M. F. Heart disease prediction and analysis using ensemble architecture. 2022 International Conference on Decision Aid Sciences and Applications (DASA), 2022, March; IEEE; pp. 1386–1390. [Google Scholar] [CrossRef]
- Nahar, N.; Ara, F.; Neloy, M. A. I.; Barua, V.; Hossain, M. S.; Andersson, K. A comparative analysis of the ensemble method for liver disease prediction. 2019 2nd international conference on innovation in engineering and technology (ICIET), 2019, December; IEEE; pp. 1–6. [Google Scholar] [CrossRef]
- Saqlain, M.; Jargalsaikhan, B.; Lee, J. Y. A voting ensemble classifier for wafer map defect patterns identification in semiconductor manufacturing. IEEE Transactions on Semiconductor Manufacturing 2019, 32(2), 171–182. [Google Scholar] [CrossRef]
- Mahajan, P.; Uddin, S.; Hajati, F.; Moni, M. A. Ensemble learning for disease prediction: A review. In Healthcare; MDPI, June 2023; Vol. 11, No. 12. [Google Scholar] [CrossRef]
- Chhillar, I.; Singh, A. An improved soft voting-based machine learning technique to detect breast cancer utilizing effective feature selection and SMOTE-ENN class balancing. Discover Artificial Intelligence 2025, 5(1), 4. [Google Scholar] [CrossRef]
- Zhou, Z. H. Ensemble methods: foundations and algorithms; CRC press, 2025. [Google Scholar]
- Yeon, I. J. Fishery biology of the blue crab, Portunus trituberculatus (Miers), in the West Sea of Korea and the East China Sea. Unpublished Doctoral dissertation, Pukyong National University. Korea, 1997. [Google Scholar]
- Oh, C. W. Population biology of the swimming crab Portunus trituberculatus (Miers, 1876)(Decapoda, Brachyura) on the western coast of Korea, Yellow Sea. Crustaceana 2011, 84(10). [Google Scholar]
- Aiken, D. E.; Waddy, S. L. Interaction of temperature and photoperiod in the regulation of spawning by American lobsters (Homarus americanus). Canadian Journal of Fisheries and Aquatic Sciences 1989, 46(1), 145–148. [Google Scholar] [CrossRef]
- Waddy, S. L.; Aiken, D. E. Seasonal variation in spawning by preovigerous American lobster (Homarus americanus) in response to temperature and photoperiod manipulation. Canadian Journal of Fisheries and Aquatic Sciences 1992, 49(6), 1114–1117. [Google Scholar] [CrossRef]
- Laufer, H.; Ahl, J. S.; Sagi, A. The role of juvenile hormones in crustacean reproduction. American Zoologist 1993, 33(3), 365–374. [Google Scholar] [CrossRef]
- Noy, S.; Zhang, W. Experimental evidence on the productivity effects of generative artificial intelligence. Science 2023, 381(6654), 187–192. [Google Scholar] [CrossRef]
- Sallam, M. ChatGPT utility in healthcare education, research, and practice: systematic review on the promising perspectives and valid concerns. In Healthcare; MDPI, March 2023; Vol. 11, No. 6. [Google Scholar] [CrossRef]
- van Dis, E. A.; Bollen, J.; Zuidema, W.; van Rooij, R.; Bocking, C. L. ChatGPT: five priorities for research. Nature. 2023. Available online: https://www.nature.com/articles/d41586-023-00288-7.
Figure 1.
Results of geometric augmentation applied to gonad image of swimming crab.
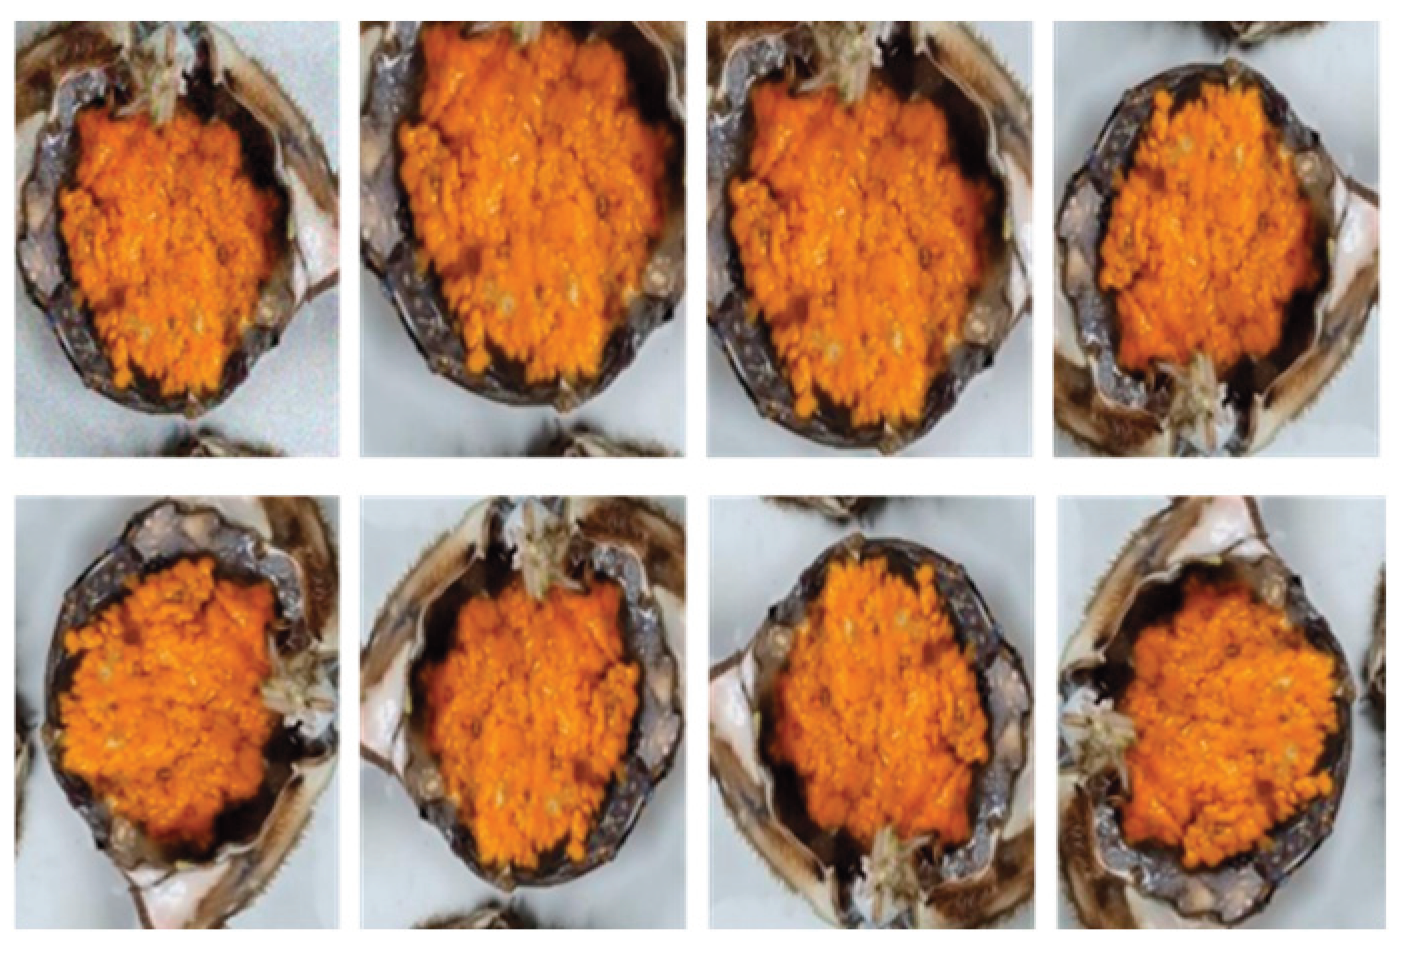
Figure 2.
Binary mask processing for ROI (Region of interest) extraction.
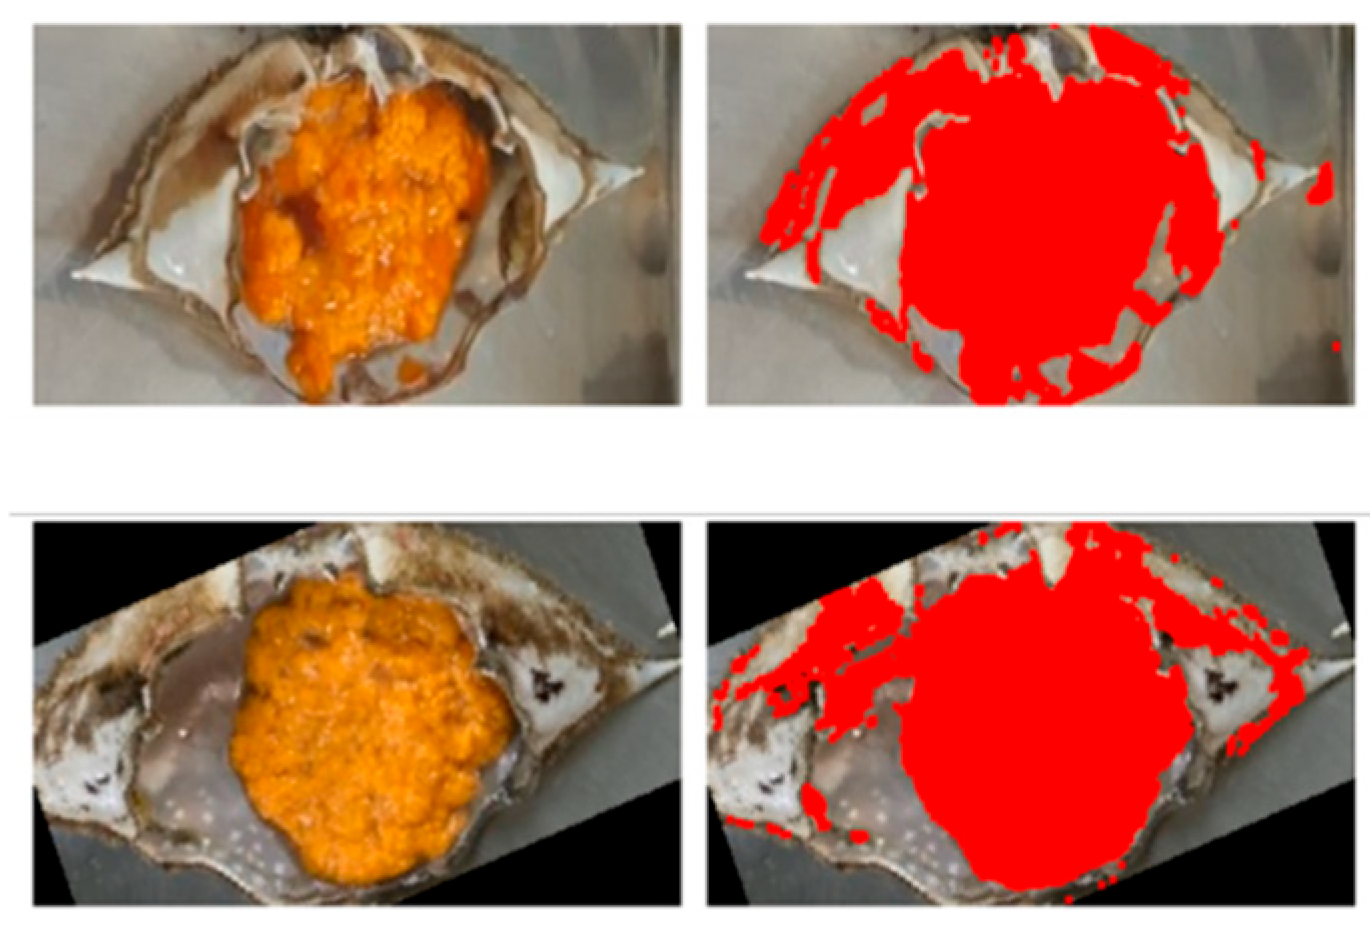
Figure 3.
Region of interest (ROI) marked in red after binary mask processing for gonad segmentation.
Figure 3.
Region of interest (ROI) marked in red after binary mask processing for gonad segmentation.
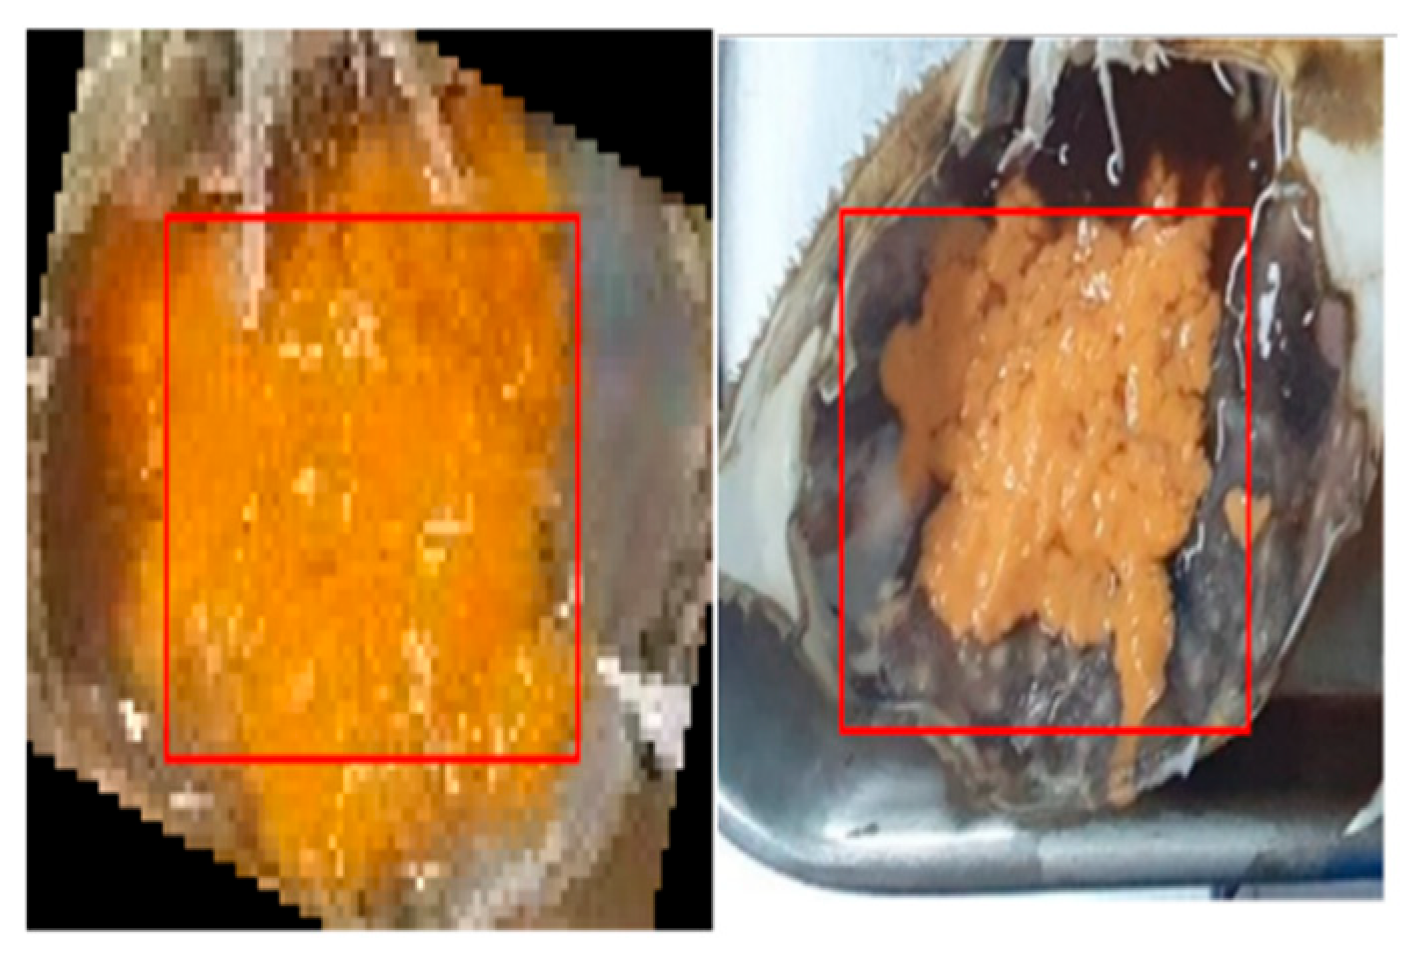
Figure 4.
ROC (Receiver Operating Characteristic) curve comparison.
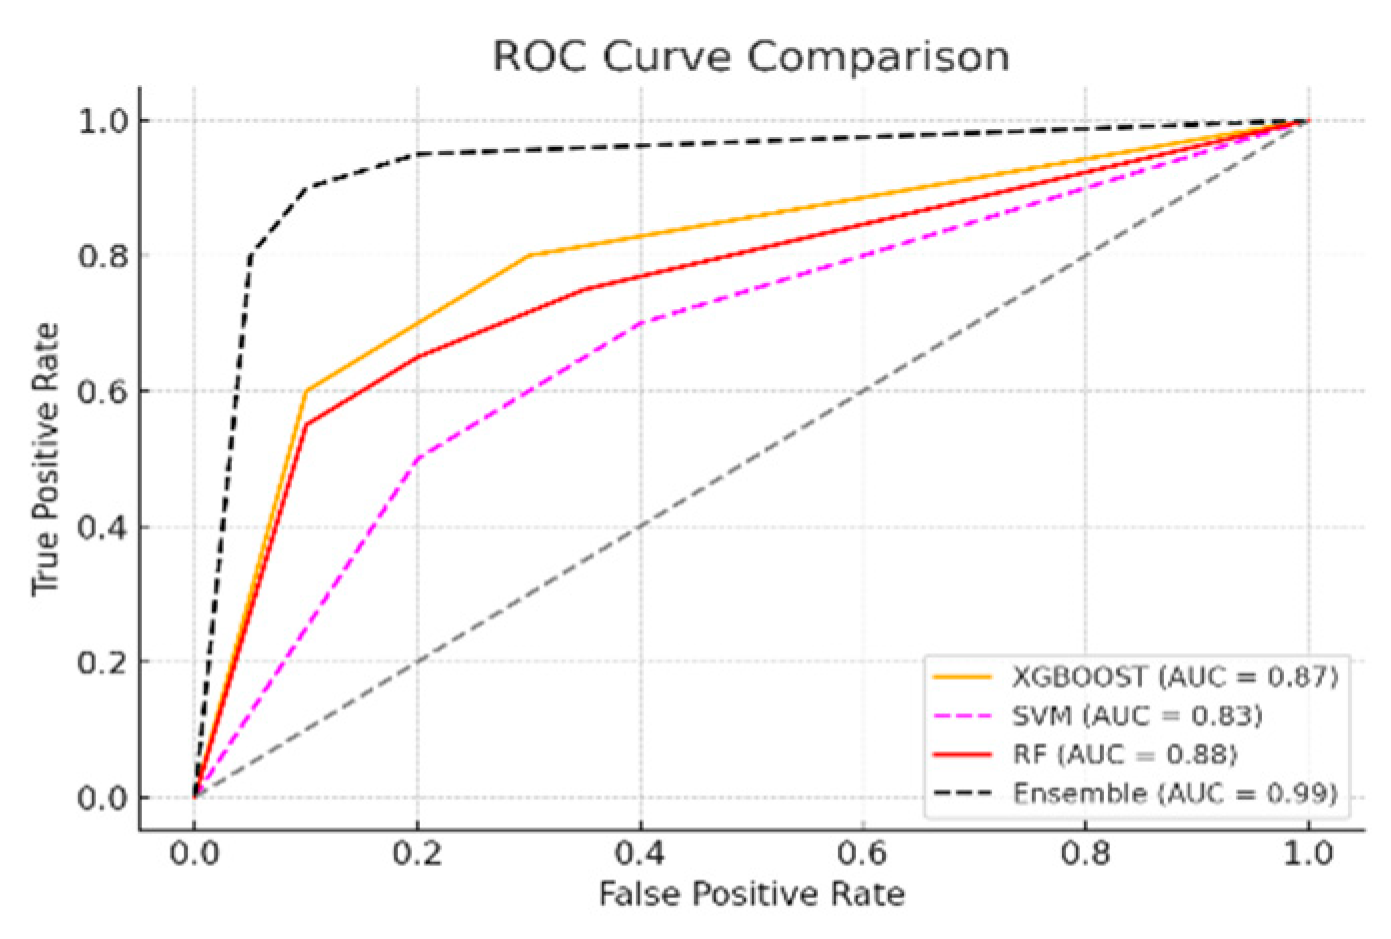
Figure 5.
Monthly changes in the gonadosomatic index (GSI) in Female.
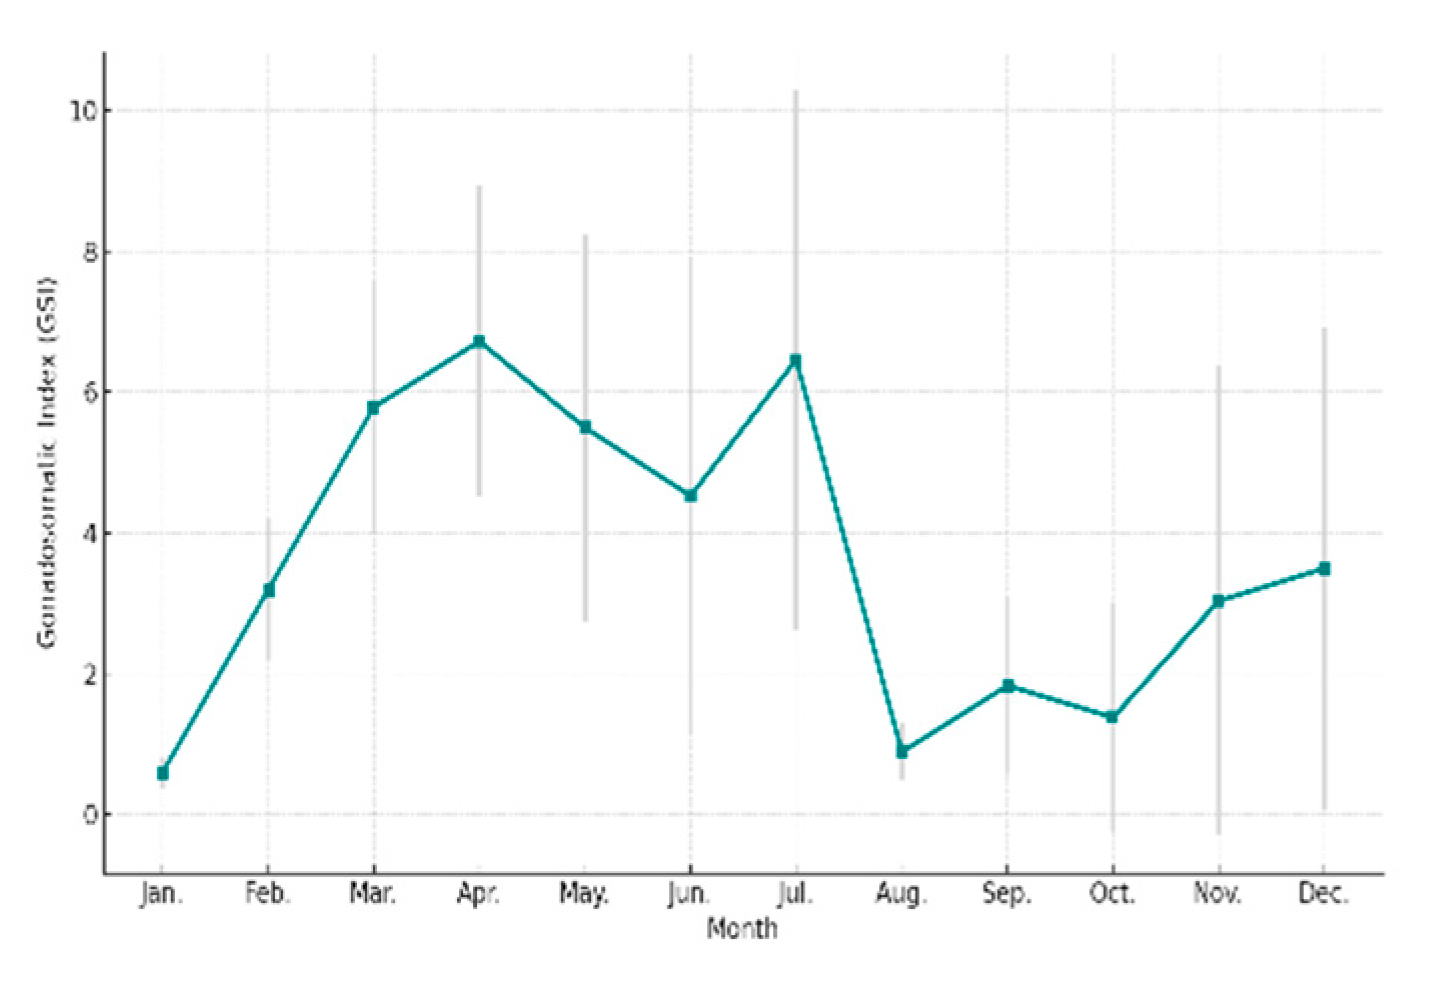
Figure 6.
Figure_6(a) Logistic regression results for estimating L₅₀ based on (a) macroscopic maturity classification and (b) machine learning-based maturity classification.
Figure 6.
Figure_6(a) Logistic regression results for estimating L₅₀ based on (a) macroscopic maturity classification and (b) machine learning-based maturity classification.
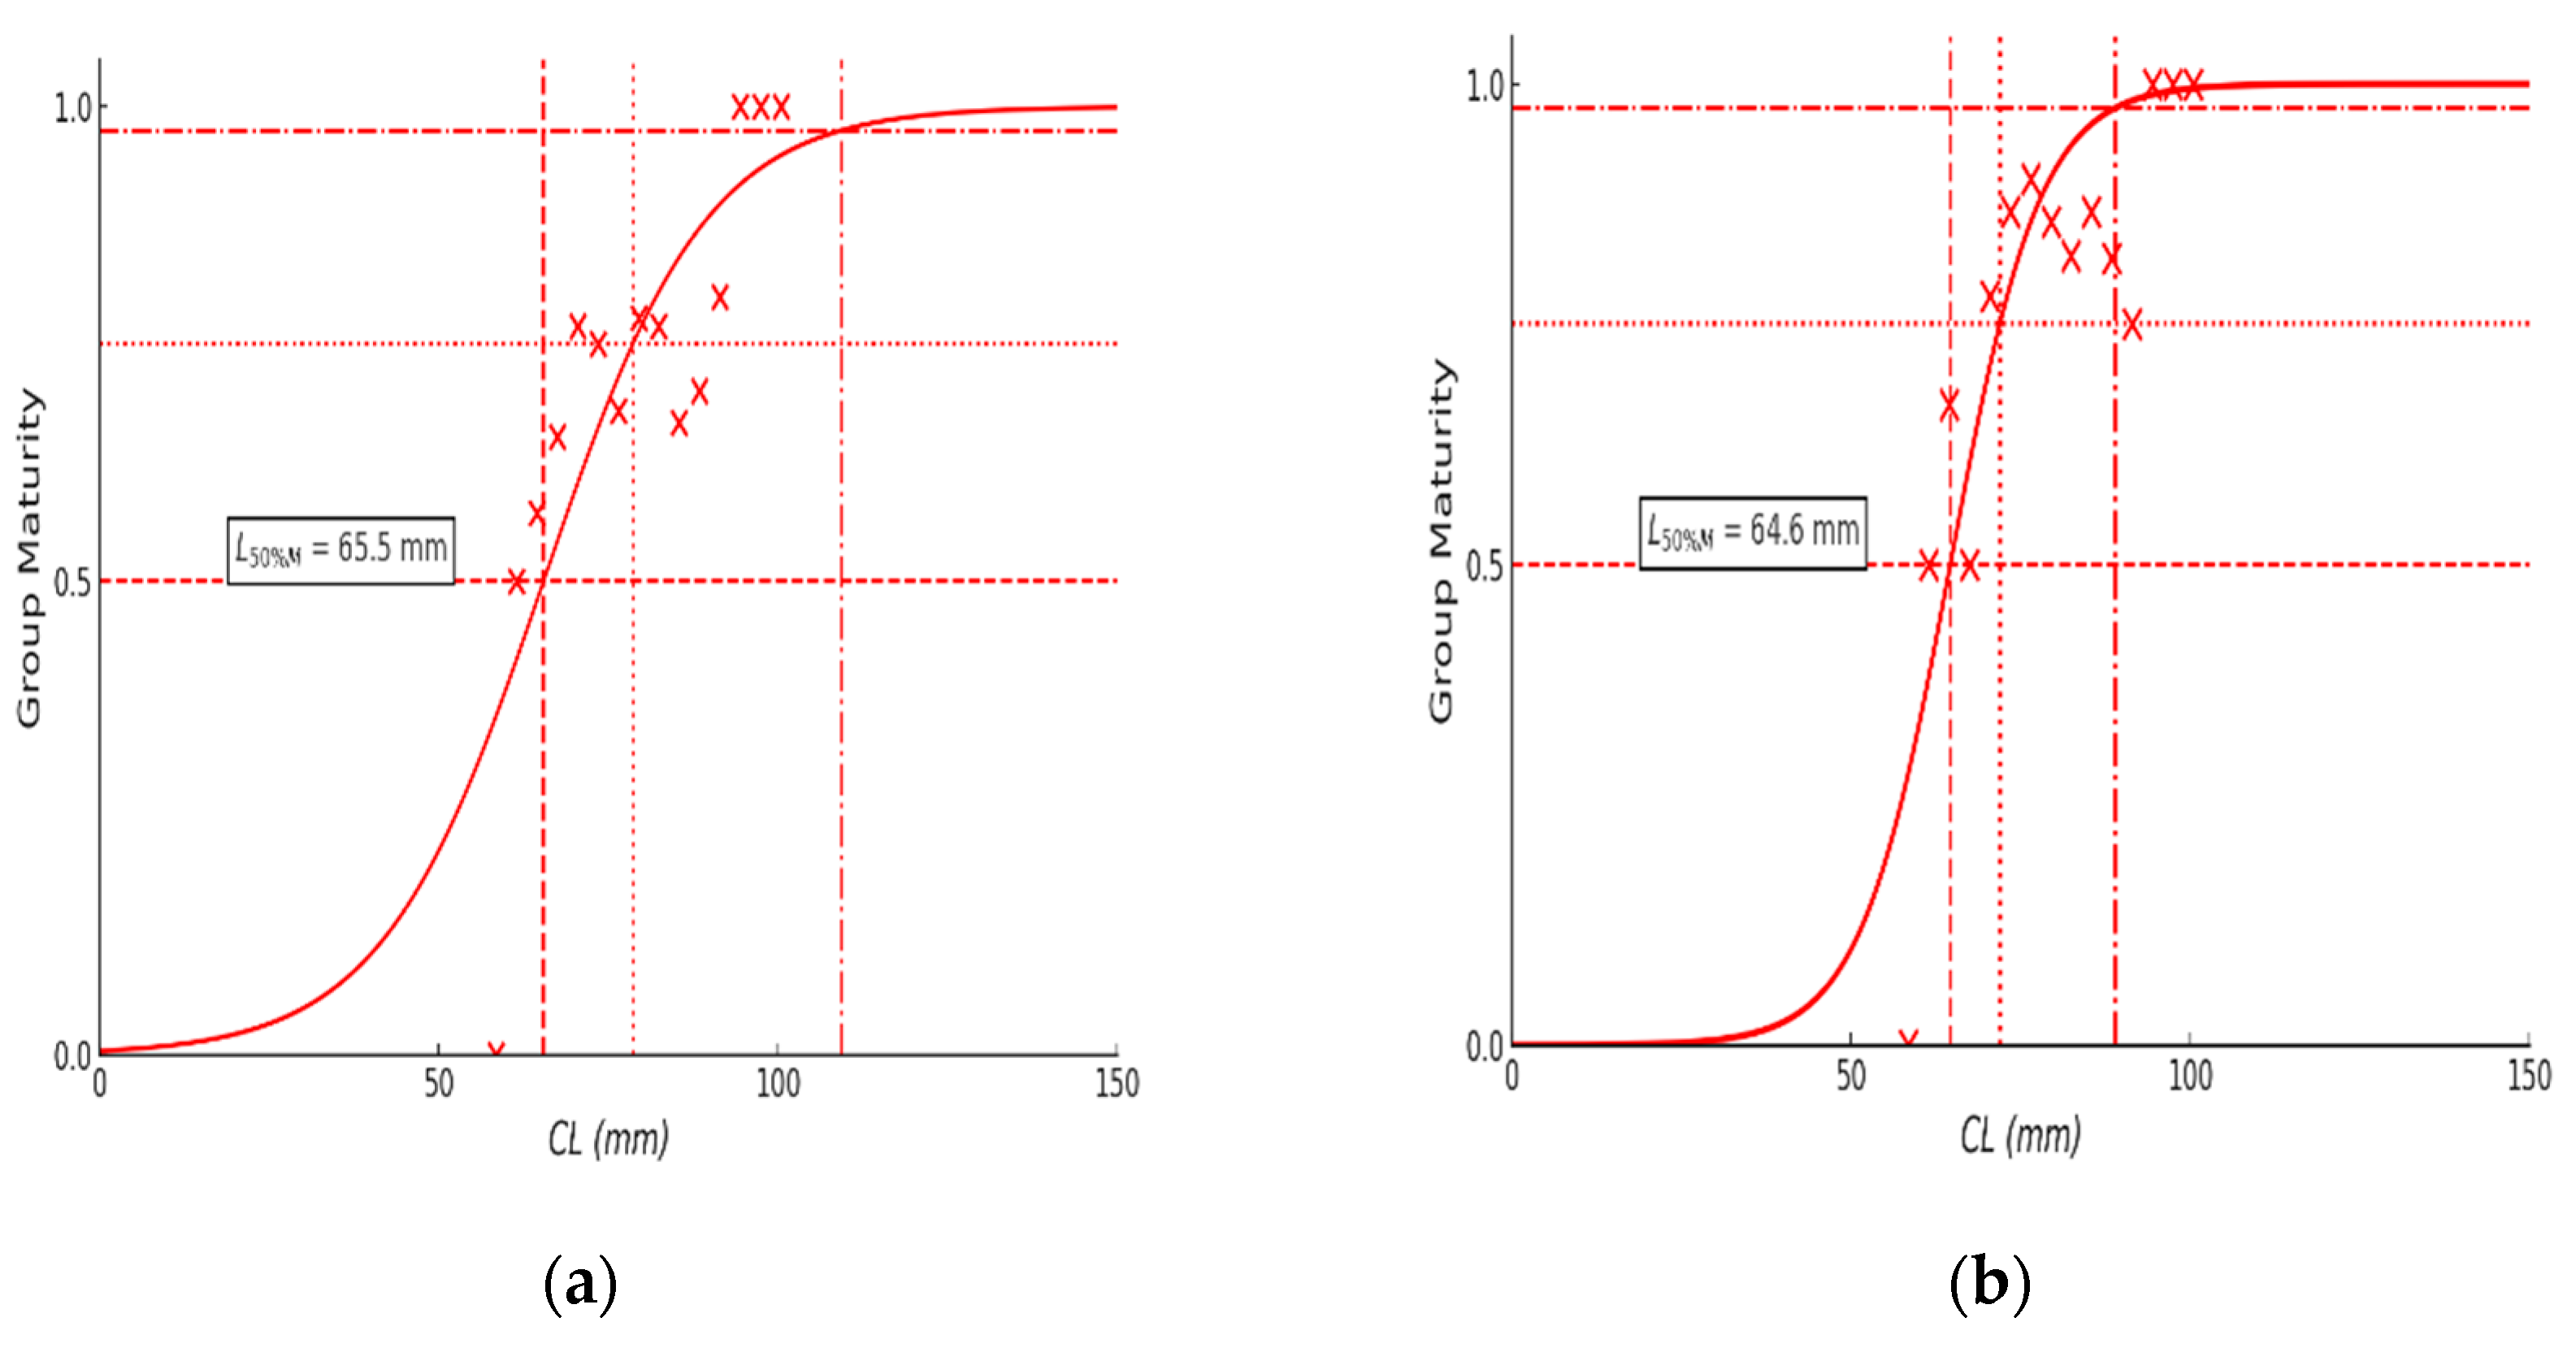
Figure 7.
Schematic diagram illustrating the overall analysis procedure for maturity classification and size estimation in swimming crab (Portunus trituberculatus) using a machine learning-based approach.
Figure 7.
Schematic diagram illustrating the overall analysis procedure for maturity classification and size estimation in swimming crab (Portunus trituberculatus) using a machine learning-based approach.
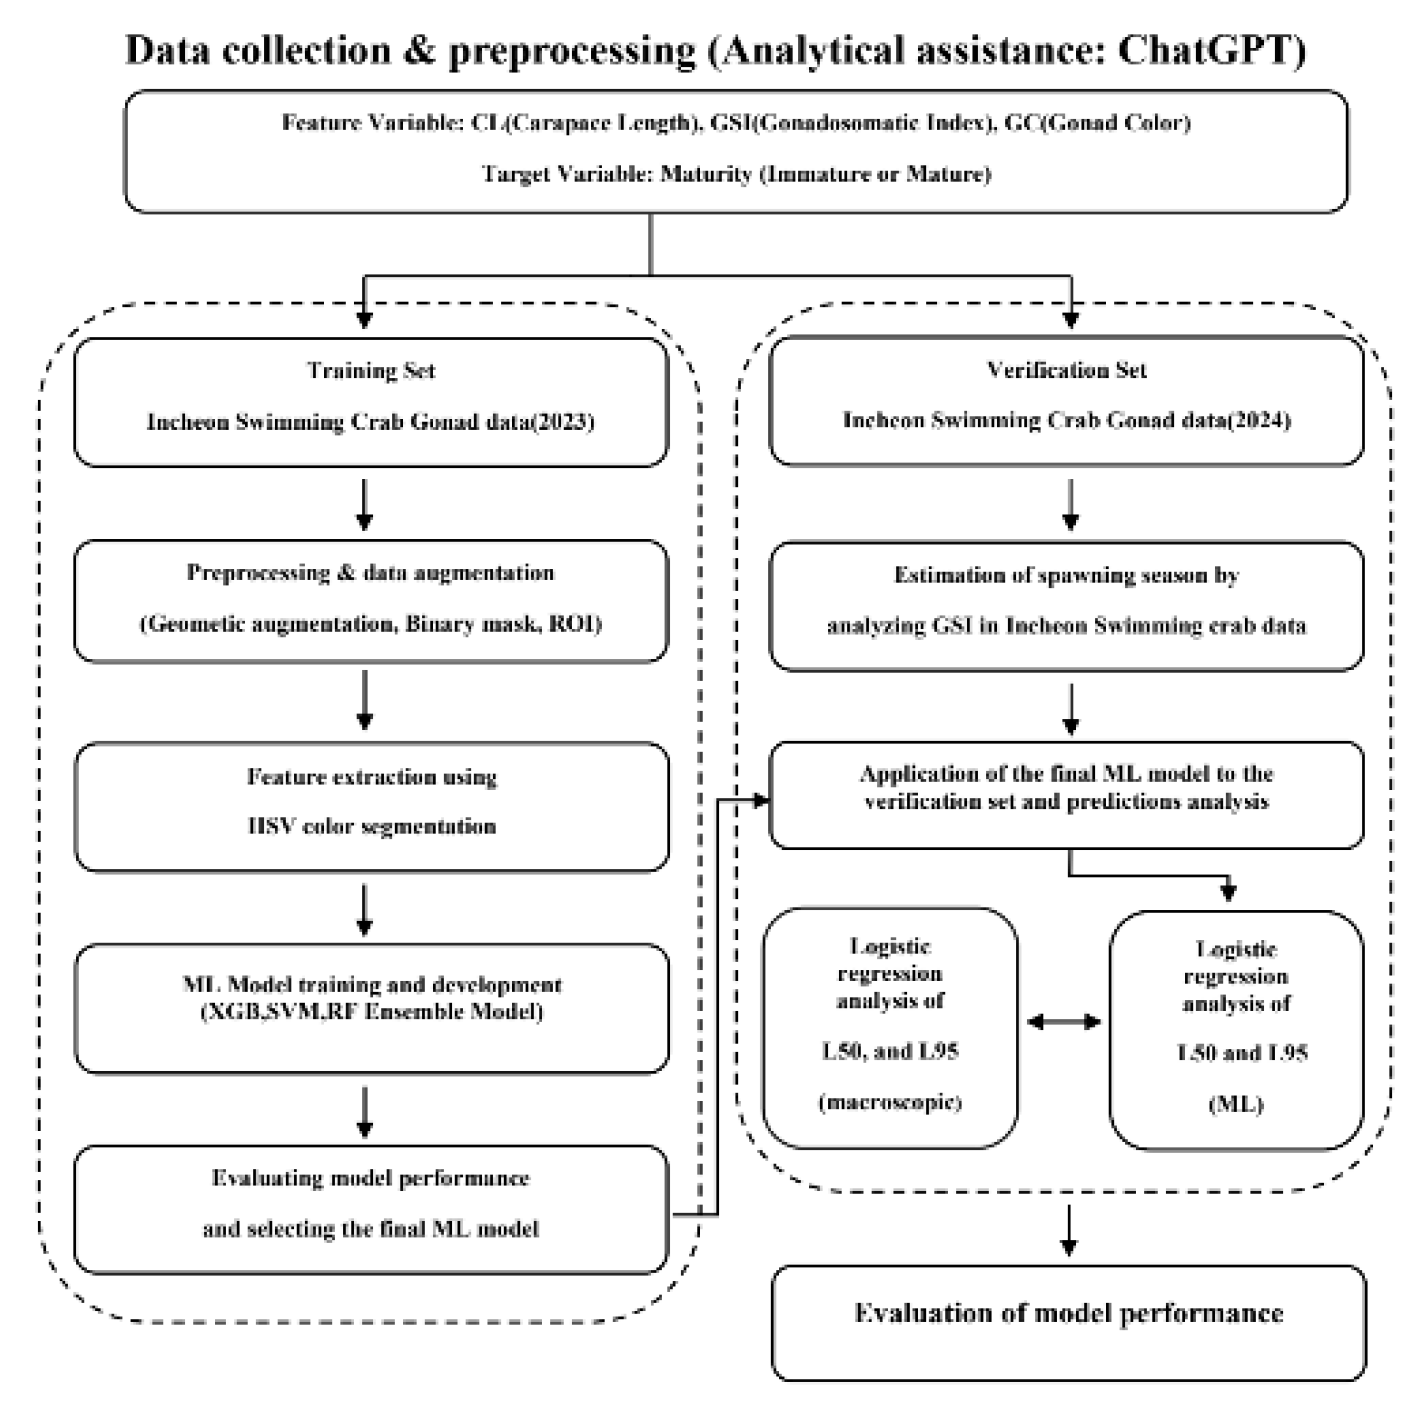

Table 1.
Optimized HSV (Hue, Saturation, Value) threshold ranges.
| Classification | Hue | Sat |
| Immature | 15-18 | 120-145 |
| Mature | 14-17 | 170-187 |
Table 2.
Model performance comparison.
| Moder | Accuracy | AUC | TSS | Final score |
|---|---|---|---|---|
| XGBoost | 0.90 | 0.87 | 0.90 | 0.90 |
| SVM | 0.85 | 0.83 | 0.70 | 0.82 |
| RF | 0.87 | 0.88 | 0.88 | 0.87 |
| Esemble | 0.97 | 0.99 | 0.94 | 0.97 |
Table 3.
Comparison of macroscopic and ML results.
| Metric | Macroscopic | ML(Esemble) | ||
|---|---|---|---|---|
| Estimate(mm) | 65.47 | 64.63 | ||
| Standard Error (SE, mm) | 2.89 | 1.73 | ||
| 95% Confidence Interval | 59.81 – 71.13 | 61.25 – 68.02 | ||
Disclaimer/Publisher’s Note: The statements, opinions and data contained in all publications are solely those of the individual author(s) and contributor(s) and not of MDPI and/or the editor(s). MDPI and/or the editor(s) disclaim responsibility for any injury to people or property resulting from any ideas, methods, instructions or products referred to in the content. |
© 2026 by the authors. Licensee MDPI, Basel, Switzerland. This article is an open access article distributed under the terms and conditions of the Creative Commons Attribution (CC BY) license (http://creativecommons.org/licenses/by/4.0/).
Copyright: This open access article is published under a Creative Commons CC BY 4.0 license, which permit the free download, distribution, and reuse, provided that the author and preprint are cited in any reuse.


