1. Introduction
Organic farming is a food production system based on environmentally friendly principles, prioritizing the reduction of external inputs. Unlike integrated farming, which combines mineral fertilization with targeted, threshold-based chemical protection, organic farming relies exclusively on biological and mineral resources, such as manure, natural minerals, and farm-sourced organic fertilizers [
1,
2,
3,
4,
5]. The complete abandonment of synthetic pesticides in organic systems necessitates alternative plant protection strategies. Mechanical techniques, including harrowing and ridging, are employed for weed control. For diseases and pests, only substances approved by national regulatory bodies (e.g., Institute of Plant Protection – National Research Institute) are permitted. These often include biopesticides based on herbal extracts, hormones, or enzymes [
6,
7,
8]. Furthermore, Effective Microorganisms (EM) are increasingly utilized to enhance soil health and biological resilience. Potato cultivation in organic systems remains a significant challenge due to high pressure from the Colorado potato beetle and late blight (
Phytophthora infestans), which can drastically reduce productivity [
9,
10,
11]. However, organic management offers substantial long-term benefits for sustainable land management, such as enhancing soil fertility through the optimization of organic matter, nutrient cycling, and microbiological activity [
12,
13,
14]. In the context of the EU’s “Farm to Fork” strategy, developing resilient potato cultivation models is crucial, particularly in regions like Southern Poland. This study conducts a comparative analysis of integrated and organic protection strategies, assessing their impact on the yield, crop structure, and starch content of seven early potato varieties. Research Objectives and Hypotheses. The primary objective is to quantify the differences in agronomic efficiency, tuber structure, and quality (total/marketable yield, dry matter, and starch) between integrated and organic systems. These results are correlated with soil fertility indicators to define optimal land management trajectories for sustainable production. The following research hypotheses were tested:
H1 (Alternative Hypothesis): There are significant differences in the effectiveness of potato protection strategies between integrated and organic systems in Southern Poland, significantly impacting yield structure and biochemical parameters (dry matter, starch) across the studied varieties.
H0 (Null Hypothesis): There are no statistically significant differences in yield or quality parameters between systems, and the protection strategies employed have no significant impact on these outcomes.
2. Materials and Methods
2.1. Location and Site Conditions
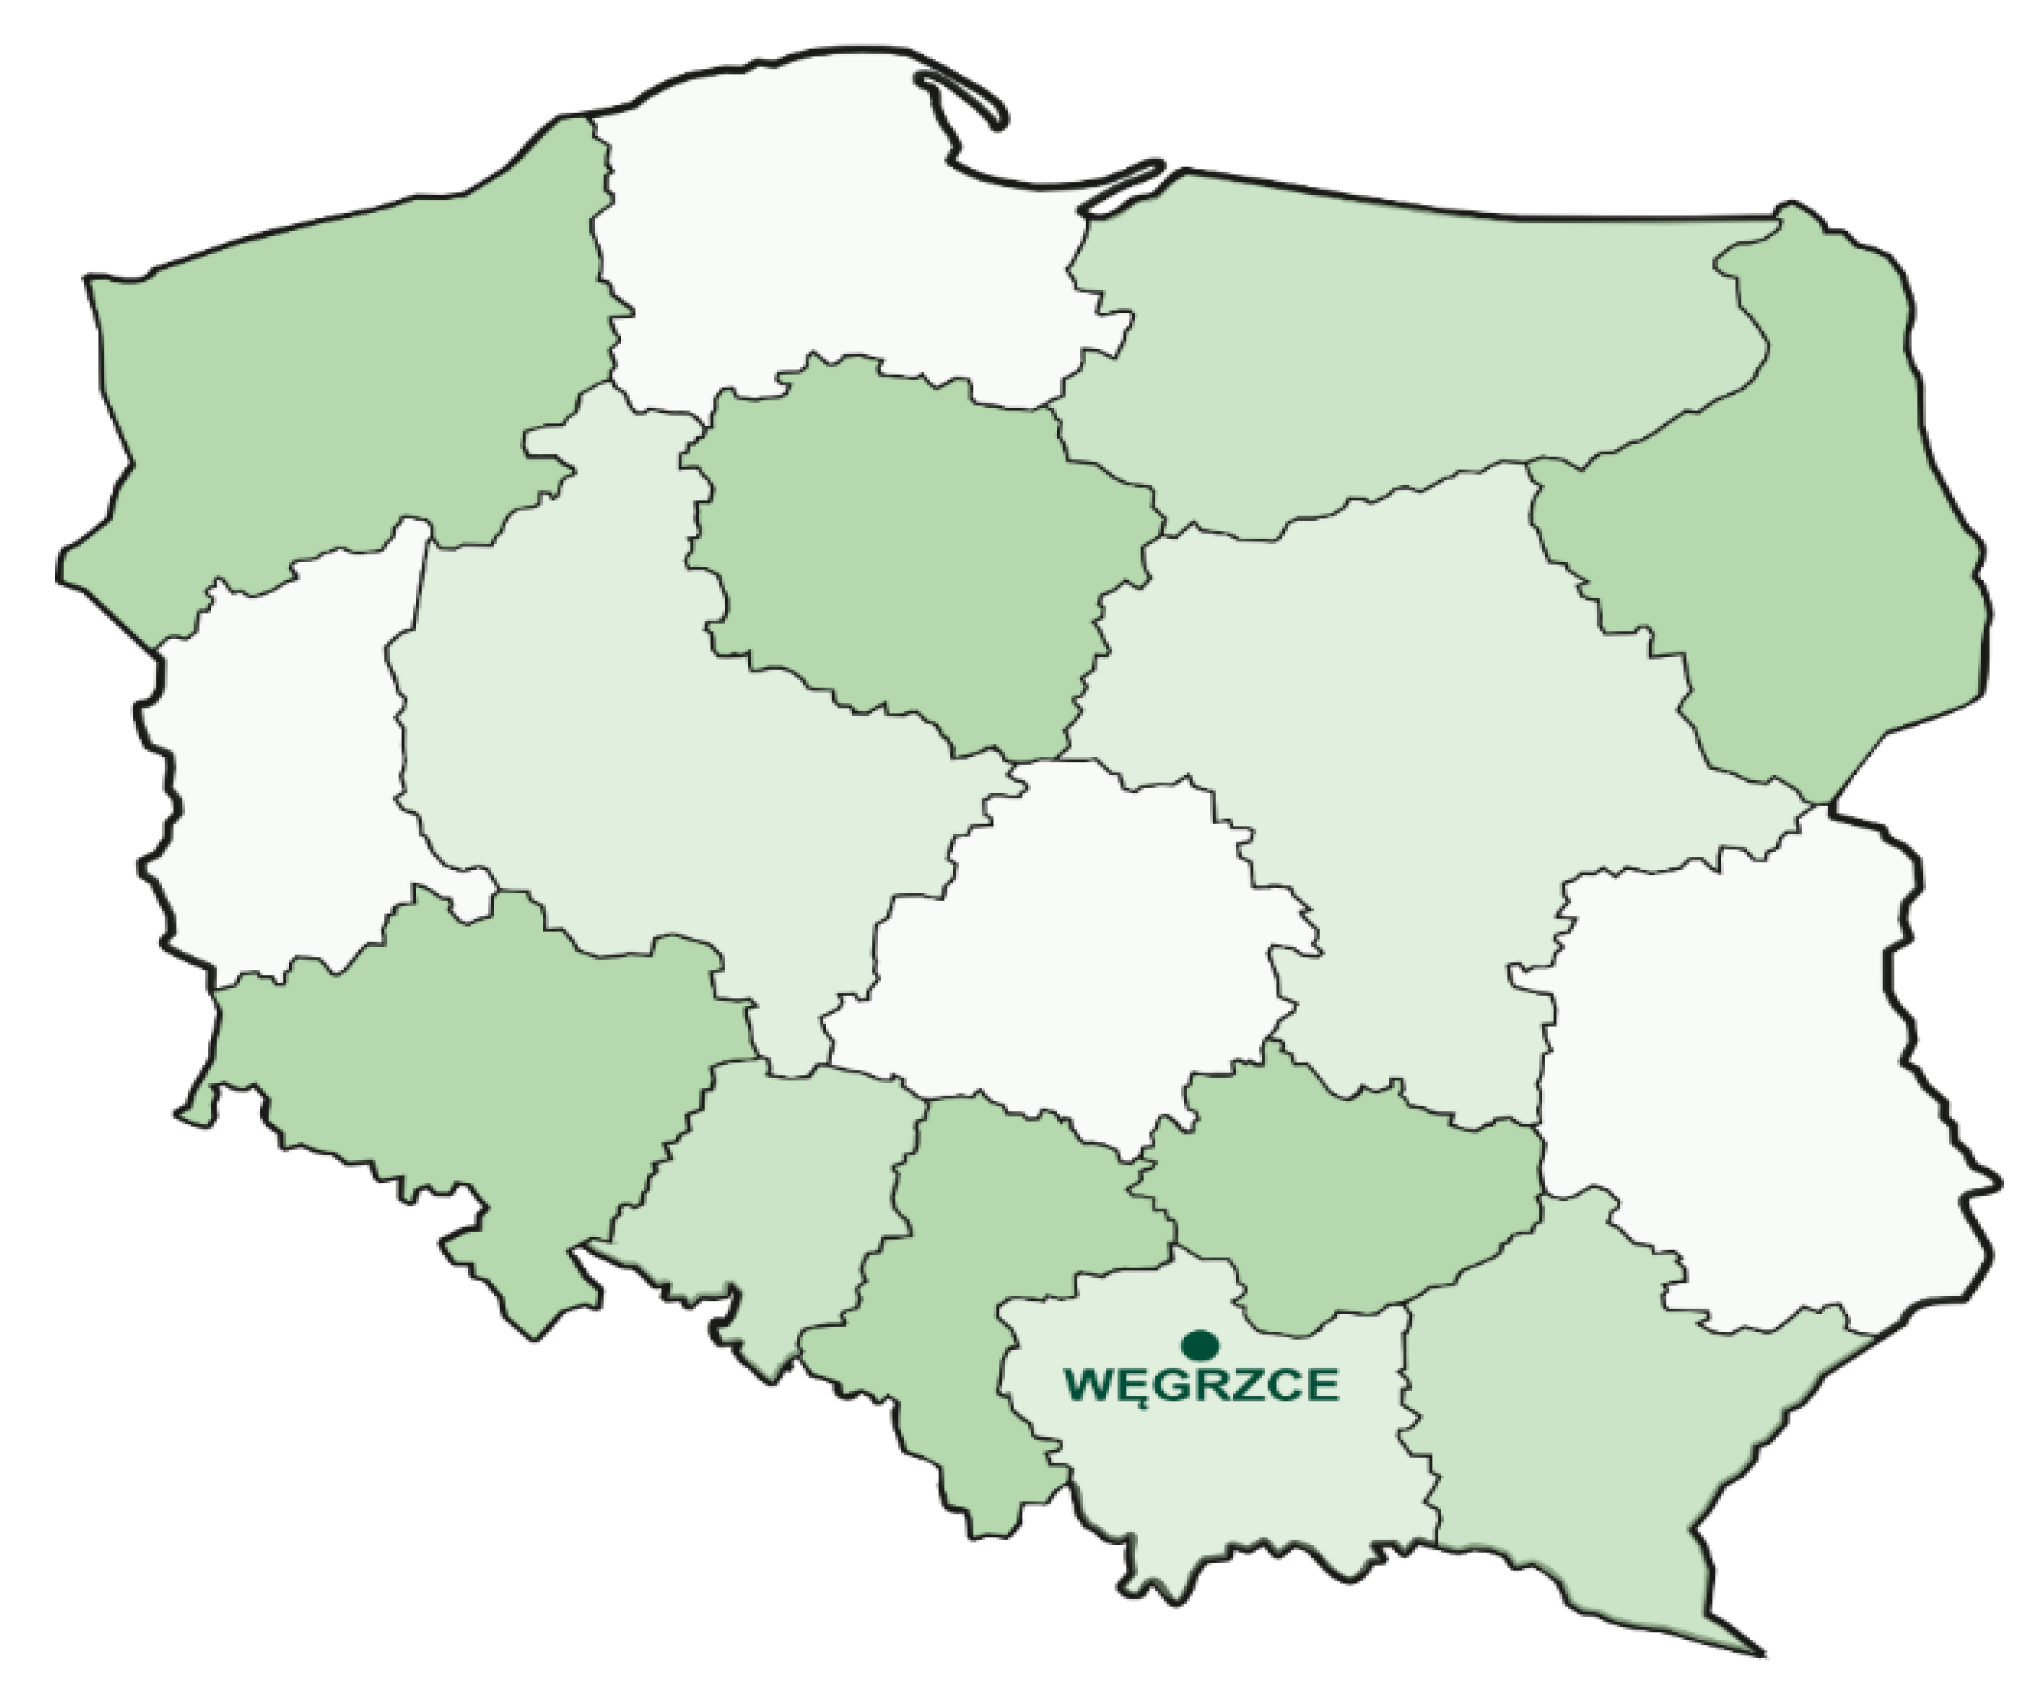
Field trials were conducted between 2022 and 2024 at the Variety Testing Experimental Station (COBORU) in Węgrzce (50°07′ N, 19°58′ E, 285 m a.s.l.), located in the Małopolska region. The experiment was conducted on a brown soil developed from loess, classified as a good wheat complex (value class II). The soil was characterized by a slightly acidic reaction, which is representative of conditions for intensive potato production in southern Poland.
2.2. Experimental Design and Factors
The experiment was designed in a split-plot (randomized blocks) with three replications. This design enabled a precise assessment of the interactions between plant protection strategies and the genetic potential of the varieties.
Primary Factor – Management System:
Integrated System: Based on the principles of Integrated Pest Management (IPM), combining balanced mineral fertilization with targeted use of plant protection products.
Organic System: Based on the complete elimination of synthetic pesticides and fertilizers, promoting soil biological activity.
Secondary Factor – Varieties: Seven early varieties of table potatoes were studied: Gwiazda, Hetman, Ignacy, Lawenda, Magnolia, Michalina, and Stokrotka, selected for their suitability for sustainable production.
Key Elements of the Research Conditions
Organic fertilization: In autumn, manure was applied in both systems at a rate of 25.0 t ha-1. The following mineral fertilizer doses were applied in the integrated system, based on the soil’s natural mineral content: 100 kg N, 70 kg P2O5, and 140 kg K2O per hectare. Popular fertilizers that best fit the integrated strategy (precise nutrient delivery) were
Table 1.
Mineral fertilization for the integrated system.
Table 1.
Mineral fertilization for the integrated system.
| Fertilizer |
Dosage |
Nutrients Delivered |
Remarks |
| Polifoska 6 (NPK 6-20-30) |
350 kg |
21 kg N, 70 kg P2O5, 105 kg K2O |
Apply pre-sowing; incorporate into the soil. |
| Potassium Sulfate (50% K2O) |
70 kg |
35 kg K2O |
Supplement potassium without chlorides to optimize starch content. |
| Saletrosan 26 (26% N + 13% S) |
300 kg |
78 kg N + 39 kg S |
Split application: 200 kg pre-sowing, 100 kg top-dressing (before hilling). |
2.3. Agronomic Techniques and Crop Rotation
The preceding crop for potatoes in each year of the study was winter wheat. In accordance with the principles of good agricultural practice and sustainable land management, after harvesting the preceding crop, a set of post-harvest tillage operations (tilling system) was carried out, aimed at limiting water evaporation and combating volunteer plants and weeds. To ensure comparability results, an identical crop rotation promoting soil structure was used in both systems: Potato → Spring barley → Field pea → Winter wheat.
The preceding crop for potatoes in each year of the study was winter wheat. In accordance with the principles of good agricultural practice and sustainable land management, after harvesting the preceding crop, a set of post-harvest tillage operations (tilling system) was carried out, aimed at limiting water evaporation and combating volunteer plants and weeds.
Fertilization
– Integrated system: manure at the rate of 25 t ha-1.
– Organic System: The experiment relied solely on organic fertilization (e.g., manure at a rate of 25–30 t·ha⁻¹) and improved soil fertility through catch crops.
Planting and plot parameters: Tuber planting took place in the second or third week of April (depending on weather conditions in a given year), maintaining a spacing of 75 x 33 cm. The experiment was conducted on plots with a harvestable area of 15 m², each with 60 tubers planted in two rows.
Weed management: The research systems employed different approaches to weed biomass control, which directly impacted water retention and topsoil structure:
Pathogen and pest protection strategies: Plant protection was differentiated according to the standards of each system, which was a key element of the Crop Protection analysis. In the organic system, only the biological product SpinTor 240 SC (0.15 dm·ha-1), based on spinosyns (fermentation of the S. spinosa bacterium), was used for pest control (Colorado potato beetle).
Plant protection in an integrated system: Chemical protection was carried out in accordance with the principles of Integrated Plant Management (IPM). Insecticide treatments against the Colorado potato beetle (
Leptinotarsa decemlineata) and aphids were performed after exceeding the economic damage thresholds, using the following preparations: Mospilan 20 SP, Carnadine 200 SL, and Cyperkil Max 500 EC (0.05L ha
-1). Intensive fungicide protection against potato late blight (
P. infestans) was implemented in accordance with the recommendations of the Institute of Plant Protection – National Research Institute [
18]. The protection strategy was based on the sequential use of the following preparations: Ridomil Gold MZ 67.8 WG (2.5 kg ha
-1), Infinito 687.5 SC (1.6 L h
a-1), and a modern systemic fungicide – Zorvec Endavia (0.4 L ha
-1). Application dates were optimized using artificial intelligence (AI) predictive models to minimize chemical inputs while maintaining full protective effectiveness.
In the organic system, the use of synthetic plant protection products was completely eliminated. The strategy for limiting the effects of
P. infestans infection was based on utilizing the natural, constitutive resistance of the tested varieties [
18].
Analysis of yield and quality parameters: During harvest, total and marketable yield were determined. A detailed analysis of the yield structure was performed based on a sample of 10 plants from each plot. The following were collected for laboratory analysis: Tuber samples (5.5 kg) to determine starch content using the polarimetric method [
19,
20,
21]. Samples of 30 representative tubers to determine dry matter content. All treatments were performed in accordance with Good Agricultural Practices (GAP), which guarantees consistency of results in the context of sustainable land management [
19,
20].
2.4. Characteristics of Plant Material
Seven edible potato varieties from the early group, reaching full maturity after approximately 110 days of vegetation, were used in the study. Selecting this earliness group is an important element of integrated and ecological plant protection strategies, enabling yields to be obtained before the period of maximum potato blight (
Phytophthora infestans) pressure. Detailed characteristics of the varieties in terms of tuber morphology and their technological suitability are presented in
Table 2.
All analyzed genotypes were characterized by the commercially desirable round-oval tuber shape. The dominant skin color was yellow, with the exception of the Lawenda (red skin) and Magnolia (light beige skin). Yellow flesh was noted in the Gwiazda and Lawenda varieties, while the remaining varieties (Hetman, Ignacy, Michalina, and Stokrotka) had light yellow flesh (
Table 2).
In terms of culinary suitability, most varieties were classified as type B (general-purpose), demonstrating their versatility. The Hetman variety represented type AB (salad), retaining high flesh firmness after heat treatment. The Magnolia and Stokrotka varieties (type B-BC) tended to be slightly floury, which broadens the spectrum of their use in households (
Table 2).
The organoleptic evaluation of flavor ranged from 6.5 to 7.0 points, with the highest scores being awarded to the Gwiazda, Lawenda, Magnolia, and Stokrotka varieties. The high flavor parameters and diverse morphological features of the tested varieties provide a solid basis for assessing their adaptation to various production systems in southern Poland [
22,
23].
2.5. Characteristics of the Study Area
2.5.1. Geographic Location and Habitat Conditions
The field experiment was located in southern Poland, in the town of Węgrzce (
Figure 1 and
Figure 2). This area is characterized by specific climatic and soil conditions that determine plant protection and land management strategies in the Małopolska region [
15].
This location was selected for its representativeness of areas with high agricultural potential but also exposed to abiotic thermal and water stresses in recent years.
2.5.2. Topographic and Physiographic Characteristics
The village of Węgrzce is located in southern Poland (Lesser Poland Voivodeship), within the Kraków Upland, part of the Polish Upland. This region is characterized by a varied, hilly terrain with numerous river valleys and small hills. The immediate surroundings of the experimental station are agricultural land and green areas typical of the suburban zone of the Kraków agglomeration. Topography, the study area lies at an altitude of 200 to 300 m above sea level. Smaller watercourses, tributaries of the Vistula River, flow through the adjacent areas, influencing local water conditions and microclimate [
15].
2.5. Soil Conditions and Habitat Potential
The geological substrate of the Kraków Upland in the Węgrzce area consists of Jurassic limestone and Cretaceous marl, covered by loess-like formations. It was at the loess substrate that fertile soil developed, determining the region’s high agricultural suitability. Chernozems, brown soils, and lessive soils dominate here [
24].
The experiment was conducted on soils belonging to the good rye complex (value class IV), indicating moderate fertility, representative of many potato-growing areas in Poland [
25,
26,
27]. The soil was characterized by a stable pH (slightly acidic to neutral), which favors the availability of micro- and macronutrients.
Soil chemical analysis performed before the experiment in 2022–2024 confirmed optimal conditions for potato cultivation (
Table 3). The average pH in KCl was 6.4, which is within the recommended range for this species. The soil was well-stocked with potassium and magnesium, which are key for building starch yield in both integrated and organic systems [
25,
26,
27].
2.5. Soil Agrochemical Characteristics
The physicochemical parameters of the soil in both cultivation systems (
Table 3) were within optimal ranges for early potato varieties, with significant differences in macronutrient content between the systems.
2.5.1. Organic System
The average soil pH was 6.4, which supported high nutrient bioavailability. The average phosphorus (P) content was 14.3 mg, potassium (K) 27.0 mg, and magnesium (Mg) 13.6 mg·100g⁻¹ of soil. Annual nutrient dynamics were observed: the highest P and K content was recorded in 2023, while in 2024, phosphorus and magnesium content decreased (to 10.6 mg) and magnesium content, while the pH decreased to 6.2 (
Table 3).
2.5.2. Integrated System
In the integrated system, the average pH was 6.3. This system was characterized by a significantly higher average content of key macronutrients: phosphorus (21.8 mg) and potassium (29.8 mg·100g⁻¹ of soil), with magnesium levels similar to those in the organic system (13.7 mg). The highest K concentration (36.0 mg) was recorded in 2022, while in 2024, a significant increase in P (25.0 mg) and Mg (18.1 mg) was observed, with stable soil pH (
Table 3).
2.5.3. System Comparison and Site Conclusions
The comparative analysis indicates that the integrated system initially offered a better supply of phosphorus and potassium, which is due to the specific mineral fertilization used and the field history of the sites. Annual nutrient fluctuations in both systems could be determined by meteorological conditions influencing the rate of organic matter mineralization and the dynamics of nutrient uptake by the preceding crop (winter wheat). Despite differences in abundance, both systems provided favorable edaphic conditions, providing a stable basis for assessing the effectiveness of various plant protection strategies [
25,
26,
27].
2.6. Agrometeorological Conditions and the Sielianinov Hydrothermal Index
Analysis of data from the meteorological station in Węgrzce (2022–2024) indicates the occurrence of weather anomalies during the potato growing season. A clear trend toward increasing air temperatures and significant unevenness in precipitation distribution were noted (
Table 4), which directly impacted pathogen pressure and yield dynamics
Characteristics of the study seasons: 2022: The season was characterized by above-normal temperatures in the key growing months (May–August). A critical factor was an extremely dry May (only 23.7% of the long-term norm) and water deficits in June and August (k from 0.4 to 1.2). These conditions favored the early emergence of the Colorado potato beetle while limiting the initial development of potato blight. 2023: This year was characterized by an unusual course – a very wet and cool spring (April and May with
$k
$ of 3.0 and 2.5, respectively), which may have hindered timely agrotechnical treatments and planting. The remainder of the season was dry, with the exception of the optimal July. An exceptionally warm September (+4.8 °C above normal) accelerated tuber ripening, which is important in the evaluation of early varieties. 2024: The warmest year of study, with all months recording temperatures above the long-term norm. Similar to 2022, an extremely dry May occurred (k = 0.4). Drought periods in July and August were interrupted by a wet June and a very wet September (188.8% of normal). Such extreme conditions (alternating droughts and downpours) pose a serious challenge to yield stability in an ecological system where intervention options are limited (
Table 4) [
28].
Conclusions for plant protection strategies: Variable hydrothermal conditions in 2022–2024 determined the effectiveness of the applied protection strategies. High temperatures coupled with periodic water shortages promoted pest development, while periods of high humidity (especially in 2023 and June 2024) generated a high risk of P. infestans infection. Selecting early varieties allowed for partial escape from extreme water deficits in late summer, confirming the validity of the adopted sustainable crop management strategy in southern Poland.
2.7. Statistical analysis
The research hypotheses were tested using analysis of variance (ANOVA) for a split-plot design [
29]. The significance of factors and their interactions were assessed using Snedecor’s F test, while the differences between means were verified using Tukey’s post-hoc test at the significance level of p = 0.05. In order to precisely determine the structure of the total variability of traits (σ
2p), a variance component analysis was performed in a random model, considering: σ
2G: genotypic (varietal) variability, σ
2Y: variability of the years of research, σ
2e: random (environmental) variability. The percentage share of individual variance components allowed for the hierarchy of factors influencing yield, yield structure traits, starch and dry matter content. Additionally, descriptive statistics calculations were performed (SPSS software): Arithmetic mean and standard deviation: to assess the central tendency and data dispersion. Coefficient of variation (V): as a dimensionless measure of experimental precision and trait stability. Persona’s linear correlation coefficients: to determine the strength and direction of the relationship between soil fertility, meteorological conditions and quality parameters of tubers [
29].
3. Results
3.1. Yield of Tubers
The analysis of the total yield of potato tubers in 2022-2024 revealed significant differences depending on the cultivation system (organic vs. integrated), varieties and year of cultivation. Interactions between these factors were also significant, except for the triple interaction (System x Variety x Year) (
Table 5), which indicates the varied plasticity of genotypes depending on the protection and fertilization strategy used.
The integrated system delivered significantly higher yields compared to the organic system. The average yield reduction in the organic system was approximately 57%, resulting from strong pathogen pressure (lack of fungicide protection) and lower availability of readily available nutrients (
Table 5).
Meteorological conditions were a significant factor in determining yields: 2022: The highest yields in the organic system (30.52 t ha-1), which may be attributed to lower potato blight pressure during the dry May and June. 2023: Record yields in the integrated system (57.67 ha-1), resulting from optimal use of high spring rainfall with full chemical protection. 2024: The lowest yields in both systems (average 25.26 tha-1), resulting from extreme drought and thermal anomalies (
Table 5).
Varietal Plasticity: The varieties demonstrated significant differences in their adaptability to ecological conditions. The yield leaders were Lawenda (25.93 t ha-1) and Michalina (23.41 t ha-1), which best tolerated the organic regime, demonstrating the highest yield stability. The Ignacy, Gwiazda, Lawenda, Michalina and Hetman varieties achieved high yield potential in the integrated system, responding most strongly to cultivation intensification, achieving the highest production results. The Magnolia and Stokrotka varieties exhibited the lowest yield stability, achieving significantly lower yields in both systems, suggesting their greater sensitivity to abiotic and biotic stresses in the Małopolska region. The significant System × Variety interaction confirms that selecting the appropriate genotype is a key element of sustainable land management. In the organic system, differences between varieties were relatively smaller than in the integrated system, suggesting that under conditions of limited protection, environmental factors (weather) become the main limiter of yield potential, regardless of genotype (
Table 5).
3.2. Tuber Yield Structure
Analysis of the tuber yield structure by transverse diameter fraction (<35 mm, 36–50 mm, 51–60 mm, and >60 mm) revealed statistically significant variation due to the cultivation system, genetic characteristics of the varieties, and meteorological conditions in the study years (
Table 6). The proportions of individual fractions are a key indicator of the utility and commercial value of the yield (marketable yield).
The cultivation system crucially determined the commercial parameters of the yield. A statistically significant shift in the size structure was noted between the studied variants. Organic System: It was characterized by a significantly higher share of small (<35 mm – 8.9%) and medium (36–50 mm – 27.4%) tubers. In total, tubers with a diameter of up to 50 mm accounted for over 36% of the yield. This is the result of limited nitrogen availability during the tuber thickening phase and the lack of fungicide protection, which leads to a shortened vegetation period and prevents the tubers from fully maturing. Integrated System: Generated a yield structure with a significantly higher market value. The dominant fraction was large tubers (>60 mm – 35.0%) and the 51–60 mm fraction (29.8%). The share of the smallest tubers was half that of the organic system (4.5%). Full plant protection allowed for the maximum extension of the photosynthetic activity of the leaves, which translated into effective translocation of assimilates to the tubers (
Table 6).
Varietal Variability (Genotypic Background): The tested varieties demonstrated a very diverse yield pattern, allowing them to be categorized based on their suitability for specific cultivation systems:
– Large-tuber varieties: Ignacy (43.2% of tubers >60 mm) and Michalina (39.2%) were most effective in producing the coarse fraction. These genotypes have high production potential, ideal for integrated systems.
– Varieties with uniform yields: Lawenda and Magnolia, which were characterized by a stable proportion of tubers with a diameter of 51–60 mm (above 30%), making them valuable in organic farming, where uniform, medium-sized raw material is expected.
– Small-tuber varieties: Gwiazda and Hetman had the highest proportion of the smallest fraction in the total yield (<50 mm), which, given their good flavor, may predispose them to be sold as “salad potatoes” or “baby potatoes” (
Table 6).
Influence of meteorological conditions during the study years: Analysis of the Sielianinov coefficient, combined with yield structure, indicates a significant impact of rainfall on tuber size. For example:
2022: High rainfall in July contributed to the highest share of tubers with a transverse diameter >60 mm (42.1%).
2023: Despite a wet start to the growing season, and subsequent drought in August and September, tuber growth drastically slowed, resulting in the lowest share of the thickest fraction (only 12.0%), with a simultaneous increase in the share of small and medium-sized tubers.
2024: was unique due to the abrupt transitions between periods of drought and heavy rain. Early spring stress, an extremely dry May (k = 0.4), limited the number of tubers that formed. According to potato physiology, fewer tubers under the bush, coupled with later water availability, led to stronger growth. Water compensation occurred in June. A very wet June (k = 1.8) allowed the plants to intensively build tuber mass, which was set in May. This is why the share of the 51–60 mm fraction was record-breaking in 2024. 2024 also saw a wet harvest: Very high rainfall in September (nearly 200% of normal) hindered harvesting but did not affect the fractional structure, which was established in August. In 2024, with large weather contrasts (dry start, wet middle, dry end of the year), the lack of chemical protection in the ecological system prevented plants from taking advantage of periods with good water availability, because their assimilation apparatus had been previously destroyed by pathogens (Table 4,6).
3.3. Marketable Tuber Yield
The analysis of the marketable potato tuber yield (understood as fractions with a diameter above 35 mm, constituting the main market value) in the years 2022-2024 showed significant variation under the influence of the cultivation system, variety and meteorological conditions of a given year. Interactions between these factors were also significant (
Table 7).
Marketable yield, a key indicator of the economic profitability of crops, showed a strong dependence on the production system and weather conditions in individual years (
Table 7). The average marketable yield in the integrated system was significantly higher by 155% than in the organic system. This significant disparity resulted from the fractional structure – in the organic system, the higher proportion of small tubers (<35 mm), which are not included in the marketable yield, significantly reduced this parameter.
Weather conditions had a significant impact on marketable yield. 2022 was the most favorable year for the organic system, thanks to lower disease pressure in the initial growth phase. 2023 was characterized by the highest average marketable tuber yield in the integrated system, indicating that in high-humidity conditions (May 2023), achieving high marketable yields in the organic system without full fungicide protection is impossible. 2024 brought the lowest average marketable yield results, confirming the negative impact of the extreme May drought on the formation of marketable tubers (
Table 7).
The varieties demonstrated varying marketable yield stability. For example, Lawenda and Michalina achieved the highest and most stable marketable yields under the challenging conditions of the organic system. In the integrated system, the Ignacy and Gwiazda varieties led the way. Magnolia and Stokrotka varieties achieved significantly the lowest marketable yields in both cultivation systems, making them less suitable for cultivation in a region with such high rainfall variability (
Table 7). Management conclusion: The high significance of the interaction between cropping system and year indicates that organic farming in southern Poland carries significantly greater production risk. However, selecting the Lawenda cultivar in an organic farming system allows for minimizing losses and achieving satisfactory marketable yields even with limited inputs.
3.4. Starch Content
Statistical analysis showed that starch content was a parameter strongly determined by the genetic characteristics of the varieties and meteorological conditions, while the cultivation system itself (organic vs. integrated/integrated) did not cause statistically significant differences (
Table 8).
Varietal variability: Significant differences were noted between varieties, allowing the identification of genotypes with the highest quality potential. The Magnolia variety emerged as the quality leader, achieving the highest starch content in both cultivation systems (average 17.45%), making it particularly suitable for the starch and processing industries. The Stokrotka (14.22%) and Lawenda (13.68%) varieties demonstrated high stability in this parameter regardless of the years of study. The Gwiazda and Hetman varieties had the lowest starch content, making them more suitable for direct consumption as salad potatoes (
Table 8).
Hydrothermal conditions significantly modified starch accumulation. 2022 was the most favorable year for starch biosynthesis. High temperatures in August, coupled with abundant water in July, promoted the accumulation of assimilates. The year 2024 was marked by a decrease in starch content compared to 2022 (
Table 8). The extremely dry May and high temperatures during the growing season may have led to metabolic stress, limiting the efficiency of the photosynthetic apparatus.
Thus, although the cultivation system does not directly affect the percentage of starch, the significant System × Year interaction indicates that in years with unfavorable rainfall patterns (e.g., 2023 in the organic system), the lack of chemical protection may indirectly reduce tuber quality by accelerating plant defoliation. However, the Magnolia variety remains unrivaled in terms of qualitative stability in both production models.
3.5. Yield of Starch
The average starch yield in the experiment was 4.69 t·ha⁻¹. Statistical analysis confirmed that the cultivation system, meteorological conditions, and the genetic potential of the varieties significantly determined the amount of starch accumulated per unit area (
Table 9).
The production strategies used dramatically varied the yield of this component. The average starch yield in the organic system was 2.80 t·ha⁻¹, which was 57.4% lower compared to the integrated system, which is due to the lower total mass of tubers rather than the lower percentage of starch. The integrated system therefore demonstrated a clear advantage in starch production efficiency, which is a key argument in the context of intensive agricultural land management (
Table 9).
The influence of weather conditions was closely correlated with the cultivation system. For example, in the organic system, the most favorable year was 2022, while a drastic decline was recorded in the dry year of 2024. In the integrated system, record-breaking, statistically consistent, and stable starch yields were achieved in 2023 and 2022 (
Table 9).
Interannual variability in starch yield highlights the crucial importance of genotype-environment interactions. In the organic system, where plant protection was limited, starch yield stability was significantly lower and more dependent on weather extremes (droughts in 2024). Optimizing production in this system therefore requires the selection of varieties with high water use efficiency and natural resistance to pathogens.
The study revealed significant two-factor interactions, confirming that the cultivation system modifies plant response to changing climatic conditions and the genetic potential of the varieties (
Table 9).
System × Year interaction: The impact of meteorological conditions varied depending on the level of agricultural technology. In the organic system, the highest starch yield was recorded in 2022, while in the integrated system, record results were achieved in 2023 and 2022.
System × Variety interaction: Genotypes demonstrated differential adaptation to plant protection strategies. Although the Lawenda variety dominated in the organic system, in the integrated system it formed the highest-yielding group, along with the Magnolia, Ignacy, and Gwiazda varieties. This demonstrates that some varieties exhibit specific plasticity, allowing for stable yields under conditions of limited input inputs. Year × Variety Interaction: The variable sensitivity of genotypes to weather conditions in subsequent seasons caused the ranking of the most productive varieties to shift, highlighting the role of yield stability in the selection of planting material (
Table 9).
The lack of significance of the three-factor interaction (S × V × Y) is a key methodological finding (
Table 9). It suggests that the overall variability in starch yield results from the summation of the effects of individual factors and their bidirectional relationships, without creating unpredictable statistical patterns. This simplifies the interpretation of results and allows for precise recommendations of specific varieties for a given cultivation system in the Małopolska region, regardless of whether fluctuations.
The complexity of factors influencing starch yield necessitates a flexible approach to agricultural management. The key to optimizing production in sustainable agriculture lies not only in selecting a variety with high potential, but above all in understanding its interactions with the environment and the adopted plant protection system.
3.6. Dry Matter Content
Dry matter content is a key indicator of the technological quality and nutritional value of tubers. As with starch, analysis of variance showed that the genetic characteristics of the varieties and meteorological conditions were the determining factors for dry matter accumulation, while the cultivation system did not have a statistically significant effect on this parameter (
Table 10).
The average dry matter content for the entire experiment was 18.38%. Results in the organic (18.28%) and integrated (18.48%) systems were almost identical, confirming the high stability of potato quality traits regardless of the intensity of chemical protection. However, weather patterns played a key role. The highest dry matter concentration was recorded in 2022 (19.51%), which corresponds to the high starch content during the same period. In contrast, 2023 was characterized by the lowest dry matter content (17.43%), which may be attributed to the high rainfall in early spring and lower sunlight, which limited photosynthesis (
Table 10).
Genotic Variation and Interactions: The varieties showed very strong variation in dry matter accumulation. The Magnolia variety clearly outperformed the other genotypes, achieving an average of 23.27% dry matter. This value is characteristic of varieties with high suitability for processing (French fries, crisps) and starch production. The group with medium dry matter content included the cultivars Stokrotka (18.96%), Lawenda (18.25%), and Ignacy (18.20%), which demonstrated stable parameters typical of general-purpose cultivars (culinary type B). The cultivars with the lowest dry matter content were Hetman (16.45%) and Gwiazda (16.70%), which were characterized by the highest tuber hydration (
Table 10).
Significance of two-factor interactions. The significant System × Variety interaction indicates that some cultivars respond specifically to the cultivation model. An example is the cultivar Stokrotka, which achieved significantly higher dry matter content (19.65%) in the integrated system than in the organic system (18.27%). Magnolia, on the other hand, maintained almost identical parameters in both systems, indicating its very strong genetic stability. The stability of dry matter content in organic farming is a significant advantage for organic food producers – despite lower overall yields, the tubers maintain full quality parameters. The Magnolia variety is the best choice for crops focused on high dry matter concentration, regardless of the farming system adopted and weather fluctuations.
3.7. Dry Matter Yield
Data analysis showed that the cultivation systems significantly modified the dry matter yield. The integrated system was distinguished by a significantly higher yield, exceeding the organic system by as much as 57%. In addition, weather conditions in the individual years of the study also significantly influenced this feature, as did the genetic characteristics of the varieties (
Table 11).
Dry matter yield per unit area, which is the product of total yield and tuber dry matter percentage, showed a strong dependence on all experimental factors and their interactions (except for the three-factor interaction). The average yield for the entire experiment was 6.25 t·ha⁻¹.
Influence of Crop System and Meteorological Conditions: Cultivation system significantly differentiated the efficiency of dry matter accumulation (statistically insignificant for percentage content but highly differentiating for yield per hectare based on tuber weight). Integrated system: Average yield was 8.76 t·ha⁻¹, which is 135% higher than in the organic system (3.73 t·ha⁻¹) (
Table 11).
The highest average yield was recorded in 2022 (8.04 t·ha⁻¹), while 2024 yielded the lowest (4.26 t·ha⁻¹), which was due to extremely unfavorable rainfall conditions that limited yields.
Genotypic Variability: Variety selection had a significant impact on final dry matter yield. Yield Leaders: The Lawenda variety achieved the highest average yield (7.08 t·ha⁻¹), demonstrating the highest efficiency in the organic system (4.94 t·ha⁻¹). High Potential: The Ignacy and Magnolia varieties demonstrated very high yields in the integrated system (9.58 and 9.43 t·ha⁻¹, respectively), which predisposes them to intensive cultivation technologies. Lowest Yield: The Hetman and Stokrotka varieties demonstrated significantly lower yield parameters compared to the leaders (
Table 11).
Statistical analysis revealed significant System × Year and System × Variety interactions, demonstrating that the response of individual genotypes to environmental conditions is closely modified by the level of agricultural technology. In the integrated system, the highest dry matter yield was achieved in 2023, while in the organic system, the best results were recorded in 2022. The Gwiazda variety showed one of the highest responses to crop intensification – its yield increased from 3.42 t·ha⁻¹ in the organic system to 8.90 t·ha⁻¹ in the integrated system (
Table 11).
Conclusions for sustainable crop management: The results indicate the Lawenda variety as the variety with the highest stability and yield, recommended for organic farming in the Małopolska region. In the integrated system, the Ignacy and Magnolia varieties guarantee the highest production efficiency, as they best utilize optimal growth conditions to build dry matter biomass.
3.8. Phenotypic Variability of Yield, Its Structure and Quality
Variance structure analysis identified key factors influencing potato productivity and quality. The results demonstrate the dominant influence of environmental factors and their complex interactions with genotype (
Table 12).
Dominance of cultivation system (E): Cultivation system was the main source of variability for total yield (55.3%) and marketable yield (52.1%). A strong influence of this factor was also noted for the extreme tuber size fractions: the smallest <35 mm (33.5%) and the largest >60 mm (43.4%). This indicates that the intensity of agricultural practices and the level of plant protection are decisive for production volume and tuber size (
Table 12).
Importance of genotype-environment interactions: The GxE interaction played a key role in shaping the share of the 36–50 mm fraction (34.1%) and total yield (24.0%). This indicates the varying plasticity of varieties – some genotypes demonstrate specific suitability for organic systems, while others require all integrated conditions to fully express the variety’s potential. Year x Variety interaction was particularly significant for quality traits, including starch content (24.1%) and dry matter content (23.6%). This high contribution of this interaction demonstrates that the stability of cultivar quality parameters in the face of changing weather conditions is a highly dynamic trait (
Table 12).
The role of genotype (G) and the three-way interaction (E x G x Y): The contribution of cultivar alone to yield variance was relatively low (12.1–13.6%), but significantly higher for quality traits such as starch content (18.1%). This confirms that quality parameters are more strongly genetically determined than quantitative traits (yield) (
Table 12).
A high contribution of the three-way interaction was also noted for total yield (24.0%) and dry matter content (15.1%), highlighting the extreme complexity of the physiological processes occurring in the agroecosystem (
Table 12).
3.9. Descriptive Statistics of Potato Characteristics
The table below presents descriptive statistics for key yield characteristics, chemical composition, and dry matter and starch content in potato tubers. This analysis allows for an understanding of the distribution, variability, and typical values for each of the characteristics studied (
Table 13).
Analysis of statistical parameters revealed high variability of the studied traits, which reflects the strong influence of experimental factors on potato yield biology. Variability of yield and yield: Total yield (y) and marketable yield (x5) were characterized by a very high coefficient of variation (V > 5%), with a wide range of values (9.70–63.12 t·ha⁻¹ of total yield and 8.96–61.10 t·ha⁻¹ of marketable yield, respectively). Similar dynamics were noted for starch yield (x7) and dry matter (x9), where the maximum values were almost six times higher than the minimum. Tuber fractional structure: The highest variability (V = 66.17) was noted for the large tuber fraction (x4 - >60 mm), indicating its high sensitivity to the cultivation system and rainfall conditions. This fraction also had the widest range of results (Range = 65.60) (
Table 13).
Stability of qualitative traits: Starch content (x6) and dry matter (x8) proved to be the most stable traits, with the lowest coefficients of variation (V approx. 14.7–14.9%). The mean values of these parameters were 13.76% and 18.38%, respectively. Data distribution: Most of the studied traits (except x3) showed positive skewness (Skewness), indicating an asymmetry in the distribution toward higher values. Negative kurtosis values for yield (y, x5) and productivity (x7, x9) suggest a flattened distribution (platykurtosis), confirming significant differences between the study years and cultivation systems (
Table 13).
Therefore, the high coefficient of variation for quantitative traits (y, x5, x7, x9) with simultaneous stability of qualitative parameters (x6, x8) proves that while the volume of potato production is strongly dependent on agrotechnical interventions, the biological value of tubers remains a relatively constant varietal characteristic.
3.10. Pearson Correlations Between Yield and Tuber Quality Traits
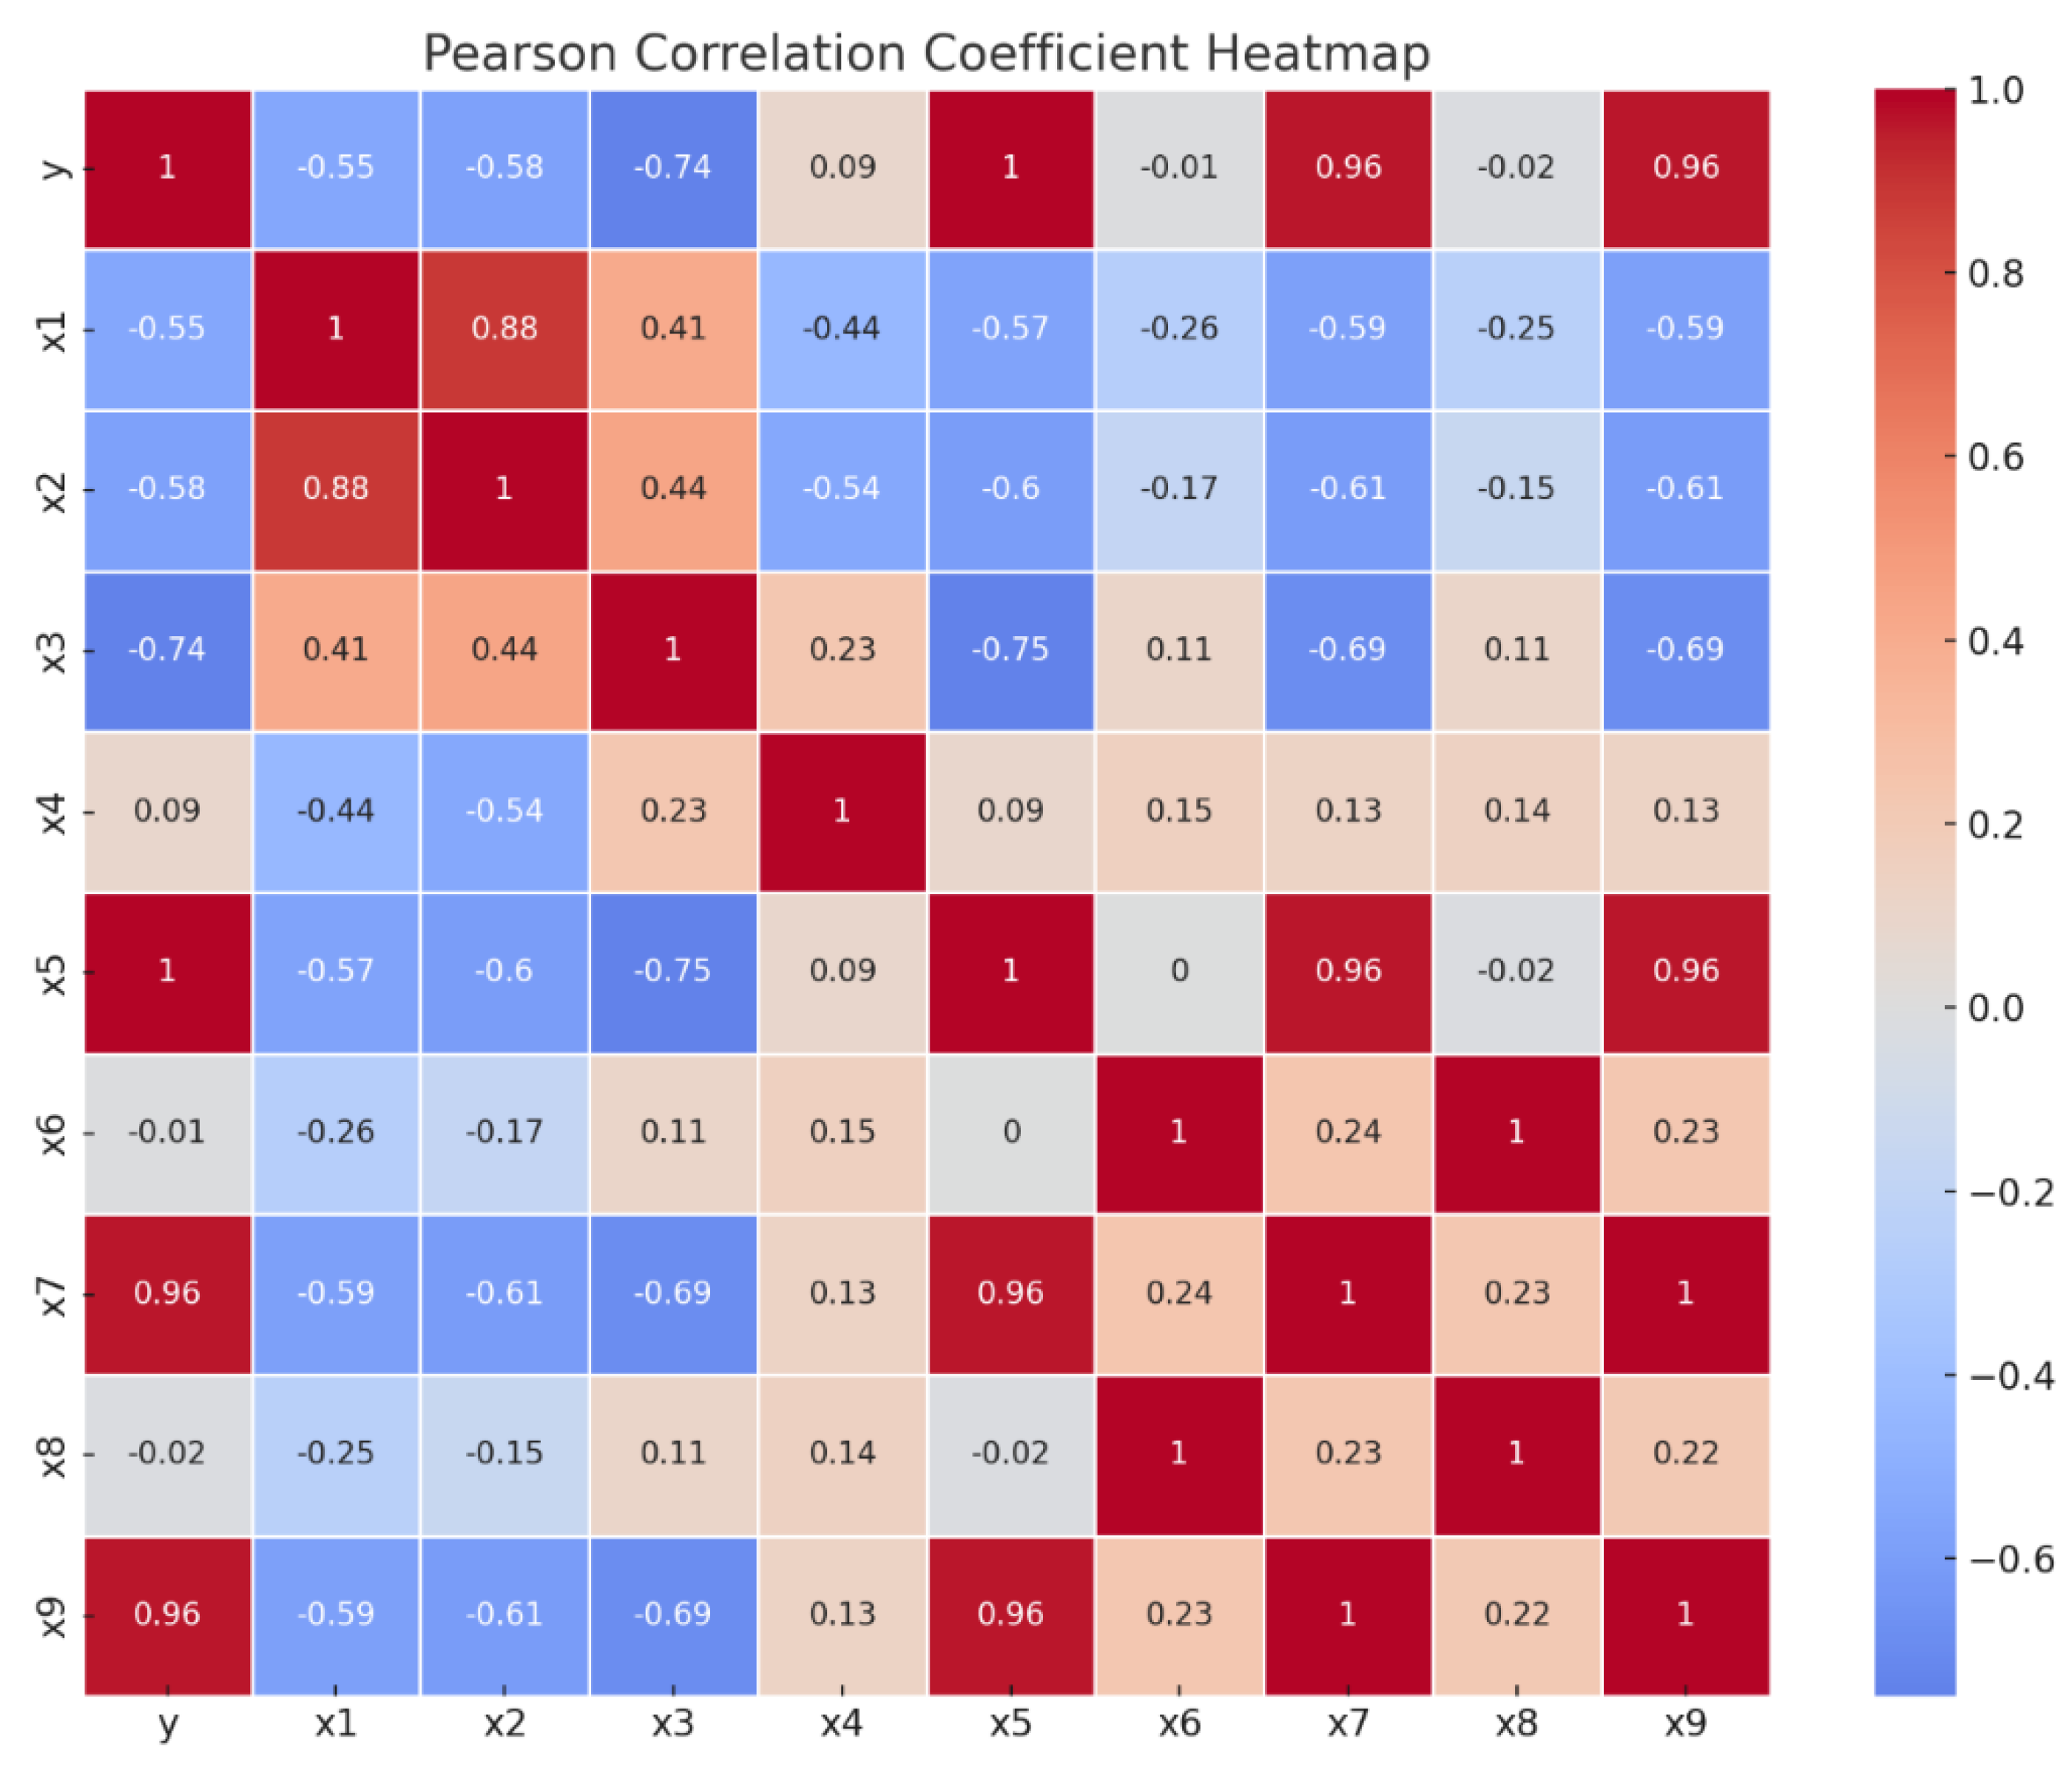
The following analysis presents Pearson correlation coefficients, which measure the strength and direction of the linear relationship between the potato tuber traits studied.
Values close to 1 or -1 indicate a strong relationship, while values close to 0 indicate no linear relationship (
Figure 3).
Figure 3 presents a Pearson correlation matrix (Heatmap), which illustrates the strength and direction of the relationships between the studied yield and potato quality traits. Key relationships include: A high positive correlation (r = 0.96) between total yield (y) and marketable yield (x5) and starch yield (x7) and dry matter yield (x9). This indicates that the total mass of tubers harvested is the main factor determining the final yield of these components per hectare.
Fractional relationships: Yield (y, x5) was found to be negatively correlated with the proportion of small (x1: r = -0.55) and medium-sized tubers (x3: r = -0.74). This confirms that higher yields are associated with a shift in the structure toward larger fractions (
Figure 3).
Qualitative stability: A very strong positive correlation (r = 1.0) was observed between starch content (x6) and dry matter content (x8). At the same time, both of these parameters showed a near-zero correlation with total yield (r = -0.01 to -0.02), demonstrating that the concentration of these components in the tuber is independent of the yield obtained (
Figure 3).
Therefore, the strategy of increasing total yield directly translates into increased starch and dry matter yield per unit area, despite having no effect on their percentage content in the tuber mass itself.
4. Discussion
4.1. Efficiency of Cultivation Systems and Yield Quality and Stability
Our research confirms the dominance of the integrated system in generating high and stable yields. Fertilization (N 100, P 80, K 120 kg·ha⁻¹) allowed for effective pest control, minimizing losses in total yield, starch, and dry matter. Despite its production advantage, this system is associated with environmental degradation, soil acidification, and the risk of pesticide residues. In terms of tuber quality, the organic system—despite significantly lower yields—is technologically equivalent to the integrated system. The average starch content in both systems was similar (13.67% vs. 13.86%), suggesting high physiological stability of the starch biosynthesis process. These results correspond to the work of Murawska et al. [
1], indicating the possibility of achieving even higher starch concentrations in the organic system. In turn, the literature on low-input systems emphasizes that they may promote vitamin C accumulation more than purely organic systems [
32,
34,
35]. A key aspect of the discussion is the genotype-environment interaction (G×E). Low variability in starch and dry matter content between systems, coupled with strong varietal differentiation, demonstrates that qualitative traits are genetically determined more strongly than quantitative traits. While the cultivation system accounts for over 50% of yield variability, the variance of qualitative traits depends more on the variety and its response to weather conditions in a given year (Yx V). In the face of climate change, breeding stable yielding genotypes (e.g., lavender) under limited chemical protection is becoming a priority for sustainable agriculture.
4.2. Yield Structure and Commercial Value in Relation to Varietal Variability
Tuber size structure is one of the most variable parameters of potato production, subject to significant modification by agrotechnical factors and hydrothermal conditions during the tuberization phase. Our research showed that the cultivation system determined 43.4% of the variance in the largest fraction (>60 mm) and 33.5% of the variance in small tubers (<35 mm). Similar results were obtained by Zarzyńska and Olszewski [
36] and Catena Petrary et al. [
37].
The dominance of the integrated system was reflected in the higher share of the marketable fraction in this system. This resulted from the optimal supply of plants with macronutrients and full protection against pathogens. The stability of industrial calibration in sustainable systems is crucial for ensuring the repeatability of the raw material, as confirmed by research on precision agricultural technologies [
38,
39]. Challenges of organic farming: The significantly higher proportion of small tubers (<35 mm) observed is typical for crops with limited nitrogen fertilization and higher weed infestation [
34,
38,
39,
40]. Reduced leaf assimilation area and weed competition in this system limit the plant’s ability to effectively feed all established tubers [
11,
12,
17].
Genotype × Environment (G × E) Interaction: Analysis of the System × Variety interaction, accounting for 24.0% of the yield variance, demonstrates that genotypes differ in their resistance to environmental stresses. Among the varieties studied, only Lawenda demonstrated unique plasticity, maintaining a high share of the marketable fraction in the organic system, making it a leader in stability under low-input conditions. Rymuza et al. [
41] examined the structure of the genotype-environment interaction of nine potato varieties using principal component analysis. They found significant variation in potato cultivar yields across locations in subsequent years of study. These cultivars were strongly influenced by environmental conditions, meaning they were unpredictable and unstable. Knowledge about cultivar responses to different environmental conditions allows for the selection of the most appropriate cultivar for specific soil and climatic conditions on a given farm. To date, studies on cultivar stability and genotype-environment interaction analysis of edible potato cultivars grown in Poland have been sparse [
31,
38,
41].
Influence of the year factor and abiotic stress: The high Year × System interaction (13.4% for fractions >60 mm) suggests that favorable rainfall distribution may only partially compensate for mineral fertilization deficits, but this phenomenon is strongly dependent on the architecture of the root system and plant vigor [
42]. The Ignacy and Gwiazda varieties fully exploited their potential in 2022 in the integrated system, achieving record marketable yields exceeding 50 t·ha⁻¹. Water shortages, as in 2024, drastically limited the tuberization process, which particularly affected drought-sensitive varieties. Therefore, the variability of the marketable fraction was a result of the variety’s genetic potential and the stability of the growing environment. While the integrated system guarantees stable industrial calibration, in organic farming, the selection of a flexible genotype characterized by tolerance to abiotic stresses (e.g., lavender) becomes the main factor determining the market value of production.
4.3. Increasing the Competitiveness of Potato Cultivation in Organic Farming – the Role of Genotype and Genotype–Environment Interactions
Increasing the competitiveness of potato cultivation in organic farming represents a major challenge for sustainable food production systems. Achieving this objective requires the introduction of cultivars characterized by high and stable yields as well as appropriate quality parameters that meet both market requirements and consumer expectations [
33,
36]. In organic farming systems, where the use of synthetic fertilizers and chemical plant protection products is restricted, the choice of an appropriate cultivar becomes a key determinant of production success.
4.3.1. Genotype, Yield and Quality Traits
Regardless of the cultivation system, genetic traits of potato cultivars play a fundamental role in determining tuber yield and quality parameters, including chemical composition. This relationship has been widely documented in previous studies [
2,
31,
32,
35,
37] and is confirmed by the results of the present research. The studied cultivars differed significantly in yield potential as well as in their ability to accumulate starch and dry matter. These differences underline the necessity of precise cultivar selection adapted to the specific conditions of a given production system, particularly in organic farming. Traits such as earliness, resistance to late blight and other pathogens, and efficient nutrient utilization are especially important under low-input conditions [
5,
35,
36,
37,
50,
51].
4.3.2. Environmental Effects and Genotype–Environment Interactions
Although potato yield and many quality traits are largely genetically determined, they are strongly modified by environmental factors, including weather conditions (temperature, precipitation and solar radiation), soil properties and applied agricultural practices [
3,
38]. In organic farming systems, which are often characterized by greater heterogeneity and lower input intensity, these interactions become more complex and pronounced.
Understanding genotype–environment interactions (G×E), defined as the differential response of genotypes to varying environmental conditions, is therefore essential for assessing the adaptive potential of potato cultivars. In organic systems, where variability in nutrient availability, weed pressure and pathogen occurrence is typically higher due to the absence of chemical control measures, the role of G×E interactions is particularly critical. Identifying cultivars that not only perform well under optimal conditions but also exhibit stability and resilience under fluctuating environmental conditions is a prerequisite for improving the competitiveness of organic potato production.
4.3.3. Variety Stability and Future Research Directions
The magnitude of genotype–environment interactions provide a direct measure of cultivar stability. Stability, understood as the ability of a cultivar to maintain high and predictable levels of yield and quality across diverse environments, is a highly desirable trait in organic farming systems. Reliable assessment of stability and detailed analysis of G×E interactions, often supported by advanced statistical tools such as AMMI or GGE biplot models, enable precise recommendations of cultivars adapted to a wide range of environmental conditions [
39,
40,
41,
51].
In the context of climate change and the increasing demand for sustainably produced food, research on G×E interactions and cultivar stability under organic conditions is gaining strategic importance. Such research contributes to reducing production risks, optimizing the use of natural resources and enhancing the resilience of agricultural systems to unpredictable climatic conditions. Future studies should focus on identifying genetic markers associated with yield stability under low-input conditions and on multi-environment field testing across diverse organic farming systems. In addition, the application of omics technologies (genomics, transcriptomics and metabolomics) may provide deeper insight into the molecular mechanisms underlying resistance and adaptation, facilitating faster and more precise cultivar selection.
4.4. Limitations of Organic and Integrated Systems
Both organic and integrated farming systems, despite their specific advantages, face a range of limitations that affect their productivity, sustainability and capacity to meet global food demand. Identifying and understanding these constraints is essential for developing more resilient and integrated agricultural systems.
4.4.1. Limitations of Organic Farming Systems
Organic farming, although widely recognized for its reduced environmental impact and promotion of biodiversity, faces several challenges that may restrict its broader adoption. One of the main constraints is lower unit yields compared to integrated farming, particularly under less favorable environmental conditions or for cultivars poorly adapted to organic systems. Limited access to synthetic fertilizers and chemical plant protection products often reduces yield potential [
13,
34,
37]. As a consequence, a larger land area may be required to produce equivalent amounts of food, raising concerns about the ability of organic agriculture to meet the demands of a growing population.
Pest, disease and weed management constitute another major challenge. The prohibition of synthetic pesticides forces organic farmers to rely on biological, agrotechnical and mechanical control methods, such as crop rotation, mechanical weeding and cultivar selection. These approaches are often more labor-intensive, require advanced knowledge and may be less predictable under high pest or pathogen pressure [
5,
14,
35,
42]. Limited availability and high costs of organic fertilizers, especially on farms without livestock production, further constrain nutrient supply and may lead to soil nutrient deficiencies and reduced yields [
13].
Additionally, organic farming is associated with increased labor requirements and higher production costs, which are reflected in higher market prices of organic products. Although consumer demand for organic food is increasing, higher prices may limit market accessibility and slow the expansion of organic production [
36]. Effective management of organic systems also requires extensive knowledge of agroecosystem functioning, soil–plant–microorganism interactions and pest biology, which may represent a barrier for farmers lacking adequate training [
3].
4.4.2. Limitations of Integrated Farming Systems
Integrated farming systems, while highly productive in the short term, pose significant environmental and social challenges. Intensive use of mineral fertilizers contributes to water eutrophication, greenhouse gas emissions and degradation of soil biodiversity. Excessive pesticide use contaminates soil and water resources, threatens non-target organisms such as pollinators and may lead to the accumulation of harmful residues in the food chain [
10].
Another critical issue is the development of resistance among pests, diseases and weeds due to repeated application of the same chemical substances. This phenomenon necessitates the use of higher doses or new, often more expensive, agrochemicals, increasing both production costs and environmental pressure [
11,
14]. Furthermore, integrated farming practices may lead to soil organic matter depletion, erosion and reduced microbial activity, resulting in long-term declines in soil fertility and increased dependence on external inputs [
10,
37].
Human health risks associated with pesticide exposure and significant external environmental costs not reflected in market prices further challenge the sustainability of integrated agriculture [
9,
10]. In addition, the strong dependence on fossil fuels for the production of fertilizers and pesticides increases vulnerability to energy price fluctuations and contributes to greenhouse gas emissions [
10].
Overall, the analysis of both systems indicates that neither organic nor integrated farming alone provides a comprehensive solution to current agricultural challenges. Organic farming must address issues related to productivity and pest management, while integrated systems must substantially reduce their environmental and health impacts [
10,
11]. In the context of climate change and global food security, the development of integrated and hybrid production systems combining the strengths of both approaches appears to be a promising direction.
4.5. Potato Yield Determinants – The Role of Environment, Genotype and Genotype–Environment Interactions
The results of the present study indicate that environmental conditions, represented by cultivation systems, exert a dominant influence on potato yield and its structure, surpassing the direct effect of genotype. Genotype–environment interactions accounted for 25.1% of yield variability, which is consistent with findings reported by Jankowska and Pietraszko [
42], who also observed a stronger influence of the environment compared to genotype. Although the relative contribution of these factors may vary depending on experimental conditions [
43], studies by Sawicka and Pszczółkowski [
44,
45] demonstrate that interactions between cultivars and years can explain up to 92.7% of yield variability, highlighting their critical importance under conditions of climatic instability.
These results confirm that, despite the genetic yield potential of potato cultivars, it is the complex interaction between genotype and environment that ultimately determines yield performance. This underscores the necessity of selecting cultivars characterized not only by high productivity but also by high stability and adaptability, particularly in organic farming systems exposed to variable environmental conditions.
4.6. Latest Perspectives in Sustainable Potato Cultivation
Modern potato research is increasingly adopting a holistic approach that integrates yield, tuber quality, and environmental sustainability. In addition to integrated production systems, innovative technologies supporting low-input and organic agriculture are receiving increasing attention.
Biostimulants can improve nutrient efficiency and plant resilience, thereby reducing the ecological footprint of potato production [
10,
17,
43,
44,
45,
46,
47,
48,
49,
50,
51,
52]. Implementing management practices that enhance ecosystem services, such as natural soil fertility and biological pest management, is also considered essential for increasing sustainability [
7,
8,
10]. Research by Crowder et al. [
11] demonstrates that enhancing natural antagonist complexes, including beneficial insects and pathogens, can significantly improve potato beetle control in potato agroecosystems.
Optimizing natural and organic fertilization remains a key area of research. Our own studies confirm the positive impact of organic and natural fertilizers on nutrient availability and tuber yield [
10,
37]. Previous studies have shown an increase in starch content under organic fertilization conditions [
46,
47], although conflicting results have also been observed [
32], highlighting the importance of site- and cultivar-specific responses. Pszczółkowski and Sawicka [
53] presented high yields achieved through mineral fertilization combined with integrated pest management [
37], as well as promising effects of effective microorganisms supplemented with plant extracts. They identified the significant potential of integrated biostimulation strategies in organic systems.
Precision agronomy and innovative cultivation techniques are gaining importance in potato production. Precision farming technologies, including optimization of plant density, row spacing, and irrigation management, enable better decision-making based on real-time data on soil conditions, crop growth, and [10,11,49–51pest pressure. According to Uzair and Sharma [
48], these technologies can significantly improve resource efficiency while reducing environmental impact. They are expected to play an increasingly important role in the development of modern organic farming systems [
53,
54].
Climate change and breeding strategies represent one of the greatest challenges for modern potato cultivation. The increasing frequency of drought and heat stress negatively impacts yield and tuber quality [
10,
49]. Traditionally, breeding for organic agriculture has focused on early maturity and resistance to late blight (P. infestans) [
10,
32,
36]. However, breeding priorities are currently shifting toward the development of genotypes with multiple resistance to viruses (PVY, PLRV, PVS, PVX), nematodes (
Globodera spp.,
Meloidogyne spp.), and bacterial wilt, as well as increased tolerance to abiotic stresses such as heat, drought, and salinity [
10,
11,
49,
50,
51]. Root system traits that improve water and nutrient uptake are also increasingly recognized as key to stress resistance. Research by Grudzińska et al. [
50] indicates significant differences in physiological responses to drought and storage conditions depending on the variety, highlighting the importance of stress-adapted breeding strategies. In summary, although organic potato cultivation is often associated with lower yields, it can offer benefits in terms of nutritional quality. Growing consumer demand for sustainably produced food emphasizes the need for further research integrating genotype, environment, and agronomic practices. Such an approach is essential to improving the sustainability, quality, and competitiveness of potato production in organic and low-input systems [
51,
52,
54]. Początek formularza
4.7. Practical Implications of the Results
The lack of significance of the three-way interaction (System × Variety × Year) for most quality traits is a key finding with practical implications. This suggests that farmers can predict the technological quality of raw materials (starch and dry matter content) with high confidence based solely on informed genotype selection, regardless of the destabilizing impact of weather fluctuations in the organic system.
Innovative implementation aspects:
– Technological predictability in organic farming: These results challenge the stereotype of unpredictable raw material quality from organic crops, demonstrating the physiological stability of biosynthetic processes in selected genotypes. This represents an innovative approach to production planning for food processing, where the repeatability of dry matter parameters is crucial.
– Variety selection optimization (Case Study: Lawenda): The research promotes the Lawenda variety as an innovative element of sustainable crop management in the southern Polish region. Thanks to its unique plasticity and tolerance to abiotic stresses, this variety allows for obtaining a satisfactory marketable fraction with minimal input (low input), which aligns with the European Green Deal strategy.
– Precise selection for plant architecture: The demonstrated relationship between variety vigor and yield stability in dry years (2024) suggests the need to implement innovative methods of phenotyping root systems in breeding practice. Varieties with stronger initial vigor, such as Ignacy and Gwiazda, can provide a basis for precision farming in integrated systems, optimizing the use of water and mineral resources.
4.8. Recommendations for Potato Breeders and Producers
Prioritizing Total Yield: Due to the very strong correlation (r = 0.96) between total yield and starch and dry matter yield, the primary breeding and agronomic goal should be increasing total tuber biomass. Any increase in yield translates directly into a greater amount of components obtained per unit area. Selection for Quality Stability: Because starch and dry matter content have a near-zero correlation with yield (r = -0.02), independent selection of genotypes with high quality potential can be conducted without fear of yield decline. Sizing Optimization: The negative correlation between yield and the proportion of small (r = -0.55) and medium (r = -0.74) tubers indicate that high-yield technologies naturally promote the coarser fraction, which is desirable in integrated systems. Selecting varieties for systems: In organic systems, it’s best to choose varieties with high natural resistance, such as Lawenda, which maintains a favorable yield structure and high starch yield despite challenging conditions. In integrated systems, maximized yields will be achieved with varieties like Ignacy and Magnolia, which best utilize optimal conditions to achieve record dry matter yields (over 9 t·ha⁻¹). Monitoring technological parameters: Due to the full correlation (r = 1.0) between starch content and dry matter, in breeding practice, monitoring just one of these parameters (e.g., using the specific gravity method) is sufficient, significantly simplifying and accelerating the quality assessment of the raw material. These relationships confirm that the key to success is combining genetics with high nutrient concentration (as in the Magnolia variety) with a cultivation system that ensures high total tuber mass.
5. Conclusions
Research conducted between 2022 and 2024 on the impact of cultivation systems (organic and integrated) on the productivity of selected potato varieties in the Kraków Upland allows for the following conclusions:
Efficiency of cultivation systems: The integrated system provided a clear advantage in terms of productivity, achieving an average total yield of 48.2 t·ha⁻¹ and a marketable yield of 45.90 t·ha⁻¹. In the organic system, a yield decrease of approximately 57-60% was observed, which was the result of strong pathogen pressure.
Stability of quality traits: The cultivation system did not significantly affect the percentage of starch and dry matter in tubers. This indicates that these parameters are strongly influenced by genetics and environmental factors (weather), and organically grown potatoes retain their full technological and nutritional value, despite the lower yield per unit area. 3. Yield structure and commercial value: The integrated system promoted the development of large tubers (>60 mm in diameter). In the organic system, smaller tubers predominated, which resulted from the shortening of the growing season by potato blight (P. infestans).
The role of meteorological factors: The greatest differences in yield occurred in 2023, characterized by a wet spring that favored infections. In contrast, an extremely dry May in 2024 limited the number of established tubers in both systems, resulting in the lowest starch and dry matter yields.
-
Variety recommendations:
- –
For organic farming: The Lawenda variety demonstrated the best adaptation and the highest stability of marketable yield and dry matter yield.
- –
For intensive farming: The Ignacy and Gwiazda varieties demonstrated the highest production potential in the integrated system. In terms of quality (starch/dry matter): The Magnolia variety, regardless of the cultivation system, achieved the highest quality parameters (on average 23.27% dry matter), which makes it an ideal raw material for processing.
Applying research results to agricultural practice reduces production risk by shifting the management burden from costly chemical protection to the variety’s biological potential. The innovation here involves using “genetic stability” as a tool to compensate for the lack of synthetic inputs in organic farming, guaranteeing stable income for producers while simultaneously protecting soil biodiversity.
Applicable conclusions: Contextual variety selection: There is no single “best” variety; Selection must consider the specific system (organic vs. integrated).
Agronomic management: Optimizing inputs within the selected system is the most powerful tool for shaping marketable yield. Breeding priorities: High Year x Variety interaction indicates that breeding genotypes that yield consistently under weather stress are essential to ensuring food security in the era of climate change.
Author Contributions
Conceptualization. PP, BS; methodology. PP, HB, BS; software. PB; validation. BS, PB; formal analysis. BS, PB; investigation. HB, PP; resources. PP, PB.; data curation. PB.; writing—original draft preparation. PP, BS, HB, PB.; writing—review and editing. BS, HB.; visualization. PP, PB; supervision. BS, HB; project administration. PP; funding acquisition PP. All authors have read and agreed to the published version of the manuscript.
Funding
This research received no external funding.
Data Availability Statement
Data is available from the first Author.
Acknowledgments
We would like to thank COBORU in Słupia Wielka for administrative and technical support, as well as donations in kind (in the form of materials used for the experiments).
Conflicts of Interest
The authors declare no conflicts of interest.
References
- Murawska, B.; Piekut, A.; Jachymska, J; Mitura, K; Madajska, KJ. Ekologiczny i konwencjonalny system gospodarowania a wielkość i jakość plonu wybranych roślin uprawnych. Infrastruktura i Ekologia Terenów Wiejskich/Infrastructure And Ecology of Rural Areas 2015, 3, 663–675. Available online: http://dx.medra.org/10.14597/infraeco.2015.3.1.053.
- Tokbergenova, Z; Aitbayev, T; Sharipova, D; Jantassova, A; Makhanova, G; Ibraiymova, M; Konysbayeva, H. Potato (Solanum tuberosum l.) healthy planting material development through innovative method. SABRAO Journal of Breeding and Genetics 2025, 57(3), 1168–1179. [Google Scholar] [CrossRef]
- Zarzyńska, K.; Trawczyński, C.; Pietraszko, M. Environmental and Agronomical Factors Limiting Differences in Potato Yielding between Organic and Conventional Production System. Agriculture 2023, 13, 901. [Google Scholar] [CrossRef]
- Przystalski, M; Lenartowicz, T. Organic system vs. conventional – a Bayesian analysis of Polish potato post-registration trials. J. Agric. Sci. 2023, 161, 97–108. [Google Scholar] [CrossRef]
- Trawczyński, C. Assessment of potato yield stability in organic cultivation. Agronomy Sci. 2024, 79(3), 99–112. [Google Scholar]
- Sawicka, B.; Barbaś, P.; Kuś, J. Variability of potato yield and its structure in organic and integrated crop production systems. EJPAU 2007, 10(1), 02. Available online: http://www.ejpau.media.pl/volume10/issue1/art-02.html.
- Mayer, J.; Scheid, S.; Widmer, F.; Liebich, A.; Oberholzer, HR. How effective are ‘Effective microorganisms® (EM)’? Results from a field study in temperate climate. Applied Soil Ecology 2010, 46(2), 230–239. [Google Scholar] [CrossRef]
- Pszczółkowski, P.; Sawicka, B. The effect of application of biopreparations and fungicides on the yield and selected parameters of seed value of seed potatoes. Acta Agrophysica 2018, 25(2), 239–255. [Google Scholar] [CrossRef]
- Pszczółkowski, P.; Sawicka, B.; Danilčenko, H. Effect of bioreporters on dry matter, starching and vitamin C in potato tubers. Agronomy Sciences 2019, 74(3), 47-56, CC BY–NC–ND. [Google Scholar] [CrossRef]
- Devaux, A.; Goffart, JP.; Kromann, P.; et al. The Potato of the Future: Opportunities and Challenges in Sustainable Agri-food Systems. Potato Res. 2021, 64, 681–720. [Google Scholar] [CrossRef]
- Devaux, A; Goffart, JP; Kromann, P; Toth, I; Braguard, C; Declerck, S. Report on-EAPR Workshop 2017 on Biocontrol and Biostimulants agents for the potato crop. Ziemniak Res 2017, 60, 291. [Google Scholar] [CrossRef]
- Crowder, DW; et al. Organic agriculture promotes evenness and natural pest control. Nat 2010, 46, 109–112. [Google Scholar] [CrossRef] [PubMed]
- Fantaw, S.; Ayalew, A.; Tadesse, D.; Medhin, Z.G.; Agegnehu, E. Evaluation of potato (Solanum tuberosum L.) varieties for yield and yield components. Journal of Horticulture and Forestry 2019, 11(3), 48–53. [Google Scholar] [CrossRef]
- Ierna, A.; Distefano, M. Crop Nutrition and Soil Fertility Management in Organic Potato Production Systems. Horticulturae 2024, 10, 886. [Google Scholar] [CrossRef]
- Barbaś, P.; Sawicka, B. Dependence of potato yield on weed infestation. Agronomy Research 2020, 18(2), 346–359. [Google Scholar] [CrossRef]
- Chełmnicki, W. Sources of the Kraków-Wieluń and Miechów Uplands; (In Polish). IGIGP UJ Kraków: Publisher, 2001. [Google Scholar]
- Bleinholder, H.L.; Weber, E.; Buhr, L.; Feller, C.; Hess, M.; Wicke, H.; Meier, U.; Van Den Boom, T.; Lancashire, P.; Buhr, D.L.; Hack, H.; Klose, R.; Stauss, R. Compendium of growth stage identification keys for mono-and dicotyledonous plants. BBCH Monograph., 2nd ed. Edited by the Federal Center for Agricultural and Forest Biological Research Uwe Meier. https, //doi.org/10.5073/bbch0461
520 18. ; 2001.
- Zarzecka, K.; Gugała, M.; Sikorska, A.; Grzywacz, K.; Niewęgłowski, M. Marketable Yield of Potato and Its Quantitative Parameters after Application of Herbicides and Biostimulants. Agriculture 2020, 10(49). [Google Scholar] [CrossRef]
- Annex to the decision of the Ministry of Agriculture and Rural Development No. R -223/2018d of 04/07/2018 in Polish.
- Recommendations for the Protection of Agricultural Plants. Volume I. Oilseeds, root crops, legumes and herbs, collective work edited by P. Strażyński. Recommendations for the Protection of Agricultural Plants. Volume I. Oilseeds, Roots, Legumes, and Herbs, collective work edited by P. Strażyński; (in Polish). IOR-PIB Publishing House: Poznań; ISBN 978-83-64655-55-5.
- Duer, I.; Fotyma, M.; Madej, A. Code of Good Agricultural Practice; (in Polish). Ministry of Agriculture and Rural Development: Warsaw, Poland, 2004; p. 93. [Google Scholar]
- Roztropowicz, S.; et al. Methodology of Observation, Measurements and Sampling in Agricultural Experiments with Potatoes, Plant Breeding and Acclimatization Institute; (in Polish). Branch Jadwisin, Poland, 1999; pp. 1–50. [Google Scholar]
- Lenartowicz, T. Potato. Descriptive List of Agricultural Cultivars; (In Polish). COBORU Publishing House: Słupia Wielka, Poland, 2024; p. pp. 40. [Google Scholar]
- Kerłowska-Kułas, M. Food product quality testing; (in Polish). PWE: Warsaw, 1993; pp. 18–187. [Google Scholar]
- WRB. World reference database for soil resources. 2014. Available online: http://www.fao.org/3/a-i3794e.pdf.
- Mocek, A. Soil Science; (in Polish). State Scientific Publisher: Warsaw, Poland, 2015; p. pp. 571. [Google Scholar]
- Kabara, C; Ciconia, M; Chudzinski, P. Correlation of Polish soil classification (2011) and the international World Reference soil classification system based on soil resources (2015). Soil Science Annual 2016, 67(2), 88–100. [Google Scholar] [CrossRef]
- Skowera, B. Changes of hydrothermal conditions in the Polish area (1971−2010). Fragm. Agron. 2014, 31, 74–87. [Google Scholar]
- IBM Statistics SPSS 28. Available online: https://www.ibm.com/docs/en/SSLVMB_28.0.0/pdf/pl/IBM_SPSS_Statistics_Core_System_User_Guide.pdf.
- Biswas, B; Ghosh, DC; Dasgupta, MK; Trivedi, N; Timsina, J; Dobermann, A. 2006 Integrated assessment of cropping systems in the Eastern Indo-Gangetic plain. Field Crop Res 99(1), 35–47. [CrossRef]
- Zarzyńska, K. Productivity of new potato cultivars under organic and conventional production system Biul. IHAR 2023, 299, 21–27. [Google Scholar] [CrossRef]
- Sawicka, B.; Kus, J. Potato yield and quality depend on the crop production system. Pam. Puł In Polish. 2000, 120, 379–390. [Google Scholar]
- Zarzyńska, K.; Goliszewski, W. Role of cultivar in potato organic production. J Res Appl Agric Eng. 2006, 51(2), 214–219. [Google Scholar]
- Macák, M.; Žák, Š.; Polláková, N. Yield and technological quality of ecological and low-input production of potatoes. Journal of Central European Agriculture 2012, 13(3), 579–594. [Google Scholar] [CrossRef]
- Sawicka, B.; Barbaś, P.; Kuś, J. The influence of weed infestation of potato canopy on the total and trade yield under organic and integrated crop production systems. Pamietnik Puławski (in Polish). 2006, 142, 429–443. [Google Scholar]
- Zarzyńska, K.; Goliszewski, W. Odmianowe zróżnicowanie produktywności roślin ziemniaka uprawianych w systemie ekologicznym i integrowanym. Frag. Agron. (in Polish). 2015, 32(3), 113–120. [Google Scholar]
- Catena Petrar, T.M.; Brasovean, I.; Racz, C.-P.; Mîrza, C.M.; Budho’s, P.D.; Mălinas, C.; Moldovan, B.M.; Adagio, A.C.M. The Impact of Agricultural Inputs and Environmental Factors on Potato Yields and Traits. Sustainability 2024, 16, 8759. [Google Scholar] [CrossRef]
- Zarzyńska, K.; Weronika, J. Różnice w jakości plonu bulw ziemniaków uprawianych w systemie ekologicznym w zależności od niektórych czynników agrotechnicznych. J. Res. Appl. Agric. Eng. (in Polish). 2007, 52(4), 148–15. [Google Scholar]
- Flis, B.; Tatarowska, B. Analiza interakcji genotypowo-środowiskowej w odniesieniu do wybranych cech użytkowych ziemniaka jadalnego w różnych systemach uprawy. Biul. IHAR (in Polish). 2019, 286, 239–242. [Google Scholar] [CrossRef]
- Gauch, H. G.; Piepho, H. P.; Annicchiarico, P. Statistical analysis of yield trials by AMMI and GGE: Further considerations. Crop Sci. 2008, 48, 866–889. [Google Scholar] [CrossRef]
- Rymuza, K.; Radzka, E.; Lenartowicz, T. Analiza interakcji genotypowo-środowiskowej średnio wczesnych jadalnych odmian ziemniaka. Biul. IHAR in Polish. 2017, 281, 59–68. [Google Scholar] [CrossRef]
- Jankowska, J.; Pietraszko, M. Analiza stabilności i szerokiej adaptacji plonu ogólnego bulw odmian ziemniaka uprawianych na glebie lekkiej. Biul. IHAR (in Polish). 2021, 294, 61–72. [Google Scholar] [CrossRef]
- Flis, B.; Domański, L.; Zimnoch-Guzowska, E.; Polar, Z.; Pousa, S.A.; Pawlak, A. Stability analysis of agronomic traits in potato cultivars of different origins. Am. J. Pot. Res. 2014, 91, 404–413. [Google Scholar] [CrossRef]
- Sawicka, B.; Pszczółkowski, P. Fenotypowania zmienność struktury plonu odmian ziemniaka w warunkach środkowo-wschodniej Polski. Biul. IHAR (in Polish). 2004, 232, 53–66. [Google Scholar] [CrossRef]
- Sawicka, B.; Pszczółkowski, P. Fenotypowa zmienność plonu i jego struktury bardzo wczesnych i wczesnych odmian ziemniaka. Fragm. Agron. (in Polish). 2017, 34(1), 76–91. [Google Scholar]
- Boligłowa, E.; Gleń, K. Yeilding and quality of potato tubers depending on the kind of organic fertlization and tillage method. EJPAU, ser. Agronomy 2003, 6((1) 03). [Google Scholar]
- Ceglarek, F.; Płaza, A. Wpływ nawożenia wsiewkami międzyplonowymi na jakość bulw ziemniaka uprawianego w rejonie Siedlec. Biuletyn IHAR in Polish. 2000, 213, 109–116. [Google Scholar]
- Uzair, A.; Sharma, L. A review of Best Management Practices for potato crop using Precision Agricultural Technologies. Smart Agric. Tech. 2023, 4, 100220. [Google Scholar] [CrossRef]
- Boguszewska-Mańkowska, D; Zarzyńska, K; Wasilewska-Nascimento, B. Potato (Solanum tuberosum L.) plant shoot and root changes under abiotic stresses – Yield response. Plants 2022, 11(24), 3568. [Google Scholar] [CrossRef]
- Grudzińska, M.; Boguszewska-Mańkowska, D; Zarzyńska, K. Drought stress during the growing season: Changes in reducing sugars, starch content and respiration rate during storage of two potato cultivars differing in drought sensitivity. Journal of Agronomy and Crop Science 2022, 208(5), 609–620. [Google Scholar] [CrossRef]
- Zarzyńska, K; Boguszewska-Mańkowska, D.; Nosalewicz, A. Differences in size and architecture of the potato cultivars root system and their tolerance to drought stress. Plant Soil Environ. 2017, 63(4), 159–164. [Google Scholar] [CrossRef]
- Zarzyńska, K.; Pietraszko, M. : Influence of different vegetation conditions on development and yield of potato plants growing under organic and conventional system in Poland. Amer. J. of Potato Res. 2015, 92(4), 511–517. [Google Scholar] [CrossRef]
- Pszczółkowski, P; Sawicka, B. Effect of the fungicides, microbiological preparations and extracts with herbs on the yield of potato. Fragm. Agron. (in Polish). 35((1) 2018), 81–93. [CrossRef]
- Sawicka, B.; Pszczółkowski, P.; Skiba, D.; Barbaś, P.; Flis-Olszewska, E. Harnessing Effective Microorganisms in Potato Cultivation: Impact on Flesh Darkening and Textures. Preprints 2025. [Google Scholar] [CrossRef]
|
Disclaimer/Publisher’s Note: The statements, opinions and data contained in all publications are solely those of the individual author(s) and contributor(s) and not of MDPI and/or the editor(s). MDPI and/or the editor(s) disclaim responsibility for any injury to people or property resulting from any ideas, methods, instructions or products referred to in the content. |