
Submitted:
12 January 2026
Posted:
14 January 2026
You are already at the latest version
Abstract
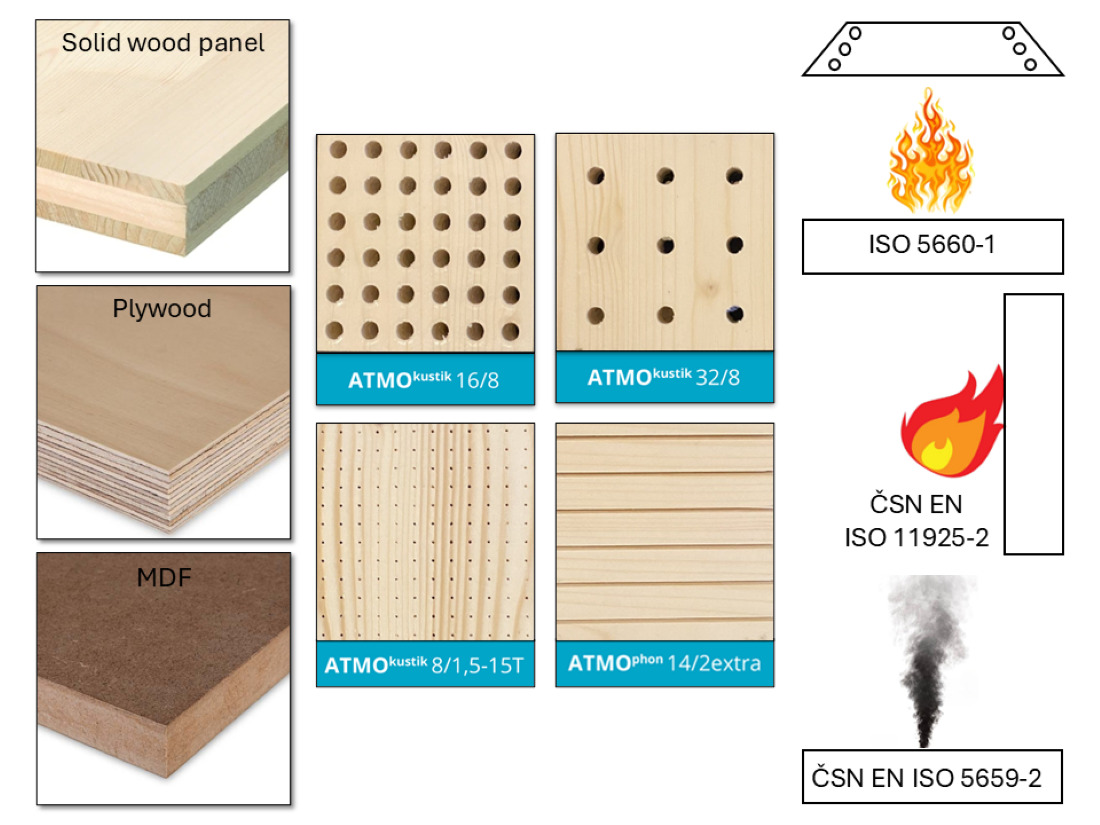
This work deals with the impact of surface acoustic treatment (holes and grooves) and primary material (plywood, MDF, solid wood panel) of acoustic panels on its fire characteristics. Fire characteristics were determined based on the cone calorimeter method, single-flame source test, and smoke generation assessment. In general, birch plywood demonstrated the highest values for heat release rate (HRR), maximum average rate of heat emission (MARHE), and effective heat of combustion (EHC), indicating its higher flammability compared to the other tested materials. MDF generally exhibited the lowest values for heat release rate (HRR) and maximum average rate of heat emission (MARHE), yet under certain perforated configurations, it generated the highest amount of smoke. Solid wood panels exhibited the lowest heat release rate (HRR) but developed the largest charred areas during the single-flame source test. Among the surface treatments, the 16/8 mm treatment resulted in the highest values of effective heat of combustion (EHC) and maximum average rate of heat emission (MARHE), while the 8/1.5–15T treatment exhibited the most rapid increase in heat release rate (HRR), attributed to the swift degradation of its thin surface layer and high void fraction. The presence of holes and grooves increased smoke production, which was most evident in MDF and plywood panels.
Keywords:
acoustic panel
; fire characteristic
; MDF
; plywood
; solid wood panel
1. Introduction
Among wood-based materials, Plywood is one of the oldest, with versatile applications in construction, furniture manufacturing, interior elements, packaging, mold making, etc. It consists of an odd number of veneers that are oriented perpendicularly to each other. Thanks to this composition, plywood has high strength, flexibility, and good thermal and sound insulation properties [1], and with the use of suitable surface veneers, it can also meet higher aesthetic demands. Medium-density fiberboard (MDF) is a sheet material composed of wood fibers, adhesive, and additives, created by pressing under high temperature and pressure [2,3]. MDF is predominantly used in furniture (especially cabinet furniture), kitchen units, wall or ceiling cladding and flush door-skins [4]. The surface of MDF is most often covered with synthetic foil, laminate, or wood veneer, depending on its application. In contrast to the above-mentioned materials, multilayer solid wood panels are made from 3 or 5 thin layers of solid wood, oriented perpendicularly to each other and glued together. These panels have versatile applications in furniture manufacturing (cabinet and bed furniture, kitchen units) [5], construction joinery products (flooring, stairs, wall and ceiling cladding), and for structural purposes (load-bearing structures of pitched roofs, structural elements, beams, cladding for extensions, formwork panels) [6].
Acoustic panels are made from various natural and synthetic materials. A significant portion of currently used acoustic panels are made from wood-based materials. Common wood-based materials include particle boards, fiberboards, OSB, plywood, blockboards, and solid wood panels. The simplest way to influence their sound-absorbing capability is through the structure and arrangement of particles or individual layers in the board itself, for example, by arranging chips or fibers, crossing veneers, increasing the overall thickness of the board, or even the type of adhesive used [7]. However, the composition and arrangement of particles or layers in wood-based materials can only affect acoustic absorption properties to a certain extent. This is why current research and production focus on additional methods of modifying materials for acoustic panels. These include perforations, grooving, 3D products with various cavity systems, Helmholtz resonators, membrane absorbers, and other acoustic metamaterials. The key principle is to absorb the widest possible range of sound waves using the minimum amount of material [8]. Acoustic materials incorporating inline cavity structures, often made from wood-based composites, offer flexible and tailored solutions for optimizing sound absorption and transmission characteristics [9]. Parallel-arranged perforated wood-based panels have demonstrated strong performance in boosting low-frequency sound absorption while maintaining a reduced thickness [10,11]. Additionally, lightweight membrane-type acoustic metamaterials composed of wood-based composites have emerged as promising candidates for broadband sound insulation, delivering high transmission loss with significantly lower weight compared to conventional materials [12].
If wood-based materials are used for acoustic panels, they provide a relatively favorable price, very good acoustic properties, and a more pleasant appearance compared to purely synthetic materials. When acoustic panels are used, entire wall or ceiling surfaces in various interior spaces are often covered, depending on the purpose of the room. Therefore, in the case of a fire, the behavior of the burning in the room largely depends on the properties of the acoustic panels—such as the rate of flame spread, the amount of heat released, the nature of smoke, the formation of combustion products, etc. [13,14]. Wood and wood-based materials produce heat, smoke, and various toxic products during combustion, which can cause health damage or death to humans, and also result in significant property damage [3,15,16,17].
The very important fire characteristics of wood and wood-based materials include heat release rate (HRR), flame spread rate, time to ignition, maximum average rate of heat emission (MARHE), effective heat of combustion (EHC), and smoke generation [13,18]. Many authors state that heat release rate (HRR) is the most important of these properties, as it determines the extent to which a material contributes thermal energy to the combustion process. A higher HRR can accelerate fire development, raise temperatures, and expose structural components to intense heat more rapidly [19,20]. The fire properties of solid wood or biomass have been studied quite intensively. However, wood-based materials have not been explored as thoroughly, with most experiments examining the impact of various flame retardants on the fire properties of these materials [1]. For example, Bekhta et al. [21] investigated the effect of several flame retardants on the fire resistance and shear strength of birch plywood. They found that commercial flame retardants designed for solid wood have the same effect on plywood and can significantly improve it from a flammable to a hardly flammable material. Grexa et al. [22] investigated flammability parameters (heat release rate, total heat release, mass loss, smoke generation) on treated and untreated beech plywood using various flame retardants. They found that the most effective method of reducing flammability using flame retardants is their application both on the veneers and directly into the adhesive mixture. Li et al. [3] investigated MDF of different thicknesses using a cone calorimeter to determine the burning behavior (mass loss rate and heat flux) under different experimental conditions. They found that the thickness of MDF has a significant impact on burning behavior and also found a linear correlation between total incident heat flux and mass loss rate.
This study focuses on the impact of surface acoustic treatments of panels made from various wood-based materials on their fire properties. The acoustic panels were made from three primary materials: solid wood panel, plywood, and MDF.
2. Materials and Methods
Material
Acoustic panels (Atmos Akustik & Industrietischlerei GmbH, Austria) used in the experiment were made from three primary materials:
- a three-layer B/C spruce solid wood panel with a thickness of 19.4 mm,
- a 13-layer birch plywood with a thickness of 18.1 mm, and
- an MDF board with a thickness of 19.2 mm, which was veneered on the face surface with ash veneer.
The reference group (Figure 1) consisted of panels made of primary wood-based material only, without surface acoustic treatment. Non-woven fabric was glued to the underside of all acoustic panels using dispersion adhesive Pattex PV/H Express (Henkel AG & Co. KGaA, Germany), class D2.
Each of these primary materials have other four subgroups with different acoustic surface treatments (Figure 2, Figure 3, Figure 4 and Figure 5). This setup was designed to compare the relative influence of both the primary materials and the acoustic surface treatments on the fire performance of the acoustic panels.
The first subgroup ATMOkustik 16/8 (Figure 2) contained acoustic damping holes. The distance between the central axes of the individual drilled holes was 16 mm and their diameter was 8 mm. The holes were drilled continuously through the entire thickness of the material.
The second subgroup, ATMOkustik 32/8 (Figure 3), featured holes with a diameter of 8 mm arranged at center-to-center distances of 32 mm. These holes extended continuously through the entire thickness of the material.
The third group was ATMOkustik 8/1,5 - 15T (Figure 4), which featured small micro-holes on the front side of the panel with a diameter of 1.5 mm and a spacing of 8 mm between the centers of the holes. The micro-holes were drilled non-through, only to a depth of 3 mm. On the rear side, non-through holes were drilled to a depth of 16 mm with a diameter of 15 mm and a center-to-center spacing of 17 mm.
The last group included panels ATMOphon 14/2extra (Figure 5), which had 2 mm wide grooves milled to a depth of 5 mm on the front side, running along the entire length of the test sample. On the rear side, non-through holes were drilled with a diameter of 9 mm, a center-to-center spacing of 16 mm, and a depth of 16 mm.
Test samples from all types of acoustic panels were conditioned under controlled specific conditions (relative humidity of 65% ± 3% and temperature of 20 °C ± 2 °C) in a Climacell 707 conditioning chamber (BMT Medical Technology Ltd., Czech Republic) to achieve an equilibrium moisture content of 12% according to ISO 13061-1 [23].
Methods
Cone Calorimeter Method
The fire test of materials was conducted using a cone calorimeter from CLASSIC CZ spol. s.r.o., Czech Republic (Figure 6). The testing was carried out in accordance with ISO 5660-1 [24], according to which test samples measuring 100 × 100 mm were prepared, with three samples for each group combining surface acoustic treatment and the primary material.
Before each testing, it was necessary to calibrate the calorimeter to ensure that all measured values were compared against the same baseline. First, the scales were calibrated using a reference weight from the manufacturer. The oxygen concentration in the airflow of 0.024 ± 0.002 m³/s was stabilized at 20.95 ± 0.01%. The third step involved calibrating the heat release rate. A nozzle was inserted under the cone heater, from which methane was released and burned for 180 seconds. The heat of combustion of methane is known. Sensors recorded the heat release rate of the supplied gas, and the values were recalculated using the stoichiometric mass ratio for oxygen and other gases. This yielded the calibration constant C, which is essential for computational operations. In the final calibration step, the radiant heat flux intensity was set to 50 kW/m² with an accuracy of ±2%, corresponding to a heater temperature of 848 °C. A water-cooled heat flux meter was placed approximately 15 ± 5 mm below the cone heater. The calibration of the radiant heat flux intensity lasted 600 seconds.
After calibrating the measuring device, the conditioned test samples were wrapped in aluminium foil, leaving the top surface exposed. The aluminium foil served as a barrier ensuring one side direction of heat and also tray to facilitate handling of the sample after burning. In the next step, prior to the actual testing, a metal holder without an additional grid was placed on the scale and tared. Then, the test sample with the aluminium wrap was placed in the holder (Figure 7), and the entire assembly was inserted into the device on the scale, which displayed only the current weight of the sample including the aluminium wrap, excluding the holder's weight.
The test sample placed under the heater was initially shielded by a shutter for 60 seconds. After that, the shutter was removed, and an artificial ignition was manually triggered using an electric arc to generate sparks. The ignition tip was positioned in the area where pyrolysis gases were forming. The moment flaming combustion began, the time was recorded in the protocol as time to ignition. Each test sample was exposed to heat flux for 1800 seconds (30 minutes). The entire process of one test, including sample replacement, took approximately 32 minutes. The output parameters in the testing of the fire properties of acoustic panels using a cone calorimeter were heat release rate (HRR), mass loss rate (MLR), maximum average rate of heat emission (MARHE), effective heat of combustion (EHC) and time to ignition (TTI).
Single-Flame Source Test
The surface flammability test using the single-flame source test was conducted in accordance with the ČSN EN ISO 11925-2 [25] standard in a laboratory chamber (Figure 8 left) from CLASSIC CZ spol. s.r.o., Czech Republic. For the experiment, test samples measuring 250 × 90 mm were prepared, with three samples for each group combining surface acoustic treatment and the primary material.
A zone was marked on each test sample where the flame effect would be observed. The lower boundary was 40 mm from the bottom edge, and the upper boundary was 150 mm above the marked lower boundary, i.e., 190 mm from the bottom edge of the sample. After marking, the individual test samples were inserted and fixed into holding jaws. The prepared assembly was then suspended on a frame inside the laboratory chamber. A nozzle with a calibration tip was then brought close to the vertically suspended test sample so that the tip touched the marked lower boundary. This calibrated the position and distance of the flame from the test sample. In the next step, the nozzle was retracted, the calibration tip was removed, the gas supply was turned on, and the flame was ignited. After a few minutes, once the flame size stabilized, its height was calibrated using a metal template, and finally, the nozzle with the flame was tilted at a 45° angle.
Next, the test sample was placed in the holder inside the laboratory chamber, and the chamber was closed with glass doors to minimize the influence of external factors. After starting the timer, the test began by bringing the flame horizontally to the lower marked edge of the test sample for 30 seconds (Figure 8 right). The flame was then removed, and the condition of the test sample was evaluated.
The output parameters in the testing of the surface flammability of acoustic panels using a single-flame source test were the height of the charred area (if the flame tip exceeds 150 mm above the point of flame application) and the time at which this occurs as well as flaming droplets/particles.
Smoke Generation - Determination of Optical Density
The smoke generation test was carried out in accordance with the ČSN EN ISO 5659-2 [26] standard, using a smoke chamber (Figure 9) manufactured by CLASSIC CZ spol. s r.o., Czech Republic. For the experiment, test samples measuring 75 × 75 mm were prepared for each group, representing combinations of surface acoustic treatment and primary material.
The device was started together with PC software for measuring the optical density of the light transmission. First, the radiant cone heater was turned on, with a water-cooled heat flux meter placed underneath. After the heat flux stabilized at 25 kW/m², calibration was performed, and the lenses for the light flux were cleaned.
Conditioned test samples were placed on a metal holder, similar in design to that used in the cone calorimeter test, but smaller in size. In this case, the samples were not wrapped in aluminium foil, as they were exposed to heat flux for only 15 minutes, which was not sufficient for complete thermal degradation of the material. The test sample, including the metal holder, was placed on a stand under the heat source so that its exposed top surface was in a horizontal position relative to the radiator. The chamber was then closed, and before each measurement, the light transmission in the photometer was calibrated. After measuring the current light transmission density for calibration, the actual test was initiated. At the same time, the shielding flaps, located between the heat source and the top surface of the sample, were removed. The measurement lasted for 900 seconds (15 minutes). The entire test, including chamber ventilation, took approximately 20 minutes.
The output parameters in the testing of the smoke generation of acoustic panels using a smoke chamber were specific optical density of smoke after 4 and 10 minutes as well as maximum specific optical density of smoke.
Statistical Evaluation
The experimental values were evaluated using multifactorial analysis (ANOVA) with Statistica 14 software (Cloud Software Group, USA). Statistical analysis was based on 95% confidence intervals of the means using Fischer's f-test.
3. Results and Discussion
3.1. Cone Calorimeter
The primary output of cone calorimetry analysis is the heat release rate (HRR). Figure 10, Figure 11 and Figure 12 present the average HRR profiles as a function of time. The results clearly show that the highest HRR values were found for plywood, whereas solid wood panels exhibited the lowest HRR values.
All HRR curves display a characteristic profile typical of lignocellulosic or wood-based materials. An initial sharp increase in HRR occurs shortly after the first minute of testing, coinciding with the removal of the heating coil cover. This rapid increase is predominantly due to intense pyrolysis reactions occurring in the uppermost layers of the material, as organics break down into volatiles and flammable gases when subjected to heat [3,27]. Research by Lowden and Hull [28] indicates that solid wood and MDF exhibit initial HRR spikes due to rapid pyrolysis, leading to the breakdown of organic materials and the release of flammable gases upon heating. This sharp increase in HRR is significant in both solid wood panels and MDF, as it outlines their susceptibility to fire hazards.
As these surface layers undergo pyrolysis, a char layer forms. The formation of this char layer restricts heat and volatile transport from the underlying material, resulting in a notable decrease in HRR. The char's effectiveness as a thermal barrier highlights its role in diminishing heat transfer through its structure, thereby leading to pyrolysis self-limiting effects following the initial phase of thermal exposure [29]. However, prolonged exposure to heat accelerates moisture evaporation and the development of cracks within this char layer [30]. These fissures enable deeper penetration of heat into previously non-pyrolyzed regions, effectively reactivating combustion processes and leading to a secondary HRR peak [31,32].
Following the secondary peak in the heat release rate (HRR), there is a gradual decline as the more volatile compounds within the wood materials are exhausted. This decrease corresponds with well-established observations related to the pyrolysis process of lignocellulosic materials, during which they predominantly transform into gaseous products and char under elevated temperatures. Research has shown that the pyrolysis of wood produces volatile gases and tars and significantly alters the structural composition of the material as these compounds are released [33,34].
As the combustion process progresses, the rate of HRR diminishes, aligning with the depletion of these volatile components, leading to a state where combustion is primarily driven by the char residue left behind [35]. This phenomenon underscores the significance of char as a thermal mass that influences the combustion dynamics, as demonstrated by Kim and Nam [36], who tested MDF, Plywood and chipboard under heat flux 50 kW/m2. The eventual extinction of the HRR occurs when the remaining combustible constituents have been completely consumed. This stage of pyrolysis varies based on the thermal history, chemical composition, and structural integrity of the materials involved, as it determines the remaining fuel available for combustion [37].
A comparison of peak heat release rate (pHRR) values is presented in Figure 13. The data clearly demonstrates that plywood exhibits the highest peaks of HRRs among all tested materials, whereas MDF consistently yields the lowest values. The influence of acoustic surface treatments is also pronounced, highlighting the significant role of surface geometry in modulating thermal response.
The acoustic surface treatment of the panels—specifically, the characteristics of the area exposed to the incident heat flux—has a significant impact on both the progression and magnitude of the heat release rate (HRR) curve. The introduction of perforations increases the effective surface area subjected to thermal exposure, potentially enhancing the total heat release [38]. However, this relationship is likely non-linear, as the thermal conditions at the edges of perforations differ from those on flat, continuous surfaces. This phenomenon closely investigated Peng et al. [39], who tested influence of hole geometry in spruce wood on heat transfer. Their results reveal that the geometric characteristics of perforations create complex thermal dynamics that directly influence heat conduction patterns.
As shown in Table 1, which compares the flat surface area of the samples to the total area of grooves or perforations, it is evident that surface geometry significantly influences thermal behavior under radiant heat exposure. In the case of the 16/8 treatment, approximately 22% of the surface area exposed to the heat flux consists of air-filled cavities from the onset of combustion. This configuration results in the highest total heat release among all tested variants.

Table 2.
Mass loss and weight of tested samples.
| Primary material |
Acoustic surface treatment |
Mean starting weight [g] | Mean weight after burning [g] |
Unburned fraction of starting weight [%] | Mass loss [g/m2] |
|---|---|---|---|---|---|
| Solid wood panel | Reference | 85.7 | 8.12 | 9.47 | 7852 |
| 16/8 mm | 64.2 | 3.4 | 5.30 | 6015 | |
| 32/8 mm | 81.8 | 8.29 | 10.13 | 7416 | |
| 8/1,5 – 15T | 43.2 | 2.5 | 5.79 | 4322 | |
| 14/2 extra | 80.2 | 7.17 | 8.94 | 7339 | |
| Plywood | Reference | 118.2 | 16.75 | 14.17 | 10255 |
| 16/8 mm | 95.1 | 14.59 | 15.34 | 8201 | |
| 32/8 mm | 113.1 | 17.64 | 15.60 | 9709 | |
| 8/1,5 – 15T | 58.9 | 3.66 | 6.21 | 5656 | |
| 14/2 extra | 130.1 | 17.31 | 13.31 | 8732 | |
| MDF | Reference | 133.8 | 45.8 | 34.23 | 8984 |
| 16/8 mm | 105.7 | 31.28 | 29.59 | 7610 | |
| 32/8 mm | 128.4 | 40.56 | 31.59 | 8983 | |
| 8/1,5 – 15T | 56.2 | 2.51 | 4.47 | 5452 | |
| 14/2 extra | 100.7 | 14.37 | 14.27 | 8764 |
Perforations also facilitate increased oxygen access into the material's interior, promoting sustained combustion in regions that would otherwise be oxygen deficient. This effect is more pronounced with larger perforation diameters and higher perforation densities as was investigated by Narang et al. [40], who tested different ventilation conditions for porosity-controlled wood crib fires. Additionally, the presence of holes allows radiant heat to penetrate deeper into the material, bypassing the protective char layer that typically forms on intact surfaces. This can result in premature ignition of the underlying flammable material layers and prolonged combustion activity, as was investigated by Frangi et al. [41] and Couto et al. [42], who tested and numerically modelled different wooden panels.
The most rapid increase in HRR is observed in the 8/1.5 – 15T treatment. In this configuration, the relatively thin outer layer that encloses large internal voids degrades and fractures quickly under thermal stress. This rapid failure exposes the internal cavity surfaces to direct heat, accelerating pyrolysis. Similar results were obtained by Fonseca et al. [43], who tested wooden acoustic panels with different types of perforations. They confirmed that perforations increase the wood surface exposed to the fire action, facilitating the penetration of flames and heat flow. This can be pronounced in our 8/1.5 – 15T treatment, where the volume ratio is approximately two-thirds void space to one-third solid material, which amplifies the rate and intensity of combustion due to the minimal thermal mass resisting heat penetration. A similarly notable HRR profile is found in the 14/2 extra treatment, where 13.6% of the surface area consists of grooves and perforations, which enhance heat transfer into the material’s interior and promote a chimney effect, further accelerating combustion through convective airflow and heat-induced pyrolysis of subsurface layers as was found by Zhang et al. [44]. They tested smouldering-to-flaming transition on beech wood induced by glowing char cracks in different airflows. In contrast, our 32/8 mm treatment demonstrates the lowest impact on HRR. Only 4.7% of its surface is composed of perforations, which limits the extent of additional heat-exposed area and, consequently, the thermal degradation and combustion intensity remain lower compared to the other modified surfaces [45].
The mass loss rate (MLR) exhibits a similar trend to the heat release rate (HRR), reflecting the inherent relationship between thermal degradation and combustion intensity. In wood and wood-based materials, the extent of thermal decomposition is closely linked to the material characteristics like density, moisture content, thermal conductivity, specific heat, thermal diffusivity and amount of released volatile, flammable compounds. These material characteristics were observed by Haddad et al. [46] on MDF panels with different acoustic treatments. Higher degradation typically results in more intense combustion and, consequently, higher heat release. The statistical analysis of peak MLR values is presented in Figure 14.
Interestingly, the highest MLR values are observed in reference samples, which lack any acoustic surface modification. This may appear counterintuitive, as these samples do not have the largest exposed surface area. However, they possess the highest total mass and thus contain more combustible material available for pyrolysis. During combustion, a substantial portion of this mass
This interpretation is further supported by data in Table , which shows that reference samples consistently exhibit the highest total mass loss across all material types. Conversely, the lowest mass loss is observed in the 8/1.5–15T acoustic panels, which contain the least amount of combustible material due to their high void fraction and reduced material volume.
In addition to heat release rate and mass loss rate, other fire performance parameters are presented in Table 3. One such parameter is the maximum of average rate of heat emission (MARHE), which quantifies a material’s ability to sustain heat release over time, encompassing both the intensity and duration of combustion [47]. Among the tested materials, plywood consistently exhibited the highest MARHE values, with a maximum observed in the 16/8 mm surface treatment. This can be attributed to plywood’s inherently high flammability caused by higher amount of volatile compounds during pyrolysis, as reported by Marchoubeh et al. [48] who tested five wood based materials, and by the increased exposed surface area resulting from perforations, which enhance oxygen access and heat transfer, as reported by Fonseca et al. [49], who tested wooden panels with perforations. In contrast, MDF generally demonstrated the lowest MARHE values, particularly in the reference and low-perforation treatments (e.g., 32/8 mm), reflecting its superior fire resistance, as reported by Martinka et al. [50], who tested fire resistant MDF. Their investigation on non-treated boards shows similar results (7% difference) with our reference sample. However, in the 8/1.5 – 15T treatment, a substantial increase in MARHE was observed. This is likely due to the reduced material volume and the ability of heat to penetrate more rapidly into the interior, bypassing the protective surface layers.
The effective heat of combustion (EHC), which reflects the total energy released per unit mass of material, provides insight into combustion efficiency [51]. Plywood exhibited consistently high EHC values across treatments, indicative of efficient and complete combustion driven by its high content of volatile compounds in resin-based adhesives. This trend is also reported by Ira et al. [52], who tested six wood based materials, with plywood surpassing other materials in Effective heat of combustion. Also, Fateh et al. [16] reported, that plywood fire characteristics strongly depend on type of plywood, and its chemical composition. Solid wood panels displayed higher variability in EHC, potentially due to the anatomical differences in pyrolysis behavior. This trend is supported by Xu et al. [53], who tested three types of CLT from combination of different species. In contrast, MDF consistently yielded the lowest EHC values, with the minimum recorded in the 32/8 mm treatment. These low values suggest less efficient combustion, likely due to increased char formation and reduced volatile release, which is consistent with the material’s lower HRR and MARHE profiles. This corresponds with Jin and Chung [54] results, where untreated MDF has almost similar amount (2% difference) of effective heat of combustion. Also, the resin used for binding wood fibres plays a significant role, as Lee et al. [55] presents in their results of wood-fiber insulation boards fire characteristics prepared with four different adhesives.
Table 3.
Average fire performance values for various acoustic panels.
| Primary material of acoustic panel |
Acoustic surface treatment | HRR (kW/m2) |
MLR (g/m2s) |
MARHE (kW/m2) |
EHC (MJ/kg) |
TTI (s) |
|
|---|---|---|---|---|---|---|---|
| Solid wood panel | Reference | Mean | 237.87 | 4.57 | 109.17 | 18.80 | 75.33 |
| SD | 14.35 | 0.15 | 11.16 | 1.88 | 2.52 | ||
| 16/8 mm | Mean | 283.67 | 3.50 | 168,57 | 34.39 | 76.00 | |
| SD | 35.40 | 0.20 | 9.65 | 3.91 | 2.65 | ||
| 32/8 mm | Mean | 218.13 | 4.30 | 133,70 | 35.05 | 77.67 | |
| SD | 6.30 | 0.10 | 9.40 | 1.49 | 2.31 | ||
| 8/1,5 – 15 T | Mean | 317.50 | 2.50 | 153,20 | 44.86 | 81.00 | |
| SD | 57.30 | 0.10 | 11.53 | 4.96 | 3.00 | ||
| 14/2 extra | Mean | 292.47 | 4.23 | 157.83 | 36.35 | 81.33 | |
| SD | 23.55 | 0.21 | 5.78 | 3.72 | 4.16 | ||
| Plywood | Reference | Mean | 365.63 | 5.93 | 161.03 | 29.15 | 79.33 |
| SD | 27.20 | 0.15 | 13.23 | 3.43 | 2.08 | ||
| 16/8 mm | Mean | 595.03 | 4.73 | 235.17 | 37.45 | 81.33 | |
| SD | 38.22 | 0.29 | 18.13 | 3.16 | 1.15 | ||
| 32/8 mm | Mean | 411.70 | 5.63 | 202.50 | 42.25 | 83.67 | |
| SD | 13.06 | 0.06 | 5.20 | 7.04 | 2.08 | ||
| 8/1,5 – 15T | Mean | 481.80 | 3.30 | 197.37 | 35.25 | 81.33 | |
| SD | 44.48 | 0.30 | 2.85 | 3.42 | 1.53 | ||
| 14/2 extra | Mean | 537.63 | 5.23 | 225.43 | 43.54 | 81.67 | |
| SD | 8.32 | 0.12 | 4.48 | 3.41 | 1.15 | ||
| MDF | Reference | Mean | 156.57 | 5.20 | 56.77 | 16.38 | 78.67 |
| SD | 23.38 | 0.10 | 3.99 | 1.56 | 0.58 | ||
| 16/8 mm | Mean | 185.63 | 4.40 | 53.50 | 25.89 | 80.33 | |
| SD | 32.87 | 0.26 | 5.75 | 4.95 | 2.08 | ||
| 32/8 mm | Mean | 169.13 | 5.30 | 43.67 | 16.44 | 77.67 | |
| SD | 8.45 | 0.26 | 3.00 | 3.07 | 1.53 | ||
| 8/1,5 – 15T | Mean | 460.73 | 3.20 | 210.80 | 16.69 | 88.00 | |
| SD | 43.89 | 0.10 | 4.77 | 3,68 | 1.73 | ||
| 14/2 extra | Mean | 408.75 | 5,00 | 193,00 | 29.53 | 83.50 | |
| SD | 13.45 | 0.10 | 2.30 | 2.09 | 0.50 |
where SD is Standard deviation.
3.2. Single-Flame Source
The outcomes of the single-flame source test are summarized in Table and illustrated in Figure 15. The data indicate that the solid wood panel samples exhibited the largest charred areas, whereas plywood consistently showed the smallest extent of charring across all tested configurations. This trend is confirmed by Gałaj and Gruszczyński [56], which tested 8 materials for surface flame spread. Importantly, none of the tested materials, regardless of acoustic surface treatment, exceeded the critical limit of 150 mm after 30 seconds of flame exposure. On the other hand, Franke and Volkmer [57] reports that untreated oak, beech and maple wood ignited and burned even after burner was removed. This finding contradicts the results of Gašpercová and Osvaldová [58], who investigated flame spread on beech and spruce wood. They observed that, in 80% of spruce samples and in 100% beech samples, the 150 mm flame spread limit was not exceeded, irrespective of whether the surface was sawn or sanded. Furthermore, the flame heights measured for spruce samples were almost identical to those recorded in our study (70–100 mm). Those differences could be explained by different type of wood (softwood × hardwood), related chemistry of those species and flame chemistry [28].
Table 4.
Results of the surface ignitability test for various acoustic panels.
| Average height of the charred area [mm] | Reaching the upper limit of 150 mm | Flaming combustion | Flaming droplets/ particles |
Filter paper ignition | ||
|---|---|---|---|---|---|---|
| Solid wood panel | reference | 76.47 | No | No | No | No |
| 16/8 | 100.53 | No | Yes. 19s | No | No | |
| 32/8 | 80.90 | No | Yes. 18s | No | No | |
| 8/1.5 – 15T | 87.80 | No | No | No | No | |
| 14/2 extra | 71.17 | No | Yes. 16s | No | No | |
| Plywood | reference | 33.40 | No | No | No | No |
| 16/8 | 48.23 | No | No | No | No | |
| 32/8 | 41.60 | No | Yes. 24s | No | No | |
| 8/1.5 – 15T | 37.47 | No | No | No | No | |
| 14/2 extra | 67.13 | No | No | No | No | |
| MDF | reference | 54.40 | No | Yes. 23s | No | No |
| 16/8 | 47.43 | No | No | No | No | |
| 32/8 | 45.57 | No | No | No | No | |
| 8/1.5 – 15T | 28.05 | No | No | No | No | |
| 14/2 extra | 76.63 | No | No | No | No | |
Despite remaining below the ignition threshold, the influence of acoustic surface treatment geometry was clearly evident. When the ignition flame was applied on flat surface, away from perforations or grooves, flame propagation was more limited and slower, leading to smaller charred areas. Conversely, when the flame was positioned directly over a perforation or groove, a more pronounced flame spread was observed. This behavior is attributed to the transition of combustion dynamics from surface burning to edge burning, where material behavior differs significantly due to increased surface-to-volume ratios and in case of wood also due to anatomical structure [41]. This transition is described by Gałaj and Gruszczyński [56], who tested eight materials for surface flame spread using two methods—surface and edge ignition. Their results show that all tested materials, particularly pine wood, ash wood panels, and MDF, ignited within 30 seconds under flame exposure, and in most cases continued burning. These findings highlight the significant influence of altered geometry and flame orientation on combustion behavior.
The perforations and grooves, particularly those that penetrated through the full material thickness, facilitated heat transfer into the material’s interior, thereby intensifying combustion through a “chimney effect.” In this process, combustible pyrolysis gases migrate upward due to reduced density from heating and the concurrent upward flow of hot air, promoting sustained flame propagation [38]. This phenomenon was most prominent in the 16/8 mm treatment, which had the largest total perforated area. A similar, though somewhat distinct, effect was observed in the 14/2 extra configuration, where vertical grooves contributed to increased surface area exposure and guided upward convective flows of hot combustion gases, reinforcing the chimney-like behavior. Similar trends in results were also obtained by Chanda et al. [59], which tested the influence of fire on plywood sandwich panels with corrugated and honeycomb cores. Also, Kmet’ová et al. [60] observed that when spruce wood was exposed to three orientations (0°, 45°, and 90°), the most rapid flame propagation and the highest overall combustion intensity occurred in the vertical orientation.
3.3. Smoke Generation
Smoke generation results are presented in Figure 16, Figure 17 and Figure 18 and summarized in Table . For solid wood panels (Figure 16), the 8/1.5–15T configuration exhibited the most rapid initial increase in specific optical density, indicating accelerated smoke production at early stages of combustion. This was followed by the 16/8 configuration, which recorded the highest peak values of specific optical density. The increased smoke output observed is attributed primarily to the enlarged surface area and enhanced internal heat penetration, both of which promote accelerated pyrolysis and facilitate the release of smoke particulates. Moreover, the “chimney effect” induced by vertical perforations is intensifying combustion dynamics, enabling faster oxygen ingress and volatile release. While these surface modifications improve acoustic functionality, they appear to significantly compromise smoke performance. However, the specific optical density of smoke values obtained for the reference samples are consistent with the average values reported for solid wood by Awad [61], who tested beech, ash, white beech pine and beech pine wood with different paintings for smoke production. Conversely, Tissot et al. [62] reports specific optical density values approximately 58% higher than those obtained in the present study; however, the wood species and exact test conditions are not specified. Different wood species and their chemical composition, along with density, moisture content, and surface geometry, markedly influence smoke production and therefore can account for substantial differences in measured Ds values.
In the case of plywood, the 14/2 extra variant demonstrated the highest specific optical density among tested configurations. This behavior can be linked to plywood’s intrinsic properties, namely, its high adhesive content and laminated veneer composition, which tend to generate substantial smoke during thermal degradation. This observation is consistent with the findings of Jaskolowski et al. [63], who tested two types of plywood along with OSB, MDF, and HDF boards, and reported that beech plywood exhibited specific optical density values approximately 53.7% higher than reference obtained in the present study. Surface perforations further amplify higher smoke production by promoting localized heat accumulation, deeper charring, and enhanced decomposition of resins. The combination of resin-rich bonding lines and higher exposed area in acoustic panels leads to increased smoke particle formation. Conversely, the increase in specific optical density can be effectively mitigated through the application of an appropriate fire-retardant coating. Park et al. [64] demonstrated this effect by testing plywood treated with a flame-retardant coating, reporting specific optical density values that were 50.8% lower compared to those of the untreated reference in the present study.
For MDF, the results revealed the most pronounced and sustained increase in specific optical density, particularly in the 8/1.5–15T and 14/2 extra configurations. Due to its fibrous structure and high content of bonding resin, MDF typically undergoes faster surface charring than for example plywood [65]. However, the introduction of perforations facilitates deeper heat penetration and accelerates the evolution of pyrolytic volatiles. This leads to denser smoke generation once thermal decomposition is initiated. The fine fiber matrix and uniform resin distribution contribute to inefficient combustion pathways, resulting in incomplete oxidation and higher smoke yields under accelerated thermal stress. Also, smoldering combustion generally produces a higher quantity of smoke than flaming combustion, as it is characterized by lower luminous intensity and reduced radiant emission compared to open flames [66].
4. Conclusions
The present study demonstrates that both the intrinsic properties of the primary material and the application of acoustic surface treatments substantially affect fire performance. Acoustic panels, widely used as wall and ceiling linings, play a critical role in compartment fire development by influencing flame spread, heat release, smoke generation, and the emission of combustion products. The results highlight the complex interplay between surface geometry and thermal response. While perforations and grooves are beneficial for acoustic performance, they simultaneously reduce fire resistance by accelerating pyrolysis, increasing heat release, and intensifying smoke production. These findings underline the importance of integrating fire-safety considerations into the design and selection of acoustic panels to minimize risks of injury, fatalities, and property damage.
Material type and surface geometry were shown to be decisive factors. Plywood exhibited the highest HRR, MARHE, and EHC values, confirming its higher flammability, while MDF generally displayed the lowest HRR and MARHE but produced the most smoke under certain perforated configurations. Solid wood panels showed the lowest HRR but developed the largest charred areas in the single-flame test. Regarding surface treatments, the 16/8 mm configuration yielded the highest EHC and MARHE, whereas the 8/1.5–15T treatment produced the most rapid HRR rise due to the rapid degradation of its thin surface layer and high void fraction. Perforations and grooves further accelerated pyrolysis and combustion of subsurface layers. To mitigate these risks, design strategies should consider limiting perforation ratios and hole diameters, applying fire-retardant coatings, and carefully selecting primary materials (e.g., MDF with protective treatments) to balance acoustic performance with fire safety.
Author Contributions
Writing – original draft, M.G. and T.K; Visualization, M.G. and T.K.; Methodology, M.G., T.K. and M.B.; Formal analysis, M.G. and T.K.; Conceptualization, M.G.; Supervision, M.G.; Funding acquisition, M.G.; Data curation, T.K.; Investigation, T.K. and M.B. All authors have read and agreed to the published version of the manuscript.
Data Availability Statement
Data available on personal request to correspondence author.
Acknowledgments
The authors are also grateful to the company Atmos Akustik & Industrietischlerei GmbH. Austria for providing acoustic panels for this research. All other funding was provided by the Faculty of Forestry and Wood Sciences, CULS Prague, excellence project “The impact of fires on the wood quality of Central European climax tree species”.
Conflicts of Interest
The authors declare that they have no known competing financial interests or personal relationships that could have appeared to influence the work reported in this paper.
References
- Alao, P.F.; Dembovski, K.H.; Rohumaa, A.; Ruponen, J.; Kers, J. The Effect of Birch (Betula Pendula Roth) Face Veneer Thickness on the Reaction to Fire Properties of Fire-Retardant Treated Plywood. Construction and Building Materials 2024, 426, 136242. [Google Scholar] [CrossRef]
- Kartal, S.N.; Green, F. Decay and Termite Resistance of Medium Density Fiberboard (MDF) Made from Different Wood Species. International Biodeterioration & Biodegradation 2003, 51, 29–35. [Google Scholar] [CrossRef]
- Li, K.; Pau, D.; Wang, J.; Ji, J. Modelling Pyrolysis of Charring Materials: Determining Flame Heat Flux Using Bench-Scale Experiments of Medium Density Fibreboard (MDF). Chemical Engineering Science 2015, 123. [Google Scholar] [CrossRef]
- Krzysik, A.M.; Muehl, J.H.; Youngquist, J.A.; Franca, F.S. Medium Density Fiberboard Made from Eucalyptus Saligna. Forest products journal 2001, Vol. 51(no. 10), 47–50. [Google Scholar]
- Ab Latib, H.; Choon Liat, L.; Ratnasingam, J.; Law, E.L.; Abdul Azim, A.A.; Mariapan, M.; Natkuncaran, J. Suitability of Paulownia Wood from Malaysia for Furniture Application. BioRes 2020, 15, 4727–4737. [Google Scholar] [CrossRef]
- Barbu, M.C.; Radauer, H.; Petutschnigg, A.; Tudor, E.M.; Kathriner, M. Lightweight Solid Wood Panels Made of Paulownia Plantation Wood. Applied Sciences 2023, 13, 11234. [Google Scholar] [CrossRef]
- Sharma, S.; Sudhakara, P.; Singh, J.; Singh, S.; Singh, G. Emerging Progressive Developments in the Fibrous Composites for Acoustic Applications. Journal of Manufacturing Processes 2023, 102, 443–477. [Google Scholar] [CrossRef]
- Lashgari, M.; Taban, E.; SheikhMozafari, M.J.; Soltani, P.; Attenborough, K.; Khavanin, A. Wood Chip Sound Absorbers: Measurements and Models. Applied Acoustics 2024, 220, 109963. [Google Scholar] [CrossRef]
- Titze, M.; Misol, M.; Monner, H.P. Examination of the Vibroacoustic Behavior of a Grid-Stiffened Panel with Applied Passive Constrained Layer Damping. Journal of Sound and Vibration 2019, 453, 174–187. [Google Scholar] [CrossRef]
- Cucharero, J.; Hänninen, T.; Lokki, T. Influence of Sound-Absorbing Material Placement on Room Acoustical Parameters. Acoustics 2019, 1, 644–660. [Google Scholar] [CrossRef]
- Kumar Saini, M.; Kumar Bagha, A.; Kumar, S. Experimental Study to Measure the Transmission Loss of Double Panel Natural Fibers. Materials Today: Proceedings 2020, 26, 482–486. [Google Scholar] [CrossRef]
- Jang, J.-Y.; Park, C.-S.; Song, K. Lightweight Soundproofing Membrane Acoustic Metamaterial for Broadband Sound Insulation. Mechanical Systems and Signal Processing 2022, 178, 109270. [Google Scholar] [CrossRef]
- Lee, B.-H.; Kim, H.-S.; Kim, S.; Kim, H.-J.; Lee, B.; Deng, Y.; Feng, Q.; Luo, J. Evaluating the Flammability of Wood-Based Panels and Gypsum Particleboard Using a Cone Calorimeter. Construction and Building Materials 2011, 25, 3044–3050. [Google Scholar] [CrossRef]
- Kim, J.; Lee, J.-H.; Kim, S. Estimating the Fire Behavior of Wood Flooring Using a Cone Calorimeter. J Therm Anal Calorim 2012, 110, 677–683. [Google Scholar] [CrossRef]
- Jiang, X.; Li, C.; Chi, Y.; Yan, J. TG-FTIR Study on Urea-Formaldehyde Resin Residue during Pyrolysis and Combustion. Journal of Hazardous Materials 2010, 173, 205–210. [Google Scholar] [CrossRef]
- Fateh, T.; Rogaume, T.; Luche, J.; Richard, F.; Jabouille, F. Characterization of the Thermal Decomposition of Two Kinds of Plywood with a Cone Calorimeter – FTIR Apparatus. Journal of Analytical and Applied Pyrolysis 2014, 107, 87–100. [Google Scholar] [CrossRef]
- Xu, Q.; Chen, L.; Harries, K.A.; Zhang, F.; Liu, Q.; Feng, J. Combustion and Charring Properties of Five Common Constructional Wood Species from Cone Calorimeter Tests. Construction and Building Materials 2015, 96, 416–427. [Google Scholar] [CrossRef]
- Mouritz, A.P.; Mathys, Z.; Gibson, A.G. Heat Release of Polymer Composites in Fire. In Applied Science and Manufacturing; Composites Part A, 2006; Volume 37, pp. 1040–1054. [Google Scholar] [CrossRef]
- White, R.H.; Dietenberger, M.A. Fire Safety of Wood Construction. Wood handbook : wood as an engineering material: chapter 18. Centennial ed. General technical report FPL ; GTR-190; U.S. Dept. of Agriculture, Forest Service, Forest Products Laboratory: Madison, WI, 2010; Volume 190, p. p. 18.1-18.22. 18.1-18.22. [Google Scholar]
- Babrauskas, V. Heat Release Rates. In SFPE Handbook of Fire Protection Engineering; Hurley, M.J., Gottuk, D., Hall, J.R., Harada, K., Kuligowski, E., Puchovsky, M., Torero, J., Watts, J.M., Wieczorek, C., Eds.; Springer: New York, NY, 2016; pp. 799–904. ISBN 978-1-4939-2565-0. [Google Scholar]
- Bekhta, P.; Bryn, O.; Sedliačik, J.; Novák, I. Effect of Different Fire Retardants on Birch Plywood Properties. Acta Facultatis Xylologiae Zvolen 2016, 59−66. [Google Scholar] [CrossRef]
- Grexa, O.; Horváthová, E.; Bešinová, O.; Lehocký, P. Flame Retardant Treated Plywood. Polymer Degradation and Stability 1999, 64, 529–533. [Google Scholar] [CrossRef]
- ISO 13061-1; Physical and Mechanical Properties of Wood — Test Methods for Small Clear Wood Specimens — Part 1: Determination of Moisture Content for Physical and Mechanical Tests. International Organization for Standardization: Geneva, Switzerland, 2014.
- ISO 5660-1; Reaction-to-Fire Tests - Heat Release, Smoke Production and Mass Loss Rate - Part 1: Heat Release Rate (Cone Calorimeter Method) and Smoke Production Rate (Dynamic Measurement). International Organization for Standardization: Geneva, Switzerland, 2015.
- ČSN EN ISO 11925-2; Reaction to Fire Tests – Ignitability of Products Subjected to Direct Impingement of Flame – Part 2: Single-Flame Source Test. Czech Standardization Agency: Prague, Czech Republic, 2020.
- ČSN EN ISO 5659-2; Plastics – Smoke Generation – Part 2: Determination of Optical Density by a Single-Chamber Test. Czech Standardization Agency: Prague, Czech Republic, 2017.
- Li, K.-Y.; Huang, X.; Fleischmann, C.; Rein, G.; Ji, J. Pyrolysis of Medium-Density Fiberboard: Optimized Search for Kinetics Scheme and Parameters via a Genetic Algorithm Driven by Kissinger’s Method. Energy &Amp; Fuels 2014, 28. [Google Scholar] [CrossRef]
- Lowden, L.A.; Hull, T.R. Flammability Behaviour of Wood and a Review of the Methods for Its Reduction. Fire Sci Rev 2013, 2, 4. [Google Scholar] [CrossRef]
- Lee, M.-K.; Park, S.-H. Effects of Thermal Thickness and Charring Properties of Solid Combustibles on Heat Release and CO Emission Characteristics. Int J Fire Sci Eng 2022, 36, 1–8. [Google Scholar] [CrossRef]
- Šejna, J.; Průšová, K.; Cábová, K.; Rušarová, S.; Wald, F. Cracks in the Charred Layer of Timber Panels: Fire Experiments and Probabilistic Solution. Case Studies in Thermal Engineering 2025, 74, 106788. [Google Scholar] [CrossRef]
- Anca-Couce, A.; Dieguez-Alonso, A.; Zobel, N.; Berger, A.; Kienzl, N.; Behrendt, F. Influence of Heterogeneous Secondary Reactions during Slow Pyrolysis on Char Oxidation Reactivity of Woody Biomass. Energy Fuels 2017, 31, 2335–2344. [Google Scholar] [CrossRef]
- Liu, B.; Fan, Q.; Wu, W.; Hu, Y. Structure and Reactivity of Rice Husk Chars under Different Bulk Densities. 2019. [Google Scholar] [CrossRef]
- Hostikka, S.; Matala, A. Pyrolysis Model for Predicting the Heat Release Rate of Birch Wood. Combustion Science and Technology 2017, 189, 1373–1393. [Google Scholar] [CrossRef]
- Gabriel, G.F. Volatile Chemical Component Differences between Fully and Partially Dried Merbau (Intsia Sp.) Wood Using Gas Chromatography-Mass Spectrometry (GC-MS) in Malaysia. Jurnal Sains Kesihatan Malaysia (Malaysian Journal of Health Sciences) 2019, 17. [Google Scholar]
- Morrisset, D.; Hadden, R.M.; Bartlett, A.I.; Law, A.; Emberley, R. Time Dependent Contribution of Char Oxidation and Flame Heat Feedback on the Mass Loss Rate of Timber. Fire Safety Journal 2021, 120, 103058. [Google Scholar] [CrossRef]
- Kim, S.-C.; Nam, D.-G. Fire Characteristics of Flaming and Smoldering Combustion of Wood Combustibles Considering Thickness. Fire Science and Engineering 2015, 29, 67–72. [Google Scholar] [CrossRef]
- Sanned, E.; Mensah, R.A.; Försth, M.; Das, O. The Curious Case of the Second/End Peak in the Heat Release Rate of Wood: A Cone Calorimeter Investigation. Fire and Materials 2023, 47, 498–513. [Google Scholar] [CrossRef]
- Drysdale, D. An Introduction to Fire Dynamics, 3rd. ed.; John Wiley & Sons, Ltd, 2011; ISBN 978-1-119-97610-3. [Google Scholar]
- Peng, L.; Wang, H.; Zhang, H.; Xin, Z.; Ke, D.; Lei, Z.; Ye, Q. Study of the Effect of Hole Defects on Wood Heat Transfer Based on Infrared Thermography. International Journal of Thermal Sciences 2023, 191, 108295. [Google Scholar] [CrossRef]
- Narang, A.; Kumar, R.; Dhiman, A.K.; Pandey, R.S.; Sharma, P.K. Study on the Influence of Vent Area on Porosity-Controlled Wood Crib Compartment Fires Prior to Flashover. Journal of Structural Fire Engineering 2023, 15, 177–191. [Google Scholar] [CrossRef]
- Frangi, A.; Fontana, M.; Schleifer, V. Fire Behaviour of Timber Surfaces with Perforations. Fire and Materials 2005, 29, 127–146. [Google Scholar] [CrossRef]
- Couto, D.L.P.; Fonseca, E.M.M.; Piloto, P.A.G.; Meireles, J.M.; Barreira, L.M.S.; Ferreira, D.R.S.M. Perforated Cellular Wooden Slabs under Fire: Numerical and Experimental Approaches. Journal of Building Engineering 2016, 8, 218–224. [Google Scholar] [CrossRef]
- Fonseca, E.; Meireles, J.; Piloto, P.; Ferreira, D. Fire Resistance of Wooden Cellular Slabs with Rectangular Perforations 2015.
- Zhang, Z.; Ding, P.; Wang, S.; Huang, X. Smouldering-to-Flaming Transition on Wood Induced by Glowing Char Cracks and Cross Wind. Fuel 2023, 352, 129091. [Google Scholar] [CrossRef]
- Friquin, K.L. Material Properties and External Factors Influencing the Charring Rate of Solid Wood and Glue-Laminated Timber. Fire and Materials 2011, 35, 303–327. [Google Scholar] [CrossRef]
- Haddad, D.; Fonseca, E.M.M.; Lamri, B. Thermal Model for Charring Rate Calculation in Wooden Cellular Slabs under Fire. In Proceedings of the ICOSADOS; Universidade de Trás-os-Montes e Alto Douro (UTAD), Vila Real, Portugal, May 10 2016; Vol. 7th, p. 8 pp. [Google Scholar]
- Lin, C.-F.; Zhang, C.; Karlsson, O.; Martinka, J.; Mantanis, G.I.; Rantuch, P.; Jones, D.; Sandberg, D. Phytic Acid-Silica System for Imparting Fire Retardancy in Wood Composites. Forests 2023, 14, 1021. [Google Scholar] [CrossRef]
- Marchoubeh, M.L.; Knight, H.; Horn, G.P. A Pyrolysis-Gas Chromatography/Mass Spectrometry Study of Volatile Compounds Produced by Wood-Based Materials. Fire and Materials 2024, 48, 542–550. [Google Scholar] [CrossRef]
- Fonseca, E.M.M.; Couto, D.; Piloto, P.A.G. Fire Safety in Perforated Wooden Slabs: A Numerical Approach 2013, 577–584.
- Martinka, J.; Mantanis, G.I.; Lykidis, C.; Antov, P.; Rantuch, P. The Effect of Partial Substitution of Polyphosphates by Aluminium Hydroxide and Borates on the Technological and Fire Properties of Medium Density Fibreboard. Wood Material Science & Engineering 2022, 17, 720–726. [Google Scholar] [CrossRef]
- Janssens, M. Calorimetry. In SFPE Handbook of Fire Protection Engineering; Hurley, M.J., Gottuk, D., Hall, J.R., Harada, K., Kuligowski, E., Puchovsky, M., Torero, J., Watts, J.M., Wieczorek, C., Eds.; Springer: New York, NY, 2016; pp. 905–951. ISBN 978-1-4939-2565-0. [Google Scholar]
- Ira, J.; Hasalová, L.; Šálek, V.; Jahoda, M.; Vystrčil, V. Thermal Analysis and Cone Calorimeter Study of Engineered Wood with an Emphasis on Fire Modelling. Fire Technol 2020, 56, 1099–1132. [Google Scholar] [CrossRef]
- Xu, B.; Chen, Q.; Zhang, R.; Wang, Z. Fire Performance Comparison of Bamboo-Wood Composite and Spruce-Pine-Fir Cross-Laminated Timber Panels. Cellulose 2025. [Google Scholar] [CrossRef]
- Jin, E.; Chung, Y.-J. Combustive Properties of Medium Density Fibreboard (MDF) Specimens Treated with Alkylenediaminoalkyl-Bis-Phosphonic Acid Derivatives. Fire Science and Engineering 2014, 28, 57–63. [Google Scholar] [CrossRef]
- Lee, M.; Lee, S.-M.; Kang, E.-C.; Son, D.-W. Combustibility and Characteristics of Wood-Fiber Insulation Boards Prepared with Four Different Adhesives. BioResources 2019, 14, 6316–6330. [Google Scholar] [CrossRef]
- Gałaj, J.; Gruszczyński, P. Analysis of Ignitability and Combustion Rate of Selected Interior Furnishing Materials. Zeszyty Naukowe SGSP / Szkoła Główna Służby Pożarniczej 2024, 91(tom 1). [Google Scholar] [CrossRef]
- Franke, T.; Volkmer, T. Thermal Behaviour and Reaction to Fire of Three Various Hardwood Species Mineralized with Calcium Oxalate. In Proceedings of the The 10th European Conference on Wood Modification, 2022; p. 125. [Google Scholar]
- Gašpercová, S.; Osvaldová, L.M. Influence of Surface Treatment of Wood to the Flame Length and Weight Loss under Load Single-Flame Source. Key Engineering Materials 2017, 755, 353–359. [Google Scholar] [CrossRef]
- Chanda, A.; Kim, N.K.; Wijaya, W.; Bhattacharyya, D. Fire Reaction of Sandwich Panels with Corrugated and Honeycomb Cores Made from Natural Materials. Journal of Sandwich Structures & Materials 2021, 23, 109963622198923. [Google Scholar] [CrossRef]
- Kmet’ová, E.; Zachar, M.; Kačíková, D. The Progressive Test Method for Assessing the Thermal Resistance of Spruce Wood. Acta Facultatis Xylologiae Zvolen res Publica Slovaca 2022, 64, 29–36. [Google Scholar]
- Awad, A. Effect of Fire Retardant Painting Product on Smoke Optical Density of Burning Natural Wood Samples. 2020. [Google Scholar]
- Tissot, J.; Talbaut, M.; Yon, J.; Coppalle, A.; Bescond, A. Spectral Study of the Smoke Optical Density in Non-Flaming Condition. Procedia Engineering 2013, 62, 821–828. [Google Scholar] [CrossRef]
- Jaskolowski, W.; Łukaszek-Chmielewska, A.; Ogrodnik, P.; Sobczak, T. Evaluation of Maximum Specific Optical Density for Selected Wood Based Materials Using PN-EN ISO 5659:2017 Method. Annals of Warsaw University of Life Sciences - SGGW 2017, 100, 18–22. [Google Scholar]
- Park, H.-J.; Jian, H.; Wen, M.; Jo, S.-U. Toxic Gas and Smoke Generation and Flammability of Flame-Retardant Plywood. Polymers 2024, 16, 507. [Google Scholar] [CrossRef] [PubMed]
- Varada Rajulu, Ch.K.; Nandanwar, A.; Chandroji Rao, K. Evaluation of Smoke Density on Combustion of Wood Based Panel Products. International Journal of Materials and Chemistry 2013, 2, 225–228. [Google Scholar] [CrossRef]
- Półka, M.; Białek, J. The Smoke Emission Properties of Selected Elements of Furnishing Apartments in the Building 2019.
Figure 1.
Figure 1. Reference primary material panels without acoustic surface treatment. (a) spruce solid wood panel, (b) birch plywood, (c) MDF veneered with an ash veneer.
Figure 1.
Figure 1. Reference primary material panels without acoustic surface treatment. (a) spruce solid wood panel, (b) birch plywood, (c) MDF veneered with an ash veneer.
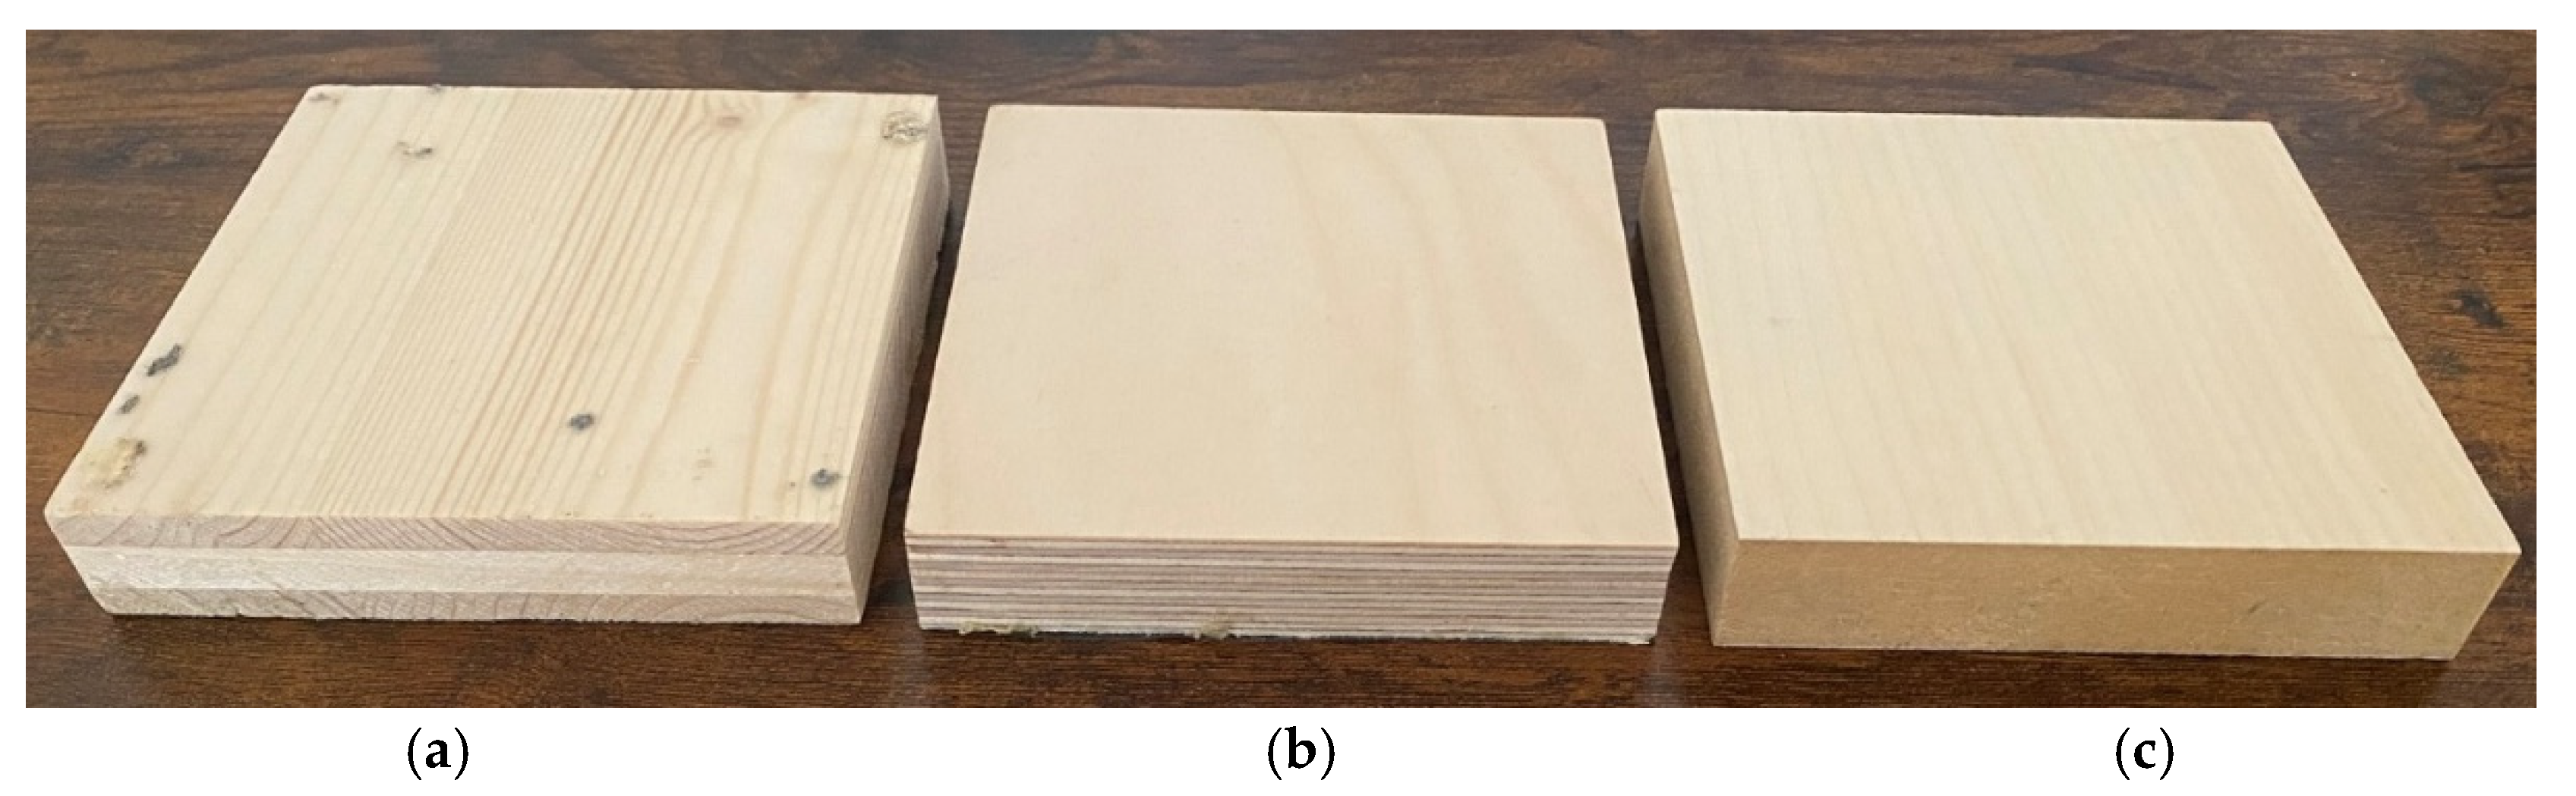
Figure 2.
Acoustic surface treatment ATMOkustik 16/8.
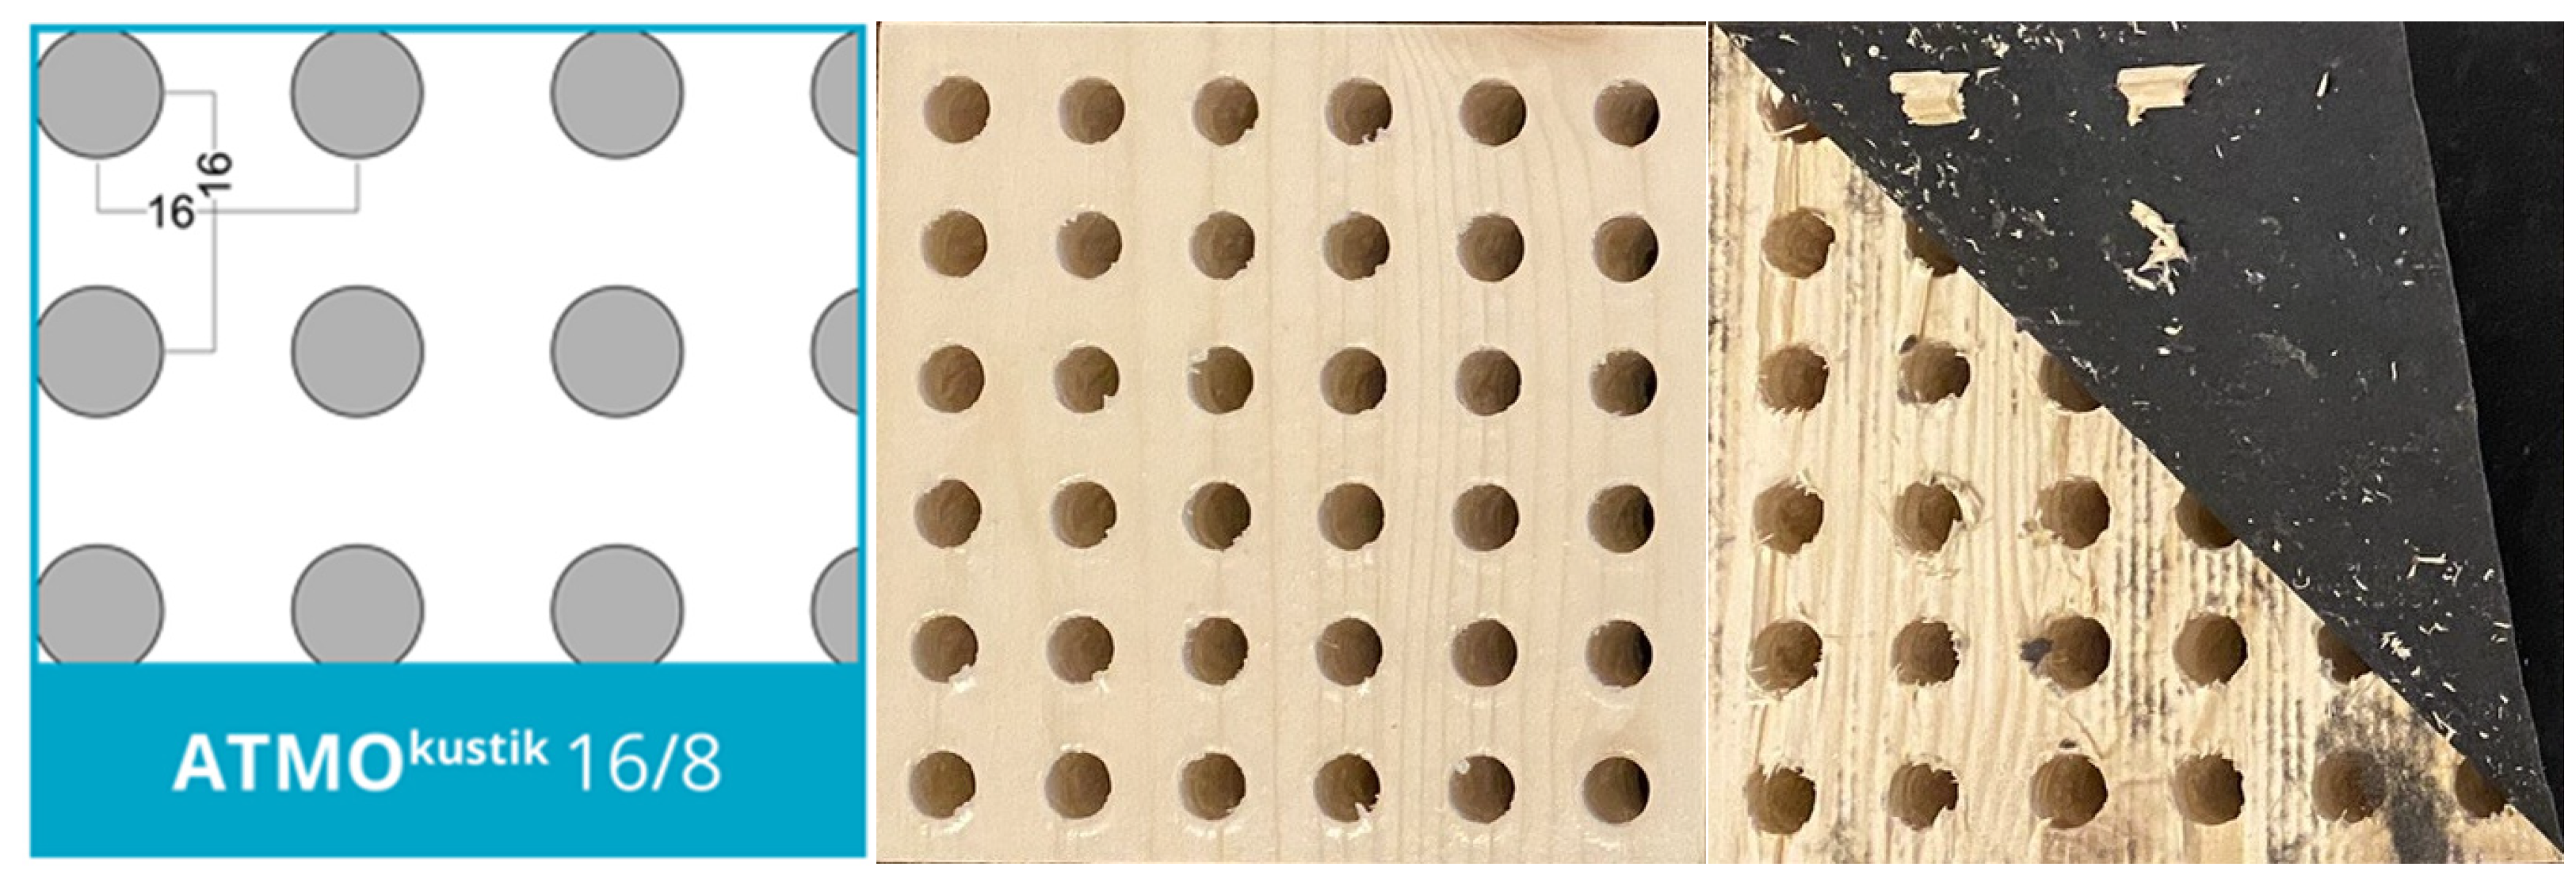
Figure 3.
Acoustic surface treatment ATMOkustik 32/8.
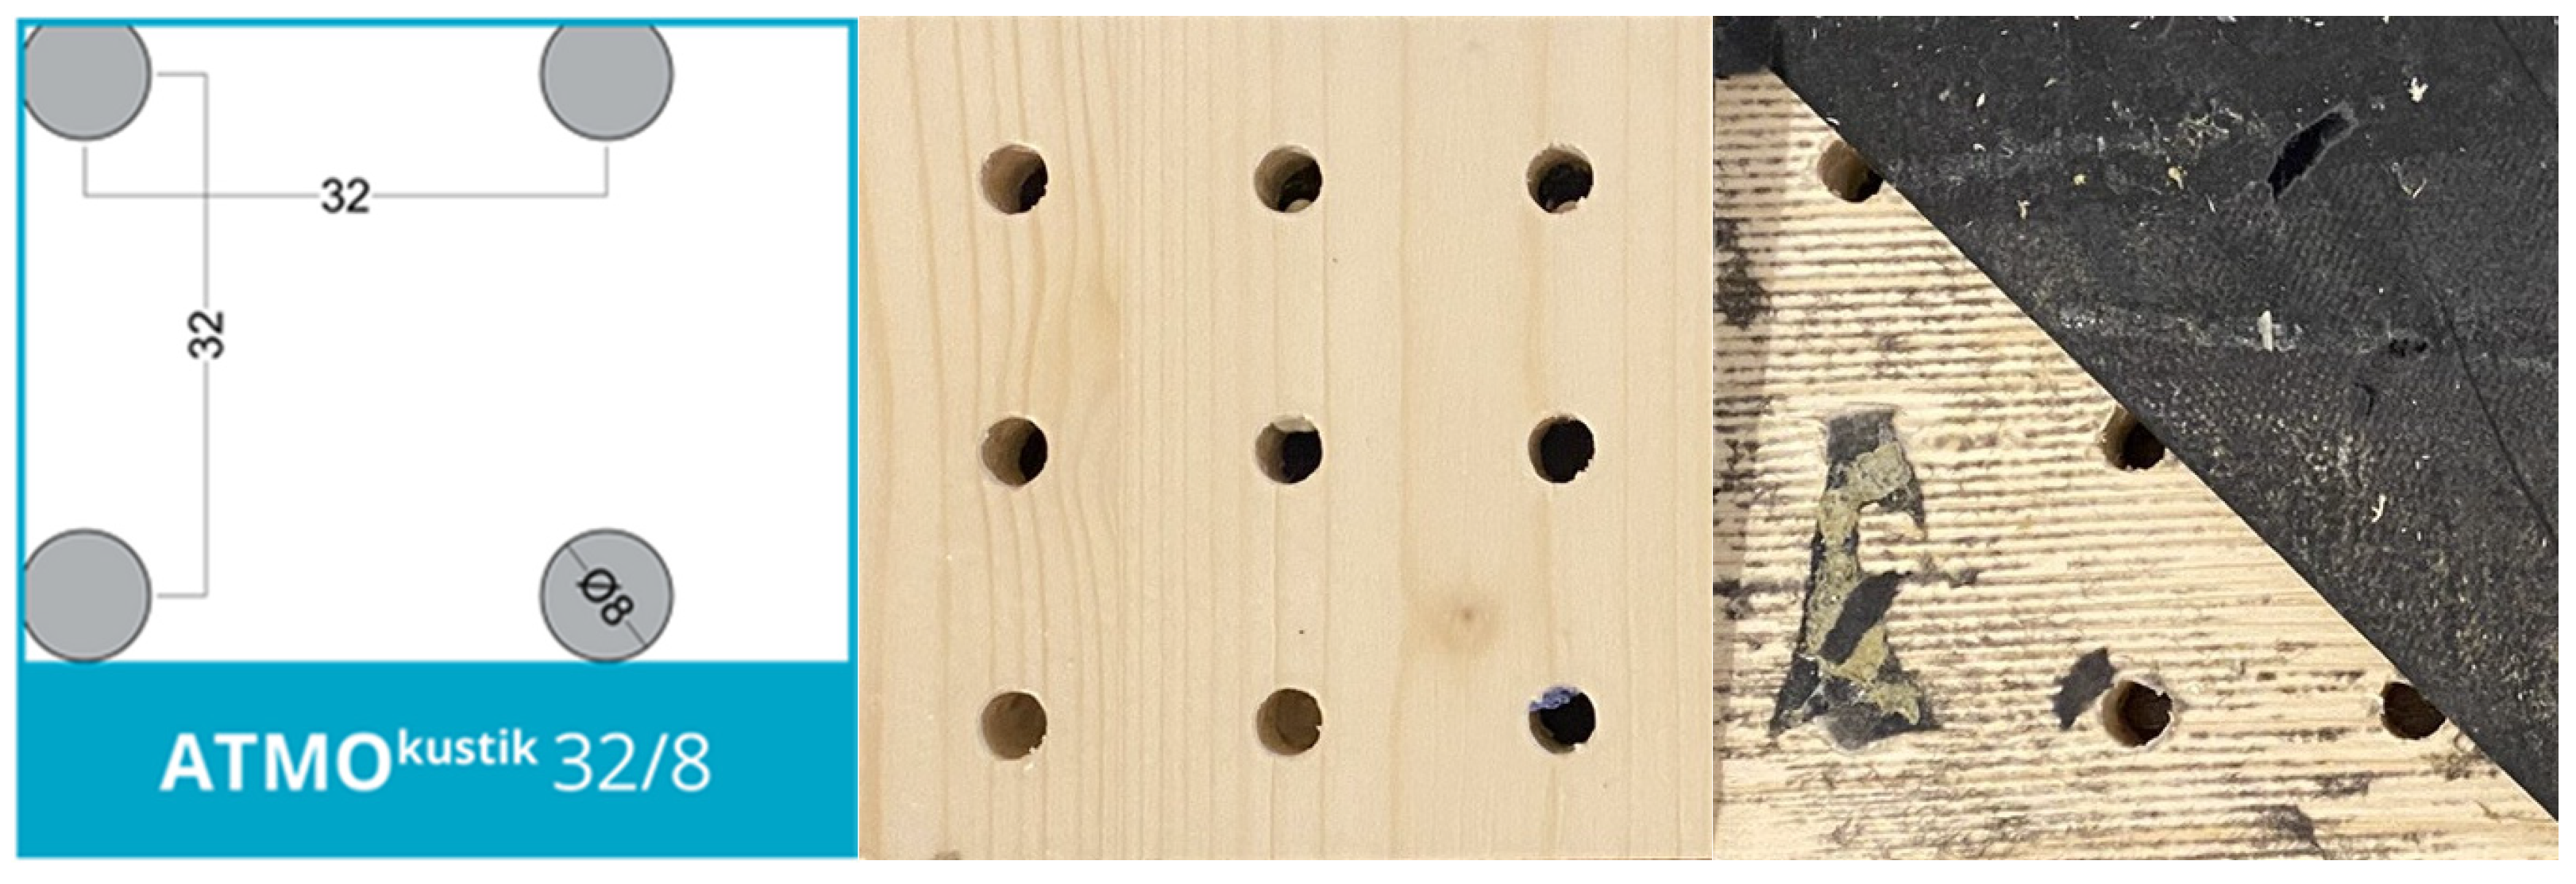
Figure 4.
Acoustic surface treatment ATMOkustik 8/1,5-15T.
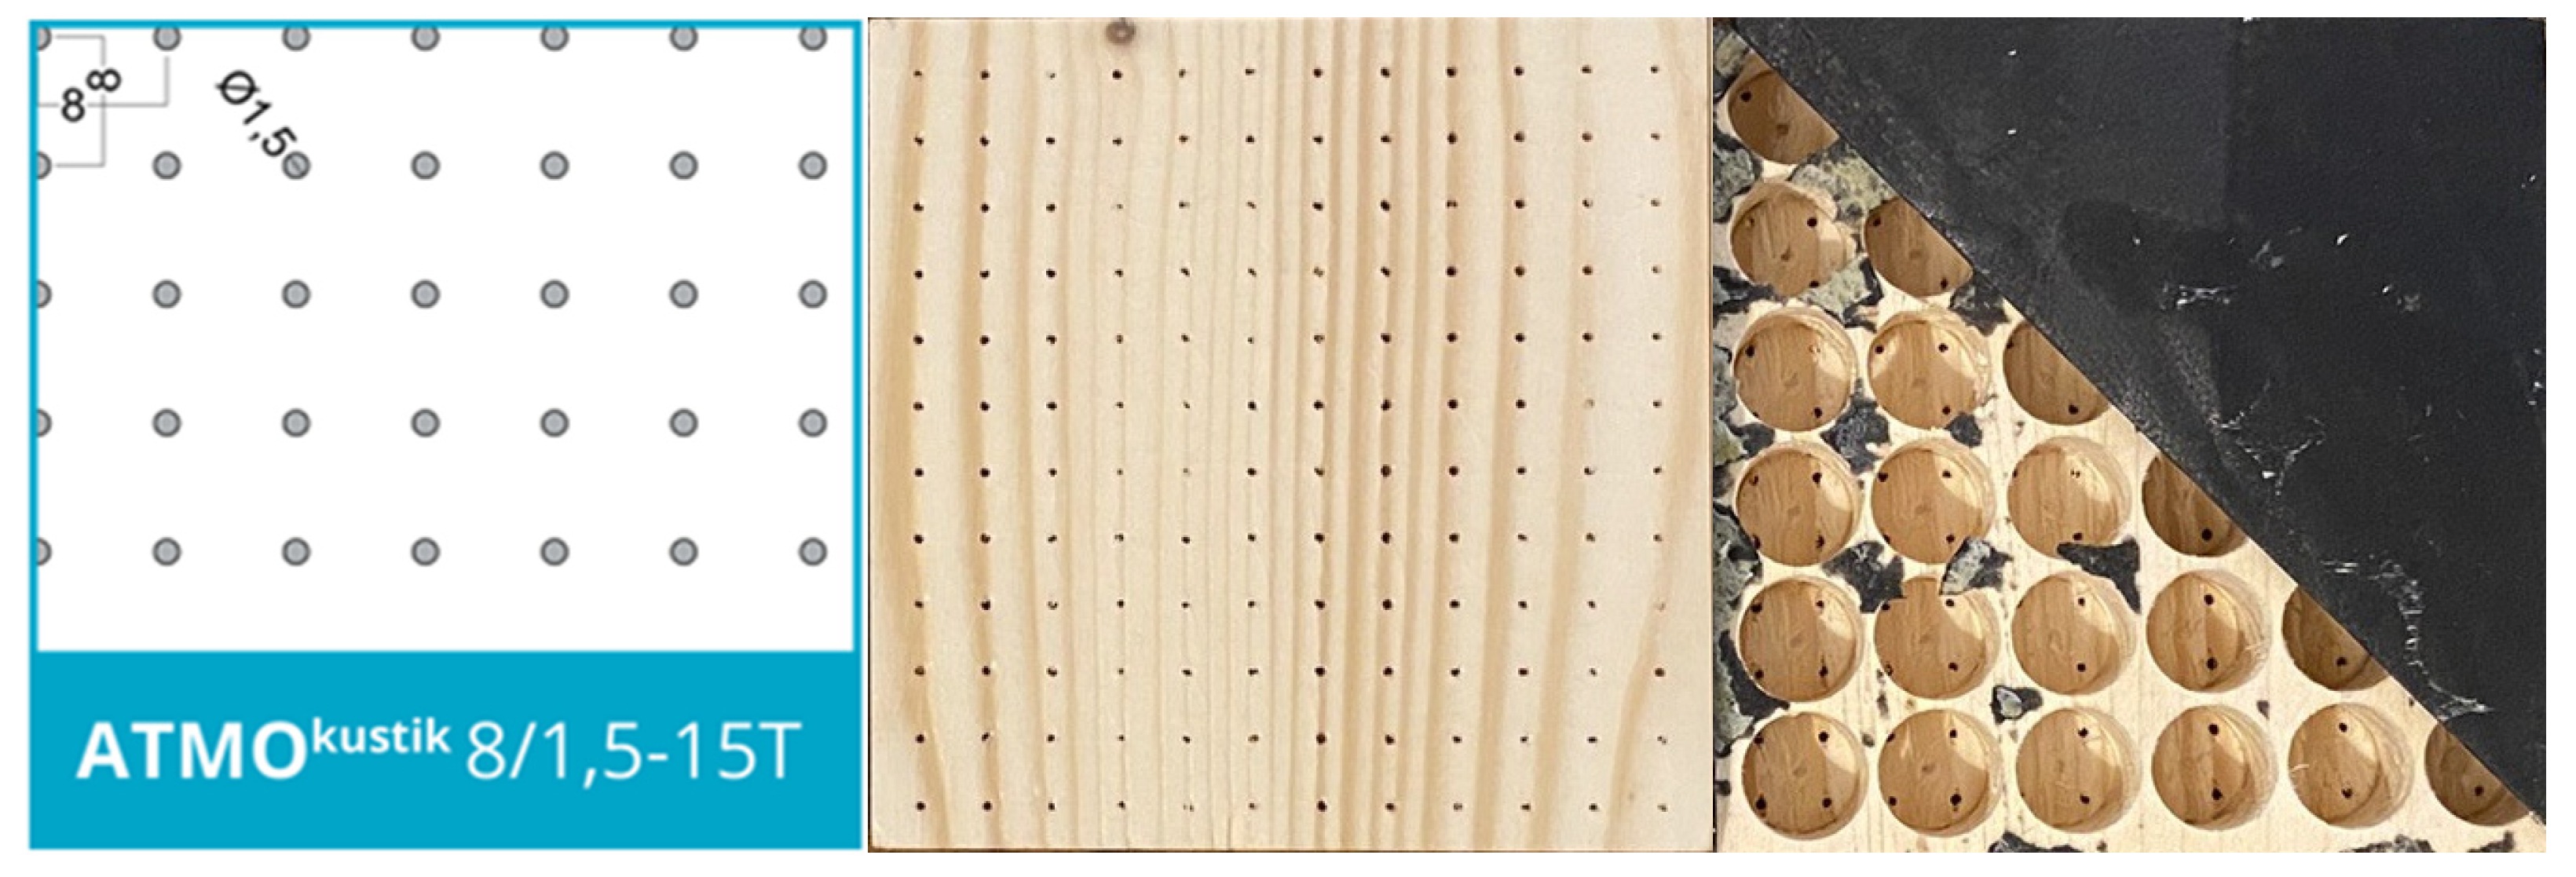
Figure 5.
Acoustic surface treatment ATMOphon 14/2 (holes + grooves).
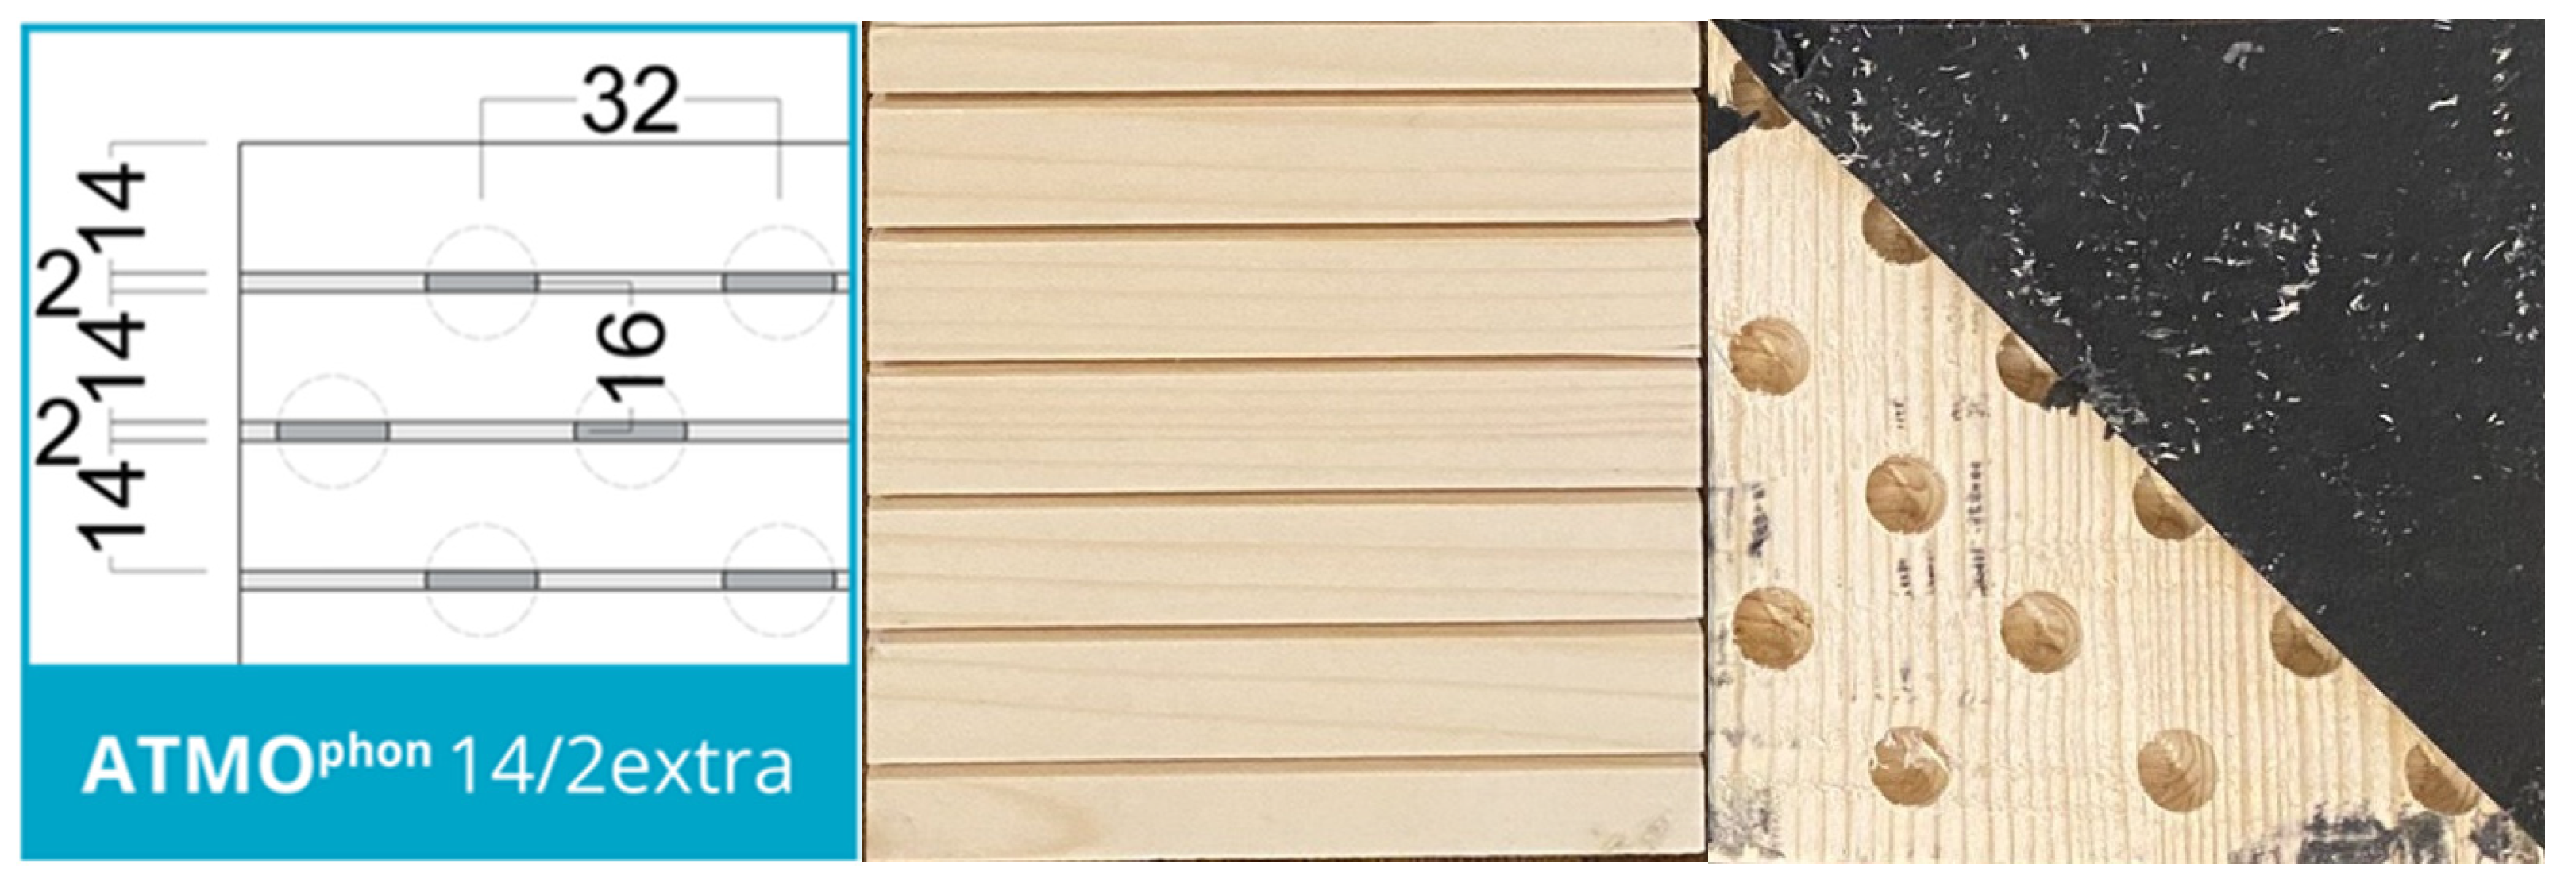
Figure 6.
Fire test apparatus: (a) Cone calorimeter, (b) samples testing.
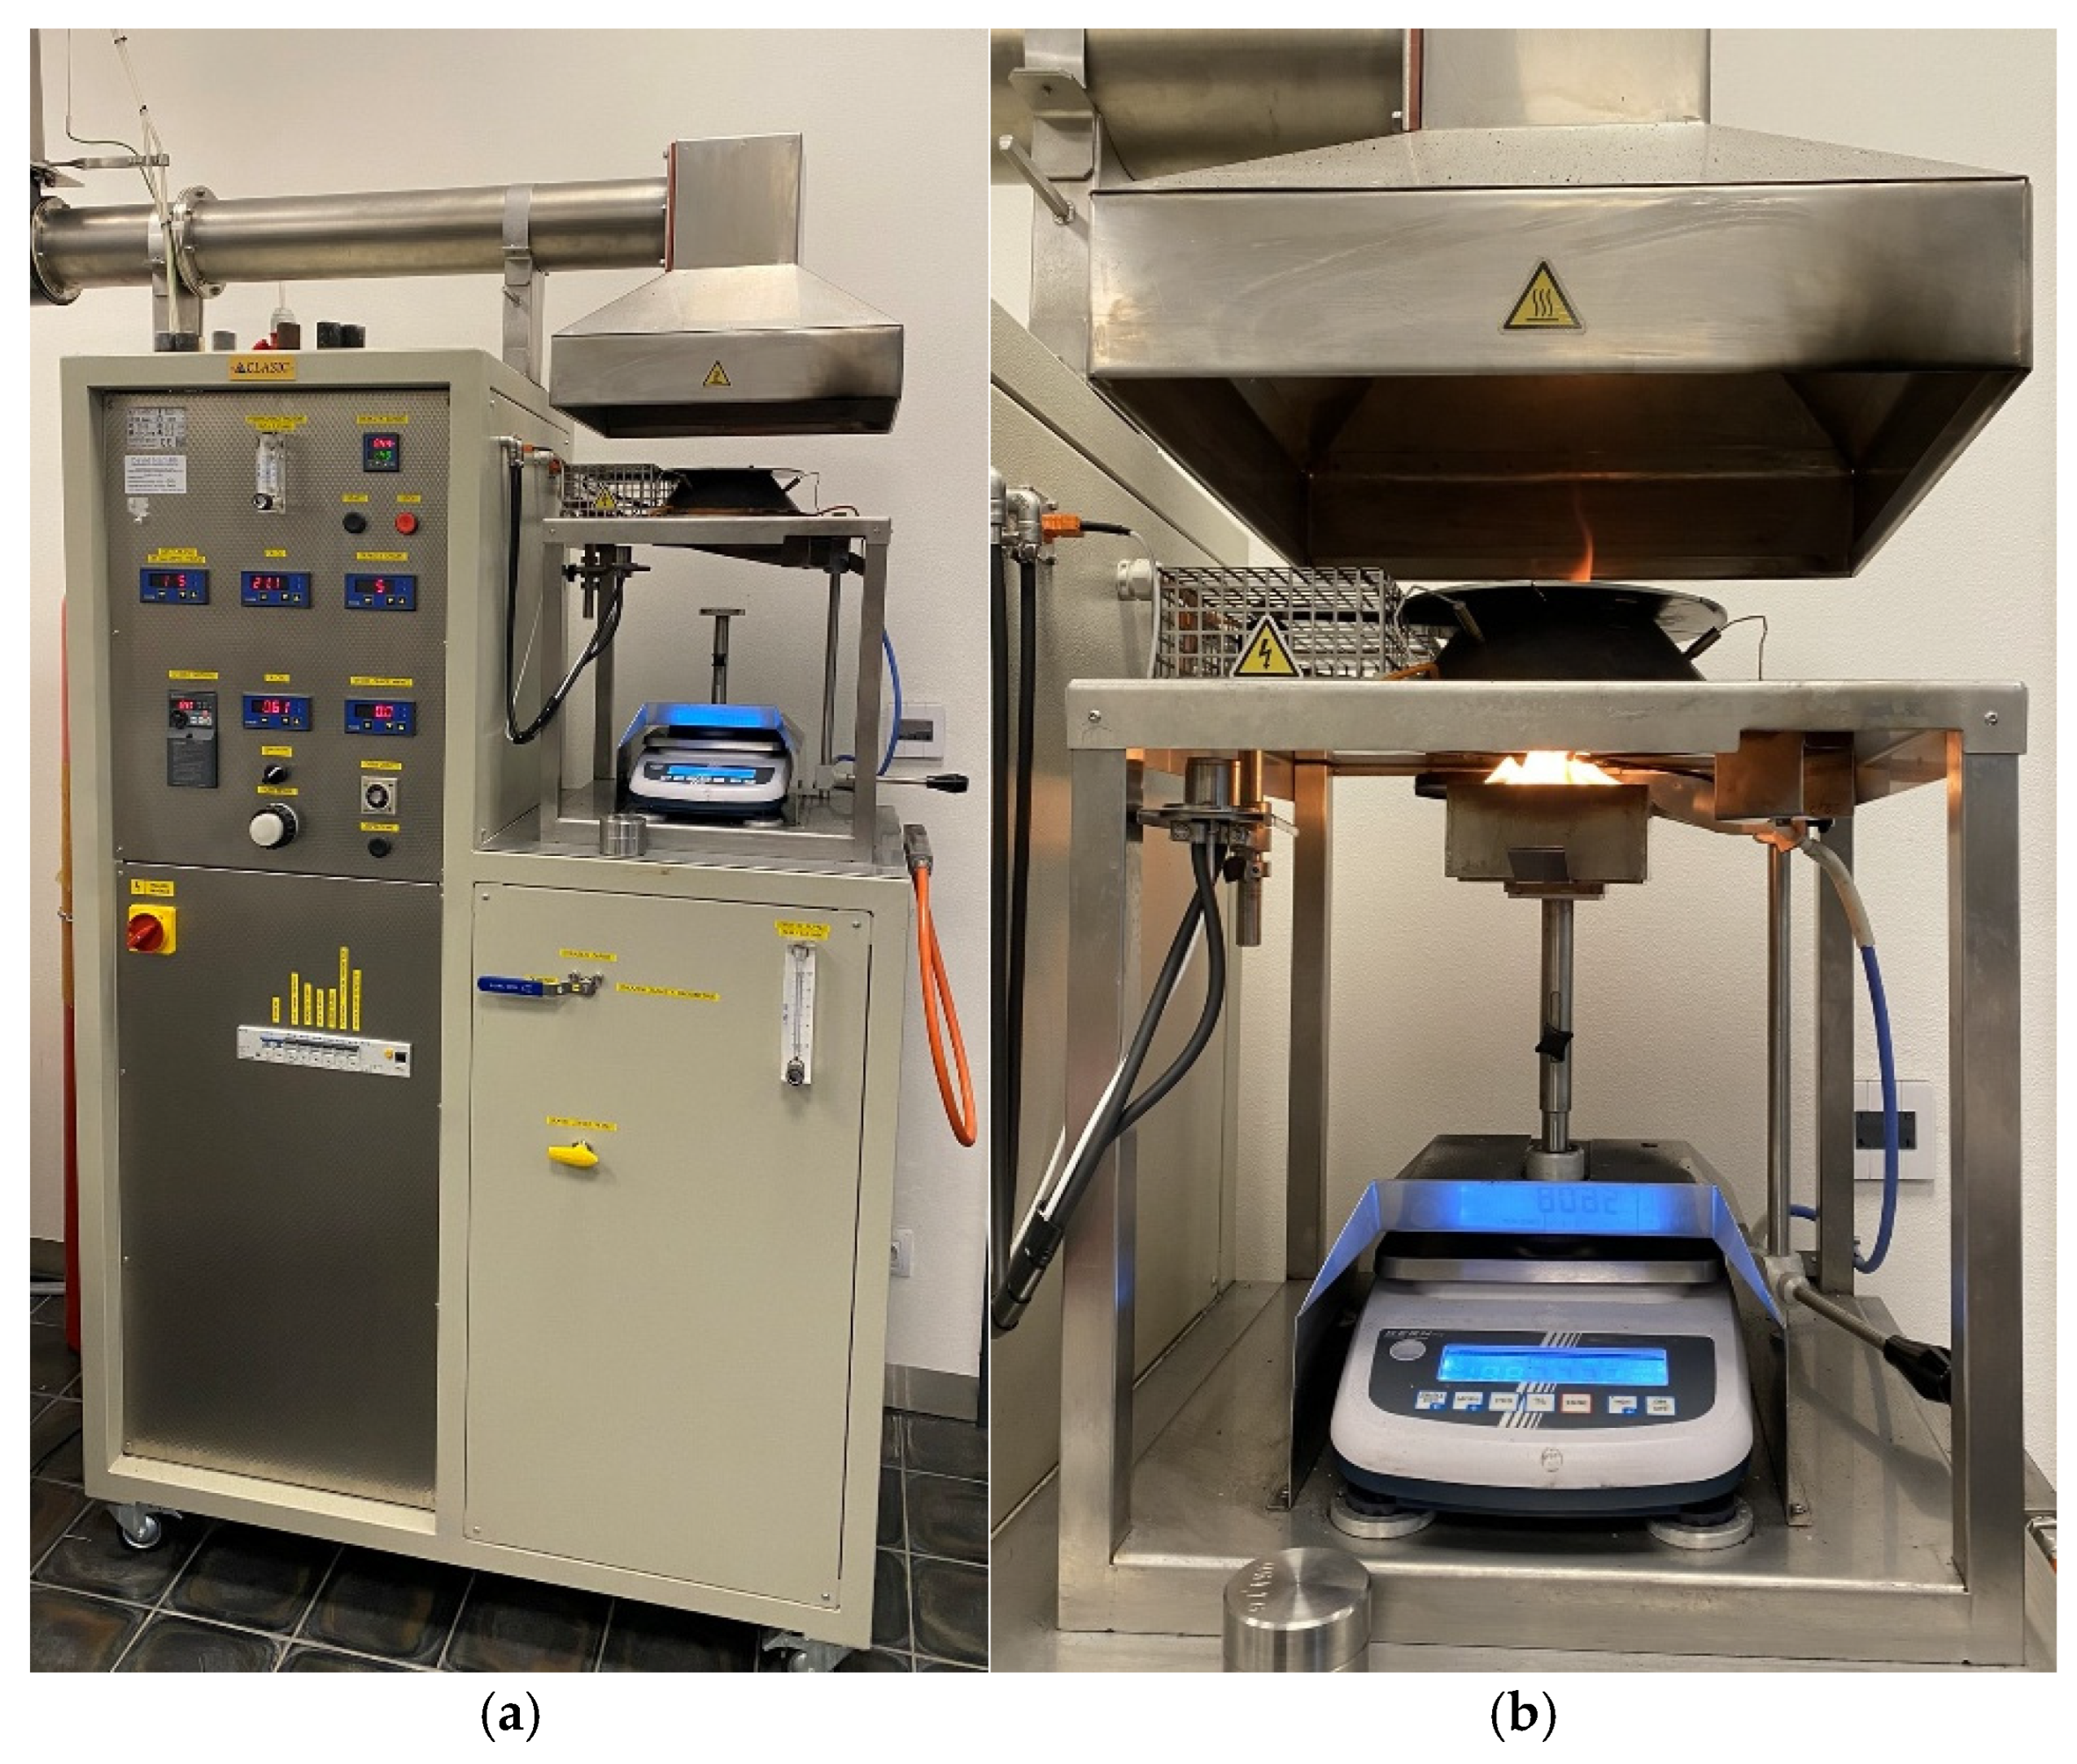
Figure 7.
Sample placed in holder.
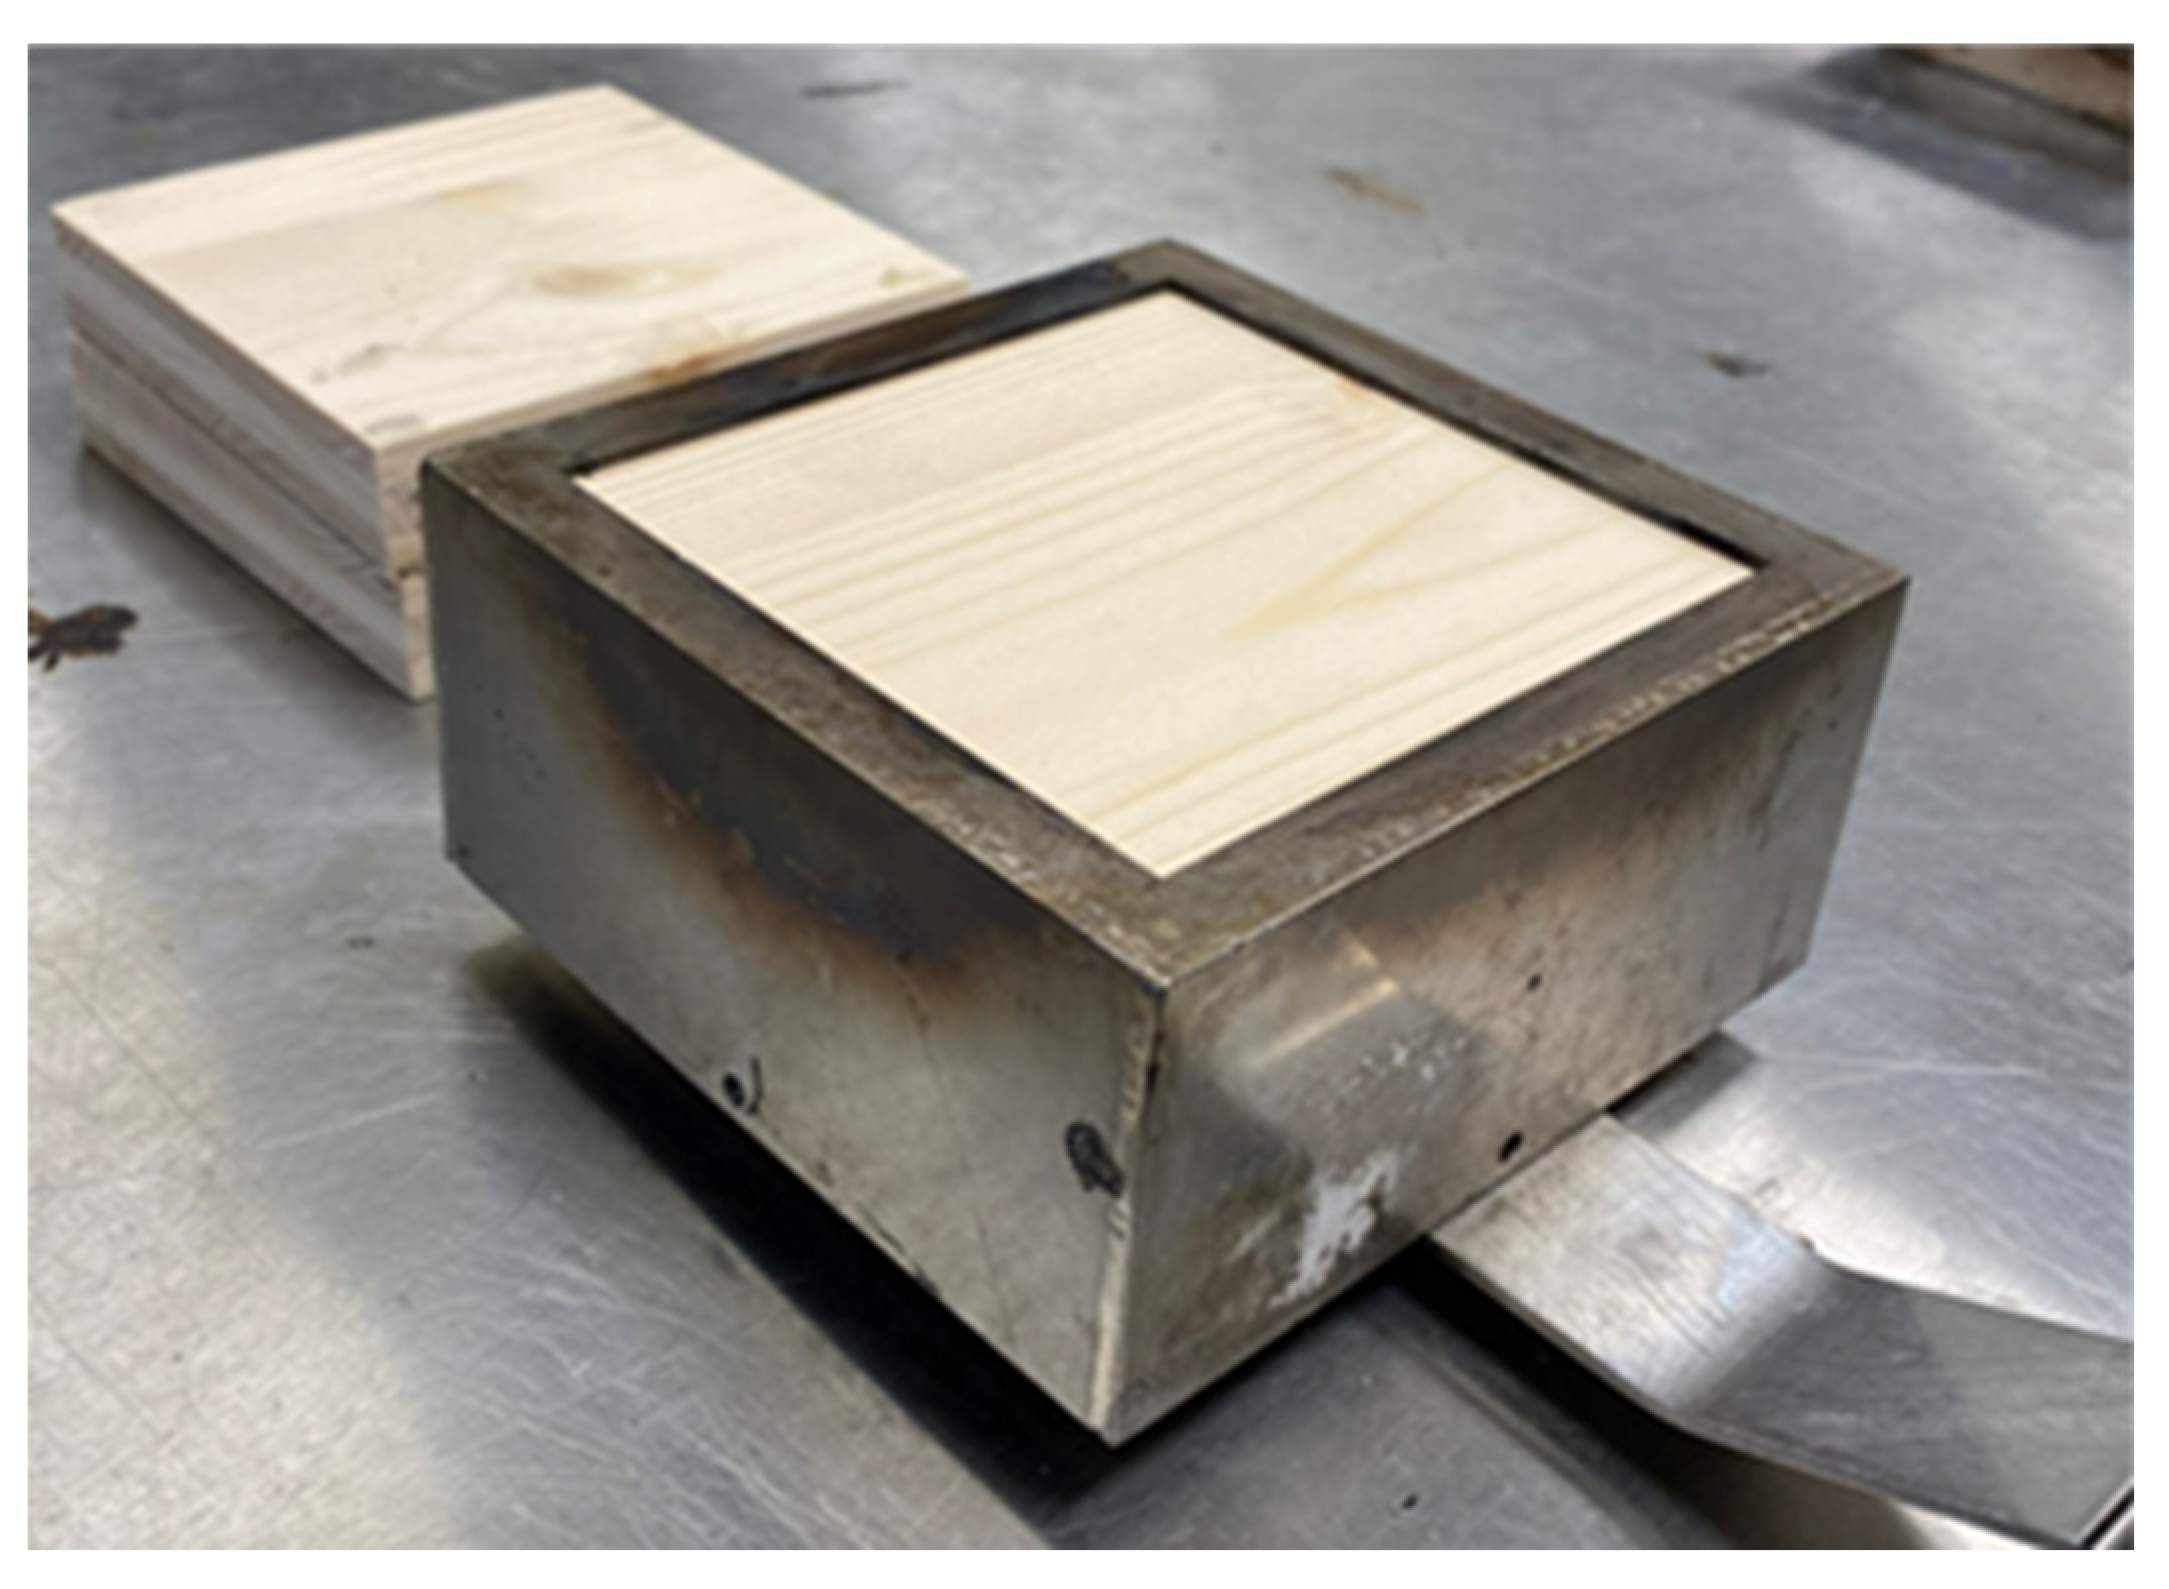
Figure 8.
Single-flame source test apparatus: (a) laboratory chamber, (b) sample testing.
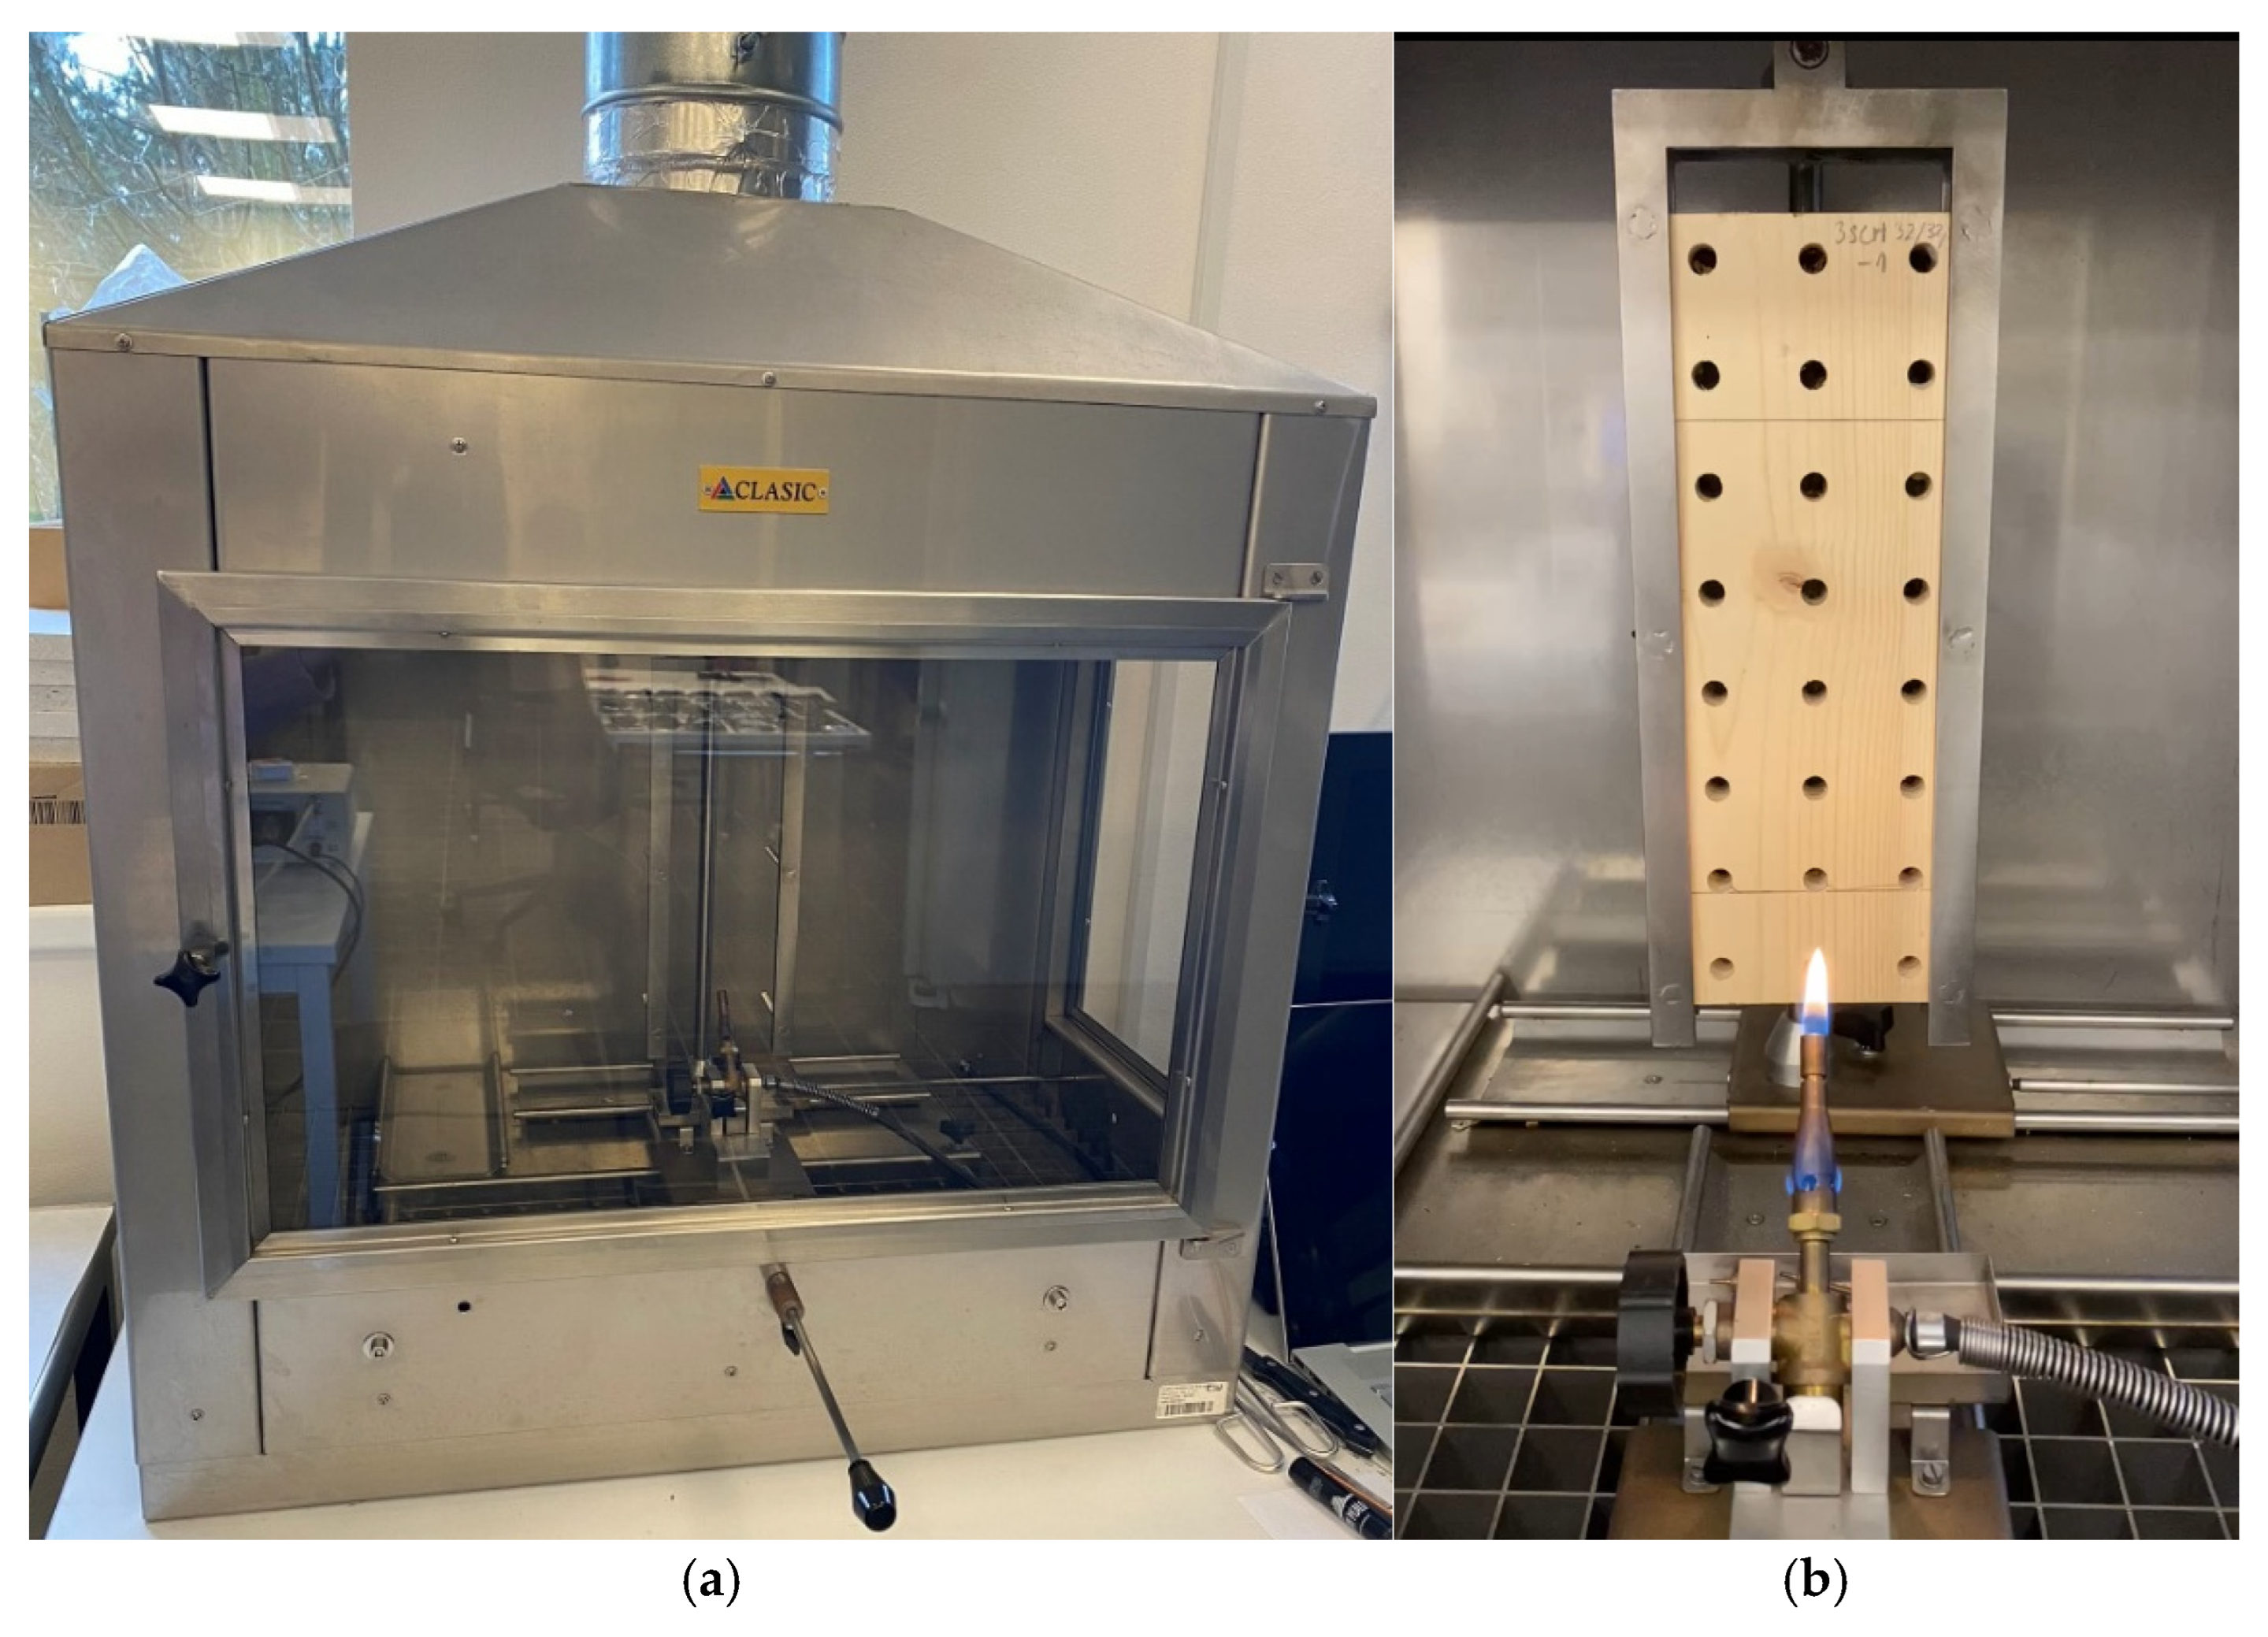
Figure 9.
Smoke generation test apparatus: (a) smoke chamber, (b) test sample after testing.
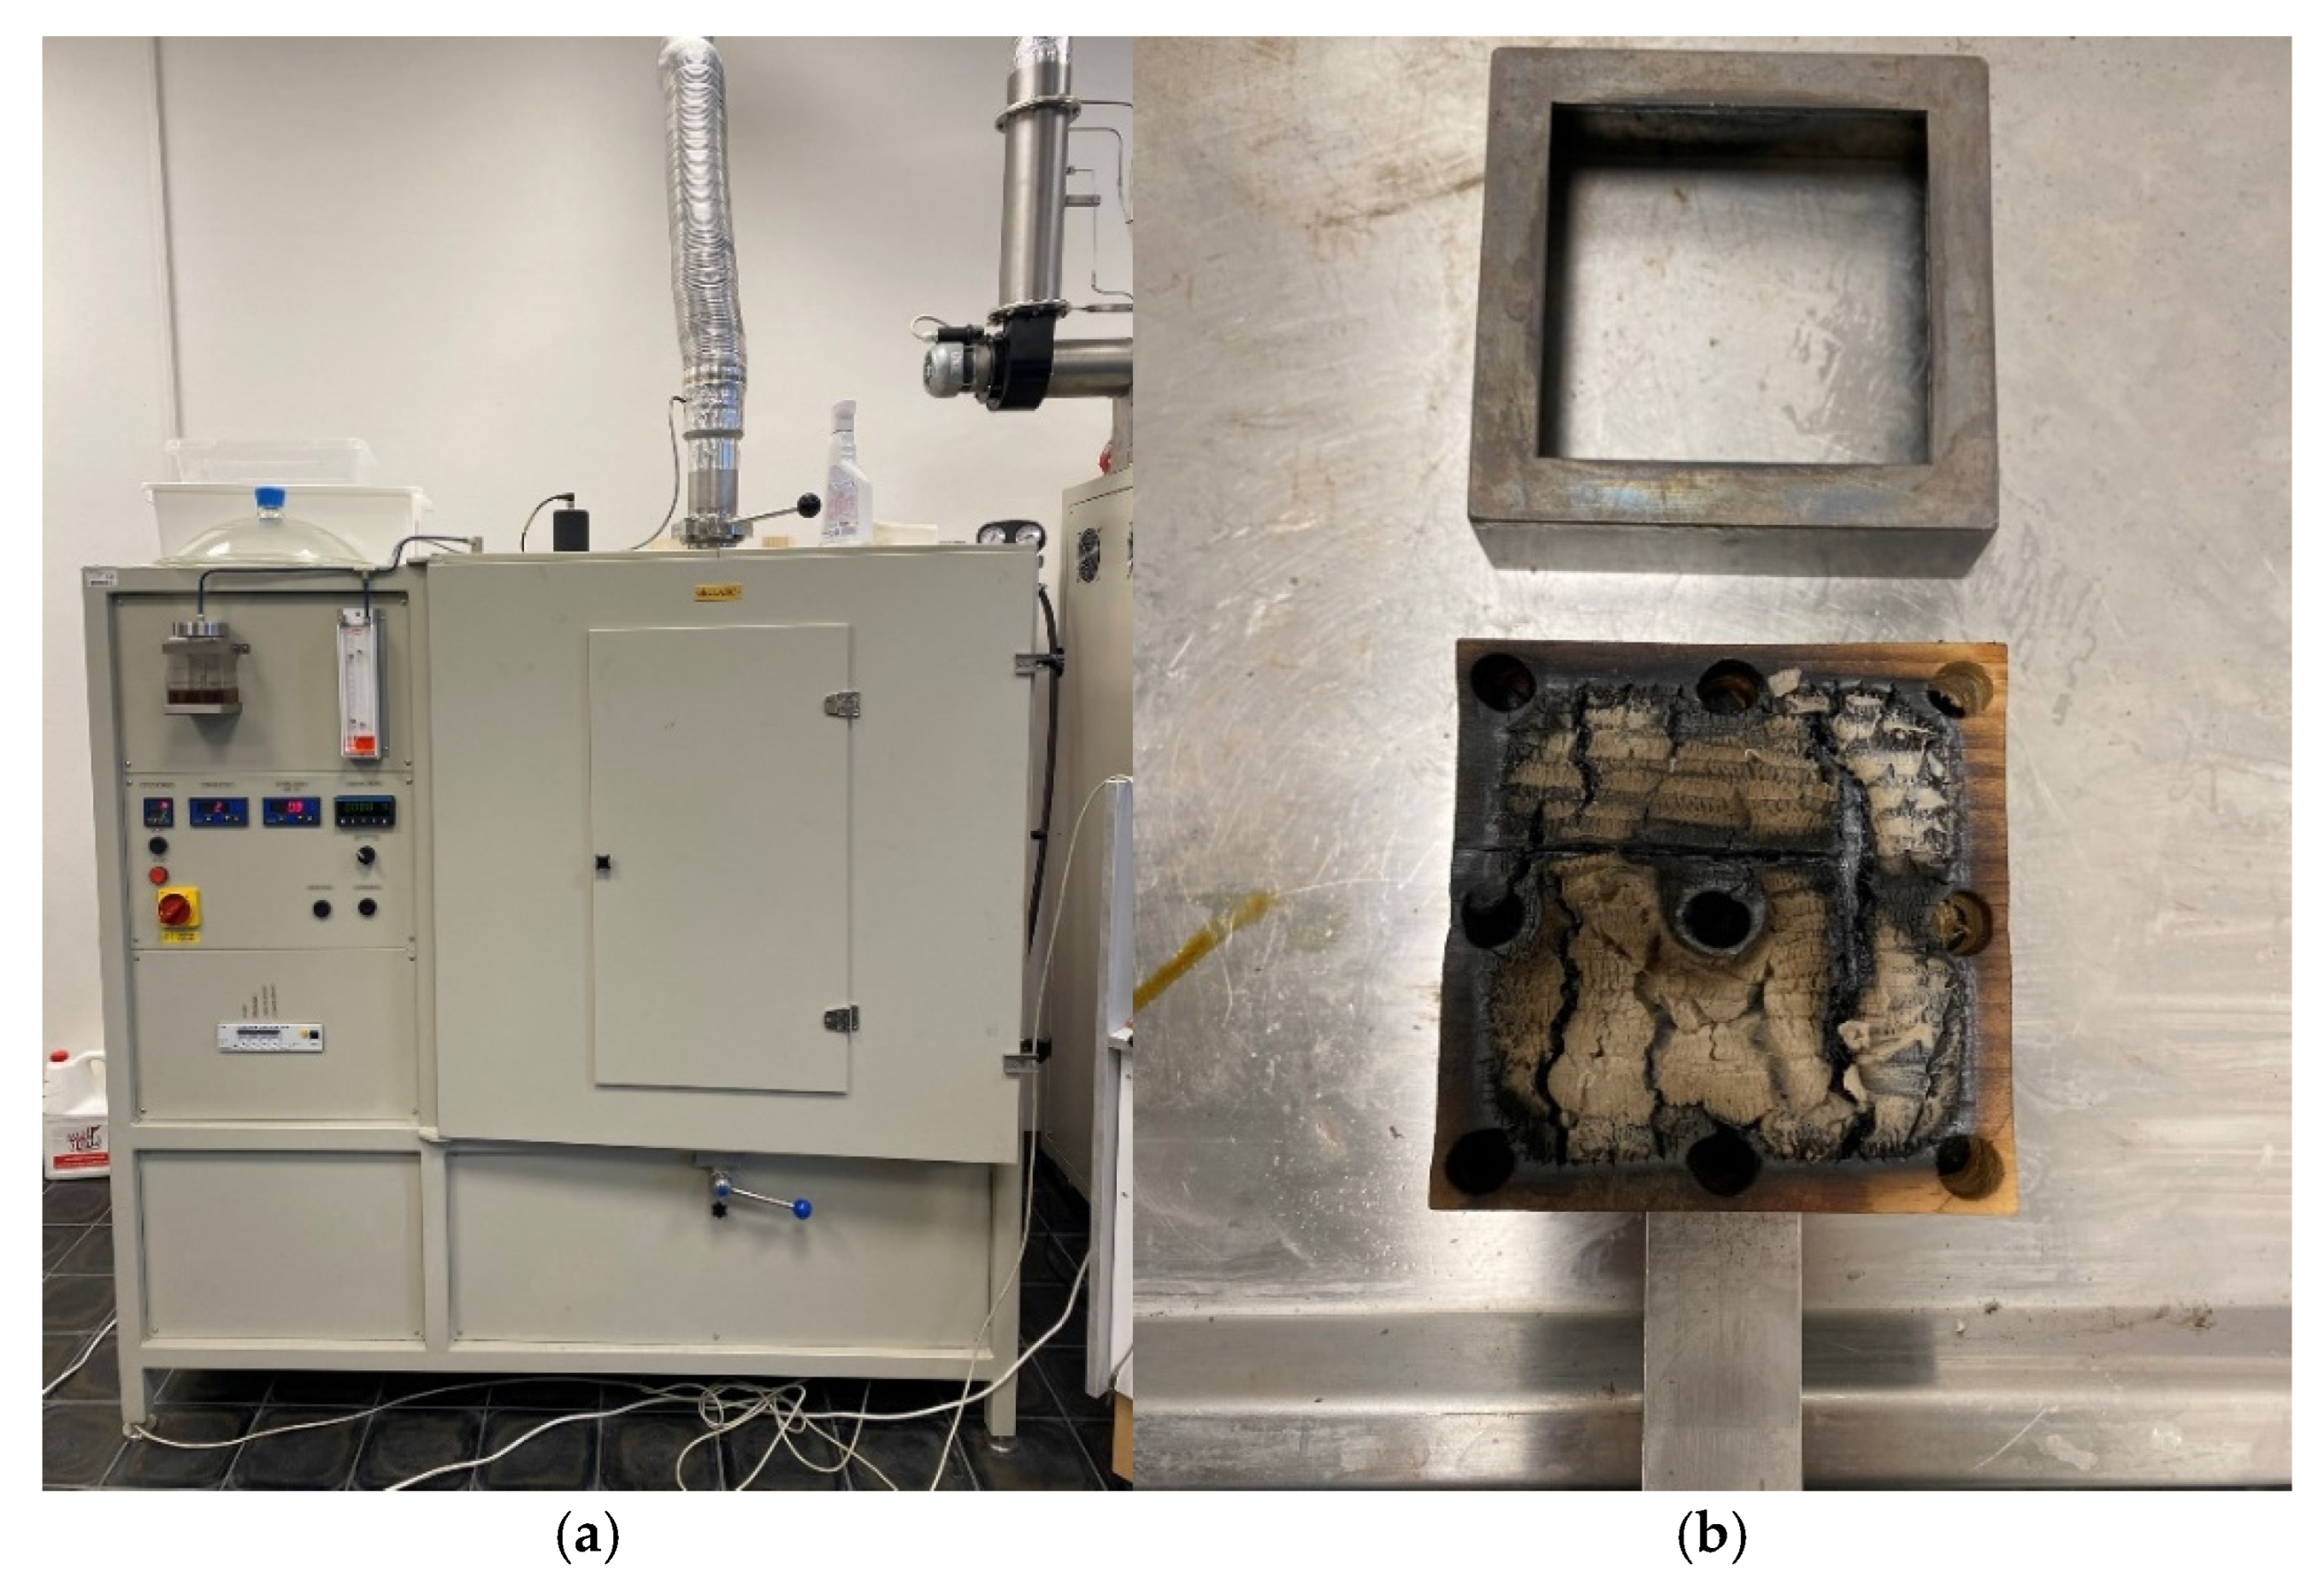
Figure 10.
Heat release rate (HRR) of a solid wood panel as a function of time.
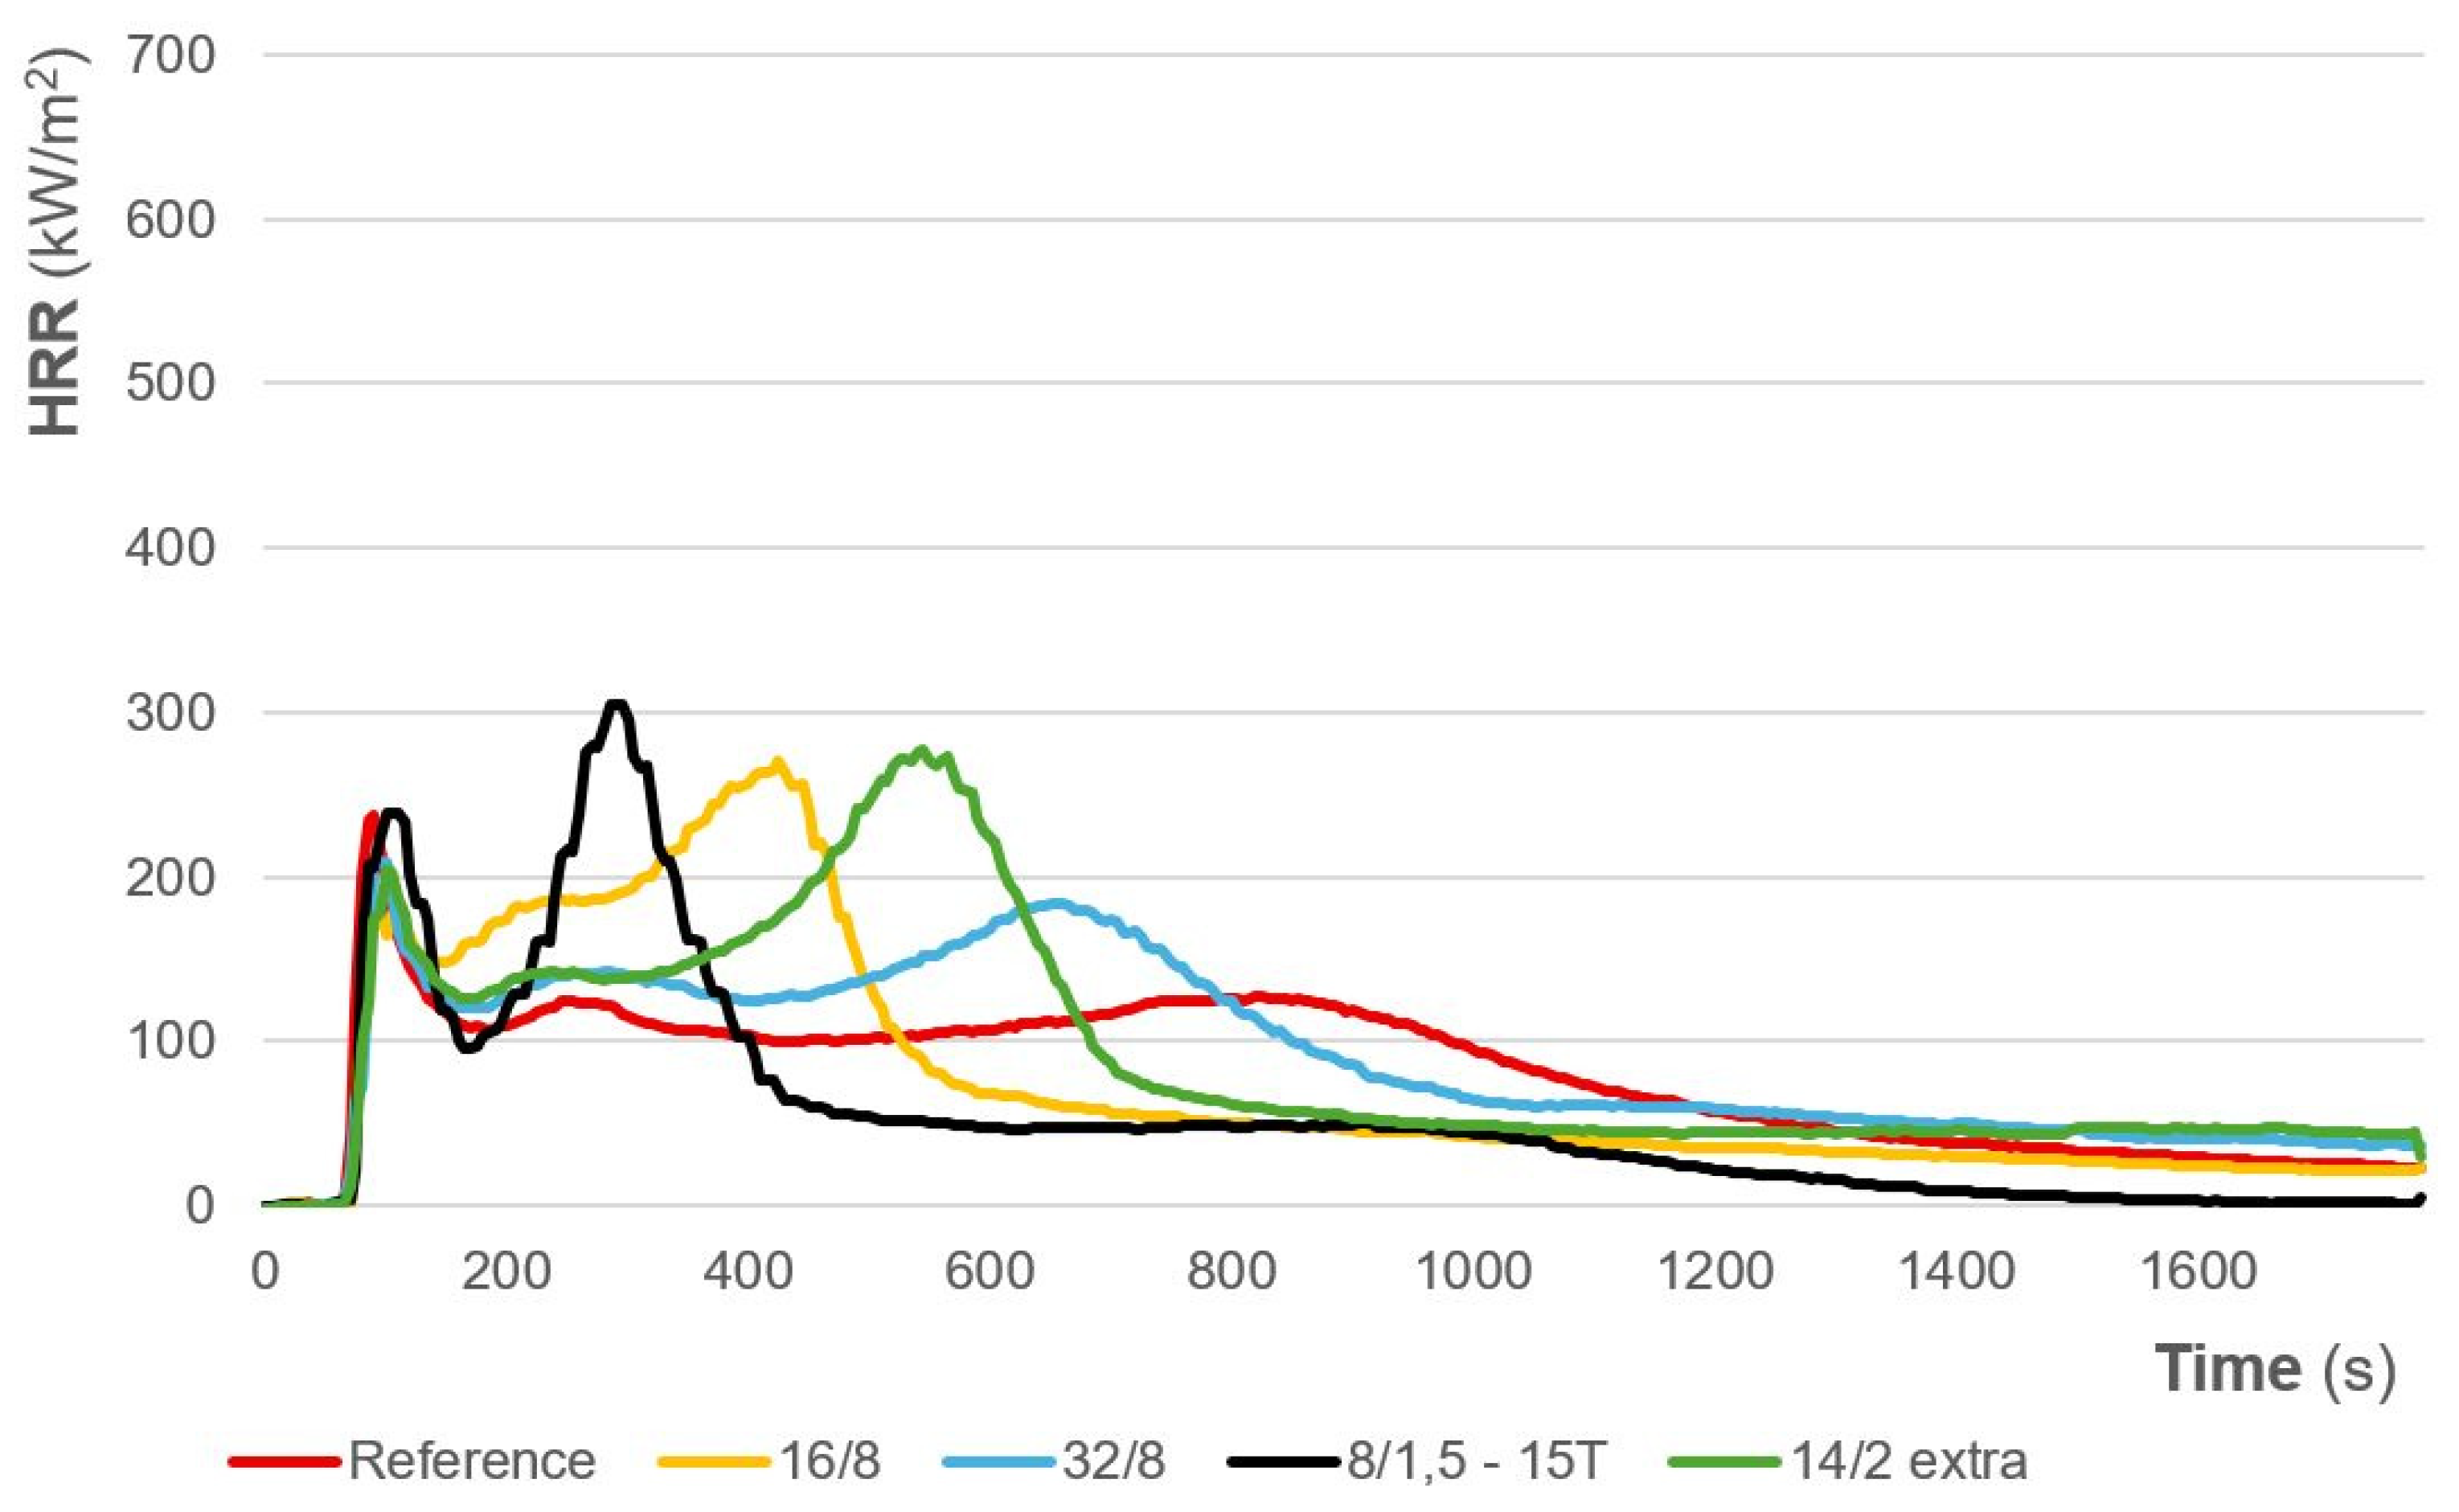
Figure 11.
Heat release rate (HRR) of a plywood as a function of time.
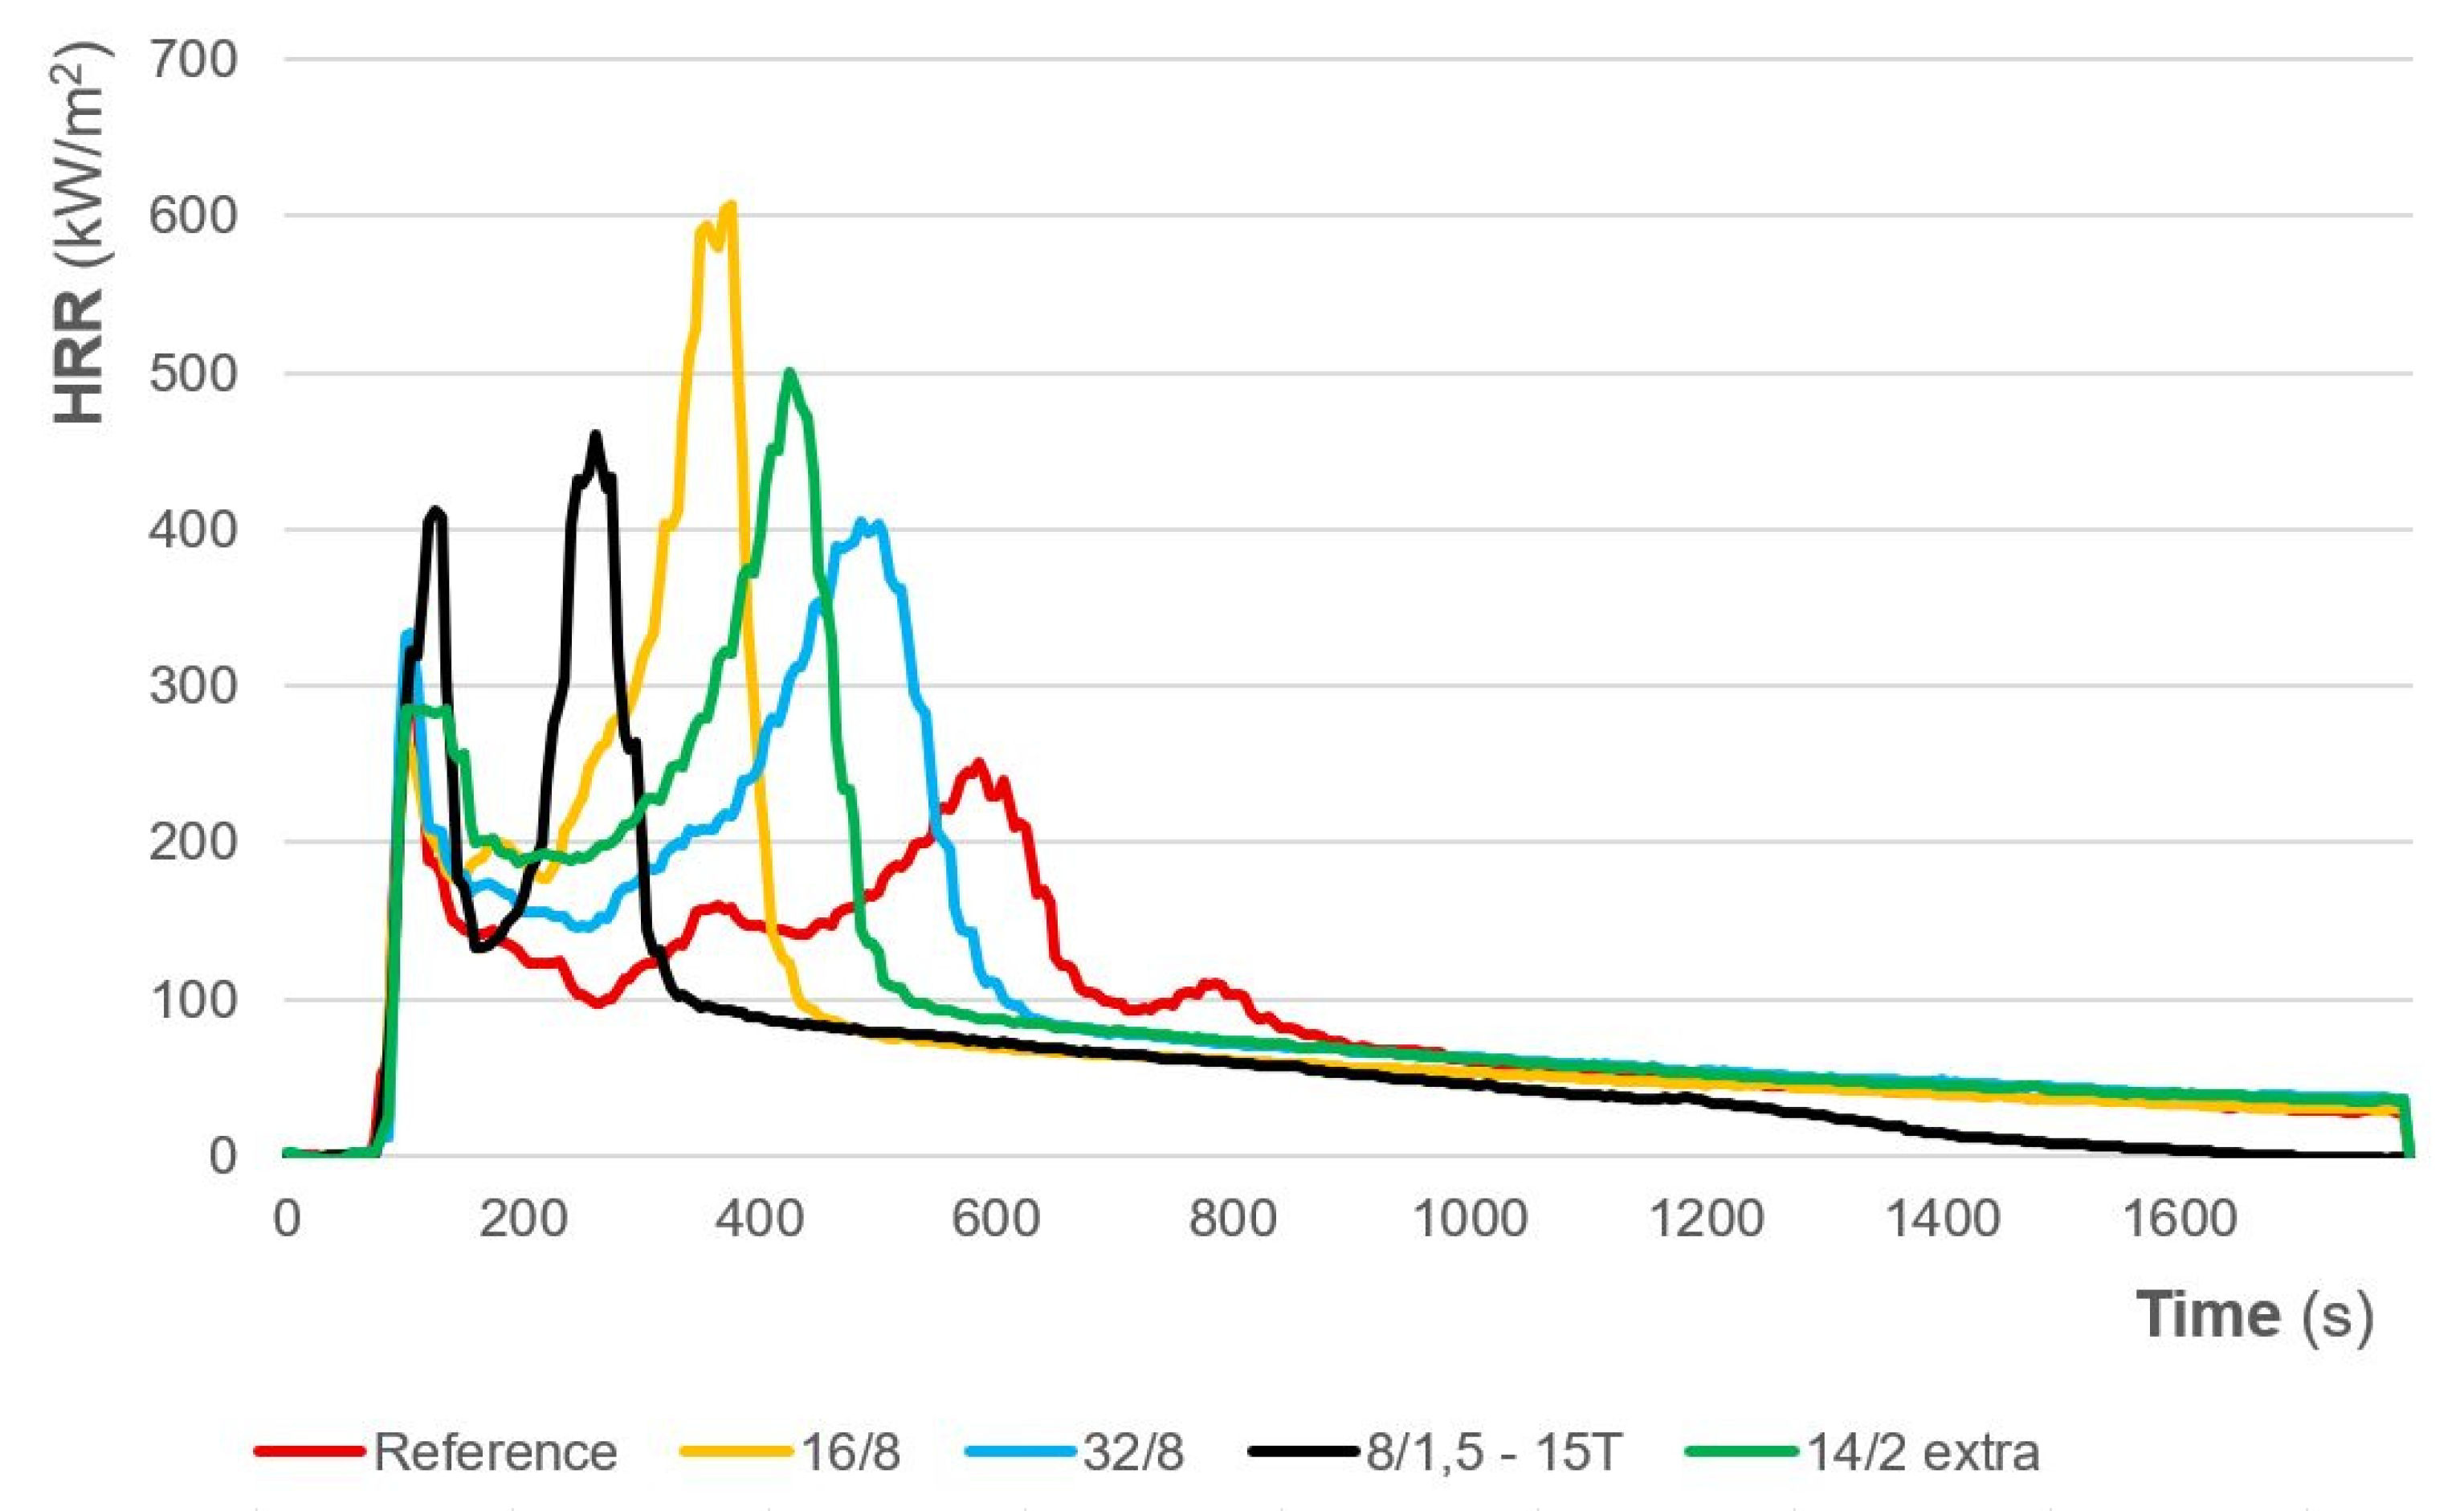
Figure 12.
Heat release rate (HRR) of a MDF as a function of time.
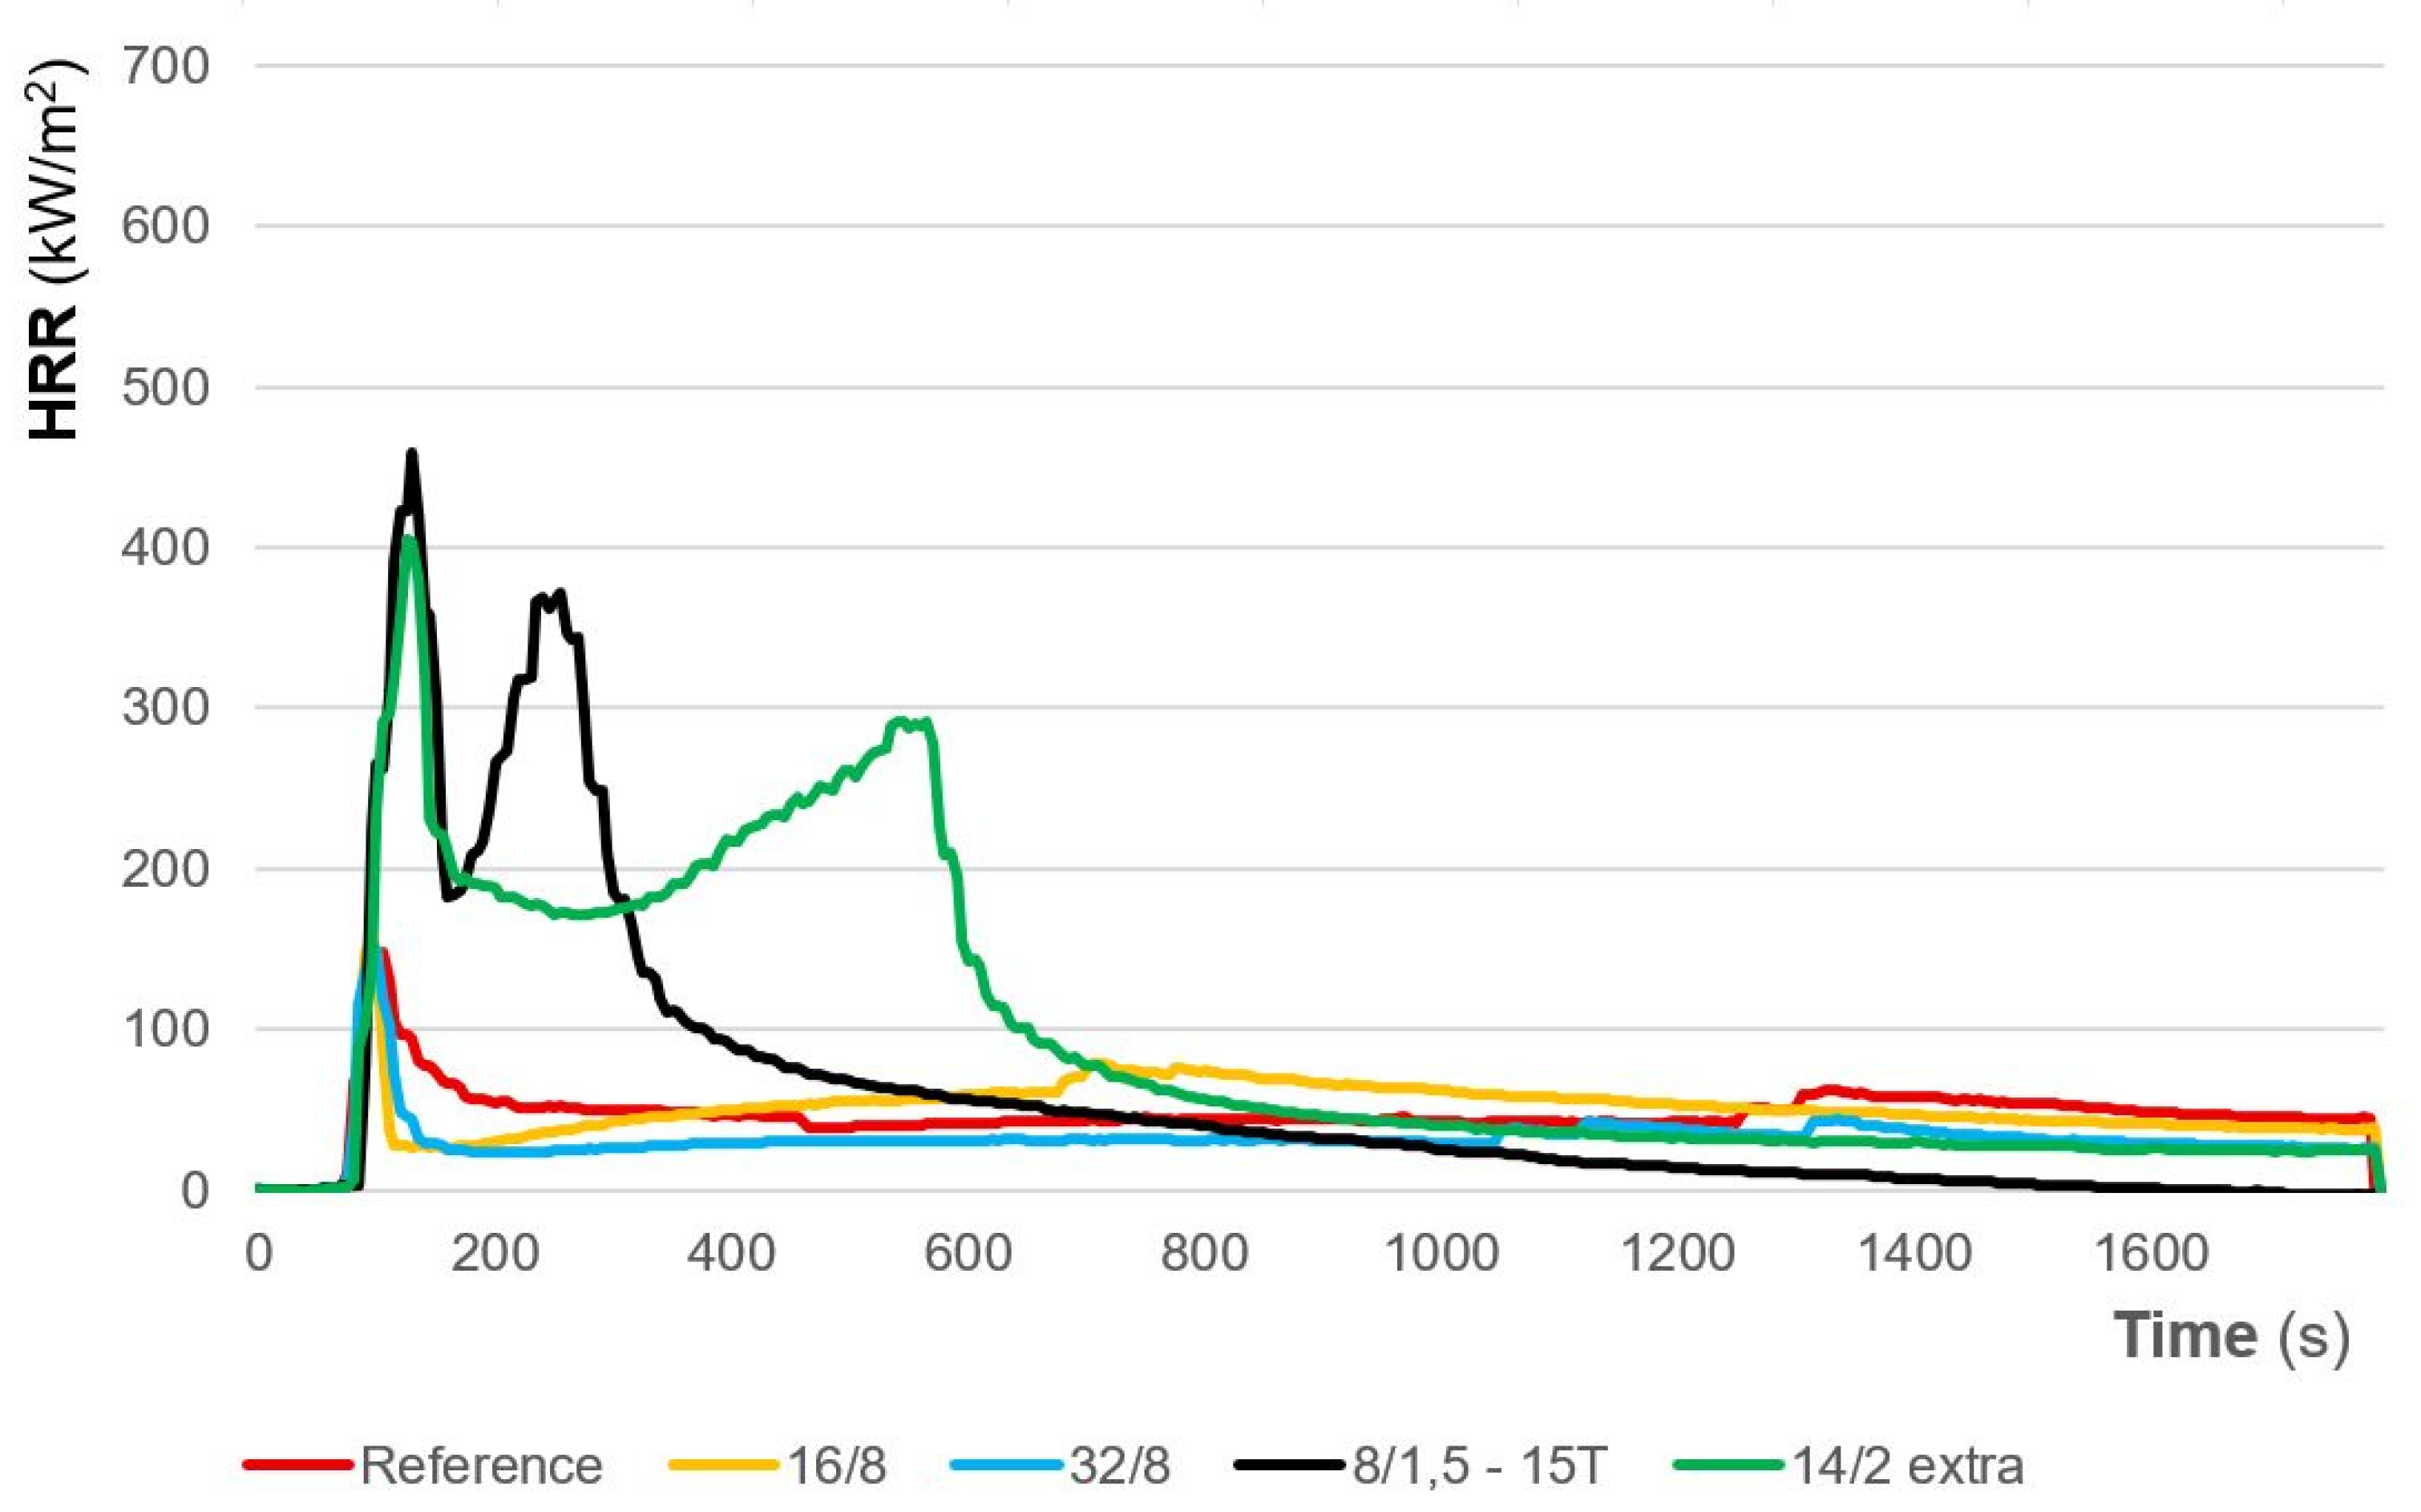
Figure 13.
Statistical evaluation of the effect of primary material and surface acoustic treatment on peak heat rate release (pHRR).
Figure 13.
Statistical evaluation of the effect of primary material and surface acoustic treatment on peak heat rate release (pHRR).
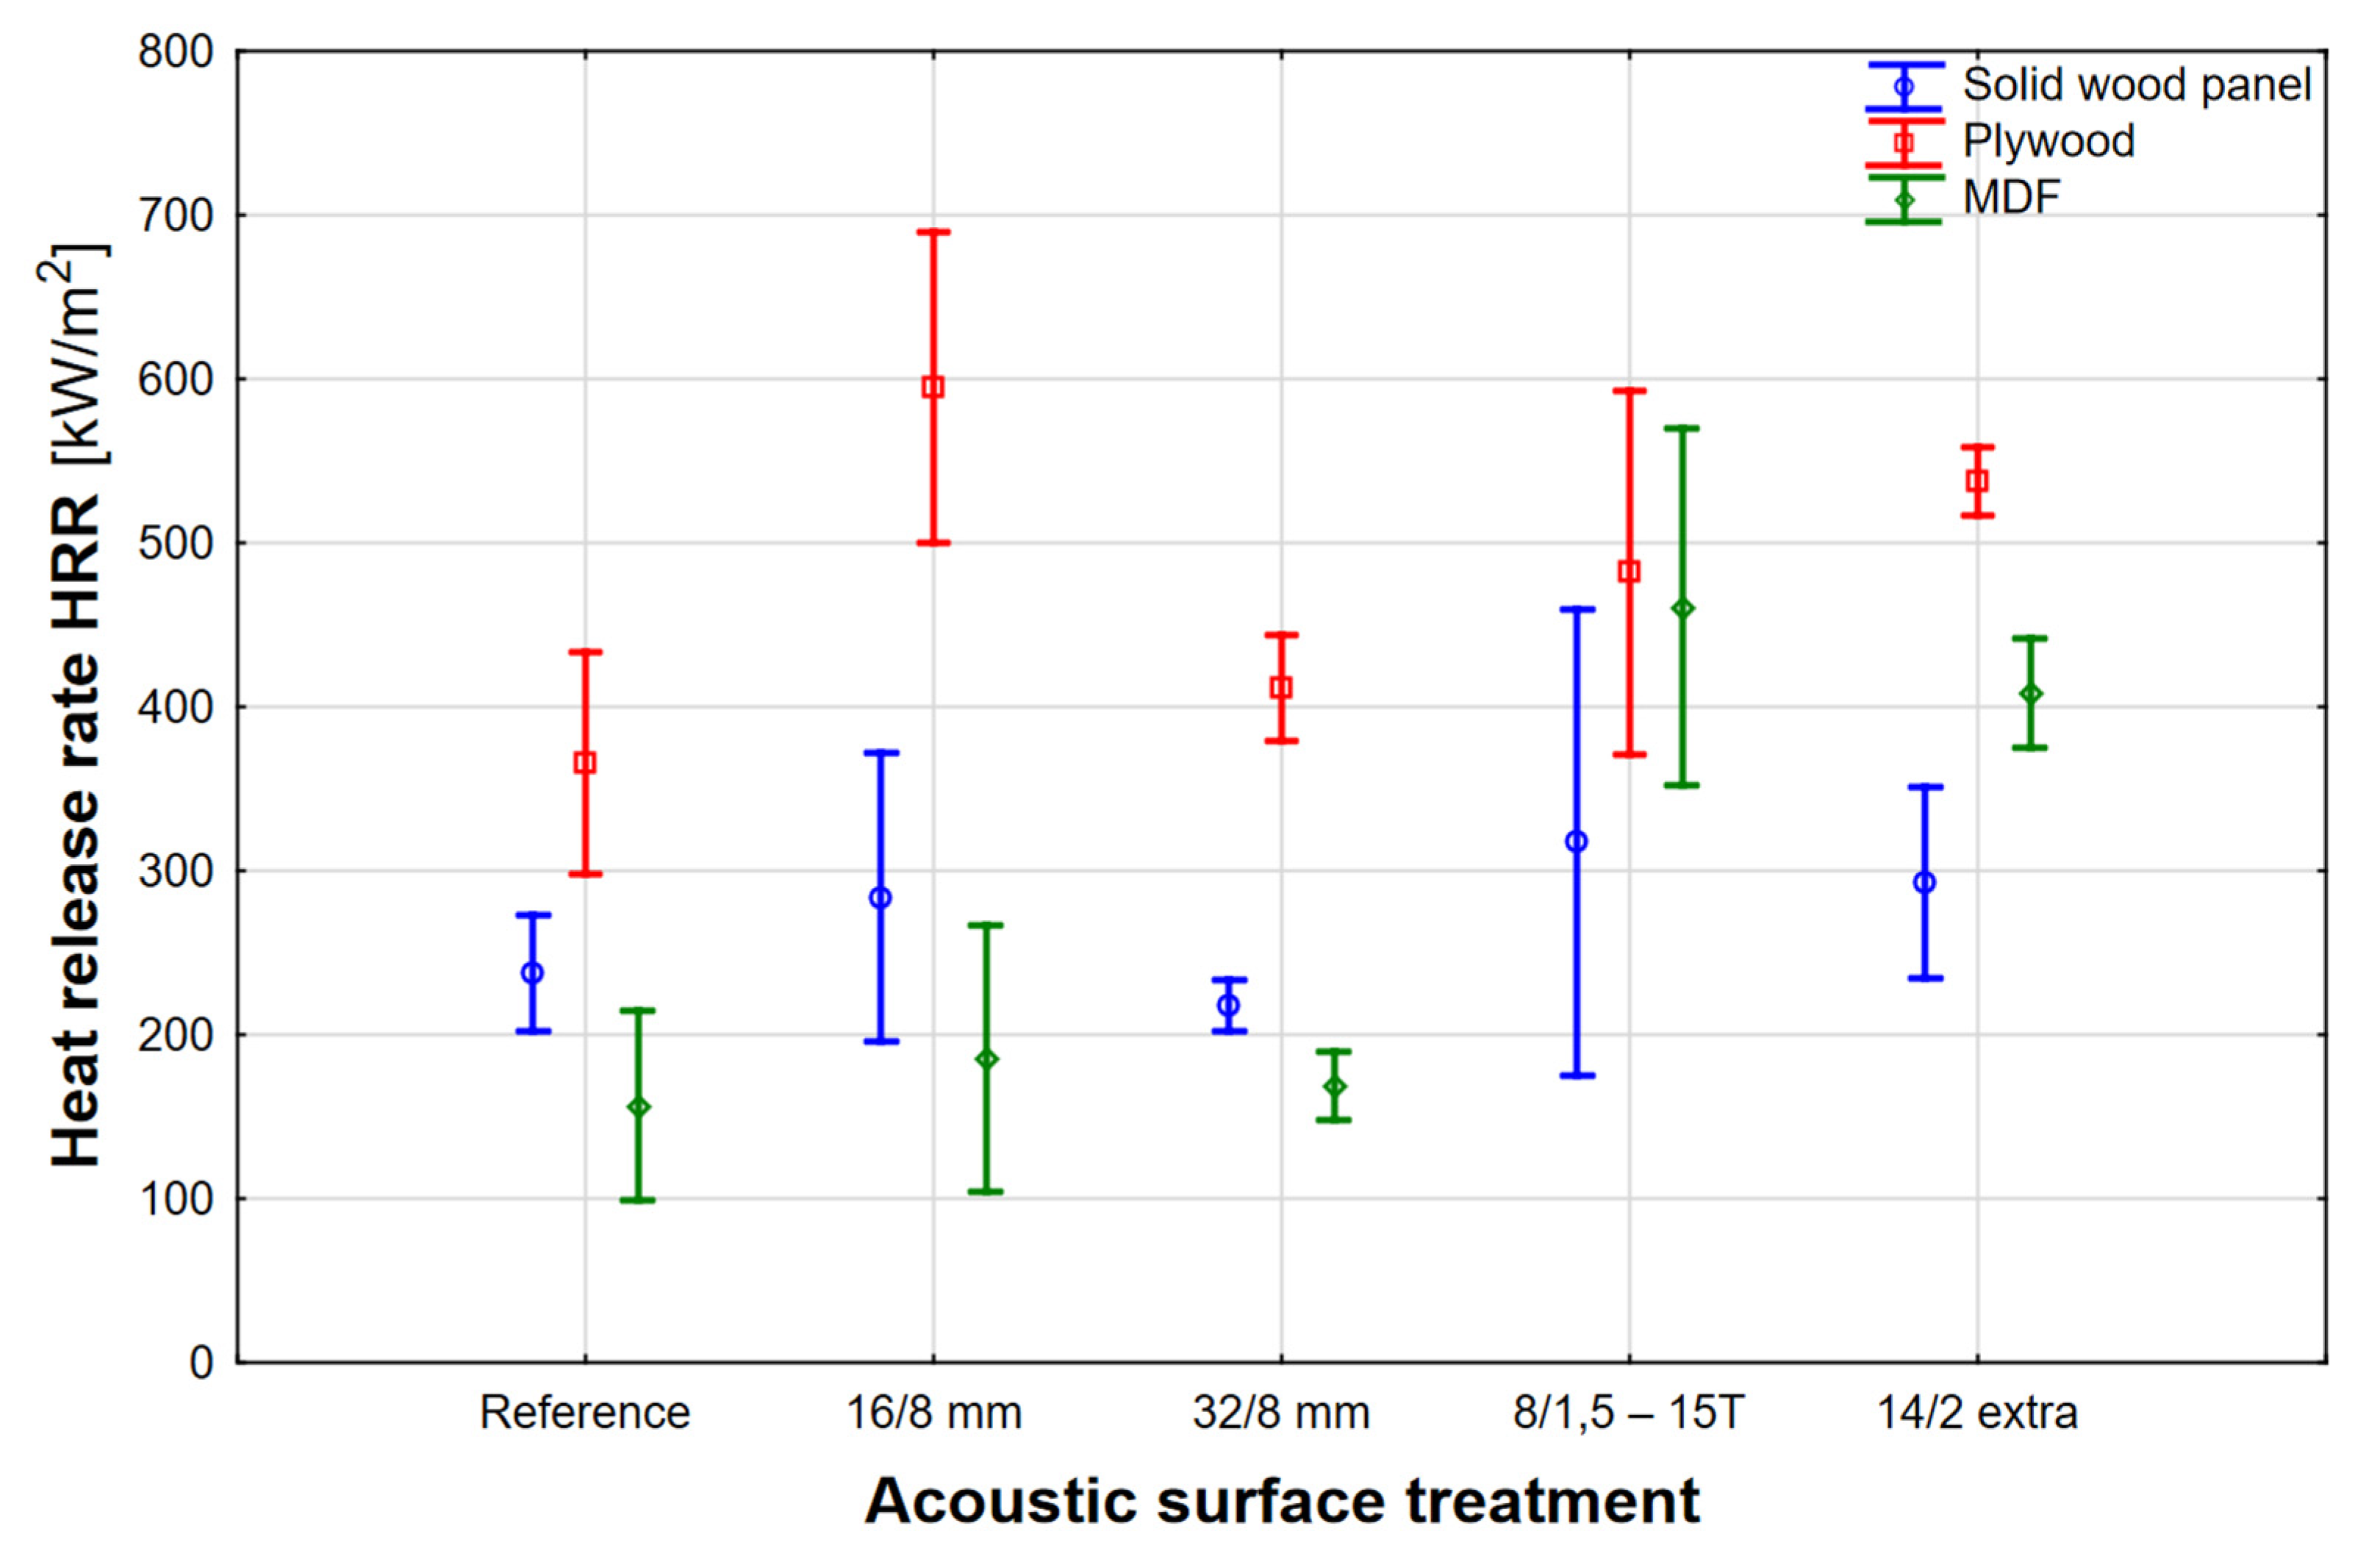
Figure 14.
Statistical evaluation of the effect of primary material and surface acoustic treatment on peak values of mass loss rate (MLR).
Figure 14.
Statistical evaluation of the effect of primary material and surface acoustic treatment on peak values of mass loss rate (MLR).
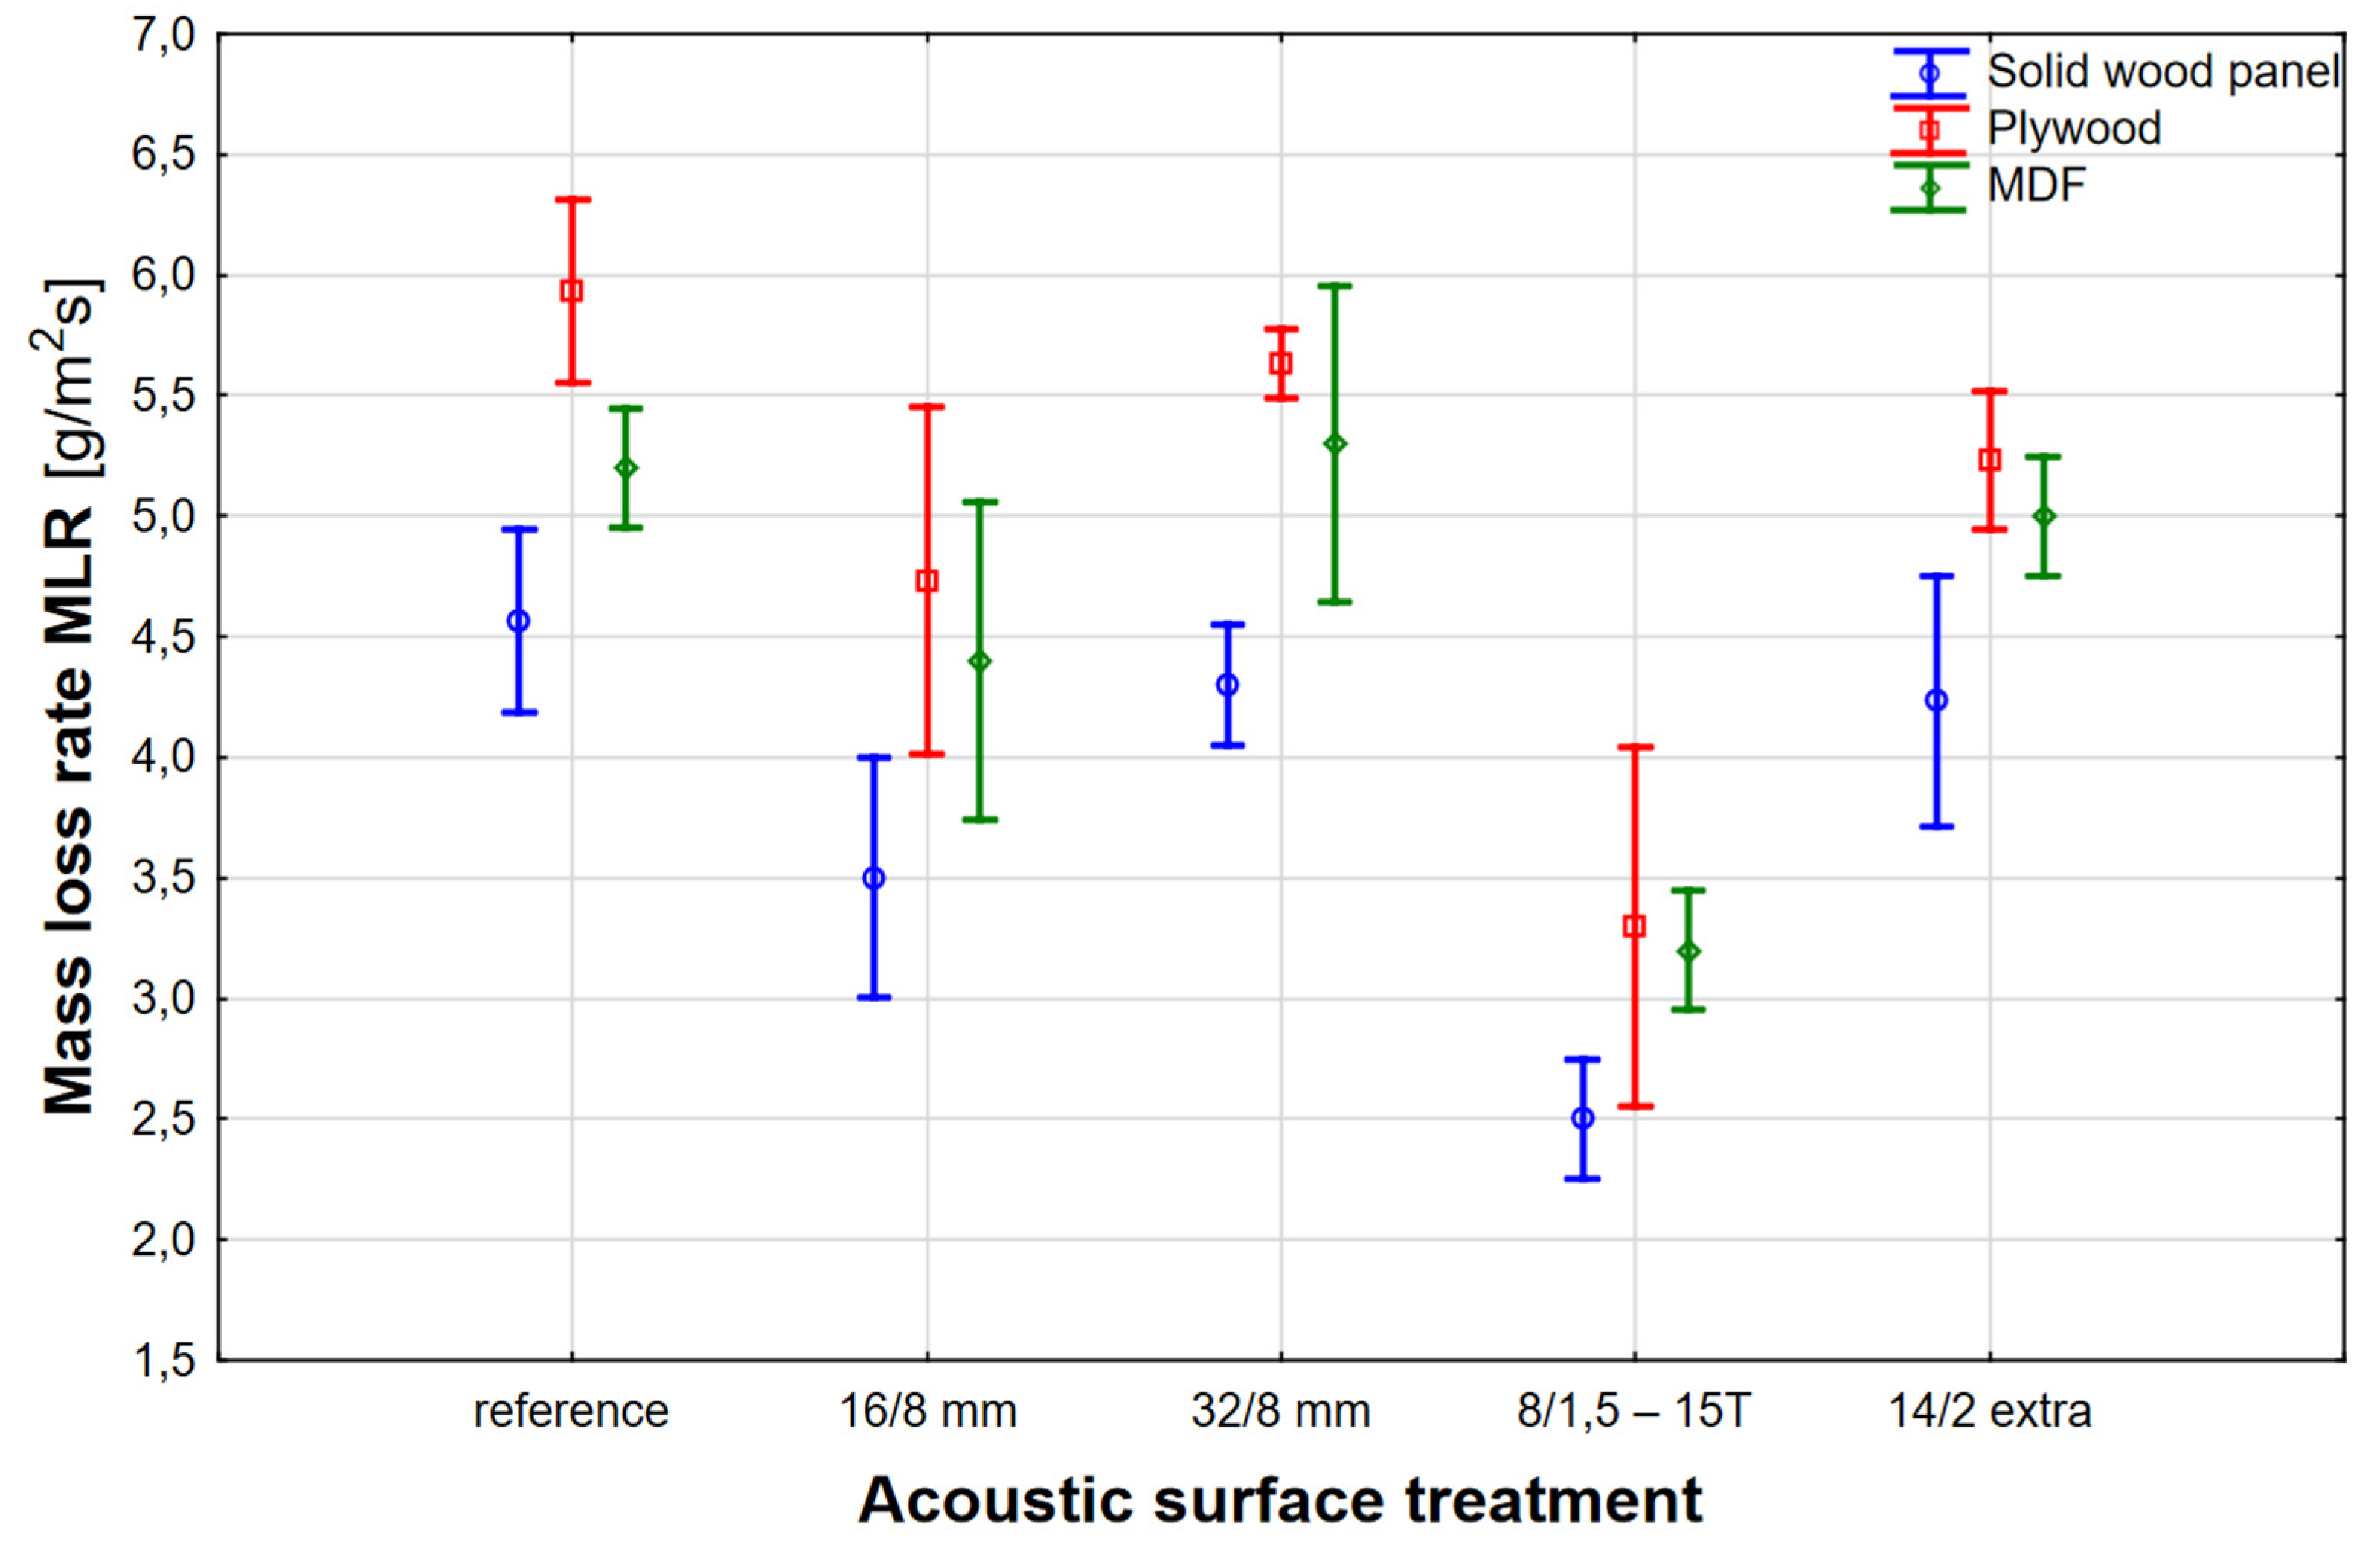
Figure 15.
The height of the charred area for various acoustic panels.
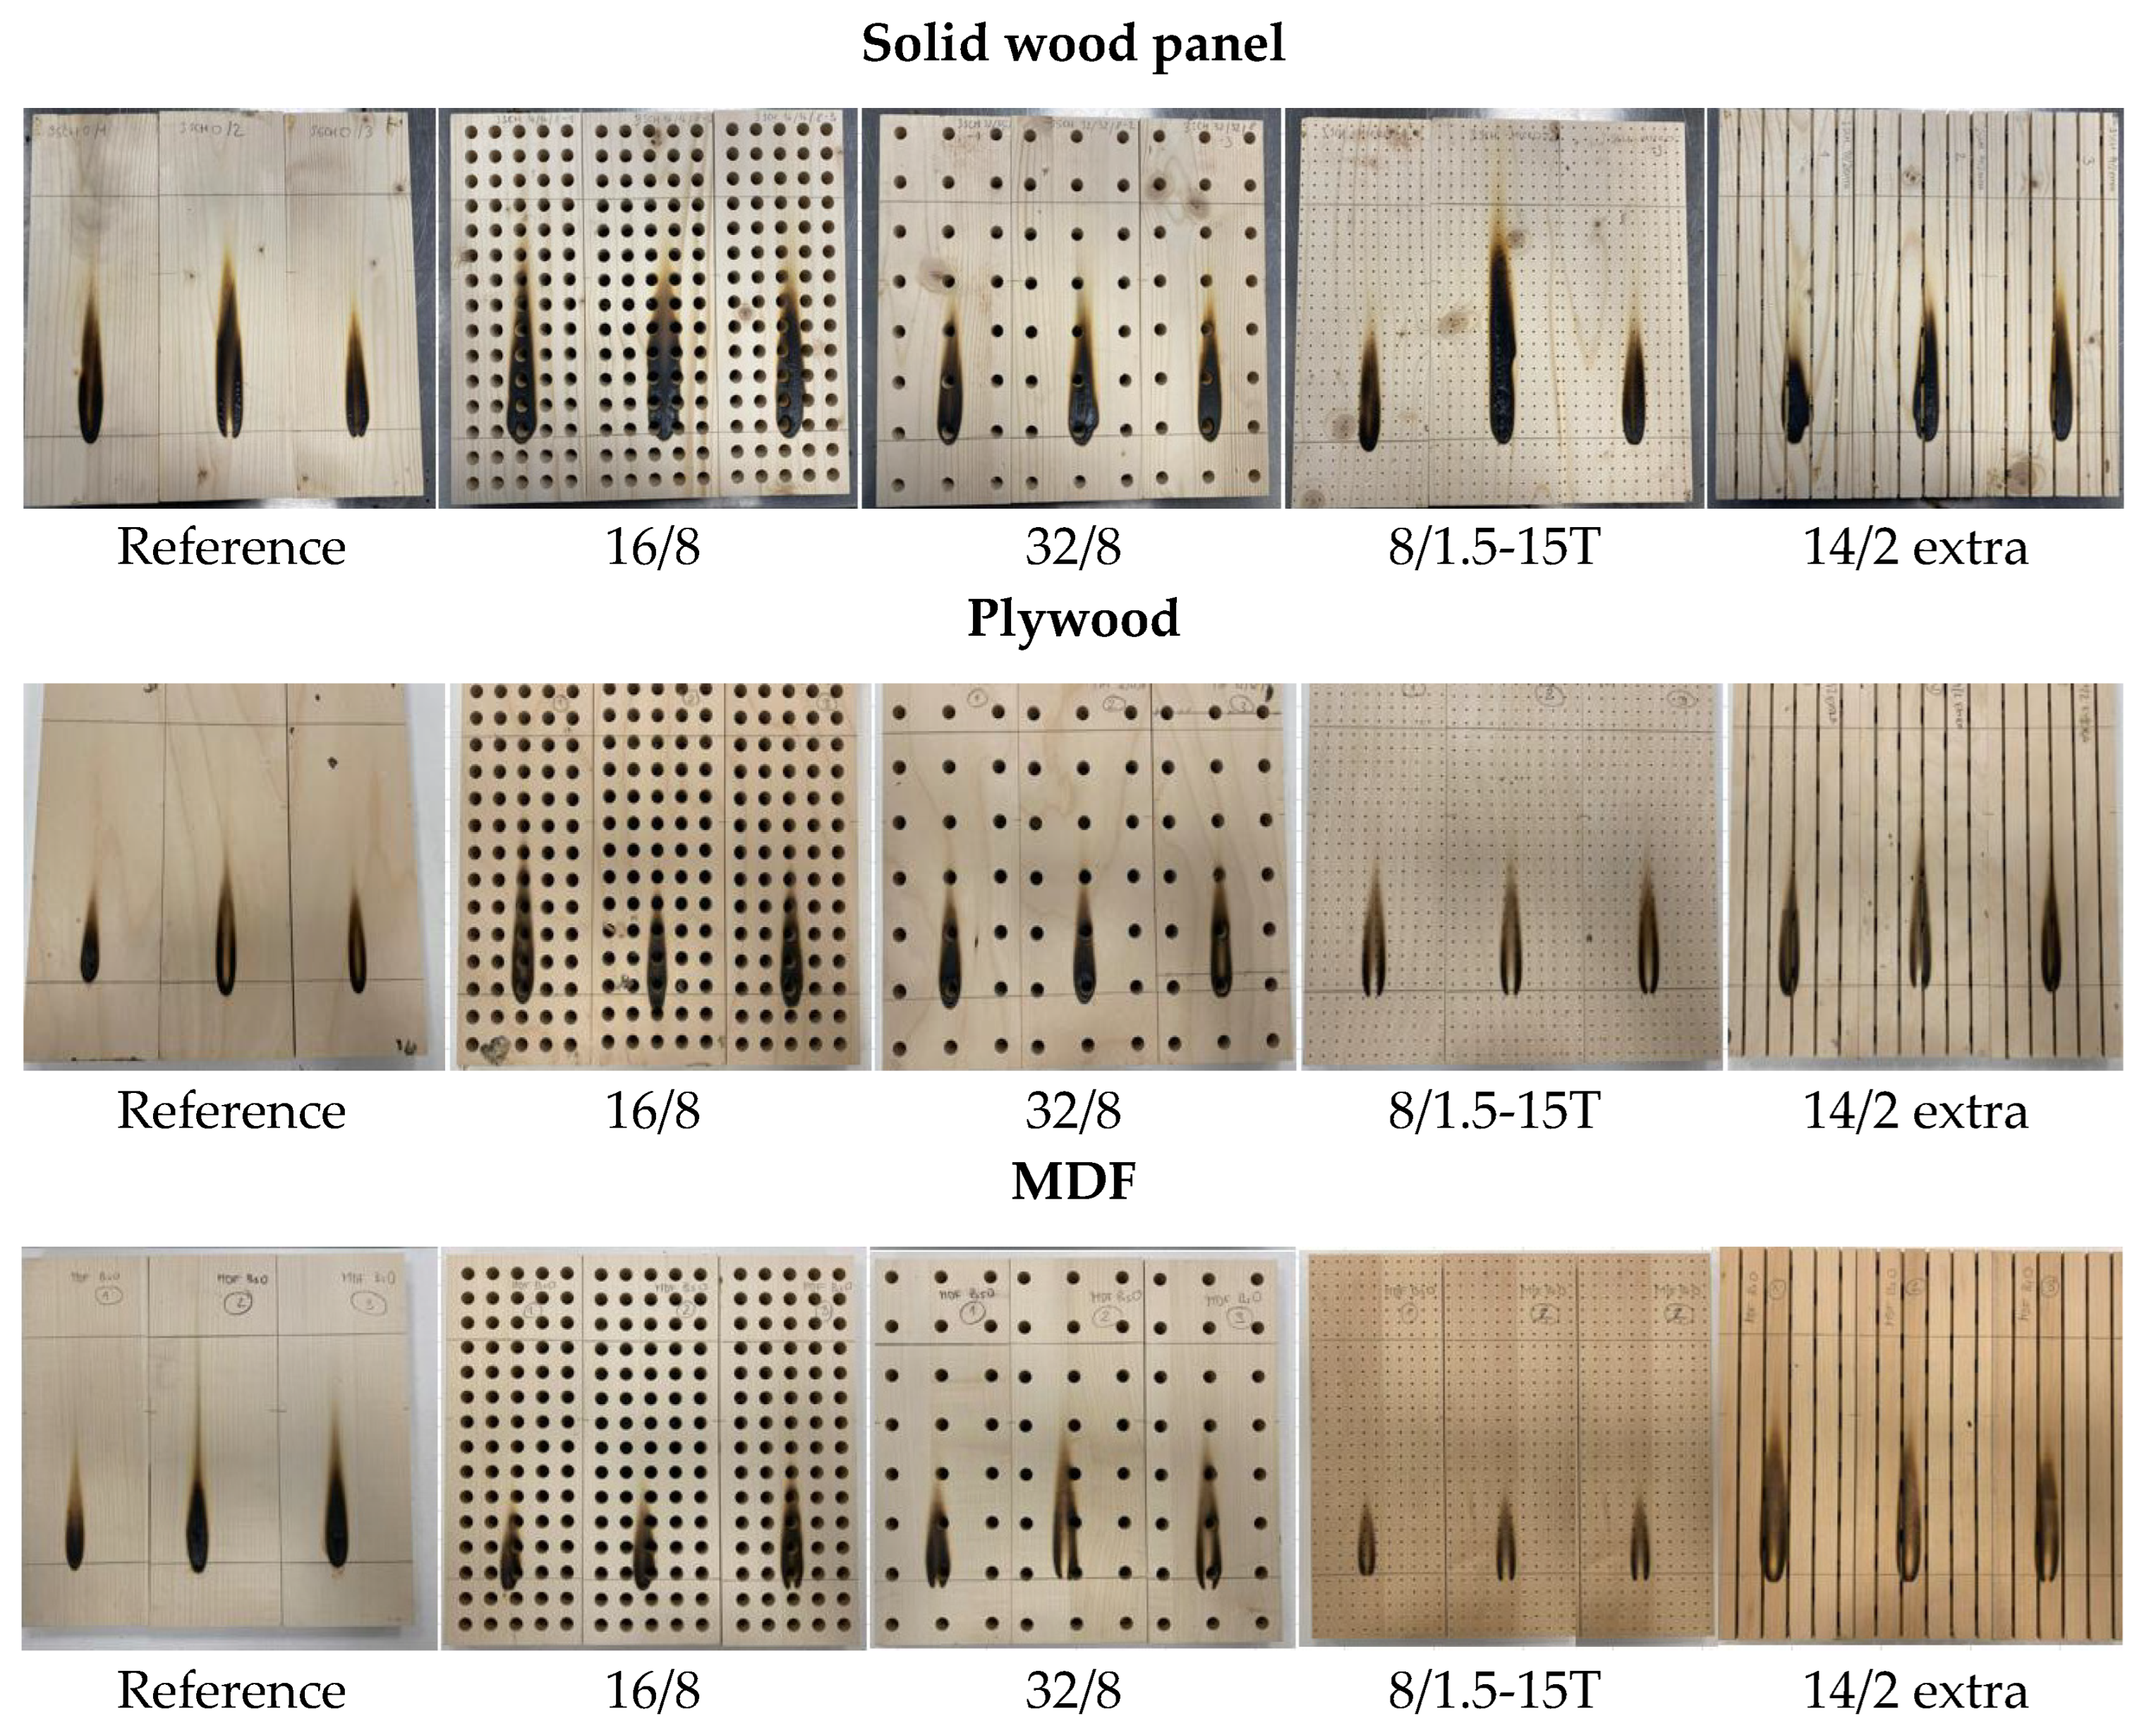
Figure 16.
Time-dependent course of specific optical density of smoke for a solid wood panel.
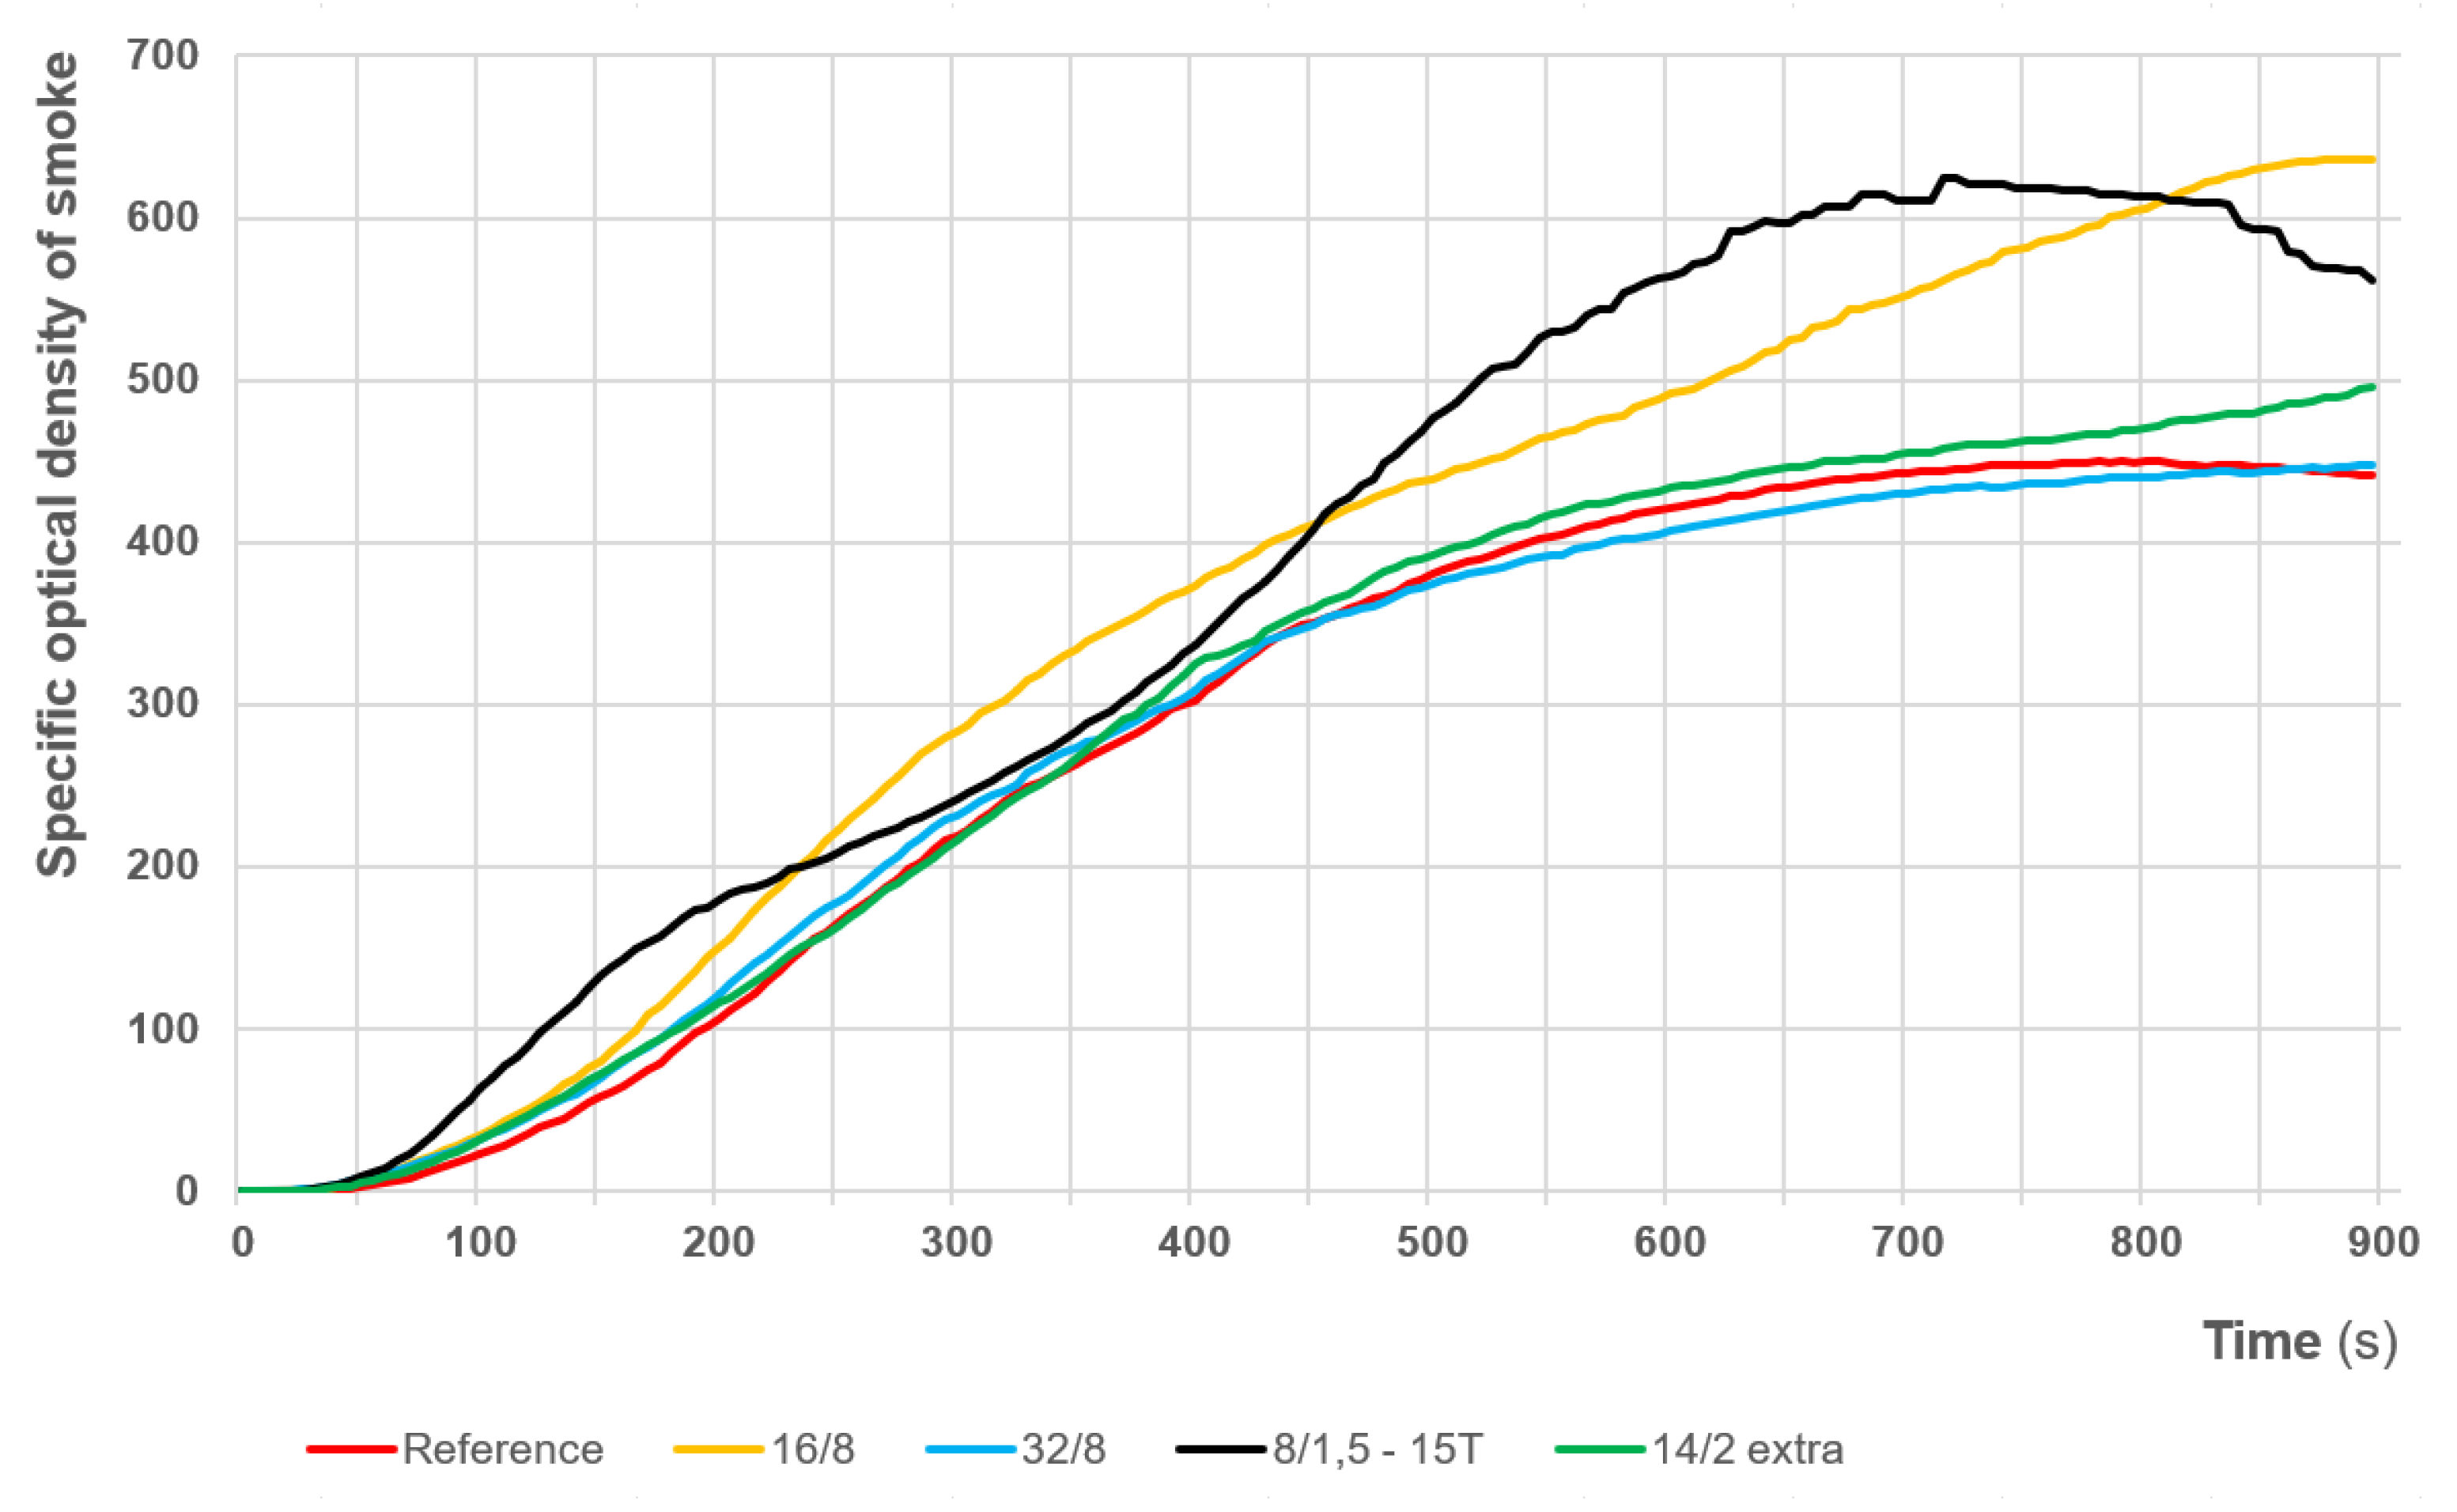
Figure 17.
Time-dependent course of specific optical density of smoke for a plywood.
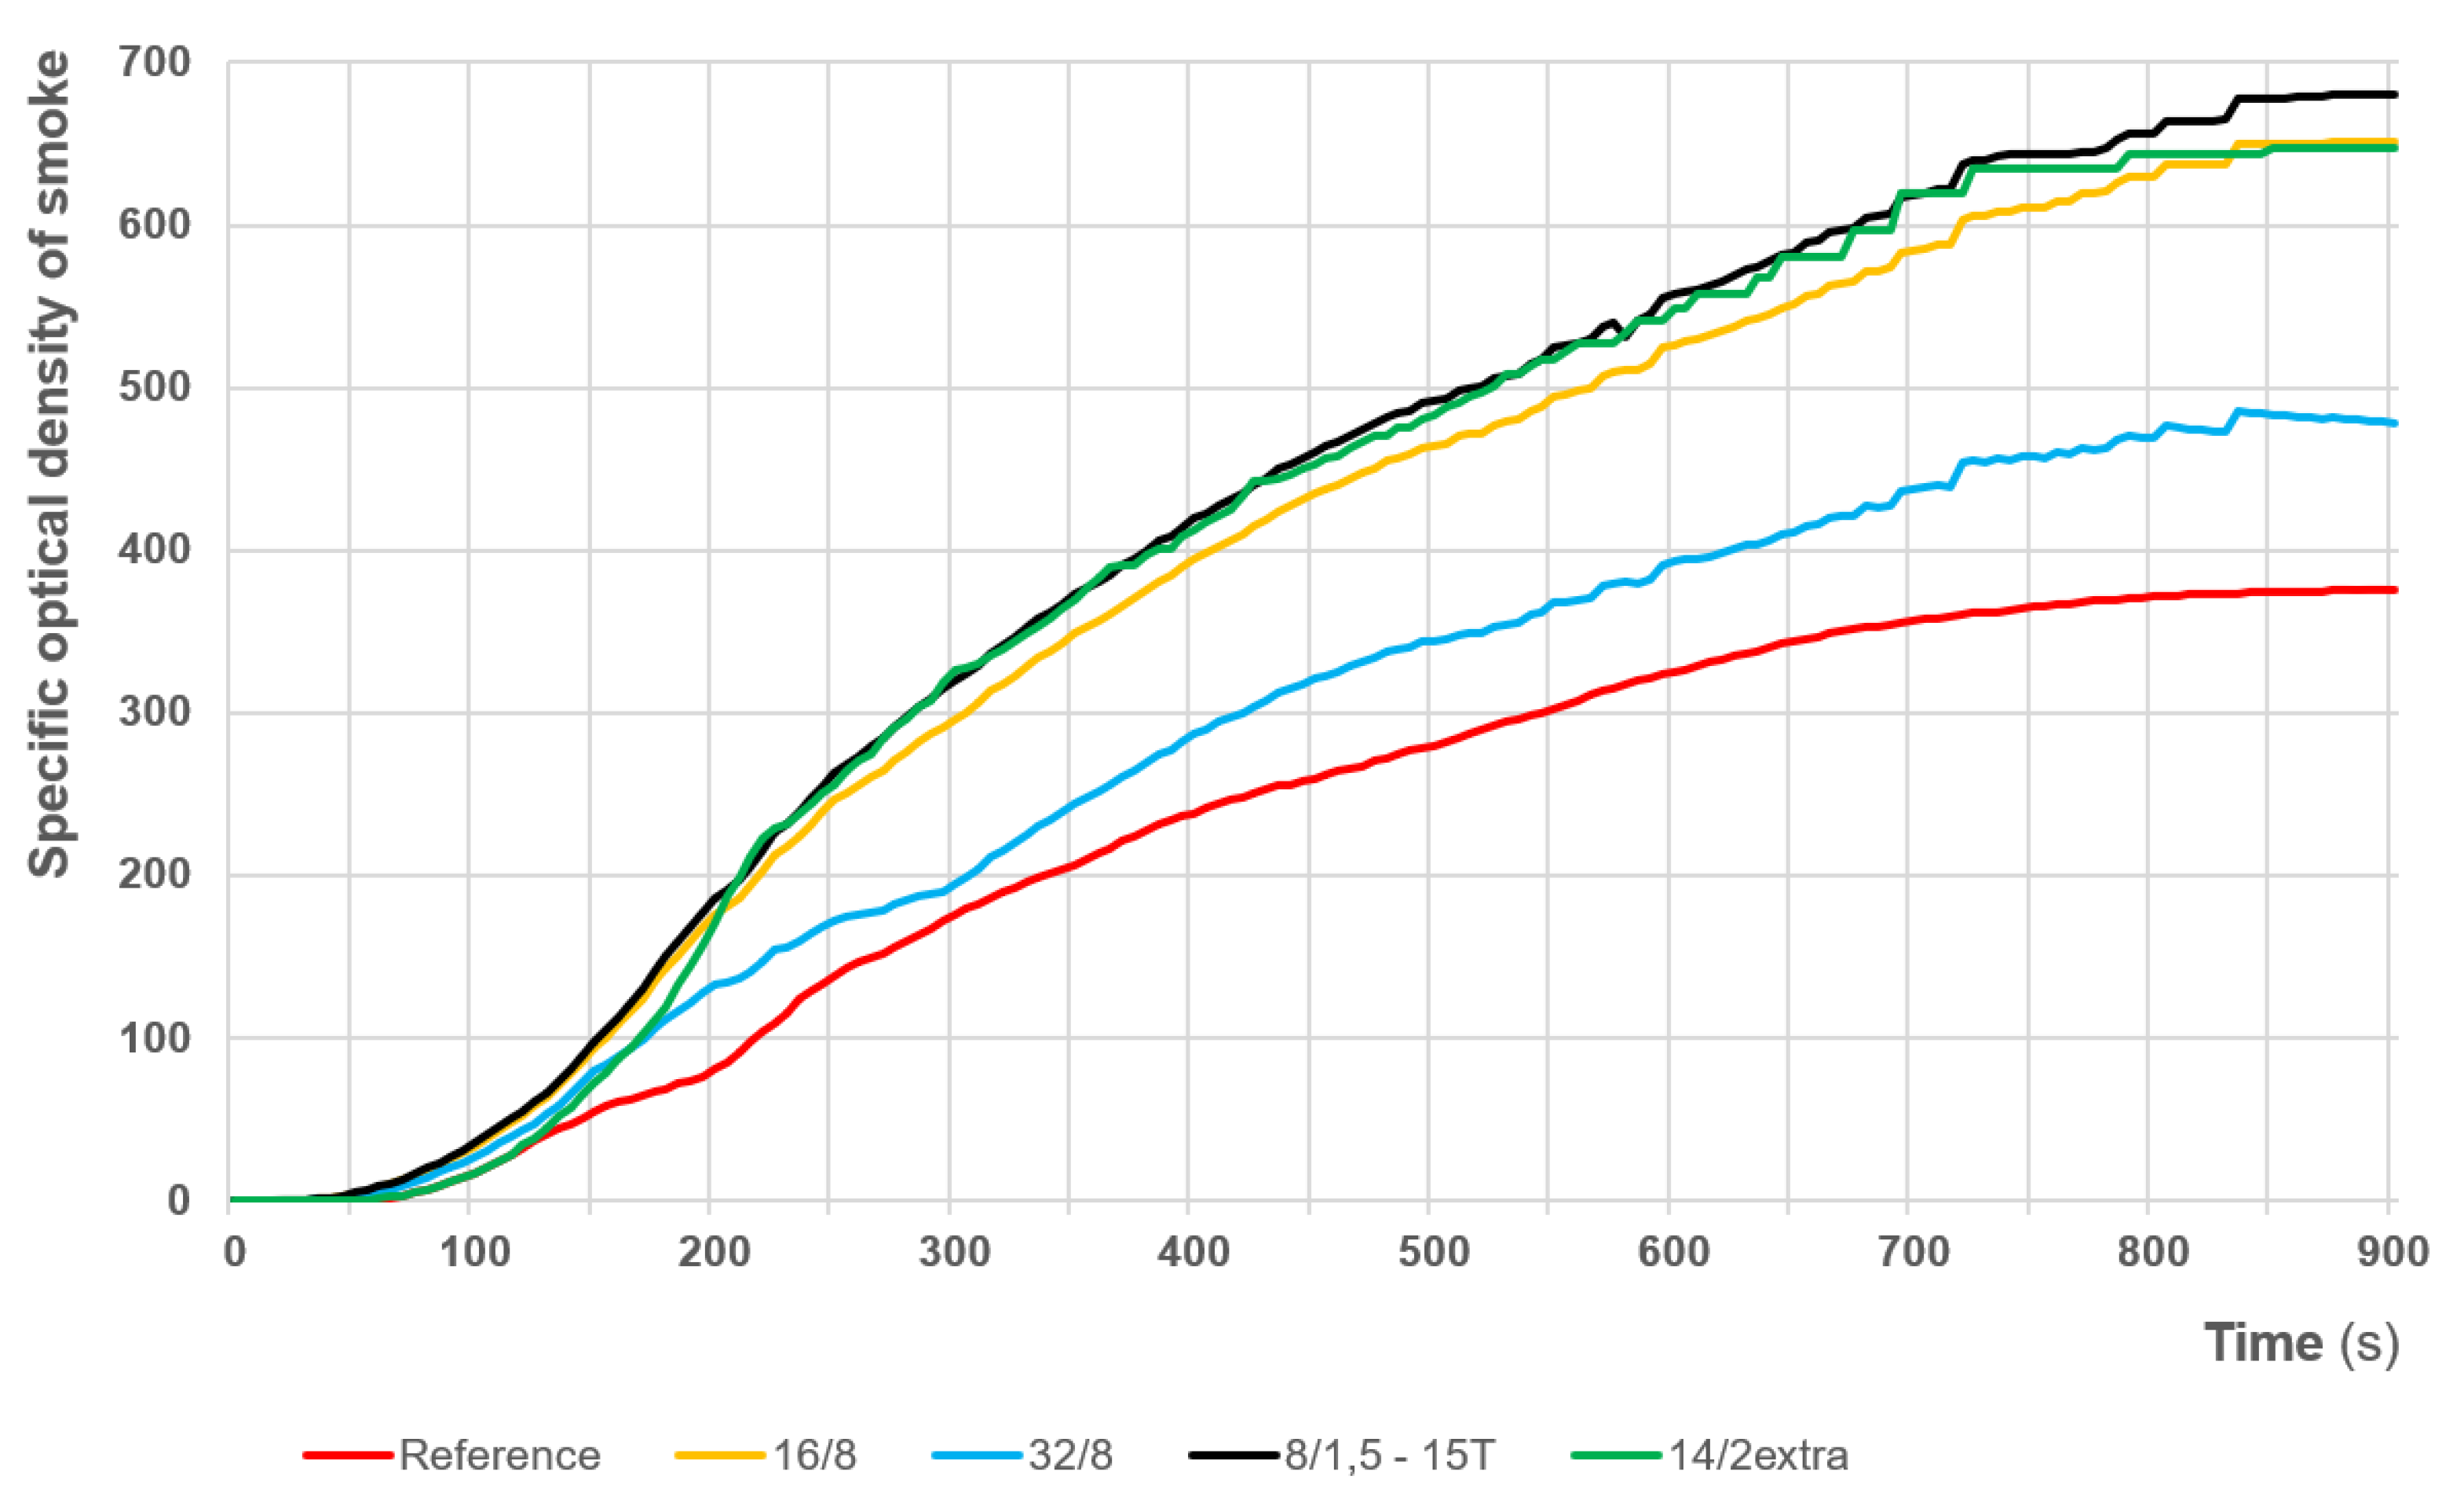
Figure 18.
Time-dependent course of specific optical density of smoke for a MDF.
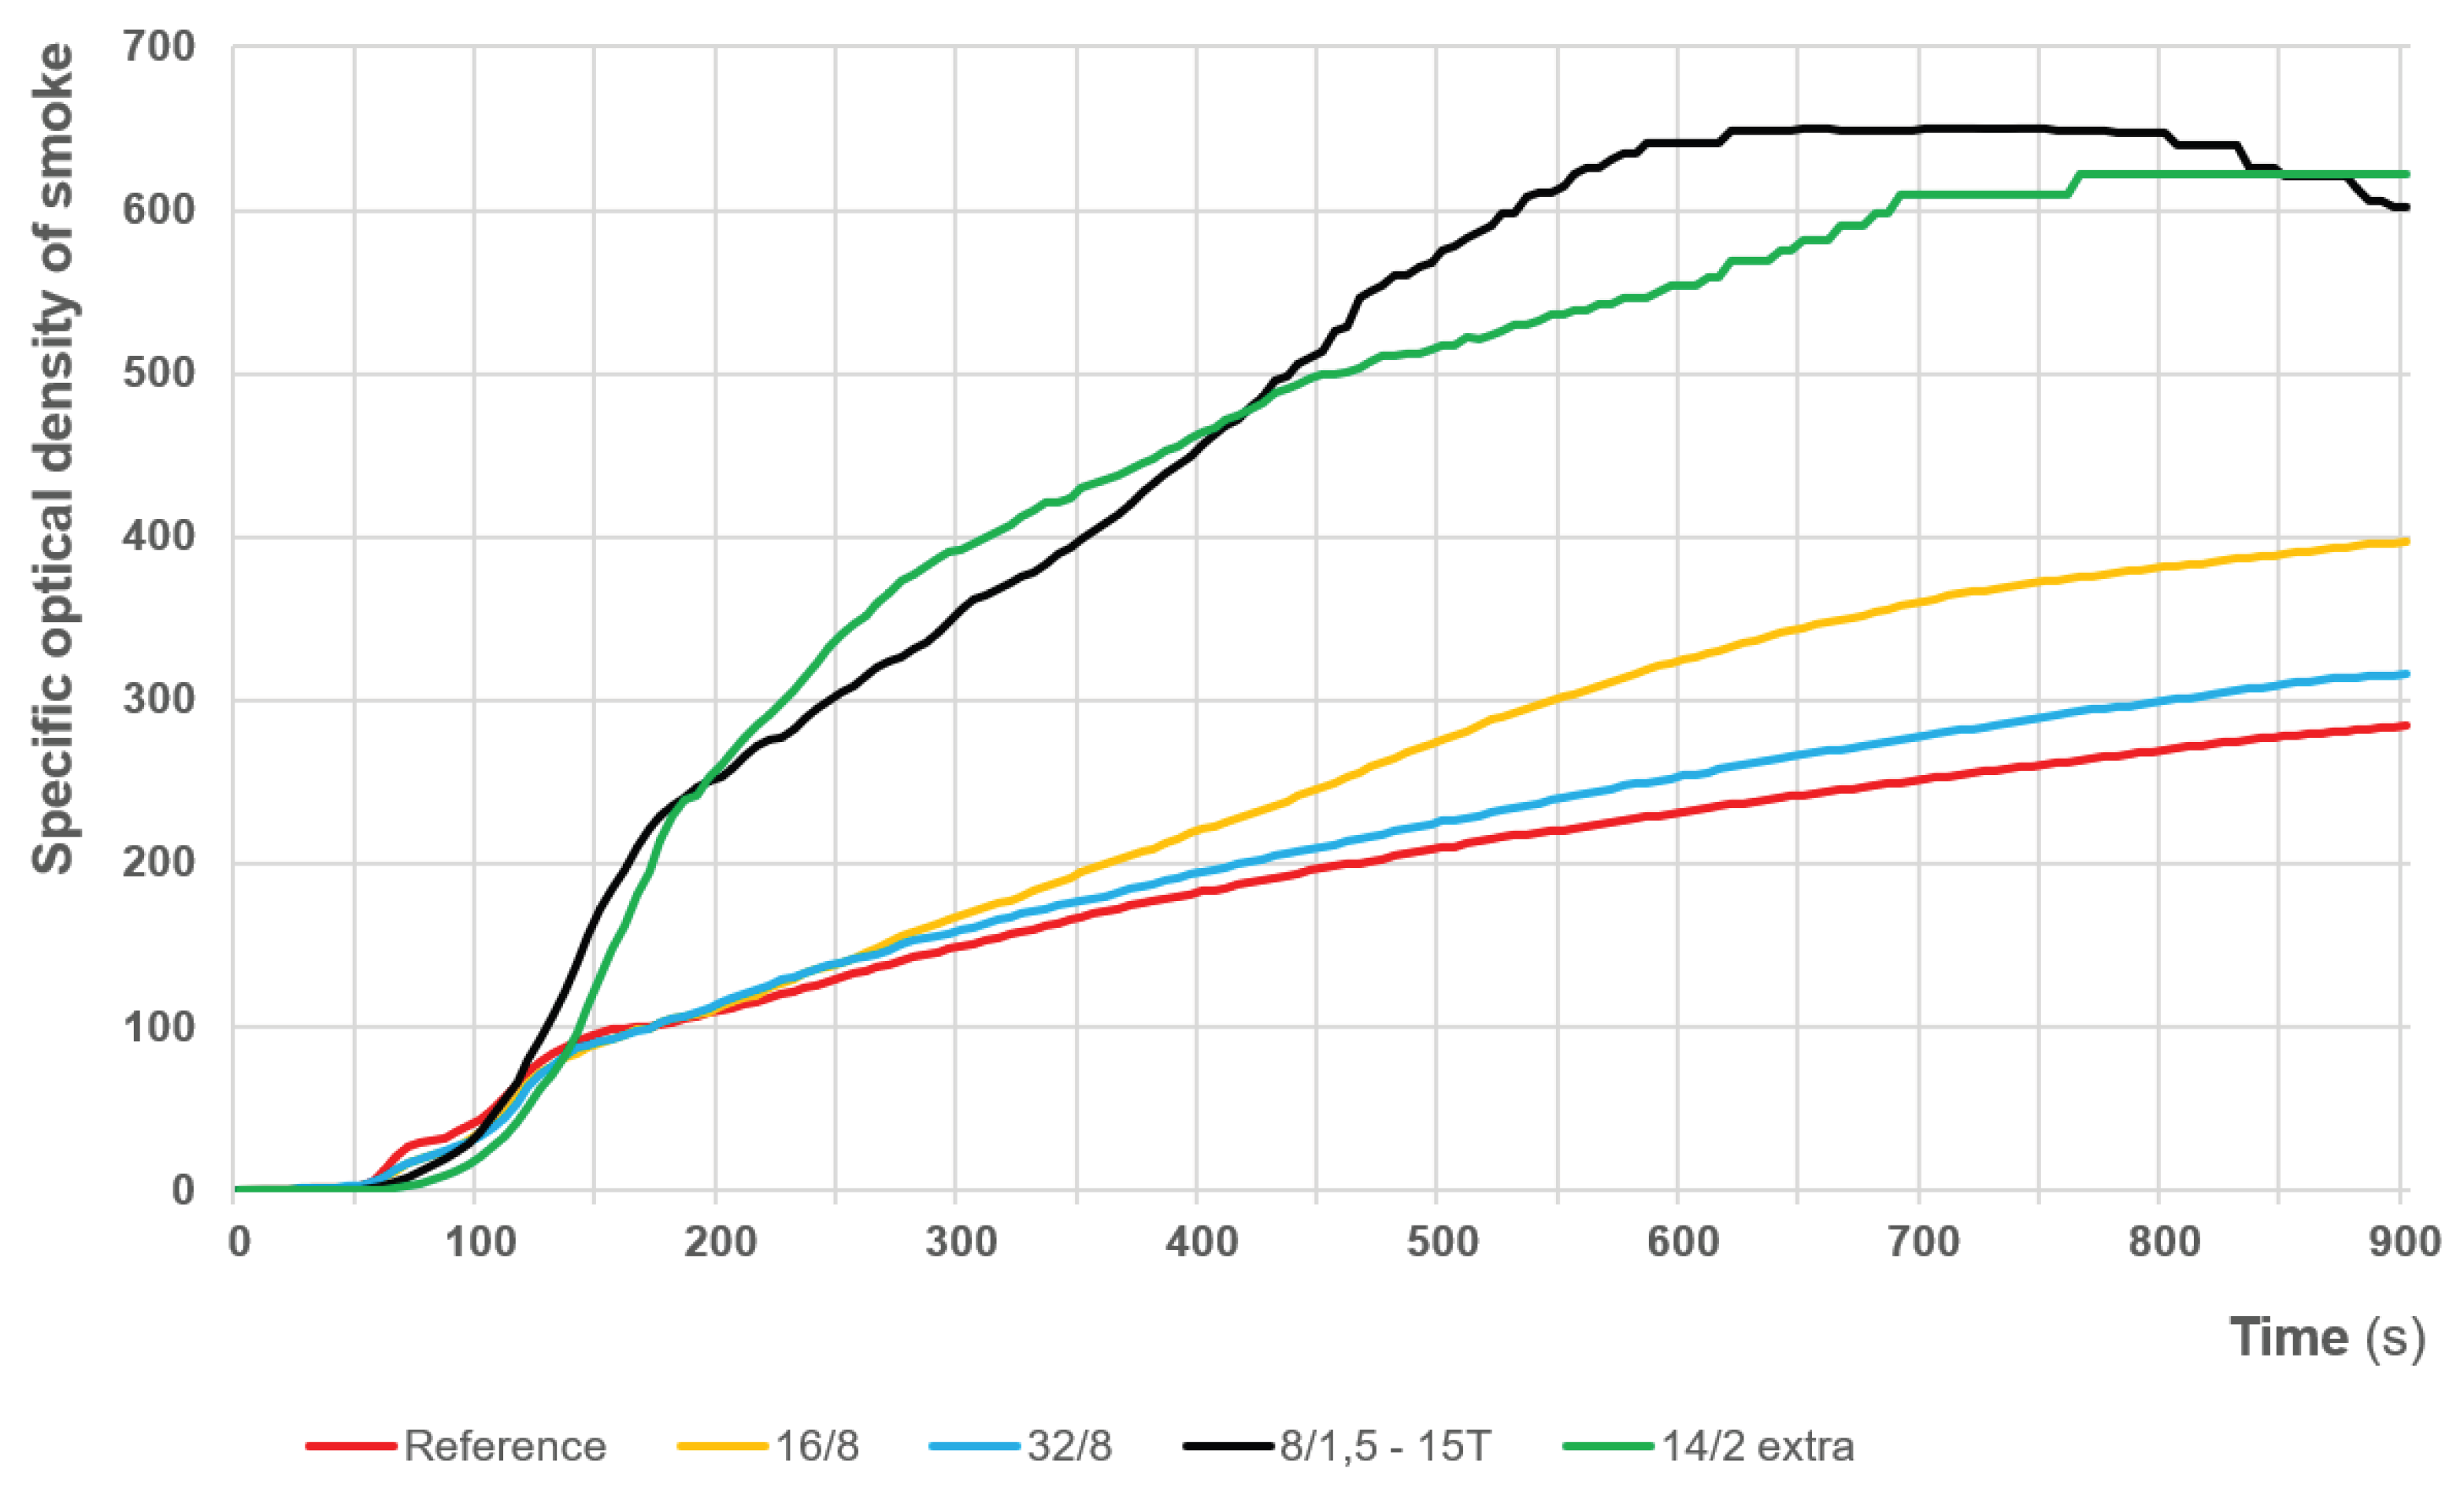
Table 1.
Sample surface area comparison.
| Acoustic surface treatment |
No. of holes/ grooves per sample |
Sample surface [cm2] | Flat surface [cm2] |
Hollow surface [cm2] |
Difference [%] |
Flat surface after 5 mm burning [cm2] |
Hollow surface after 5 mm burning [cm2] |
Difference after 5 mm burning [%] |
|---|---|---|---|---|---|---|---|---|
| Reference | 0 | 100.00 | 100.00 | 0.00 | 0.00 | 100.00 | 0.00 | 0.00 |
| 16/8 mm | 36 | 100.00 | 81.91 | 18.09 | 22.08 | 81.91 | 18.09 | 22.08 |
| 32/8 mm | 9 | 100.00 | 95.48 | 4.52 | 4.74 | 95.48 | 4.52 | 4.74 |
| 8/1.5 – 15T | 144 | 100.00 | 89.83 | 10.17 | 11.33 | 36.42 | 63.58 | 174.61 |
| 14/2 extra | 18/6 | 100.00 | 88.00 | 12.00 | 13.64 | 88.55 | 11.45 | 12.92 |
Table 5.
Specific optical density of smoke values for various acoustic panels.
| Solid wood panels | |||||
| Time | reference | 16/8 | 32/8 | 8/1.5 – 15T | 14/2 extra |
| 4 min | 148.6 | 201.6 | 163.9 | 200.1 | 150.2 |
| 10 min | 420.5 | 488.3 | 405.3 | 563.0 | 431.2 |
| Max | 450.3 | 636.2 | 447.7 | 624.5 | 496.1 |
| Plywood | |||||
| reference | 16/8 | 32/8 | 8/1.5 – 15T | 14/2 extra | |
| 4 min | 128.8 | 232.3 | 164.6 | 247.9 | 216.7 |
| 10 min | 325.7 | 526.5 | 392.9 | 557.4 | 537.3 |
| Max | 375.9 | 651.8 | 485.6 | 680.8 | 641.3 |
| MDF | |||||
| reference | 16/8 | 32/8 | 8/1.5 – 15T | 14/2 extra | |
| 4 min | 162.1 | 135.2 | 135.4 | 295.0 | 322.6 |
| 10 min | 231.9 | 325.7 | 253.9 | 641.4 | 554.3 |
| Max | 284.5 | 396.8 | 316.1 | 650.2 | 621.7 |
Disclaimer/Publisher’s Note: The statements, opinions and data contained in all publications are solely those of the individual author(s) and contributor(s) and not of MDPI and/or the editor(s). MDPI and/or the editor(s) disclaim responsibility for any injury to people or property resulting from any ideas, methods, instructions or products referred to in the content. |
© 2026 by the authors. Licensee MDPI, Basel, Switzerland. This article is an open access article distributed under the terms and conditions of the Creative Commons Attribution (CC BY) license (http://creativecommons.org/licenses/by/4.0/).
Copyright: This open access article is published under a Creative Commons CC BY 4.0 license, which permit the free download, distribution, and reuse, provided that the author and preprint are cited in any reuse.


