
Submitted:
12 January 2026
Posted:
13 January 2026
You are already at the latest version
Abstract
This study examined the relationship between perceptions of financial health indica-tors, lived experiences, and actions taken to address economic crises, while also ex-ploring potential gender differences. A non-experimental, quantitative, cross-sectional design was applied to a sample of 499 working professionals who had graduated from universities in Veracruz and were employed in either the public or private sector. A 24-item Likert-scale instrument was used to assess financial health perceptions, per-sonal experiences, and crisis-related actions. Reliability was confirmed with Cronbach’s alpha and McDonald’s omega values above 0.7. Data were analyzed using Exploratory Factor Analysis with Varimax rotation, Structural Equation Modeling, and Bayesian analysis to assess gender differences. A four-factor structure explained 64.86% of the variance. Moderate correlation was observed between financial wellbe-ing and resilience (r = 0.32), a weaker correlation between wellbeing and experiences (r = 0.18), and a strong correlation between experiences and actions in crises (r = 0.47). No significant gender differences were found. Findings highlight strategies for man-aging financial crises, maintaining credit health, and improving resilience, proposing a refined three-factor model linking experiences and actions to financial outcomes.
Keywords:
financial wellbeing
; financial resilience
; gender differences
1. Introduction
The concept of financial wellbeing and resilience may seem straightforward at first glance, but it involves a series of fundamental preliminary steps. Reflecting on these concepts helps us understand the reality that precedes the study of this pair of concepts. Financial knowledge is an essential foundation that must be prevalent among individuals and serves as the basis for financial literacy and financial education. Financial literacy is grounded in financial knowledge and focuses on its practical application. Just as a person must first learn letters and how they combine to form words and sentences before being able to read and write, financial literacy requires a solid foundation of knowledge about the subject. This knowledge is acquired through reading, listening, and observing and is then extended to a deeper and more specialized learning of advanced financial topics. To develop aspects such as literacy, education, behavior, and financial wellbeing, it is crucial to have a solid base of knowledge on the subject. This foundation contributes to more effective financial management and prepares individuals to face any adverse situations related to money. Herein lies the importance of financial resilience.
Theoretically, it has been argued that financial literacy refers to knowledge in financial matters, which is essential for developing financial skills. Collins and O’Rourke (2010) conducted a study evaluating whether mandatory financial education leads to improvements in financial behavior and outcomes among low-income families. Their results indicated that financial education led to improvements in financial behavior, highlighting the perception that participants believed they were managing their finances better. Similarly, Goso et al. (2022) assessed financial literacy in married couples, specifically focusing on financial knowledge and skills, and found that these concepts play an important role in decision-making for better money distribution and consumption. This reflection on financial literacy and education underscores that both concepts translate into financial knowledge. Decades ago, Lusardi and Mitchell (2007) analyzed the Rand American Life Panel data to examine financial literacy and retirement planning. They suggested that financial knowledge allows for a more precise evaluation of financial literacy than was previously possible.
Financial knowledge provides a solid understanding of aspects such as skills, wellbeing, behavior, and financial resilience. This knowledge enables individuals to use financial services more effectively, thus promoting financial inclusion. Frequent use of these services contributes to refining skills for managing specific financial products, and optimizing money management. With this foundation, it is logical to think that individuals are better prepared to face economic and financial adversities. In an increasingly complex and globalized economic environment, understanding and managing financial resources has become an indispensable skill for individuals and organizations. The concepts of financial knowledge, financial education, financial literacy, financial skills, financial wellbeing, and financial resilience, though interrelated, cover different aspects of money management and the ability to overcome economic difficulties. Lusardi and Mitchell (2011) analyze how financial knowledge impacts decision-making and the ability to face economic challenges, emphasizing the importance of financial education in financial wellbeing and resilience.
We can establish a chronological sequence regarding these topics: financial knowledge provides the theoretical information necessary for money management; financial skills develop from this knowledge; practical application of this knowledge supports informed and effective financial decisions; and as a result, financial wellbeing is achieved, reflecting a state of economic stability and satisfaction with financial circumstances. Finally, financial resilience, built on financial knowledge and skills, enables individuals to adapt to and recover from economic adversities, ensuring long-term financial stability. Therefore, this work is oriented towards exploring the relationship between financial wellbeing and financial resilience from a perspective based on lived experiences and gender differences. The following section presents a theoretical analysis of the relevant literature.
1.1. Financial Literacy and Financial Education
To understand the connection between financial wellbeing and financial resilience, it is first essential to examine how financial knowledge develops, beginning with financial literacy and financial education concepts. Financial literacy refers to the ability to interpret and use financial information to make informed decisions. According to Lusardi and Mitchell (2014), this skill is fundamental for making well-informed financial choices and managing personal resources efficiently. Financial literacy has been established as a key factor in financial wellbeing, as it enables individuals to make informed financial decisions, manage their resources effectively, and plan for future needs. It includes knowledge about budgeting, saving, investing, and understanding financial products, all contributing to improved financial wellbeing.
On the other hand, financial education is the educational process that provides individuals with the knowledge and skills necessary to manage their finances effectively. Hilgert, Hogarth and Beverly (2003) highlight that financial education can significantly enhance individuals’ ability to make sound financial decisions. Finally, financial knowledge refers to a detailed understanding of financial concepts such as interest rates, investments, and financial planning. Lusardi and Tufano (2015) explain that this knowledge is a fundamental basis for financial literacy and is essential for effective decision-making. These three aspects are interconnected and contribute to healthy financial management and sound financial decision-making.
1.2. Connection with Financial Knowledge
Based on the previously mentioned arguments, we can assert that financial literacy and financial education provide individuals with the necessary knowledge to manage their finances effectively. In this regard, Lusardi and Mitchell (2014) highlight that financial literacy is crucial for making well-informed decisions and developing financial skills, which translates into better management of personal finances. The ability to handle financial concepts such as interest rates, saving, and investing allows individuals to optimize their money management, contributing to greater financial wellbeing.
According to Lusardi and Tufano (2015), financial knowledge is fundamental for effective decision-making and sound financial management. Thus, financial wellbeing and financial resilience are interconnected: the ability to manage finances effectively (financial wellbeing) contributes to a greater capacity to face economic adversities (financial resilience). Therefore, financial knowledge is essential for both, as it provides the necessary tools for proper resource management and adapting to economic changes and challenges (Lusardi &Tufano, 2015). Financial knowledge refers to the acquired ability to make informed decisions about money management, covering aspects such as saving, investing, and credit management (Huston, 2010). Also, Gitman and Zutter (2007) emphasize its crucial role in strategic financial decision-making, both personally and professionally. This knowledge is fundamental for evaluating investments, managing assets and liabilities, and planning for long-term economic stability.
Despite the importance of financial knowledge, studies such as those by Kiviat and Morduch (2012) show that theoretical knowledge does not always translate into effective practical application. Xu and Zia (2012) expand this perspective by highlighting that financial knowledge must include practical skills, such as payment calculation and financial planning. The gap between knowledge and its practical application is evident in the observed deficiencies in financial skills among various populations (Chen & Volpe, 1998; Lusardi, 2011). This suggests that financial education should go beyond mere information acquisition, focusing also on the ability to apply this knowledge in real situations. The success of applying financial knowledge can be affected by individual factors such as impulsivity and lack of access to financial services (Huston, 2010; Johnson and Sherraden, 2007). These factors highlight the need for comprehensive financial education that imparts knowledge and addresses practical barriers to its application. Thus, it is important to consider financial skill as the ability to apply financial knowledge in practice to make effective decisions about money management, including saving, investing, and credit management (Torres, 2005; Zait & Bertea, 2015). Therefore, utilizing acquired financial knowledge to manage financial resources effectively allows for the practical implementation of actions based on theoretical knowledge. Practical financial skills, such as budgeting and investment planning, are essential for translating knowledge into effective financial behaviors (Krueger, 1986; Goldberg and Lewis, 1978).
Financial skill is not limited to technical knowledge; it is also influenced by emotional and psychological factors, such as the ability to act effectively in practice (Krueger, 1986; Goldberg and Lewis, 1978). The development of financial skills is essential to avoid economic problems such as over-indebtedness and to plan for future financial needs appropriately (Chinen and Endo, 2012; Lusardi, 2011). Financial education must provide practical skills that enable individuals to make informed financial decisions and manage their resources efficiently. Similarly, financial skill allows individuals to interact with financial institutions and utilize financial products and services, which is fundamental for effective personal financial management (Kaye et al., 2014). This underscores the importance of educating about financial concepts and developing practical skills that facilitate interaction with the financial system.
1.3. Financial Wellbeing and Difference by Gender
Early conceptualizations of financial wellbeing primarily focused on economic stability and security. Traditional economic theories linked financial wellbeing with the absence of stress or economic instability, and classical models, such as Milton Friedman’s (1957) Permanent Income Hypothesis, emphasized the importance of stable income and savings for achieving long-term financial security. According to Friedman, individuals make consumption decisions based on a long-term average income rather than fluctuating incomes, suggesting that income stability is essential for financial wellbeing.
In recent decades, the concept of financial wellbeing has expanded to include financial stability and resilience. This shift reflects a deeper understanding of the need to adapt to economic shocks and changes. Research by Tahir, Shahid, and Richards (2022) highlights that financial resilience is crucial for maintaining wellbeing during economic uncertainty. The emergence of digital financial tools has significantly impacted financial wellbeing. Yadav and Shaikh (2023) analyze how the use of budgeting apps, financial planning software, and online investment platforms has enhanced financial resilience by providing greater control over personal finances and facilitating better resource management. Financial wellbeing is also closely linked to financial inclusion and equity. Kass-Hanna et al. (2021) argue that financial and digital literacy is crucial for promoting financial inclusion and improving resilience. Inclusive financial education and access to digital tools can reduce economic disparities and enhance the wellbeing of disadvantaged populations. Erdem and Rojahn (2022) emphasize the importance of public policies in improving financial resilience, while Ahrens and Ferry (2020) examine how government responses to financial crises, such as the COVID-19 pandemic, affect financial wellbeing, highlighting the need for robust policies to support individuals during times of crisis.
Financial wellbeing is a complex concept that encompasses effective daily financial management, future planning, and the ability to face unexpected economic challenges. This study explores the evolution of the concept of financial wellbeing from early theories focused on economic stability to current models emphasizing resilience and adaptability. Proper application of financial knowledge contributes to wellbeing, as effective money management improves economic stability and reduces stress (Brüggen et al., 2017; Netemeyer et al., 2018). Recent research indicates that financial wellbeing does not solely depend on high income but also on subjective perceptions of the economic situation and the ability to manage financial stress (Brüggen et al., 2017; Netemeyer et al., 2018). Financial inclusion is key to making informed decisions and improving financial wellbeing, especially in the context of economic crises and unexpected events such as the COVID-19 pandemic (Yao & Zhang, 2023).
About differences by gender, due to the traditional role in managing family finances, men have demonstrated better financial competencies (Agarwalla et al., 2015). Therefore, Bannier and Schwarz (2016) and Kiliyanni and Sivaraman (2016) propose increasing financial training programs for women, which would help improve their risk tolerance and reduce the existing gaps between genders. Swiecka Yesildag, Özen, and Grima (2020) also show that men perform better in financial skills. Additionally, Vanegas, Arango, Gómez-Betancur, and Cortés-Cardona (2020) reported low financial indicators, emphasising women more. Conversely, regarding participation in stock markets, significant differences have been found between women and men, with women showing lower participation. However, Almenberg and Dreber (2015) point out that increasing financial literacy levels could help reduce the existing gender gap.
1.4. From Resilience to Financial Resilience
Resilience, defined as the capacity to adapt and recover from adversity, has been studied from various perspectives. This work explores the evolution of the concept, from its early formulations to its applications in the financial domain, highlighting the contributions of key researchers. Research on resilience began in the 1970s with Michael Rutter, who demonstrated that childhood adversities do not necessarily lead to negative developmental outcomes in adulthood (Rutter, 1970, 1984b). The work of Werner and Smith (1982), Werner and Smith (1992) and Werner (1989) expanded this perspective by showing that some children thrive despite adversities, emphasizing the adaptive capacity present in many individuals. In the 1980s, Garmezy, Masten and Tellegen (1984) enriched the concept by highlighting the importance of adaptive systems and plasticity in resilience.
Garmezy (1985, 1987) also explored resilience in clinical contexts, such as schizophrenia and childhood psychopathology. The 1990s saw a focus on resilience in the face of poverty. Garmezy (1991a, 1991b) demonstrated that resilience helps individuals cope with economic adversities, while Benard (1991) highlighted the role of educational institutions in the development of at-risk youth. From a socio-ecological perspective, Holling (1996) and Gunderson (2000) introduced the idea that resilience facilitates adaptation to changes and disturbances in complex systems. On the other hand, Gunderson and Holling (2002) expanded this view to include the capacity of socio-ecological systems to adapt and reorganize.
In the financial context, financial resilience has gained significance: Tahir, Shahid and Richards (2021) and Tahir, Ahmed and Richard (2021) linked financial resilience to economic wellbeing, while Bialowolski, Cwynar and Weziak-Bialowolska (2022) highlighted the role of financial education. Kulshreshtha et al. (2023) defined financial resilience as a strategy for managing unexpected expenses. Recent studies, such as those by Yadav and Shaikh (2023) and Yao and Zhang (2023), have shown that using digital financial services and creating financial resilience indices can enhance household economic capacity. Kass-Hanna et al. (2022) also emphasized how digital and financial literacy promotes resilience. Additionally, Setterfield and Kim (2024) studied the Financial Instability Hypothesis (FIH) in the domestic sphere, adapting the three financial stances associated with FIH (coverage, speculative, and Ponzi ) to the household context through a simple model of household debt and financing. In their study, Setterfield and Kim (2024) connect with comparative political economy research on credit systems, social welfare, and types of capitalism, describing how welfare systems and financial regimes influence household borrowing behavior and financial vulnerability.
In an analysis of financial resilience in African countries, Okumu, Ansong, Koomson and Chen (2024) identified two profiles: 41% were financially resilient, and 59% were not. These profiles predicted the duration of social control policies in different countries. The study highlights the variability of financial resilience and the need for social protection programs to address and recover from the damage caused by the pandemic. Similarly, the study by Yang et al. (2024) focused on an analysis involving 276 Chinese cities between 2011 and 2021, resulting in the construction of an Urban Economic Resilience Index. This index shows that digital finance significantly enhances economic resilience by strengthening the capacity for resistance, adaptation, adjustment, innovation, and transformation. The analysis reveals that digital finance also drives innovation, industrial upgrading, and financial efficiency, with a more pronounced impact in western regions and areas with less network coverage, offering new perspectives on the role of digital finance in economic resilience. Based on the arguments previously presented, which allow us to understand the different financial concepts involved in the study, we gain insight into how financial wellbeing is achieved. Furthermore, this knowledge allows individuals to face adversities in the economic and financial context within their personal finance management. Therefore, it is relevant to question the following:
Research Questions
- Does the perception of financial health indicators, as well lived experiences and actions to address crises, conform an underlying structure that explains financial wellbeing?
- Is there a relationship between financial wellbeing and financial resilience?
- Is there are difference by gender in relation to financial health indicators.
Null Hypotheses:
H01:
There is no underlying structure that explains health indicators, as well lived experiences and actions to address crises conform to an underlying structure that explains financial wellbeing.
HO2:
There is no relationship between financial wellbeing and financial resilience.
H03:
There is no relationship between the perceptions toward financial health indicators with to actions to address economic crises.
H04:
There is no relationship between lived experiences relation to financial health indicators with the actions to face economic crises.
H05:
There is no difference by gender in relation to financial health indicators.
Alternative Hypotheses: All the HA establish the opposite of each HO, indicating that there is a relationship and that there is an underlying structure of factors that explains financial wellbeing and difference by gender among variables under study.
2. Materials and Methods
Using a non-experimental, quantitative, and cross-sectional design, the database was analyzed to determine whether perceptions of financial health indicators, personal experiences, and crisis management actions align with an underlying structure that explains financial wellbeing. Additionally, the study aimed to evaluate the relationship between financial wellbeing and financial resilience.
2.1. Participants
A non-probabilistic self-selection sampling method was used to collect data. The questionnaire was administered within the Veracruz context. 499 working professionals who had graduated from universities in Veracruz and were employed in either the public or private sector participated, with 56.9% (n=284) identifying as male and 41.5% (n=207) as female. Of the participants, 42.5% (n=212) were enrolled in public institutions and 49.6% (n=246) in private institutions, all of whom were university students. Participants’ ages were as follows: 55.5% (n=277) were between 18 and 20 years old, 26.5% (n=132) were between 21 and 25 years old, and 13.4% (n=67) were between 26 and 30 years old. Regarding marital status, the majority were single (75.4%, n=376), 11.6% (n=58) were married, and 12.6% (n=63) were in a common-law relationship.
2.2. Ethics
This study was approved by the Ethics Committee of the Business School at the XXXXXXXXXXXXXXX University (Project ID P-11/2024). The research adhered to the principles established in the Declaration of Helsinki. The study’s objectives and procedures were explained to participants during the administration of the questionnaire, ensuring their full confidentiality and anonymity. Informed consent was obtained from all participants after they had read and understood the provided instructions and statements.
2.3. Instrument
The instrument used is the test developed by Flores, Zamora-Lobato and García-Santillán (2024), which includes indicators of participants’ sociodemographic profiles and features 24 items on a 5-point Likert scale. This questionnaire has three sections: 8 items gauge perceptions of financial health indicators, 8 assess lived experiences related to these indicators, and 8 evaluate actions taken to address adverse economic and financial situations in relation to the financial health indicators. The eight items measuring perceptions of financial health indicators are based on the BBVA (2020) proposal and the Center for Financial Services Innovation (CFSI).
2.4. Procedure
Reliability and internal consistency: The scale is validated using Cronbach’s alpha and McDonald’s Omega, with a criterion >.7 (acceptable) based on the following equations:
Unlike the alpha coefficient, the omega coefficient is based on the factor loadings, which are the weighted sum of standardized variables (Gerbing & Anderson, 1988). This coefficient provides more stable calculations (Timmerman, 2005) and a more accurate reliability and internal consistency assessment. Additionally, unlike the alpha coefficient, the number of items, as demonstrated by its mathematical formula (McDonald, 1999), does not affect the omega coefficient.
Multivariate normality: To assess the normality of the data, the criteria of skewness (< 2) and kurtosis (< 7) are applied, according to the following equation:
Where: a higher sum of ∑(xi–x)3 indicates greater skew.
In this process, Fisher’s skewness coefficient is used, and the guidelines suggested by Kim (2013) are followed as detailed in Table 1.
If the data matrix does not exhibit normality, it is advisable to use polychoric correlation matrices if skewness and kurtosis exceed the values suggested by Kim (2013), Muthén and Kaplan (1985), Richaud (2005), Ogasawara (2011), and Timmerman and Lorenzo-Seva (2011). Following this, Exploratory Factor Analysis (EFA) is performed to generate a theoretical model, which is then used to empirically test hypotheses (Gorsuch, 1983; Gerbing, 1996). EFA extracts factors based on the statistical criterion of eigenvalues greater than 1 and orthogonal Varimax rotation (Thurstone, 1931) to obtain the factorial solution that integrates the rotated factor matrix. Subsequently, the factorial solution is confirmed using SEM methodology (García-Santillán et al., 2024), where model fit, structural fit, and parsimony are validated (Ho, 2006; Schreiber, Stage, King, Nora and Barlow, 2006; Hooper et al., 2008; Hair et al., 1999). SPSS and AMOS v29 software are used for the analysis.
In addition, Bayesian analysis is used to test the hypotheses HO5. This involves estimating Bayesian parameters. When estimating parameters, prior beliefs are reflected in the prior distribution. These beliefs are then updated through the predictive updating factor, resulting in the posterior distribution.
Posterior = Predictive Updating Factor * Prior
The global representation is as follows:
Null Hypothesis: H0: μ = FHI
The level of financial health does not differ by participant gender.
Alternative Hypothesis: Ha: μ ≠ FHI
The level of financial health differs by participant gender.
To test the Bayesian hypothesis:
Posterior model odds = Bayes factor*prior model odds
:
Interpretation of the Bayes factor:
If BF > 1: The data favor the alternative hypothesis H1 over the null hypothesis H0.
If BF < 1: The data favor the null hypothesis H0 over the alternative hypothesis H1.
BF = 1: The data do not favor either hypothesis specifically, as the evidence is equal for both.
The Bayes factor provides a quantitative measure indicating the strength of evidence in favor of one hypothesis compared to another. This metric can be displayed in two distinct formats (as shown in Table 2). Regardless of the format, both provide a comparative analysis of the likelihoods between the two hypotheses based on the data.
3. Results
The data matrix shows acceptable reliability with a Cronbach’s alpha of 0.876 and a McDonald’s omega of 0.949 (individual item values are provided in the appendices). The Kaiser-Meyer-Olkin measure of sampling adequacy is 0.930, and Bartlett’s test of sphericity yields a Chi-square value of 7491.454 with 276 degrees of freedom and a p-value < 0.001. Table 3 and Table 3b, and 3c also present the correlation matrices, with the sampling adequacy measure MSA, and descriptive statistics including mean, standard deviation, skewness, and kurtosis.
Table 3.
Correlation Matrix, MSA and Descriptives – PFHI Factor.
| PX1 | PX2 | PX3 | PX4 | PX5 | PX6 | PX7 | PX8 | MSA | Mean | Standard deviation | skewness | kurtosis | |
| PX1 | 1.000 | .925a | 3.25 | 1.48 | -0.19 | -1.40 | |||||||
| PX2 | 0.684 | 1.000 | .914a | 3.57 | 1.50 | -0.57 | -1.24 | ||||||
| PX3 | 0.482 | 0.605 | 1.000 | .931a | 3.15 | 1.14 | -0.05 | -0.63 | |||||
| PX4 | 0.472 | 0.535 | 0.637 | 1.000 | .943a | 3.34 | 1.31 | -0.39 | -1.05 | ||||
| PX5 | 0.451 | 0.511 | 0.599 | 0.549 | 1.000 | .920a | 3.09 | 1.11 | -0.08 | -0.67 | |||
| PX6 | 0.652 | 0.708 | 0.626 | 0.606 | 0.604 | 1.000 | .926a | 3.61 | 1.36 | -0.56 | -1.03 | ||
| PX7 | 0.482 | 0.519 | 0.571 | 0.625 | 0.463 | 0.703 | 1.000 | .923a | 3.38 | 1.34 | -0.39 | -1.08 | |
| PX8 | 0.524 | 0.591 | 0.568 | 0.665 | 0.503 | 0.749 | 0.767 | 1.000 | .914a | 3.56 | 1.41 | -0.53 | -1.11 |
- Determinant= .0001.
Table 3.b. Correlation Matrix, MSA and Descriptives – LEFHI Factor (EX).
| EX1 | EX2 | EX3 | EX4 | EX5 | EX6 | EX7 | EX8 | MSA | Mean | Standard deviation | skewness | kurtosis | |
| EX1 | 1.000 | .935a | 3.17 | 1.22 | -0.25 | -0.97 | |||||||
| EX2 | 0.598 | 1.000 | .950a | 3.24 | 1.23 | -0.23 | -0.91 | ||||||
| EX3 | 0.357 | 0.378 | 1.000 | .803a | 2.77 | 1.00 | 0.04 | -0.33 | |||||
| EX4 | 0.307 | 0.308 | 0.634 | 1.000 | .853a | 2.84 | 1.00 | -0.02 | -0.40 | ||||
| EX5 | 0.417 | 0.427 | 0.396 | 0.327 | 1.000 | .928a | 2.90 | 1.12 | -0.05 | -0.73 | |||
| EX6 | 0.425 | 0.504 | 0.274 | 0.314 | 0.581 | 1.000 | .953a | 3.13 | 1.25 | -0.03 | -1.01 | ||
| EX7 | 0.085 | 0.199 | 0.351 | 0.264 | 0.171 | 0.148 | 1.000 | .782a | 2.86 | 1.16 | 0.09 | -0.64 | |
| EX8 | 0.297 | 0.353 | 0.153 | 0.158 | 0.277 | 0.365 | 0.322 | 1.000 | .919a | 3.18 | 1.19 | -0.18 | -0.93 |
Table 3.c. Correlation Matrix, MSA and Descriptives – AAFC factor (AX).
| AX1 | AX2 | AX3 | AX4 | AX5 | AX6 | AX7 | AX8 | MSA | Mean | Standard deviation | skewness | kurtosis | |
| AX1 | 1.000 | .964a | 3.21 | 1.13 | -0.04 | -0.83 | |||||||
| AX2 | 0.588 | 1.000 | .968a | 3.18 | 1.15 | -0.15 | -0.76 | ||||||
| AX3 | 0.558 | 0.572 | 1.000 | .949a | 3.02 | 1.06 | -0.07 | -0.39 | |||||
| AX4 | 0.551 | 0.566 | 0.665 | 1.000 | .950a | 3.07 | 1.10 | -0.15 | -0.67 | ||||
| AX5 | 0.604 | 0.590 | 0.649 | 0.702 | 1.000 | .950a | 3.12 | 1.07 | -0.22 | -0.59 | |||
| AX6 | 0.482 | 0.532 | 0.556 | 0.588 | 0.663 | 1.000 | .938a | 3.00 | 1.05 | -0.15 | -0.52 | ||
| AX7 | 0.430 | 0.453 | 0.596 | 0.565 | 0.590 | 0.661 | 1.000 | .927a | 2.96 | 0.99 | -0.08 | -0.36 | |
| AX8 | 0.518 | 0.522 | 0.587 | 0.584 | 0.656 | 0.599 | 0.589 | 1.000 | .948a | 3.07 | 1.04 | -0.09 | -0.42 |
The correlation matrices show that the results are acceptable, as evidenced by the determinant value close to zero. Additionally, the Measure of Sampling Adequacy (MSA) for each variable exceeds the suggested theoretical threshold (>0.5). However, the means show a concentration at the midpoint 3 (on a scale from 1 to 5) of the Likert scale, which leads to excess kurtosis and skewness, not aligning with the theoretical criteria suggested by Kim (2013). Therefore, in the absence of normality in the data, Lorenzo-Seva and Ferrando (2006) suggest using polychoric matrices. Other studies have proposed robust estimation techniques, such as using the robust minimum discrepancy estimator and data transformation, among other techniques (Gorsuch, 1983; Simmerman, 1985; Browne and Cudeck, 1993; Fabrigar, Wegener, MacCallum and Strahan, 1999; Preacher and MacCallum, 2002; Costello and Osborne, 2005). Given these considerations, the data matrix was evaluated based on eigenvalues greater than 1 and principal component extraction with Varimax orthogonal rotation, considering loadings greater than (>0.5). Table 4 shows the rotated component matrix and total variance, while Figure 2 displays the initial measurement model based on the obtained factor solution and the component plot in the rotated space.
Confirmatory analysis
The factorial solution obtained from the Exploratory Factor Analysis (Figure 1) is confirmed using SEM methodology. With the factorial solution, the research question regarding the existence of an underlying structure that explains the perception toward financial health indicators, as well lived experiences and actions to address financial crisis. To assess the validity of the model, its goodness of fit was analyzed using indices classified into three groups: absolute fit, incremental fit, and parsimony (Ho, 2006).
The model fit, structural fit, and parsimony results are presented below. First, Table 5 shows the values for the maximum likelihood ratio, CMIN/DF, RMR, GFI, and AGFI. Some authors, such as Carmines and McIver (1981), suggest that the ratio should be between 2.1 and 3.1 for the model to be considered acceptable. In contrast, Ullman (2001) and Paswan (2009) indicate that it should be less than 2 for a good fit. Kline (1998) suggests a value of 3, but Schumacker and Lomax (2004) have even accepted values up to 5 for the model to be considered a good fit. In this study, the value of 2.646 in the final adjusted model is considered acceptable. The goodness-of-fit indices GFI and AGFI exceed the acceptable threshold (>.9). Additionally, the root mean square residual (RMR) is close to zero (0.052), which is acceptable for this study. The parsimony goodness-of-fit index (PGFI) suggests that a higher value indicates greater parsimony, and the result (0.637) is considered acceptable.
Figure 3.
Measure model adjusted 2.
Figure 4.
Measure model adjusted 3.
Figure 5.
Measure model adjusted 4.
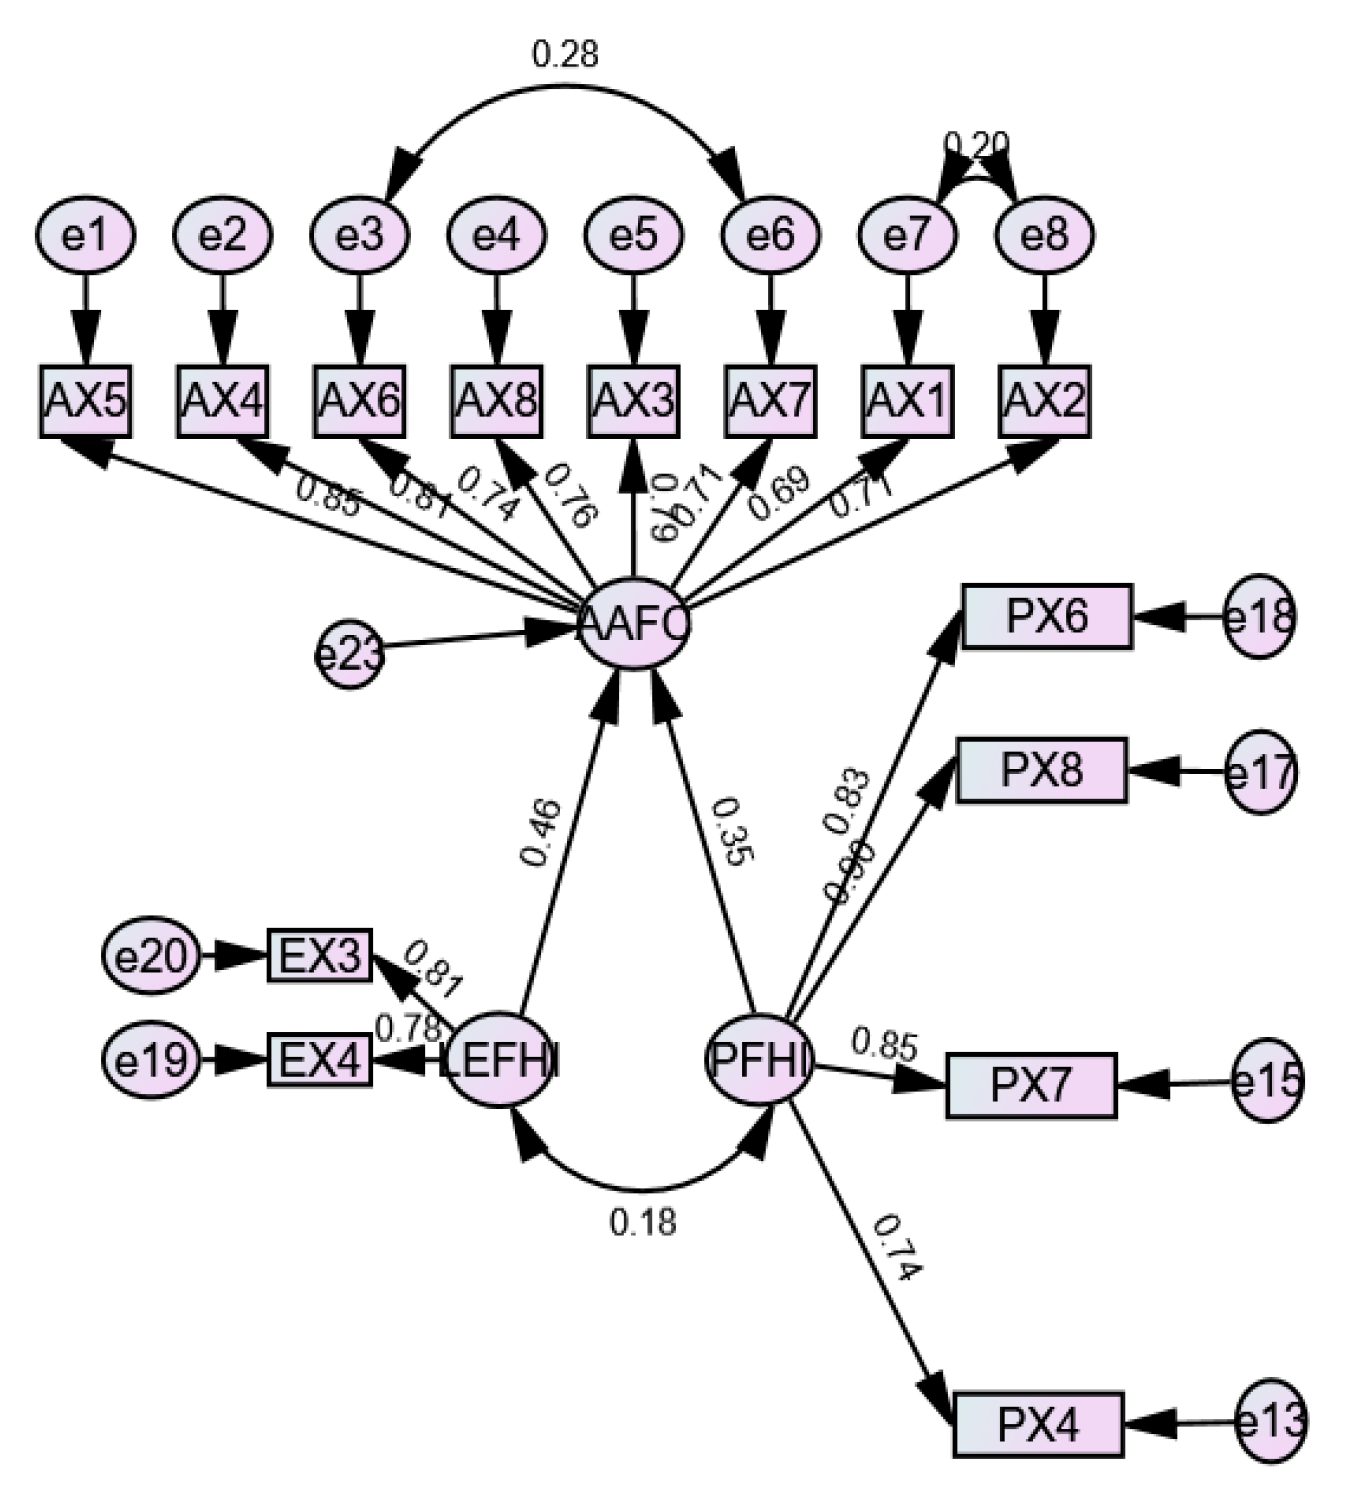
In Table 6, the Baseline comparison values for NFI, RFI, IFI, TLI and CFI are presented, as well as the Parsimony-Adjusted Measures PRATIO, PNFI and PCFI. The final adjusted model shown in Figure 6 yields a CFI value > .9, indicating a good model fit based on non-centrality, although it may be biased (Curran et al., 2002). Regarding the Incremental Fit Index (IFI), it should be equal to or greater than 0.90 to accept the model; in our case, it exceeds the threshold of > .9. Similarly, the Normed Fit Index (NFI) ranges from 0 to 1, with 1 representing a perfect fit; the model in Figure 6 exceeds this threshold (.958). The Relative Fit Index (RFI), known as rho1, should be close to 1; the study yields a value of .946, which is acceptable.
The Tucker-Lewis Index (TLI), also known as the Non-Normed Fit Index, is like the NFI but penalizes model complexity; a value close to 1 indicates a good fit. In our case, we obtain a TLI value of .966, which exceeds the threshold proposed by Hu and Bentler (1999), who suggest that TLI >= 0.95 to denote a good model fit. For the Parsimony-Adjusted Fit Index (PNFI), no commonly accepted value for an acceptable model is established; however, some studies suggest it should be greater than 0.50. In this study, we obtain a value of 0.749, which is acceptable.
It is worth noting that parsimony measures often present issues. According to Mulaik et al. (1989), absolute and incremental fit indices frequently perform better with simpler models compared to more complex ones. Consequently, fit analysis incorporates parsimony indices with degrees of freedom as a weighting factor. Mulaik et al. (1989) recommended a threshold of 0.05 for parsimony indices, which is quite low compared to other indices suggesting values greater than 0.9. Thus, it can be concluded that the parsimony measures comfortably exceed the recommended threshold (PRATIO: 0.782; PNFI: 0.749; PCFI: 0.761).
Table 7 shows the Root Mean Square Error of Approximation (RMSEA), which is a popular fit measure because it does not require comparison with a null model. This index is among the least affected by sample size. Fan, Thompson, and Wang (1999) note that if the sample is small, the RMSEA tends to overestimate the goodness of fit. Some authors, such as Schumacker and Lomax (2004), suggest that the RMSEA value should be ≤ 0.05, though values ≤ 0.08 are also considered acceptable. Hu and Bentler (1999) indicate that a value ≤ 0.06 is acceptable for denoting a good model fit. For this study, the obtained RMSEA value was 0.057, which aligns with the suggested criteria.
Finally, the Hoelter index is analyzed to assess whether the sample size was adequate. The Hoelter index is a statistical measure used to evaluate the robustness of results obtained in a factorial analysis, specifically in confirmatory factor analysis, to assess the stability of factor solutions based on sample size. For this study, two values were obtained: one at a significance level of 0.05 and another at 0.01, indicating that a sample of at least 248 to 277 participants is required. In our case, the sample consisted of 499 participants. The criterion is that if the sample size is greater than 277, it is considered adequate, while if it is below 248, it is considered insufficient to accept the model according to Chi-square.
Results of the Financial Wellbeing and Financial Resilience Model
The final model of financial wellbeing and financial resilience comprises three factors, described as follows: Factor 1: Actions to Address Financial Crises. This factor includes items AAFC, AAFC, AAFC, AAFC, AAFC, and AAFC. It evaluates whether a strategy has been established to manage and pay debts on time sustainably. It also considers whether measures have been taken to ensure sufficient savings or long-term assets. In cases of poor credit history, it should be reviewed if a plan has been implemented to improve the situation. If not, it is advisable to plan for immediate and short-term expenses. Additionally, whether a plan has been developed to increase savings in liquid financial products should be assessed. Finally, if adequate insurance is lacking or needs adjustment, a plan should be considered to address this. It should be noted that items AAFC and AAFC were not representative in the model. Factor 2: Perception of Financial Health Indicators. This factor is composed of items PFHI6, PFHI8, PFHI7, and PFHI4. It highlights the importance of maintaining a healthy credit history, planning future expenses, and having adequate insurance. It also emphasizes the need to have sufficient savings or long-term assets to ensure financial stability and handle unexpected events. Factor 3: Experiences Related to Financial Health Indicators. This factor includes items LEFHI3 and LEFH4, which indicate the importance of having sufficient savings in liquid financial products, and they have enough savings or long-term assets.
Finally, to evaluate hypothesis H05, which states that there is no difference by gender regarding financial health indicators, hypothesis H05 is examined using Bayesian inferential statistics, specifically through Bayesian ANOVA. Table 8 presents the comparison model.
The first column shows two possible models: an alternative model and a null model. The models are ordered by their predictive performance relative to the best model; this is indicated in the BF01 column, which displays the Bayes factor in relation to the best model that only includes the gender factor. The prior probability of the model P(M) is 0.5 for both models, and the resulting posterior model probabilities are given by P(M|data). The BFM column shows the change from prior to posterior probabilities for each model. The best model has gender as a predictor, and the change in probabilities is; (0.051 / (1 - 0.051)) * ((1 - 0.5) / 0.5) = 0.0537, which matches the result from Table 8.
The BF01 column shows the Bayes factors of the models compared to the best model. The Bayes factor for the null model versus the gender model can be obtained by dividing their Bayes factors against the best model: 0.054 / 1 = 0.054 in favor of the alternative hypothesis. Column 6 provides a percentage of error indicating the accuracy of the numerical approximations, which should not be too large. The Table 9 shows the averaged posterior distributions for each level using four statistics: posterior mean, posterior standard deviation, and the lower and upper limits of the 95% central confidence interval.
The relationship associated with the gender level corresponding to men is obtained by adding the posterior mean of the intercept to the posterior mean of the male attribute: 77.138 - (-6.020) results in 83.158. For the female attribute, the result is 79.254 and finally, for LGBT, it is 69.02.
These results show that the contributions from men and women are very similar; however, there is a slight difference in relation to the LGBT community (see Figure 3).
Figure 8.
Gender (level 1 male, level 2 female and level 3 LGBT+).
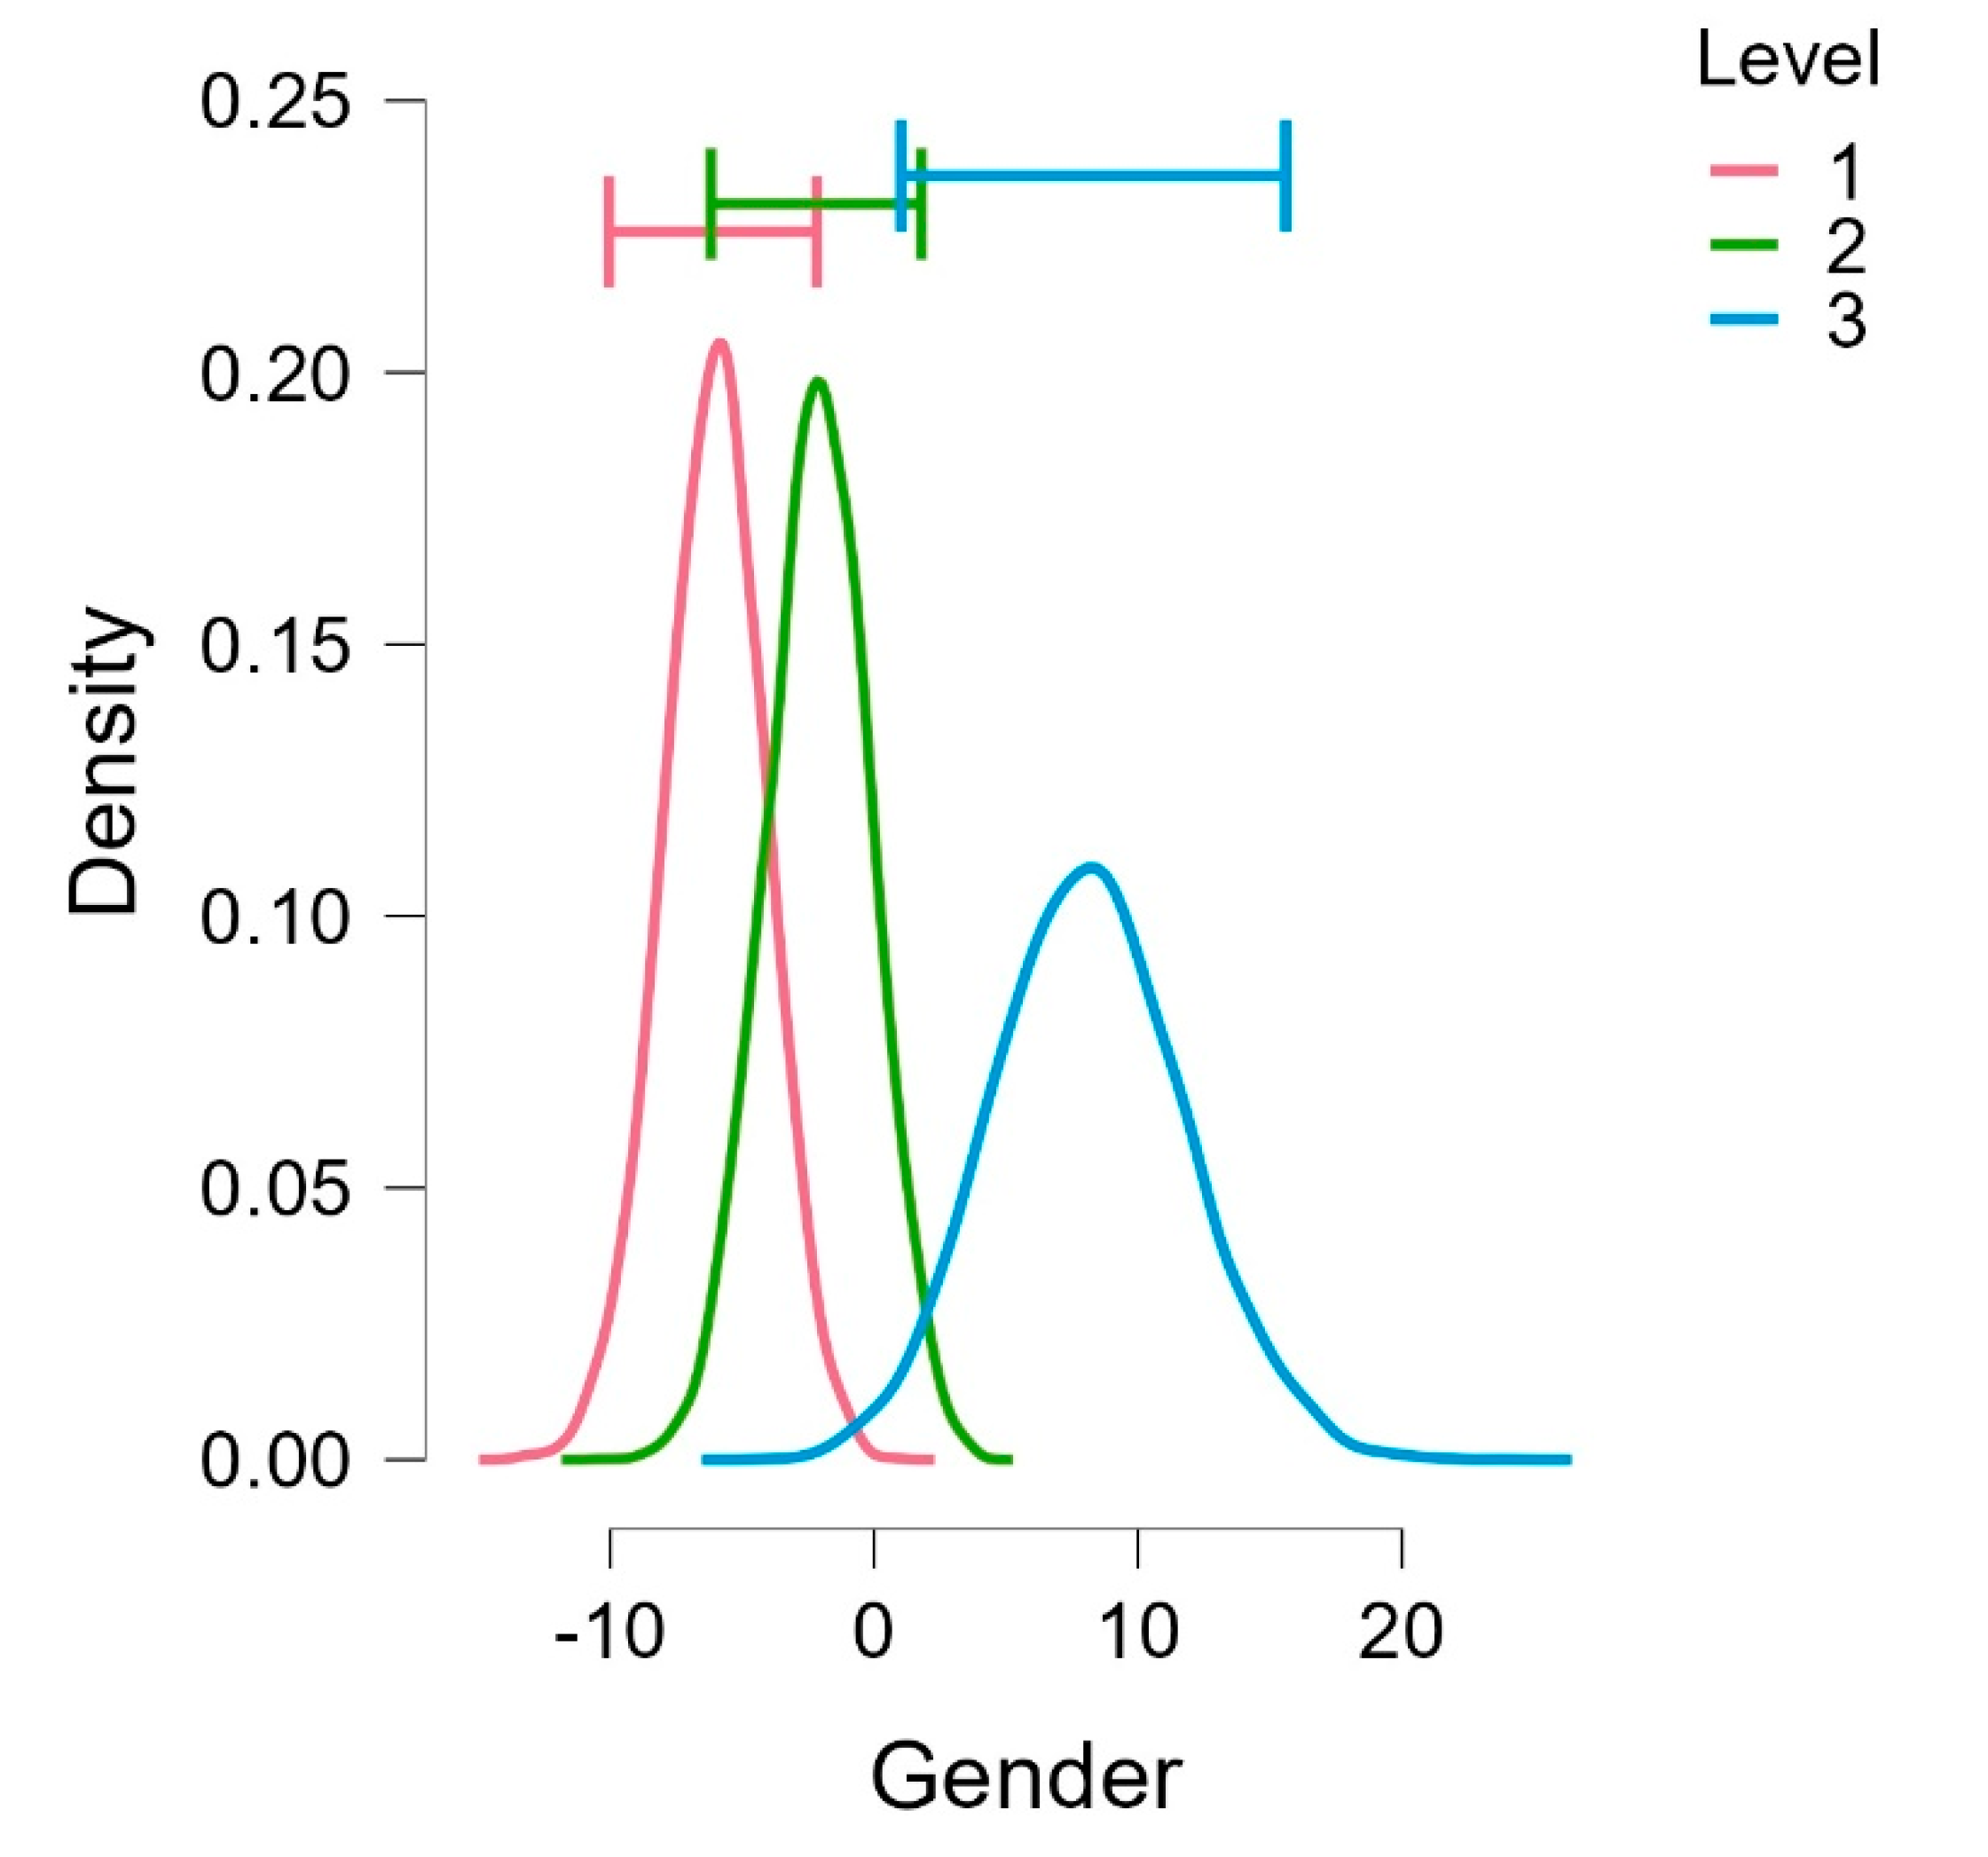
Figure 9 displays a rain cloud plot that includes raw data points and a half-violin to illustrate the probability density (the “cloud”). The plot also visualizes key summary statistics using a box plot, which shows the mean alongside a confidence interval. This analysis reveals that financial health varies very little with respect to gender.
4. Discussion
Exploratory analysis (see Table 4 and Figure 2) revealed a four-factor structure explaining 64.86% of the variance in the phenomenon studied, leading to the rejection of null hypothesis HO1. The Chi-square value of 7491.454 with 276 degrees of freedom and a p-value < 0.001 exceeds the maximum Chi-square value of 135.807 with 100 degrees of freedom and a p-value of 0.01. In confirming the initial model with Structural Equation Modeling (SEM) methodology, item EX7 was included in factor 4, as it was not viable to integrate it as a single item, resulting in an adjusted three-factor model (see Figure 7). This adjustment aligns with Lusardi and Mitchell’s (2014) emphasis on the need for precise models to evaluate financial literacy and wellbeing and conforms to Kiviat and Morduch (2012) and Xu and Zia’s (2012) suggestions about adapting models to data realities. For HO2, a moderate direct relationship (r = 0.32) was demonstrated between financial wellbeing indicators (PFHI) and financial resilience indicators (AAFC). HO3 showed a weaker relationship (r = 0.18) between financial wellbeing indicators (PFHI) and lived experiences related to these indicators (LEFHI). HO4 revealed a stronger relationship (r = 0.47) between lived experiences (LEFHI) and actions to address crises (AAFC).
In summary, the results indicate a moderate positive relationship (r = 0.32) between financial wellbeing and financial resilience for HO2. HO3 has a weak relationship (r = 0.18) between financial wellbeing and lived experiences, and HO4 has a strong relationship (r = 0.47) between lived experiences and actions to address crises. These findings are consistent with Lusardi and Mitchell’s (2011, 2014) work, which highlights that financial knowledge and literacy impact the ability to handle economic adversities. The results also align with Tahir, Shahid, and Richards (2022) and Yadav and Shaikh’s (2023) studies, which explore the impact of financial resilience on wellbeing during economic crises. In relation to HO5, there is no significant evidence to reject the null hypothesis, as the difference between men and women is minimal. This result is inconsistent with the findings of Agarwalla, Barua, Jacob, and Varma (2015), who report significant differences in financial competencies by gender. Similarly, Kiliyanni and Sivaraman (2016) identified notable gaps in risk tolerance between genders. Additionally, these findings do not align with the study by Swiecka Yesildag, Özen, and Grima (2020), which demonstrated that men possess greater financial skills compared to women.
5. Conclusion
Theoretical Contributions
This study presents an adjusted theoretical model of financial wellbeing and financial resilience consisting of three factors. The revision and adjustment from a four-factor to a three-factor model contribute to a more accurate understanding of how actions, perceptions, and experiences influence financial wellbeing and resilience. The model adjustment is a common practice in financial studies, and the changes made are in line with previous literature (Flóres et al., 2024). Differences in the number of factors proposed in the literature may reflect variations in studied populations and methodologies used. The moderate relationship between wellbeing and financial resilience aligns with expectations, according to Friedman (1957), Lusardi, and Mitchell’s work (2011, 2014). The relationships found between wellbeing and lived experiences, as well as between lived experiences and actions to address crises, also reflect common trends in financial resilience research.
Practical Contributions
The results of the final model emphasize the importance of defining strategies to address financial crises, maintaining a healthy credit history, and having sufficient savings. These findings provide practical recommendations for individuals seeking to improve their financial wellbeing and resilience. Identifying key factors such as debt planning, long-term saving, and adequate insurance can be useful for designing policies and financial education programs. The connection between lived experiences and actions to address crises highlights the importance of practical financial education. The identified strategies can be used to design interventions that enhance financial skills and individuals’ ability to manage challenging financial situations.
Study Limitations
A common limitation in empirical studies, particularly in developing countries, is the lack of financial resources. This shortage hinders the ability to reach broader population samples. Another limitation is the participants’ reluctance to engage with data collection instruments. Despite explaining the purpose of the requested information and providing access to the study results, some individuals choose not to participate.
Author Contributions
The author’s has made a substantial, direct and intellectual contribution to the work, and approved it for publication.
Funding
This research received no external funding.
Conflicts of Interest
The author’s declare no conflict of interest.
Appendix A
Financial Wellbeing Scale, Financial Skill Scale & Financial Resilience Scale
Consent Declaration
You have been invited to participate in a questionnaire targeting university students as part of the “Study on Financial Wellbeing, Resilience and Financial Education in Students,” conducted by researchers at the xxxxxxxxxxxxxx of xxxxxxxxxxxxxxxxx.
The aim of this research is to gather information to better understand the levels of financial wellbeing and financial resilience among students. Before proceeding, we request your consent to participate, having read and understood the following information:
Your participation in this questionnaire is entirely voluntary and without cost. There will be no advantages or disadvantages whether you choose to participate or not. Additionally, you are free to withdraw from the study at any time without any negative consequences.
The Declaration of Helsinki and all its amendments, and its modifications regarding the protection of personal data protect the confidentiality of your data. This ensures that your responses cannot be associated with your identity.
Should you have any questions or require further clarification, please contact the technical team of the institution conducting the study at the following email: ()[ ].
The information collected in this survey is confidential and will be used for research purposes. The data provided will remain confidential and anonymous.
Profile of respondents
1.- Gender:
( ) Male ( ) Female ( ) others
2.- Type of the University
Public ( ) Private ( )
3.- Age: ( ) 18 to 20; 21 to 25 ( ); 26 to 30 ( ); 30 to 40 ( ); > 40 ( )
4.- Civil status
( ) Single, ( ) Married, ) Free union, ( ) Separate, ( ) Divorced, ( ) Widowed
Financial resilience scale
(Dimensions of Financial Health indicator & Financial Resilience: Perception toward Financial Health Indicators (PFHI), Lived Experiences toward Financial Health Indicators (LEFHI) and Actions to Address Financial Crises (AAFC))
Part 1: perception toward financial health indicators
| Items |
| PFHI 1.- Do you think that you should spend less than what you earn? |
| PFHI 2.- Do invoice have to be paid on time and in full? |
| PFHI 3.- Is it convenient to have enough savings in liquid financial products? |
| PFHI 4.- Have enough savings or long-term assets? |
| PFHI 5.- Have a sustainable level of debt? |
| PFHI 6.- Have a healthy credit history? |
| PFHI 7.- Have adequate insurance? |
| PFHI 8.- Plan expenses for the future? |
Part 2: Lived experience towards financial health indicators
| Items |
| LEFHI 1.- Personally, have you experienced a situation where you spend less than you earn? |
| LEFHI 2.- If you had outstanding payments, did you pay the bills on time and in full? |
| LEFHI 3.- Do you have enough savings in liquid financial products? |
| LEFHI 4.- Do you have enough savings or long-term assets? |
| LEFHI 5.- Currently, do you have a sustainable level of debt? |
| LEFHI 6.- Today, do you have a healthy credit history? |
| LEFHI 7.- Do you currently have adequate insurance in force? |
| LEFHI 8.- In your personal life, do you plan the expenses that you will have in the immediate future and in the short term? |
Part 3: During or after the some adverse financial situation
| Items |
| AAFC 1.- Personally, did you take any actions to spend less than you earn? |
| AAFC 2.- In the event of having had pending payments, and not having paid on time: did you take any action to resolve the payment of your invoices on time and in full? |
| AAFC 3.- If so, did you implement any plan to increase your savings in liquid financial products? |
| AAFC 4.- Did you take any action to have enough savings or long-term assets? |
| AAFC 5.- Have you defined any strategy to maintain your debts in a sustainable manner and that you can pay when due? |
| AAFC 6.- If you did not have a healthy credit history, did you carry out any plan? |
| AAFC 7.- In case of not having adequate insurance, or having some, did you implement any plan to modify this scheme? |
| AAFC 8.- In case of not doing it in your personal life, did you implement a strategy to plan the expenses that you will have in the immediate future and in the short term? |
Appendix B

Table A1.
Items total statistics and Cronbach’s alpha.
| Average scale if the element has been suppressed |
Scale variance if the element has been suppressed |
Total item correlation corrected |
Cronbach’s alpha suppressed element |
|
| Gender | 156.0481 | 1248.869 | .175 | .876 |
| TypeUniv | 155.8377 | 1264.915 | -.216 | .879 |
| Age | 155.8136 | 1248.168 | .104 | .877 |
| Marital status | 156.1122 | 1262.754 | -.147 | .878 |
| PFHI1 | 154.2425 | 1196.646 | .555 | .871 |
| PFHI2 | 153.9279 | 1186.139 | .651 | .870 |
| PFHI3 | 154.3427 | 1208.198 | .585 | .872 |
| PFHI4 | 154.1503 | 1197.285 | .623 | .871 |
| PFHI5 | 154.4028 | 1214.546 | .516 | .873 |
| PFHI6 | 153.8838 | 1184.501 | .739 | .869 |
| PFHI7 | 154.1162 | 1193.645 | .650 | .870 |
| PFHI8 | 153.9359 | 1186.550 | .692 | .870 |
| LEFHI1 | 154.3267 | 1203.068 | .602 | .872 |
| LEFHI2 | 154.2545 | 1196.367 | .679 | .871 |
| LEFHI3 | 154.7255 | 1226.083 | .409 | .874 |
| LEFHI4 | 154.6573 | 1225.997 | .408 | .874 |
| LEFHI5 | 154.5972 | 1210.289 | .567 | .872 |
| LEFHI6 | 154.3667 | 1196.831 | .664 | .871 |
| LEFHI7 | 154.6373 | 1228.465 | .317 | .875 |
| LEFHI8 | 154.3166 | 1202.815 | .622 | .871 |
| AAFC 1 | 154.2886 | 1199.599 | .701 | .871 |
| AAFC 2 | 154.3126 | 1200.794 | .671 | .871 |
| AAFC 3 | 154.4790 | 1207.049 | .647 | .872 |
| AAFC 4 | 154.4269 | 1205.036 | .650 | .872 |
| AAFC 5 | 154.3747 | 1205.303 | .661 | .872 |
| AAFC 6 | 154.4950 | 1211.668 | .585 | .872 |
| AAFC 7 | 154.5311 | 1216.623 | .549 | .873 |
| AAFC 8 | 154.4248 | 1211.446 | .594 | .872 |
| PFHI | 130.5371 | 836.249 | .702 | .888 |
| LEFHI | 133.4168 | 924.874 | .817 | .860 |
| AAFC | 132.8677 | 905.107 | .740 | .869 |
Table A2.
Items total statistics and Cronbach’s alpha & McDonald’s omega.
| Average scale if the element has been suppressed |
Scale variance if the element has been suppressed |
Total item correlation corrected |
Cronbach’s alpha suppressed element |
McDonald Omega if suppresed element | |
| Gender | 156.0481 | 1248.869 | .175 | .876 | .949 |
| TypeUniv | 155.8377 | 1264.915 | -.216 | .879 | .935 |
| Ege | 155.8136 | 1248.168 | .104 | .877 | .951 |
| Marital status | 156.1122 | 1262.754 | -.147 | .878 | .938 |
| PFHI1 | 154.2425 | 1196.646 | .555 | .871 | .947 |
| PFHI2 | 153.9279 | 1186.139 | .651 | .870 | .946 |
| PFHI3 | 154.3427 | 1208.198 | .585 | .872 | .947 |
| PFHI4 | 154.1503 | 1197.285 | .623 | .871 | .946 |
| PFHI5 | 154.4028 | 1214.546 | .516 | .873 | .947 |
| PFHI6 | 153.8838 | 1184.501 | .739 | .869 | .945 |
| PFHI7 | 154.1162 | 1193.645 | .650 | .870 | .946 |
| PFHI8 | 153.9359 | 1186.550 | .692 | .870 | .945 |
| LEFHI1 | 154.3267 | 1203.068 | .602 | .872 | .947 |
| LEFHI2 | 154.2545 | 1196.367 | .679 | .871 | .946 |
| LEFHI3 | 154.7255 | 1226.083 | .409 | .874 | .949 |
| LEFHI4 | 154.6573 | 1225.997 | .408 | .874 | .949 |
| LEFHI5 | 154.5972 | 1210.289 | .567 | .872 | .948 |
| LEFHI6 | 154.3667 | 1196.831 | .664 | .871 | .947 |
| LEFHI7 | 154.6373 | 1228.465 | .317 | .875 | .948 |
| LEFHI8 | 154.3166 | 1202.815 | .622 | .871 | .946 |
| AAFC 1 | 154.2886 | 1199.599 | .701 | .871 | .946 |
| AAFC 2 | 154.3126 | 1200.794 | .671 | .871 | .947 |
| AAFC 3 | 154.4790 | 1207.049 | .647 | .872 | .947 |
| AAFC 4 | 154.4269 | 1205.036 | .650 | .872 | .947 |
| AAFC 5 | 154.3747 | 1205.303 | .661 | .872 | .947 |
| AAFC 6 | 154.4950 | 1211.668 | .585 | .872 | .948 |
| AAFC 7 | 154.5311 | 1216.623 | .549 | .873 | .948 |
| AAFC 8 | 154.4248 | 1211.446 | .594 | .872 | .948 |
| PFHI | 130.5371 | 836.249 | .702 | .888 | .970 |
| LEFHI | 133.4168 | 924.874 | .817 | .860 | .939 |
| AAFC | 132.8677 | 905.107 | .740 | .869 | .955 |
References
- Agarwalla, S., Barua, S., Jacob, J. and Varma, J. (2015). Financial literacy among working young in urban India. World Development, 67(2013), 101-109. [CrossRef]
- Ahrens, T., and Ferry, L. (2020). Financial resilience of English local government in the aftermath of COVID-19. Journal of Public Budgeting, Accounting & Financial Management, 32(5), 813-823. [CrossRef]
- Almenberg, J. and Dreber, A. (2015). Gender, stock market participation and financial literacy. Economics Letters, 137, 140-142. [CrossRef]
- Bannier, C. and Schwarz, M. (2016). Gender differences in financial risk taking: the role of financial literacy and risk tolerance. Economics Letters, 145, 130-135. [CrossRef]
- BBVA (2020). Salud financiera: ocho indicadores para medirla [Financial health: eight indicators to measure]. Retrieved of: https://www.bbva.com/es/salud-financiera/salud-financiera-ocho-indicadores-medirla/.
- Bernard, Β. (1991). Fostering Resiliency in Kids: Protective Factors in the Family, school, and Community. San Francisco, CA: WestEd Regional Educational Laboratory.
- Bialowolski, P., Cwynar, A. and Weziak-Bialowolska, D. (2022), “The role of financial literacy for financial resilience in middle-age and older adulthood”, International Journal of Bank Marketing, Vol. 40 No. 7, pp. 1718-1748. [CrossRef]
- Bialowolski, P., Cwynar, A. and Weziak-Bialowolska, D. (2022), “The role of financial literacy for financial resilience in middle-age and older adulthood”, International Journal of Bank Marketing, Vol. 40 No. 7, pp. 1718-1748. [CrossRef]
- Brown, T. A. (2015). Confirmatory factor analysis for applied research. Guilford Publications.
- Browne, M. W., and Cudeck, R. (1993). Alternative ways of assessing model fit. En K. A. Bollen & J. S. Long (Eds.), Testing structural equation models (pp. 136-162). Sage Publications. [CrossRef]
- Bruggen, E., Hogreve, J., Holmlund, M., Kabadayi, S. and Lofgren, M. (2017). “Financial wellbeing: a conceptualization and research agenda”, Journal of Business Research, Vol. 79, pp. 228-237. [CrossRef]
- Carmines, E. G. and J. P. McIver, 1981, Analyzing Models with Unobserved Variables: Analysis of Covariance Structures, pp. 65-115 in Social Measurement: Current Issues, edited by G.W. Bohmstedt and E.F. Borgatta. Beverly Hills: Sage.
- Chen, H., and Volpe, R. (1998). An analysis of Personal Financial Literacy Among College Students. Financial Services Review, 7(2), 107-128.
- Chinen, K., and Endo, H. (2012). Effects of attitude and background on personal financial ability: A student survey in the United States. International Journal of Management, 29(1), 33.
- Collins, J. Michael and O’Rourke, Collin, Financial Education and Counseling — Still Holding Promise (2010). Journal of Consumer Affairs, 44(3), 483-498., Available at SSRN: https://ssrn.com/abstract=1529422 or. [CrossRef]
- CONSUMER FINANCIAL PROTECTION BUREAU (2018). Measuring financial wellbeing: A guide to using the CFPB Financial Wellbeing Scale. Retrieved of: https://www.consumerfinance.gov/consumer-tools/financial-well-being/.
- CONSUMER FINANCIAL PROTECTION BUREAU (2018). Measuring financial skill: A guide to using the Bureau of Consumer Financial Protection’s Financial Skill Scale. Retrieved of: https://www.consumerfinance.gov/data-research/research-reports/measuring-financial-skill/.
- Costello, A. B., and Osborne, J. W. (2005) - Best Practices in Exploratory Factor Analysis: Four Recommendations for Getting the Most From Your Analysis. Practical Assessment, Research, and Evaluation, 10(1), 1-9.
- Costello, A. B., and Osborne, J. W. (2005b). Best practices for assessing the validity of instruments. Journal of Research in Education, 5(2), 391-406.
- Erdem, D. and Rojahn, J. (2022), “The influence of financial literacy on financial resilience – New evidence from Europe during the COVID-19 crisis”, Managerial Finance, Vol. 48 No. 9/10, pp. 1453-1471. [CrossRef]
- Fabrigar, L. R., Wegener, D. T., MacCallum, R. C., and Strahan, E. J. (1999). Evaluating the use of exploratory factor analysis in psychological research. Psychological Methods, 4(3), 272–299. [CrossRef]
- Fan, X., B. Thompson, and L. Wang, 1999, Effects of Sample Size, Estimation Method, and ModelSpecification on Structural Equation Modeling Fit Indexes, Structural Equation Modeling (6):56-83.
- Field, A. (2013). Discovering statistics using IBM SPSS statistics. Sage Publications.
- Flores, M., Zamora-Lobato, T. and García-Santillán, A. (2024). Three-dimensional model of financial resilience in workers: Structural equation modeling and Bayesian analysis. Economics and Sociology, 17(1), 69-88. [CrossRef]
- Floyd, F. J., and Widaman, K. F. (1995). Factor analysis in the development and refinement of clinical assessment instruments. Psychological Assessment, 7(3), 286–299. [CrossRef]
- Friedman, M. (1957). Una teoría de la función consumo. Madrid: Alianza.
- Garmezy N. (1991b). Resilience in children’s adaptation to negative life events and stressed environments. Pediatr Ann. 1991 Sep;20(9):459-60, 463-6. PMID: 1945543. [CrossRef]
- Garmezy, N. (1983). Stressors of childhood. In N. Garmezy & M. Rutter (Eds.), Stress, coping, and development in children. (pp. 73-84). New York: McGraw-Hill.
- Garmezy, N. (1987). Stress, competence, and development: Continuities in the study of schizophrenic adults, children vulnerable to psychopathology, and the search for stress-resistant children. American Journal of Orthopsychiatry. 57(2).
- Garmezy, N. (1991a). Resiliency and vulnerability to adverse developmental outcomes associated with poverty. American Behavioral Scientist, 34 (4), pp. 416-430.
- Garmezy, N., Masten, A. S., and Tellegen, A. (1984). The study of stress and competence in children: A building block for developmental psychopathology. Child Development, 55(1), 97–111. [CrossRef]
- Gerbin D, Hamilton J. (1996). Viability of Exploratory Factor Analysis as a Precursor to Confirmatory Factor Analysis. Struct Equ Modeling. 1996;3(1):62-72.
- Gerbing, D. W. and Anderson J. C. (1988). An update paradigm for scale development incorporating unidimentionality and its assessment. Journal of Marketing Research, 25 (2), pp. 186-192.
- Gitman, L. J. & Zutter, C. J. (2007). Principios de Administración Financiera. México: Pearson Educación Décimo Segunda Edición. Educacion Superior Latinoamericana: Marisa de Anta.
- Goldberg Herb and Lewis, Robert T. (1978). Money madness: The psychology of saving, spending, loving, and hating money: New York: William Morrow. The reviewer, Thomas L. Ruble, teaches administrative and behavioral studies at the Indiana University School of Business, Business Horizons, 21, (5), 94-96.
- Gorsuch R. (1983). Factor Analysis. 2nd ed. Hillsdale, NJ: Erlbaum Associates; 1983.
- Goso, Goso and Alam, Syamsu & Amar, Muhammad & Munizu, Musran. (2023). Financial Literacy’s Importance in Household Finance Decision-Making. 10.2991/978-2-494069-49-7_162.
- Gunderson, L. H., and C. S. Holling. (2002). Panarchy: Understanding transformations in human and natural systems. Island Press, Washington, D.C., USA.
- Gunderson, L.H. (2000). Ecological resilience. In theory and application. Annual Review of Ecology and Systematics, 31(1), p.425-439. [CrossRef]
- Hair J, Anderson R, Tatham R, and Black W. (1999). Análisis Multivariante. 5a ed. Madrid: Prentice Hall; 1999.
- Henson, R. K., and Roberts, J. K. (2006). Use of Exploratory Factor Analysis in Published Research: Common Errors and Some Comment on Improved Practice. Educational and Psychological Measurement, 66(3), 393–416. [CrossRef]
- Hilgert, M. A., Hogarth, J. M., & Beverly, S. G. (2003). Household financial management: The connection between knowledge and behavior. Federal Reserve Bulletin, 89(7), 309-322.
- Ho, R. (2006). Handbook of Univariate and Multivariate Data Analysis and Interpretation with IBM-SPSS (1st ed.). Chapman and Hall/CRC. [CrossRef]
- Holling, C. S. (1996). Engineering resilience versus ecological resilience. In P. Pchulze (ed.), Engineering Within Ecological Constraints (pp. 31-44). National Academy Press.
- Hooper, D., Coughlan, J., and Mullen, M. R. (2008). Structural Equation Modelling: Guidelines for Determining Model Fit. The Electronic Journal of Business Research Methods, 6, 53-60. [CrossRef]
- Hu, L. and P. M. Bentler, 1999, Cutoff Criteria for Fit Indexes in Covariance Structure Analysis:Conventional Criteria Versus New Alternatives, Structural Equation Modeling 6(1): 1-55.
- Huston, S. J. (2010). Measuring financial literacy. Journal of Consumer Affairs, 44(2), 296-316. [CrossRef]
- Jeffreys, H. (1961).Theory of Probability (3rd ed.). Oxford University Press.
- Johnson, E., and Sherraden, M.S. (2007). From financial literacy to financial capability among youth. Journal of Sociology and Social Welfare 34(3), 119-145.
- Kass-Hanna, Josephine Lyons, Angela C. and Liu, Fan, (2022). “Building financial resilience through financial and digital literacy in South Asia and Sub-Saharan Africa,” Emerging Markets Review, Elsevier, vol. 51(PA). [CrossRef]
- Kaye, J., McCuistion, M., Gulotta, R., and Shamman, D. A. (2014). Money talks: Tracking personal finances. Session: Managing Income. [CrossRef]
- Kiliyanni, A. and Sivaraman, S. (2016). The perception-reality gap in financial literacy: evidence from the most literate state in India. International Review of Economics Education, 23, 47-64. [CrossRef]
- Kim HY. (2013). Statistical notes for clinical researchers: assessing normal distribution (2) using skewness and kurtosis. Restor Dent Endod. 2013 Feb; 38(1): 52-4. [CrossRef]
- Kiviat, B. and Morduch, J. (2012). From financial literacy to financial action. Financial Access Initiative, Financial Access Initiative Robert F. Wagner Graduate School of Public Service New York University January 9, 2012.
- Kline, R. B., (1998), Principles and Practice of Structural Equation Modeling, Guilford Press.
- Krueger, DW (1986), “Dinero, éxito y fobia al éxito”, en Krueger, DW (Ed.), El último tabú: El dinero como símbolo y realidad en psicoterapia y psicoanálisis. Brunner/Mazel, Nueva York, págs. 3-16.
- Kulshreshtha, A., Raju, S., Muktineni, S.M. and Chatterjee, D. (2023), “Income shock and financial wellbeing in the COVID-19 pandemic: financial resilience and psychological resilience as mediators, International Journal of Bank Marketing, 2023, № 5, p. 1037-1058. [CrossRef]
- Lorenzo-Seva, U., and Ferrando, P. J. (2006). FACTOR: A computer program to fit the exploratory factor analysis model. Behavior Research Methods, 38(1), 88-91. [CrossRef]
- Lusardi A. and Mitchell O., (2011). Financial literacy and planning: implications for retirement wellbeing, NBER working paper, series working paper 17078 http://www.nber.org/papers/w17078.
- Lusardi and Mitchell (2011). Financial Literacy around the World: An Overview, Cambridge, MA, National Bureau of Economic Research.
- Lusardi, (2011). Americans’ financial capability. National Bureau of Economic Research Working Paper No. w17103. [CrossRef]
- Lusardi, A., and Mitchell, O. S. (2014). The economic importance of financial literacy: Theory and evidence. Journal of Economic Literature, 52(1), 5-44. [CrossRef]
- Lusardi, A., and Mitchell, O. S. (2014). The Economic Importance of Financial Literacy: Theory and Evidence, 52, 1–40.
- Lusardi, A., andTufano, P. (2015). Debt literacy, financial experiences, and overindebtedness. Journal of Pension Economics & Finance, 14(4), 332-368.
- Lusardi, Annamaria and Mitchell, Olivia S., (2007). Financial Literacy and Retirement Planning: New Evidence from the Rand American Life Panel (October 2007). Michigan Retirement Research Center Research Paper No. WP 2007-157. [CrossRef]
- McDonald, R. P. (1999). Test theory: A unified treatment. Mahwah: Lawrence Erlbaum Associates, Inc.
- Minsky, H. P. (1986). Stabilizing an unstable economy. Yale University Press.
- Mulaik, Stanley A.; James, Larry R.; Van Alstine, Judith; Bennett, Nathan; Lind, Sherri and Stilwell, C. Dean (1989). “Evaluation of goodness-of-fit indices for structural equation models”. Psychological Bulletin. Vol. 105, No. 3. Washington, EEUU. Pp. 430-445.
- Muthén, B., and Kaplan D. (1985). A comparison of some methodologies for the factor analysis of non-normal Likert variables. British Journal of Mathematical and Statistical Psychology, 38, 171-189. [CrossRef]
- Netemeyer, R.G., Warmath, D., Fernandes, D. and Lynch, J.G. (2018), “How Am I doing? Perceived financial wellbeing, its potential antecedents, and its relation to overall wellbeing”, Journal of Consumer Research, Vol. 45 No. 1, pp. 68-89. [CrossRef]
- Ogasawara, H. (2011). Asymptotic expansions of the distributions of the polyserial correlations coefficients. Behaviormetrika, 38(2), 153-168. [CrossRef]
- Okumu M., Ansong D., Koomson I., and Ding-Geng Chen (2024). How Financial Resilience Shapes Social and Public Health Policy Choices in Africa: Empirical Insights from the COVID-19 Pandemic. Journal of the Society for Social Work and Research Volume 15, Number 1 Spring 2024. [CrossRef]
- Paswan, A., (2009). Confirmatory Factor Analysis and Structural Equations Modeling, AnIntroduction, Department of Marketing and Logistics, COB, University of North Texas, USA.
- Preacher, K. J., and MacCallum, R. C. (2002). Exploratory factor analysis in behavior genetics research: Factor recovery with small sample sizes. Behavior Genetics, 32(3), 211-221. [CrossRef]
- Richaud, M. (2005). Desarrollos del análisis factorial para el estudio de ítem dicotómicos y ordinales. Revista Interdisciplinaria, 22(2), 237-251.
- Rutter M. (1970). Sex differences in children’s response to family stress. In The child in his familia (eds. Anthony E. J., Koupernik C.). Wiley, New York.
- Rutter M. (1984b) Continuities and discontinuities in socio-emotional development: empirical and conceptual perspectives. In Continuities and Discontinuities in Development (eds. Emde R., Harmon R.). Plenum, New York.
- Salignac, F., Marjolin, A., Reeve, R., and Muir, K. (2019). Conceptualizing and Measuring Financial Resilience: A Multidimensional Framework. Social Indicators Research, 145,17-38. [CrossRef]
- Schreiber, J. B., Nora, A., Stage, F. K., Barlow, E. A., and King, J. (2006). Reporting Structural Equation Modeling and Confirmatory Factor Analysis Results: A Review. Journal of Educational Research, 99, 323-338. [CrossRef]
- Schumacker, R. E and R. G. Lomax, (2004). A Beginner’s Guide to Structural Equation Modeling, Second Edition, and Lawrence Erlbaum Associates.
- Schumacker, R. E. and R. G. Lomax, (1996). A Beginners Guide to Structural Equation Modeling, Hillsdale, N. J. Erlbaum, readable introduction to use of EQS 5.0 or LISREL8-SIMPLIS.
- Setterfield, M., and Kim, Y. (2024). How financially fragile can households become? Household borrowing, the welfare state, and macroeconomic resilience. Rev Evol Polit Econ 5, 121–151 (2024). [CrossRef]
- Simmerman, G. (1985). An evaluation of the use of polychoric correlation coefficients in factor analysis. Multivariate Behavioral Research, 20(3), 305-319. [CrossRef]
- Swiecka, B., Yeşildağ, E., Özen, E. and Grima, S. (2020). Financial literacy: the case of Poland. Sustainability, 12(2), 700. [CrossRef]
- Tabachnick, B. G., and Fidell, L. S. (2013) - Using Multivariate Statistics (6th ed.). Pearson.
- Tahir, M.S., Shahid, A.U. and Richards, D.W. (2022), “The role of impulsivity and financial satisfaction in a moderated mediation model of consumer financial resilience and life satisfaction”, International Journal of Bank Marketing, Vol. ahead-of-print No. ahead-of-print. [CrossRef]
- Tahir, Muhammad, Ahmed, Abdullahi and Richards, Daniel. (2021). Financial literacy and financial wellbeing of Australian consumers: a moderated mediation model of impulsivity and financial capability. International Journal of Bank Marketing. ahead-of-print. 10.1108/IJBM-09-2020-0490.
- Thurstone L. (1931). Multiple Factor Analysis. Psychol Rev. 1931; 38: 406-427.
- Timmerman, M. (2005). Factor analysis. Retrieved of: http://www.ppsw.rug. nl/~metimmer/FAMET.pdf.
- Timmerman, M. E., and Lorenzo-Seva, U. (2011). Dimensionality assessment: The role of correlation matrices and the use of polychoric correlations. Psychological Methods, 16(4), 447-466. [CrossRef]
- Torres, A. (2005). MEFIPES, Método para Obtener Finanzas Personales Sanas, Caso: Tenaris Tamsa. Instituto de Investigaciones y Estudios Superiores de las Ciencias Administrativas. Universidad Veracruzana. Xalapa. 18-81, 128-129.
- Ullman, J. B. (2006). Structural Equation Modeling: Reviewing the Basics and Moving Forward. Journal of Personality Assessment, 87, 35-50.http://dx.doi.org/10.1207/s15327752jpa8701_03.
- Vanegas, J. G., Arango Mesa, M. A., Gómez-Betancur, L., and Cortés-Cardona, D. (2020). Educación financiera en mujeres: un estudio en el Barrio López de Mesa de Medellín. Revista Facultad De Ciencias Económicas, 28(2). [CrossRef]
- Werner, E. E. (1989). High-risk children in young adulthood: A longitudinal study from birth to 32 years. American Journal of Orthopsychiatry, 59(1), 72–81. [CrossRef]
- Werner, E. E. and Smith, R. S. (1982). Vulnerable but invincible. A study of resilient children. Nueva York: McGraw-Hill.
- Werner, E. E. and Smith, R. S. (1992). Overcoming the odds: High-risk children from birth to adulthood. Ithaca, NY: Cornell University Press.
- Xu, L., and Zia, B. (June 2012). Financial literacy around the world: an overview of the evidence with practical suggestions for the way forward. World Bank Policy Research Working Paper No. 6107.
- Yadav, P. and Shaikh, I. (2023), “Measuring financial resilience with consumer sentiment data from India”, International Journal of Bank Marketing, Vol. 41 No. 5, pp. 1083-1103. [CrossRef]
- Yang Y, Li Z., Xu Z., and Liu S., (2024). The impact of digital finance on regional economic resilience.Pacific-Basin Finance Journal, Volume 85, June 2024, 102353. [CrossRef]
- Yao, R. and Zhang, J. (2023), “Employment status and financial resilience during the COVID-19 pandemic”, International Journal of Bank Marketing, Vol. 41 No. 5, pp. 992-1009. [CrossRef]
- Zait and Bertea, (2015). Financial Literacy–Conceptual Definition and Proposed Approach for a Measurement Instrument. The Journal of Accounting and Management, 4(3).
- Zeka, B. and Alhassan, A.L. (2024), “Gender disparities in financial resilience: insights from South Africa”, International Journal of Bank Marketing, Vol. 42 No. 6, pp. 1212-1231. [CrossRef]
Figure 1.
Conceptual model for the empirical study. (Dimensions of Financial Health indicator & Financial Resilience: Perception toward Financial Health Indicators (PFHI), Lived Experiences toward Financial Health Indicators (LEFHI) and Actions to Address Financial Crises (AAFC)).
Figure 1.
Conceptual model for the empirical study. (Dimensions of Financial Health indicator & Financial Resilience: Perception toward Financial Health Indicators (PFHI), Lived Experiences toward Financial Health Indicators (LEFHI) and Actions to Address Financial Crises (AAFC)).
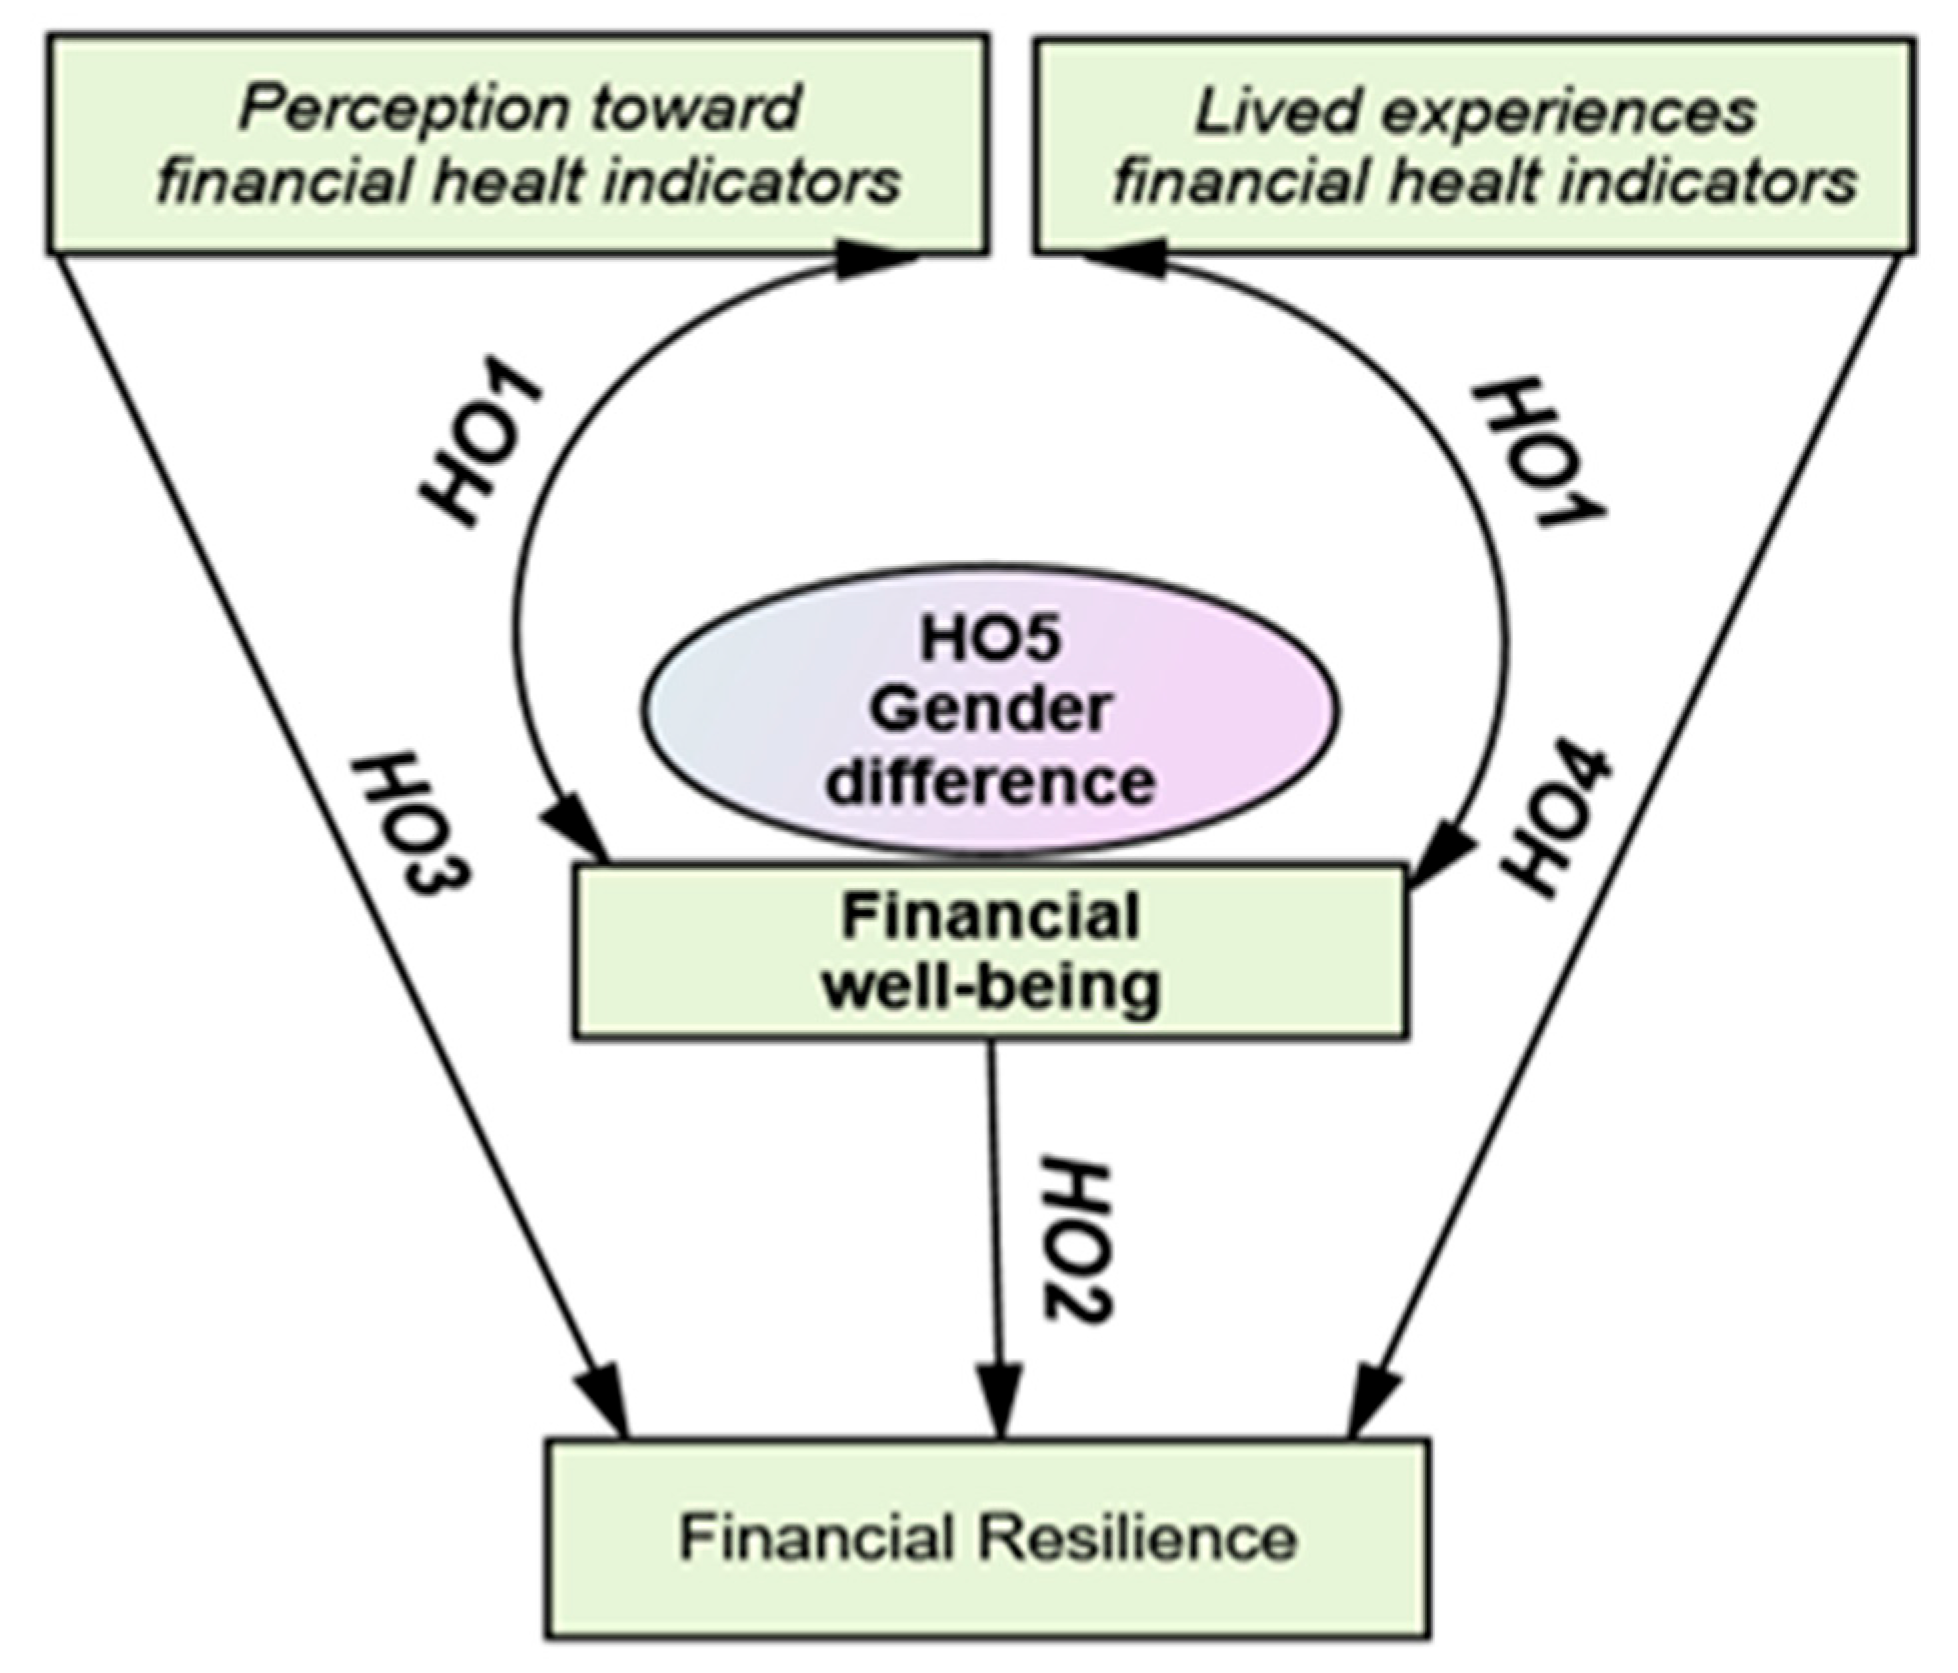
Figure 2.
Initial measure path model & component graph in rotated space Chi-square = 989.405, Degrees of freedom = 186, Probability level = .000.
Figure 2.
Initial measure path model & component graph in rotated space Chi-square = 989.405, Degrees of freedom = 186, Probability level = .000.
Figure 6.
Measure model adjusted 5.
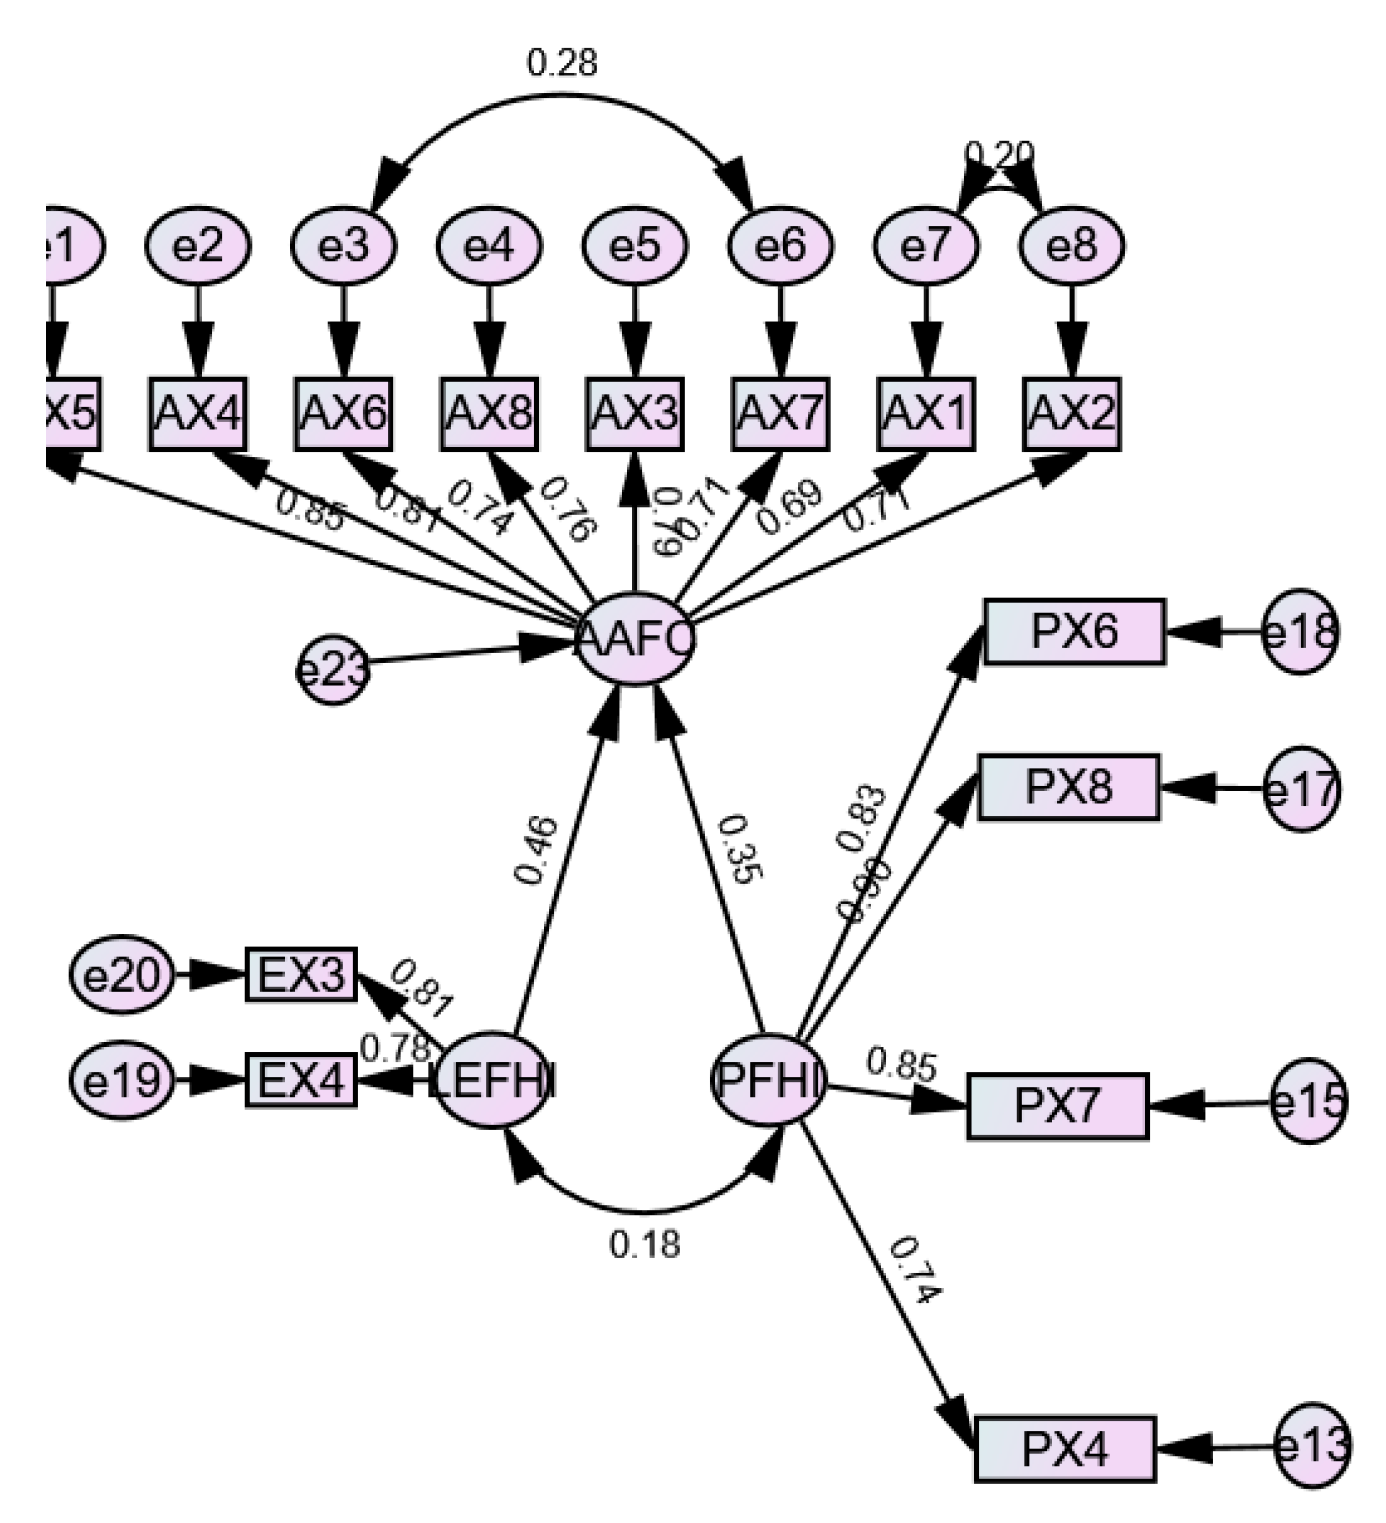
Figure 7.
Final Model adjusted. Chi-square = 161.396, Degrees of freedom = 61, Probability level = .070.
Figure 7.
Final Model adjusted. Chi-square = 161.396, Degrees of freedom = 61, Probability level = .070.
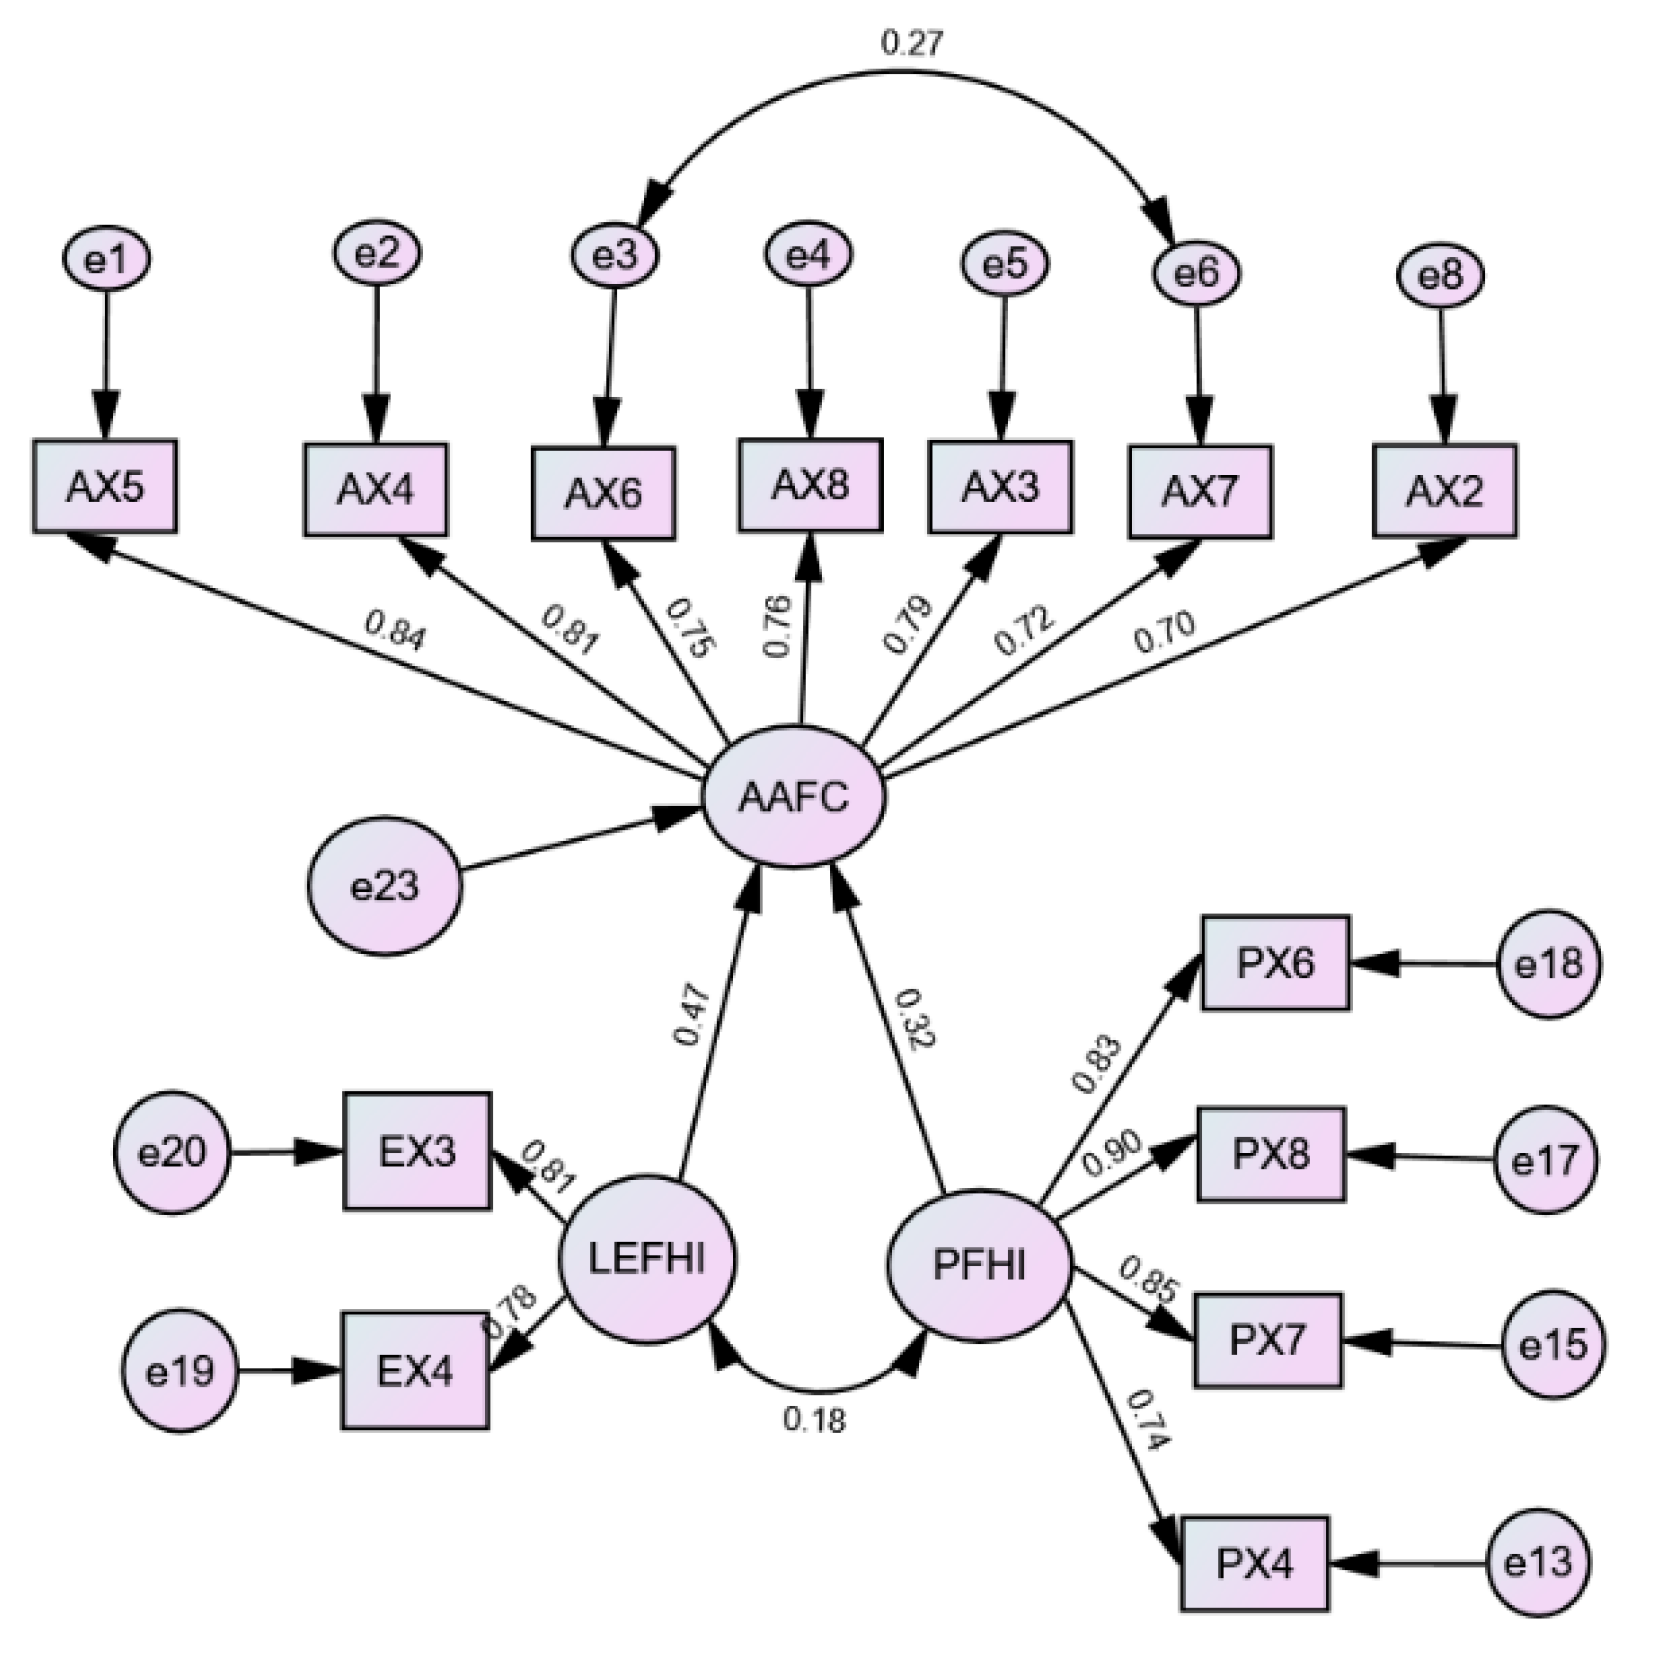
Figure 9.
Rain Cloud Plot Showing Probability Density (level 1 male, level 2 female and level 3 LGBT+).
Figure 9.
Rain Cloud Plot Showing Probability Density (level 1 male, level 2 female and level 3 LGBT+).
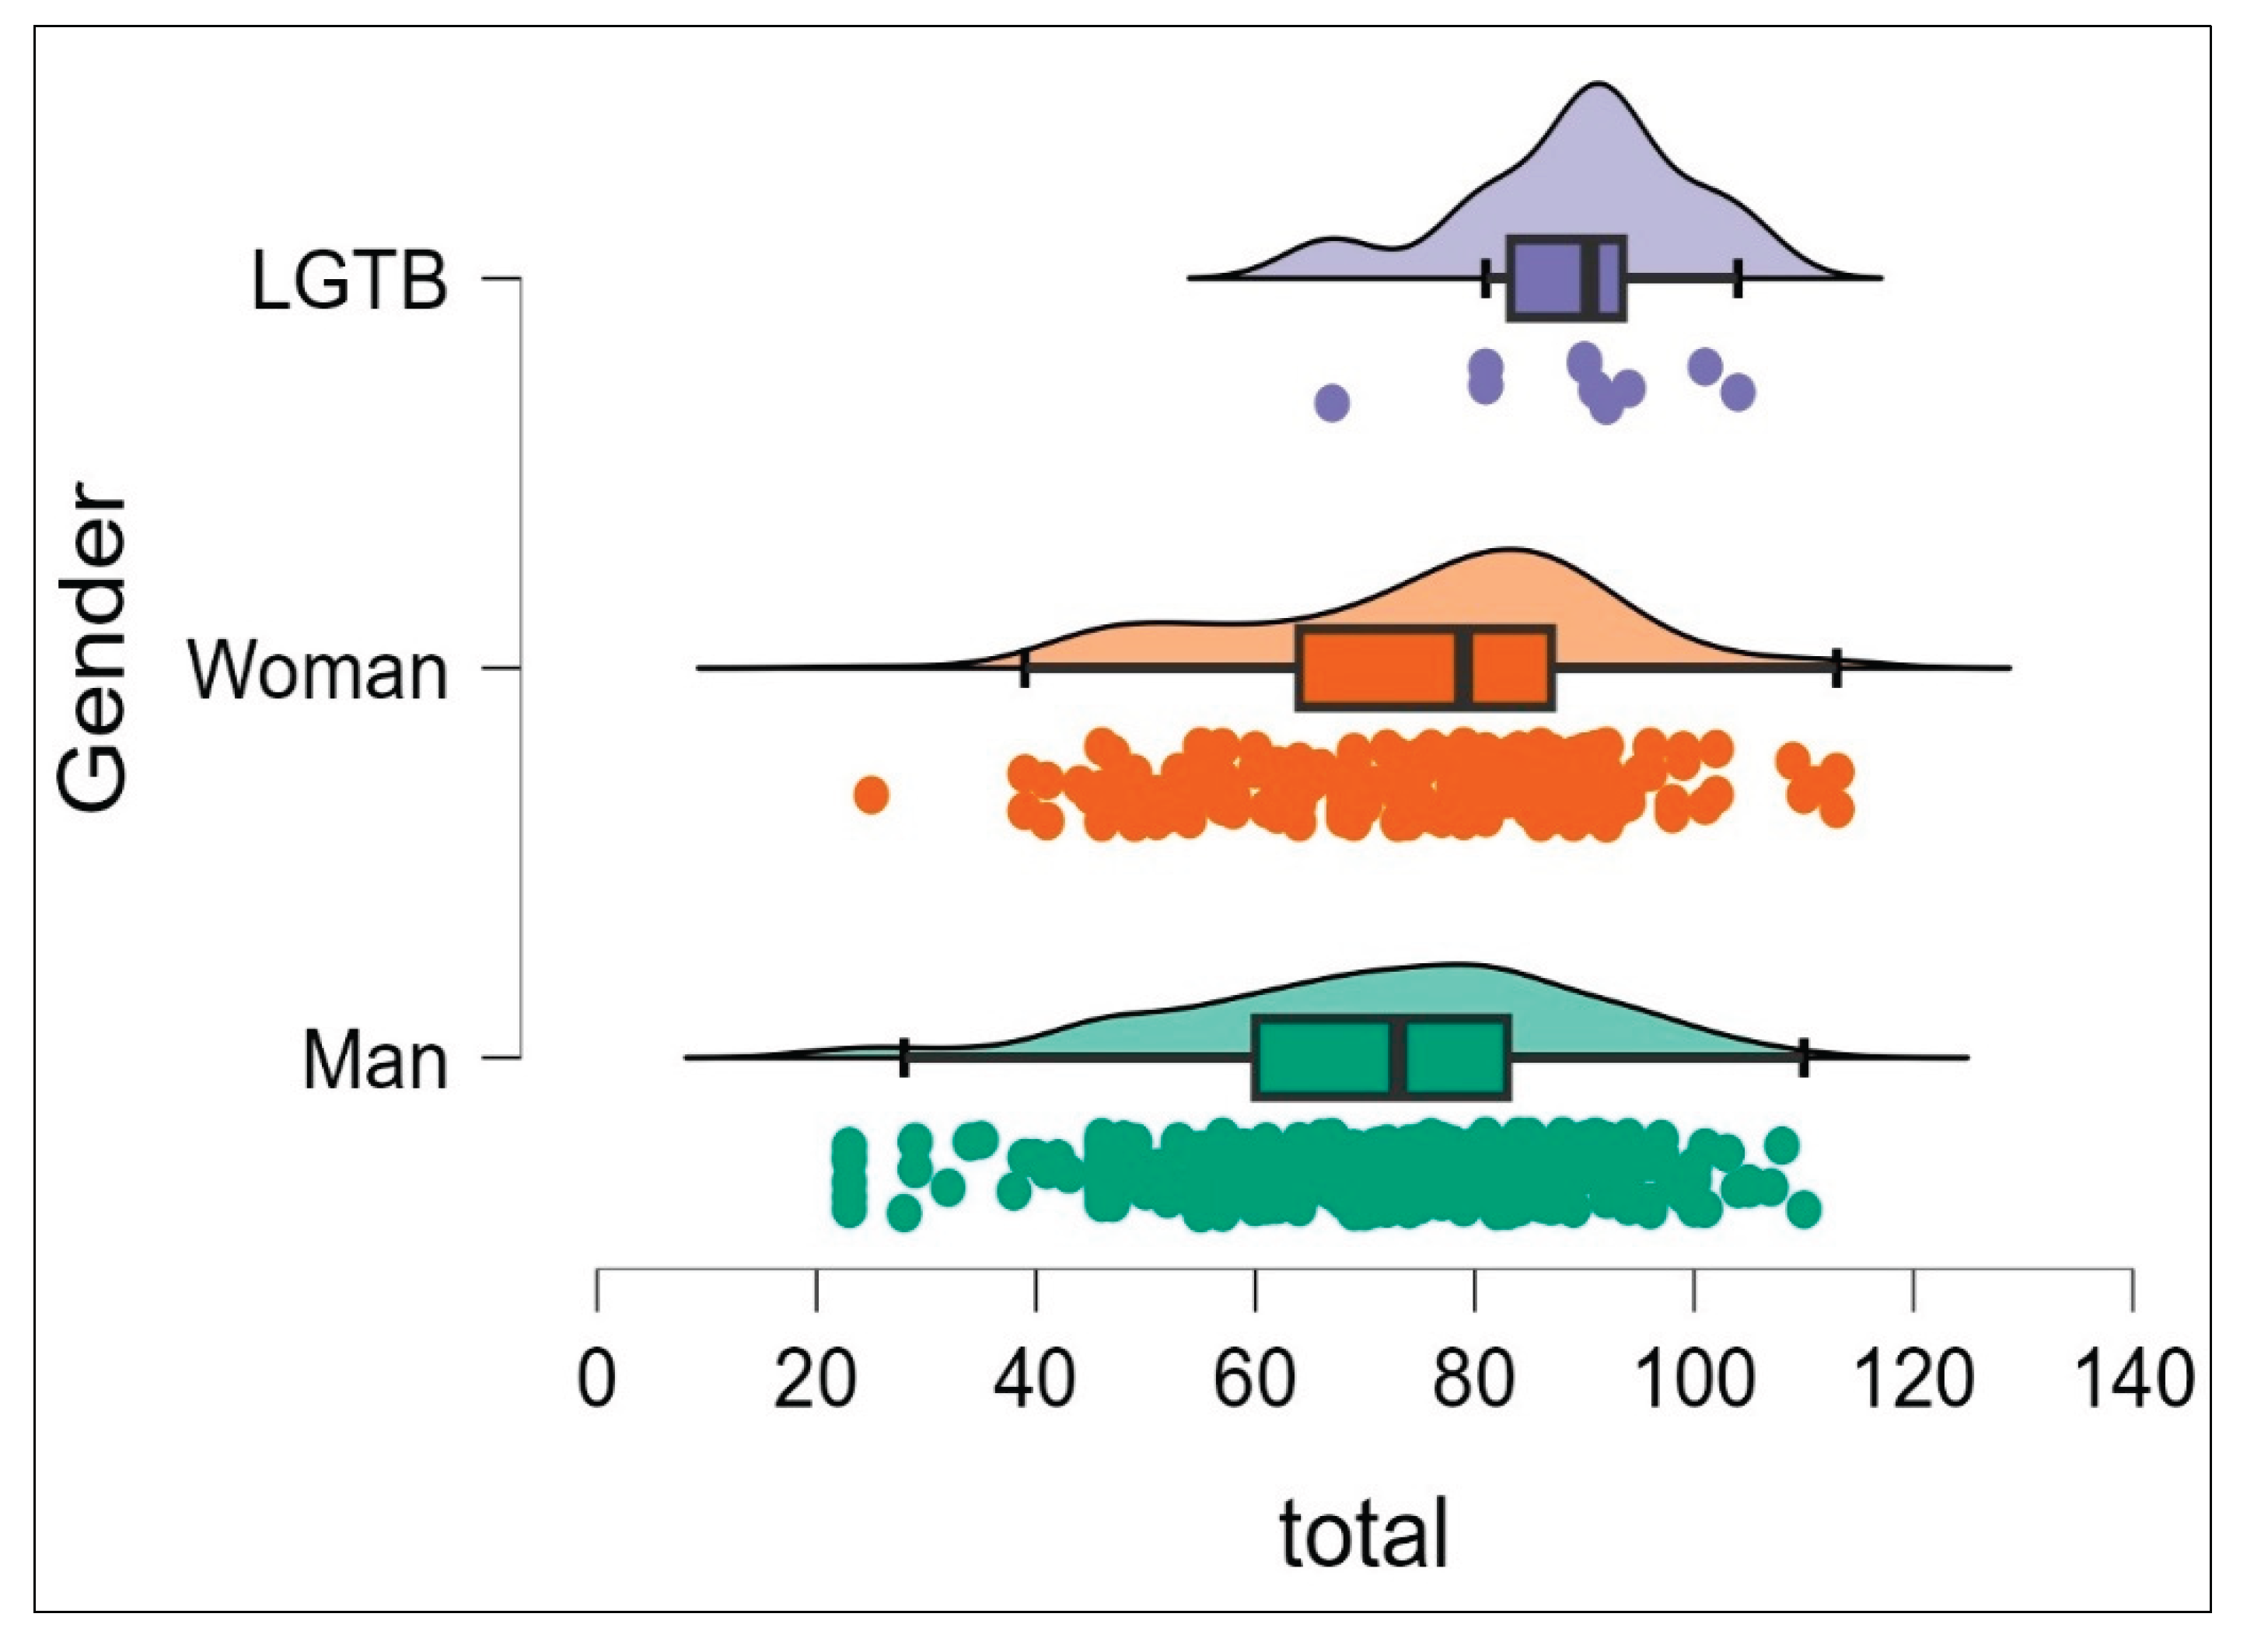
Table 1.
Theoretical values of skewness and kurtosis.
| Sampling | Z | Skewness | Kurtosis | p-value | HO | Distribution |
| small n< 50 | > 1.96 | Ignore | Ignore | 0.05 | Reject | No normally |
| medium 50 < n < 300 | > 3.29 | Ignore | Ignore | 0.05 | Reject | No normally |
| large > 300 | Ignore | > 2 | > 7 | 0.05 | Reject | No normally |
| Otherwise | Not ignore if | < 2 | < 7 | 0.05 | Not Reject | Normally |
Source: Kim (2013).
Table 2.
Quantifiable values of the Bayes factor, according to Jeffrey.
| BF0u Null hypothesis over the alternative | Value | |
| In favor of H0 | Very strong | >30 |
| Strong | 10 to 30 | |
| Moderate | 3.1 to 10 | |
| Anecdotal | 1.1. to 3.1 | |
| No evidence | 1 | |
| In favor of H1 | Anecdotal | 0.3 to 0.9 |
| Moderate | 0.29 to 0.1 | |
| Strong | 0.09 to 0.03 | |
| Very strong | <0.03 | |
Source: based in the work of Ramos-Vera (2021).
Table 4.
Rotated component matrix and explained variance.
| Items | F1 | F2 | F3 | F4 | |
| AX5. Have you defined any strategy to maintain your debts in a sustainable manner and that you can pay when due? | 0.836 | 0.699 | |||
| AX4. Did you take any action to have enough savings or long-term assets? | 0.790 | 0.624 | |||
| AX6. If you did not have a healthy credit history, did you carry out any plan? | 0.786 | 0.618 | |||
| AX8. In case of not doing, it in your personal life, did you implement a strategy to plan the expenses that you will have in the immediate future and in the short term? | 0.783 | 0.613 | |||
| AX3. If so, did you implement any plan to increase your savings in liquid financial products? | 0.767 | 0.588 | |||
| AX7. In case of not having adequate insurance, or having some, did you implement any plan to modify this scheme? | 0.767 | 0.588 | |||
| AX1. Personally, did you take any actions to spend less than you earn? | 0.676 | 0.457 | |||
| AX2. In the event of having had pending payments, and not having paid on time: did you take any action to resolve the payment of your invoices on time and in full? | 0.664 | 0.441 | |||
| EX6. Today, do you have a healthy credit history? | 0.614 | 0.377 | |||
| PX6. Have a healthy credit history? | 0.856 | 0.733 | |||
| PX8. Plan expenses for the future? | 0.818 | 0.669 | |||
| PX2. Do invoices have to be paid on time and in full? | 0.778 | 0.605 | |||
| PX7. Have adequate insurance? | 0.774 | 0.599 | |||
| PX3. Is it convenient to have enough savings in liquid financial products? | 0.767 | 0.588 | |||
| PX4. Have enough savings or long-term assets? | 0.761 | 0.579 | |||
| PX1. Do you think that you should spend less than what you earn? | 0.732 | 0.536 | |||
| PX5. Have a sustainable level of debt? | 0.717 | 0.514 | |||
| EX8. In your personal life, do you plan the expenses that you will have in the immediate future and in the short term? | 0.508 | 0.258 | |||
| EX3. Do you have enough savings in liquid financial products? | 0.800 | 0.640 | |||
| EX4. Do you have enough savings or long-term assets? | 0.756 | 0.572 | |||
| EX7. Do you currently have adequate insurance in force? | 0.684 | 0.468 | |||
| eigenvalue | 9.458 | 3.473 | 1.506 | 1.13 | Σ |
| % variance explained by extraction | 39.409 | 14.469 | 6.276 | 4.706 | 64.86 |
| % variance explained by rotation | 25.440 | 24.460 | 9.702 | 5.258 | 64.86 |
| AVE (Average variance extracted) | 0.556 | 0.565 | 0.404 | ** | |
| CR Composite Reliability | 0.918 | 0.920 | 0.575 |
* Extraction Method: Principal Component Analysis. Rotation Method: Varimax with Kaiser Normalization. The rotation has converged in 10 iterations. (EX2, EX5 and EX1 have not charge). **This items it has included in factor 3 (see Figure 2).
Table 5.
Likelihood ration Chi-Square.
| Model fit summary | Model 1 Initial factorial solution | Adjusted Model 2 | Adjusted Mode 3 | Adjusted Mode 4 | Adjusted Mode 5 | Adjusted Final Model 6 | Theoretical criterion | |
| CMIN | NPAR | 45 | 37 | 35 | 32 | 33 | 30 | |
| CMIN | 989.405 | 543.434 | 298.994 | 237.618 | 221.285 | 161.396 | ||
| DF | 186 | 116 | 85 | 73 | 72 | 61 | ||
| P | 0 | 0 | 0 | 0 | 0 | 0 | ||
| CMIN/DF | 5.319 | 4.685 | 3.518 | 3.255 | 3.073 | 2.646 | 2.1 to 3.1 | |
| RMR, GFI | RMR | 0.115 | 0.087 | 0.082 | 0.071 | 0.073 | 0.052 | Close to 0 |
| GFI | 0.832 | 0.878 | 0.924 | 0.933 | 0.939 | 0.951 | >9 | |
| AGFI | 0.792 | 0.839 | 0.892 | 0.904 | 0.912 | 0.927 | >9 | |
| PGFI | 0.67 | 0.666 | 0.654 | 0.649 | 0.644 | 0.637 | > 0.5 value > parsimony | |
Table 6.
Baseline comparison and parsimony adjusted measures.
| Model fit summary | Model 1 Initial factorial solution | Adjusted Model 2 | Adjusted Mode 3 | Adjusted Mode 4 | Adjusted Mode 5 | Adjusted Final Model 6 | Theoretical criterion | |
| Baseline Comparisons | NFI -Delta 1 | 0.851 | 0.899 | 0.936 | 0.944 | 0.948 | 0.958 | ≥.9 |
| RFI -rho1 | 0.832 | 0.882 | 0.92 | 0.93 | 0.934 | 0.946 | ≥.9 | |
| IFI Delta 2 | 0.876 | 0.919 | 0.953 | 0.96 | 0.964 | 0.973 | ≥.9 | |
| TLI -rho2 | 0.859 | 0.905 | 0.942 | 0.95 | 0.954 | 0.966 | ≥.95 | |
| CFI | 0.875 | 0.919 | 0.953 | 0.96 | 0.964 | 0.973 | ≥.9 | |
| Parsimony-Adjusted Measures | PRATIO | 0.886 | 0.853 | 0.81 | 0.802 | 0.791 | 0.782 | >0.50 |
| PNFI | 0.754 | 0.767 | 0.757 | 0.757 | 0.75 | 0.749 | >0.50 | |
| PCFI | 0.775 | 0.784 | 0.771 | 0.77 | 0.763 | 0.761 | >0.50 | |
Table 7.
Root mean square error of approximation & Hoelter.
| Model fit summary | Model 1 Initial factorial solution | Adjusted Model 2 | Adjusted Mode 3 | Adjusted Mode 4 | Adjusted Mode 5 | Adjusted Final Model 6 | Theoretical criterion | |
| FMIN | FMIN | 1.987 | 1.091 | 0.6 | 0.477 | 0.444 | 0.324 | |
| F0 | 1.613 | 0.858 | 0.43 | 0.331 | 0.3 | 0.202 | ||
| LO 90 | 1.423 | 0.72 | 0.331 | 0.244 | 0.217 | 0.134 | ||
| HI 90 | 1.819 | 1.011 | 0.543 | 0.432 | 0.397 | 0.285 | ||
| RMSEA | RMSEA | 0.093 | 0.086 | 0.071 | 0.067 | 0.065 | 0.057 | ≤ 0.05 |
| LO 90 | 0.087 | 0.079 | 0.062 | 0.058 | 0.055 | 0.047 | ||
| HI 90 | 0.099 | 0.093 | 0.08 | 0.077 | 0.074 | 0.068 | ||
| PCLOSE | 0.000 | 0.000 | 0.000 | 0.002 | 0.007 | 0.121 | ||
| HOELTER | HOELTER 0.05 | 111 | 131 | 180 | 197 | 209 | 248 | |
| HOELTER 0.01 | 118 | 142 | 197 | 218 | 232 | 277 | ||
Table 8.
Model Comparison.
| Models | P(M) | P(M|data) | BFM | BF01 | error % |
| Null model | 0.500 | 0.051 | 0.0537 | 1.000 | 0.020 |
| Gender | 0.500 | 0.949 | 18.501 | 0.054 |
Table 9.
Model Averaged Posterior Summary.
| Variable | Level | Means | Sd | 95% Credible Interval | |
| Lower | Upper | ||||
| Intercept | 77.138 | 2.057 | 72.750 | 81.001 | |
| Gender | 1 - Male | -6.020 | 1.964 | -10.042 | -2.175 |
| 2 - Female | -2.116 | 2.000 | -6.188 | 1.783 | |
| 3 - LGBT+ | 8.136 | 3.630 | 1.017 | 15.587 | |
*Note: 1 Male 77.138-(-6.020)=83.158; 2 Female 77.138-(-2.116)= 79.254, and 3 LGBT+ 77.138-(8.136)= 69.002.
Disclaimer/Publisher’s Note: The statements, opinions and data contained in all publications are solely those of the individual author(s) and contributor(s) and not of MDPI and/or the editor(s). MDPI and/or the editor(s) disclaim responsibility for any injury to people or property resulting from any ideas, methods, instructions or products referred to in the content. |
© 2026 by the authors. Licensee MDPI, Basel, Switzerland. This article is an open access article distributed under the terms and conditions of the Creative Commons Attribution (CC BY) license (http://creativecommons.org/licenses/by/4.0/).
Copyright: This open access article is published under a Creative Commons CC BY 4.0 license, which permit the free download, distribution, and reuse, provided that the author and preprint are cited in any reuse.


