
Submitted:
09 January 2026
Posted:
12 January 2026
You are already at the latest version
Abstract
Filter cake (or cachaza), a residue generated in the artisanal production of panela, represents an under-explored source of renewable energy in the Ecuadorian Amazon. Valorizing filter cake could reduce the use of solid biomass and emissions associated with traditional combustion. Our objective was to determine the energy potential of the biogas obtained and its contribution to the sustainability of the panela (unrefined cane sugar) production system. A sequential procedure was applied that included the physicochemical characterization of filter cake, feed flow modeling, and stoichiometric simulation under mesophilic conditions. The anaerobic digestion of filter cake with the optimal Composition 6 generated up to 1,736.40 m³·day⁻¹ of biogas with 40.7% methane and a calorific value of 14,350 kJ·m⁻³. This was enough to replace 1.24 t·day⁻¹ of wood or 2.38 t·day⁻¹ of bagasse in the production system. This represents an annual saving of 631.08 t of solid biomass, equivalent to conserving 3.63 ha·year⁻¹ of the Amazon rainforest. The TRACI analysis showed impacts on climate change (17.40 kg CO₂ eq/m³) and acidification (0.00516 kg SO₂ eq/m³), attributable to unburned methane and residual H₂S. Meanwhile, the social assessment using the OHSP indicator showed high risks in terms of handling filter cake and cleaning the digestate.
Keywords:
biogas
; cachaza
; calorific value
; mathematical models
; panela
; simulation
; stoichiometry
1. Introduction
Globally, around 80% of Saccharum officinarum crops are used for sugar production and 20% for ethanol [1]. In 2020, around 1,869.7 million tons of sugarcane were harvested, and Brazil was the main producer, growing 757.1 million tons, followed by India, China, Pakistan, and Thailand [2]. Brazilian productivity can achieve up to 72 t/ha, with the southeast region accounting for 60% of national production [3]. The sugar industry generates approximately 279 million metric tons of waste each year, including bagasse and filter cake [4]. The latter, also known as cachaza, is produced during juice clarification and has a high moisture content (≈75%) as well as compounds such as cellulose, hemicellulose, lignin, sucrose, and minerals [5]. The composition of filter cake varies depending on the type of sugarcane, the soil, the climate, and the efficiency of the milling process [6].
The province of Pastaza, in the Ecuadorian Amazon, has an estimated sugarcane production potential of 4,500 hectares, with an average yield of 55 t/ha, mainly for the production of derivatives such as panela in blocks, granulated panela, aguardiente (a type of sugarcane liquor), and fresh sugarcane sticks [7]. The local sugarcane industry is made up of more than 110 small factories, which, alongside their products, generate a considerable amount of organic waste that accumulates around these facilities [8]. This activity depends on the use of solid biomass wood and bagasse as a source of thermal energy, which leads to a high consumption of forest resources and the emission of incomplete combustion gases. Therefore, the valorization of filter cake as an energy substrate is a strategic alternative to reduce deforestation, decrease the use of traditional biomass, and strengthen the sustainability of artisanal sugarcane systems. However, there is no research available that integrates stoichiometric simulation with TRACI (Tool for the Reduction and Assessment of Chemical and Other Environmental Impacts) and social life cycle assessment (S-LCA) tools to demonstrate the energy potential of biogas obtained from filter cake and its environmental and social benefits in artisanal panel systems.
The processing of sugarcane using rudimentary technologies continues to be common practice within small factories in the province of Pastaza. In several sugar mills (paneleras), filter cake is considered a waste product due to its high organic load, with chemical oxygen demand (COD) values of up to ≈ 90,000 mg/L and biochemical oxygen demand (BOD₅) values of up to ≈ 40,000 mg/L [9]. The final disposal of filter cake is usually carried out without prior treatment, thus intensifying the contamination of soils, water bodies, and areas surrounding the trapiches [10]. [11] reported that 71.4% of sugar mills do not apply any kind of environmental management, while [12] identified that 89.5% of environmental impacts come from processes related to the management of waste, such as filter cake, and other stages of the panela production process and cane cutting.
Anaerobic digestion represents an appropriate technological option for the treatment of agro-industrial waste with high moisture content, such as filter cake. This technology, in addition to being economically accessible, allows for the production of biogas as a renewable energy source and a stabilized by-product (digestate) with potential use as fertilizer [13]. Previous records of sugarcane waste digestion have focused on kinetic estimates or laboratory conditions, without incorporating a comprehensive approach that links biogas production with environmental sustainability indicators. This gap limits the possibility of comparing the energy efficiency of biogas with traditional fuels and makes it difficult to quantify its real environmental benefits.
The yield of anaerobic digestion is directly dependent upon the type of substrate used [14]. One study found that the combination of filter cake with agricultural waste achieved a production of 120 m³/t of methane (CH₄), whereas the exclusive use of filter cake yielded outputs ranging from 73.7 to 129.5 mL/g of CH₄ [15]. Similarly, [16] reported the generation of 0.360 m³ of biogas from 10 kg of cattle manure, and [17] achieved an 81% biogas yield using vinasses as substrate. The quality of biogas is associated with the proportion of methane present, which is the component with the highest calorific value. In simple applications, such as stoves, heaters, or generators, the removal of carbon dioxide (CO₂) is not required. However, for more demanding uses like vehicle fuel, it is necessary to purify the biogas to maximize its energy efficiency [18].
This study proposes a comprehensive approach applied to artisanal panela production, combining stoichiometric simulation in CHEMCAD [19,20] with the TRACI and S-LCA tools. This integration enables a simultaneous analysis of the energy yield of biogas obtained from filter cake and the environmental impacts associated with its use. It also incorporates the social dimension linked to the operation of the biodigester, offering a more complete view of the production system. In this way, a technical basis is established that contributes to optimizing the use of agro-industrial waste and promoting sustainable practices in artisanal panela systems.
The analysis of environmental impact using the TRACI tool allows for the evaluation of emissions associated with thermochemical and biological processes by considering compounds such as CH₄, CO₂, H₂S, and NOₓ [21]. This methodology classifies impacts into categories such as climate change, soil acidification, tropospheric ozone formation, eutrophication, human toxicity, photochemical smog, and ozone depletion [22], providing a quantitative basis for comparing energy alternatives to the use of fossil fuels or solid biomass. The choice of TRACI 2.2 over methodologies such as life cycle assessment (LCA), GREENSCOPE (Gauging Reaction Effectiveness for the Environmental Sustainability of Chemistries with a Multi-Objective Process Evaluator), or WAR (Waste Reduction Algorithm) is justified by its ability to estimate environmental impacts directly from simulated process flows, without requiring complete life cycle inventories. It sets itself apart from LCA, which requires a database, or GREENSCOPE and WAR, which focus on the efficiency and safety of large-scale chemical plants.
In addition to the environmental component, the sustainability of the sugarcane industry includes social and occupational dimensions. In this study, S-LCA was considered to identify occupational health and safety risks for personnel involved in the operation of the biodigester. The Occupational Health and Safety Potential (OHSP) indicator allowed for the quantification of hours potentially lost due to workplace accidents. Therefore, this study methodologically integrated CHEMCAD simulation, S-LCA, and the TRACI model and applied it to the case of an artisanal sugarcane mill in Pastaza. This enabled the simultaneous estimation of biogas yield, solid biomass savings, and associated environmental impact categories, providing a technical basis for the energy transition of the Ecuadorian sugarcane sector.
Based on the above, this study aimed to determine the energy potential, environmental impact, and OHSP of biogas obtained from the bagasse generated in the artisanal production of panela in Pastaza, using simulations in CHEMCAD, TRACI, and S-LCA software to estimate the sustainable performance of the panela system.
2. Materials and Methods
This research followed a sequential methodological procedure aimed at assessing the energy use of filter cake and its effect on the panela system. The first stage involved collecting primary and secondary information from the plant in Pastaza, including data on milling capacity, filter cake generation, fuel consumption, and operating conditions. Based on this, the filter cake was characterized, and representative compositions of moisture, organic matter, and ash were defined, which served as direct input for modeling anaerobic digestion and defining input and output streams in the diagram of the process (Figure 1).
The final phase integrated modeling and simulation of the process in CHEMCAD with two levels of evaluation. First, the calorific value of the biogas and the amount of wood and bagasse that can be replaced in the boiler were calculated, consistent with actual plant data. Second, TRACI 2.2 was applied together with the OHSP indicator within the S-LCA approach to estimate environmental impacts and occupational risks.
2.1. Data Collection
The information used to characterize the filter cake was obtained from scientific sources indexed in international databases (Scopus, SciELO, Elsevier, Springer, and Wiley), using keywords such as filter cake, biogas, and anaerobic digestion. Recent (≤ 5 years) average compositions were prioritized, including moisture, ash, fiber, protein, lipids, and sugars. The information collected was compared with local data on sugarcane yield and panela production in the province of Pastaza [7,23]. This allowed the average compositions obtained from the literature to be adjusted, and it ensured their representativeness in the Amazonian context.
2.2. Characterization of the Filter Cake
The filter cake composition was analyzed based on information obtained from recent scientific literature, prioritizing experimental reference values. Data on crude protein, lipids, ash, sucrose, total fiber, and their fractions were incorporated, along with profiles of amino acids, fatty acids, minerals, and bioactive compounds reported by [5,24,25,26].
2.3. Modeling of the Process
Different boundary conditions for anaerobic digestion were analyzed by considering the upper and lower limits of the main components of the filter cake (Table 1). The purpose was to establish a representative range of compositions, including a base profile, in order to evaluate the system’s response to possible variations in the raw material.
Simulation scenarios were defined based on different feed flow levels (Table 2) by adjusting the percentage of available bagasse according to the theoretical value for the province of Pastaza. These combinations allow simulations to be run that show the behavior of the system under variable load conditions, with an emphasis on the amount of biogas in terms of CH₄, CO₂, and H₂S.
2.4. Simulation of the Process
The simulation was performed in CHEMCAD 6.3.1 by modeling the anaerobic digestion of filter cake using mass balances. Daily capacity was estimated based on sugarcane data in Pastaza [7] and by considering usable area and land set aside for panela. The operating conditions were a mesophilic temperature of 25–35 °C and pH of 6.8–7.2 [27]. These parameters ensure microbiological stability in anaerobic processes.
2.4.1. Estimation of Filter Cake Production in Pastaza
The estimate was made according to the availability of sugarcane and the percentage of filter cake extracted. Sugarcane production and the percentage of usable sugarcane crops were established according to [7], while the estimated cane yield and percentage used for panela production were set according to [28], and the percentage of filter cake was determined as proposed by [29]. Based on these parameters and considering an annual operating period of 365 days, a tentative daily filter cake production of 9,760 kg d⁻¹ was estimated, and this value was used as a reference for defining feed flows and process simulation scenarios.
2.5. Technical Evaluation of Biogas
The Low Heating Value (LHV) was obtained by extrapolating the values published in [30]. The LHV of wood (Eucalyptus globulus) was obtained from [31] and that of bagasse from Equation 1 proposed by [32].
LHV= [(18260 – 207.63 (moisture % sample) – 182.6 (ash % sample) – 31.14 (brix % sample)] kJ.kg- 1
The energy balance equation and was used to estimate the amount of wood and bagasse that can be replaced by the biogas generated, considering the heating values of the three fuels evaluated.
The energy savings obtained by replacing solid biomass with biogas were compared with the average aboveground biomass of the Amazon rainforest to establish an ecological equivalence. To do this, a value of 174 Mg ha⁻¹ was used as the average dry biomass density reported by [33], and an average individual biomass of 0.70 t tree⁻¹. Using these references, the proportion of wood replaced that would correspond to the preserved forest area and number of equivalent trees was calculated, thus linking the use of biogas to the potential for rainforest preservation in the Amazon.
The results were compared with recent studies on the anaerobic digestion of filter cake and sugarcane residues carried out by [15,34,35]. The reference datasets included the organic matter composition, moisture content, and lignin content of filter cake, along with the experimental biogas and methane yields reported in those studies. The comparison covered total biogas volume, methane (CH₄) fraction, and hydrogen sulfide (H₂S) concentration, and there was a general alignment between local results and international experimental ranges.
2.6. Environmental Assessment with TRACI 2.2
In estimating the environmental impact using TRACI 2.2, only the gaseous flows generated during anaerobic digestion were considered, as they constitute the main source of direct emissions associated with the energy use of biogas. Liquid and solid flows—corresponding to digestate and process sediments—were not included because their impact requires further treatment depending on the type of disposal or agricultural use, which exceeds the system boundaries defined for this assessment. The quantitative analysis focused on emissions of CH₄, CO₂, H₂S, and NOₓ, selected for their significant contribution to the categories of the impact of climate change (kg CO₂ eq), acidification (kg SO₂ eq), and tropospheric ozone formation (kg O₃ eq), in accordance with the methodological guidelines of the TRACI 2.2 model.
The substances considered for each category were CH₄ and CO₂ for climate change, NOₓ and H₂S for acidification, and CH₄ and NOₓ for photochemical smog. The composition of the biogas was obtained from experimental results. For natural gas (≈98% CH₄), liquefied petroleum gas (LPG), and propane, estimated emission values for complete combustion were used based on technical data [36,37,38]. The impact calculation consisted of multiplying the estimated mass of each substance by its corresponding TRACI characterization factor.
2.7. Occupational Health and Safety Potential (OHSP)
The study incorporated the occupational health and safety component through the use of the OHSP indicator, developed by [39], as a midpoint indicator within the S-LCA. This facilitated the quantification of hours potentially lost due to occupational accidents in each phase of the biogas production process (Equation 2). The reference values came from the [40] database in conjunction with the values from the study panel. The mathematical model is described by the following relationship:
where:
is the occupational characterization factor, calculated as:
corresponds to the total work hours in stage n of the production process.
The OHSP indicators module reports that the agro-industrial sector has a global average rate of 2.5 accidents resulting in lost days per 100 workers, with an average annual working time of 2,000 hours per employee and an average duration of 4 days lost per accident. These values were applied as reference parameters, adjusted proportionally to the actual hours of the simulated process.
The filter cake-based biogas system was divided into four operational stages: receiving and preparing the filter cake, loading and feeding the biodigester, operating and controlling anaerobic digestion, and cleaning and discharging the digestate. At each stage, the main exposure factors were identified and the OHSP indicator was estimated, taking into account the characteristics of the work, the annual duration, and the nature of the existing risks.
3. Results
3.1. Bibliographic Characterization
Table 3 shows the compounds present in filter cake, including macronutrients, essential and non-essential amino acids, saturated and unsaturated fatty acids, minerals, and phytochemicals with functional potential. This characterization allows the identification of components suitable for agro-industrial use, such as structural fiber, phytosterols, and residual sugars.
3.2. Mathematical Modeling
Mathematical models for predicting biogas production were developed based on the general mass balance equation and the chemical composition of the waste. The modeling considered the main organic fractions present in filter cake, allowing the formulation of stoichiometric reactions that describe the conversion of organic matter during anaerobic digestion (Table 4).
3.3. Modeling of the Process
3.3.1. Simulation of the Anaerobic Digestion Process
The simulated process starts with the storage of filter cake (Unit 1 in Figure 2), which is subsequently fed into the anaerobic digester operated under mesophilic conditions at approximately 25 °C. This operating temperature was selected to maintain stable microbial activity during anaerobic digestion (Singh et al., 2020). After digestion, two main output streams are generated: digestate and biogas. The digestate is discharged through Stream 4, while the biogas is conveyed through Stream 5 toward a purification unit.
In the purification stage, the biogas comes into contact with iron(III) oxide supplied as nanoparticles or granular hematite. This interaction promotes the removal of hydrogen sulfide from the gas phase. The solid products formed during this stage are discharged through Stream 9, while the purified biogas exits the system as the final gaseous product (Figure 2).
3.3.2. Estimation of Bagasse Production in the Sugar Mill
The estimated amount of bagasse generated in the province of Pastaza is approximately 9,760 kg·d⁻¹, considering an extraction rate of 4% per ton of processed sugarcane [28]. Based on a processing capacity of 10 t·d⁻¹, a total of 400 kg·d⁻¹ of filter cake was estimated as available substrate for biogas production in the simulation. To evaluate system performance under variable operating conditions, the simulation was performed using different feedstock capacities (Table 5).
3.4. Process Simulation
3.4.1. Base Production Case According to the Literature Review
According to [35], 120–155 m³ of biogas can be obtained from one ton of processed filter cake, i.e., a yield of 12–15.5%. Under the base production scenario, a feed flow of 1,000 kg·d⁻¹ (1 t·d⁻¹) of filter cake generated 172.98 m³·d⁻¹ of biogas, corresponding to a yield of 17.2%. The simulated biogas consisted mainly of methane and carbon dioxide, while ammonia and hydrogen sulfide were produced in lower proportions (Figure 3 A–B).
3.4.2. Production Flow Case in Pastaza
Figure 3A shows that biogas production increased as the feed flow increased, with the gas mixture mainly composed of CH₄ and CO₂. Figure 3B indicates the presence of NH₃ and SH₄ in lower proportions. The average methane content obtained was 39.6%, while carbon dioxide reached 58.3%. Ammonia represented 2.03% of the gas mixture, whereas hydrogen sulfide remained at a low level of 0.04%.
3.4.3. Boundary Conditions for the Proposed Model
Figure 4 shows the relationship between filter cake composition, feed flow, and biogas production. Biogas output varied according to both composition and production flow. Among the evaluated scenarios, Composition 6 achieved the highest biogas production, reaching 1,736.40 m³·d⁻¹ at a feed flow of 9,760 kg·d⁻¹. An overall increase in biogas production was observed as the feed flow increased, particularly for Compositions 6, 7, and 8.
Hydrogen sulfide remained stable and below 0.12% in all formulations, as shown in Figure 5. This indicates a low concentration of sulfur compounds in the gas phase and a consistent behavior of H₂S across the evaluated conditions.
3.5. Technical Evaluation of Biogas
The biogas obtained from filter cake showed an average calorific value of 13,900 kJ·m⁻³. In the highest production scenario evaluated, with a biogas flow of 1,288.62 m³·day⁻¹, an estimated saving of 1,242.88 kg·day⁻¹ of wood was obtained, equivalent to 1.24 t·day⁻¹ of solid biomass. In Composition 6, with a methane content of 40.69%, biogas production values of 71.16 and 1,736.4 m³·day⁻¹ were obtained at filter cake feed flows of 400 and 9,760 kg·day⁻¹, respectively. These production levels corresponded to wood savings of 70.86 and 1,728.99 kg·day⁻¹, as well as bagasse savings of 135.91 and 3,316.43 kg·day⁻¹ (Table 6).
3.6. Comparison of the Environmental Impact of Gaseous Fuels Using TRACI
The environmental impact assessment using TRACI factors compared four gaseous fuels: biogas, methane (natural gas), LPG, and propane, considering the stages from production to energy use. Biogas was produced through anaerobic digestion of filter cake under mesophilic conditions and purified using iron(III) oxide, resulting in a gas with a methane content of 40.7% (Table 7). Methane, LPG, and propane were considered based on their conventional industrial production routes from fossil resources.
The results show differences among fuels in the impact categories of climate change, acidification, and photochemical ozone formation. Biogas presented the highest climate change impact, reaching 17.40 kg CO₂ eq·m⁻³. Methane exhibited a lower value of 2.875 kg CO₂ eq·m⁻³, while LPG and propane showed intermediate values of 3.07 and 3.05 kg CO₂ eq·m⁻³, respectively.
In terms of acidification, biogas reached 0.00516 kg SO₂ eq·m⁻³, followed by LPG (0.00280 kg SO₂ eq·m⁻³), propane (0.00210 kg SO₂ eq·m⁻³), and methane (0.00140 kg SO₂ eq·m⁻³). For photochemical ozone formation, LPG and propane presented the highest impacts, with values of 0.09919 and 0.07440 kg O₃ eq·m⁻³, respectively, while biogas and methane reached 0.05894 and 0.04965 kg O₃ eq·m⁻³ (Table 7).
3.7. Occupational Assessment and Risk Analysis for Biogas Production
The results of the OHSP indicator calculation are summarized in Table 8. The stages of receiving and grinding the filter cake and cleaning and discharging the digestate showed the highest OHSP values, reaching 0.08 and 0.096, respectively. These stages also recorded higher numbers of accidents and lost workdays, with two accidents per year and three lost days in both cases.
Lower OHSP values were obtained for loading the biodigester (0.075) and operating the biodigester (0.048). These stages involved fewer accidents and were characterized by more controlled working conditions, with reduced direct exposure to waste and gaseous emissions. The numerical values for hours worked, accidents, days lost, and OHSP indicators for each process stage are presented in Table 8.
4. Discussion
The diversity of compounds identified in filter cake indicates the complexity of this by-product and its potential for agro-industrial use, including structural fiber, phytosterols, and residual sugars. This variability depends on crop management, sugarcane variety, and technological practices applied during processing [6].
The waste contains a wide variety of organic compounds, including polysaccharides and oligosaccharides, amino acids, long-chain fatty acids, alcohols, and phytosterols. These components determine the structure of the stoichiometric equations and lead mainly to the formation of CH₄ and CO₂ as final products, in agreement with previously reported mass balance-based models for anaerobic digestion [42].
The simulated configuration enables the optimization of substrate proportions and operational conditions to enhance methane production during anaerobic digestion [43]. Mesophilic operation supports process stability and biogas yield by favoring the activity of anaerobic microorganisms [27]. The separation of digestate and biogas streams improves operational control and allows independent handling of solid and gaseous products.
The incorporation of iron(III) oxide in the purification stage allows hydrogen sulfide to be converted into stable sulfide compounds such as Fe₂S₃, reducing corrosive effects and improving biogas quality [44]. This mechanism aligns with adsorption-based purification strategies described for biogas treatment systems [45], ensuring safer handling and greater suitability of the biogas for energy applications.
The use of variable feedstock flows allows the assessment of system behavior under realistic production fluctuations commonly observed in artisanal sugar mills. The application of a ±10 % variation in filter cake availability provides a basis for identifying break-even conditions and the most viable production scenarios, considering seasonal and operational variability in the region [46]. This approach improves the robustness of the simulation by accounting for uncertainties in raw material supply.
The biogas yield obtained in this study is higher than the range of 120–155 m³·t⁻¹, equivalent to 12–15.5%, reported for filter cake digestion in previous studies [35]. This difference can be explained by variations in substrate composition and process assumptions applied during simulation. The chemical characteristics of filter cake, influenced by agroecological conditions, crop type, operational efficiency of the sugar mill, and clarification method, play a determining role in biogas production potential [34]. These factors contribute to the variability observed among reported yields and support the use of simulation approaches to evaluate optimized operating scenarios.
The methane fraction obtained is slightly below the typical range of 40–70% reported for biogas systems [47] but close to the value of 42.47% reported for filter cake digestion [48]. The relatively high CO₂ content is associated with the presence of phytosterols in filter cake, whose anaerobic degradation favors the formation of this gas [49]. The detection of NH₃ indicates protein and amino acid degradation during digestion, while the very low SH₄ concentration is consistent with efficient sulfur removal using metal oxides such as Fe₂O₃, which can remove 70–90% of H₂S [50].
From an energy perspective, lower CO₂ concentrations are associated with improved combustion performance and higher calorific values [51]. Under the simulated conditions, the CH₄ fraction obtained from filter cake was sufficiently high and the CO₂ content remained at moderate levels, allowing the direct use of biogas for heating, heat generation, or combined power applications without requiring an additional CO₂ removal stage.
The higher biogas production observed in Compositions 6, 7, and 8 is influenced by differences in raw material composition. For instance, Composition 8 included a mixture with higher alcohol content, which favors microbial activity during the acidogenic phase and contributes to increased biogas volumes. However, despite the volumetric increase, Figure 5 shows a slight decrease in the molar fraction of methane, while carbon dioxide remained the dominant component, reaching 57.2% in Composition 6. This behavior is associated with the anaerobic degradation of phytosterols and long-chain alcohols, metabolic pathways that generate a higher proportion of CO₂ relative to CH₄ [52].
Although present at low concentrations, hydrogen sulfide affects biogas quality due to its corrosive nature. Its limited presence may be associated with the reduced degradation of sulfur-containing amino acids such as cysteine and methionine in the protein fraction of the substrate. Effective H₂S control in anaerobic processes can be achieved through redox condition adjustment and the use of absorbent agents, improving system stability and reducing operational risks [53].
The calorific value obtained for biogas produced from filter cake supports its technical viability as an alternative energy source for panela production systems. Its energy performance is comparable to that of traditional solid fuels commonly used in sugar mills, such as bagasse and Eucalyptus globulus wood, whose heating values have been widely reported in the literature [31,32]. Based on this energy equivalence, the use of 1 m³ of biogas is equivalent to replacing approximately 0.96 kg of wood or 1.85–1.91 kg of bagasse, depending on biogas composition (Table 6).
When extrapolated to continuous annual operation, the estimated biomass savings reach 631.08 t·year⁻¹, corresponding to the conservation of 3.63 ha·year⁻¹ of Amazon rainforest or approximately 902 trees·year⁻¹. This ecological equivalence was established using reference values for aboveground biomass density and average individual tree biomass reported for Amazonian forests [33], providing an environmental interpretation of the energy substitution achieved.
The magnitude of biomass displacement obtained in this study exceeds that reported for domestic biodigester systems, where average savings of 1,856.78 kg of wood·year⁻¹ per installed unit have been documented, equivalent to 0.011 ha·year⁻¹ of preserved forest [54]. This difference is primarily associated with the operational scale of the system, as household biodigesters are designed to supply individual families, whereas the present evaluation considers higher volumes of filter cake generated in artisanal sugar mills.
The estimated wood savings are also consistent with findings from high-altitude rural communities, where biogas systems with methane contents ranging from 35 to 60% have been shown to replace up to 75% of daily firewood consumption, with reported savings of 0.1–0.4 kg per person per day, equivalent to approximately 1 m³ of biogas·person⁻¹·day⁻¹ [55]. This consistency supports the robustness of the simulated results under different geographic and socio-productive contexts.
In addition to energy substitution, replacing the direct combustion of wood and bagasse with biogas contributes to a reduction in emissions of particulate matter, carbon monoxide, and volatile organic compounds, thereby decreasing exposure to pollutants in artisanal heating environments [56]. Furthermore, the diversion of bagasse traditionally used as fuel enables its use as a low-impact agro-industrial input for applications such as composting, artisanal paper production, and lignocellulosic board manufacturing, reinforcing circular resource use and reducing pressure on forest biomass [57,58].
The higher climate change impact observed for biogas is associated with its lower methane concentration and the presence of unburned CH₄ and biogenic CO₂ in its composition. Methane leakage during production and handling plays a critical role, as leakage rates exceeding 2% can offset the climate benefits of biogas when compared with natural gas [59].
Natural gas shows a lower climate impact due to its high purity, with methane concentrations close to 98%, which favors more efficient combustion and lower emissions per unit of useful energy delivered [60]. In contrast, LPG and propane exhibit intermediate climate impacts, reflecting their fossil origin and combustion characteristics.
The acidification potential of biogas is mainly related to the presence of hydrogen sulfide. During anaerobic digestion, a significant fraction of sulfur contained in the substrate can be converted into H₂S, which, if not adequately removed, dominates the acidification profile of biogas systems [61]. This highlights the importance of effective gas purification prior to utilization.
The higher contribution of LPG and propane to photochemical ozone formation is linked to emissions of nitrogen oxides and volatile organic compounds during combustion and handling. These emissions favor tropospheric ozone formation and explain the higher smog-related impacts observed for these fuels [62]. Overall, the comparison shows that although biogas presents higher impacts in certain categories, its renewable origin and potential for emission mitigation through improved control strategies support its role as a sustainable alternative to fossil gaseous fuels.
The higher OHSP values observed during filter cake reception and digestate cleaning are associated with increased exposure to physical, chemical, and biological hazards, including wet waste handling, hydrogen sulfide and ammonia emissions, noise, and elevated temperatures. These stages represent critical points for occupational risk management in biogas production systems. Incorporating occupational indicators into S-LCA frameworks allows environmental performance to be linked with worker health and safety, identifying biomass handling and waste gas management as priority stages [63].
The identification of ATEX hazardous areas is essential for reducing accident risks related to methane and hydrogen sulfide leaks or accumulations in biogas facilities [64]. In this context, the digestate cleaning and discharge stage presents elevated risk due to the simultaneous presence of toxic vapors and thermal stress. Effective risk reduction requires integrated preventive strategies that combine regulatory compliance, organizational measures, and worker training, supported by appropriate personal protective equipment, adequate ventilation, and clear safety signage [65]. The use of respirators with acid gas filters, waterproof gloves, and insulated protective clothing contributes to minimizing exposure and improving occupational safety during high-risk operations.
5. Conclusions
The energy use of filter cake through anaerobic digestion is a viable option for the artisanal sugarcane industry in the province of Pastaza. Composition 6 performed best in the process, with biogas production of up to 1,736.40 m³·day⁻¹ and methane fractions close to 40.7%. This level enables the partial replacement of wood and bagasse used as fuels and is associated with an approximate annual reduction of 631.08 t·year⁻¹ of solid biomass, equivalent to the conservation of around 3.63 ha·year⁻¹ of Amazon rainforest or about 902 trees per year. The environmental analysis showed that the sustainable performance of the system depends on controlling methane leaks and removing H₂S to reduce contributions to climate change and acidification, while the social assessment identified greater occupational risks in the stages of receiving the filter cake and cleaning the digestate.
Author Contributions
Conceptualization, A.P.M. and K.D.S.; methodology, J.P.P.and K.D.S.; software, R.D.V.P. and L.P.P.; validation, J.P.P. and E.G.Y.; formal analysis, R.D.V.P. and E.G.Y.; investigation, R.D.V.P. and J.P.P.; resources, L.P.P. and D.S.G.; data curation, D.S.G. and K.D.S.; writ-ing—original draft preparation, R.D.V.P. and L.P.P.; writing—review and editing, E.G.Y. and A.P.M.; visualization, E.G.Y. and D.S.G.; supervision, A.P.M.; project administration, A.P.M.; funding acquisition, A.P.M. and L.P.P.; All authors have read and agreed to the published version of the manuscript.
Funding
The APC was funded by Universidad Estatal Amazónica”.
Institutional Review Board Statement
Not applicable.
Informed Consent Statement
Not applicable.
Data Availability Statement
All the data generated in the research is in the manuscript.
Acknowledgments
The authors would like to thank Dr. Gerardo J. Ruiz-Mercado at the U.S. Environmental Protection Agency for his suggestions and guidance in preparing the article, and Helen Pugh for proofreading the article.
Conflicts of Interest
The authors declare no conflicts of interest.
References
- FAO. (2022). OECD-FAO Agricultural Outlook 2022-2031. In (Vol. 1 Edition, pp. 180-193). OECD/FAO. https://www.fao.org/3/CC0308EN/Sugar.pdf.
- Ungureanu, N., Vlăduț, V., & Biriș, S.-Ș. Sustainable Valorization of Waste and By-Products from Sugarcane Processing. Sustainability, vol. 14(17), 11089, 2022. [CrossRef]
- Hiranobe, C. T., Gomes, A. S., Paiva, F. F. G., Tolosa, G. R., Paim, L. L., Dognani, G., Cardim, G. P., Cardim, H. P., dos Santos, R. J., & Cabrera, F. C. Sugarcane Bagasse: Challenges and Opportunities for Waste Recycling. Clean Technologies, vol. 6(2), 662-699, 2024. [CrossRef]
- Jugwanth, Y., Sewsynker-Sukai, Y., & Gueguim Kana, E. B. Valorization of sugarcane bagasse for bioethanol production through simultaneous saccharification and fermentation: Optimization and kinetic studies. Fuel, vol. 262, 116552, 2020. [CrossRef]
- Ochoa, P., Cabello, J., Sagastume, A., Hens, L., & Vandecasteele, C. Residue from Sugarcane Juice Filtration (Filter Cake): Energy Use at the Sugar Factory. Waste and Biomass Valorization, vol. 1, 407–413, 2010. [CrossRef]
- Santos, F., Eichler, P., Machado, G., De Mattia, J., & De Souza, G. (2020). Chapter 2 - By-products of the sugarcane industry. In F. Santos, S. C. Rabelo, M. De Matos, and P. Eichler (Eds.), Sugarcane Biorefinery, Technology and Perspectives (pp. 21-48). Academic Press. [CrossRef]
- Carvajal-Padilla, V. P., Ambuludi-Paredes, R. R., Chele-Yumbo, E. A., Sarduy-Pereira, L. B., & Diéguez-Santana, K. Alternativas de producción más limpias para la destilería “Puro Puyo”, Pastaza, Ecuador. Revista de I+D Tecnológico, vol. Vol. 17 Núm. 1 5-13, 2021. [CrossRef]
- Sánchez, A., Rivera, C., & Murrillo, E. Perspectivas de uso de subproductos agroindustriales para la produccción de bioetanol. Scientia et technica, vol. Vol 17, Num 46, 232-235, 2010. http://www.redalyc.org/articulo.oa?id=84920977043.
- Chaile, A. P., Uboldi, M. E., & Elsa Ferreyra, M. M. Tratamiento químico de vinaza de caña de azúcar con peróxido de hidrógeno. Revista de Ciencias Ambientales, vol. 59(1), 1-19, 2024. [CrossRef]
- Ibarra Guevara, R. M., Barrientos Fuentes, J. C., & Gómez Guerrero, W. A. Technical, economic, social, and environmental implications of the organic panela production in Nocaima, Colombia: The ASOPROPANOC case. Agronomía Colombiana, vol. 41(1), 1-13, 2023. [CrossRef]
- Tauta Muñoz, J. L., Huertas Carranza, B., Carrillo Cortés, Y. P., & Arias Rodríguez, L. A. Comprehensive characterization of high Andean sugarcane production systems (Saccharum officinarum) for panela production in Colombia. Revista Ceres, vol. 71(e71036), 2024.
- González Rivera, V., Albán Galárraga, M. J., Casco Guerrero, E. C., & Hidalgo Guerrero, I. Critical analysis of the environmental impacts generated by the sugar cane agroindustry in the province of Pastaza - Ecuadorian Amazon. ConcienciaDigital, vol. 7(3), 6-25, 2024. [CrossRef]
- Bao, K., Bieber, L.-M., Kürpick, S., Radanielina, M. H., Padsala, R., Thrän, D., & Schröter, B. Bottom-up assessment of local agriculture, forestry and urban waste potentials towards energy autonomy of isolated regions: Example of Réunion. Energy for Sustainable Development, vol. 66, 125-139, 2022. [CrossRef]
- Simeonov, I., Chorukova, E., & Kabaivanova, L. Two-Stage Anaerobic Digestion for Green Energy Production: A Review. Processes, vol. 13(2), 2025. [CrossRef]
- García-Alvarez, E., Monteagudo-Yanes, J. P., & Gómez-Sarduy, J. R. Modelo con algoritmo genético para el diseño óptimo de una planta de producción de biogás a partir de cachaza. ICIDCA. Sobre los Derivados de la Caña de Azúcar, vol. 49(3), 51-54, 2015. https://www.redalyc.org/articulo.oa?id=223144218011.
- Cepero Rodriguez, O., & Meneses Martin, Z. (2021). Construcción de plantas de biogás en comunidades rurales. Construction of biogas plants in rural communities. In (Vol. 1, pp. 76). Editorial Academica Española. https://www.diderich.lu/fr/livres/9786203882322/construccion-de-plantas-de-biogas-en-comunidades-rurales.
- Salazar, M., Zambrano, S., Salabarría, J., & Delgado Villafuerte, C. Evaluación de la producción de metano de vinazas mediante digestor anaerobio tipo batch. Revista Iberoamericana Ambiente & Sustentabilidad, vol. 2, 79-80, 2019. [CrossRef]
- Aghel, B., Behaein, S., & Alobaid, F. CO2 capture from biogas by biomass-based adsorbents: A review. Fuel, vol. 328, 125276, 2022. [CrossRef]
- Ferreira, S., Monteiro, E., Brito, P., & Vilarinho, C. A Holistic Review on Biomass Gasification Modified Equilibrium Models. Energies, vol. 12(1), 2019. [CrossRef]
- Pérez-Sánchez, A., Sánchez, E. J. P., & Segura Silva, R. M. Simulation of the styrene production process via catalytic dehydrogenation of ethylbenzene using CHEMCAD® process simulator. Tecnura, vol. 21(53), 15-31, 2017.
- Wu, T., Gong, M., & Xiao, J. Preliminary sensitivity study on an life cycle assessment (LCA) tool via assessing a hybrid timber building. Journal of Bioresources and Bioproducts, vol. 5(2), 108-113, 2020. [CrossRef]
- Bare, J. TRACI 2.0: the tool for the reduction and assessment of chemical and other environmental impacts 2.0. Clean Technologies and Environmental Policy, vol. 13(5), 687-696, 2011. [CrossRef]
- Valle, S. B., Yaguache, B. D., Caicedo, W. O., Toscano, J. F., Yucailla, D. M., & Abril, R. V. Caracterización socioeconómica y productiva de los cañicultores de la provincia Pastaza, Ecuador. Cuban Journal of Agricultural Science, vol. 55(2), 2021. http://scielo.sld.cu/scielo.php?script=sci_arttext&pid=S2079-34802021000200004&lng=es&tlng=es.
- Gálvez, L., Cabello, A., & Villamil, G. (2002). Manual de los derivados de la caña de azúcar. In I. C. d. I. d. l. D. d. l. C. d. Azucar (Ed.), (Vol. Tercera Edición (inglés, español y portugués), pp. 421). ICIDCA,.
- Aguilar, N., Rodríguez, D., & Castillo, A. Azúcar, coproductos y subproductos en la diversificación de la agroindustria de la caña de azúcar. Revista VIRTUALPRO vol. 106(11), 1-28, 2010. https://www.virtualpro.co/biblioteca/azucar-coproductos-y-subproductos-en-la-diversificacion-de-la-agroindustria-de-la-cana-de-azucar#comocitar.
- Martínez, R., Castro, I., & Oliveros, M. Characterization of Products from Sugar Cane Mud. Revista de la Sociedad Química de México, vol. 46(1), 64-66, 2002. http://www.scielo.org.mx/scielo.php?script=sci_arttext&pid=S0583-76932002000100011&lng=es.
- Singh, B., Szamosi, Z., & Siménfalvi, Z. Impact of mixing intensity and duration on biogas production in an anaerobic digester: a review. Critical Reviews in Biotechnology, vol. 40(4), 508-521, 2020. [CrossRef]
- Valle, S. B., Yaguache, B. D., Caicedo, W. O., Toscano, J. F., Yucailla, D. M., & Abril, R. V. Socio-economic and productive characterization of sugarcane farmers in Pastaza province, Ecuador. Cuban Journal of Agricultural Science, vol. 55, 1-7, 2021. https://www.redalyc.org/journal/6537/653769345004/.
- Cerda-Mejia, V., Yordi, E., Cerda Mejía, G., Vinocunga-Pillajo, R. D., Perez, A., & González, E. Procedure for the determination of operation and design parameters considering the quality of non-centrifugal cane sugar. Entre Ciencia e Ingeniería, vol. 16 (31), 43-50, 2022. [CrossRef]
- Szwaja, S., Tutak, W., Grab-Rogaliński, K., Jamrozik, A., & Kociszewski, A. Selected combustion parameters of biogas at elevated pressure-temperature conditions. Silniki Spalinowe, vol. 51(1), 40-47, 2012. http://www.combustion-engines.eu/numbers/5/228.
- Telmo, C., & Lousada, J. Heating values of wood pellets from different species. Biomass and Bioenergy, vol. 35(7), 2634-2639, 2011. [CrossRef]
- Kumar, R., Kumar, M., & Amit, R. K. An Experimental Study to Evaluate the Calorific Values of Bagasse after Solar Cabinet Drying. International Journal on Recent Innovation Trends in Computing Communication, vol. Vol. 4, No. 6, 239-241, 2016.
- Ometto, J. P., Gorgens, E. B., de Souza Pereira, F. R., Sato, L., de Assis, M. L. R., Cantinho, R., Longo, M., Jacon, A. D., & Keller, M. A biomass map of the Brazilian Amazon from multisource remote sensing. Scientific Data, vol. 10(1), 668, 2023. [CrossRef]
- Bernal, R., López, L., Ríos Obregón, J., Jiménez, J., García, Y., & Arteaga, Y. Thermoalkaline pretreatment influence on anaerobic biodegradability of filter cake for methane production. MOL2NET, vol. 3, 1-7, 2017.
- Janke, L., Leite, A., Nikolausz, M., Schmidt, T., Liebetrau, J., Nelles, M., & Stinner, W. Biogas production from sugarcane waste: assessment on kinetic challenges for process designing. International Journal of Molecular Sciences, vol. 16(9), 20685-20703, 2015. [CrossRef]
- Acurex Environmental Corporation. Emission Factor Documentation for AP-42 Section 1.5: Liquified Petroleum Gas Combustion. U.S. Environmental Protection Agency, Office of Air Quality Planning and Standards. https://www.epa.gov/sites/default/files/2020-09/documents/emission_factor_documentation_for_ap42_section_1.5_liquified_petroleum_gas.pdf (29 october 2025).
- Environmental Protection Agency. AP-42 Section 1.4: Natural Gas Combustion. U.S. Environmental Protection Agency. https://www.epa.gov/sites/default/files/2020-09/documents/1.4_natural_gas_combustion.pdf (29 october 2025).
- The Climate Registry. 2023 Default Emission Factors. The Climate Registry. https://theclimateregistry.org/wp-content/uploads/2023/06/2023-Default-Emission-Factors-Final.pdf (29 october 2025).
- Tsalidis, G. A. Introducing the Occupational Health and Safety Potential Midpoint Impact Indicator in Social Life Cycle Assessment. Sustainability, vol. 16(9), 2024. [CrossRef]
- International Labour Organization. Indicators and data tools. https://ilostat.ilo.org/data/ (29 october 2025).
- Instituto Cubano de Investigaciones de los Derivados de la Caña de Azúcar. (2000). Manual de los Derivados de la Caña de Azúcar. Instituto Cubano de Investigaciones de los Derivados de la Caña de Azúcar. https://www.academia.edu/10912163/MANUAL_DE_LOS_DERIVADOS_DE_LA_CA%C3%91A?auto=download.
- Barahmand, Z., & Samarakoon, G. Sensitivity Analysis and Anaerobic Digestion Modeling: A Scoping Review. Fermentation, vol. 8(11), 2022. [CrossRef]
- Wongarmat, W., Sittijunda, S., Imai, T., & Reungsang, A. Co-digestion of filter cake, biogas effluent, and anaerobic sludge for hydrogen and methane production: Optimizing energy recovery through two-stage anaerobic digestion. Carbon Resources Conversion, vol. 8(2), 100248, 2025. [CrossRef]
- Costa, C., Cornacchia, M., Pagliero, M., Fabiano, B., Vocciante, M., & Reverberi, A. P. Hydrogen Sulfide Adsorption by Iron Oxides and Their Polymer Composites: A Case-Study Application to Biogas Purification. Materials, vol. 13(21), 4725, 2020. [CrossRef]
- Ciahotný, K., & Kyselová, V. Hydrogen Sulfide Removal from Biogas Using Carbon Impregnated with Oxidants. Energy & Fuels, vol. 33(6), 5316-5321, 2019. [CrossRef]
- Lara-Haro, D. M., Argothy-Almeida, L. A., Martínez-Mesias, J. P., & Mejía-Chávez, M. A. El impacto de las crisis en el desempeño del sector agropecuario del Ecuador. Revista Finanzas y Política Económica, vol. 14(1), 167-186, 2022. [CrossRef]
- Cepero, L., Savran, V., Blanco, D., Díaz, M., Suárez, J., & Palacios, A. Producción de biogás y bioabonos a partir de efluentes de biodigestores. Pastos y Forrajes, vol. 35(2), 219-226, 2012. http://www.redalyc.org/articulo.oa?id=269125071009.
- Talha, Z., Hamid, A., Ding, W., & Osman, B. H. Biogas Production from Filter Mud in (CSTR) Reactor, Co-digested with Various Substrates (Wastes). Agricultural Environmental Sciences Journal, vol. 1(1), 15-24, 2017.
- Werkneh, A. A. Biogas impurities: environmental and health implications, removal technologies and future perspectives. Heliyon, vol. 8(10), e10929, 2022. [CrossRef]
- Dauknys, R., & Mažeikienė, A. Process Improvement of Biogas Production from Sewage Sludge Applying Iron Oxides-Based Additives. Energies, vol. 16(7), 3285, 2023. [CrossRef]
- Wang, H., Xu, J., Sheng, L., Liu, X., Zong, M., & Yao, D. J. E. Anaerobic Digestion Technology for Methane Production Using Deer Manure Under Different Experimental Conditions. Energies, vol. 12(9), 1819, 2019.
- Weckerle, T., Ewald, H., Guth, P., Knorr, K. H., Philipp, B., & Holert, J. Biogas digestate as a sustainable phytosterol source for biotechnological cascade valorization. Microb Biotechnol, vol. 16(2), 337-349, 2023. [CrossRef]
- Vu, H. P., Nguyen, L. N., Wang, Q., Ngo, H. H., Liu, Q., Zhang, X., & Nghiem, L. D. Hydrogen sulphide management in anaerobic digestion: A critical review on input control, process regulation, and post-treatment. Bioresource Technology, vol. 346, 126634, 2022. [CrossRef]
- Kefalew, T., Tilinti, B., & Betemariyam, M. The potential of biogas technology in fuelwood saving and carbon emission reduction in Central Rift Valley, Ethiopia. Heliyon, vol. 7(9), 2021. [CrossRef]
- Gross, T., Zahnd, A., Adhikari, S., Kaphre, A., Sharma, S., Baral, B., Kumar, S., & Hugi, C. Potential of biogas production to reduce firewood consumption in remote high-elevation Himalayan communities in Nepal [10.1051/rees/2017021]. Renew. Energy Environ. Sustain., vol. 2, 6, 2017. [CrossRef]
- Pillarisetti, A., Ye, W., & Chowdhury, S. Indoor Air Pollution and Health: Bridging Perspectives from Developing and Developed Countries. Annual Review of Environment and Resources, vol. 47(Volume 47, 2022), 197-229, 2022. [CrossRef]
- da Silva Aires, F. I., Freitas, I. S., dos Santos, K. M., da Silva Vieira, R., Nascimento Dari, D., Junior, P. G. d. S., Serafim, L. F., Menezes Ferreira, A. Á., Galvão da Silva, C., da Silva, É. D. L., Andrea Sindeaux de Oliveira, L., Maria Santiago de Castro, L., Araújo Oliveira, L., Barroso dos Santos, M. T., Hebert da Silva Felix, J., da Silva Sousa, P., Simão Neto, F., & Sousa dos Santos, J. C. Sugarcane Bagasse as a Renewable Energy Resource: A Bibliometric Analysis of Global Research Trends. ACS Sustainable Resource Management, vol. 2(8), 1551-1561, 2025. [CrossRef]
- Hassa, W., Fiala, K., Apiraksakorn, J., & Leesing, R. Sugarcane bagasse valorization through integrated process for single cell oil, sulfonated carbon-based catalyst and biodiesel co-production. Carbon Resources Conversion, vol. 8(2), 100245, 2025. [CrossRef]
- Bakkaloglu, S., & Hawkes, A. A comparative study of biogas and biomethane with natural gas and hydrogen alternatives [10.1039/D3EE02516K]. Energy & Environmental Science, vol. 17(4), 1482-1496, 2024. [CrossRef]
- Kolb, S., Plankenbühler, T., Hofmann, K., Bergerson, J., & Karl, J. Life cycle greenhouse gas emissions of renewable gas technologies: A comparative review. Renewable and Sustainable Energy Reviews, vol. 146, 111147, 2021. [CrossRef]
- Travis, K. R., Nault, B. A., Crawford, J. H., Bates, K. H., Blake, D. R., Cohen, R. C., Fried, A., Hall, S. R., Huey, L. G., Lee, Y. R., Meinardi, S., Min, K. E., Simpson, I. J., & Ullman, K. Impact of improved representation of volatile organic compound emissions and production of NOx reservoirs on modeled urban ozone production. Atmos. Chem. Phys., vol. 24(16), 9555-9572, 2024. [CrossRef]
- Tian, G., Yeung, M., & Xi, J. H2S Emission and Microbial Community of Chicken Manure and Vegetable Waste in Anaerobic Digestion: A Comparative Study. Fermentation, vol. 9(2), 169, 2023. [CrossRef]
- Jayawickrama, K., Ruparathna, R., Seth, R., Biswas, N., Hafez, H., & Tam, E. Challenges and Issues of Life Cycle Assessment of Anaerobic Digestion of Organic Waste. Environments, vol. 11(10), 217, 2024. [CrossRef]
- Abanades, S., Abbaspour, H., Ahmadi, A., Das, B., Ehyaei, M. A., Esmaeilion, F., El Haj Assad, M., Hajilounezhad, T., Jamali, D. H., Hmida, A., Ozgoli, H. A., Safari, S., AlShabi, M., & Bani-Hani, E. H. A critical review of biogas production and usage with legislations framework across the globe. International Journal of Environmental Science and Technology, vol. 19(4), 3377-3400, 2022. [CrossRef]
- Hegazy, H., Saady, N. M. C., & Zendehboudi, S. Safety in biogas plants: An analysis based on international standards and best practices. Process Safety and Environmental Protection, vol. 200, 107390, 2025. [CrossRef]
Figure 1.
Heuristic diagram of the research methodology.
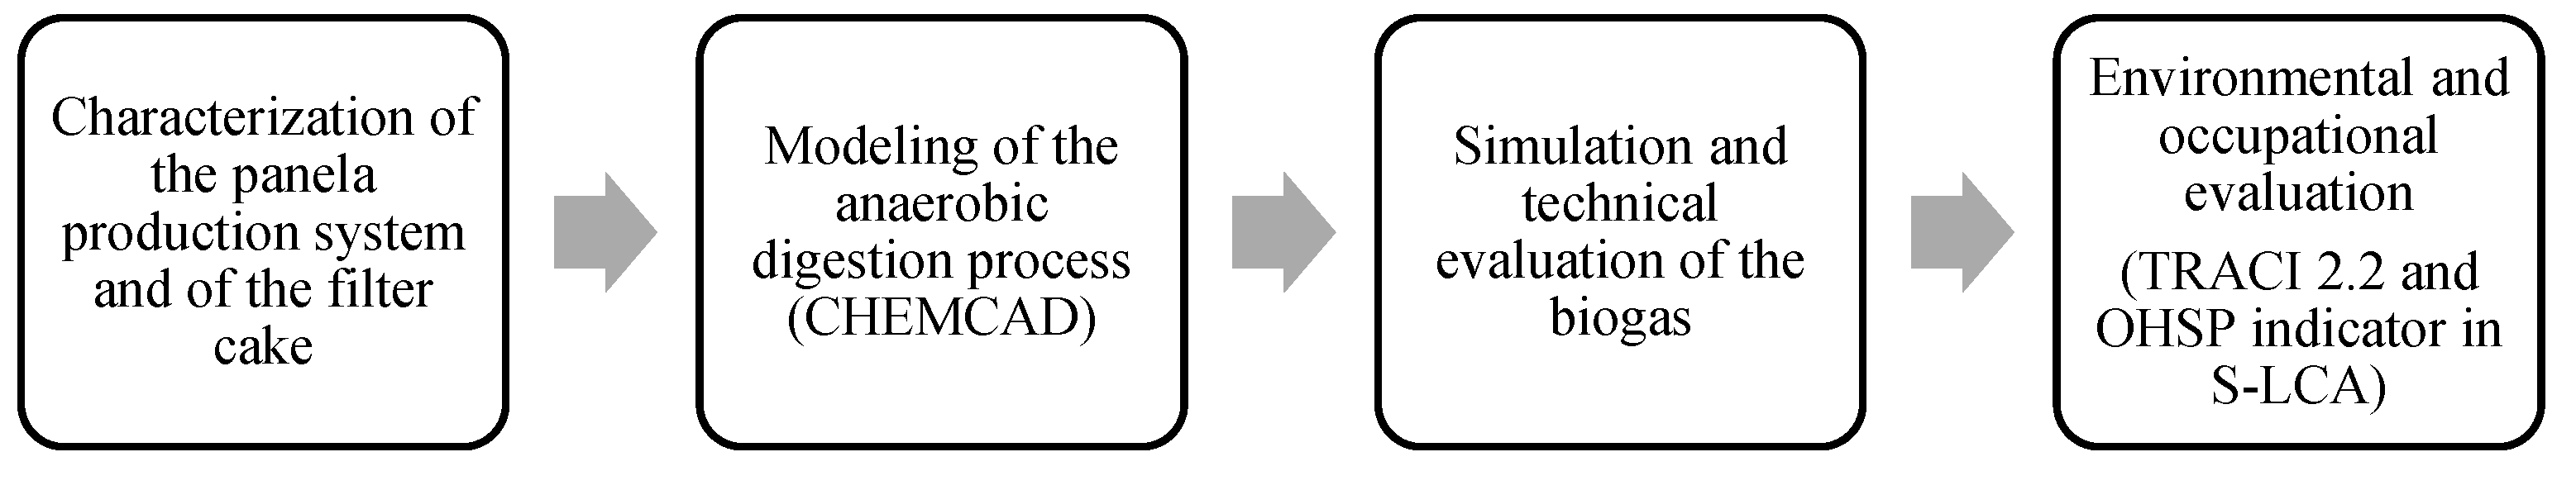
Figure 2.
Technological diagram concerning biogas production.
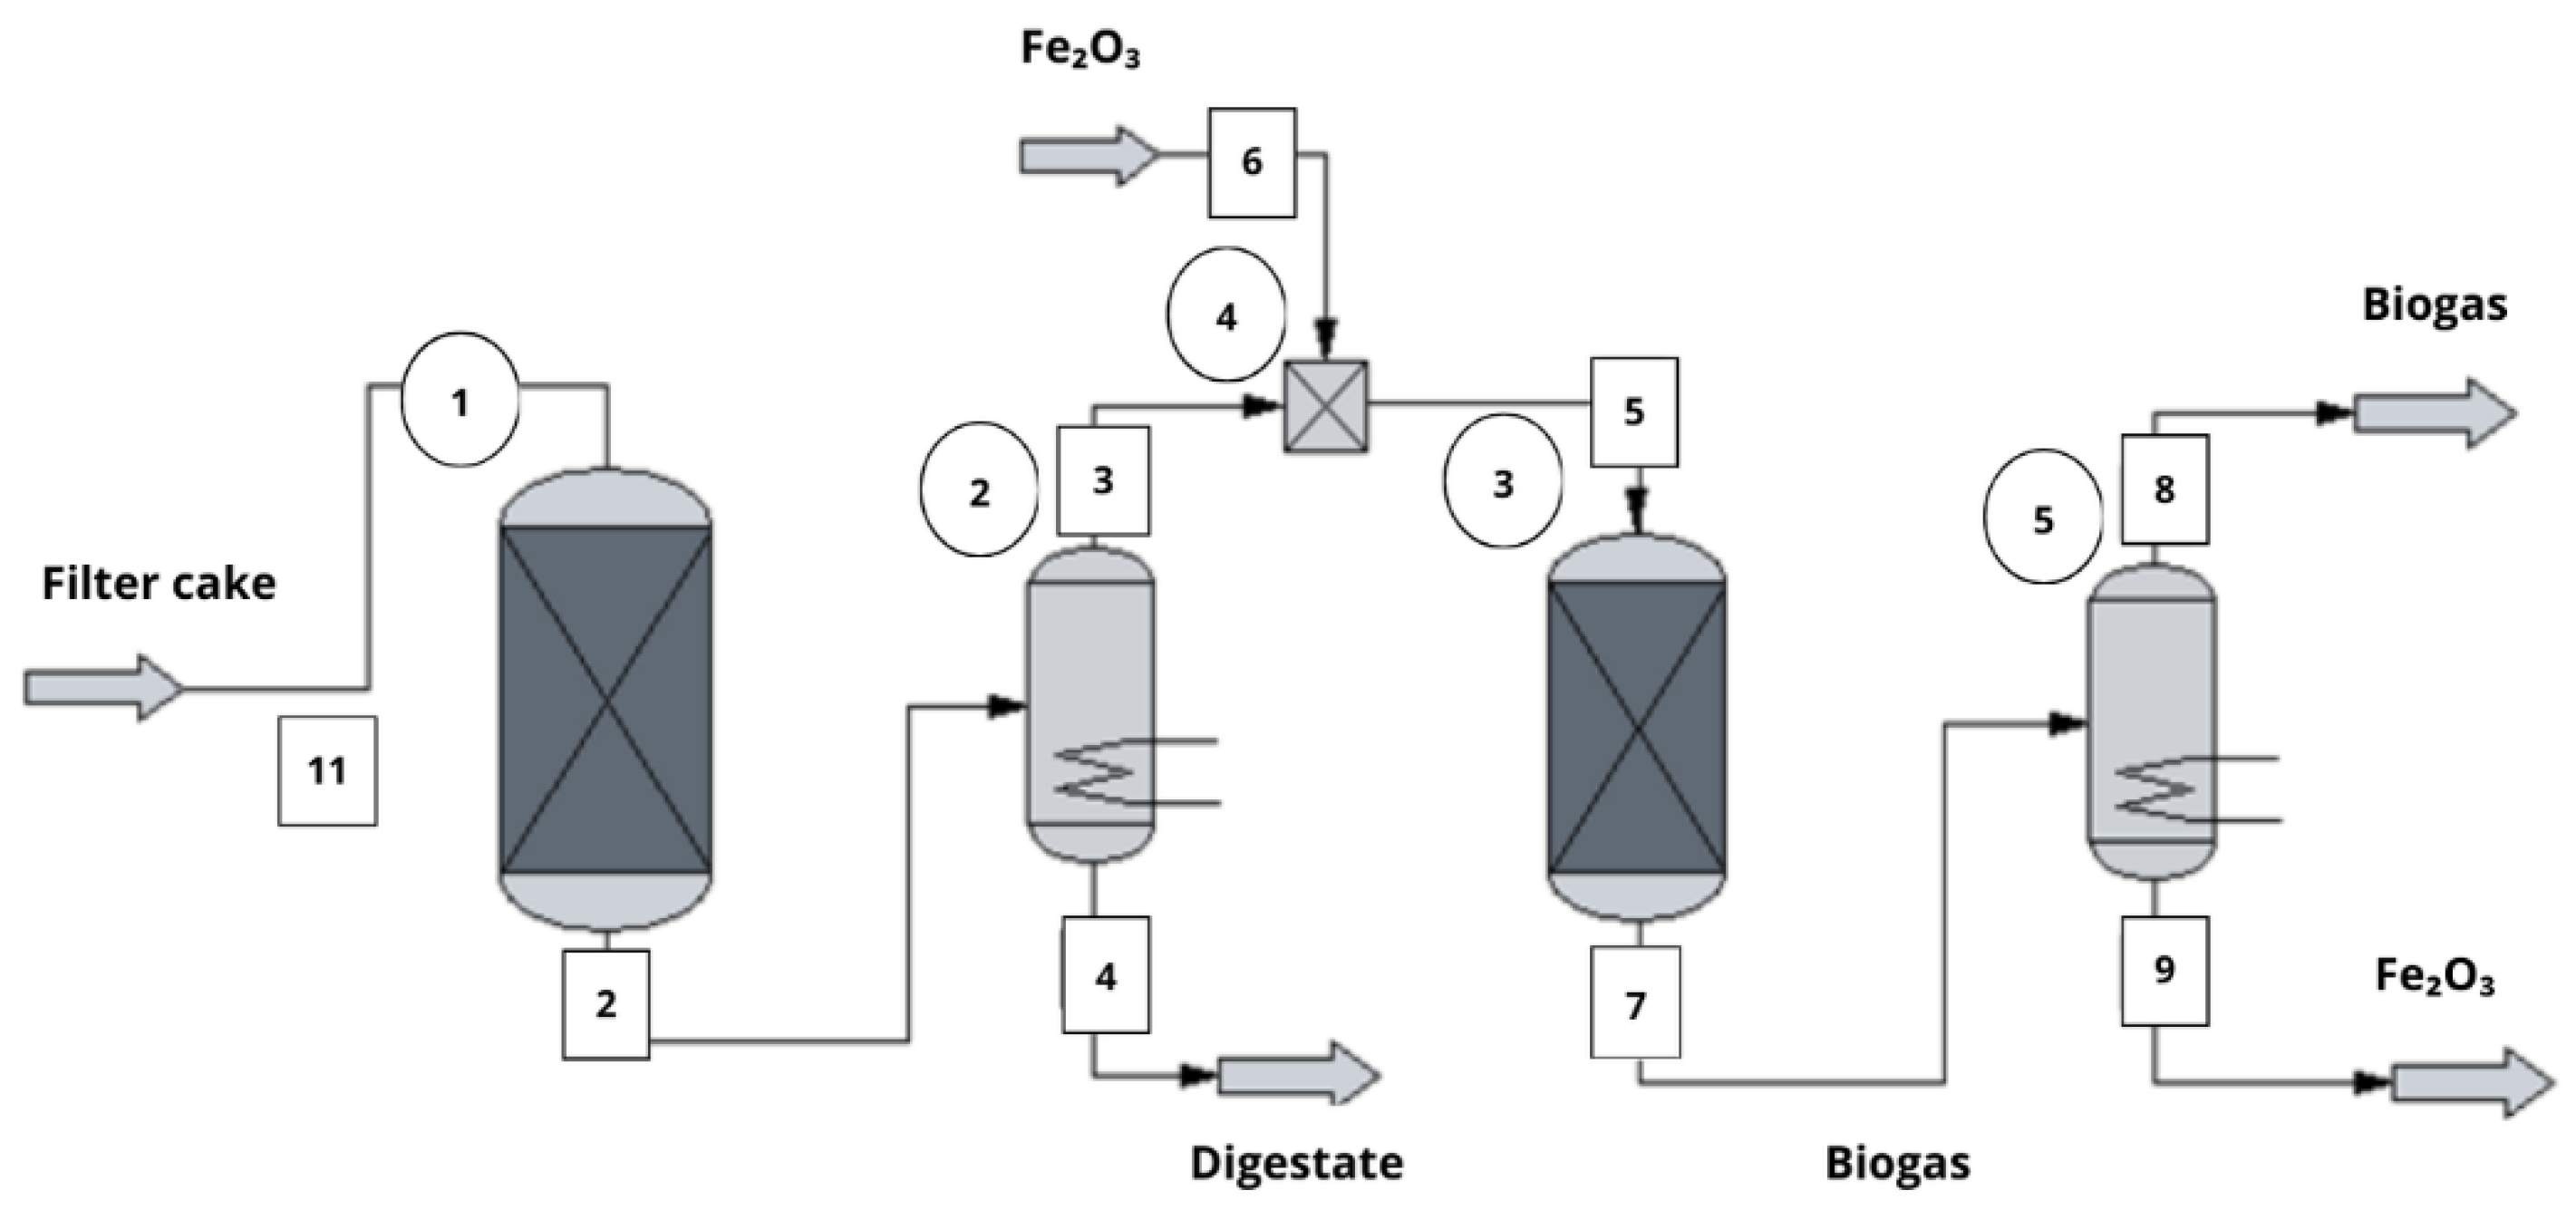
Figure 3.
(a) Production of biogas, methane, and carbon dioxide; (b) Production of ammonia and hydrogen sulfide.
Figure 3.
(a) Production of biogas, methane, and carbon dioxide; (b) Production of ammonia and hydrogen sulfide.
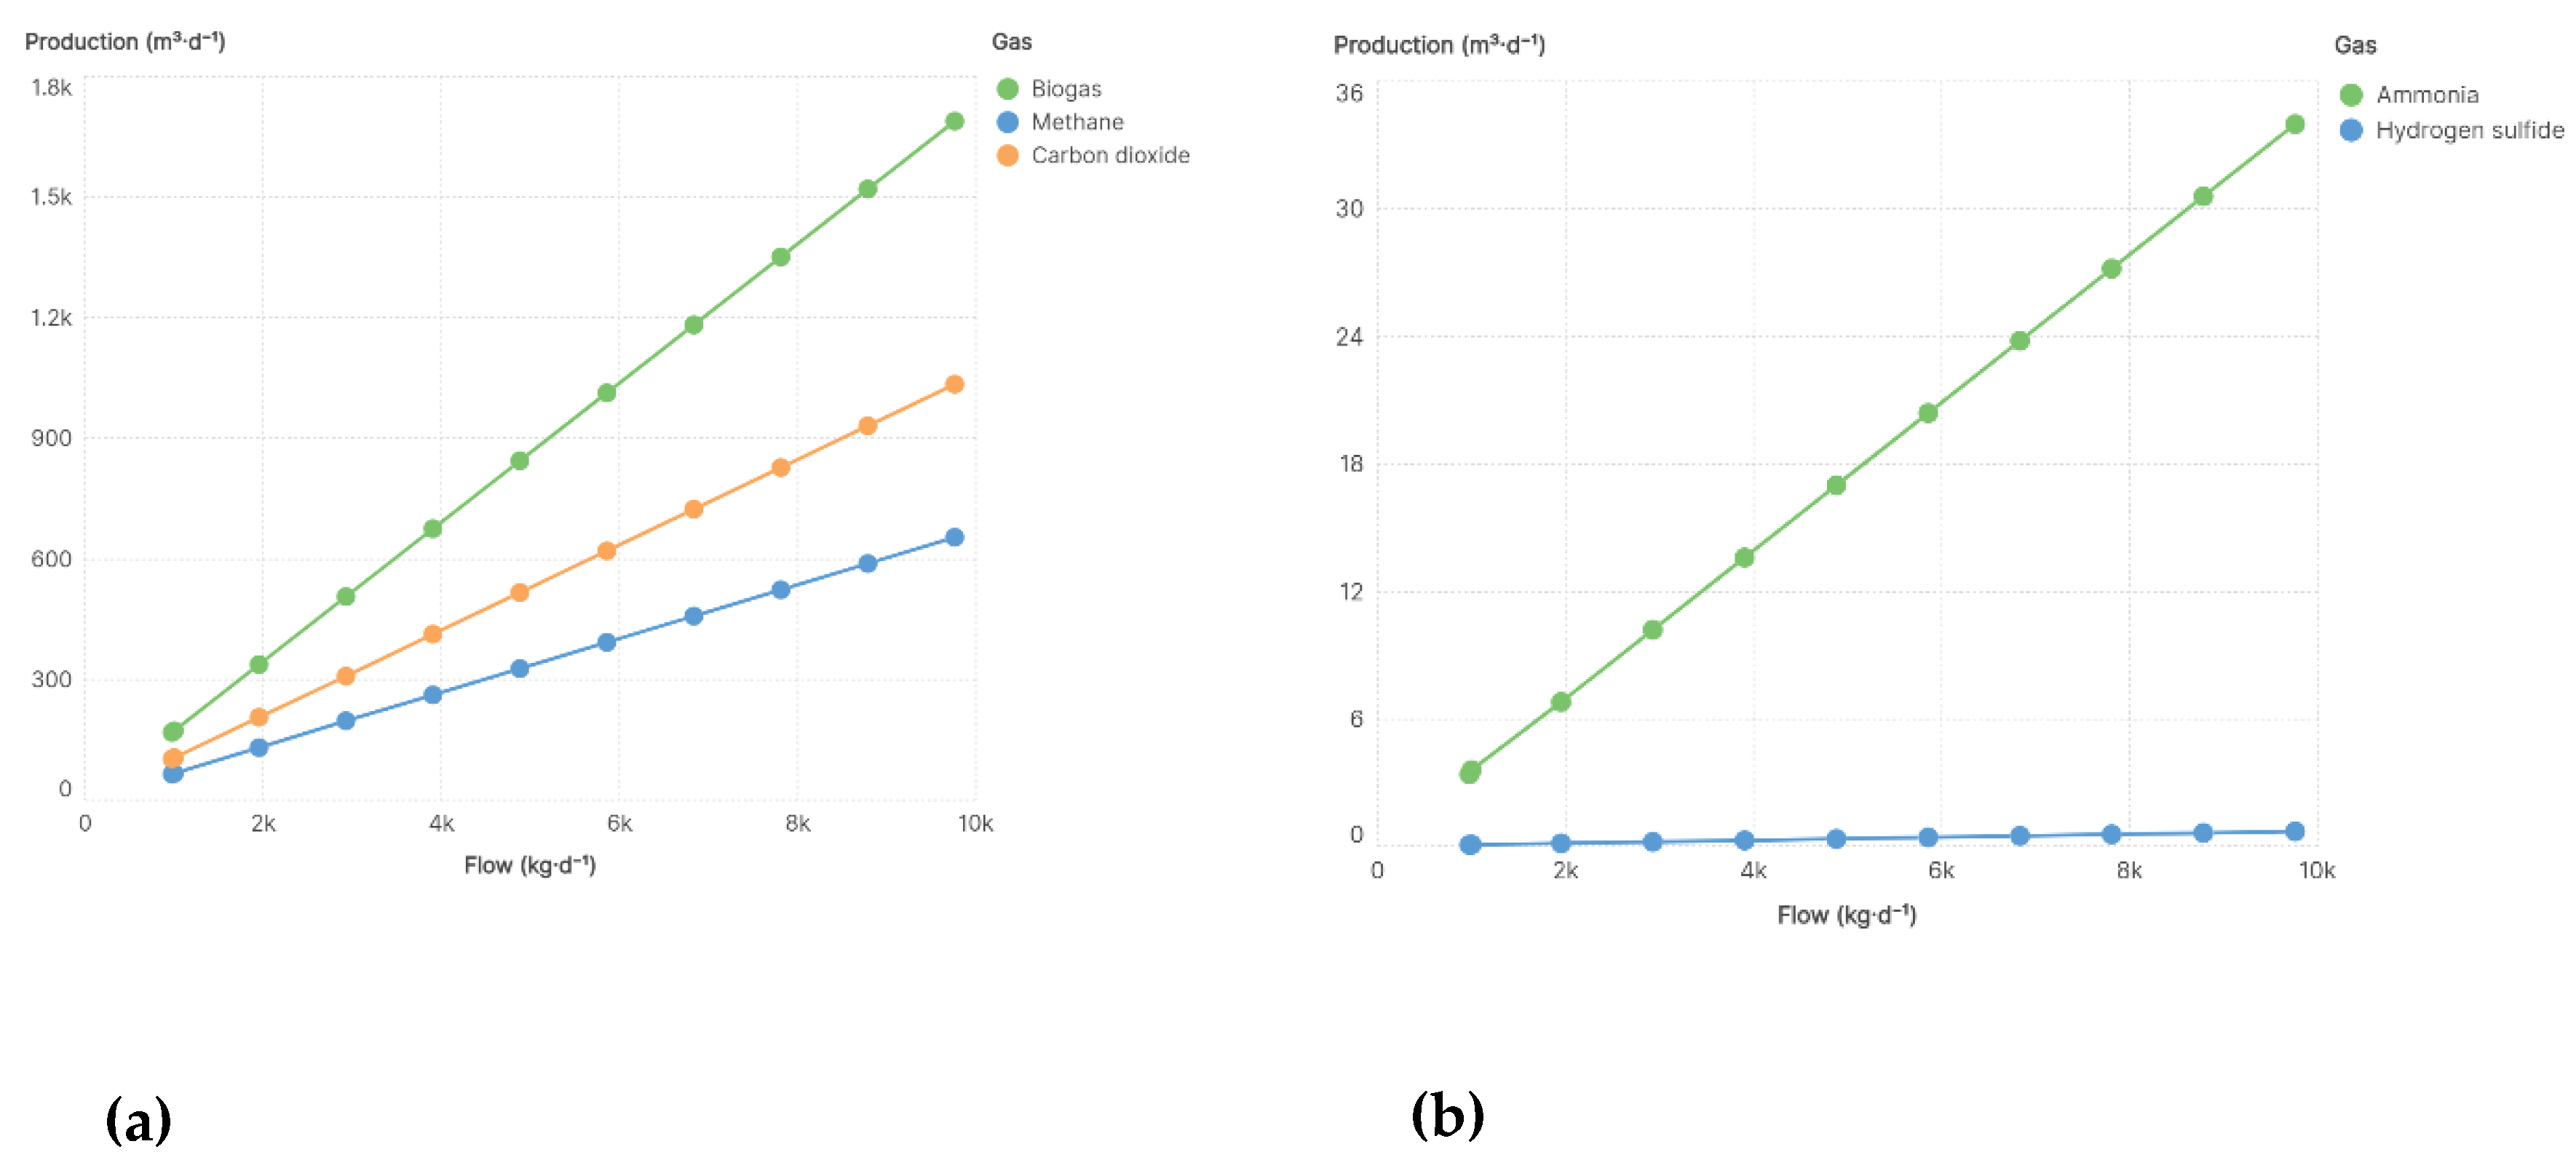
Figure 4.
Biogas production in Pastaza. AVG = Average value, Base comp. = Base composition, Comp. = composition.
Figure 4.
Biogas production in Pastaza. AVG = Average value, Base comp. = Base composition, Comp. = composition.
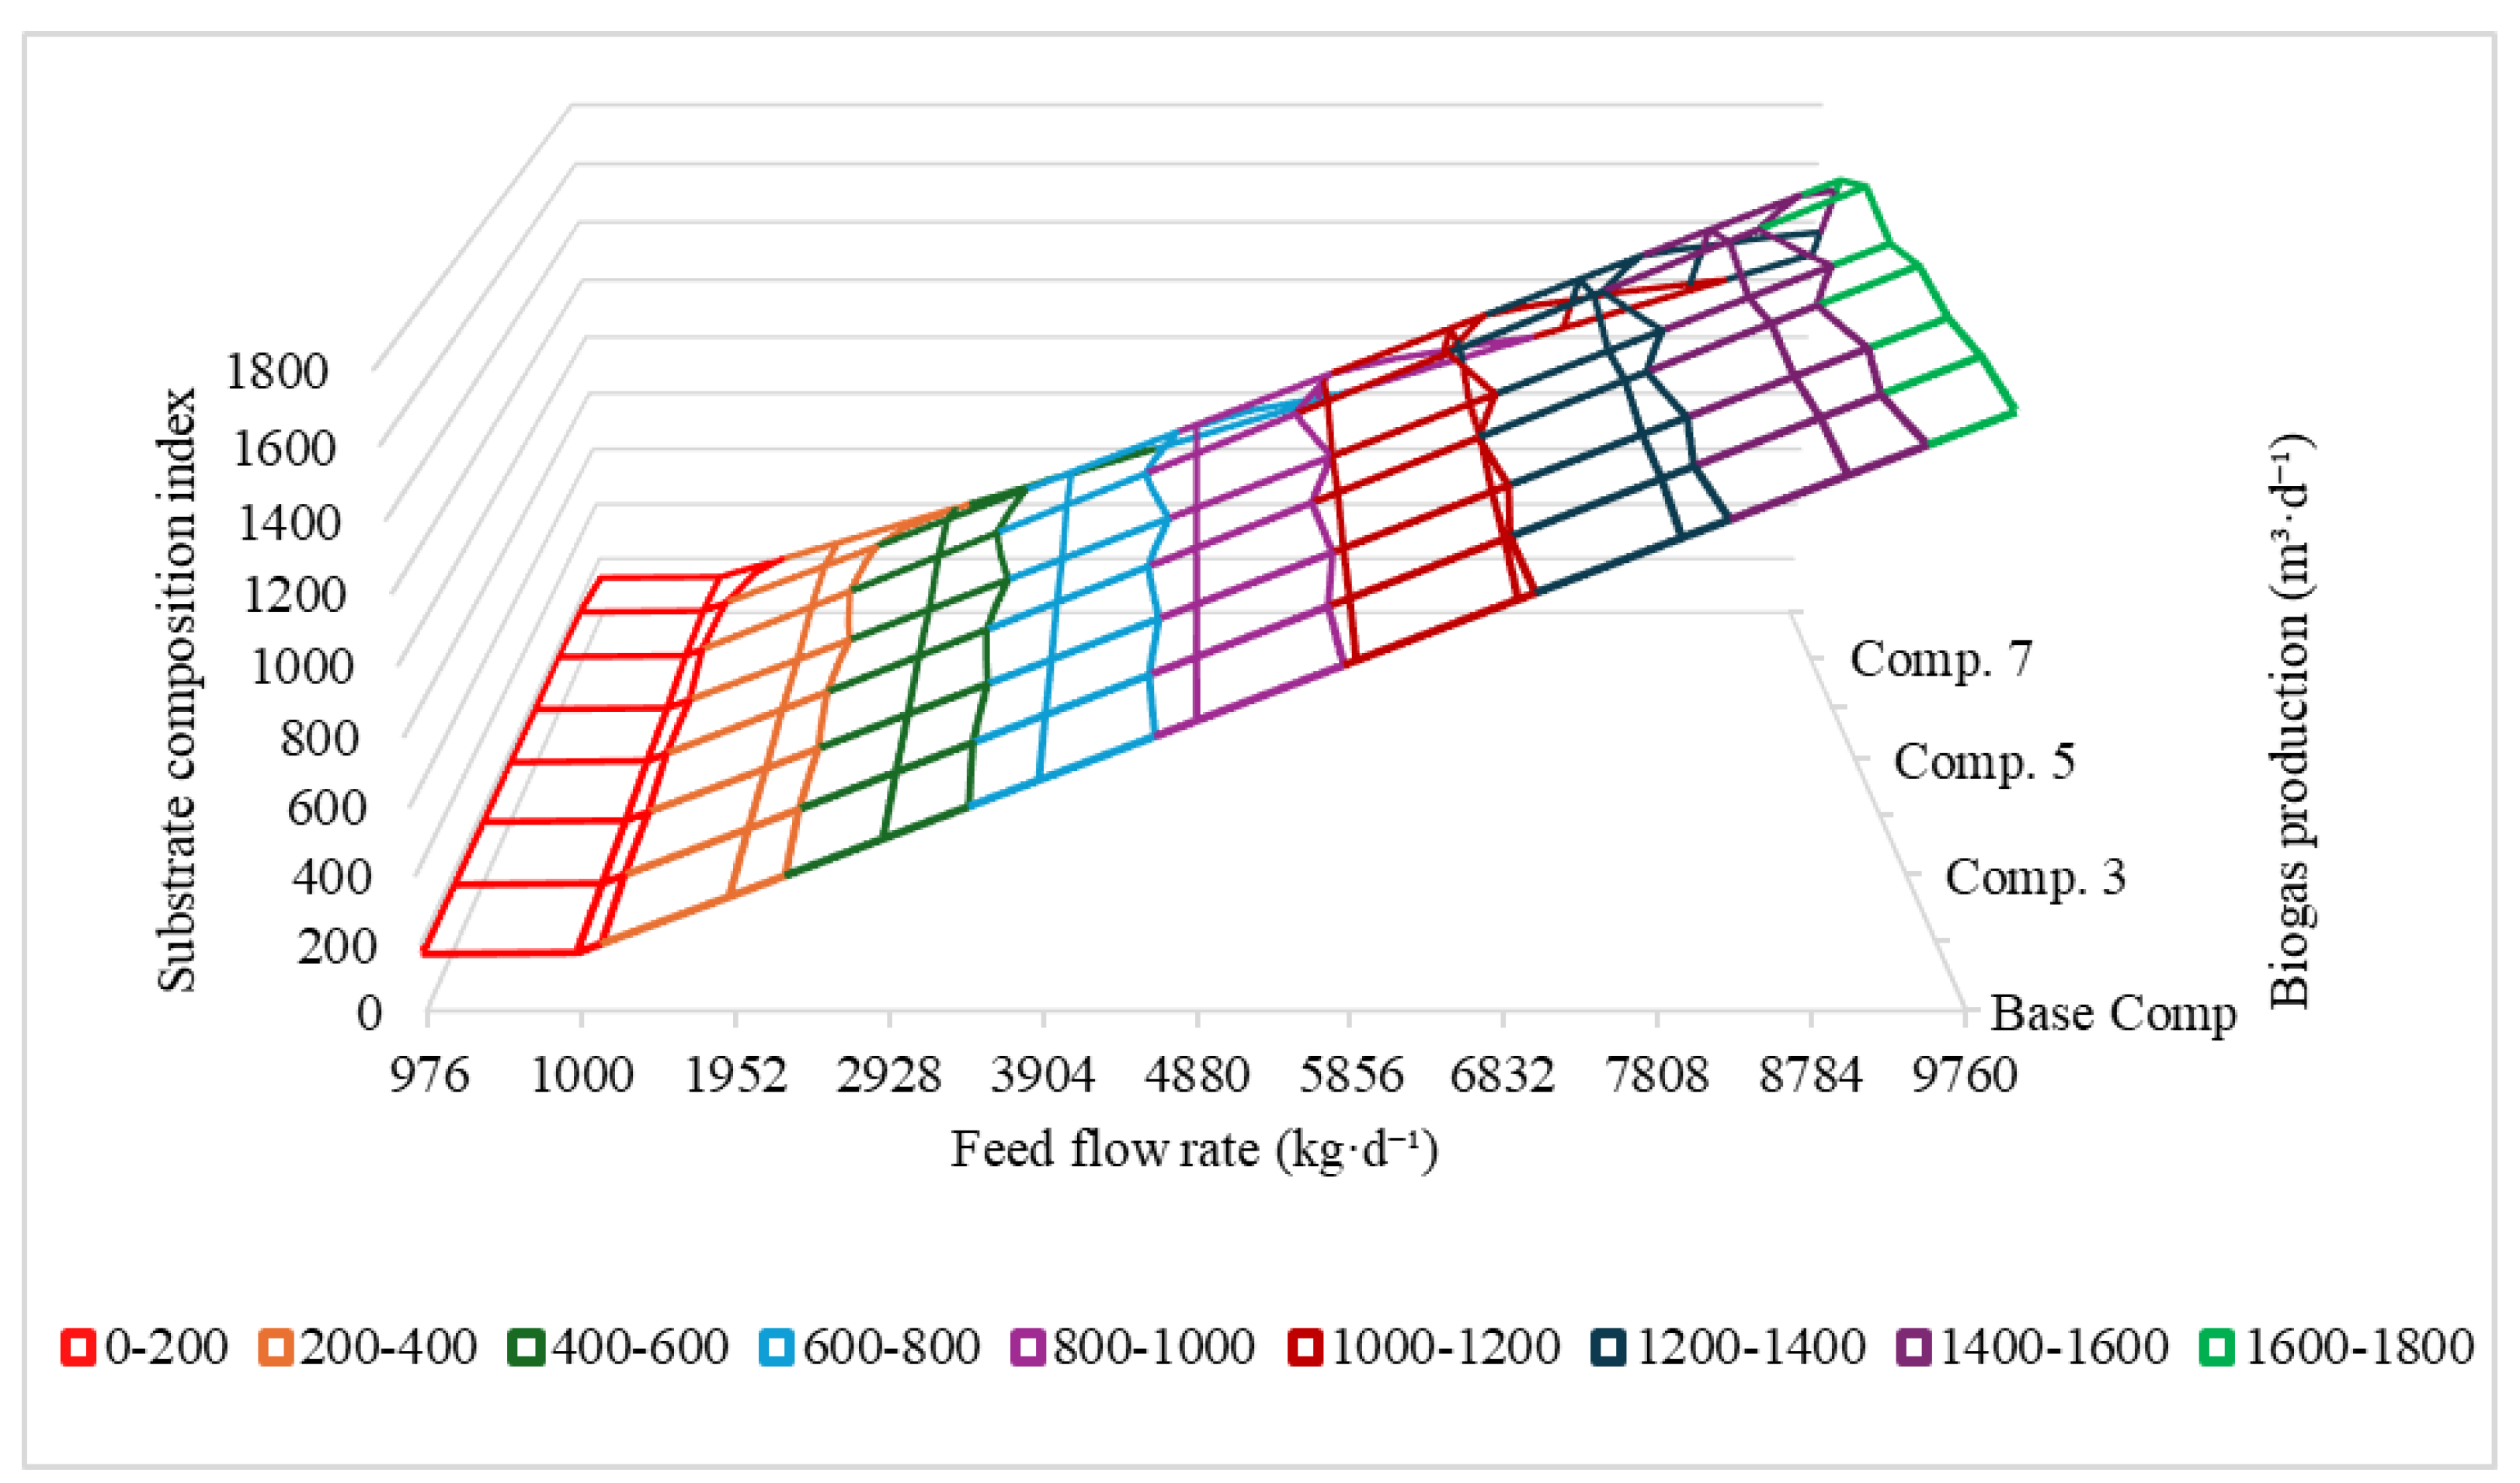
Figure 5.
Biogas composition.
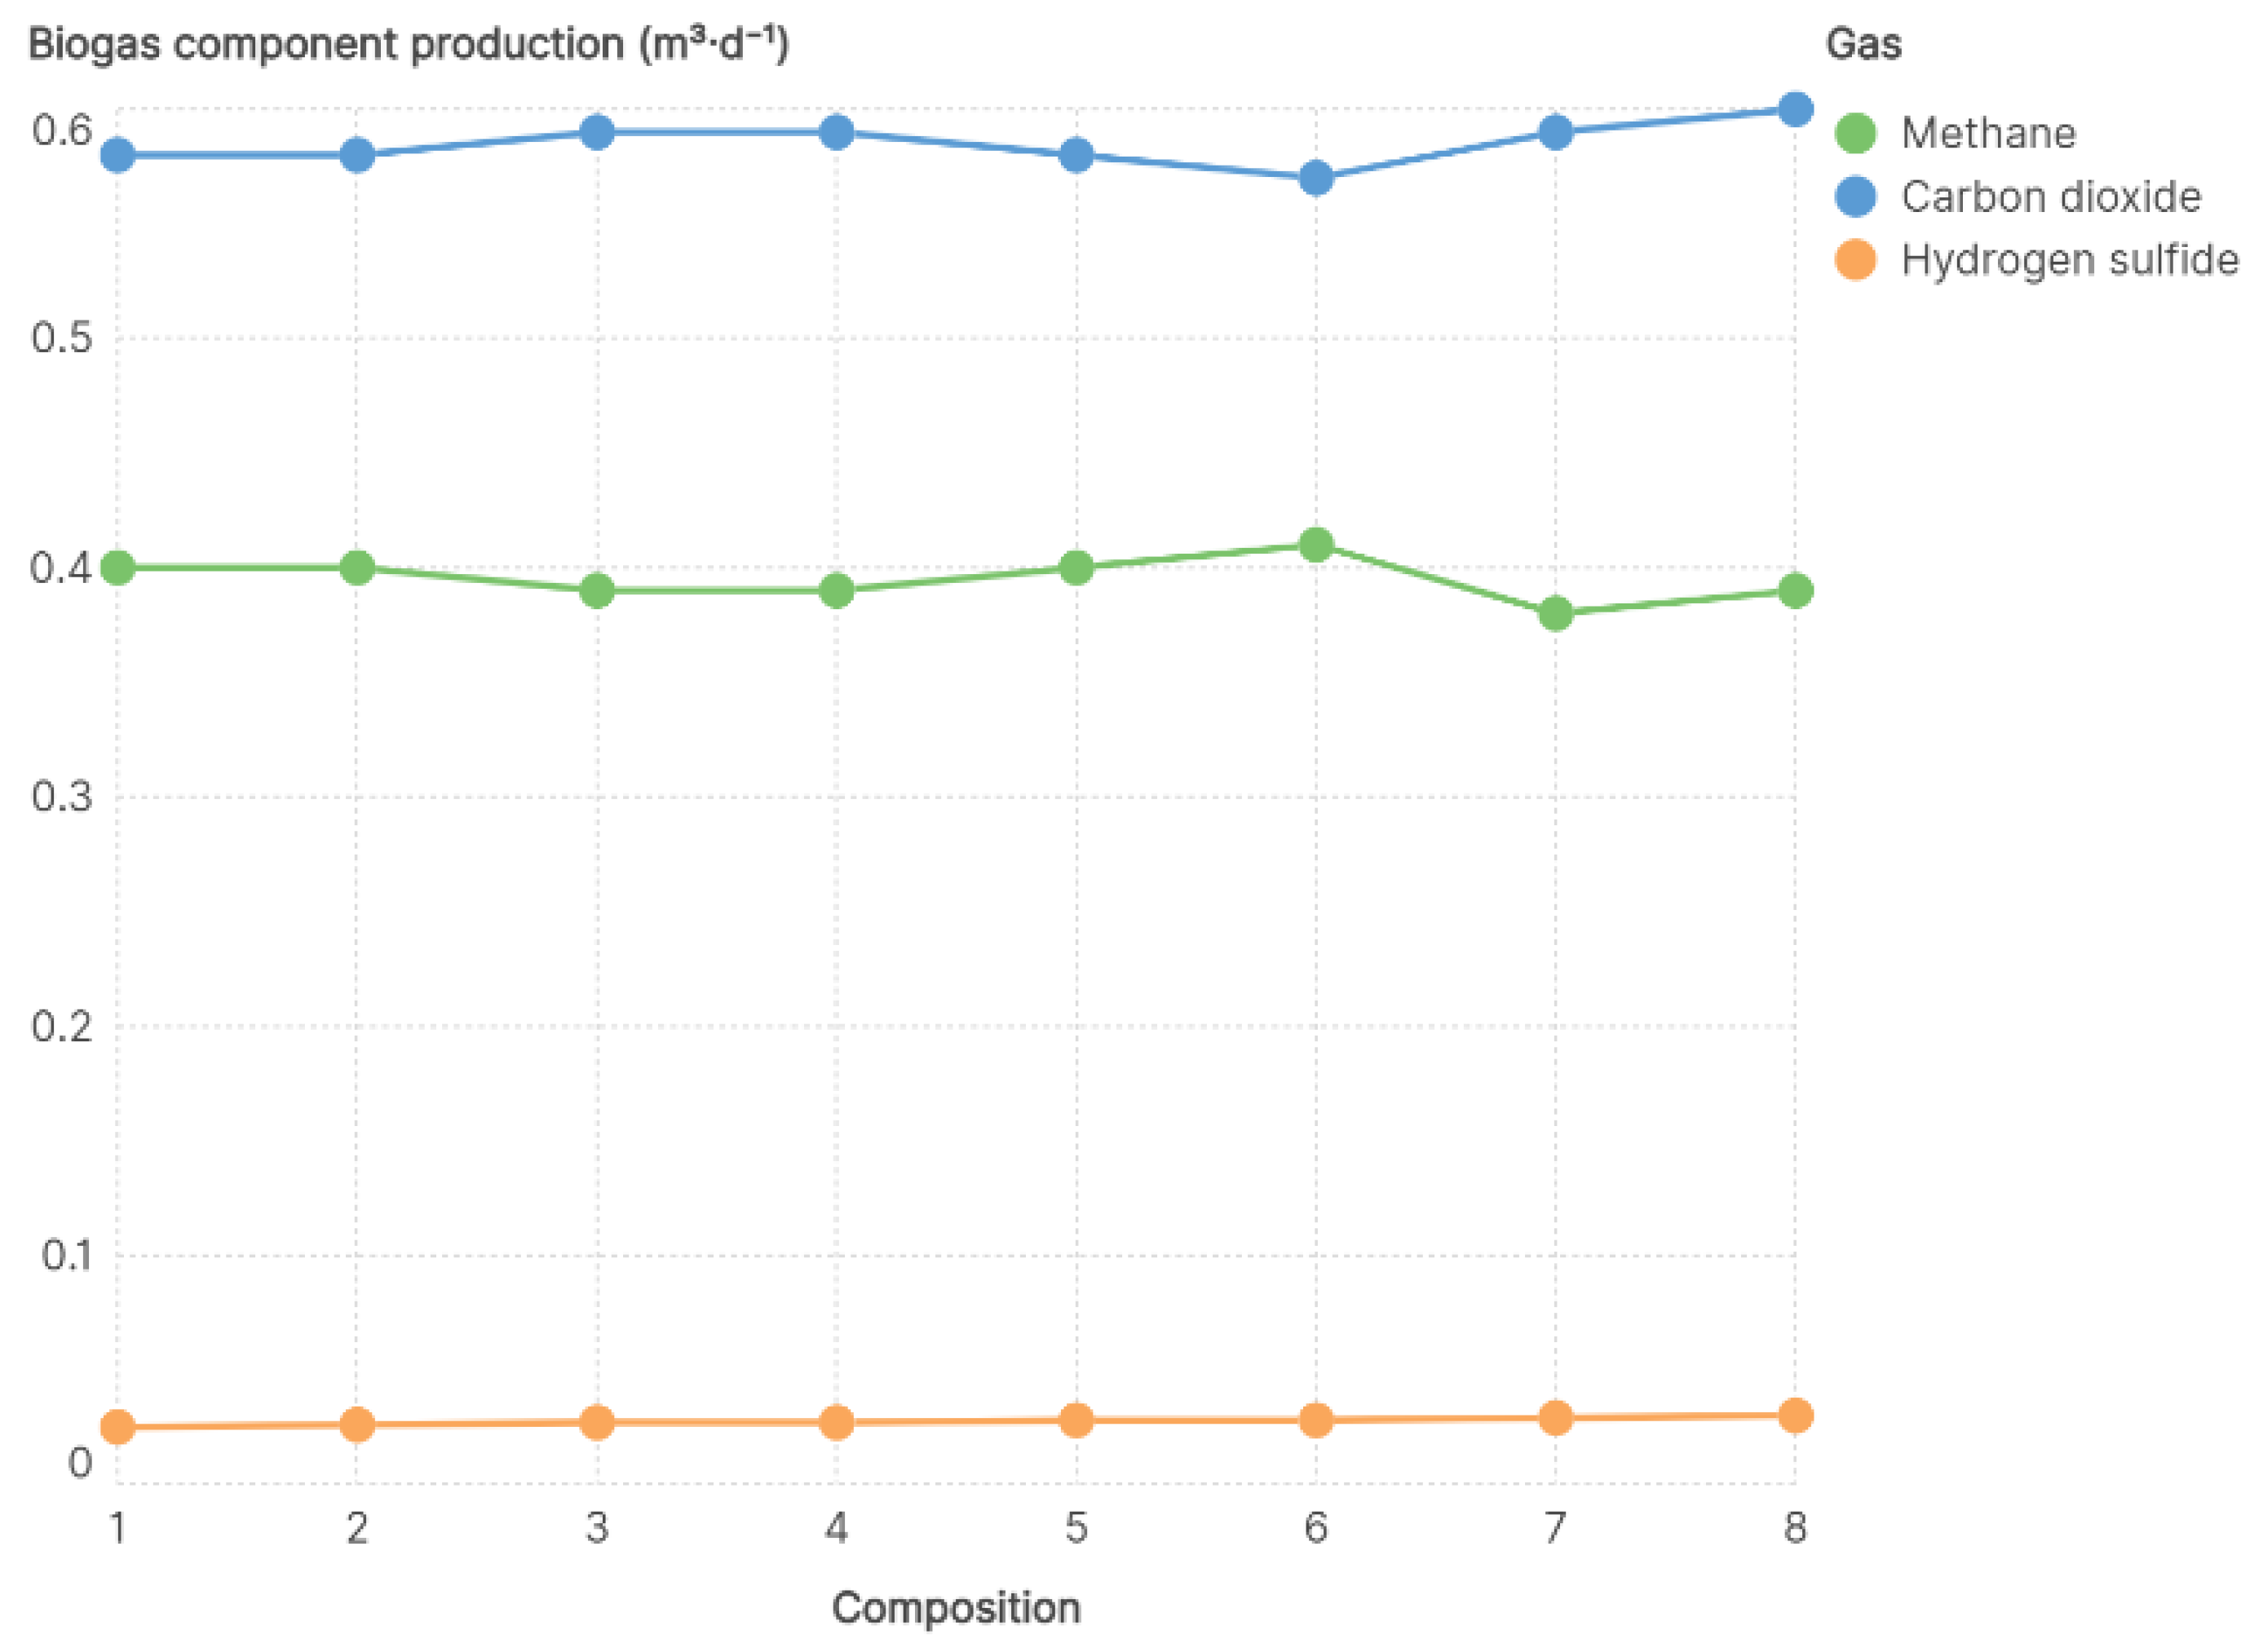

Table 1.
Boundary conditions for composition.
| Lower limit | Upper limit | Base comp. |
Comp. 2 | Comp. 3 | Comp. 4 | Comp. 5 | Comp. 6 | Comp. 7 | |
|---|---|---|---|---|---|---|---|---|---|
| Moisture | 70.72 | 70.72 | 70.72 | 70.72 | 70.72 | 70.72 | 70.72 | ||
| Protein | 3.81 | 4.68 | AVG Protein | Lower limit Protein | Upper limit Protein | AVG Protein | AVG Protein | AVG Protein | AVG Protein |
| Lipids | 3.22 | 4.1 | AVG Lipids | Upper limit Lipids | Lower limit Lipids | AVG Lipids | AVG Lipids | AVG Lipids | AVG Lipids |
| Ash | 2.34 | 3.51 | AVG Ash | AVG Ash | AVG Ash | Lower limit Ash | Upper limit Ash | AVG Ash | AVG Ash |
| Sucrose | 2.93 | 4.1 | AVG Sucrose | AVG Sucrose | AVG Sucrose | Upper limit Sucrose | Lower limit Sucrose | AVG Sucrose | AVG Sucrose |
| Fiber | 4.98 | 7.32 | AVG Fiber | AVG Fiber | AVG Fiber | AVG Fiber | AVG Fiber | Lower limit Fiber | Upper limit Fiber |
| Others | 7.61 | 9.96 | AVG Others | AVG Others | AVG Others | AVG Others | AVG Others | Upper limit Others | Lower limit Others |
*AVG = Average value, Base comp. = Base composition, Comp. = composition.
Table 2.
Boundary conditions for feedstock flows.
| Flow for Pastaza | |
|---|---|
| F (100%) | THV |
| F (90%) | THV-(90%*THV) |
| F (80%) | THV-(80%*THV) |
| F (70%) | THV-(70%*THV) |
| F (60%) | THV-(60%*THV) |
| F (50%) | THV-(50%*THV) |
| F (40%) | THV-(40%*THV) |
| F (30%) | THV-(30%*THV) |
| F (20%) | THV-(20%*THV) |
| F (10%) | THV-(10%*THV) |
*THV = theoretical value, F = flow.
Table 3.
Detailed composition of the filter cake.
| Amino acids / (%) | Value | Author | Fatty acids / (%) | Value | Author | Minerals and others / (%) | Value | Author |
|---|---|---|---|---|---|---|---|---|
| Crude protein | 4.39 | [24] | Total lipids | 3.51 | [26] | Ash | 2.93 | [41] |
| Aspartic acid | 0.56 | Myristic acid | 0.013 | Silicon (Si) | 0.189 | [25] | ||
| Threonine | 0.33 | Palmitic acid | 0.385 | Zinc (Zn) | 0.357 | |||
| Glutamic acid | 0.47 | Stearic acid | 0.082 | Iron (Fe) | 1.401 | |||
| Methionine | 0.06 | Oleic acid | 0.084 | Magnesium (Mg) | 0.49 | |||
| Isoleucine | 0.27 | Linoleic acid | 0.025 | Copper (Cu) | 0.028 | |||
| Alanine | 0.74 | Linolenic acid | 0.04 | Manganese (Mn) | 0.112 | |||
| Valine | 0.45 | Arachidonic acid | 0.004 | Aluminum (Al) | 0.35 | |||
| Leucine | 0.46 | n-tetracosanoic acid | 0.013 | Sucrose | 3.52 | [41] | ||
| Tyrosine | 0.08 | n-hexacosanoic acid | 0.006 | Fiber | 6.15 | |||
| Phenylalanine | 0.17 | n-octacosanoic acid | 0.488 | Cellulose | 4.378 | [5] | ||
| Tryptophan | 0.15 | n-nonacosanoic acid | 0.023 | Hemicellulose | 1.181 | |||
| Histidine | 0.28 | n-triacontanoic acid | 0.286 | Lignin | 0.59 | |||
| Lysine | 0.27 | n-dotriacontanoic acid | 0.158 | Others | 8.78 | [41] | ||
| Arginine | 0.12 | n-tetratriacontanoic acid | 0.212 | n-tetracosanol | 0.712 | [26] | ||
| Stigmasterol | 0.524 | n-hexacosanol | 0.558 | |||||
| Campesterol | 0.572 | n-heptacosanol | 0.294 | |||||
| β-sitosterol | 0.602 | n-octacosanol | 6.086 | |||||
| n-nonacosanol | 0.294 | |||||||
| n-triacontanol | 0.872 | |||||||
| n-dotriacontanol | 0.172 | |||||||
| n-tetratricontanol | 0.335 |
Table 4.
Organic compounds and corresponding chemical reactions.
| Component | Chemical Reaction |
|---|---|
| Oligosaccharide | |
| Sucrose | |
| Polysaccharides | |
| Hemicellulose | |
| Cellulose | |
| Cross-linked phenolic polymers | |
| Lignin | |
| Amino acids | |
| Aspartic acid | |
| Fatty acids | |
| Linoleic acid | |
| Higher primary aliphatic alcohols | |
| N-tetracosanol | |
| Phytosterols or sterols of plant origin | |
| Stigmasterol |
Table 5.
Production flows in Pastaza.
| Percentage of total flow fed | Flow for Pastaza (kg·d⁻¹) |
|---|---|
| 10% | 976 |
| 20% | 1,952 |
| 30% | 2,928 |
| 40% | 3,904 |
| 50% | 4,880 |
| 60% | 5,856 |
| 70% | 6,832 |
| 80% | 7,808 |
| 90% | 8,784 |
| 100% | 9,760 |
Table 6.
Results of estimated fuel savings.
| Feed flow (kg·d⁻¹) | Biogas production (m³·d⁻¹) | Bagasse saved (kg·d⁻¹) | Wood saved (kg·d⁻¹) |
|---|---|---|---|
| 1 | 1 | 1.909 | 0.996 |
| 400 | 71.16 | 135.91 | 70.86 |
| 9,760 | 1,736.4 | 3,316.43 | 1,728.99 |
| Annual ecological equivalent | 631.08 t·year⁻¹ (≈ 3.63 ha ≈ 902 trees) |
Table 7.
Table 7. Assessment of the environmental performance of gaseous fuels using TRACI factors.
| Fuel | Climate change (kg CO₂ eq) | Acidification (kg SO₂ eq) | Smog (kg O₃ eq) |
|---|---|---|---|
| Biogas | 17.40 | 0.00516 | 0.05894 |
| Methane (natural gas) | 2.875 | 0.00140 | 0.04965 |
| LPG | 3.07 | 0.00280 | 0.09919 |
| Propane | 3.05 | 0.00210 | 0.07440 |
Table 8.
Occupational risk analysis in biogas production using the OHSP indicator.
| Process stage | Main risks | Hours worked/year | Accidents/year |
|---|---|---|---|
| Receiving and grinding the filter cake |
Noise, dust, and heat | 1,800 | 2 |
| Loading the biodigester | Contact with waste and gases | 1,600 | 1 |
| Operating the biodigester | Internal pressure and methane gas | 2,000 | 1 |
| Cleaning and discharging the digestate |
Biological and thermal risk | 1500 | 2 |
Disclaimer/Publisher’s Note: The statements, opinions and data contained in all publications are solely those of the individual author(s) and contributor(s) and not of MDPI and/or the editor(s). MDPI and/or the editor(s) disclaim responsibility for any injury to people or property resulting from any ideas, methods, instructions or products referred to in the content. |
© 2026 by the authors. Licensee MDPI, Basel, Switzerland. This article is an open access article distributed under the terms and conditions of the Creative Commons Attribution (CC BY) license.
Copyright: This open access article is published under a Creative Commons CC BY 4.0 license, which permit the free download, distribution, and reuse, provided that the author and preprint are cited in any reuse.


