
Submitted:
09 January 2026
Posted:
12 January 2026
You are already at the latest version
Abstract
Remote sensing has become a cornerstone of data-driven decision-making for monitoring biodiversity and supporting the achievement of the Sustainable Development Goals (SDGs). By providing consistent, spatially explicit observations across scales, Earth observation (EO) technologies enable systematic assessment of environmental change and ecosystem dynamics. Within this context, the Essential Biodiversity Variables (EBV) framework offers a standardised approach to harmonising biodiversity observations from in-situ and remote sensing platforms, thereby enhancing interoperability and the effective use of biodiversity information for conservation and sustainable development. This paper focuses on two EBV classes of particular relevance to EO applications: Ecosystem structure and Species traits. We review recent advances in remote sensing techniques—particularly LiDAR, multispectral, hyperspectral, and radar data—and their capacity to monitor ecosystem vertical structure, ecosystem distribution, habitat suitability, and vegetation traits such as productivity, phenology, leaf area index, chlorophyll content, and functional traits. The integration of EO data with in-situ observations and machine learning approaches is highlighted as a key pathway for improving habitat modelling and biodiversity assessments at regional to continental scales, with direct relevance to SDG 15 (Life on Land). We further discuss current challenges, including data resolution limitations, standardisation, computational demands, and the translation of EO-derived indicators into policy-relevant metrics. Finally, we outline future perspectives, emphasising the role of emerging sensor technologies, artificial intelligence, FAIR data principles, and multi-source data integration in advancing EBV monitoring and strengthening the contribution of remote sensing to sustainable ecosystem management and global biodiversity targets.
Keywords:
remote sensing
; earth observation
; biodiversity
; sustainable development goals
; essential biodiversity variables
; EBVs
Introduction
Remote sensing applications play a significant role in facilitating data-driven decision-making processes. It empowers policymakers, researchers, and organisations with the requisite tools to systematically monitor progress and identify challenges for the realisation of the Sustainable Development Goals (SDGs) (Estoque 2020). Through the acquisition and analysis of remotely sensed data obtained from different platforms (e.g., spaceborne, airborne, Unmanned Aerial Vehicle), remote sensing offers a scientific basis for assessing environmental, social, and economic parameters, furnishing valuable insights that underpin informed policy development, and sustainable development initiatives aligned with the SDGs (Avtar et al. 2020). It is necessary to employ a systematic approach that uses standardised formats and procedures for biodiversity observations, complemented by concurrent environmental monitoring to identify and monitor alterations in biodiversity and ecosystems. The optimisation of biodiversity information applications for informing conservation and sustainable development strategies hinges on the imperative of ensuring interoperability across biodiversity observation and monitoring approaches (Proença et al. 2017). This necessitates the harmonisation of data formats and structures, fostering smooth integration and exchange of information and enhancing the efficiency and effectiveness of data-driven decision-making processes in the realms of biodiversity management and sustainable development (Pereira et al. 2010). In this respect, Essential Biodiversity Variables (EBVs) were introduced to advance biodiversity information acquisition, dissemination, and utilisation (Navarro et al. 2017; Pereira et al. 2013). This framework serves as a unifying mechanism for consolidating the diverse biodiversity observations gathered through various platforms, including in-situ and remote sensing data within a biological framework. In other words, EBVs facilitate a comprehensive and standardised representation of biodiversity dynamics, fostering a more coherent and integrated understanding of ecological changes over time and space, thereby contributing to more effective conservation and management strategies.
The EBV framework consists of six distinct classes, namely 'Genetic composition', 'Species populations', 'Species traits', 'Community composition', 'Ecosystem functioning', and 'Ecosystem structure', comprising 21 proposed EBV candidates, as articulated by the biodiversity and remote sensing community. Given the existing technological constraints and advancements, retrieving 'Genetic composition' among the proposed EBV classes remains unattainable through remote sensing platforms (Skidmore et al., 2021). Among the EBV classes, the 'Ecosystem structure' and 'Species traits' are of specific scientific interest from Earth observation (EO) perspectives. Monitoring ecosystem structure is essential for multiple reasons since it yields valuable information that could potentially be applied for land system science, conservation, and management purposes (Murawski 2000). The current state of knowledge indicates that understanding the status of ecosystem structure plays a significant role in delineating ecosystem health, detecting ecosystem alterations, conserving biodiversity, and facilitating the provision of ecosystem services, among other functions (Lamy et al. 2016; Peng et al. 2007). Additionally, concerning animal distributions and diversity, empirical evidence substantiates that the structural attributes of ecosystems significantly influence various aspects of animal ecology. These influences include, but are not limited to, species distributions and abundance, the dynamics of predation risk, and behavioural patterns (Müller et al. 2014; Robinson and Holmes 1984; Whittingham and Evans 2004).
In addition, examining Species traits from the EBV perspective also holds paramount significance in understanding and preserving ecological health (Skidmore et al., 2021). Species traits, encompassing features such as plant phenology, morphology and physiology, are pivotal components that contribute to the intricate web of biodiversity. From an EBV standpoint, these traits serve as measurable indicators that offer valuable insights into the functioning of ecosystems. However, species traits (i.e. traits of individual species) aggregate in plant communities (or vegetation) to shape vegetation traits, which is more easily measurable with EO data. Gross primary productivity, for instance, measures how efficiently a plant turns sunlight into organic matter, impacting the overall productivity of the ecosystem (Zhang et al. 2024). On the other hand, other variables such as chlorophyll content can reflect on the plant's ability to harness sunlight for energy, contributing to the photosynthetic processes that sustain life. Moreover, vegetation water content and leaf area index (LAI) play critical roles in shaping habitat conditions and supporting a diverse range of fauna. By closely examining these vegetation traits through the lens of EBVs, researchers get a detailed look at standardised metrics that help monitor and assess ecosystem health. This comprehensive understanding is vital for informed conservation strategies, sustainable land management, and, ultimately, the preservation of biodiversity in the face of environmental challenges. One of the challenges addressed recently by Skidmore et al. (2021) pertains to the feasibility of retrieving all EBVs using EO data, aimed to identify and introduce remote sensing biodiversity products capable of monitoring EBV candidates from space.
Monitoring Ecosystem Structure and Species Traits for Sustainable Development Goals
Monitoring ecosystem structure is of key importance for achieving SDG targets, especially for sustainable management of forests, conservation and restoration of terrestrial ecosystems, and policy-making regarding actions to halt land degradation and biodiversity loss. Ecosystem structure is increasingly seen as an indicator of biodiversity and habitat conditions at local to regional scales. Yet, the three-dimensional (3D) structure of ecosystems continues to be one of the most crucial information gaps in the observational archive for assessing biodiversity (Dubayah et al. 2020). Over the past decades, developments in active remote sensing, notably the light detection and ranging (LiDAR) technique, have fundamentally changed the way we obtain information to understand the linkages between biodiversity and ecosystem structure (Acebes et al. 2021; Beland et al. 2019; Lefsky et al. 2002). LiDAR enables accurate measurement of 3D ecosystem structure by emitting the laser pulses from the sensor and recording its subsequent return signals from the vegetation, generating discrete point clouds or full-waveforms from which metrics of ecosystem structure (e.g., ecosystem height, cover, and structural complexity) can be derived (Assmann et al. 2022; Kissling et al. 2022; Valbuena et al. 2020). Applying LiDAR technology can be crucial in monitoring the "Ecosystem Vertical Profile" as an EBV candidate within the 'Ecosystem structure' class. In addition, the profound impacts of animal communities have long been recognised to be influenced by the 3D structure of ecosystems (Davies and Asner 2014). However, climate change can magnify alterations in terrestrial ecosystem structure, primarily manifested in biome shifts, changes in forest growth and mortality, pest infestations, wildfires, winter warming, heightened intensity of the hydrologic cycle, and shifts in ecosystem states (Grimm et al. 2013).
Another crucial aspect of monitoring ecosystem structure lies in its association with ecosystem distribution, which can be effectively delineated through remote sensing applications. This involves acquiring spatially explicit data on habitat distribution and condition, fragmentation patterns, and their consequential effects on species distribution within their habitats. This can be addressed through habitat modelling by assessing and characterising the spatial arrangement and composition of the habitats within given ecosystems. Habitat modelling can improve our understanding of the spatial dynamics and ecological relationships that influence ecosystems, providing vital insights for informed conservation and management strategies. In this respect, the latest assessment by the EEA (The European Environment Agency – state and Outlook 2020) shows that Europe's biodiversity continues to decline at an alarming rate, with most protected species and habitats found not to have good conservation status. Much more effort is needed to reverse current trends and to ensure a resilient and healthy nature. The EEA supports the European Commission in collecting and reviewing the data submitted by European member states.
Artificial Intelligence (AI) techniques, such as machine learning (ML), could enable improved monitoring of biodiversity and ecosystems with satellite-based high-resolution datasets such as the Copernicus High-Resolution Vegetation Phenology Product (HR-VPP) to support European policy-making better. Therefore, understanding where habitats occur across Europe is crucial for biodiversity conservation and taking specific management actions. Since information on habitats at the European level is currently limited to a 10 km grid level (Article 17 of the Birds and Habitats Directive), more spatially detailed habitat maps are required using innovative methods (e.g. ML) together with high-resolution satellites, in addition to climate and environmental data and integration of in-situ observations as training data from the European Vegetation Archive (EVA). Limitations in habitat modelling concern the accuracy and spatial resolution of the climate and environmental data (e.g., soil and climate data), which are generally much coarser than the satellite data.
Monitoring species traits is essential for researchers, conservationists, policy-makers and private sectors. Vegetation traits, in particular, are the unique characteristics that define different types of ecosystems (Kattge et al. 2020). These traits from the vegetation point of view, including leaf structures, root systems, and reproductive strategies, play a crucial role in shaping the natural world (Kolb and Diekmann 2005; Westoby et al. 2002). Each plant species has its features reflecting its evolution and ability to thrive in specific environments. Monitoring these traits is vital for achieving SDGs, especially those related to forest management, ecosystem conservation, and combating land degradation (Prince 2019). In other words, monitoring species traits, particularly vegetation traits, is of key importance for achieving SDG targets, especially those related to environmental sustainability, biodiversity conservation, and land management (Kussul et al. 2019; Skidmore et al. 2021).
Understanding vegetation traits helps to assess ecosystem health and resilience; for example, physiological traits, like photosynthesis and root adaptations, highlight how plants use energy and resources (Kleyer and Minden 2015; Pearcy et al. 1987). Likewise, phenological traits, focusing on events like flowering and fruiting, provide insights into plant responses to environmental cues. Both dimensions contribute to a dynamic understanding of how vegetation interacts with its surroundings and adapts to ecological changes. In the context of SDGs, effective forest management relies on recognising vegetation traits essential for ecosystem stability and biodiversity (Sayer et al. 2019). This involves understanding genetic diversity, understanding reproductive strategies, as well as identifying species with carbon-sequestration abilities. Knowledge about tolerance to disturbances, mycorrhizal associations, and phenological patterns guides conservation efforts and sustainable practices (Morellato et al. 2016).
Advanced Remote Sensing for Monitoring Essential Biodiversity Variables
Ecosystem Vertical Profile
Ever since the initial perspective of LiDAR remote sensing for ecosystem studies published by Lefsky et al. (2002), the LiDAR technique has evolved, with wide-range capabilities to monitor topographic characteristics (Davies and Asner 2014), ecosystem structure and function (Antonarakis et al. 2011), animal habitats (Koma et al. 2021b), and carbon dynamics at various scales (Antonarakis et al. 2014). LiDAR sensors can be deployed across multiple platforms, each serving distinct purposes, including mobile LiDAR, unmanned aerial vehicle (UAV) based LiDAR, terrestrial LiDAR, airborne LiDAR, and spaceborne laser scanning. At plot scale, mobile laser scanning (MLS) (e.g., phone-based, hand-held, backpack, vehicle-based laser scanning) often adopts simultaneous localisation and mapping robotics systems (Choi and Song 2022; Hyyppä et al. 2020), providing accurate information related to plant stem density, basal area, and above-ground biomass even in forests with weak Global Navigation Satellite System signal. MLS also allows flexible and multi-temporal data acquisitions, which can serve as field reference data for vegetation growth and forest inventories (Liang et al. 2019). More recently, the advanced capability of UAV-based laser scanning enables detailed measurements at the site-level, capturing tree height and crown structure at much lower flight height (about 50 m to 300 m above ground) (Guo et al. 2022). Nevertheless, MLS and UAV-based laser scanning are usually limited by their spatial coverage, hindering the transferability of ecosystem monitoring workflows that are developed with those systems. Terrestrial laser scanning (TLS), which benefits from a multi-scan strategy and very high point density, allows accurate mapping of vegetation biophysical variables such as LAI, 3D foliage distribution, plant functional traits, stem volume, and ground-biomass at individual tree level or plot level (Hyyppä et al. 2020). However, due to the scan angle, TLS often has limited capacity to accurately capture details related to canopy height and crown shape accurately (Beland et al. 2019). At the national or regional scale, airborne laser scanning (ALS) has been widely used for tree species classification (Shi et al. 2018), habitat niche differentiation (Koma et al. 2021a), and species diversity and distribution monitoring (Bakx et al. 2019; Wulder et al. 2013). With national-wide ALS campaigns becoming increasingly available, data products derived from ALS data quantifying ecosystem height, cover, and structural complexity start further assisting landscape monitoring and management across different ecosystems (e.g., forest, grassland, agriculture, etc.) and research on biodiversity patterns and species-habitat relationships at national or regional scale (Assmann et al. 2022; Kissling et al. 2023). At a global scale, the Geoscience Laser Altimeter System (GLAS) carried on the Ice, Cloud, and land Elevation Satellite (ICESat) was the first spaceborne laser scanning system (with a 70 m footprint), aiming to measure canopy height and above-ground biomass at global scale (Zwally et al. 2002). In December 2018, the Global Ecosystem Dynamics Investigation (GEDI) was installed and launched on the International Space Station. With a footprint of 25 m, GEDI derives data products including canopy height, canopy foliar profiles, LAI, sub-canopy topography and biomass with a near-global coverage (Dubayah et al. 2020). However, both spaceborne lasers scanning systems had relatively short lifespan – ICES at stopped data collection in 2009 and GEDI only had a two-year nominal lifetime. The typical characteristics of different LiDAR systems and their potential contribution to SDGs are listed in Table 1.
Ecosystem Distribution
The links between ecosystem and species distribution are intricate and interconnected, reflecting the dynamic relationships within ecological systems, and contributing to our understanding of ecological patterns. The ecosystem distribution sets the stage for the presence and arrangement of various habitats, and the distribution of habitats contributes to ecosystems' overall composition and functioning. The two concepts are interconnected components that define natural landscapes' spatial and ecological characteristics. Distribution modelling has been restricted for a long time to species distribution modelling. However, the ecological constraints that apply to species are more or less the same for habitats, as habitats are built up by species with the same ecological preferences. Also, habitats can only exist under specific conditions, which can be determined by climate, soil, topography, and, in many cases, human and animal interactions (Hirzel and Le Lay 2008). For ecosystem accounting, there is an urgent need to obtain information on the location, extent, and distribution of all habitats due to their provision of indispensable data and information for biodiversity quantification, valuation of ecosystem services, analysis of habitat connectivity, ongoing monitoring of ecological variations, etc. Habitat modelling is one way to reach these goals.
Habitat suitability models can also indicate potential areas for the restoration of specific habitats, such as ombrotrophic bogs. The habitat maps generated as a result of the modelling are directly and indirectly related to several EBV classes (Pereira et al. 2013), such as 'Community composition', 'Species populations', and in particular, 'Ecosystem structure'. Therefore, the mapping and monitoring of habitats is of utmost importance for biodiversity monitoring. Each habitat type comprises a range of plant species that characterise a specific ecosystem structure but can vary based on their quality. In the past, major habitats were mapped (Mücher et al. 2004) by using land cover information as the starting point and the land cover was further subdivided based on knowledge rules that included, amongst others, soil data, topography, biogeographic regions, and information on the distribution of specific indicator species as derived from example the Atlas Flora Europaea. However, to be able to model nature, a classification system is needed to identify the various habitats. Within the European context, this can be accomplished through different systems, such as the European Nature Information System (EUNIS) habitat type classification (European Nature Information System) and the Annex I habitat types (Davies et al. 2004). Contrary to Annex I, the EUNIS habitat classification is a comprehensive and hierarchical system in which each habitat type is described in terms of its floristic composition and, therefore, a sound basis for wall-to-wall habitat mapping. The source for the EUNIS habitat distribution is the European Vegetation Archive (EVA) (Chytrý et al. 2016), currently with well over two million plot observations. Such plots typically contain a complete list of vascular plant species, often also a list of bryophytes and lichens, estimates of cover-abundance of each species and various additional information on vegetation structure and location. The geographical scope of the database is the whole of Europe. The database contains plots representing habitat groups like saltmarshes, coastal, wetlands, grasslands, shrublands, forests, sparsely vegetated, man-made habitats, and inland surface water. In this context, a classification expert system EUNIS-ESy (i.e., EUNIS Expert System) was developed for identifying the habitats belonging to the above-mentioned habitat groups based on species composition and cover-abundances of particular species or species groups (Chytrý et al. 2020).
The widely used software Maxent (Phillips et al. 2006) for maximum entropy modelling of species geographic distributions, has been widely used for habitat suitability modelling. Maxent is a general-purpose ML method with a simple and precise mathematical formulation. It has several aspects that make it well-suited for habitat distribution modelling. The modelling requires two kinds of data. On the one hand, vegetation in-situ observations are needed for training and testing the model and on the other hand, environmental data like climate, topography, soil, and remotely sensed EBVs are needed as predictors (Figure 1). The suitability map indicates how suitable an area is, in terms of climate, soil and other conditions, for the specific EUNIS habitat class, expressed on a scale of 0 to 1. It is possible to model 203 EUNIS habitat types at a resolution of 100 m at the European scale (Hennekens 2017, 2019a; Hennekens 2019b, 2020) and 10 m resolution at the regional scale or country level. Overall, a regional approach and a higher spatial resolution improve the accuracy of the resulting habitat maps.
Further, habitat probability maps can be generated by refining the habitat suitability maps with, amongst others, detailed land cover information and spatial-explicit rules (e.g., maximum distance to coast and rivers) (Figure 2) (Mücher and Hennekens 2016, 2018, 2019, 2020; Mücher et al. 2015). The land cover map holds considerable significance among the EO products that can be applied in habitat modelling. Currently, the most suitable land cover information is the Copernicus high-resolution layers (HRLs) at 20-30m resolution available for, amongst others, forests, and grasslands. Since Copernicus HRLs layers are unavailable for all land cover types, Corine land cover (CLC) and CLC plus (backbone) are still complementary and valuable sources of land cover information generated using EO data (Gilić et al. 2023). Notably, a recent investigation has revealed significant variations in habitat suitability maps concerning their estimates of different land cover types, even when maintaining the exact spatial resolution. Notably, the Copernicus CGLS-LC100 and ESA CCI-LC maps emerge as the most suitable options for assessing habitat probability maps (Mag et al. 2011). The contribution of the remote sensing data is not limited to generating land cover maps in habitat modelling. For instance, other predictor variables such as land surface phenology peak (max of season) and slope of the land surface phenology green-up (start of season) can also be retrieved using EO data. Retrieving these predictors is a commonplace procedure applying remote sensing applications (Table 1).
Vegetation Traits
The comprehensive examination of vegetation traits, encompassing both physiological and phenological characteristics of plant communities, has been the subject of extensive investigation facilitated by diverse remote sensing applications at various spatial scales, ranging from regional to local scales (Ali et al. 2020; Darvishzadeh et al. 2019; Gara et al. 2019; Hilker et al. 2011; Homolová et al. 2013; Houborg et al. 2015; Skidmore et al. 2021). In the realm of physiological traits as an EBV candidate, applying satellite imagery, hyperspectral data, and LiDAR has significantly advanced the ability to monitor key indicators such as net and gross productivity, chlorophyll content, LAI, etc. These observations can occur on regional and global scales, providing a broader understanding of large-scale trends, while local scale assessments enable a more detailed examination of specific ecosystems or vegetation types. One crucial physiological trait studied through remote sensing applications is photosynthetic activity, which involves estimating both the net and gross primary productivity. For instance, multispectral, hyperspectral, and LiDAR data have emerged as invaluable tools in advancing our understanding of vegetation health and functioning and monitoring of vegetation photosynthesis activity (Gobron et al. 2006; Mishra et al. 2017; Omasa et al. 2007). It is important to note that, up to now, many computational techniques have been developed, such as the radiative transfer model, which has been widely employed to monitor and estimate vegetation physiological traits, such as chlorophyll and water content by means of remote sensing data (Darvishzadeh et al. 2008; Jacquemoud et al. 2000; Riaño et al. 2005).
Parallel to this, phenology is another EBV candidate under the ‘Species traits’ class. The study of phenological characteristics has dramatically benefited from integrating satellite observations, especially high-temporal-resolution data such as the Moderate Resolution Imaging Spectroradiometer (MODIS) (Hmimina et al., 2013; Zhang et al., 2003). This technology allows for examining vegetation phenological traits at the landscape scale. Additionally, high-spatial-and-temporal-resolution satellite data, such as Landsat and Sentinel-2, have been employed for local studies (Melaas et al., 2013; Misra et al., 2020). These satellites can provide time-series imagery, a valuable source for monitoring vegetation phenological traits. In other words, EO data offer the capacity to observe phenological events over extensive geographical areas, providing a regional perspective on flowering patterns, fruiting cycles, and the timing of leaf emergence and senescence. It is important to note that ground-based measurements can complement these remote sensing approaches in addition to satellite data by offering finer details at the local scale, capturing nuanced variations within specific habitats or ecosystems (Alberton et al. 2017). For example, ground-based sensors (e.g., cameras or vegetation indices sensors) can monitor vegetation growth and changes (Nijland et al. 2014). Combining regional and local scales, this dual approach has enriched our understanding of how vegetation responds to environmental stimuli and adapts to ecological changes.
In addition, morphological vegetation traits like leaf dry matter content (LDMC) and specific leaf area (SLA) are also considered as remote sensing biodiversity products under the "Species Traits" EBV class. Studying LDMC and SLA is crucial in understanding and assessing EBVs for plant species (Ali 2016). These traits are key indicators of a plant's ecological strategy and environmental adaptation. LDMC, representing the proportion of dry mass in a leaf, provides insights into a plant's investment in structural components and resource allocation (Ali et al. 2016). On the other hand, SLA, defined as the leaf area per unit dry mass, reflects a plant's ability to capture light and conduct photosynthesis. LDMC and SLA contribute valuable information about species' functional characteristics, influencing its competitive ability, response to environmental stress, and overall ecological role. Incorporating these traits into biodiversity assessments enhances our understanding of ecosystem dynamics, species interactions, and ecosystem services, ultimately aiding in practical conservation and management strategies. Hyperspectral remote sensing data has been extensively employed to investigate these two crucial vegetation traits (i.e., LDMC and SLA) at a local scale. Ali et al. (2016), for instance, applied Sentinel-2 data to accurately estimate LDMC, while synthetic aperture radar (SAR) was employed for the study of SLA, as demonstrated by Bhattarai et al. (2022). On a global scale, the effectiveness of MODIS and Landsat data in estimating SLA and LDMC has been successfully demonstrated, as highlighted by (Moreno-Martínez et al. 2018). This underscores the versatility and applicability of remote sensing technologies in advancing our understanding of vegetation traits across varying spatial scales.
Current Role Towards Sustainable Development Goals
Ecosystem structure, as one of the six EBV classes, contributes to several SDG-15 Targets, e.g. to conservation, restoration, and sustainable use of terrestrial ecosystems (Target 15.1), sustainable forest management (Target 15.2), and policy-making to reduce the degradation of habitats and halt the loss of biodiversity (Target 15.5). Many studies have already explored the utilisation of optical remote sensing (e.g., multispectral/hyperspectral data) towards achieving SDGs, including capturing forest degradation signals (Mondal et al. 2020), management of forest restoration (Camarretta et al. 2020) and biodiversity conservation (Cavender-Bares et al. 2022). LiDAR remote sensing, on the other hand, provides complementary 3D structural information to the spectral reflectance garnered from optical remote sensing, allowing both horizontal and vertical measurement of ecosystem structure and relating it to other dimensions of biodiversity (Cavender-Bares et al. 2022). Besides the capability of different LiDAR systems for monitoring ecosystem structure solely, the combination of LiDAR and other remote sensing sources continues broadening our understanding of ecosystem structure from different perspectives. For instance, integrating LiDAR and RADAR can further improve the accuracy of predicting biomass and basal-area dynamics as well as vegetation biophysical properties, including LAI (Antonarakis et al. 2011). Combining LiDAR and image spectroscopy enables more accurate canopy composition and ecosystem dynamics estimations (Antonarakis et al. 2014). The integration of these two advanced technologies offers substantial scientific advantages in understanding forest ecosystems (Antonarakis et al. 2014), and the combination of LiDAR and aerial photography can be very effective for monitoring canopy cover, structural diversity and species composition (Levick and Rogers 2008; Tickle et al. 2006).
SDG-15 "Life on Land" is directly related to ecosystem distribution as an EBV candidate under the 'Ecosystem structure' class as it focuses on conserving the Earth's most important ecosystems. Amongst the following, SDG-15 targets the ecosystem distribution and habitat modelling, contributing to Target 15-1, which aims to "ensure the conservation, restoration and sustainable use of terrestrial and inland freshwater ecosystems and their services, in particular forests, wetlands, mountains and drylands, in line with obligations under international agreements, by 2020." In addition, ecosystem distribution and habitat modelling play a crucial role in achieving Target 15.4, which aims to conserve mountain ecosystems, enhancing their capacity to provide essential benefits for sustainable development by 2030, as well as Target 15.5, which endeavours to address the degradation of natural habitats, prevent biodiversity loss, and safeguard threatened species from extinction by 2020 urgently and significantly. Therefore, modelling, mapping, and monitoring habitats are paramount to reaching the SDG-15.
Species traits monitoring, as an EBV class and more broadly vegetation traits, can play a vital and critical role, significantly contributing to attaining SDG-15 objectives, as SDG-15's emphasis on safeguarding, restoring, and sustainably utilising terrestrial ecosystems, managing forests, combating desertification, and reversing biodiversity loss highlights the pressing need for comprehensive strategies (Mohieldin and Caballero 2015). Understanding and preserving ecological health is central to achieving SDG-15. By monitoring vegetation traits, there is a possibility of proactively promoting the sustainable use of terrestrial ecosystems. This approach aligns with the broader goal of ensuring the 'ecological health of mountain ecosystems, thereby enhancing their capacity to provide essential benefits for sustainable development by 2030', which is reflected in Target 15.4 and preserving these ecosystems is vital for the planet's overall health. For instance, monitoring vegetation traits such as chlorophyll content, LAI, water content, and productivity is pivotal in achieving specific targets outlined in SDG-15 (Estoque 2020). For instance, in order to achieve Target 15.1, which focuses on the conservation and restoration of ecosystems, tracking these traits provides crucial insights into the overall health and resilience of vegetation, aiding in identifying areas requiring conservation efforts or ecosystem restoration. Additionally, for Target 15.5, addressing the prevention of natural habitat degradation, monitoring these (i.e., chlorophyll content, LAI, water content, and productivity) helps detect early signs of stress or decline in vegetation, enabling timely interventions to safeguard habitats. In the context of Target 15.8, aimed at the early detection and management of invasive alien species, monitoring vegetation traits becomes instrumental in identifying changes in plant composition and health that may indicate the presence of invasive species, facilitating proactive measures to mitigate their impact (Figure 3).
Overall, the proposed EBVs in the 'Species traits' class serve as valuable indicators of ecosystem health, guiding targeted actions to fulfil the objectives of SDG-15 and contribute to the sustainable management of terrestrial ecosystems. Numerous studies have already explored and utilised various remote sensing data, including multispectral and hyperspectral data, at different scales (local and regional) for monitoring vegetation health and the restoration of ecosystems, aiming to achieve the SDG-15 target. For example, assessing forest degradation at multiple scales using MODIS, Landsat, and Sentinel data Mondal et al. (2020), monitoring and understanding forest health characterized by its resistance and resilience to disturbance (Lausch et al. 2016), and deriving canopy biophysical and biochemical parameters in ecosystem scale using image spectroscopy data (Stagakis et al. 2010) these instances underscore how remote sensing platforms can contribute significantly to achieving the targets outlined in SDG-15. It is important to note that the impact of monitoring vegetation traits using remote sensing applications extends beyond the confines of SDG-15, creating a ripple effect that synergistically supports other SDGs. One notable example is its contribution to climate resilience (SDG-13). By gaining insights into ecosystem dynamics through vegetation traits monitoring, we enhance our ability to adapt to and mitigate the impacts of climate change.
Additionally, this practice has far-reaching implications for sustainable agricultural practices, aligning with SDG-2. Monitoring vegetation traits provides valuable information for implementing sustainable farming methods, which, in turn, improves land and soil quality. This integrated approach addresses the interconnectedness of environmental sustainability and agricultural practices. In conclusion, monitoring vegetation traits is not merely a singular strategy but a pivotal tool that fosters holistic environmental sustainability. By addressing key targets within SDG-15, this practice contributes significantly to achieving multiple interconnected SDGs, forming a crucial component of a comprehensive and integrated approach to global development.
Challenges and Perspectives
While modern remote sensing techniques to quantify ecosystem structure greatly assist ecological and biodiversity studies, there are still gaps between the information gained from data-driven approaches and the in-depth understanding of the structural components required by restoration practitioners and land managers to guide interventions (Camarretta et al. 2020). Notably, the linkage between LiDAR-derived ecosystem structural properties, real-life ecological and biodiversity scenarios, and policy-making is still underexplored, especially when different decision-making levels are desired across various scales. This can hinder the progress towards sustainable forest management (Target 15.2) and action taken to reduce natural habitat degradation and halt biodiversity loss (Target 15.5). For example, understanding how ecosystem structure changes affect biodiversity loss and relate to sustainable management policy cannot be achieved without detailed knowledge of the interactions between species and vegetation structures in multiple environments and across various taxonomic groups (Davies and Asner 2014).
There is a need for improved metrics and predictors for capturing ecosystems and biodiversity dynamics at different scales to monitor progress on SDG targets and contribute to regional or national level SDG reporting (Mondal et al. 2020). Although spaceborne LiDAR has the advantage of obtaining data with global coverage, the coarse footprint still limits fine-scale ecosystem and biodiversity monitoring. From a technical development point of view, accurately extracting ecologically meaningful properties from LiDAR data is still essential to further improve the quality of data products capturing ecosystem structure (e.g., eliminating noises or misclassifications). Standardisation and FAIR principles (i.e., Findability, Accessibility, Interoperability, and Reusability) should be considered when developing workflows and generating data products at the regional or national level. Big data and heavy computational demands may still be a bottleneck for upscaling LiDAR remote sensing for large-scale ecosystem monitoring (Table 1). Nevertheless, evaluating the computational efficiency of different pipelines using parallelisation and distributed processing could be a potential solution. By providing an accurate and cost-effective way for measuring ecosystem structure, LiDAR remote sensing can foster the wider incorporation of ecosystem structure monitoring into biodiversity research, land management and policy-making at different scales, ultimately contributing to achieving SDG targets.
Although significant steps have been made concerning habitat modelling that includes in-situ vegetation plots as training data and remote sensing variables such as vegetation phenology and land cover as predictors, there are still significant challenges to improving the mapping accuracy of the individual habitat types and the locational accuracy of the in-situ vegetation plot data for training purposes. More advanced ML/AI techniques, including deep learning techniques, can be used to make wall-to-wall habitat maps since what has been presented so far mainly focuses on modelling each habitat type. Still, a substantial part of the modelled habitat types have limited accuracy, which means that more effort has to be put into collecting accurate and sufficient in-situ observations, next to the promotion of field habitat mapping that focuses on rare habitats that are difficult to model due to the invisibility from space, or have a very fragmented and complex nature. Concerning the last, it was observed that habitat modelling at 10 meters instead of 100 meters can improve classification accuracy (Carré et al. 2021). Moreover, new EO products, including vegetation height and land cover databases with a very high spatial resolution, are expected to be used as additional predictors.
Using remote sensing data to monitor vegetation traits for achieving SDG-15 presents challenges and promising perspectives (Prince 2019). One primary challenge is the need for consistent, high-spectral, and spatial-resolution data across diverse spatial and temporal scales. While multispectral satellite imagery, hyperspectral data, and LiDAR have advanced our ability to monitor physiological and phenological traits, ensuring the reliability and accuracy of these data at finer resolutions remains a hurdle. For example, traditional methods of remote sensing data for estimating plant productivity still cannot meet the needs to support SDG-15 goals due to technological limitations (Avtar et al. 2020; Giuliani et al. 2020), particularly in generating high-resolution productivity products over large areas. In recent decades, multispectral satellite data such as MODIS have been widely used to generate plant productivity products, such as net primary productivity (Hu et al. 2021; Potter et al. 2007; Wu et al. 2010). However, the spatial resolution of such products is still insufficient for monitoring progress towards SDGs.
Furthermore, it is important to note that most studies on other species traits, like LDMC and SLA, were established using hyperspectral data at the local scale obtained from airborne flight campaigns or using field instruments. Airborne hyperspectral sensors are often relatively expensive due to their limited spatial coverage, requiring multiple flight lines to cover a study area (Adão et al. 2017). This limitation can be overcome by using hyperspectral satellites. Several hyperspectral satellites have been launched or planned for launching in the near and distant future. These missions will provide a better opportunity for monitoring species traits and achieving SDG 15 (Briottet 2022). For example, recently launched hyperspectral satellites like EnMap, DESIS, and PRISMA offer more imagery alternatives, and their newly developed image-processing algorithms provide more analytical tools. Hyperspectral remote sensing is positioned to become one of the core technologies for geospatial research, exploration, and monitoring of vegetation and species traits.
Despite these challenges, the perspectives offered by remote sensing data are highly promising. Continued technological advancements, including the development of more sophisticated sensors and the integration of AI, hold the potential to enhance the accuracy and efficiency of trait monitoring. Collaborative efforts to establish standardised methodologies and protocols can foster comparability between studies, enabling a more comprehensive understanding of vegetation traits on a global scale.
Moreover, the integration of ground-based measurements with remote sensing data can provide a more holistic view, capturing local variations and nuances that may be missed by satellite observations alone. In conclusion, while data quality, cost, and standardisation challenges persist, remote sensing data for monitoring vegetation traits offers valuable perspectives for achieving SDGs. Overcoming these challenges requires continued investment in technology, interdisciplinary collaboration, and the development of standardised approaches. The potential benefits, including enhanced ecosystem management, biodiversity conservation, and support for multiple interconnected SDGs, underscore the importance of addressing these challenges to fully unlock the potential of remote sensing in fostering sustainable development.
References
- Acebes, P., Lillo, P., & Jaime-González, C. (2021). Disentangling LiDAR Contribution in Modelling Species–Habitat Structure Relationships in Terrestrial Ecosystems Worldwide. A Systematic Review and Future Directions. Remote Sensing, 13, 3447.
- Adão, T., Hruška, J., Pádua, L., Bessa, J., Peres, E., Morais, R., & Sousa, J.J. (2017). Hyperspectral imaging: A review on UAV-based sensors, data processing and applications for agriculture and forestry. Remote Sensing, 9, 1110.
- Alberton, B., Torres, R.d.S., Cancian, L.F., Borges, B.D., Almeida, J., Mariano, G.C., dos Santos, J., & Morellato, L.P.C. (2017). Introducing digital cameras to monitor plant phenology in the tropics: applications for conservation. Perspectives in Ecology and Conservation, 15, 82-90.
- Ali, A.M. (2016). Quantitative remote sensing of forest leaf functional traits: leaf dry matter content and specific leaf area. University of Twente Faculty of Geo-Information and Earth Observation (ITC).
- Ali, A.M., Darvishzadeh, R., Skidmore, A., Heurich, M., Paganini, M., Heiden, U., & Mücher, S. (2020). Evaluating prediction models for mapping canopy chlorophyll content across biomes. Remote Sensing, 12, 1788.
- Ali, A.M., Darvishzadeh, R., Skidmore, A.K., van Duren, I., Heiden, U., & Heurich, M. (2016). Estimating leaf functional traits by inversion of PROSPECT: Assessing leaf dry matter content and specific leaf area in mixed mountainous forest. International Journal of Applied Earth Observation and Geoinformation, 45, 66-76.
- Antonarakis, A.S., Munger, J.W., & Moorcroft, P.R. (2014). Imaging spectroscopy- and lidar-derived estimates of canopy composition and structure to improve predictions of forest carbon fluxes and ecosystem dynamics. Geophysical Research Letters, 41, 2535-2542.
- Antonarakis, A.S., Saatchi, S.S., Chazdon, R.L., & Moorcroft, P.R. (2011). Using Lidar and Radar measurements to constrain predictions of forest ecosystem structure and function. Ecological Applications, 21, 1120-1137.
- Assmann, J.J., Moeslund, J.E., Treier, U.A., & Normand, S. (2022). EcoDes-DK15: high-resolution ecological descriptors of vegetation and terrain derived from Denmark's national airborne laser scanning data set. Earth System Science Data, 14, 823-844.
- Avtar, R., Komolafe, A.A., Kouser, A., Singh, D., Yunus, A.P., Dou, J., Kumar, P., Gupta, R.D., Johnson, B.A., & Minh, H.V.T. (2020). Assessing sustainable development prospects through remote sensing: A review. Remote sensing applications: Society and environment, 20, 100402.
- Bakx, T.R.M., Koma, Z., Seijmonsbergen, A.C., & Kissling, W.D. (2019). Use and categorization of Light Detection and Ranging vegetation metrics in avian diversity and species distribution research. Diversity and Distributions, 25, 1045-1059.
- Beland, M., Parker, G., Sparrow, B., Harding, D., Chasmer, L., Phinn, S., Antonarakis, A., & Strahler, A. (2019). On promoting the use of lidar systems in forest ecosystem research. Forest Ecology and Management, 450, 117484.
- Bhattarai, R., Rahimzadeh-Bajgiran, P., Weiskittel, A., Homayouni, S., Gara, T.W., & Hanavan, R.P. (2022). Estimating species-specific leaf area index and basal area using optical and SAR remote sensing data in Acadian mixed spruce-fir forests, USA. International Journal of Applied Earth Observation and Geoinformation, 108, 102727.
- Briottet, X. (2022). BIODIVERSITY–A new space mission to monitor Earth ecosystems at fine scale. Revue Française de Photogrammétrie et de Télédétection, 224, 33-58.
- Camarretta, N., Harrison, P.A., Bailey, T., Potts, B., Lucieer, A., Davidson, N., & Hunt, M. (2020). Monitoring forest structure to guide adaptive management of forest restoration: a review of remote sensing approaches. New Forests, 51, 573-596.
- Carré, A.ę., Malak, D.A., Marín, A.I., Trombetti, M., Ruf, K., Hennekens, S., Mücher, S., & Stein, U. (2021). Comparative analysis of EUNIS habitats modelling and extended ecosystem mapping: toward a shared and multifunctional map of European wetland and coastal ecosystems.
- Cavender-Bares, J., Schneider, F.D., Santos, M.J., Armstrong, A., Carnaval, A., Dahlin, K.M., Fatoyinbo, L., Hurtt, G.C., Schimel, D., Townsend, P.A., Ustin, S.L., Wang, Z., & Wilson, A.M. (2022). Integrating remote sensing with ecology and evolution to advance biodiversity conservation. Nature Ecology & Evolution, 6, 506-519.
- Choi, H., & Song, Y. (2022). Comparing tree structures derived among airborne, terrestrial and mobile LiDAR systems in urban parks. Giscience & Remote Sensing, 59, 843-860.
- Chytrý, M., Hennekens, S.M., Jiménez-Alfaro, B., Knollová, I., Dengler, J., Jansen, F., Landucci, F., Schaminée, J.H., Aćić, S., & Agrillo, E. (2016). European Vegetation Archive (EVA): an integrated database of European vegetation plots. Applied vegetation science, 19, 173-180.
- Chytrý, M., Tichý, L., Hennekens, S.M., Knollová, I., Janssen, J.A., Rodwell, J.S., Peterka, T., Marcenò, C., Landucci, F., & Danihelka, J. (2020). EUNIS Habitat Classification: Expert system, characteristic species combinations and distribution maps of European habitats. Applied vegetation science, 23, 648-675.
- Darvishzadeh, R., Skidmore, A., Abdullah, H., Cherenet, E., Ali, A., Wang, T., Nieuwenhuis, W., Heurich, M., Vrieling, A., & O’Connor, B. (2019). Mapping leaf chlorophyll content from Sentinel-2 and RapidEye data in spruce stands using the invertible forest reflectance model. International Journal of Applied Earth Observation and Geoinformation, 79, 58-70.
- Darvishzadeh, R., Skidmore, A., Schlerf, M., & Atzberger, C. (2008). Inversion of a radiative transfer model for estimating vegetation LAI and chlorophyll in a heterogeneous grassland. Remote Sensing of Environment, 112, 2592-2604.
- Davies, A.B., & Asner, G.P. (2014). Advances in animal ecology from 3D-LiDAR ecosystem mapping. Trends in Ecology & Evolution, 29, 681-691.
- Davies, C.E., Moss, D., & Hill, M.O. (2004). EUNIS habitat classification revised 2004. Report to: European environment agency-European topic centre on nature protection and biodiversity, 127-143.
- Dubayah, R., Blair, J.B., Goetz, S., Fatoyinbo, L., Hansen, M., Healey, S., Hofton, M., Hurtt, G., Kellner, J., Luthcke, S., Armston, J., Tang, H., Duncanson, L., Hancock, S., Jantz, P., Marselis, S., Patterson, P.L., Qi, W., & Silva, C. (2020). The Global Ecosystem Dynamics Investigation: High-resolution laser ranging of the Earth’s forests and topography. Science of Remote Sensing, 1, 100002.
- Estoque, R.C. (2020). A review of the sustainability concept and the state of SDG monitoring using remote sensing. Remote Sensing, 12, 1770.
- Gara, T.W., Darvishzadeh, R., Skidmore, A.K., Wang, T., & Heurich, M. (2019). Accurate modelling of canopy traits from seasonal Sentinel-2 imagery based on the vertical distribution of leaf traits. ISPRS Journal of Photogrammetry and Remote Sensing, 157, 108-123.
- Gilić, F., Gašparović, M., & Baučić, M. (2023). Current state and challenges in producing large-scale land cover maps: review based on recent land cover products. Geocarto international, 38, 2242693.
- Giuliani, G., Mazzetti, P., Santoro, M., Nativi, S., Van Bemmelen, J., Colangeli, G., & Lehmann, A. (2020). Knowledge generation using satellite earth observations to support sustainable development goals (SDG): A use case on Land degradation. International Journal of Applied Earth Observation and Geoinformation, 88, 102068.
- Gobron, N., Pinty, B., Taberner, M., Mélin, F., Verstraete, M., & Widlowski, J.-L. (2006). Monitoring the photosynthetic activity of vegetation from remote sensing data. Advances in Space Research, 38, 2196-2202.
- Grimm, N.B., Chapin III, F.S., Bierwagen, B., Gonzalez, P., Groffman, P.M., Luo, Y., Melton, F., Nadelhoffer, K., Pairis, A., & Raymond, P.A. (2013). The impacts of climate change on ecosystem structure and function. Frontiers in Ecology and the Environment, 11, 474-482.
- Guo, Q., Liang, X., Li, W., Jin, S., Guan, H., Cheng, K., Su, Y., & Tao, S. (2022). LiDAR Remote Sensing of Forest Ecosystems: Applications and Prospects. In B. Li, X. Shi, A.X. Zhu, C. Wang, & H. Lin (Eds.), New Thinking in GIScience (pp. 221-231). Singapore: Springer Nature Singapore.
- Hennekens, S. (2017). Distribution and habitat suitability maps of revised EUNIS grassland types. In: EEA-European Environment Agency.
- Hennekens, S. (2019a). Distribution and habitat suitability maps of revised EUNIS coastal and wetland habitats. In: Task.
- Hennekens, S. (2019b). Distribution and Habitat Suitability Maps of Revised EUNIS Vegetated Man-Made Habitats.
- Hennekens, S. (2020). Distribution and habitat suitability maps of revised EUNIS Marine salt marshes and Sparsely vegetated habitats'.
- Hilker, T., Gitelson, A., Coops, N.C., Hall, F.G., & Black, T.A. (2011). Tracking plant physiological properties from multi-angular tower-based remote sensing. Oecologia, 165, 865-876.
- Hirzel, A.H., & Le Lay, G.ź. (2008). Habitat suitability modelling and niche theory. Journal of Applied Ecology, 45, 1372-1381.
- Homolová, L., Malenovský, Z., Clevers, J.G., García-Santos, G., & Schaepman, M.E. (2013). Review of optical-based remote sensing for plant trait mapping. Ecological Complexity, 15, 1-16.
- Houborg, R., Fisher, J.B., & Skidmore, A.K. (2015). Advances in remote sensing of vegetation function and traits. In (pp. 1-6): Elsevier.
- Hu, Y., Wang, C., Yu, X., & Yin, S. (2021). Evaluating Trends of Land Productivity Change and Their Causes in the Han River Basin, China: In Support of SDG Indicator 15.3. 1. Sustainability, 13, 13664.
- Hyyppä, E., Kukko, A., Kaijaluoto, R., White, J.C., Wulder, M.A., Pyörälä, J., Liang, X., Yu, X., Wang, Y., Kaartinen, H., Virtanen, J.-P., & Hyyppä, J. (2020). Accurate derivation of stem curve and volume using backpack mobile laser scanning. ISPRS Journal of Photogrammetry and Remote Sensing, 161, 246-262.
- Jacquemoud, S., Bacour, C., Poilvé, H., & Frangi, J.-P. (2000). Comparison of four radiative transfer models to simulate plant canopies reflectance: Direct and inverse mode. Remote Sensing of Environment, 74, 471-481.
- Kamps, M., Bouten, W., & Seijmonsbergen, A., C. (2017). LiDAR and Orthophoto Synergy to optimize Object-Based Landscape Change: Analysis of an Active Landslide. Remote Sensing, 9, 805.
- Kattge, J., B├Ânisch, G., D├şaz, S., Lavorel, S., Prentice, I.C., Leadley, P., Tautenhahn, S., Werner, G.D., Aakala, T., & Abedi, M. (2020). TRY plant trait databaseÔÇôenhanced coverage and open access. Global change biology, 26, 119-188.
- Kellner, J.R., Armston, J., Birrer, M., Cushman, K.C., Duncanson, L., Eck, C., Falleger, C., Imbach, B., Král, K., Krůček, M., Trochta, J., Vrška, T., & Zgraggen, C. (2019). New Opportunities for Forest Remote Sensing Through Ultra-High-Density Drone Lidar. Surveys in Geophysics, 40, 959-977.
- Kissling, W.D., Shi, Y., Koma, Z., Meijer, C., Ku, O., Nattino, F., Seijmonsbergen, A.C., & Grootes, M.W. (2022). Laserfarm – A high-throughput workflow for generating geospatial data products of ecosystem structure from airborne laser scanning point clouds. Ecological Informatics, 72, 101836.
- Kissling, W.D., Shi, Y., Koma, Z., Meijer, C., Ku, O., Nattino, F., Seijmonsbergen, A.C., & Grootes, M.W. (2023). Country-wide data of ecosystem structure from the third Dutch airborne laser scanning survey. Data in Brief, 46, 108798.
- Kleyer, M., & Minden, V. (2015). Why functional ecology should consider all plant organs: An allocation-based perspective. Basic and Applied Ecology, 16, 1-9.
- Kolb, A., & Diekmann, M. (2005). Effects of life-history traits on responses of plant species to forest fragmentation. Conservation biology, 19, 929-938.
- Koma, Z., Grootes, M.W., Meijer, C.W., Nattino, F., Seijmonsbergen, A.C., Sierdsema, H., Foppen, R., & Kissling, W.D. (2021a). Niche separation of wetland birds revealed from airborne laser scanning. Ecography, 44, 907-918.
- Koma, Z., Seijmonsbergen, A.C., & Kissling, W.D. (2021b). Classifying wetland-related land cover types and habitats using fine-scale lidar metrics derived from country-wide Airborne Laser Scanning. Remote Sensing in Ecology and Conservation, 7, 80-96.
- Kussul, N., Lavreniuk, M., Kolotii, A., Skakun, S., Rakoid, O., & Shumilo, L. (2019). A workflow for Sustainable Development Goals indicators assessment based on high-resolution satellite data. International Journal of Digital Earth.
- Lamy, T., Liss, K., Gonzalez, A., & Bennett, E. (2016). Landscape structure affects the provision of multiple ecosystem services. Environmental Research Letters, 11, 124017.
- Lausch, A., Erasmi, S., King, D.J., Magdon, P., & Heurich, M. (2016). Understanding forest health with remote sensing-part I—a review of spectral traits, processes and remote-sensing characteristics. Remote Sensing, 8, 1029.
- Lefsky, M.A., Cohen, W.B., Parker, G.G., & Harding, D.J. (2002). Lidar Remote Sensing for Ecosystem Studies: Lidar, an emerging remote sensing technology that directly measures the three-dimensional distribution of plant canopies, can accurately estimate vegetation structural attributes and should be of particular interest to forest, landscape, and global ecologists. BioScience, 52, 19-30.
- Levick, S.R., & Rogers, K.H. (2008). Structural biodiversity monitoring in savanna ecosystems: Integrating LiDAR and high resolution imagery through object-based image analysis. In T. Blaschke, S. Lang, & G.J. Hay (Eds.), Object-Based Image Analysis: Spatial Concepts for Knowledge-Driven Remote Sensing Applications (pp. 477-491). Berlin, Heidelberg: Springer Berlin Heidelberg.
- Liang, X., Hyyppä, J., Kukko, A., Kaartinen, H., Jaakkola, A., & Yu, X. (2014). The Use of a Mobile Laser Scanning System for Mapping Large Forest Plots. Ieee Geoscience and Remote Sensing Letters, 11, 1504-1508.
- Liang, X., Kankare, V., Hyyppä, J., Wang, Y., Kukko, A., Haggrén, H., Yu, X., Kaartinen, H., Jaakkola, A., Guan, F., Holopainen, M., & Vastaranta, M. (2016). Terrestrial laser scanning in forest inventories. ISPRS Journal of Photogrammetry and Remote Sensing, 115, 63-77.
- Liang, X., Wang, Y., Pyörälä, J., Lehtomäki, M., Yu, X., Kaartinen, H., Kukko, A., Honkavaara, E., Issaoui, A.E., & Nevalainen, O. (2019). Forest in situ observations using unmanned aerial vehicle as an alternative of terrestrial measurements. Forest Ecosystems, 6, 1-16.
- Mag, Z., Szép, T., Nagy, K., & Standovár, T. (2011). Modelling forest bird community richness using CORINE land cover data: a study at the landscape scale in Hungary. Community Ecology, 12, 241-248.
- Mishra, P., Asaari, M.S.M., Herrero-Langreo, A., Lohumi, S., Diezma, B., & Scheunders, P. (2017). Close range hyperspectral imaging of plants: A review. Biosystems Engineering, 164, 49-67.
- Mohieldin, M., & Caballero, P. (2015). Protect, restore and promote sustainable use of terrestrial ecosystems, sustainably manage forests, combat desertification, and halt and reverse land degradation and halt biodiversity loss. UN Chronicle, 51, 34-35.
- Mondal, P., McDermid, S.S., & Qadir, A. (2020). A reporting framework for Sustainable Development Goal 15: Multi-scale monitoring of forest degradation using MODIS, Landsat and Sentinel data. Remote Sensing of Environment, 237, 111592.
- Morellato, L.P.C., Alberton, B., Alvarado, S.T., Borges, B., Buisson, E., Camargo, M.G.G., Cancian, L.F., Carstensen, D.W., Escobar, D.F., & Leite, P.T. (2016). Linking plant phenology to conservation biology. Biological conservation, 195, 60-72.
- Moreno-Martínez, Á., Camps-Valls, G., Kattge, J., Robinson, N., Reichstein, M., van Bodegom, P., Kramer, K., Cornelissen, J.H.C., Reich, P., & Bahn, M. (2018). A methodology to derive global maps of leaf traits using remote sensing and climate data. Remote Sensing of Environment, 218, 69-88.
- Mücher, C., & Hennekens, S. (2016). Modelling habitat probability maps for EUNIS habitat types heathland, scrub and tundra based on vegetation relev├ęs, environmental data and Copernicus land cover data: ETC/BD Report 4/2016. In: ETC/BD.
- Mücher, C., & Hennekens, S. (2018). Processing European habitat probability maps at 20m resolution for EUNIS grassland types based on vegetation relev├ęs, environmental data and Copernicus HRL grassland: ETC/BD Technical paper 8/2018. In: ETC/BD.
- Mücher, C., & Hennekens, S. (2019). Processing European habitat probability maps for EUNIS Forest (T), Heathland, scrub and tundra (S) and Grassland (R) habitat types based on vegetation relev├ęs, environmental data and Copernicus land cover: ETC/BD Technical paper 2/2019. In: ETC/BD.
- Mücher, C., & Hennekens, S. (2020). Producing European habitat probability maps for wetlands and coastal habitats based on in-situ vegetation plots, environmental data and Copernicus land cover. In: ETC/BD.
- Mücher , C., Hennekens, S., Bunce, R., & Schaminée, J. (2004). Mapping European habitats to support the design and implementation of a pan-European ecological network; the PEENHAB-project. In: Alterra.
- Mücher, C., Hennekens, S., Schaminée, J., Halada, L., & Halabuk, A. (2015). Modelling the spatial distribution of EUNIS forest habitats based on vegetation relev├ęs and Copernicus HRL. European Topic Centre Biological Diversity.
- Müller, J., Bae, S., Röder, J., Chao, A., & Didham, R.K. (2014). Airborne LiDAR reveals context dependence in the effects of canopy architecture on arthropod diversity. Forest Ecology and Management, 312, 129-137.
- Murawski, S.A. (2000). Definitions of overfishing from an ecosystem perspective. ICES Journal of Marine Science, 57, 649-658.
- Navarro, L.M., Fernández, N., Guerra, C., Guralnick, R., Kissling, W.D., Londoño, M.C., Muller-Karger, F., Turak, E., Balvanera, P., & Costello, M.J. (2017). Monitoring biodiversity change through effective global coordination. Current opinion in environmental sustainability, 29, 158-169.
- Nijland, W., De Jong, R., De Jong, S.M., Wulder, M.A., Bater, C.W., & Coops, N.C. (2014). Monitoring plant condition and phenology using infrared sensitive consumer grade digital cameras. Agricultural and Forest Meteorology, 184, 98-106.
- Omasa, K., Hosoi, F., & Konishi, A. (2007). 3D lidar imaging for detecting and understanding plant responses and canopy structure. Journal of experimental botany, 58, 881-898.
- Pearcy, R.W., Björkman, O., Caldwell, M.M., Keeley, J.E., Monson, R.K., & Strain, B.R. (1987). Carbon Gain by Plants in Natural Environments: Carbon assimilation analysis provides an understanding of how plants function in diverse environments. BioScience, 37, 21-29.
- Peng, J., Wang, Y., Wu, J., & Zhang, Y. (2007). Evaluation for regional ecosystem health: Methodology and research progress. Acta Ecologica Sinica, 27, 4877-4885.
- Pereira, H.M., Belnap, J., Brummitt, N., Collen, B., Ding, H., Gonzalez-Espinosa, M., Gregory, R.D., Honrado, J.ú., Jongman, R.H., & Julliard, R. (2010). Global biodiversity monitoring. Frontiers in Ecology and the Environment, 8, 459-460.
- Pereira, H.M., Ferrier, S., Walters, M., Geller, G.N., Jongman, R., Scholes, R.J., Bruford, M.W., Brummitt, N., Butchart, S., & Cardoso, A. (2013). Essential biodiversity variables. Science, 339, 277-278.
- Potapov, P., Li, X., Hernandez-Serna, A., Tyukavina, A., Hansen, M.C., Kommareddy, A., Pickens, A., Turubanova, S., Tang, H., Silva, C.E., Armston, J., Dubayah, R., Blair, J.B., & Hofton, M. (2021). Mapping global forest canopy height through integration of GEDI and Landsat data. Remote Sensing of Environment, 253, 112165.
- Potter, C., Gross, P., Genovese, V., & Smith, M.-L. (2007). Net primary productivity of forest stands in New Hampshire estimated from Landsat and MODIS satellite data. Carbon Balance and Management, 2, 1-11.
- Prince, S.D. (2019). Challenges for remote sensing of the Sustainable Development Goal SDG 15.3. 1 productivity indicator. Remote Sensing of Environment, 234, 111428.
- Proença, V., Martin, L.J., Pereira, H.M., Fernandez, M., McRae, L., Belnap, J., Böhm , M., Brummitt, N., García-Moreno, J., & Gregory, R.D. (2017). Global biodiversity monitoring: from data sources to essential biodiversity variables. Biological Conservation, 213, 256-263.
- Qi, Y., Coops, N.C., Daniels, L.D., & Butson, C.R. (2022). Comparing tree attributes derived from quantitative structure models based on drone and mobile laser scanning point clouds across varying canopy cover conditions. ISPRS Journal of Photogrammetry and Remote Sensing, 192, 49-65.
- Riaño, D., Vaughan, P., Chuvieco, E., Zarco-Tejada, P.J., & Ustin, S.L. (2005). Estimation of fuel moisture content by inversion of radiative transfer models to simulate equivalent water thickness and dry matter content: Analysis at leaf and canopy level. IEEE Transactions on Geoscience and Remote Sensing, 43, 819-826.
- Robinson, S.K., & Holmes, R.T. (1984). Effects of plant species and foliage structure on the foraging behavior of forest birds. The Auk, 101, 672-684.
- Sayer, J., Sheil, D., Galloway, G., Riggs, R.A., Mewett, G., MacDicken, K.G., Arts, B., Boedhihartono, A.K., Langston, J., & Edwards, D.P. (2019). SDG 15 Life on land–the central role of forests in sustainable development. Sustainable development goals: their impacts on forest and people (pp. 482-509): Cambridge University Press.
- Shi, Y., Wang, T., Skidmore, A.K., & Heurich, M. (2018). Important LiDAR metrics for discriminating forest tree species in Central Europe. ISPRS Journal of Photogrammetry and Remote Sensing, 137, 163-174.
- Skidmore, A.K., Coops, N.C., Neinavaz, E., Ali, A., Schaepman, M.E., Paganini, M., Kissling, W.D., Vihervaara, P., Darvishzadeh, R., & Feilhauer, H. (2021). Priority list of biodiversity metrics to observe from space. Nature Ecology & Evolution, 5, 896-906.
- Stagakis, S., Markos, N., Sykioti, O., & Kyparissis, A. (2010). Monitoring canopy biophysical and biochemical parameters in ecosystem scale using satellite hyperspectral imagery: An application on a Phlomis fruticosa Mediterranean ecosystem using multiangular CHRIS/PROBA observations. Remote Sensing of Environment, 114, 977-994.
- Tickle, P.K., Lee, A., Lucas, R.M., Austin, J., & Witte, C. (2006). Quantifying Australian forest floristics and structure using small footprint LiDAR and large scale aerial photography. Forest Ecology and Management, 223, 379-394.
- Valbuena, R., O'Connor, B., Zellweger, F., Simonson, W., Vihervaara, P., Maltamo, M., Silva, C.A., Almeida, D.R.A., Danks, F., Morsdorf, F., Chirici, G., Lucas, R., Coomes, D.A., & Coops, N.C. (2020). Standardizing ecosystem morphological traits from 3D information sources. Trends in Ecology & Evolution, 35, 656-667.
- Westoby, M., Falster, D.S., Moles, A.T., Vesk, P.A., & Wright, I.J. (2002). Plant ecological strategies: some leading dimensions of variation between species. Annual review of ecology and systematics, 33, 125-159.
- Whittingham, M.J., & Evans, K.L. (2004). The effects of habitat structure on predation risk of birds in agricultural landscapes. Ibis, 146, 210-220.
- Wu, C., Munger, J.W., Niu, Z., & Kuang, D. (2010). Comparison of multiple models for estimating gross primary production using MODIS and eddy covariance data in Harvard Forest. Remote Sensing of Environment, 114, 2925-2939.
- Wulder, M.A., Coops, N.C., Hudak, A.T., Morsdorf, F., Nelson, R., Newnham, G., & Vastaranta, M. (2013). Status and prospects for LiDAR remote sensing of forested ecosystems. Canadian Journal of Remote Sensing, 39, S1-S5.
- Zhang, L., Qi, S., Li, P., & Zhou, P. (2024). Influence of stand and environmental factors on forest productivity of Platycladus orientalis plantations in Beijing’s mountainous areas. Ecological Indicators, 158, 111385.
- Zhao, F., Strahler, A.H., Schaaf, C.L., Yao, T., Yang, X., Wang, Z., Schull, M.A., Román, M.O., Woodcock, C.E., Olofsson, P., Ni-Meister, W., Jupp, D.L.B., Lovell, J.L., Culvenor, D.S., & Newnham, G.J. (2012). Measuring gap fraction, element clumping index and LAI in Sierra Forest stands using a full-waveform ground-based lidar. Remote Sensing of Environment, 125, 73-79.
- Zhu, X., Wang, T., Darvishzadeh, R., Skidmore, A.K., & Niemann, K.O. (2015). 3D leaf water content mapping using terrestrial laser scanner backscatter intensity with radiometric correction. ISPRS Journal of Photogrammetry and Remote Sensing, 110, 14-23.
- Zwally, H.J., Schutz, B., Abdalati, W., Abshire, J., Bentley, C., Brenner, A., Bufton, J., Dezio, J., Hancock, D., Harding, D., Herring, T., Minster, B., Quinn, K., Palm, S., Spinhirne, J., & Thomas, R. (2002). ICESat's laser measurements of polar ice, atmosphere, ocean, and land. Journal of Geodynamics, 34, 405-445.
Figure 1.
The flowchart gives an overview of the general methodological approach to processing the distribution, suitability, and habitat probability maps. Conceptual content provided by the authors; figure drafted with assistance from FigureLabs (figurelabs.ai).
Figure 1.
The flowchart gives an overview of the general methodological approach to processing the distribution, suitability, and habitat probability maps. Conceptual content provided by the authors; figure drafted with assistance from FigureLabs (figurelabs.ai).
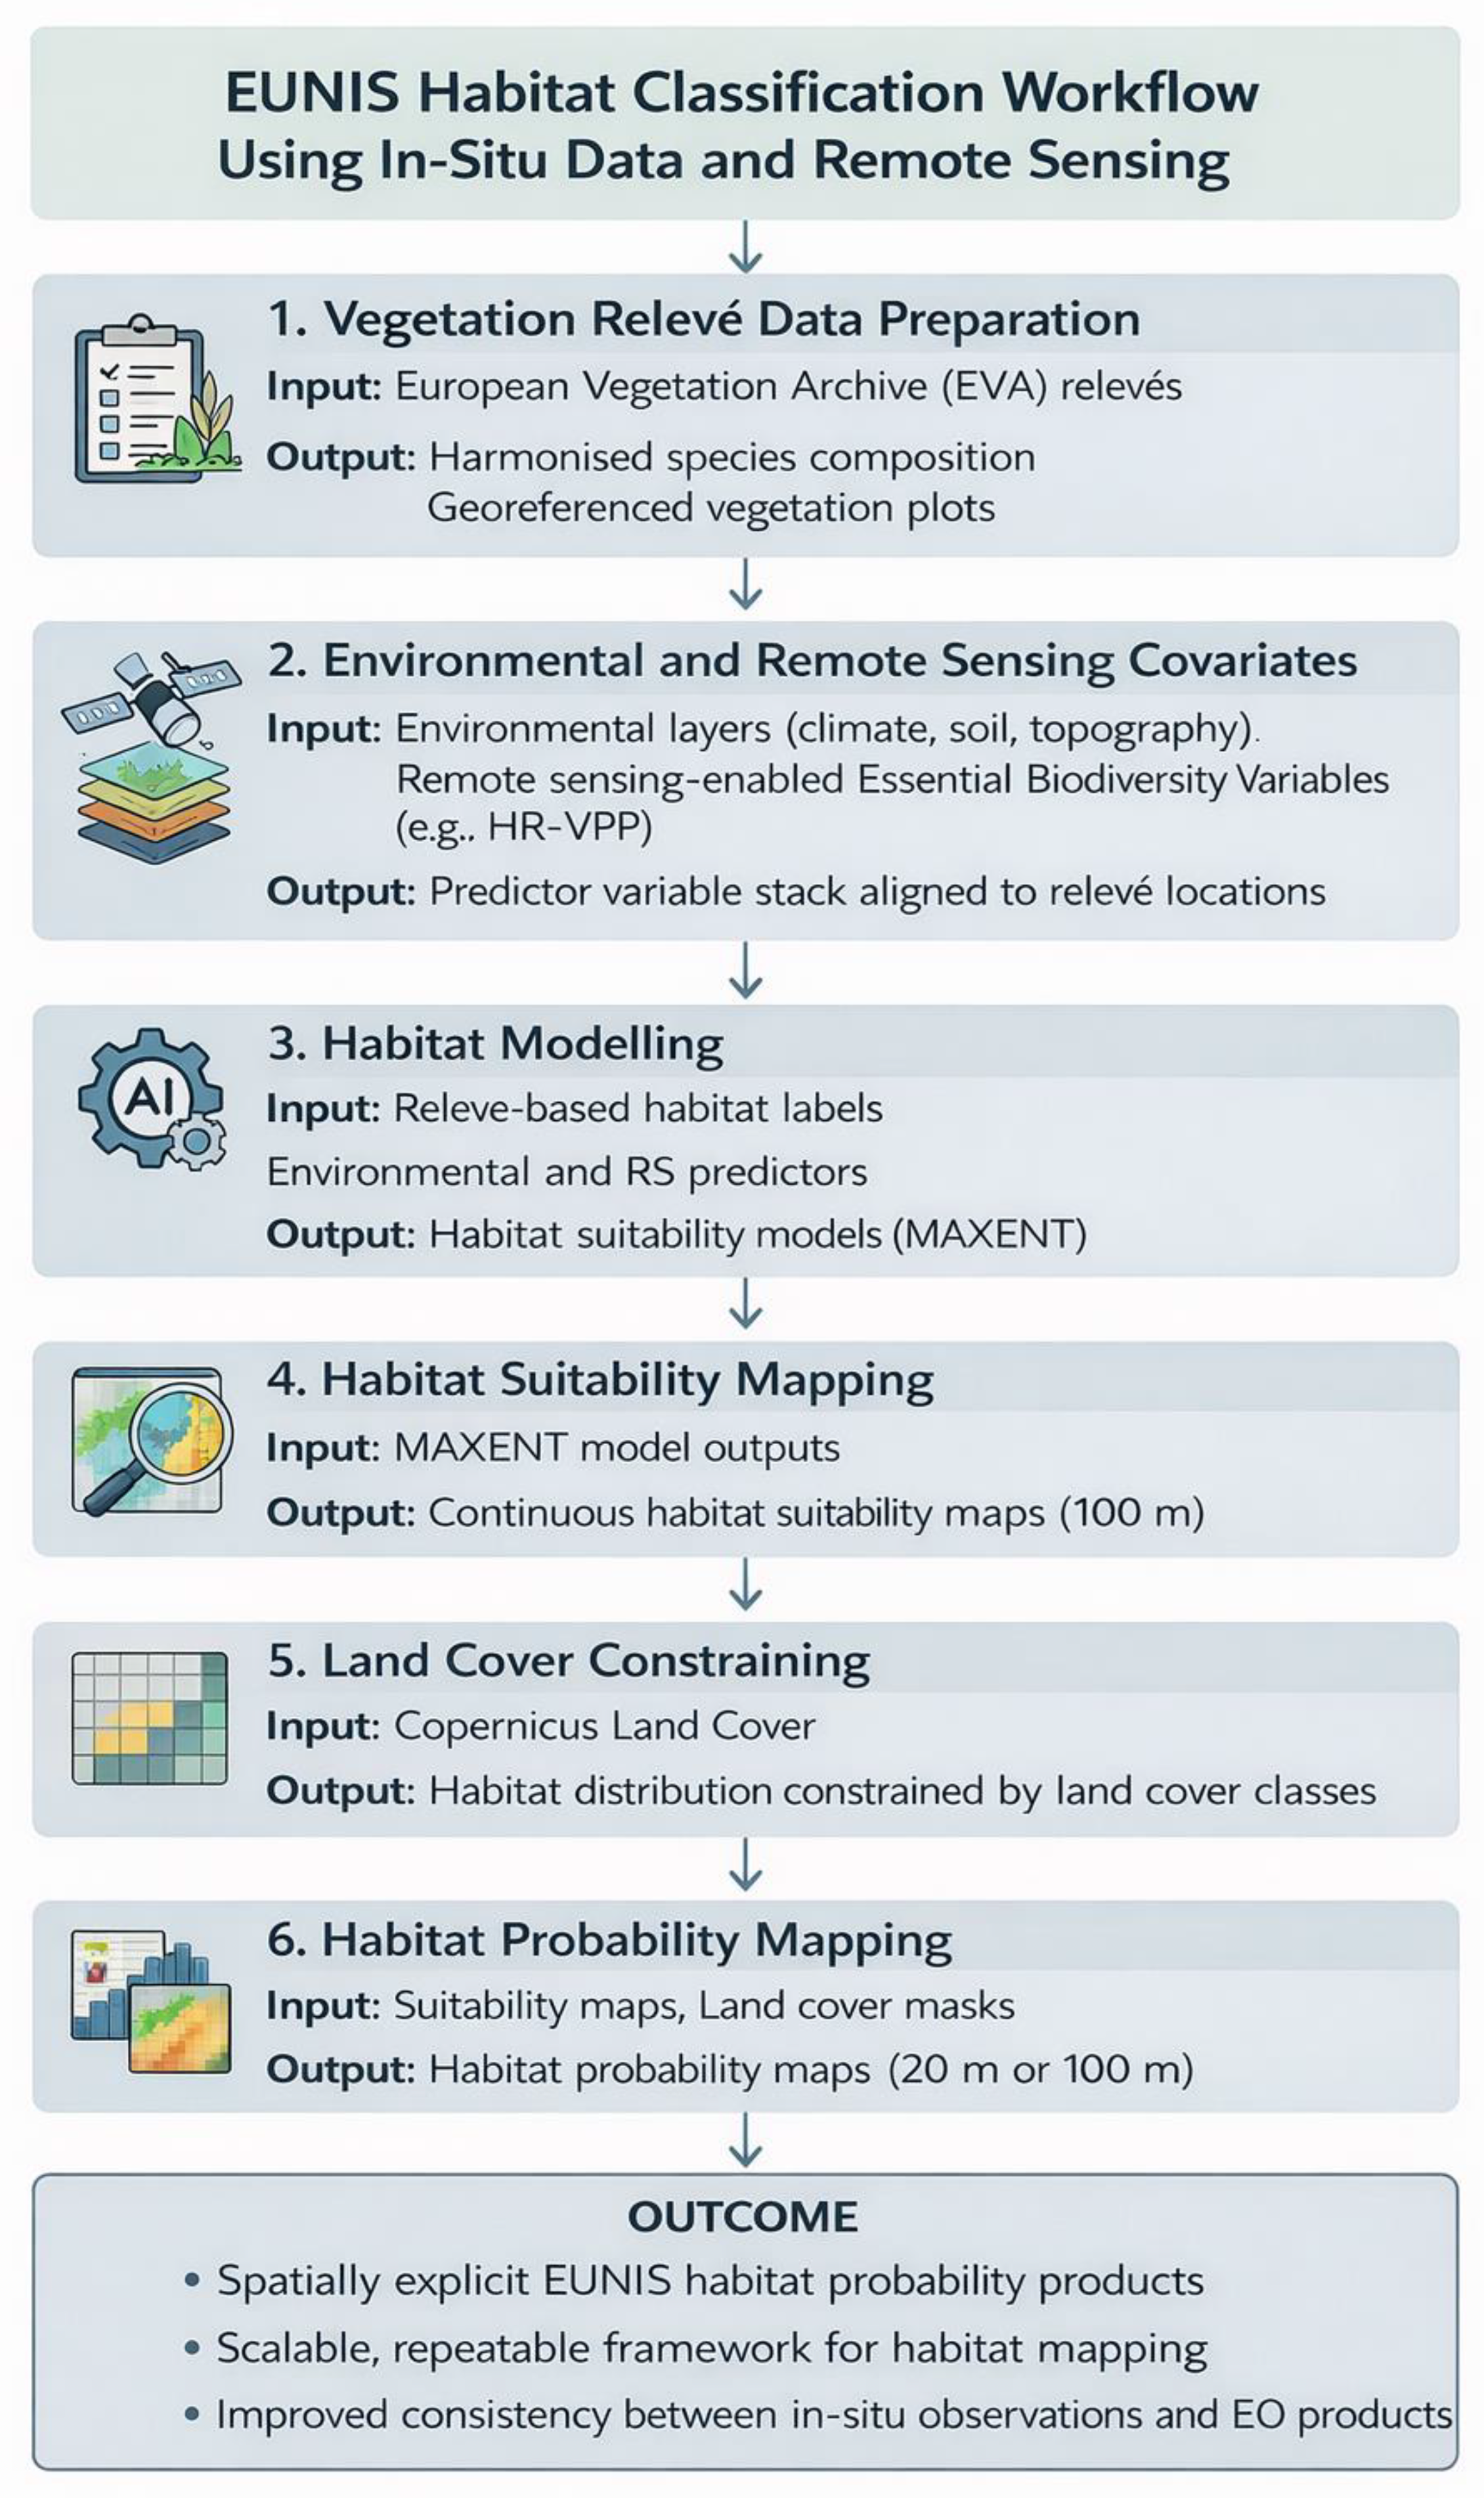
Figure 2.
Example of habitat distribution, habitat suitability and habitat probability for EUNIS habitat Wet heath. .
Figure 2.
Example of habitat distribution, habitat suitability and habitat probability for EUNIS habitat Wet heath. .
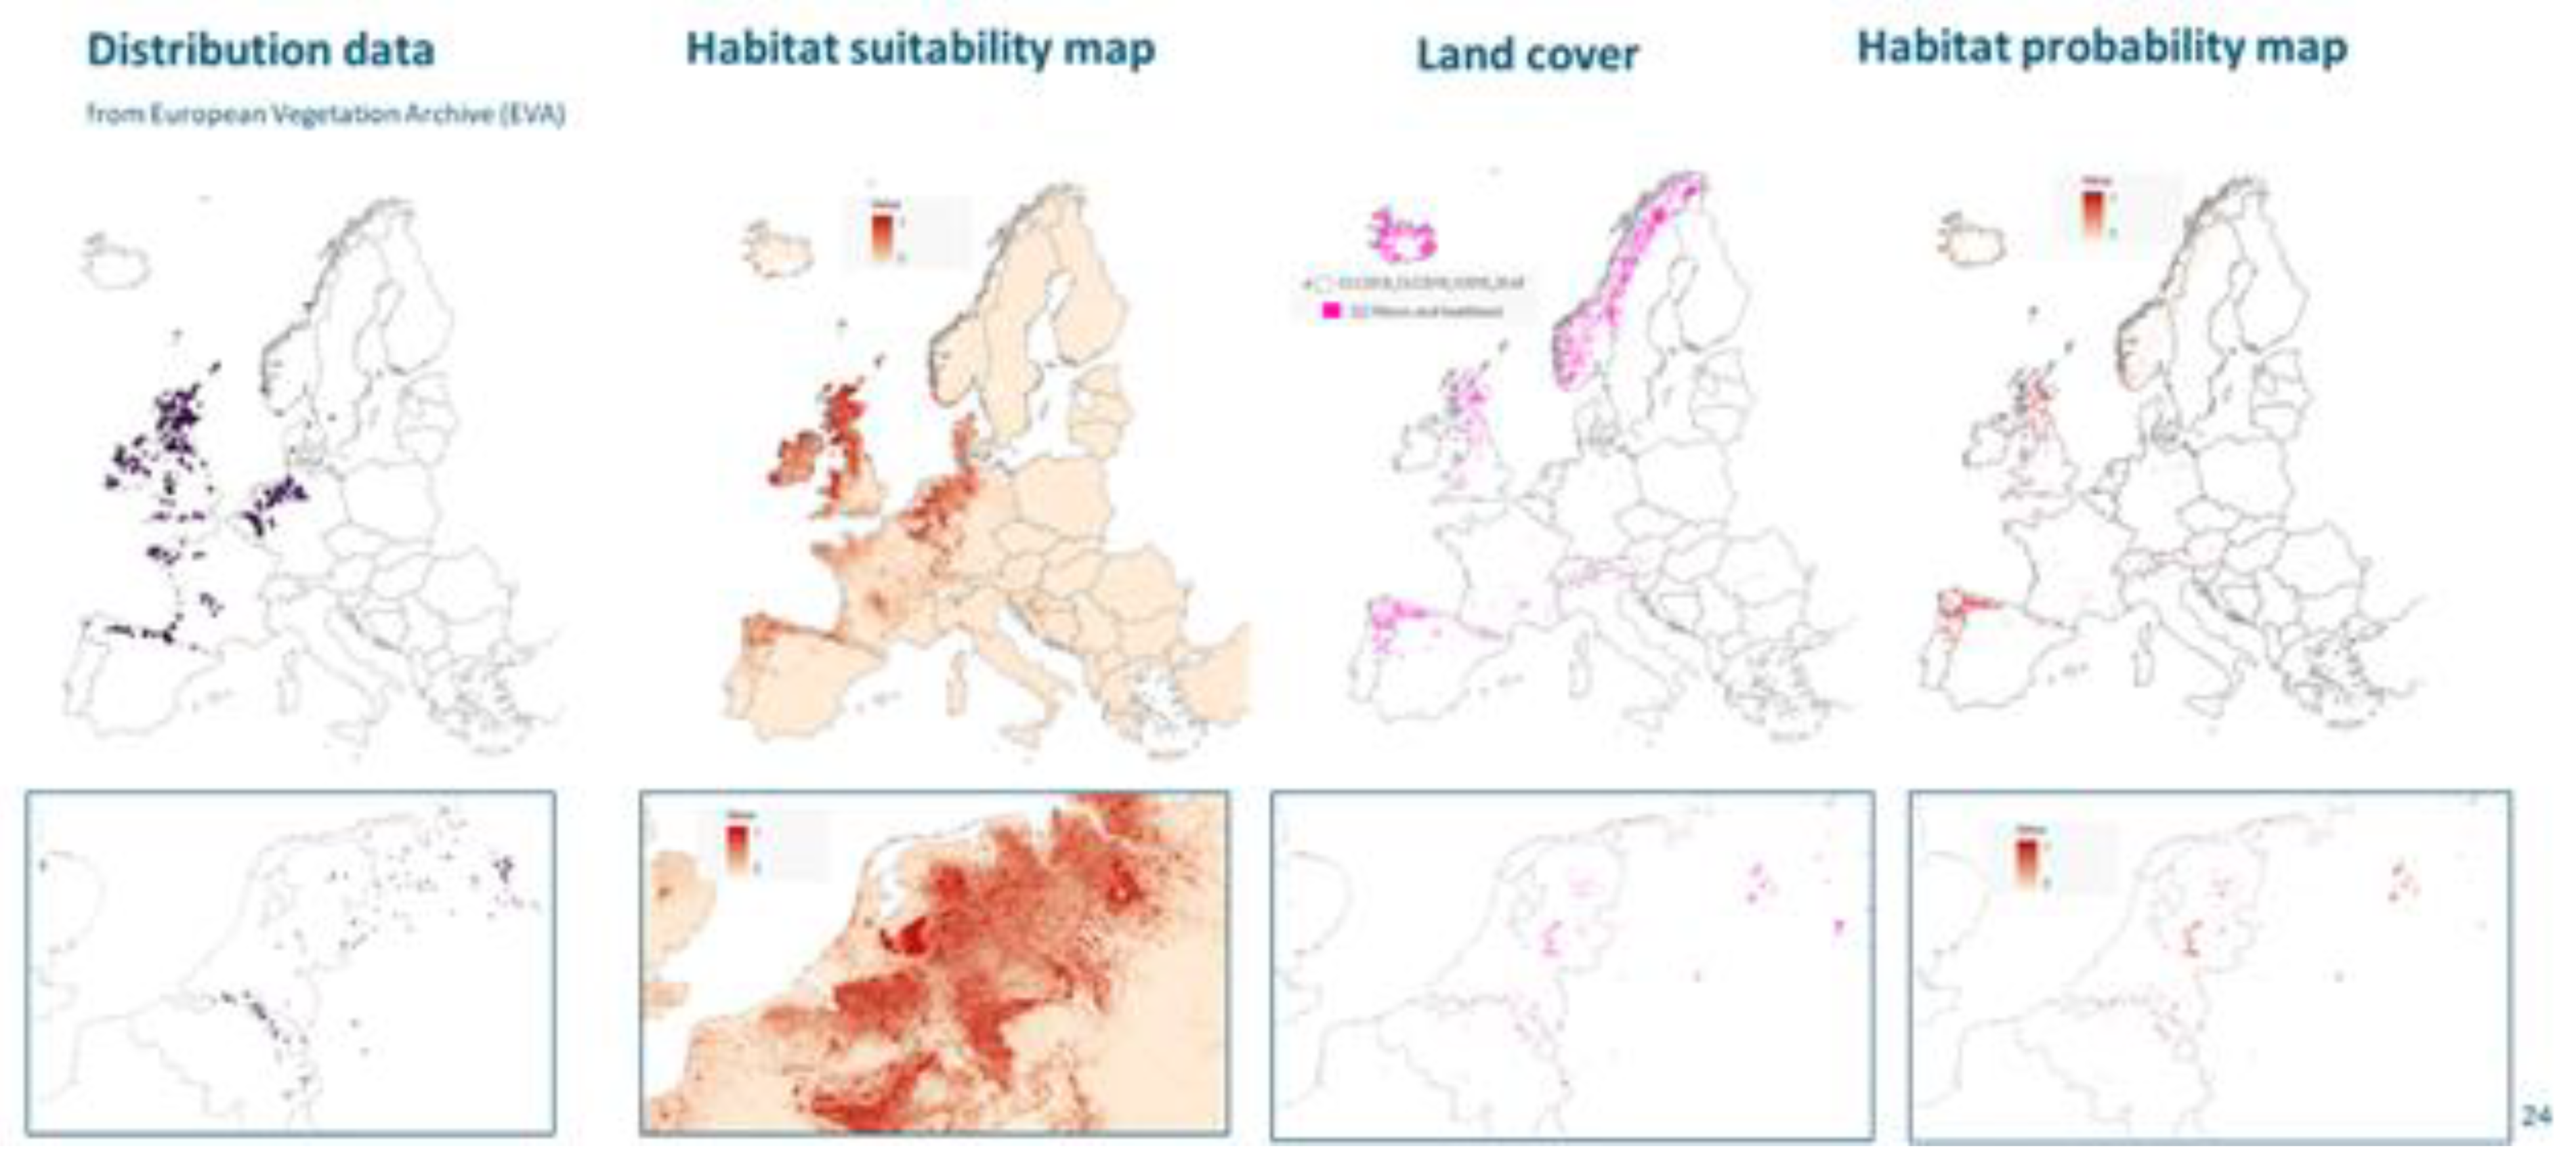
Figure 3.
The contribution of Essential Biodiversity Variable Classes' Ecosystem 'structure' and 'Species 'traits' to that are aimed in the Sustainable Development Goal (SDG) Targets of SDG -15.
Figure 3.
The contribution of Essential Biodiversity Variable Classes' Ecosystem 'structure' and 'Species 'traits' to that are aimed in the Sustainable Development Goal (SDG) Targets of SDG -15.
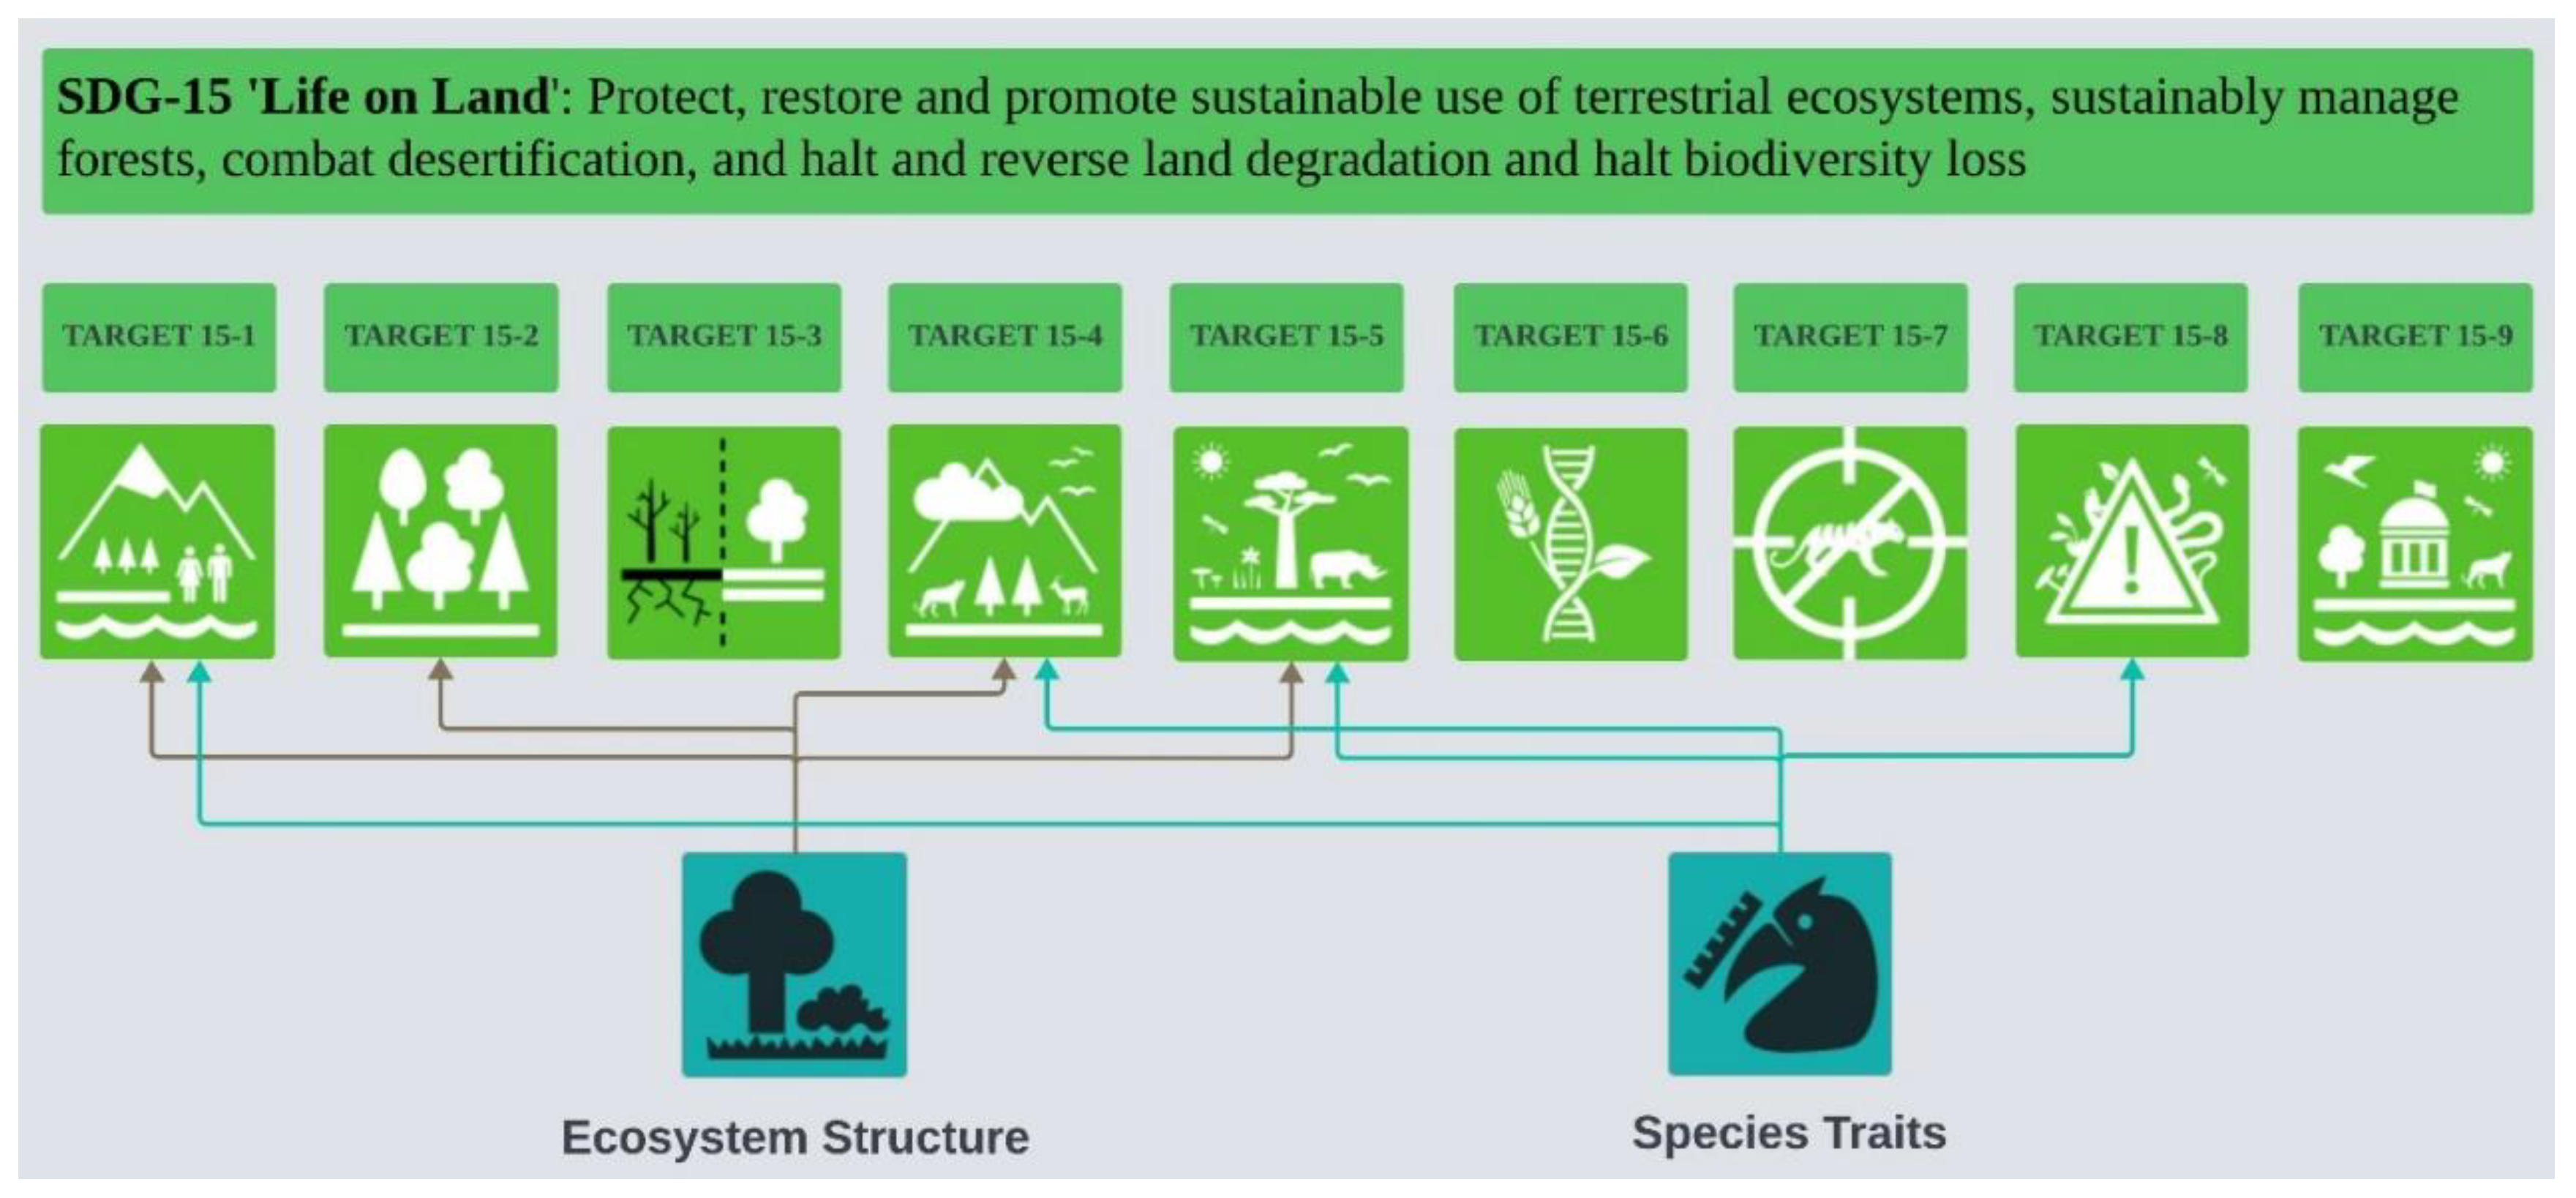

Table 1.
Typical footprint and spatial coverage of different LiDAR systems and examples of potential properties can be derived from those LiDAR systems as well as their potential contribution to SDGs.
Table 1.
Typical footprint and spatial coverage of different LiDAR systems and examples of potential properties can be derived from those LiDAR systems as well as their potential contribution to SDGs.
| LiDAR | Footprint (m) | Typical Spatial Coverage (km2) | Ecosystem Structural Properties can be Derived | Potential Contribution to SDGs Target | Examples |
|---|---|---|---|---|---|
| Mobile LiDAR | 0.01‒0.1 | 0.01‒0.5 (Individual tree to plot level) |
Stem density and volume, basal area, diameter at breast height (DBH), above-ground biomass, forest inventory | Conservation and restoration of terrestrial ecosystems (15.1); assisting forest inventory and management (15.2) | (Liang et al. 2014); (Hyyppä et al. 2020); (Choi and Song 2022) |
| UVA-LiDAR | 0.05‒0.1 | 0.02‒10 (Individual tree to local study site) |
Tree height, species richness, upper branch location, and crown structure | Understanding different ecosystems and their services (15.1); monitoring the degradation of natural habitats (15.5) | (Guo et al. 2022); (Qi et al. 2022); (Kellner et al. 2019) |
| Terrestrial LiDAR | 0.01‒0.05 | 0.01‒0.5 (Individual tree to plot level) |
Leaf area index (LAI), DBH, 3D foliage distribution, plant functional traits, gap fraction, canopy radiation, and above-ground biomass | Conservation and restoration of different ecosystems (15.1); evaluation of animal habitat condition (15.5) | (Zhu et al. 2015); (Liang et al. 2016); (Zhao et al. 2012) |
| Airborne LiDAR | 0.1‒10 | 10‒1000 (Plot to a national or regional extent) |
Tree species, animal habitat, landslides detection, land cover change, forest inventory | Ecosystem services (15.1); Sustainable Forest management (15.2); monitoring degradation of natural habitats (15.5) | (Shi et al. 2018); (Koma et al. 2021a); (Kamps et al. 2017) |
| Spaceborne LiDAR | 12‒25 | Continental to the near-global extent | Canopy height, canopy vertical structure, LAI, sub-canopy topography and biomass | Assisting sustainable use of ecosystem services (15.1); decision-making for afforestation and reforestation globally (15.2) | (Zwally et al. 2002); (Dubayah et al. 2020); (Potapov et al. 2021) |
Disclaimer/Publisher’s Note: The statements, opinions and data contained in all publications are solely those of the individual author(s) and contributor(s) and not of MDPI and/or the editor(s). MDPI and/or the editor(s) disclaim responsibility for any injury to people or property resulting from any ideas, methods, instructions or products referred to in the content. |
© 2026 by the authors. Licensee MDPI, Basel, Switzerland. This article is an open access article distributed under the terms and conditions of the Creative Commons Attribution (CC BY) license (http://creativecommons.org/licenses/by/4.0/).
Copyright: This open access article is published under a Creative Commons CC BY 4.0 license, which permit the free download, distribution, and reuse, provided that the author and preprint are cited in any reuse.


