
Submitted:
30 December 2025
Posted:
09 January 2026
You are already at the latest version
Abstract
Africa has the youngest population worldwide, with many young people engaged in informal or temporary employment. Long-term financial resilience in this demographic requires that they develop strong digital financial literacy (DFL) skills, including saving, investing, and managing risk through digital platforms. This study investigates digital financial literacy (DFL) among 300 Rwandan young adults aged 18–32 years and explores an AI-enabled intervention, aligning with Sustainable Development Goals (SDGs) 1 (No Poverty), 5 (Gender Equality), 8 (DecentWork and Economic Growth), 9 (Industry, Innovation and Infrastructure), and 10 (Reduced Inequalities). Findings reveal average financial knowledge, moderate digital literacy, and engagement in budgeting and saving behaviors, but persistent gaps in access to formal financial services and cybersecurity practices. Significant gender disparities were identified, with men demonstrating higher financial knowledge and participation in savings and investments, and higher educational attainment was positively associated with DFL.The low-fidelity chatbot intervention for loan literacy, delivered via a mobile money platform—designed based on survey insights—showed limited usability and acceptability due to participants’ low awareness of personal finances and prolonged task times. These results highlight the need for inclusive, context-sensitive digital financial education solutions and responsible AI integration within digital financial ecosystems to advance sustainable financial inclusion and economic empowerment in low-resource settings.
Keywords:
digital
; financial literacy
; interventions
; Africa
; chatbot
1. Introduction
Africa has the youngest population in the world, with a median age of just 19.2 years in 2024 [1]. By 2030, 42% of the world’s youth will live in Africa [2]. This demographic profile presents both opportunities and challenges for sustainable development. A large youth population has the potential to drive inclusive economic growth and productivity through enhanced workforce participation and innovation, directly contributing to Sustainable Development Goal (SDG) 8 (Decent Work and Economic Growth) and SDG 9 (Industry, Innovation, and Infrastructure). Evidence from the entrepreneurial ecosystem in Africa supports this potential: an analysis of 114 unicorn, soonicorn, and growth-stage start-ups shows that the median age of founders at venture inception was 29 years [3], compared with a global median founding age of 34 years [4].
However, this demographic also puts pressure on jobs and employment. Each year, between 10 and 12 million young people enter the African labor market, but only 3.1 million jobs are created [5]. Global shocks such as COVID-19 exacerbated these challenges. In 2024, 86.6% of people in Sub-Saharan Africa (SSA) worked in the informal sector, with only 19.1% having access to at least one social protection [6]. One fast-growing subset of informal employment is the gig marketplace, which provides short-term, often digitally mediated work (gigs). A survey by the Mastercard Foundation found that the gig economy is growing 20% every year in Africa and will employ 80 million workers by 2030 [7]. Therefore, to be financially resilient in the present and in the future, young people in Africa need a high level of financial knowledge and skills to self-manage multiple aspects of their finances, including purchasing insurance, saving for emergencies such as workplace accidents and job loss, and saving for retirement.
Digital Financial Literacy (DFL) refers to the ability to understand and use digital financial products and services for informed decision making [8]. It combines traditional financial literacy (FL) - knowledge of financial concepts such as interest and inflation, and practical application of this knowledge, with digital literacy (DL) - having the knowledge and skills to use digital products in a safe and effective way [8]. With most of the banked SSA population using digital platforms like mobile money (MoMo) to access financial services [9], and the increasingly digital nature of gigs, it is essential to promote DFL, rather than traditional financial literacy alone, in African youth.
There are increasing numbers of studies evaluating adult DFL in various countries [10,11,12]. However, studies on DFL in Africa have focused primarily on the link between DFL and financial inclusion [13,14,15,16]. It is still unclear what knowledge and skill gaps exist, making it difficult to identify topics that should be prioritized in DFL interventions or supportive policies. Similarly, there is little literature on technology-mediated DFL interventions in Africa. Nursi et al. developed Finlingo, an artificial intelligence (AI)-powered question-answering chatbot [17]. The evaluations showed high precision, but perceived usability (ease of use) and usefulness, both important components for the adoption of technology according to the Technology Acceptance Model (TAM) [18], were not evaluated during prototype development. Therefore, the roles that African users require novel technologies like generative AI to play in technology-mediated DFL remain unknown.
Lakkaraju et al. [19] also investigated the effectiveness of large language model (LLM)-based chatbots like ChatGPT and Bard in financial advisement tasks, comparing them with SafeFinance, a rule-based chatbot. Their results revealed that although LLMs can provide fluent and plausible answers, they often struggle with numeric reasoning, produce inconsistent responses across demographic groups, and are unreliable when asked to retrieve factual information from trusted sources. Our study contributes to this emerging area by evaluating the usability and acceptability of a simulated question-answering chatbot for financial decision support, extending recent work on LLMs in financial advisement, sentiment analysis, and AI-human interaction design in financial contexts [20,21] .
We conducted a survey (n=300) and prototype testing (n=10) study in Rwanda, an East African country of 13.8 million people [22] where 92% of adults use formal financial products and services [23]. Our study aimed to answer three research questions:
- RQ1: What is the digital financial literacy of young adults in Rwanda (18-32 years old), and how does it vary by gender and level of education?
- RQ2: What factors influence the usability and acceptability of conversational agents aimed at promoting digital financial literacy?
Our findings revealed:
- The participants had average knowledge of financial concepts (correctly answered 3 of 5 questions), but moderately high digital literacy (around 70% capable of doing internet-based tasks and aware of basic cybersecurity concepts) and participation in budgeting and savings behaviors. However, there were gaps in the adoption of best cybersecurity practices and several financial products and services, such as bank cards.
- There were significant gender gaps in favor of men in knowledge of financial concepts, the number of information sources used for financial decision making, and in saving and investing behaviors.
- Participants with higher education levels were more likely to score higher on knowledge of financial concepts and digital literacy.
- Only four out of ten participants accepted an opportunistic simulated chatbot intervention for loan literacy and decision-making support, with the main barriers being the increased task completion time and the difficulty answering personal finance questions.
More research is needed on how and why gender gaps arise and persist and on designing personal finance management tools for populations with irregular income.
2. Related Work
2.1. Digital and Financial Literacy in Rwanda
DL and FL have been evaluated by various studies in Rwanda. In the third quarter of 2024, 75.2% of people aged 16 and over had at least one digital skill [24]. Ogoi surveyed employees of the Rwanda Revenue Authority and found modest levels of FL (59.50%) [25]. Although 61.82% of the participants correctly answered 3 of 4 questions that tested their knowledge of financial concepts, less than 50% found their pension scheme useful and these participants were less likely to engage in discussions about retirement planning. Grohmann and Schoofs measured the FL of rural and poor households in the Southern Province of Rwanda and found a gender gap that impacted women’s participation in household decision-making [26].
Other studies have explored FL among owners of small and medium enterprises (SMEs). Alain used subjective self-assessments to evaluate knowledge, skill, attitudes and behaviors of rural and urban SMEs in Rwanda [27]. He found that more than 70% of the business owners perceived that they had high levels of knowledge or skill. Meanwhile, Gaudence, Patrick, and Denys evaluated the correlation between book-keeping literacy, budgeting literacy, and debt management literacy and loan repayment behaviors of SME members of a credit-and-savings union (SACCOS) in the Southern Province of Rwanda [28]. They found a moderate positive effect for the first two factors and a strong positive correlation for debt management literacy.
Neither of these studies assesses digital literacy nor people’s attitudes and usage of digital financial products and services. Our study addresses this gap for younger adults (18-32 years old).
2.2. Measuring Digital Financial Literacy
To date, there are no standard means of assessing DFL. The survey developed by OECD/INFE aims to provide internationally comparable measures of DFL [29]. The survey contains self-report questions on internet access and use, digital skills and knowledge, attitudes toward digital financial services, and the use of financial products - covering reasons for adoption and how these products are managed online. The survey requires a minimum sample of 1,000 people in order to draw nationally representative insights. Various researchers, including [10,11,12], and [30] have developed their own survey instruments to assess DFL. Although these instruments differ in specific content and emphasis, they generally include a mix of self-report questions and multiple choice items that assess knowledge of financial and cybersecurity concepts. Most also measure respondents’ self-reported ability to use digital devices for a range of tasks, as well as knowledge and use of financial products and services - both general and country specific and attitudes and behaviors related to budgeting, saving, and investing. The surveys have been used to assess DFL in India and Malaysia, among other countries. We adapted the questions used in these surveys and conducted the first assessment of DFL among Rwandan youth.
3. Methods
The study was carried out in two stages. The first stage was a survey study aimed at assessing the digital financial literacy of Rwandans aged 18 to 32 years, and was conducted from 11 July to 7 August 2024. The second stage was a usability testing study aimed at assessing user attitudes toward simulated chatbot assistance in digital financial services. The study was conducted from 14 to 16 December 2024 with 10 participants.
3.1. Participant Inclusion Criteria
For both substudies, participants had to meet the following criteria to be included:
- Aged 18-32 years old
- A Rwandan citizen who had lived in Rwanda for at least 5 years
- Speaks English or Kinyarwanda
3.2. Substudy 1: Survey of Digital Financial Literacy
3.2.1. Sample Size and Participant Recruitment
A total of 300 participants were recruited for the study. We recruited participants of different levels of education from both rural and urban areas to gain insight on how digital financial literacy changed with various demographic factors. Nonrandom sampling strategies were used because our objective was to gain insight from a diverse sample on the aspects of DFL young adults in Rwanda face and, therefore, what DFL interventions are needed. We deliberately chose strategic locations such as markets and city streets with high foot traffic and then selected participants at these sites to ensure gender diversity. Members of the research team also advertised the study on their social networks and used snowball sampling to recruit additional participants.
Urban participants were recruited from the cities of Kigali and Musanze. Kigali is Rwanda’s capital and the most populous city, while Musanze, located 93.9 km north-west of Rwanda, is one of the largest towns. Rural participants were recruited in Rwamagama, which is located 60 km east of Kigali.
3.2.2. Survey Design
Our survey questions were informed by the OECD financial literacy questionnaire [29], the Global Financial Literacy Survey,1 and the work of Ravikumar et al. on digital financial literacy among Indian adults [11]. The survey consisted of 22 questions distributed in three sections:
- Demographics Information
- Knowledge of financial concepts
- Digital skills and Financial decision-making
The demographic details collected were age, gender, education level, employment status, marital status, and primary residence (rural / urban) in the last five years. The “knowledge of financial concepts” section had multiple choice questions about calculating interest and inflation, and on the best risk diversification strategies. Meanwhile, the “digital skills and financial decision-making” section had Likert scale, multiple choice, and free response questions on (1) digital skills, specifically which tasks (e.g., sending an SMS or searching for information online) participants could do without help and participants’ cybersecurity knowledge (e.g., that they are exposed to risks when online and characteristics of a strong password); (2) which financial products/services participants had heard of and which ones they used; (3) methods and criteria participants used to search for financial information and to select providers, (4) main financial decision maker (the participant, spouse, parent, etc.); (5) degree of responsible financial decision making (e.g., attitudes towards savings, use of budgets). The survey was developed in English and translated into Kinyarwanda by two members of the research team, who are native Kinyarwanda speakers. We piloted the survey with 5 participants to assess the clarity of the questions and translation, determine whether there was bias in question order (through brief exit interviews), and determine how long the questionnaire took to complete. Participants completed the survey first and then participated in one-on-one exit interviews in which they were asked to explain or redistribute random questions and provide general feedback on the survey questions. Two main changes were made after the piloting. First, the number of questions was reduced from 40 to 22, after identifying questions that provided redundant or redundant data and those that did not provide useful information. Second, the translations were refined with the input of the participants. The final version of the survey took an average of 45 minutes to complete.
3.3. Substudy 2: Acceptability of Opportunistic Loan Literacy Lessons
After analyzing the responses to the surveys, we determined that participants would benefit from lessons on responsible borrowing and posited that question-answering (QA) simulated chatbots powered by large language models (LLM) would provide an easy-to-use and effective means of providing lessons. QA ensures that only relevant information is presented to the user, while LLMs ensure that answers are personalized, and thus more useful.
3.3.1. Participant Recruitment
We recruited five graduate students studying engineering or information technology courses and five support staff (cleaners and guards) from our university campus to participate in the study. Convenience sampling was used as the aim was to gather preliminary insights on the needs of users with higher (students) vs. lower (support staff) education levels, and thus digital literacy levels.
3.3.2. Prototype Design
We developed a paper-based low-fidelity prototype of a MoMo application to assess the acceptability of such lessons and chatbot interactions. The MoMo providers in Rwanda allow users to apply for microloans from their phone and the microloans are issued immediately. They are therefore ideal platforms for providing just-in-time digital interventions to promote responsible borrowing. We based the prototype design on MTN Rwanda’s Android MoMo app, since MoMo is the most widely used MoMo system in the country and the menu would be more learnable for participants. Figure 1 depicts the home page, the loan application screen, and the chatbot question-answer interface developed for the study. We prompted ChatGPT (GPT 3.5) to generate tips and answers to questions about choosing the right loan amount for a user based in Kigali, Rwanda. The interfaces were translated into Kinyarwanda by members of the research team, while the lesson content and the simulated chatbot question-answer pairs were translated by GPT and then validated by the research team.
3.3.3. Prototype Evaluation Sessions
During the session, the participants completed four tasks that lasted a total of 40 minutes:
- 1.
-
Preliminary tasks
- (a)
- Send cash to another user
- (b)
- Save 5,000 Rwandan Francs to the savings (MoKash) wallet
- 2.
-
Loan application tasks
- (a)
- Apply for a microloan (from the MoKash wallet) without using the simulated chatbot feature
- (b)
- Apply for a second microloan using the simulated chatbot for assistance
Sending cash to another user (Task 1(a)) is the most widely used MoMo feature [31]. This task allowed users who had never used the MoMo Android app to familiarize themselves with the interface. Task 1b was included as users must build a credit history through regular deposits to qualify for a loan2.
3.4. Participant Compensation
Participants in both substudies received 2,000 Rwandan francs (equivalent to US $1.41) for their time.
3.5. Ethics Considerations
The study was reviewed by the Rwanda National Ethics Committee and the Institutional Review Board (IRB). Further permission was provided to conduct the study by the National Council of Science and Technology in Rwanda. All participants gave their informed and documented consent.
4. Results
4.1. Substudy 1: Assessing digital financial literacy
300 participants (168 male and 132 female) completed the survey. Over half of the participants (n=157, 52.30%) had completed secondary school education (9 to 12 years of schooling). The demographic details are summarized in Table 1.
4.1.1. Knowledge of Financial Concepts
On average, the participants correctly answered 3 of 5 questions, indicating a modest level of financial knowledge. The question most correctly answered was about how compound interest works (74% correctly answered), while the least correctly answered was about how inflation works (52.67% correctly answered). A Mann-Whitney U test showed that male participants scored significantly higher on questions about calculating simple interest (p-value: 0.0041) and on compound interest awareness (p-value: 0.0001). We also observed a trend for higher scores as the education level increased, although the differences were not significant. On average, participants with tertiary education answered 3.396 questions correctly versus 3.063 for participants with secondary education and 2.459 for participants with primary education or no schooling (six or less years of schooling). Figure 2 shows how financial literacy scores change with educational level. Participants with primary education or less have the largest error bars due to the smaller sample size, showing more variability in their average score.
4.1.2. Digital Knowledge and Skills
We present the general digital skills and cybersecurity-related knowledge and skills of the participants.
Digital Skills:We asked participants on their ability to independently complete five lower-order digital tasks (tasks that do not require the internet, for example, saving/deleting contacts) and three higher-order tasks (tasks that are completed online, for example, signing up for email). A 5-point Likert scale was used to elicit responses.
A high proportion of the participants reported confidence in their ability to complete these tasks independently. Specifically, 73.30% agreed or strongly agreed that they could send SMS messages on their own. A slightly higher proportion (74.33%) reported being able to add and delete contacts, while 74.99% indicated that they could manage their phone storage. When it comes to financial tasks, 74. 90% of the participants felt capable of using the MoMo menu to send or withdraw money, and 75.26% reported being able to use MoMo to pay bills or conduct MoMo-to-bank transactions on their own.
Disaggregating the responses by education level revealed that participants with primary education or less were more likely to struggle with managing contacts or phone storage (only 51.35% and 51% expressed ability), although differences were not significant.
Participants reported similar levels of confidence in independently completing the four higher-order (internet-based) tasks assessed. Across the sample, 71% reported being able to self-register for email and other online services, 70.90% reported being able to perform online searches, and 69.20% indicated that they could send or receive emails. However, only 59. 80% reported being able to independently shop online. Participants with tertiary education were significantly more likely (p < 0.05) to report a higher number of higher-order digital skills (internet-based tasks) compared to other levels of education. In general, the participants showed moderately high levels of digital literacy.
Cybersecurity knowledge and behaviors: Analysis of cybersecurity awareness data reveals a notable discrepancy between knowledge and practice. Most of the participants were aware of fundamental security principles: 70.6% agreed or strongly agreed) that private credentials such as usernames, passwords and PINs should not be shared, and 63.9% understood that users are vulnerable to risks such as phishing when conducting financial transactions online. Despite this, 34. 33% of the participants reported reusing passwords on multiple platforms, and more worryingly, 32. 9% stated that they used birth years or sequences like “1234” in their PINs or passwords. A Mann–Whitney U test revealed that there were no statistically significant differences between male and female participants. Interestingly, there were also no statistically significant differences in cybersecurity awareness or security practices based on education levels.
4.1.3. Financial Decision-Making
In this section, we first present findings on the knowledge and uptake of financial products and services by participants, followed by their information seeking practices. We conclude by describing their attitudes and practices around budgeting, saving, and investing.
Average Number of Known vs. Adopted Products/Services: On average, participants reported knowing about seven of the ten financial products/services but using only three of them. No significant differences were observed by gender. However, we note that tertiary educated participants were significantly more likely (Mann–Whitney U test) to report knowledge or adoption of current accounts (p-value = 0.0009), savings accounts (p-value = 0.0052), stocks/shares (p-value = 0.0039), bonds(p-value = 0.0), online payment gateways (p-value = 0.029) and unit trusts (p-value = 0.01).
Knowledge-Adoption Gaps per Financial Product/Service: The most widely adopted financial products were insurance, current accounts, and savings accounts (93.33%, 86.33% and 84.66%, respectively). Few people demonstrated a knowledge-to-adoption gap for these categories. 30.4% were aware of insurance but did not use it, while 26.6% and (39.7%) were aware of, but did not use, current and savings accounts, respectively.
In contrast, there were high knowledge-to-adoption gaps for bank cards (83% aware, 36.33% adopted), informal lending groups (SACCOS) (81% aware, 31.33% adopted), mortgages (71.33% aware, 13.33% adopted), stocks/shares (68.67% aware, 18,6% adopted), digital payment gateways (65.33% aware, 14.67% adopted), and unit trusts (58% aware, 5.67% adopted). Most SACCOS users resided in rural areas.
Figure 3 depicts the knowledge and adoption levels for the 10 financial products and services assessed.
Information-seeking practices: Participants mainly (n=75, 25%) relied on information from their peers to decide which financial services or products to use. Other popular sources of information were product reviews and online recommendations (n=69, 23%).
On average, the participants used 1.5 information sources. A Mann-Whitney U test showed that male participants used significantly more information sources than female participants, and each source is quoted below. Male participants were also significantly more likely to receive unsolicited recommendations from friends and family, with a p-value of 0.0134. Females were significantly less likely to use product reviews that they found inadvertently online, with a p-value of 0.0048.
Provider Selection Criteria:Most participants (67%) compared the product / service offerings of different providers before making their final selection. Those who reported not considering other options at all (15.50%) were mostly from rural areas, while those who considered offerings from the same company only (77%) were mostly from the urban population. Some participants (4.60 %) indicated that they tried searching for various options but were unable to identify alternatives.
The top three criteria that participants looked at when selecting providers were (1) the number of products/services offered (n=145, 48.30%), (2) interest rates provided (n=135, 45%, (3) availability of digital platforms, e.g., mobile and web apps (n=118, 39.30%).
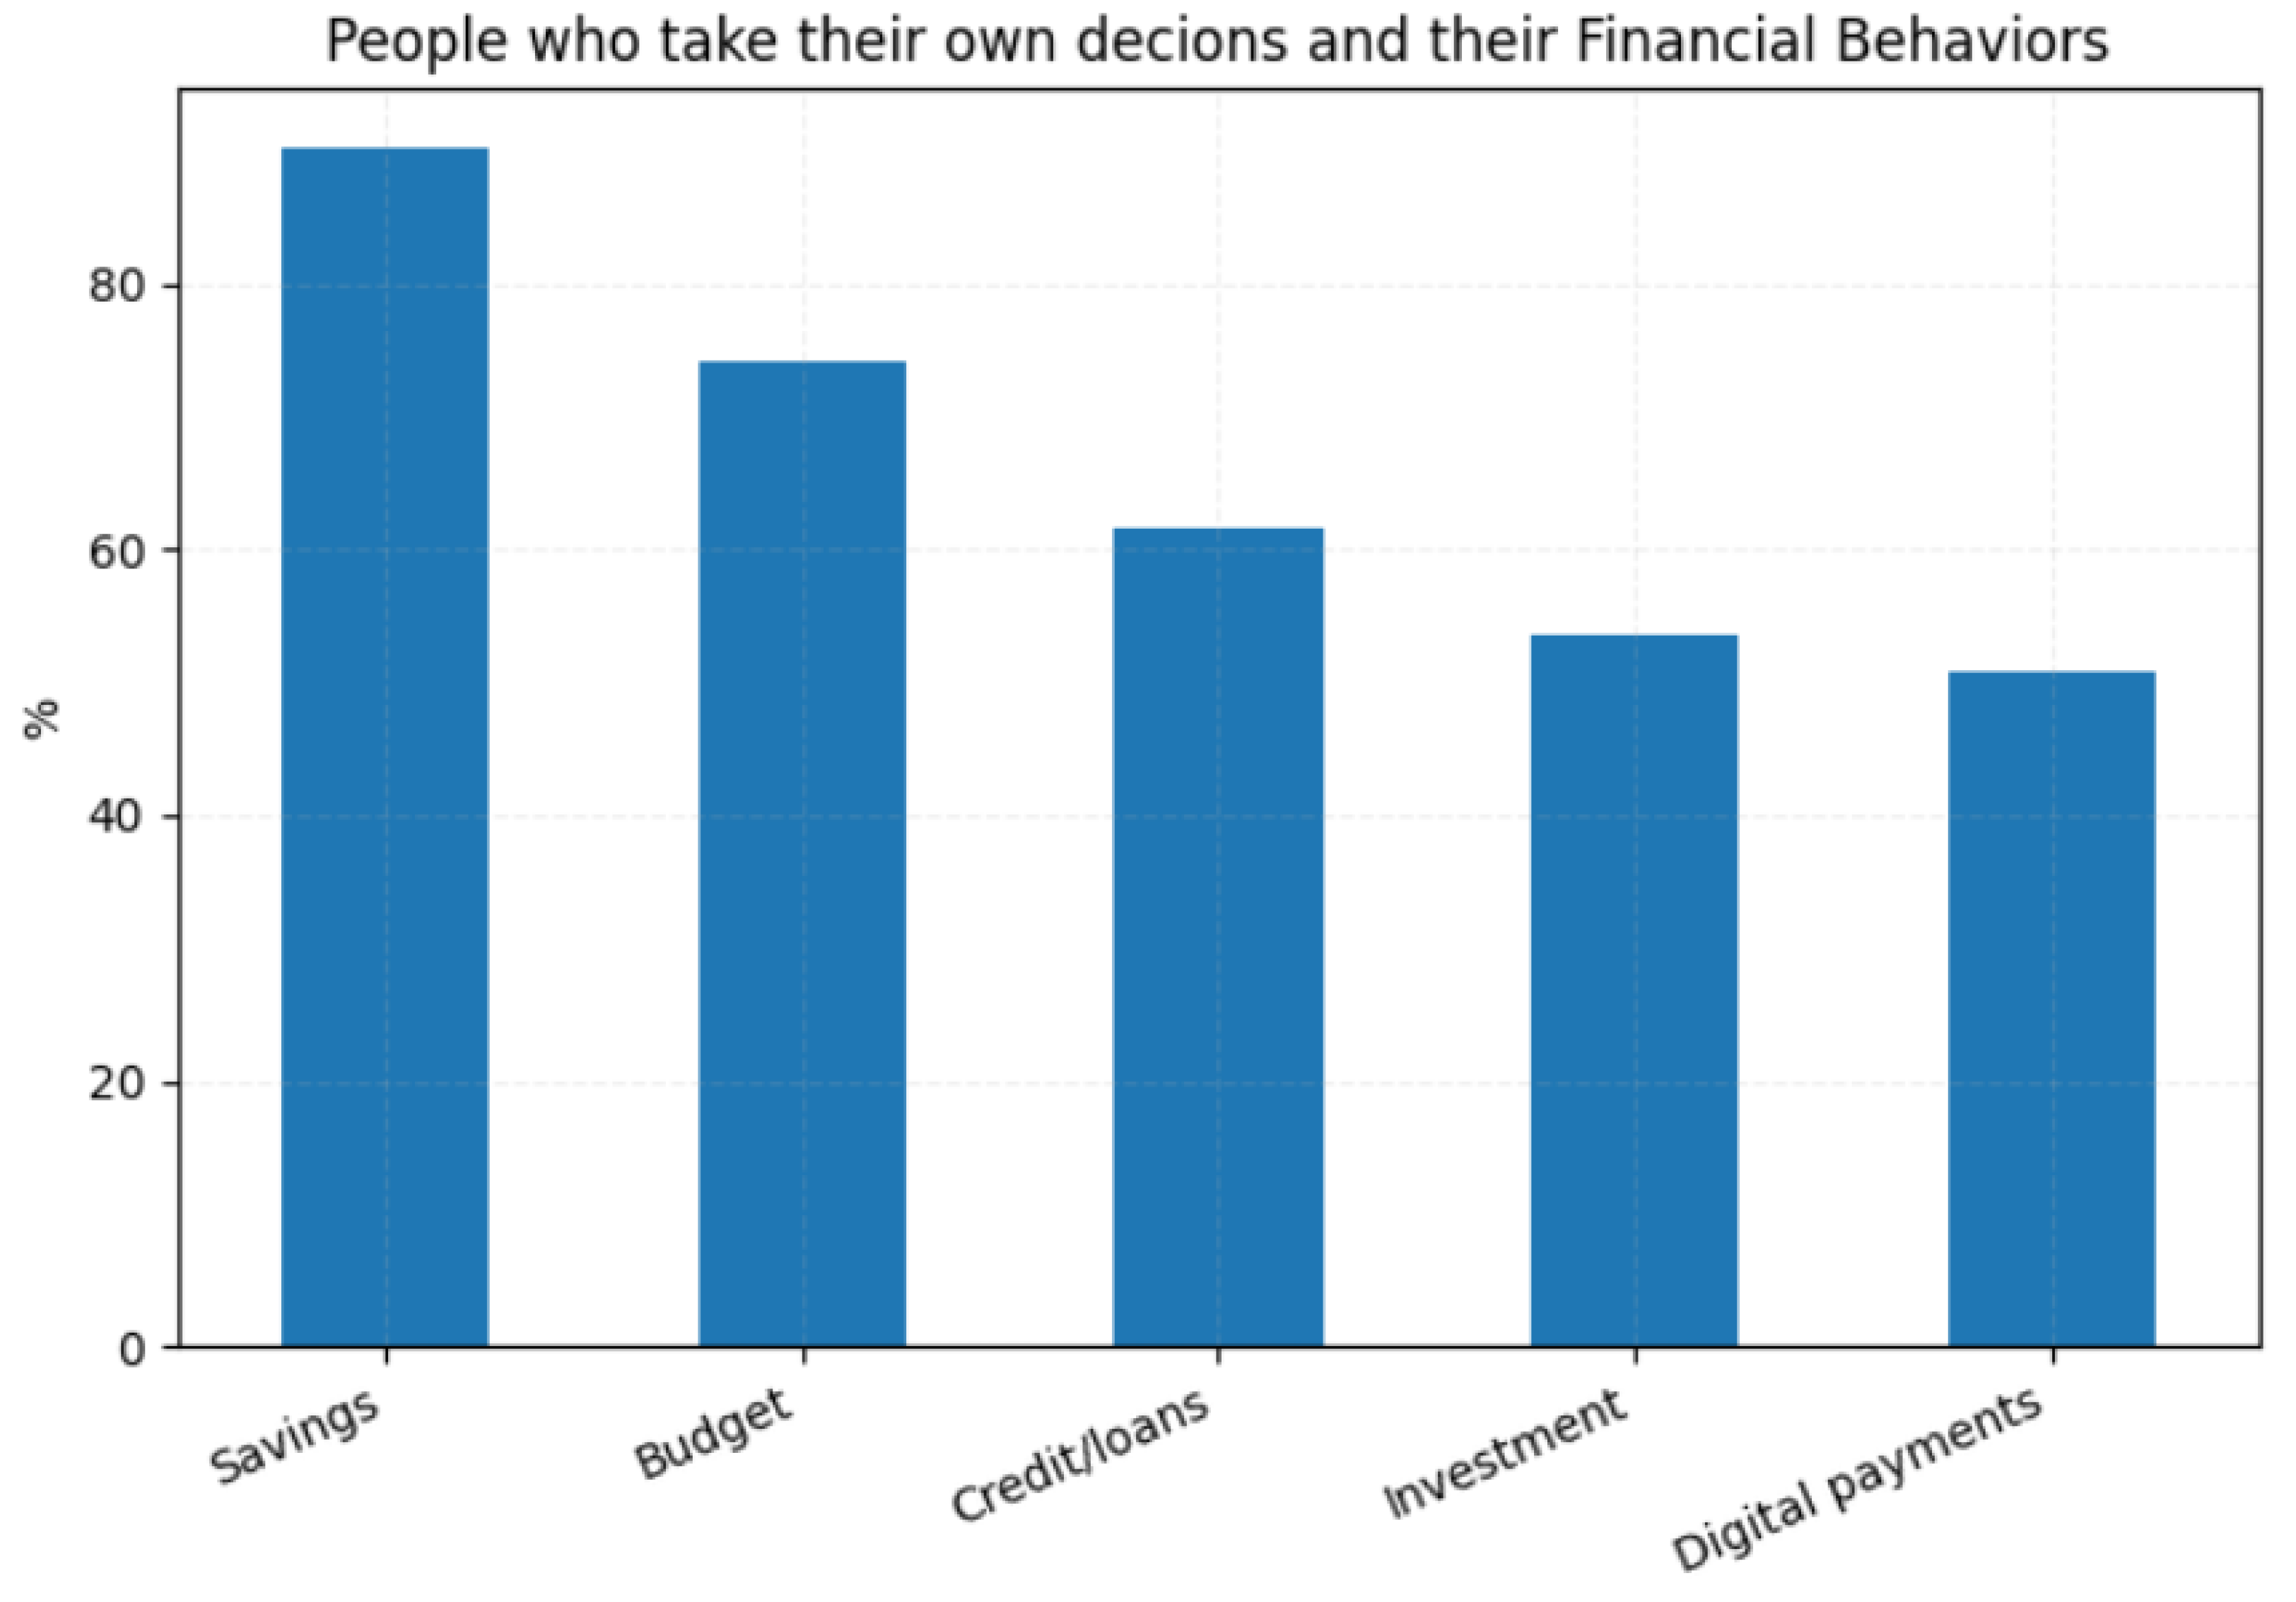
Attitudes towards Budgeting, Saving, and Investing: We asked participants who was responsible for financial decision making in their households. 112 participants (37.33%) reported that they made all financial decisions alone, while 33 reported that they made joint decisions with a spouse/partner or other family member. Of the people who made decisions alone, 101 (90.18%) reported that they regularly saved and 83 (74.11%) reported that they budgeted. However, few reported using credit/loans (n=69, 61.61%) or investing (n=60, 53.57%). Male participants were significantly more likely to save or invest than female participants (Mann–Whitney U test, with p values of 0.0121 and 0.0109, respectively). However, no significant gender differences were observed for budgeting.
Figure 4.
Ranking of the products and services
4.2. Substudy 2: Acceptability of Opportunistic Loan Literacy Lessons
Ten participants (7 male, 3 female) took part in the prototype testing sessions. The ages and educational backgrounds of the participants are summarized in Table 2.
All of the participants had used MTN’s MoMo service on USSD and nine had used the MTN microloan (MoKash) feature in the past. None had used the MTN smartphone application.
4.2.1. Performance and Feedback on Preliminary Tasks
Participants took an average of 1 minute and 48 seconds to send cash (peer-to-peer transfer), 1 minute and 20 seconds to save money in the MoKash wallet, and 1 minute and 18 seconds to take out a MoKash microloan. All participants struggled with the user interface on one or more tasks due to differences between the USSD and the mobile app task flows. One point of confusion was around transaction confirmation. In the USSD version, users input the PIN after selecting the type of transaction to complete and providing details such as the receiver’s number and transaction amount. Entering the PIN is the final step and serves as a confirmation to complete the transaction. However, in the mobile app version, users have to log in using their PIN and then select the transaction type and provide receiver details. There is no confirmation stage.
4.2.2. Performance and Feedback on simulated Chatbot-Assisted Tasks
Applying for a loan with simulated chatbot assistance took participants an average of 2 minutes and 28 seconds, more than a minute longer than the 1 minute and 21 seconds required without chatbot support. Chatbot-assisted tasks took 82.42% longer on average. No significant differences in error rates were observed, but subjective workload increased. Four participants (P1, P2, P7, and P10) felt that the chatbot asked “too many questions” about income and expenses, whose answers they did not easily know. The participants, along with two others (P3, P4), also felt that the chatbot-assisted process was “too long” and preferred the normal loan application process instead. A participant, P4, also cited the need for autonomy in loan application processes. The remaining four participants (P5, P6, P8, and P9) preferred chatbot assistance because it provided useful information. Only one participant (P4) recommended an alternative implementation, allowing users to borrow within the amount they can afford to repay, rather than giving them several options and information. Participants rated chatbot usefulness and trust on a 5-point Likert scale, with average scores of 3.9 and 4.5 respectively.
5. Discussion
We surveyed 300 urban and rural Rwandan residents aged 18-32 years and performed prototype tests with 10 participants to determine their DFL and perceptions of mini-DFL interventions delivered by a simulated chatbot, respectively. We discuss our four key findings below:
Finding 1: The levels of digital financial literacy in Rwandan youth are modest, with gender disparities observed in the knowledge of financial concepts and information search practices. Participants reported an average knowledge of financial concepts (3 of 5 correctly answered questions) but showed a higher level of digital literacy, with 68% or more of the participants capable of independently completing tasks such as using mobile financial services and being aware of basic cybersecurity concepts. Both financial and digital literacy increased with the level of education. Men scored significantly higher in knowledge of financial concepts and in the number of information sources used when deciding on the financial products or services to adopt.
Low levels of financial literacy are a global challenge. Early studies reveal that about a third of people had high financial literacy, scoring 75% (correctly answering 3 of 4 questions) [32]. Gender disparities in FL in Rwanda were also observed in [26], but they have also been observed in other geographical regions, including western Europe and the Americas [32]. The underpinning causes of gender gaps include women having fewer educational opportunities and less confidence (females are more likely to choose “I don’t know” than men) [33]. However, explanatory studies about gender disparities remain limited and more research is needed to understand when, how, and why differences in FL emerge and perpetuate in different countries for participants with similar educational backgrounds. Similarly, few studies have explored the influences of gender and family dynamics (for co-habiting couples) on financial information seeking goals and practices. Without such insights, it is impossible to design financial products/services and search engines to be truly inclusive and usable.
Finding 2: Many people know about the variety of financial products and services, but this does not translate to adoption. 93% of the survey respondents reported having some form of insurance, and this was the most widely known and adopted financial product. Insurance tends to have low acceptance in many African countries [34,35], but Rwanda operates a Community Health Insurance Scheme (Mutuelle de Santé) with a national coverage rate of over 90% [36]. Although we were unable to discern the type of insurance used in the responses of the participants, it is likely that most of the respondents referred to this health insurance program, given its widespread adoption. The observed awareness-adoption gap is unsurprising, given the extensive literature on the multifaceted barriers African consumers face. These include high operating costs relative to income [37], strict account opening and maintenance requirements [38][9,39], greater trust in personal reliance and community financing than formal financial institutions [40], and low liquidity and limited technological infrastructure in African stock markets [38,41]. To support more systematic comparisons, we have developed a fintech index that captures the maturity of fintech ecosystems across several African countries (. We call for complementary efforts to map the accessibility of financial options, especially in terms of geographic reach, affordability, and eligibility, in diverse population groups. Such data is critical to disentangle how much nonadoption stems from lack of opportunity versus lack of knowledge or motivation.
Finding 3: Cybersecurity Knowledge-Action Gap Most of the participants were aware of basic cybersecurity principles, including the characteristics of strong PINs and passwords. However, many still opt for less secure choices. This aligns with previous studies (see, e.g., [42]), which find that user behavior often diverges from cybersecurity knowledge. Convenience and memorability are among the key drivers of cyber-risky practices, highlighting the need for design strategies that accommodate these user mentalities without compromising security.
Finding 4: Gaps in financial self-awareness and autonomy preferences could challenge the effectiveness of chatbot-based loan advice. Only 4 of the 10 participants felt the simulated chatbot-mediated loan application was useful and relatively easy to use. According to the Technology Adoption Model (TAM) [18], people accept and use technologies if they perceive them to be useful and easy to use. In our study, users’ lack of knowledge on their income and expenses and the added time needed to apply for a loan lowered the perceived usability of the system. Future studies should explore how to promote financial self-tracking behaviors in these populations and whether strategies such as defaults and user-configurable recommendations would increase acceptability.
In summary, the low acceptability of the chatbot intervention suggests that such systems may require simplified interfaces and contextualized prompts tailored to users in Sub-Saharan Africa. Techniques such as retrieval-augmented generation and default-based recommendations could enhance usability. Key design implications include the need for explainability, personalization, and minimizing cognitive load. Furthermore, deploying AI in low-resource contexts raises important concerns around data privacy, fairness in recommendations, and informed consent—all of which must be carefully addressed in scalable implementations.
6. Conclusions
This study explored the digital financial literacy (DFL) of Rwandan adults aged 18-32 years and the acceptability of chatbot-assisted loan application processes. The results revealed average levels of DFL, with participants, especially women, struggling with knowledge of financial concepts and the adoption of financial products and services. Chatbot acceptability was hindered by usability issues that increased task completion time. In the future, more studies are needed to explore the barriers to the adoption of various financial products and services and how to improve the usability of chatbots in digital financial systems.
Future work will explore multilingual, multimodal chatbot architectures with personalized financial coaching capabilities. Partnerships with MoMo providers could enable scalable deployment, especially if chatbot interactions are embedded within existing financial workflows.
Acknowledgment
This project received funding from the AFRETEC network.
References
- Statista. Median Age in Africa 2000-2030.
- Bureau, P.R. Africa’s Future: Youth and the Data Defining their Lives. 2019. [Google Scholar]
- Nairobi, A. The Unicorn founder roadmap: Insights into Africa’s startup founders and the ecosystem. 2021. [Google Scholar]
- Tamaseb, A. Super founders: What data reveals about billion-Dollar startups; PublicAffairs, 2021. [Google Scholar]
- Bank, W. Toward Solutions for Youth Employment, 2015. Accessed: 2025-03-28.
- Barasa, L.; Kiiru, J.M. The Digital Economy and Youth Employment in Africa. In Public Policy and Technological Transformations in Africa: Nurturing Policy Entrepreneurship, Policy Tools and Citizen Participation; Springer, 2023; pp. 161–182. [Google Scholar]
- Foundation, M. Digital Commerce and Youth Employment in Africa. Technical report, Mastercard Foundation, 2019. Accessed: 2025-03-28.
- Monticone, C. OECD/INFE survey instrument to measure the financial literacy of MSMEs. 2020. [Google Scholar] [CrossRef]
- Demirgüç-Kunt, A.; Klapper, L.; Singer, D.; Ansar, S. The Global Findex Database 2021: Financial inclusion, digital payments, and resilience in the age of COVID-19; World Bank Publications, 2022. [Google Scholar]
- Rahayu, R.; Ali, S.; Aulia, A.; Hidayah, R. The current digital financial literacy and financial behavior in Indonesian millennial generation. Journal of Accounting and Investment 2022, 23, 78–94. [Google Scholar] [CrossRef]
- Ravikumar, T.; Suresha, B.; Prakash, N.; Vazirani, K.; Krishna, T. Digital financial literacy among adults in India: Measurement and validation. Cogent Economics & Finance 2022, 10, 2132631. [Google Scholar] [CrossRef]
- Low, K.C.; Chong, S.L.; Mohamad, S.S.; Arshad, R.; et al. Digital Financial Literacy Among Young Adults in Malaysia. European Proceedings of Social and Behavioural Sciences 2023. [Google Scholar]
- Kamau, A.; Misati, R.; Ngoka, K.; Odongo, M.; Were, M. Digital financial services and implications of financial literacy on gender and over indebtedness: The case of Kenya. Technical report; African Economic Research Consortium, 2023. [Google Scholar]
- Sarfo, Y.; Musshoff, O.; Weber, R. Farmers’ awareness of digital credit: Does financial literacy matter? Journal of International Development 2023, 35, 2299–2317. [Google Scholar] [CrossRef]
- Adel, N. The impact of digital literacy and technology adoption on financial inclusion in Africa, Asia, and Latin America. Heliyon 2024, 10. [Google Scholar] [CrossRef] [PubMed]
- Chibesa, K.; Mwange, A. The Role of Digital Financial Literacy in Enhancing Financial Inclusion Among Informal Entrepreneurs in Zambia. East African Finance Journal 2025, 4, 141–146. [Google Scholar] [CrossRef]
- Mursi, J.K.; Nach, H.; Odera, A.; Mwende, B.; Dhol, D.; Mwikali, F. Finlingo: A Conversational AI for Enhancing Financial Literacy Education in Africa. In Proceedings of the 2024 IEEE International Conference on Technology Management, Operations and Decisions (ICTMOD), 2024; IEEE; pp. 1–7. [Google Scholar]
- Davis, F.D.; Al-Suqri, MN; et al. Technology acceptance model: TAM. Al-Aufi, AS: Information Seeking Behavior and Technology Adoption 1989, 205, 5. [Google Scholar]
- Lakkaraju, K.; Jones, S.E.; Vuruma, S.K.R.; Pallagani, V.; Muppasani, B.C.; Srivastava, B. Llms for financial advisement: A fairness and efficacy study in personal decision making. In Proceedings of the Proceedings of the Fourth ACM International Conference on AI in Finance, 2023; pp. 100–107. [Google Scholar]
- Iacovides, G.; Konstantinidis, T.; Xu, M.; Mandic, D. FinLlama: LLM-Based Financial Sentiment Analysis for Algorithmic Trading. In Proceedings of the Proceedings of the 5th ACM International Conference on AI in Finance (ICAIF ’24), New York, NY, USA, 2024; pp. 134–141. [Google Scholar] [CrossRef]
- Li, Y.; Wang, S.; Ding, H.; Chen, H. Large Language Models in Finance: A Survey. In Proceedings of the Proceedings of the 4th ACM International Conference on AI in Finance (ICAIF ’23), Brooklyn, NY, USA, 2023; pp. 374–382. [Google Scholar] [CrossRef]
- of Statistics of Rwanda, N.I. Size of the resident population.
- Access to Finance Rwanda. Rwanda FinScope Survey 2024. Technical report, Access to Finance Rwanda, Kigali, Rwanda, 2024. Accessed: 2025-04-13.
- of Statistics Rwanda, N.I. Labor Force Survey - Q3(2024). Technical report, National Institute of Statistics Rwanda, 2024.
- Ogoi, H.J. Role of Financial Literacy in Retirement Planning in Rwanda: A Case Study of Rwanda Revenue Authority (RRA). International Journal of Research in Management, Economics and Commerce 2019, 9, 10–16. [Google Scholar]
- Grohmann, A.; Schoofs, A. Financial literacy and intra-household decision making: Evidence from Rwanda. Journal of African Economies 2021, 30, 225–250. [Google Scholar] [CrossRef]
- Alain, A.M. An evaluation of financial literacy among business owners of micro, small and medium enterprises in Rwanda. ULK Scientific Journal 2022, 45, 111–144. [Google Scholar]
- Gaudence, M.; Patrick, M.; Denys, M. Effects of financial literacy on loan repayment among small and medium entrepreneurs of microfinance institutions: Case study of Inozamihigo Umurenge Sacco in Nyaruguru District. IOSR Journal of Business and Management 2018, 20, 19–37. [Google Scholar]
- Jennah, H.U.X.L.E.Y. OECD/INFE Toolkit for Measuring Financial Literacy and Financial Inclusion 2022. 2022. Available online: https://www.oecd.org/financial/education/2022-oecd-infe-toolkit.pdf (accessed on 24 April 2025).
- Chhillar, N.; Arora, S.; Chawla, P. Measuring digital financial literacy: Scale development and validation. Thailand and The World Economy 2024, 42, 110–145. [Google Scholar]
- Tengeh, R.K.; Gahapa Talom, F.S. Mobile money as a sustainable alternative for SMEs in less developed financial markets. Journal of Open Innovation: Technology, Market, and Complexity 2020, 6, 163. [Google Scholar] [CrossRef]
- Hasler, A.; Lusardi, A. The gender gap in financial literacy: A global perspective. Global Financial Literacy Excellence Center, The George Washington University School of Business 2017, 2–16. [Google Scholar]
- Haag, L.; Brahm, T. The Gender Gap in Economic and Financial Literacy: A Review and Research Agenda. International Journal of Consumer Studies 2025, 49, e70031. [Google Scholar] [CrossRef]
- Malambo, M. The Empirical Evaluation of the Uptake of Insurance Products in the Sub-Saharan Africa. Journal of Financial Risk Management 2022, 11, 342–352. [Google Scholar] [CrossRef]
- Malambo, M. Insurance Penetration in Africa—A Systematic Literature Review. Journal of Financial Risk Management 2023, 12, 87–94. [Google Scholar] [CrossRef]
- Binagwaho, A.; Hartwig, R.; Ingeri, D.; Makaka, A. Mutual health insurance and the contribution to improvements in child health in Rwanda. Rotterdam: International Institute of Social Studies: Erasmus University 2012. [Google Scholar]
- Shirono, M.K.; Beyene, B.; Fareed, F.; Loots, C.; Quevedo, A.; Naidoo, K. Understanding barriers to financial access: Insights from bank pricing data; International Monetary Fund, 2024. [Google Scholar]
- United Nations Economic Commission for Africa. Tapping into the Potential of African Markets. In Economic Report on Africa 2020: Innovative Finance for Private Sector Development in Africa; UNECA: Addis Ababa; Chapter 4, 2020. [Google Scholar]
- Luhanga, E.; Sowon, K.; Cranor, L.F.; Fanti, G.; Tucker, C.; Gueye, A. User Experiences with Third-Party SIM Cards and ID Registration in Kenya and Tanzania. arXiv 2023, arXiv:2311.00830. [Google Scholar] [CrossRef]
- Obonyo, E.; Sydow, A. Understanding indigenous approaches to money can help drive financial inclusion. 2024. [Google Scholar]
- Becker, C. Attractiveness of African stock markets for foreign investors: An analytical perspective. Journal of Securities Operations & Custody 2024, 16, 385–395. [Google Scholar] [CrossRef]
- Wash, R.; Rader, E. Prioritizing security over usability: Strategies for how people choose passwords. Journal of Cybersecurity 2021, 7, tyab012. [Google Scholar] [CrossRef]
| 1 | |
| 2 |
Figure 1.
Paper prototypes of the home page, loan application screen, and simulated chatbot question-and-answer interface
Figure 1.
Paper prototypes of the home page, loan application screen, and simulated chatbot question-and-answer interface
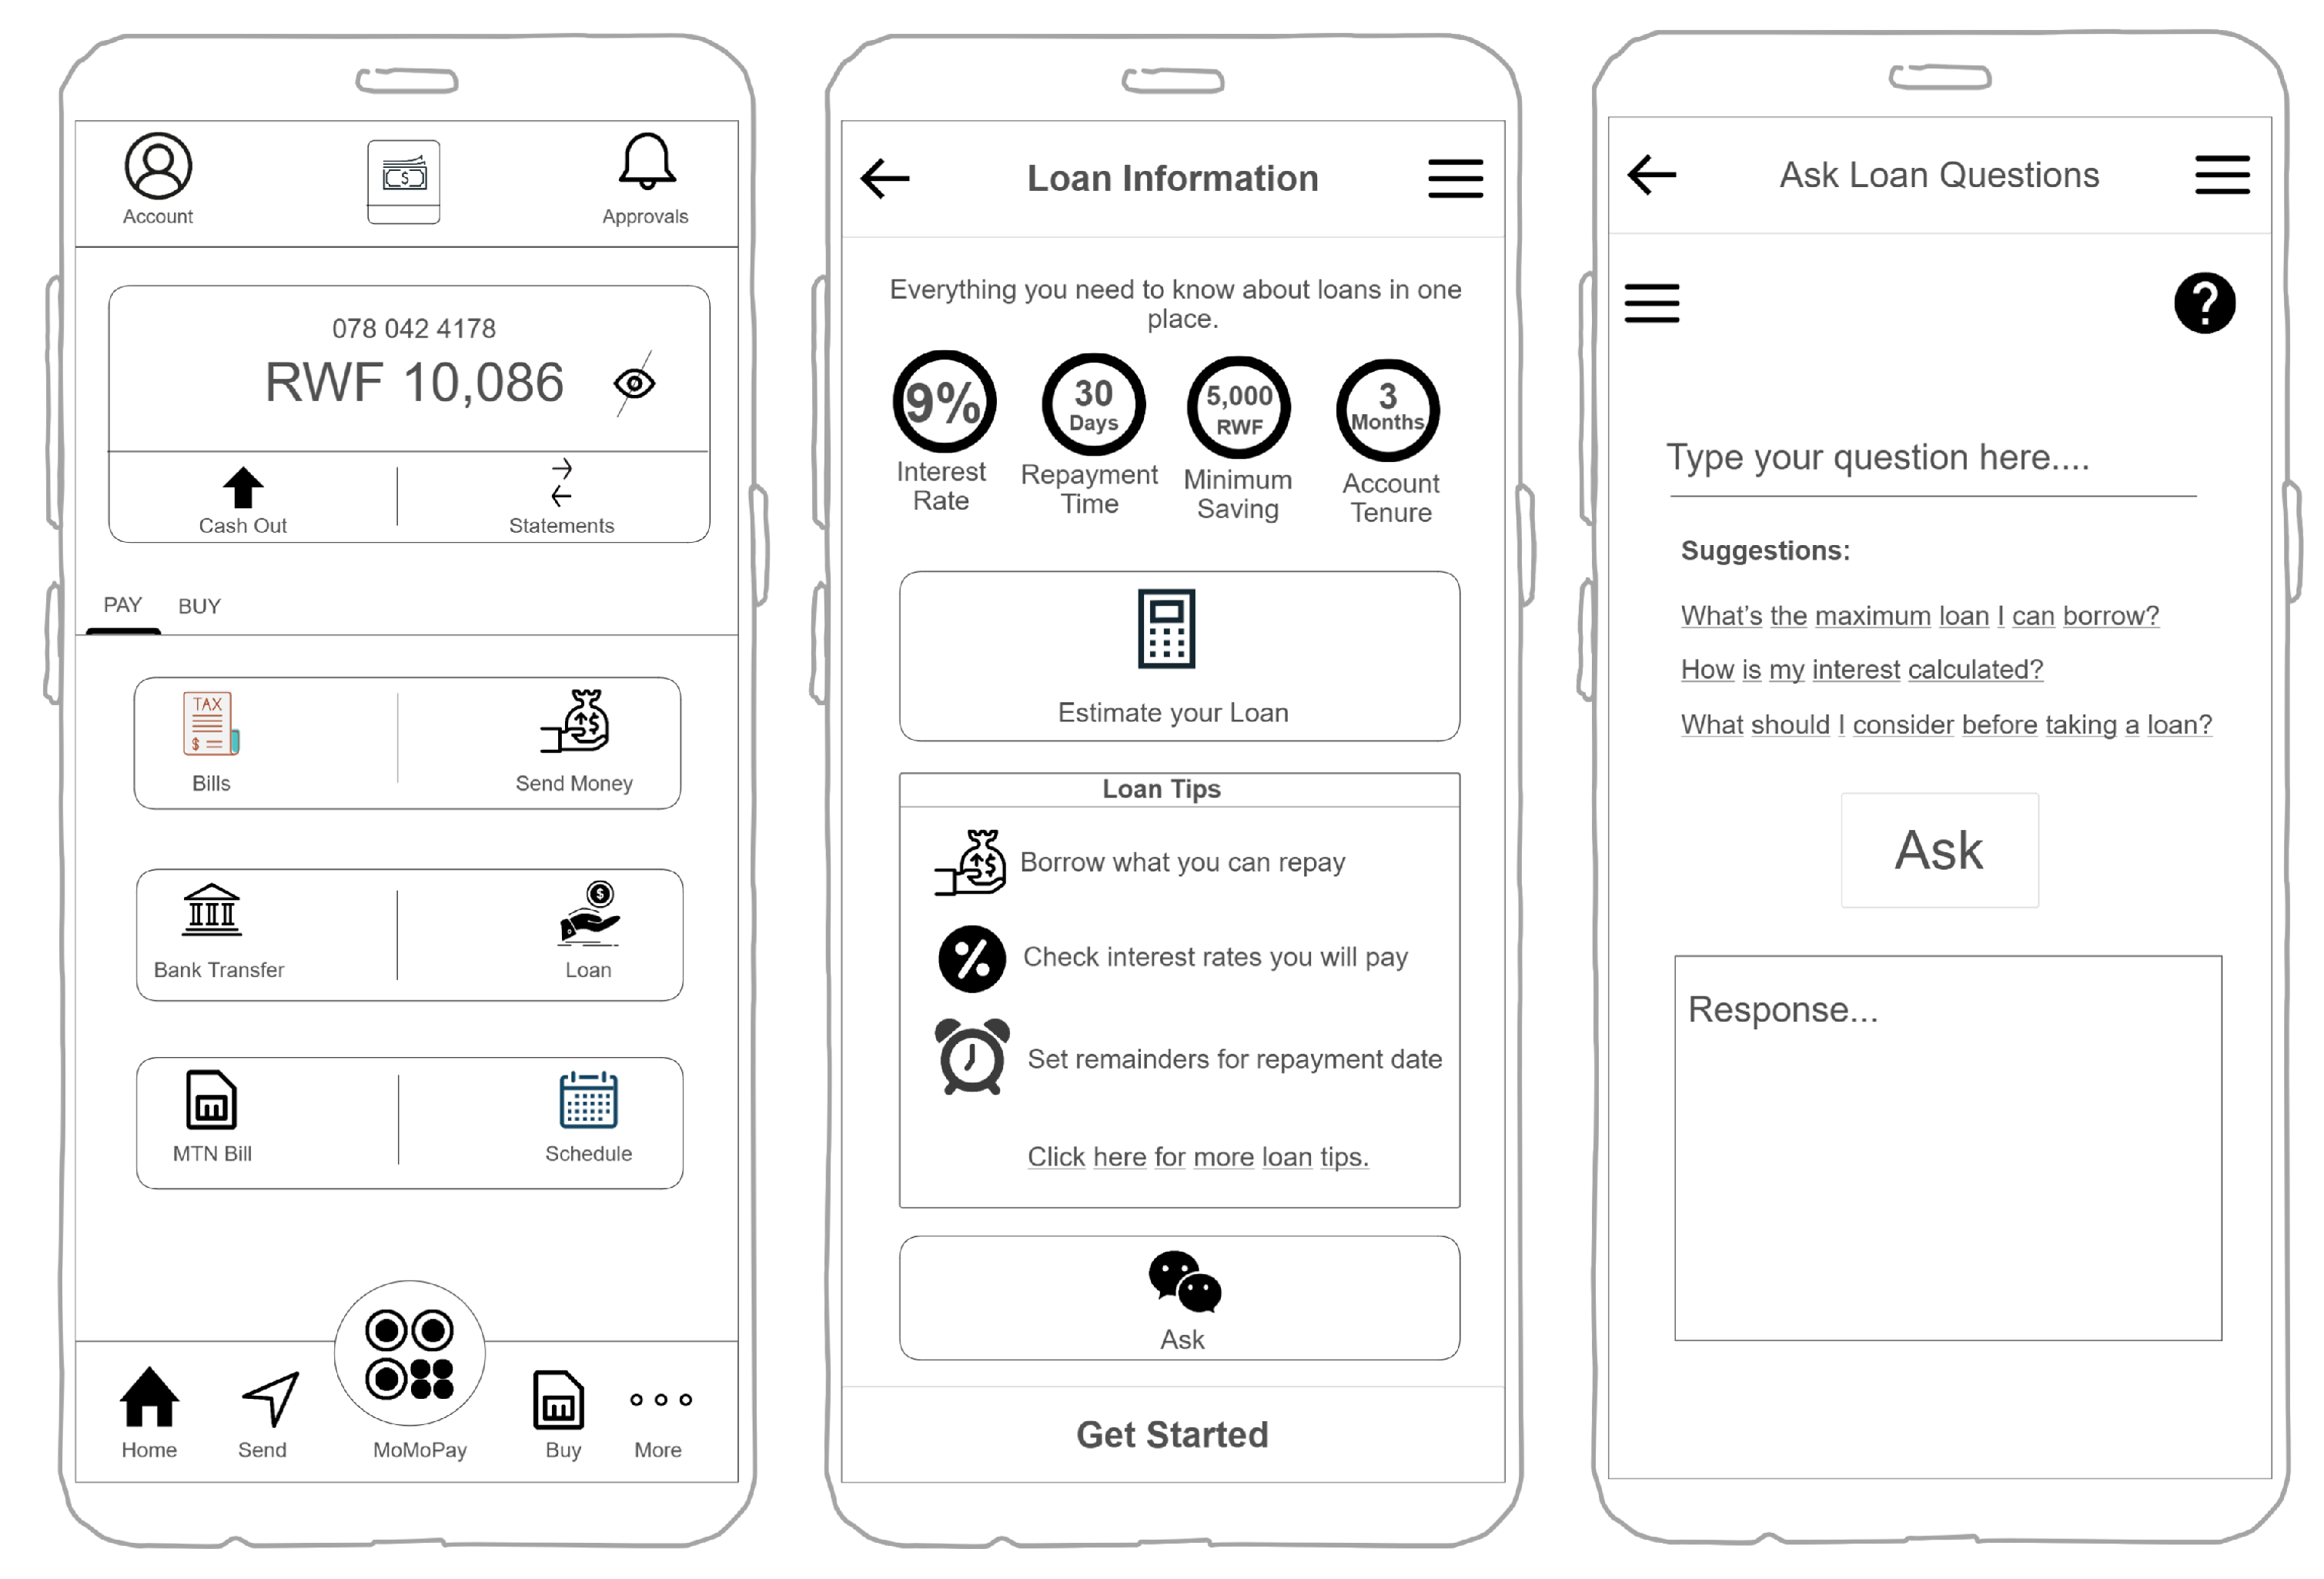
Figure 2.
Education level vs. Financial literacy
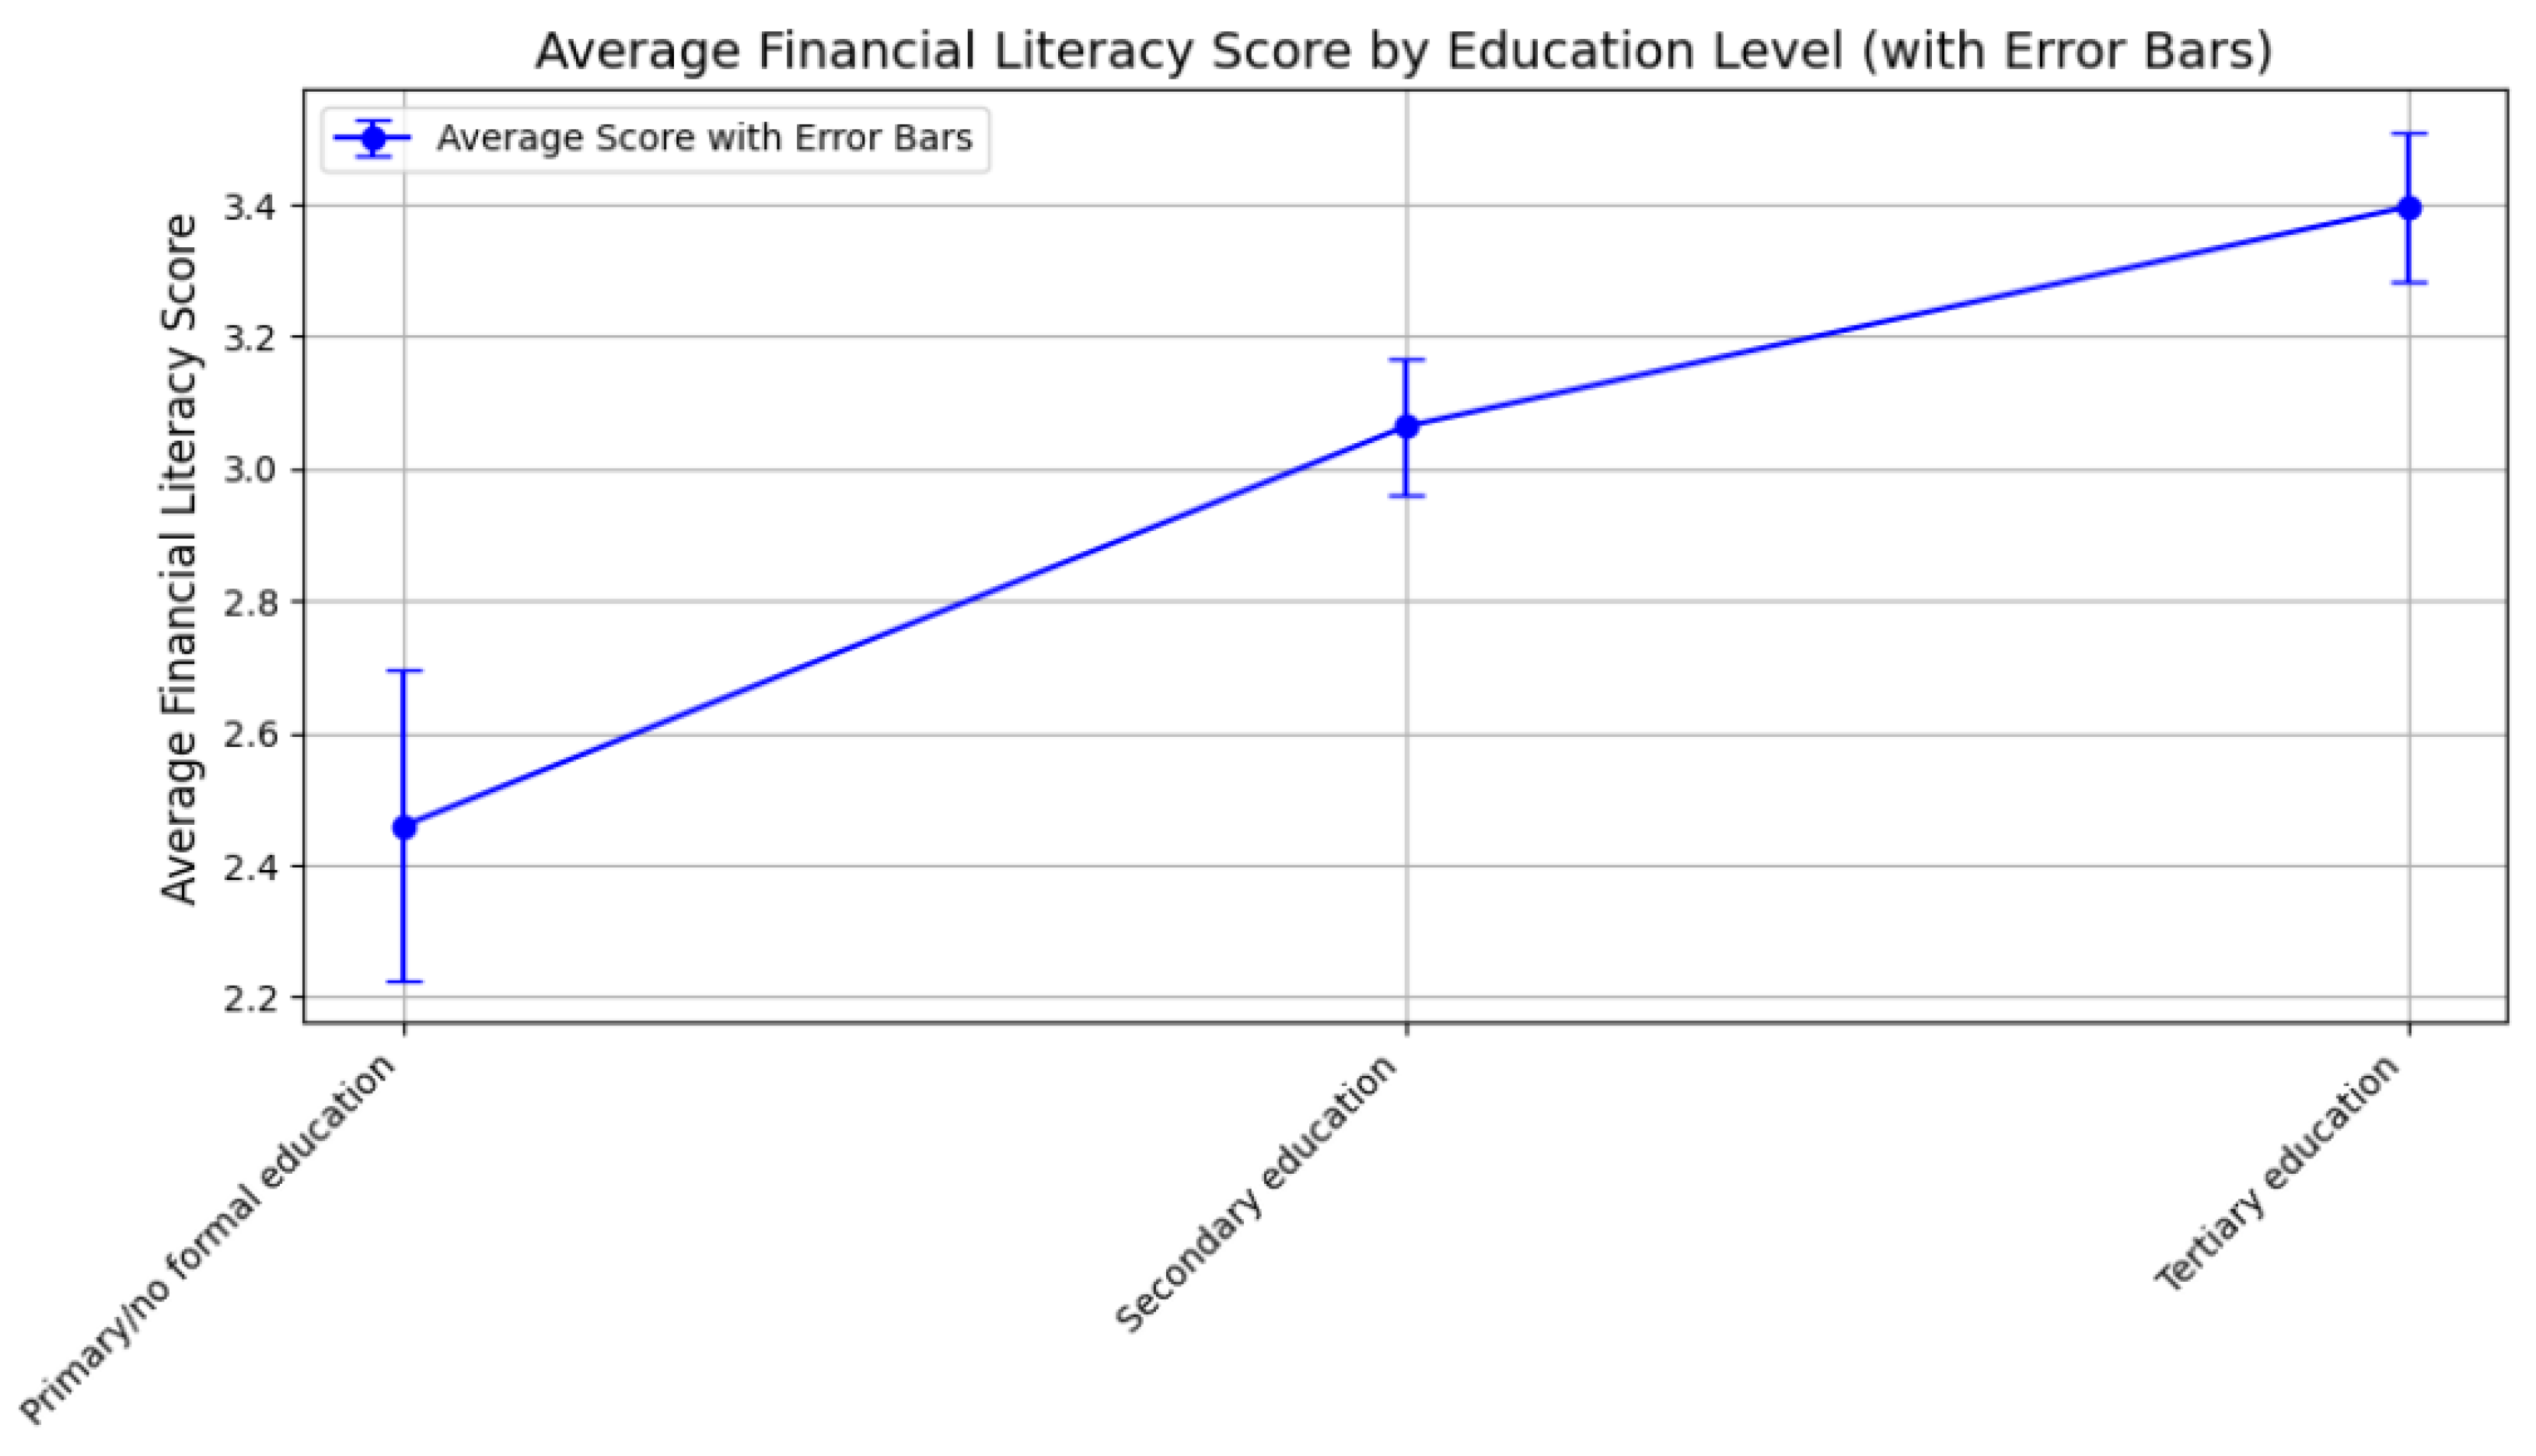
Figure 3.
Ranking of the services known to the subjects
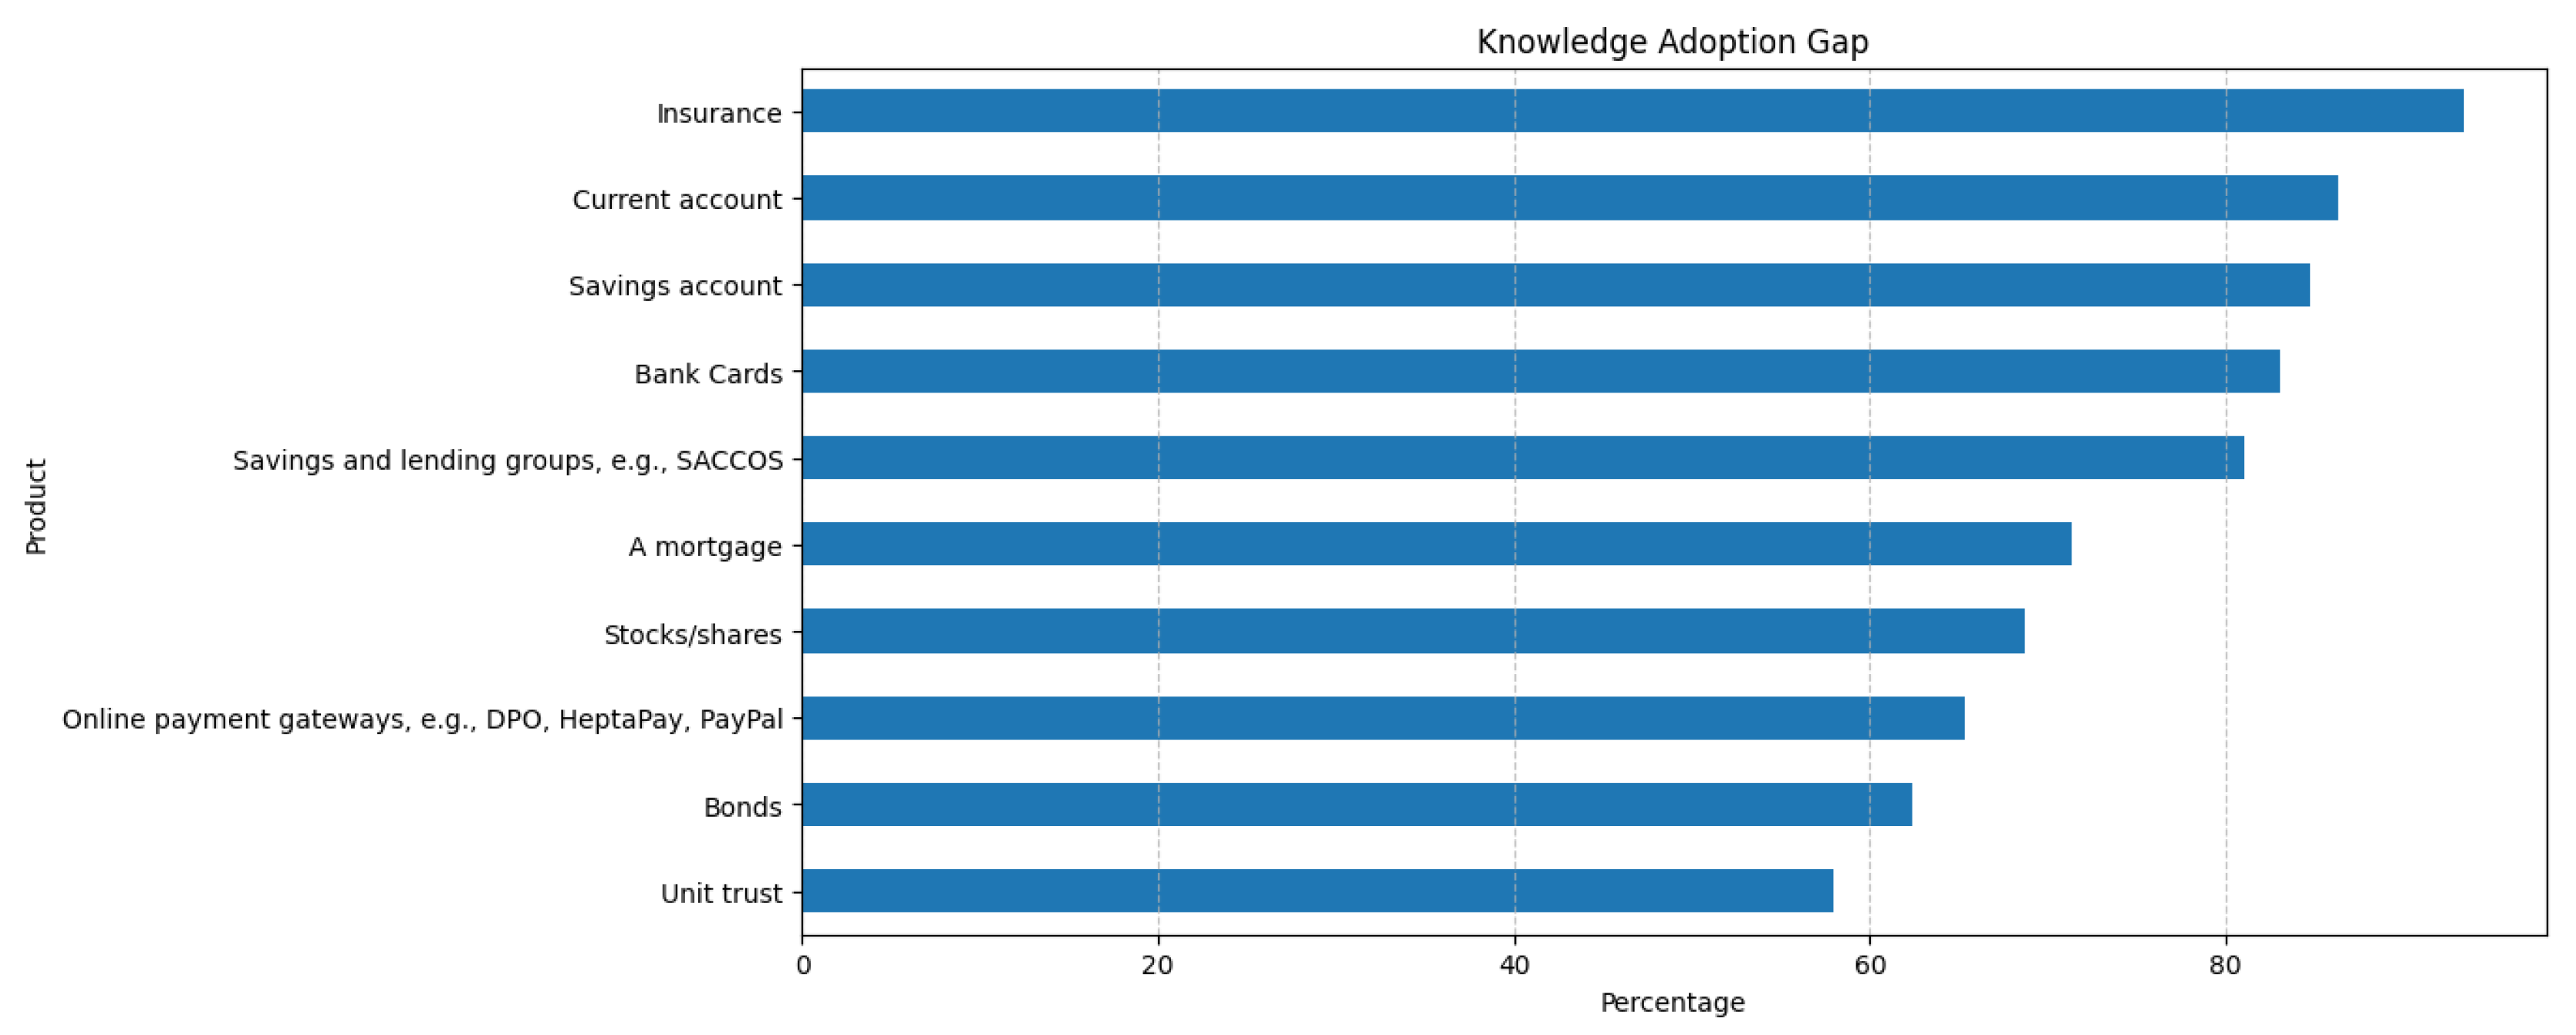

Table 1.
Participant demographics.
| Sex | Number of Participants |
|---|---|
| Male | 168 (56%) |
| Female | 132 (44%) |
| Education Level | Number of Participants |
| No schooling or primary (elementary) level education | 37 (12.3%) |
| Secondary (high school) education | 157 (52.3%) |
| Tertiary education | 106 (35.3%) |
Table 2.
Demographic profile of participants who took part in the prototype testing study.
| Participant | Age Range | Gender | Highest Education Level |
|---|---|---|---|
| P1 | 25-32 years | Female | Graduate studies |
| P2, P3, P4, P6 | 25-32 years | Male | Graduate studies |
| P5 | 18-24 years | Male | Graduate studies |
| P7 | 18-24 years | Female | Undergraduate studies |
| P8, P10 | 25-32 years | Male | Secondary Education |
| P9 | 18-24 years | Female | Secondary Education |
Disclaimer/Publisher’s Note: The statements, opinions and data contained in all publications are solely those of the individual author(s) and contributor(s) and not of MDPI and/or the editor(s). MDPI and/or the editor(s) disclaim responsibility for any injury to people or property resulting from any ideas, methods, instructions or products referred to in the content. |
© 2026 by the authors. Licensee MDPI, Basel, Switzerland. This article is an open access article distributed under the terms and conditions of the Creative Commons Attribution (CC BY) license (http://creativecommons.org/licenses/by/4.0/).
Copyright: This open access article is published under a Creative Commons CC BY 4.0 license, which permit the free download, distribution, and reuse, provided that the author and preprint are cited in any reuse.


