Submitted:
03 September 2025
Posted:
09 September 2025
You are already at the latest version
Abstract
This study investigates how digital finance platforms influence financial literacy in Ilala Municipality, Tanzania, focusing on the effects of media exposure, financial content quality, and user engagement. The specific objectives involved investigating the effects of exposure to media, the effects of the quality of content, and the effects of exposure to digital platforms on financial literacy. A quantitative cross-sectional design was applied, using structured questionnaires to collect data from 201 respondents. Statistical analyses, including regression and mediation tests, were conducted to examine the relationships. Findings reveal that media exposure through digital sources negatively affects financial literacy (B = -3.018, p < 0.001), which means that unfiltered information can limit financial knowledge. Meanwhile, the financial content quality (B = 3.774, p < 0.001) and digital media exposure (B = 7.995, p < 0.001) significantly enhance money literacy. The study provides evidence for policymakers, financial institutions, and educators to leverage digital platforms as tools for financial literacy campaigns. Emphasis should be placed on ensuring high-quality content and promoting interactive engagement. The paper contributes to the limited empirical literature in Sub-Saharan Africa, highlighting the mechanisms by which digital finance platforms affect literacy in an urban Tanzanian setting.
Keywords:
digital financial platforms
; financial literacy
; media exposure
; user engagement
; Tanzania
1. Introduction
Digital finance has expanded access to financial services globally, with platforms like M-Pesa, Tigo Pesa, and Airtel Money driving inclusion in Tanzania. Despite high adoption, financial literacy covering budgeting, saving, and investing remains low. In Ilala Municipality, Dar es Salaam, where digital activity is high, this study examines whether media exposure, content quality, and user engagement on digital platforms enhance financial literacy.
Globally, access to financial information does not always translate to literacy, as seen in the U.S., Europe, and Asia (FINRA, 2022; Lusardi & Mitchell, 2017; Suri & Jack, 2016; World Bank, 2022). In Sub-Saharan Africa, only 22% of adults are financially literate (AfDB, 2021), with mobile platforms improving awareness but structural and cultural barriers persisting (GSMA, 2023; Napier et al., 2020).
In Tanzania, over 65% of adults use mobile money, yet financial literacy is only 28% (Bank of Tanzania, 2023; FSDT, 2022). Urban areas like Dar es Salaam benefit from high smartphone penetration (78%) and internet access, but challenges remain due to misinformation, language barriers, and gender disparities (GSMA, 2023; Rutashobya et al., 2021). Existing initiatives have not fully bridged the gap (Finscope Tanzania, 2022). This study investigates how digital media factors influence financial literacy in Ilala Municipality.
-
Objectives:
- To examine the influence of media exposure through digital platforms on financial literacy levels in Ilala Municipality.
- To assess how the quality of digital financial content influences financial literacy in Ilala Municipality.
- To analyze the effect of engagement with digital platforms on financial literacy in Ilala Municipality.
2. Literature Review and Hypotheses Development
2.1. Digital Financial Literacy
Digital finance has increased access to financial services worldwide, with platforms like M-Pesa, Tigo Pesa, and Airtel Money expanding inclusion in Tanzania. Despite high adoption, financial literacy covering budgeting, saving, and investing remains low. Globally and in Sub-Saharan Africa, access to financial information does not always translate to literacy, with only 22% of adults in the region considered financially literate. In Tanzania, over 65% of adults use mobile money, yet only 28% are financially literate. Urban areas like Dar es Salaam benefit from high smartphone penetration and internet access, but challenges such as misinformation, language barriers, and gender disparities persist. This study examines how media exposure, content quality, and engagement with digital platforms influence financial literacy in Ilala Municipality.
2.2. Media Exposure
Media exposure is the frequency and extent of engaging with media sources, shaping knowledge and behavior. In financial literacy, it involves accessing personal finance information via traditional and digital media, including social platforms like Facebook, Instagram, and YouTube (OECD, 2021; Lin, 2023; Bonsón et al., 2021). Repeated exposure to diverse financial content can improve understanding and attitudes toward money management. In this study, media exposure is measured as how Ilala residents use online media for financial education and its influence on informed financial decision-making.
2.3. Digital Financial Platforms
Digital platforms such as websites, mobile apps, and social networks facilitate access to financial education and services, enabling users to manage finances, invest, and pay bills (Kiptum, 2018). They are especially valuable in developing countries, offering affordable, accessible, and interactive learning opportunities (Vargo et al., 2022). Mobile technologies and customized apps further support financial literacy through budgeting and investment guidance. In this study, digital platforms are examined as an independent variable to assess their impact on financial knowledge and decision-making among residents of Ilala Municipality.
2.4. Financial Literacy
Financial literacy is the ability to understand and manage personal finances, including budgeting, saving, investing, and debt management, as well as applying concepts like interest rates, inflation, and risk management (OECD, 2022; Lusardi, 2021). It involves both knowledge and practical skills for informed decision-making, such as retirement planning and responsible debt use. With the rise of online financial services, digital literacy is crucial for navigating mobile banking and other digital platforms. In this study, financial literacy is the dependent variable, assessed to examine how media exposure and engagement with digital platforms influence financial knowledge, behavior, and decision-making in Ilala Municipality.
2.5. Theoretical Framework
This study is grounded in the Uses and Gratification Theory (UGT) and Technology Acceptance Model (TAM), which emphasize perceived usefulness and ease of use in technology adoption, and the Financial Literacy Framework, which views literacy as a product of exposure, comprehension, and behavioural change.
- i.
- Uses and Gratifications Theory
The Uses and Gratifications Theory (UGT) posits that individuals actively select media to satisfy needs like information, social interaction, and entertainment (Katz, Blumler, & Gurevitch, 1973). Unlike passive audience models, it emphasizes purposeful media use. In the digital era, UGT explains how people turn to mobile apps, social media, and online platforms to enhance financial knowledge (Ruggiero, 2000). For this study, UGT provides a framework showing how Ilala residents’ media exposure, content quality, and engagement with digital platforms drive financial literacy by reflecting their motivations and active learning behaviors (Papathanassopoulos & Negrine, 2021).
- ii.
- Technology Acceptance Model (TAM)
The Technology Acceptance Model (TAM) explains technology adoption through perceived usefulness and ease of use (Davis, 1989). In this study, TAM assesses how the relevance, clarity, and accessibility of digital financial content influence financial literacy. Perceived usefulness reflects the value of online resources, while ease of use emphasizes user-friendly design for sustained engagement. When combined with the Uses and Gratifications Theory (UGT), which captures users’ motivational drivers, the integrated framework explains both why residents of Ilala Municipality engage with digital platforms and how they adopt and retain them, enhancing financial literacy outcomes.
2.6. Media Exposure through Digital Platforms
Chaudhary and Luthra (2022) demonstrated that media exposure through digital platforms such as blogs and apps positively influences financial literacy in emerging economies by improving decision-making in budgeting and investment. Their findings underscore the role of digital platforms as effective tools for enhancing financial knowledge. Similarly, Alam and Islam (2021) found that exposure to online platforms, including YouTube tutorials and financial blogs, improved financial literacy among Bangladeshi youth, particularly in debt management and savings. However, they also highlighted gaps in the accessibility and availability of engaging financial content in emerging markets. Both studies affirm that digital platforms can significantly enhance financial literacy, supporting this study’s focus on Ilala Municipality, where media exposure is critical to addressing financial knowledge gaps.
2.7. The Quality of Digital Financial Content
Wang and Zhou (2023) found that the quality of digital financial content strongly influences financial literacy in urban China, with clear, accurate, and user-friendly materials significantly improving knowledge in areas such as retirement planning and investment. Similarly, Müller and Weber (2022) showed in Germany that high-quality, transparent, and tailored financial content enhances user confidence and decision-making. Both studies highlight that the effectiveness of financial education depends on the accuracy and clarity of online content, supporting this study’s objective of examining how the quality of digital financial content shapes financial literacy in Ilala Municipality.
2.8. Engagement with Digital Platforms
Kim and Park (2021) in South Korea found that frequent interactions with digital platforms such as mobile banking apps, online financial courses, and blogs significantly improved financial literacy, particularly in budgeting and investment management. Similarly, Oluwatayo and Oladimeji (2022) in Nigeria showed that active and consistent use of mobile financial platforms enhanced understanding of savings, loans, and investment opportunities, leading to better financial decision-making. Both studies emphasize that sustained engagement with digital platforms is crucial for strengthening financial literacy, directly supporting this study’s objective of assessing the role of user engagement with digital finance platforms in Ilala Municipality.
2.9. Conceptual Framework
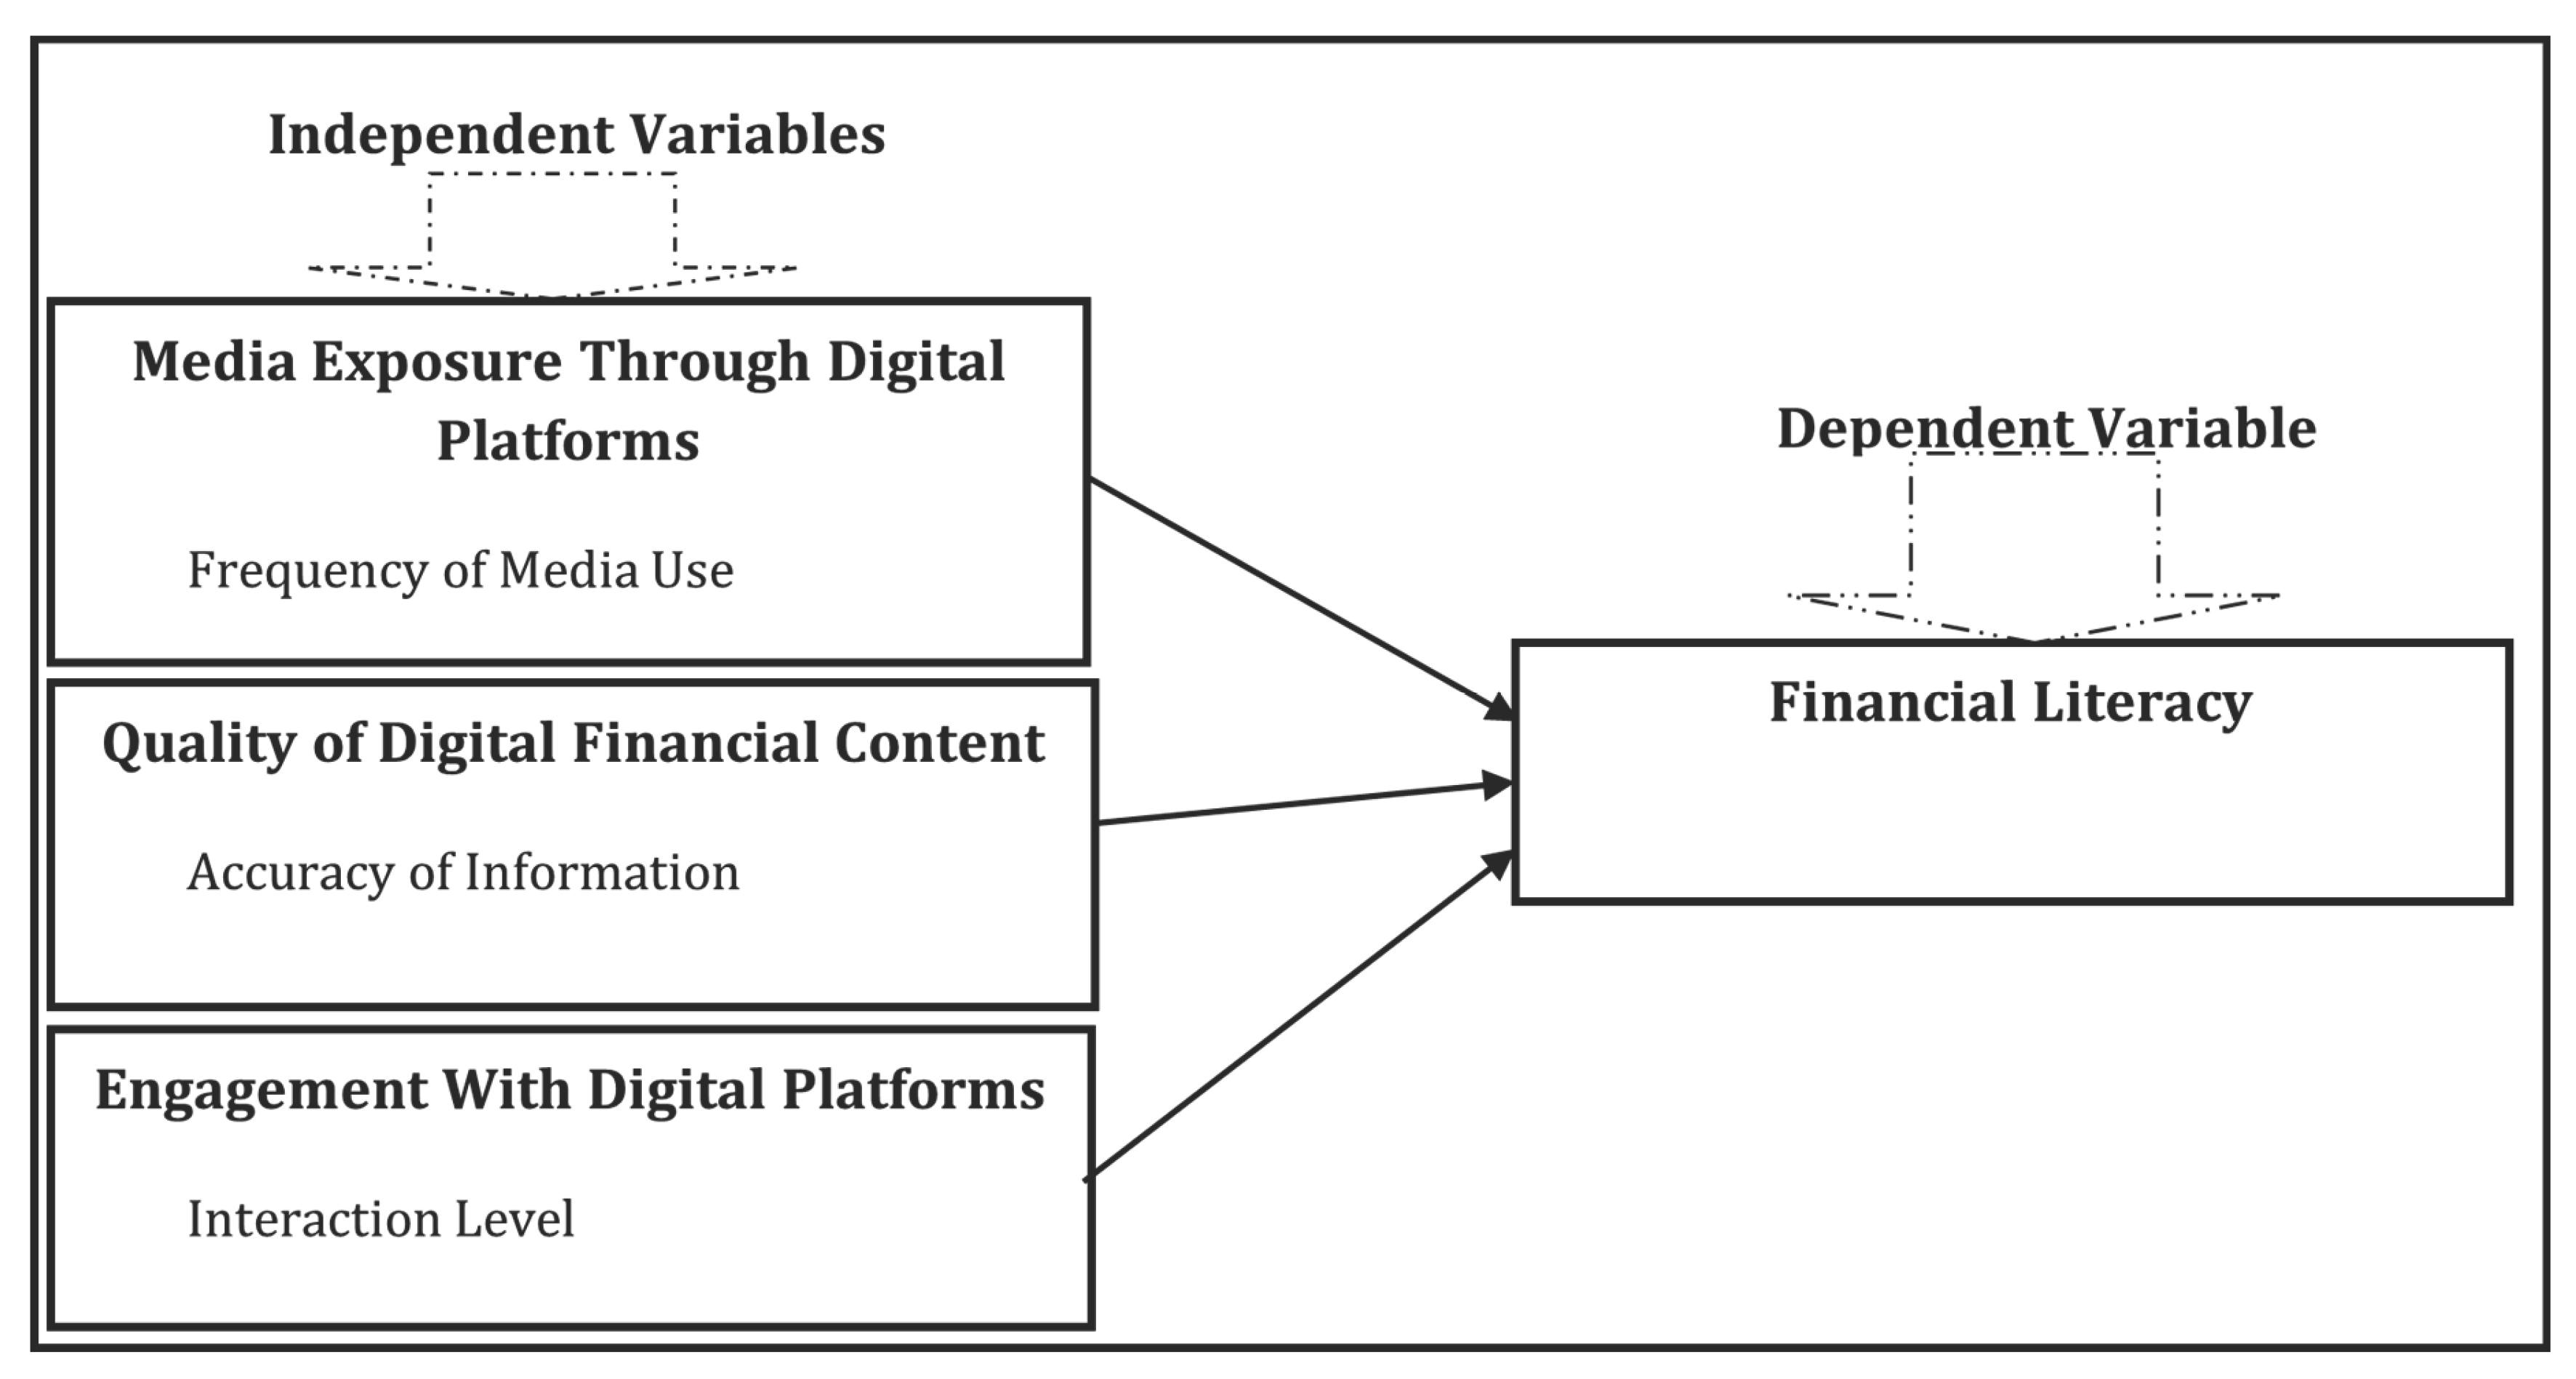
The study uses a conceptual model showing how media exposure, digital financial content quality, and user engagement on digital platforms influence financial literacy. Media exposure measures how frequently and diversely individuals access digital financial information and the perceived credibility of sources. Content quality assesses the accuracy, clarity, and relevance of information in relation to users’ financial needs. User engagement captures active participation, including interaction with platforms, use of financial tools, and duration of platform use. Together, these factors explain how digital platforms enhance financial knowledge, skills, and behaviors, ultimately improving overall financial literacy.
Figure 1.
Conceptual Framework Source: Literature review, (2025).
3. Materials and Methods
3.1. Study Area
The study was conducted in Ilala Municipality, Dar es Salaam, Tanzania, a densely populated and socioeconomically diverse urban area near the central business district. Its strategic location, strong transport links, widespread mobile phone and internet use, and concentration of financial institutions make it an ideal setting to examine how digital platforms influence financial literacy. Ilala’s mix of income levels, education, and digital media exposure provides a representative urban population, while its coordinates (6.7921° S, 39.2035° E) situate it near the coast and central commercial hub. These factors collectively create an optimal environment to study the role of digital media in shaping financial literacy in a digitally active urban context.
3.2. Research Design
A quantitative cross-sectional design was employed, whereby data were collected at a single point in time to examine the relationship between media exposure, digital financial content quality, user engagement, and financial literacy in Ilala Municipality, Dar es Salaam. This design was cost-effective and time-efficient, making it appropriate for resource-constrained projects, while also enabling the use of statistical techniques such as regression analysis for hypothesis testing (Kothari, 2016; Creswell & Creswell, 2018). By sampling Ilala’s socioeconomically diverse population, the design enhanced the potential for generalizing findings to similar urban contexts (Zamzam, 2018; Huyler & McGill, 2019).
3.3. Sampling and Data Collection
The study employed stratified random sampling across Ilala Municipality’s 36 wards, with a sample of 216 respondents determined using Yamane’s formula and proportionally allocated. Data were collected via structured Likert-scale questionnaires, both physical and online, measuring media exposure, digital content quality, platform engagement, and financial literacy. Out of 216, 201 valid responses were obtained (93.05% response rate), mainly from respondents aged 18–34. Reliability tests showed high internal consistency (Cronbach’s alpha = 0.934) and stable responses, confirming that the findings reliably reflect media’s impact on financial literacy in the municipality.
3.4. Measures
Table 1 illustrates the measurement plan of this study for both independent and dependent variables. Each of these indicators is pegged on a Likert scale to quantify subjective perception/behaviors.

Table 1.
Measurement of Variables.
| S/N | Variables | Measure/Indicator | Description | Sources |
|---|---|---|---|---|
| Independent | ||||
| 1. | Media Exposure through Digital Platforms | Frequency of Media Use | Respondents showed the level of their usage of online platforms. Data was gathered through a Likert scale. | Hsieh & Lee, (2021) |
| Type of Content Consumed | Participants identified the proportion of financial and non-financial information that they read on the internet platforms. Data was gathered utilizing the Likert scale. | Chatterjee & Soni (2022); Moutinho & Santos, (2023) | ||
| Source Credibility | Respondents rated how much they think the source is reliable. Sites’ trustworthiness was assessed with Likert scale items. | Lee & Choi, (2021); Rho & Yang, (2022) | ||
| 2. | Quality of Digital Financial Content | Accuracy of Information | Respondents rated whether content consumed in finances matches confirmed sources. This was done through the use of Likert scale measures. | Batra, & Sharma, (2021); Taneja & Kumar, (2022) |
| Clarity and Readability | Participants evaluate the readability and comprehensibility of the digital financial information, with a focus on understanding and ease of access. Responses were collected using Likert scale. | Kumar, & Mehra, (2021); Sharma, & Gupta, (2022) | ||
| Relevance of Topics | The importance of the issues to the financial decision-making of the respondent were quantified. Data was collected using a Likert scale approach. | Lee & Park, (2022); Hsieh & Lin, (2023) | ||
| 3. | Engagement With Digital Platforms | Interaction Level | Participants indicated their own degree of participation (comments, shares, discussions) on fiscal content through digital media based on Likert scale questions. | Kumar, & Mehra, (2021); Sharma, & Gupta, (2022) |
| Utilization of Tools | Participants assessed their utilization of electronic resources such as calculators, applications, or online guides to financial literacy by using Likert scale items. | Kumar, & Mehra, (2021); Sharma, & Gupta, (2022) | ||
| Dependent | ||||
| 1. | Financial Literacy | Knowledge Acquisition | Respondents were examined for their understanding of financial concepts by standard financial literacy tests or questionnaires. | Kumar, & Mehra, (2021); Sharma, & Gupta, (2022) |
Source: Researcher, (2024).
3.5. Validity and Reliability of the Study
- i.
- Validity of the Data
Validity ensures research tools measure what they are intended to. This study addressed content validity by aligning questionnaire items with key dimensions—media exposure, digital content quality, digital platform use, and financial literacy—and having experts review them for relevance. Construct validity was confirmed by comparing survey items with established financial literacy theories, ensuring the constructs were measured accurately and theoretically sound.
Table 2.
KMO and Bartlett’s Test.
| Kaiser-Meyer-Olkin Measure of Sampling Adequacy. | .691 | |
| Bartlett’s Test of Sphericity | Approx. Chi-Square | 432.513 |
| Df | 36 | |
| Sig. | .000 | |
Source: SPSS Output, (2025).
Pilot testing confirmed that the questionnaire effectively measured the intended variables. The KMO value of 0.691 indicated moderate sampling adequacy suitable for factor analysis, while Bartlett’s Test of Sphericity (χ² = 432.513, df = 36, p < .000) confirmed strong item correlations. Together, these results established construct validity, showing that the instrument was appropriate for identifying latent constructs related to financial literacy and media use.
Table 3.
Pattern Matrix.
| Variables | Componenta | |||
| 1 | 2 | 3 | 4 | |
| Frequency of Media Use | -.169 | -.309 | -.804 | .089 |
| Type of Content Consumed | .191 | .750 | .171 | -.127 |
| Source Credibility | .073 | -.266 | -.004 | .839 |
| Accuracy of Information | -.102 | -.162 | .713 | .241 |
| Clarity and Readability | -.342 | .743 | .000 | -.132 |
| Relevance of Topics | -.120 | -.504 | .312 | -.448 |
| Interaction Level | -.130 | .079 | .442 | .652 |
| Utilization of Tools | .921 | -.190 | .078 | -.102 |
| Usage Duration | .742 | .075 | -.047 | .153 |
| Extraction Method: Principal Component Analysis. Rotation Method: Promax with Kaiser Normalization. | ||||
| a. Rotation converged in 7 iterations. | ||||
Source: SPSS Output, (2025).
The Pattern Matrix identified four distinct components, confirming the multidimensionality of the constructs. Component 1 captured Use of Tools and Length of Use, while Component 2 reflected Nature of Content Used and Clarity and Legibility. Component 3 represented Accuracy of Data, and Component 4 encompassed Credibility of Source and Degree of Interaction. These results demonstrate that the instrument successfully distinguished key factors of online media consumption, reinforcing its construct validity in measuring engagement drivers influencing financial literacy.
- ii.
- Reliability of the Data
Reliability refers to the consistency of measurement over time (Chiang et al., 2015). In this study, it ensured dependable measurement of constructs such as media exposure, digital financial content quality, and engagement levels in relation to financial literacy. Reliability was assessed using Cronbach’s alpha, with values of 0.7 or higher considered acceptable. The results showed that all constructs met this threshold, indicating reliable measures. Cronbach’s alpha, a widely used indicator of internal consistency, evaluates how closely related items within a scale are as a group (Surucu & Maslakci, 2020).
Table 4.
Reliability Statistics.
| Cronbach’s Alpha | Cronbach’s Alpha Based on Standardized Items | N of Items |
| .934 | .940 | 52 |
Source: SPSS Output, (2025).
According to Middleton (2020), a Cronbach’s alpha above 0.7 is considered acceptable for research, indicating adequate internal consistency. In this study, the Cronbach’s alpha was 0.934 across 52 items, exceeding 0.9 and demonstrating very high reliability of the variables. In addition, test-retest reliability was assessed by re-administering the questionnaire to a sub-sample after a short interval, confirming stability of responses over time. These reliability and validity measures ensure that the findings are both robust and representative, supporting the conclusion that media use contributes meaningfully to enhancing financial literacy in Ilala Municipality.
3.6. Ethical Considerations
The study adhered to research ethics by ensuring informed consent, voluntary participation, and the right to withdraw without consequences. Anonymity and confidentiality were maintained, with no personal identifiers collected, secure data storage, and results reported in aggregate to protect participants’ privacy.
3.7. Data Analysis
Data were analyzed using IBM SPSS Statistics v26. Descriptive statistics summarized respondents’ demographics, media usage, and financial literacy levels, while inferential analysis, including nonparametric correlation, examined the strength and direction of relationships between media exposure, content quality, platform engagement, and financial literacy.
Multiple regression analysis further established the extent to which these independent variables explained variation in financial literacy outcomes.
The model used is specified as:
Y= β0+β1X1+β2X2+β3X3+ϵ
where:
- Y = Financial literacy score (dependent variable)
- X1 = Media exposure (frequency and type of financial media consumed)
- X2 = Quality of digital financial content (accuracy, clarity, and relevance)
- X3 = Engagement with digital platforms (intensity and use of financial tools)
- β0 = Constant
- β1, β2, β3 = Regression coefficients
- ε = Error term
The regression tested the independent effects of each predictor while controlling for the others, enabling insights into their relative contributions to financial literacy.
To ensure reliability and validity, standard regression assumptions were tested:
- Linearity: verified through scatterplots and residual analysis.
- Homoscedasticity: checked via residual plots.
- Normality of residuals: assessed using P-P plots and Shapiro-Wilk tests.
- No multicollinearity: confirmed by acceptable Variance Inflation Factor (VIF < 10) values.
These steps enhanced the robustness of the findings, ensuring valid inferences about the role of digital media in shaping financial literacy outcomes.
4. Results
Respond Rate of the Respondents
Table 5 indicates that 216 questionnaires were distributed to participants, both physically and online. Of these, 201 were completed and returned, representing a response rate of 93.05%, while 15 questionnaires (6.95%) were either missing or partially completed. A response rate exceeding 75% is considered acceptable for research validity (Kothari, 2016), confirming that the study’s data are suitable for further analysis.
Table 5.
Response Rate of the Respondents.
| Responses | Frequency | Percent (%) |
|---|---|---|
| Valid Response | 201 | 93.05 |
| Missing Response | 15 | 6.95 |
| Total | 216 | 100 |
Source: Field study, (2025).
The high response rate strengthens the reliability of the findings, ensuring that the results are representative of the target population.
Demographic Information of the Respondents
Table 6 summarizes the demographic characteristics of respondents. Most respondents (62.2%) were aged 18–34 years, indicating a predominantly youthful sample. Regarding education, the majority (56.2%) held college or undergraduate degrees, while 29.4% had completed secondary education, reflecting a relatively educated sample.
Table 6.
Demographic Information (n=201).
| Age of the Respondents | Frequency | Percent (%) |
| 18-24 | 60 | 29.9 |
| 25-34 | 65 | 32.3 |
| 35-44 | 57 | 28.4 |
| 45-54 | 13 | 6.5 |
| 55 and above | 6 | 3.0 |
| Educational Level of the Respondents | Frequency | Percent (%) |
| Primary Education Level | 19 | 9.5 |
| Secondary Education Level | 59 | 29.4 |
| College/Undergraduate degree | 113 | 56.2 |
| Postgraduate degree | 10 | 5.0 |
| Frequency of Digital Platform Usage by Respondents | Frequency | Percent (%) |
| Daily | 51 | 25.4 |
| Weekly | 66 | 32.8 |
| Monthly | 46 | 22.9 |
| Rarely | 22 | 10.9 |
| Never | 16 | 8.0 |
| Monthly Income Level of the Respondents | Frequency | Percent (%) |
| Below TZS 500,000/= | 74 | 36.8 |
| TZS 500,000/= - 1,000,000/= | 84 | 41.8 |
| TZS 1,000,000/= - 1,500,000/= | 28 | 13.9 |
| TZS 1,500,000/= - 2,000,000/= | 8 | 4.0 |
| Above TZS 2,000,000/= | 7 | 3.5 |
Source: Field study, (2025).
Respondents reported frequent use of digital platforms: 25.4% used them daily, and 32.8% weekly. Most respondents (78.6%) earned less than TZS 1,000,000 per month, indicating a low-income, youthful, and educated population—an ideal sample for studying digital financial literacy.
Findings Based on Specific Objectives
Media Exposure Through Digital Platforms on Financial Literacy Levels
Respondents were asked to report on the frequency of media use, types of content consumed, and perceived credibility of sources. A five-point Likert scale was employed (1 = Strongly Disagree to 5 = Strongly Agree).
- i)
- Frequency of Digital Platforms Use
Table 7 indicates that respondents frequently rely on digital platforms for financial information. The highest mean (M = 3.73, SD = 1.09) reflects frequent overall use, with mobile apps and social media commonly used sources (M = 3.57, SD = 1.20).
Table 7.
Frequency of Digital Media Platforms Use by the Respondents (n= 201).
| Statements | N | Minimum | Maximum | Mean | Std. Deviation |
| I frequently use digital platforms to access financial information. | 201 | 1.00 | 5.00 | 3.7264 | 1.09076 |
| I regularly access digital platforms (e.g., mobile apps, social media) to learn about finances. | 201 | 1.00 | 5.00 | 3.5672 | 1.20280 |
| I rely on digital platforms daily for updates on financial matters. | 201 | 1.00 | 5.00 | 3.5721 | 1.18576 |
| My frequency of using digital platforms for financial purposes has increased over the past year. | 201 | 1.00 | 5.00 | 3.5075 | 1.11857 |
| Digital platforms are my primary source of financial information. | 201 | 1.00 | 5.00 | 3.5174 | 1.20870 |
Source: Field Study, (2025).
The findings reveal increased reliance on digital platforms for financial information, suggesting their critical role in enhancing financial literacy (Lusardi & Mitchell, 2014).
- ii)
- Type of Content Consumed
Table 8 shows that financial content is the most accessed category (M = 3.93), followed by diverse financial learning content (M = 3.69). However, prioritization and personalization scores were lower (M = 3.24–3.43), indicating that users may not fully align content with personal financial goals.
Table 8.
Type of Content Consumed on Digital Platforms used by Respondents (n=201).
| Statements | N | Minimum | Maximum | Mean | Std. Deviation |
| The content I consume on digital platforms is mostly related to financial topics. | 201 | 1.00 | 5.00 | 3.9254 | 1.02440 |
| I prioritize financial content over non-financial content when using digital platforms. | 201 | 1.00 | 5.00 | 3.2388 | 1.32389 |
| The financial content I find on digital platforms is relevant to my personal financial needs. | 201 | 1.00 | 5.00 | 3.4279 | 1.23936 |
| I often seek educational content on budgeting and savings on digital platforms. | 201 | 1.00 | 5.00 | 3.3781 | 1.34399 |
| Digital platforms provide a variety of content that caters to my financial learning. | 201 | 1.00 | 5.00 | 3.6866 | 1.21913 |
Source: Field Study, (2025).
- iii)
- Source Credibility
- Source Credibility of Digital Platforms
Respondents expressed high trust in digital platforms, with credibility influencing decision-making (M = 4.05) and high ratings for reliability (M = 4.07). However, lower scores for preferring familiar sources (M = 3.54) indicate that verification practices are inconsistent.
Table 9.
Source Credibility of the Digital Platforms used by Respondents.
| Statements | N | Minimum | Maximum | Mean | Std. Deviation |
| I trust the financial content provided on the digital platforms I use. | 201 | 1.00 | 5.00 | 4.2189 | .91205 |
| The financial platforms I access are reliable and well-researched. | 201 | 1.00 | 5.00 | 4.0746 | 1.02927 |
| I prefer digital financial content from recognized and verified sources. | 201 | 1.00 | 5.00 | 3.5423 | 1.37821 |
| Credibility of the source affects my decision to follow the advice given in digital financial content. | 201 | 1.00 | 5.00 | 4.0498 | 1.03320 |
| I verify the information obtained from digital platforms before applying it to my financial decisions. | 201 | 1.00 | 5.00 | 3.6418 | 1.08676 |
Source: Field Study, (2025).
The results suggest that while credibility is generally high, critical evaluation of content is moderate, emphasizing the need for improved digital literacy skills (OECD, 2020).
The Quality of Digital Financial Content and Financial Literacy
The study assessed how financial content quality—measured by accuracy, clarity/readability, and relevance—affects respondents’ financial literacy. Participants rated these factors on a five-point Likert scale (1 = Strongly Disagree to 5 = Strongly Agree), with results presented in the subsequent tables.
- i)
- Accuracy of Information in Digital Platforms
Table 10 indicates that respondents generally perceive digital financial content as accurate, with mean scores above 3.6. The highest-rated item (M = 3.90) reflects agreement that online financial information is factually correct, supporting its role in improving financial literacy (Huston, 2010).
Table 10.
Accuracy of Information in Digital Platforms.
| Statements | N | Minimum | Maximum | Mean | Std. Deviation |
| The financial content that I access from the digital platforms is factually correct. | 201 | 1.00 | 5.00 | 3.9005 | 1.18324 |
| The information provided by digital financial platforms about budgeting and investment is accurate. | 201 | 1.00 | 5.00 | 3.7413 | 1.09669 |
| The content agrees with the finance principles I am used to. | 201 | 1.00 | 5.00 | 3.8806 | 1.12057 |
| I seldom encounter misinformation on the digital platforms that I use to learn about finances. | 201 | 1.00 | 5.00 | 3.8159 | 1.08671 |
| For me, accuracy in financial content is an important condition for using digital platforms for financial purposes. | 201 | 1.00 | 5.00 | 3.6915 | 1.33206 |
Source: Field study, (2025).
High standard deviations indicate some variation in perception, but overall, accuracy remains a strong determinant of content credibility.
- ii)
- Clarity and Readability in Digital Platforms
Table 11 shows respondents perceive digital financial content as clear and easy to understand (M ≥ 3.75). Visual aids such as charts and videos (M = 3.96) enhance comprehension, highlighting the importance of design in digital financial literacy (OECD, 2020).
Table 11.
Clarity and Readability in Digital Platforms.
| Statements | N | Minimum | Maximum | Mean | Std. Deviation |
| Financial content on digital platforms is easy to understand. | 201 | 1.00 | 5.00 | 3.8856 | 1.05917 |
| The language used in digital financial content is clear and concise. | 201 | 1.00 | 5.00 | 3.7612 | 1.18012 |
| Visual aids on digital platforms (charts, videos) make financial content easier to understand. | 201 | 1.00 | 5.00 | 3.9552 | 1.03585 |
| I do not understand the financial content on some digital platforms. (Reverse-coded) | 201 | 1.00 | 5.00 | 3.7861 | 1.16576 |
| Digital platforms effectively simplify complex financial topics. | 201 | 1.00 | 5.00 | 3.9154 | 1.16953 |
Source: Field Study, (2025).
The results suggest that content clarity is satisfactory, and digital media are generally effective in facilitating understanding of financial concepts.
- iii)
- Relevance of Topics
Table 12 demonstrates that respondents find digital financial content relevant to personal financial needs and goals (M ≥ 3.60). Items such as personal financial problem-solving scored highest (M = 3.88), indicating strong perceived applicability (Lusardi & Mitchell, 2014).
Table 12.
Relevance of Topics in Digital Platform.
| Statements | N | Minimum | Maximum | Mean | Std. Deviation |
| Digital platforms provide content that matches my financial goals. | 201 | 3.00 | 5.00 | 3.8756 | .62406 |
| I find financial content on digital platforms relevant to my current needs. | 201 | 3.00 | 5.00 | 3.8308 | .64903 |
| The topics covered in digital financial content are practical for everyday financial decisions. | 201 | 2.00 | 5.00 | 3.6070 | .65555 |
| Financial content on digital platforms is frequently updated to reflect current trends. | 201 | 1.00 | 5.00 | 3.7015 | .99521 |
| I often find financial content on digital platforms that applies directly to my financial challenges. | 201 | 1.00 | 5.00 | 3.8806 | .86352 |
Source: Field Study, (2024).
Users perceive digital content as relevant, though frequency of updates could be enhanced to ensure continuous applicability.
Engagement with Digital Platforms and Financial Literacy
Engagement was assessed through interaction level, use of digital tools, and duration of platform use.
- i)
- Interaction Level
Table 13 shows moderate interaction with online financial communities. Highest scores were for contribution to decision-making (M = 3.46), while active participation (sharing content, forum posts) was relatively low, suggesting potential for increased engagement.
Table 13.
Interaction Level with Digital Platforms (n=201).
| Statements | N | Minimum | Maximum | Mean | Std. Deviation |
| I always take part in online discussion forums related to finance. | 201 | 1.00 | 5.00 | 3.0846 | .85312 |
| I often comment or share some financial content that I have come across on digital platforms. | 201 | 1.00 | 5.00 | 3.0498 | .81087 |
| Engaging with other users of finance has improved my knowledge about the subject. | 201 | 1.00 | 5.00 | 3.1393 | .92763 |
| I ask frequently ask questions or seek advice on financial platforms. | 201 | 1.00 | 5.00 | 3.3085 | 1.03169 |
| Interaction with the digital financial community adds something to my financial decision-making. | 201 | 1.00 | 5.00 | 3.4577 | .83633 |
Source: Field study, (2025).
The findings indicate engagement adds value but is underutilized, suggesting a need for interventions to foster active participation.
- ii)
- Utilization of Tools
Table 14 presents result on using digital tools to control finances, with overall positive but mixed levels of participation. Respondents tend to agree somewhat use tools like budgetary software or calculators (mean = 3.03) and that respondents enhance their planning ability (mean = 3.19).
Table 14.
Utilization of Tools in digital platforms.
| Statements | N | Minimum | Maximum | Mean | Std. Deviation |
| I often use digital tools, such as budgeting applications or calculators in managing my finances. | 201 | 1.00 | 5.00 | 3.0348 | 1.02654 |
| The digital tools available on platforms have enhanced my financial planning skills. | 201 | 1.00 | 5.00 | 3.1891 | .84503 |
| I find it easy to use financial tools on digital platforms. | 201 | 2.00 | 33.00 | 3.8507 | 2.35534 |
| Digital tools on the platforms give me an accurate idea about my financial status. | 201 | 1.00 | 5.00 | 3.3632 | 1.42914 |
| I make decisions regarding investment and savings based on digital tools. | 201 | 1.00 | 5.00 | 3.3881 | 1.11295 |
Source: Field Study, (2025).
The results reflect moderate engagement with digital tools, supporting incremental gains in financial literacy.
- iii)
- Usage Duration of digital platforms
Table 15 shows that respondents spend meaningful time learning finance on digital platforms (M = 3.26–3.46). Outlier values (Max = 45) suggest data entry issues, but overall, time investment contributes to enhanced financial literacy (Huston, 2010).
Table 15.
Usage Duration of Digital Platforms (n=201).
| Statements | N | Minimum | Maximum | Mean | Std. Deviation |
| I spend ample time on digital platforms to learn more about finance. | 201 | 1.00 | 5.00 | 3.2637 | 1.03688 |
| The time I spent on financial platforms contributed a lot to my understanding of finance. | 201 | 1.00 | 5.00 | 3.4577 | 1.01954 |
| I spend a certain number of minutes each day accessing financial content on digital devices. | 201 | 1.00 | 5.00 | 3.4179 | 1.11107 |
| Spending more hours on digital devices has advanced my financial literacy. | 201 | 1.00 | 5.00 | 3.4428 | 1.16532 |
| I hardly know how time flies when learning on digital platforms about finances. | 201 | 1.00 | 45.00 | 3.8856 | 3.10030 |
Source: Field study, (2024).
Financial Literacy of the Respondents
Table 16 presents self-reported financial knowledge acquisition. Respondents reported increased understanding of budgeting, saving, and investing (M = 3.94), as well as confidence in financial decisions (M = 3.97), demonstrating the positive role of digital platforms (Lusardi & Mitchell, 2014).
Table 16.
Knowledge Acquisition in Digital Platforms (n=201).
| Statement of the Respondents | N | Minimum | Maximum | Mean | Std. Deviation |
| I have been taken through the basics, including budgeting, saving, and investment | 201 | 1.00 | 5.00 | 3.9353 | 1.20449 |
| I am confident in making financial decisions based on knowledge gained from the digital platforms. | 201 | 1.00 | 5.00 | 3.9701 | 1.10865 |
| Digital financial content has improved my ability to manage my personal finances. | 201 | 1.00 | 5.00 | 3.8109 | 1.05550 |
| I can understand the risks involved with debt and credit management. | 201 | 1.00 | 5.00 | 3.7612 | 1.21354 |
| I can plan and track my expenses effectively using the knowledge of finance that I have gained. | 201 | 1.00 | 5.00 | 3.4975 | 1.38248 |
| Digital platforms have improved my understanding of financial products, such as loans and insurance. | 201 | 1.00 | 5.00 | 3.6119 | 1.35228 |
| I feel more financially empowered after consuming financial content on digital platforms. | 201 | 1.00 | 5.00 | 3.6219 | 1.29473 |
Source: Field Study, (2025).
High standard deviations indicate variability among respondents, possibly due to differing literacy levels or content quality.
Inferential Statistic
Normality Distribution of the Variables
Before applying parametric tests, normality of the variables was assessed using Kolmogorov–Smirnov and Shapiro–Wilk tests. Table 17 shows that p-values for all variables were below 0.05, indicating non-normal distributions. Consequently, non-parametric tests such as Spearman’s rank correlation and the Kruskal–Wallis test were employed to examine relationships and differences.
Table 17.
Tests of Normality.
| Variables | Kolmogorov-Smirnova | Shapiro-Wilk | ||||
| Statistic | df | Sig. | Statistic | df | Sig. | |
| Frequency of Media Use | .175 | 201 | .000 | .931 | 201 | .000 |
| Type of Content Consumed | .194 | 201 | .000 | .907 | 201 | .000 |
| Source Credibility | .225 | 201 | .000 | .890 | 201 | .000 |
| Accuracy of Information | .155 | 201 | .000 | .895 | 201 | .000 |
| Clarity and Readability | .176 | 201 | .000 | .866 | 201 | .000 |
| Relevance of Topics | .266 | 201 | .000 | .893 | 201 | .000 |
| Interaction Level | .149 | 201 | .000 | .951 | 201 | .000 |
| Utilization of Tools | .143 | 201 | .000 | .925 | 201 | .000 |
| Usage Duration | .170 | 201 | .000 | .913 | 201 | .000 |
| Financial Literacy (Dependent Variable) | .172 | 201 | .000 | .878 | 201 | .000 |
| a. Lilliefors Significance Correction | ||||||
Source: SPSS Output, (2025).
The non-normal distribution suggests that financial literacy and its predictors vary among respondents, warranting the use of non-parametric methods
Correlation Analysis
- i.
- Kruskal Wallis Test
The Kruskal–Wallis test (Table 18) assessed whether variations in media exposure, quality of online financial content, and engagement with digital platforms significantly affect financial literacy. All three factors were statistically significant, indicating meaningful contributions to financial knowledge.
Table 18.
Kruskal Wallis Test Statistics.
| Media Exposure Through Digital Platforms | Quality of Digital Financial Content | Engagement With Digital Platforms | |
| Kruskal-Wallis Ha,b | 37.982 | 15.224 | 12.920 |
| Df | 4 | 4 | 4 |
| Asymp. Sig. | .000 | .004 | .012 |
| a. Kruskal Wallis Test | |||
| b. Grouping Variable: Financial Literacy | |||
Source: SPSS Output, (2025).
The results indicate that higher exposure, better-quality content, and active engagement are associated with differences in financial literacy levels among respondents.
- ii.
- Spearman’s Rank Correlation
Spearman’s correlation (Table 19) was used to examine relationships between financial literacy and its predictors. Notably, media exposure showed a negative correlation (ρ = -0.264, p < 0.01), while content quality (ρ = 0.150, p < 0.05) and engagement (ρ = 0.144, p < 0.05) were positively correlated, highlighting the importance of content quality and interaction over mere exposure.
Table 19.
Spearman’s Rank Correlations.
| Financial Literacy | Media Exposure via Digital Platforms | Quality of Digital Financial Content | Engagement With Digital Platforms | |||
| Spearman’s rho | Financial Literacy | Correlation Coefficient | 1.000 | -.264** | .150* | .144* |
| Sig. (2-tailed) | . | .000 | .033 | .041 | ||
| N | 201 | 201 | 201 | 201 | ||
| Media Exposure via Digital Platforms | Correlation Coefficient | -.264** | 1.000 | -.292** | .232** | |
| Sig. (2-tailed) | .000 | . | .000 | .001 | ||
| N | 201 | 201 | 201 | 201 | ||
| Quality of Digital Financial Content | Correlation Coefficient | .150* | -.292** | 1.000 | -.178* | |
| Sig. (2-tailed) | .033 | .000 | . | .011 | ||
| N | 201 | 201 | 201 | 201 | ||
| Engagement With Digital Platforms | Correlation Coefficient | .144* | .232** | -.178* | 1.000 | |
| Sig. (2-tailed) | .041 | .001 | .011 | . | ||
| N | 201 | 201 | 201 | 201 | ||
| **. Correlation is significant at the 0.01 level (2-tailed). | ||||||
| *. Correlation is significant at the 0.05 level (2-tailed). | ||||||
Source: SPSS Output, (2025).
Interpretation: Simply accessing content does not guarantee learning; active engagement and high-quality content are critical for improving financial literacy (Huston, 2010).
Regression Analysis
- i)
- Linearity Test
Table 20 indicates linear relationships between predictors and financial literacy. Media exposure shows a strong linear relationship, while quality of content and engagement exhibit slight deviations, suggesting more complex effects.
Table 20.
Test for Linearity.
| Sum of Squares | df | Mean Square | F | Sig. | |||
| Financial Literacy * Media Exposure through Digital Platforms | Between Groups | (Combined) | 43.896 | 36 | 1.219 | 1.672 | 0.017 |
| Linearity | 8.593 | 1 | 8.593 | 11.786 | 0.001 | ||
| Deviation from Linearity | 35.303 | 35 | 1.009 | 1.384 | 0.092 | ||
| Within Groups | 119.568 | 164 | 0.729 | ||||
| Total | 163.464 | 200 | |||||
| Financial Literacy * Quality of Digital Financial Content | Between Groups | (Combined) | 47.921 | 25 | 1.917 | 2.903 | 0 |
| Linearity | 8.505 | 1 | 8.505 | 12.881 | 0 | ||
| Deviation from Linearity | 39.416 | 24 | 1.642 | 2.487 | 0 | ||
| Within Groups | 115.543 | 175 | 0.66 | ||||
| Total | 163.464 | 200 | |||||
| Financial Literacy * Engagement with Digital Platforms | Between Groups | (Combined) | 56.633 | 29 | 1.953 | 3.126 | 0 |
| Linearity | 3.338 | 1 | 3.338 | 5.343 | 0.022 | ||
| Deviation from Linearity | 53.296 | 28 | 1.903 | 3.047 | 0 | ||
| Within Groups | 106.831 | 171 | 0.625 | ||||
| Total | 163.464 | 200 | |||||
Source: SPSS Output, (2025).
- ii)
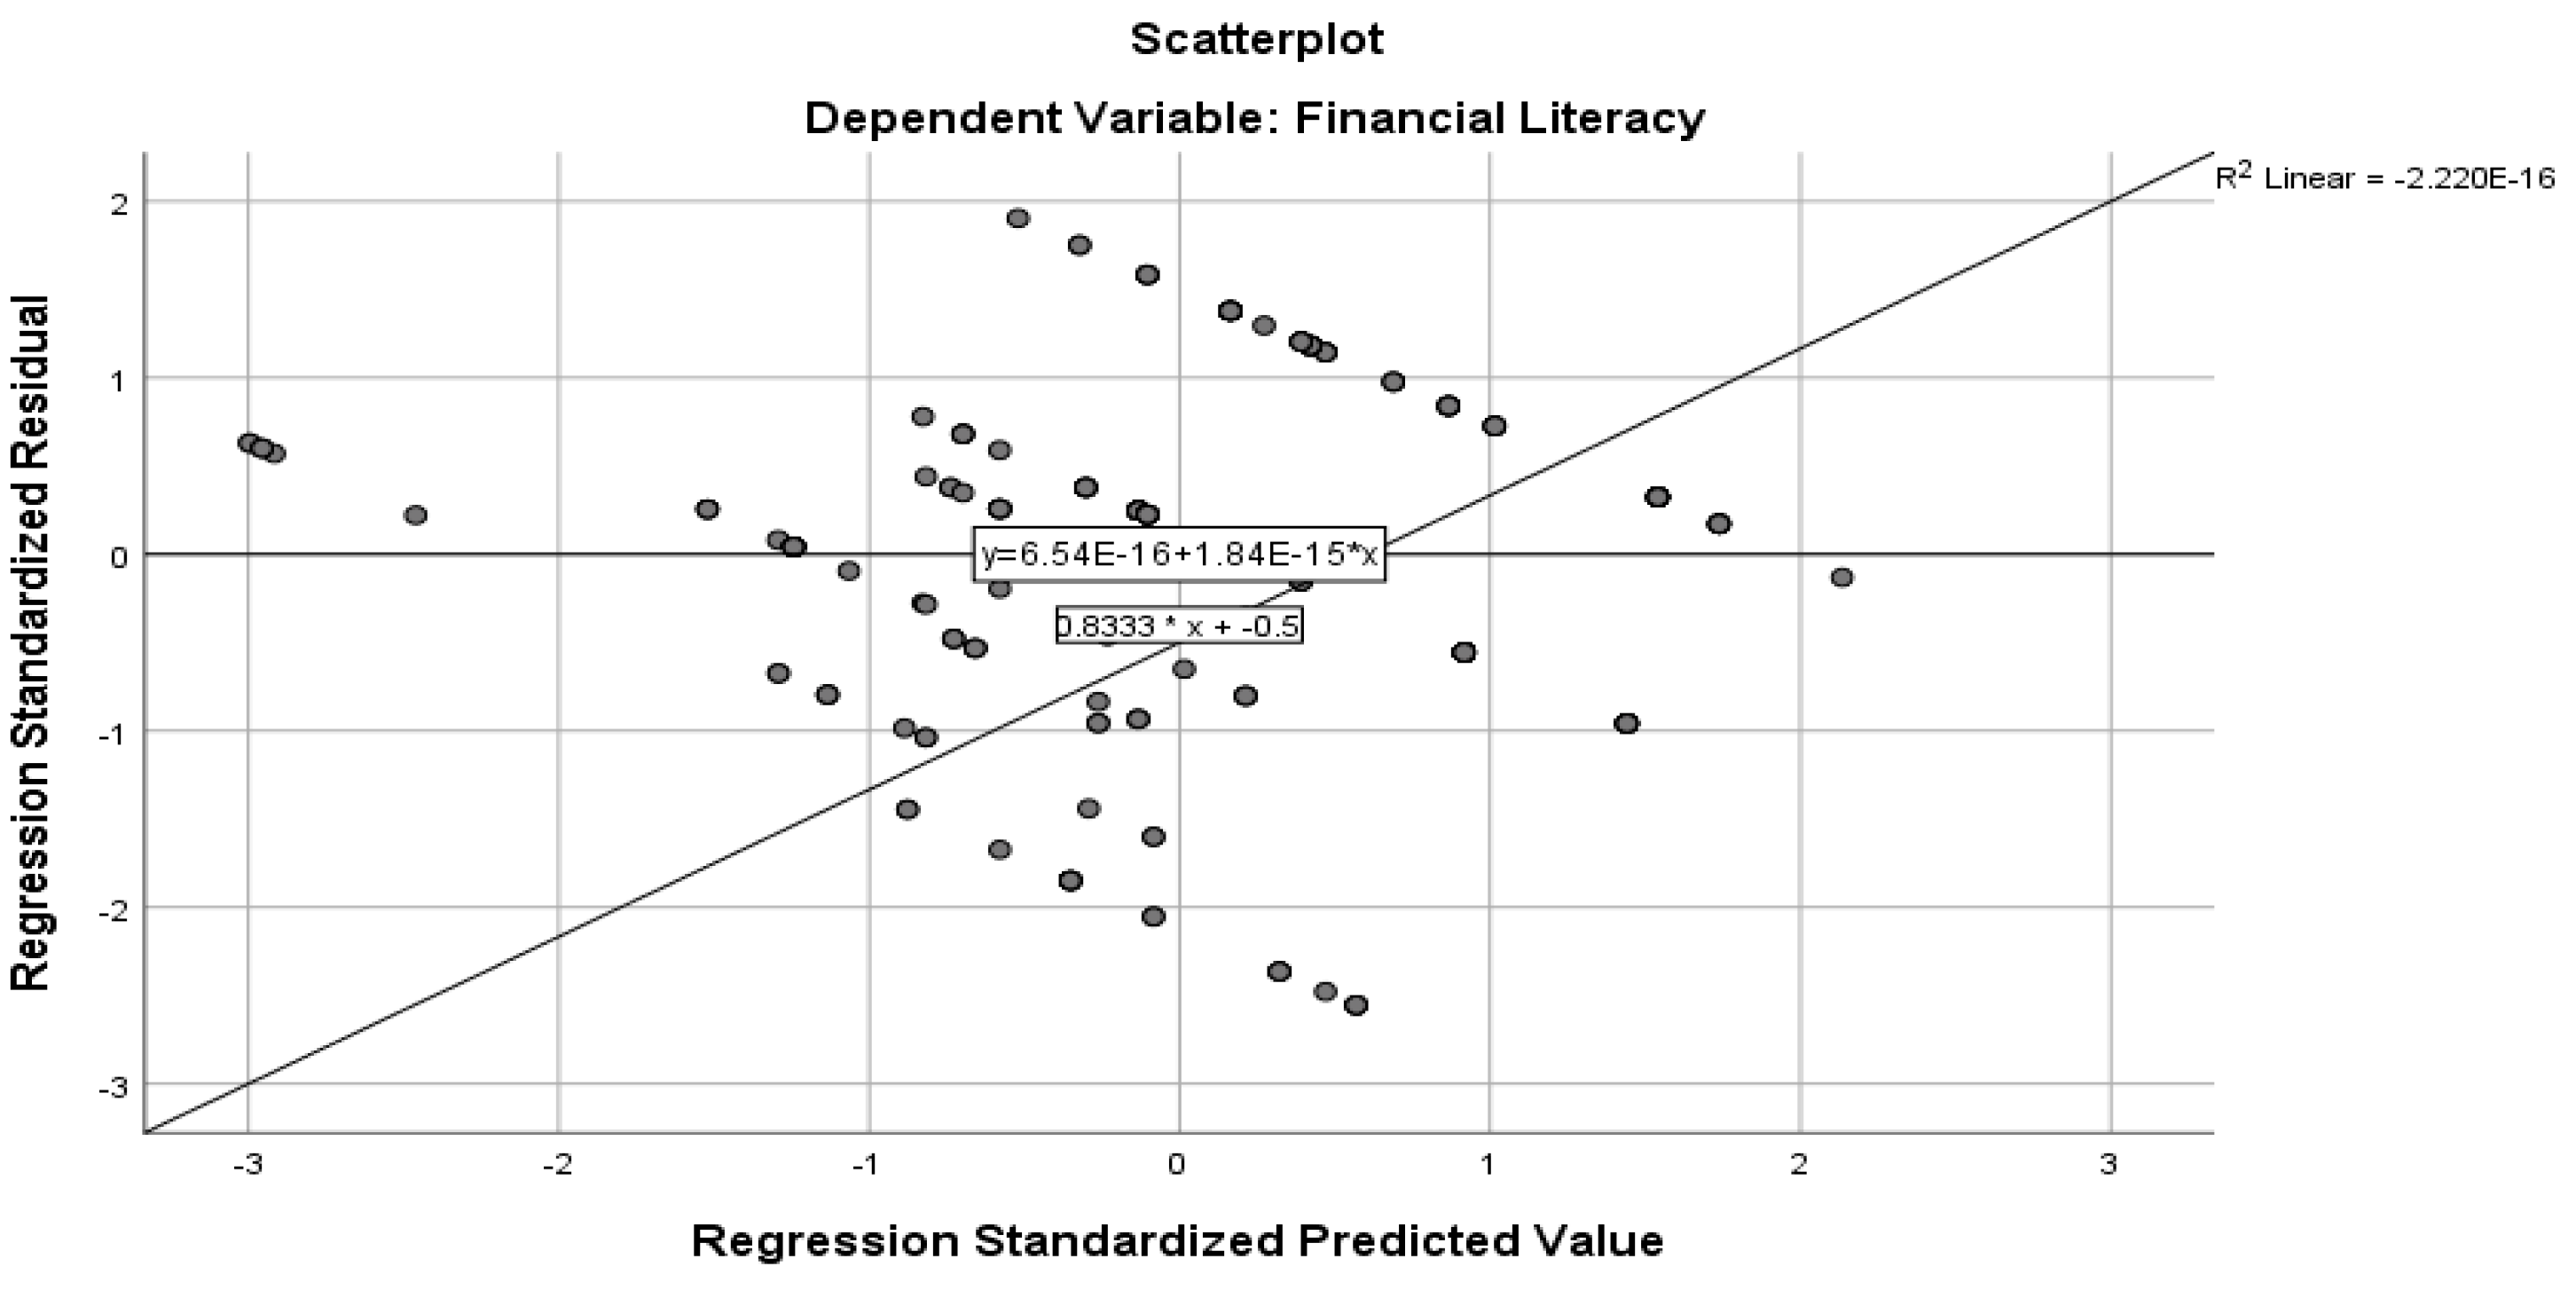
- Homoscedasticity Test
Residuals were visually assessed (Figure 2) and found to be randomly distributed, indicating constant variance and validating the assumptions of regression analysis.
Figure 2.
the Visual Test for Homoscedasticity.
- iii)
- Multicollinearity Test
Table 21 confirms no multicollinearity (VIF < 10, Tolerance > 0.1), meaning each
Table 21.
Test for Multicollinearity.
| Variables | Collinearity Statistics | |
| Tolerance | VIF | |
| Media Exposure through Digital Platforms | .814 | 1.229 |
| Quality of Digital Financial Content | .757 | 1.322 |
| Engagement with Digital Platforms | .915 | 1.093 |
| a. Dependent Variable: Financial Literacy | ||
| Source: SPSS Output, (2025). | ||
- iv)
- Model Summary
Table 22 shows the regression model explains 60.3% of the variance in financial literacy (R² = 0.603), indicating a strong predictive relationship between digital platform factors and financial literacy.
Table 22.
Model Summary.
| Model | R | R Square | Adjusted R Square | Std. Error of the Estimate |
| 1 | .751a | .603 | .593 | 1.0955 |
| a. Predictors: (Constant), Engagement with Digital Platforms, Media Exposure through Digital Platforms, Quality of Digital Financial Content Source: SPSS Output, (2025) | ||||
- v)
- ANOVA
The regression model is statistically significant (F = 28.613, p < 0.001), confirming that media exposure, content quality, and engagement collectively influence financial literacy (Table 23).
Table 23.
ANOVA.
| Model | Sum of Squares | df | Mean Square | F | Sig. | |
| 1 | Regression | 98.193 | 3 | 32.731 | 28.613 | .000b |
| Residual a | 225.356 | 197 | 1.144 | |||
| Total | 323.549 | 200 | ||||
| a. Dependent Variable: Financial Literacy | ||||||
| b. Predictors: (Constant), Engagement with Digital Platforms, Media Exposure Through Digital Platforms, Quality of Digital Financial Content Source: SPSS Output, (2025) | ||||||
- vi)
- Coefficients Analysis
Table 24 presents standardized regression coefficients. Media exposure has a significant negative effect (B = -3.018), while quality of content (B = 3.774) and engagement (B = 7.995) have strong positive effects, highlighting the critical role of interactive and high-quality digital content in improving financial literacy.
Table 24.
Coefficients.
| Modela | Unstandardized Coefficients | Standardized Coefficients | t | Sig. | ||||
| B | Std. Error | Beta | ||||||
| 1 | (Constant) | -14.161 | 4.029 | -3.514 | .001 | |||
| Media Exposure through Digital Platforms | -3.018 | .711 | -.265 | -4.243 | .000 | |||
| Quality of Digital Financial Content | 3.774 | .645 | .379 | 5.852 | .000 | |||
| Engagement with Digital Platforms | 7.995 | 1.109 | .425 | 7.209 | .000 | |||
| a. Dependent Variable: Financial Literacy | ||||||||
| Source: SPSS Output, (2025). | ||||||||
Interpretation: Excessive exposure without quality control can negatively affect financial literacy, whereas well-structured content and active engagement significantly enhance knowledge and decision-making capabilities (OECD, 2020; Lusardi & Mitchell, 2014).
5. Discussion
5.1. Influence of Media Exposure Through Digital Platforms on Financial Literacy Levels in Ilala Municipality
The study found a negative and statistically significant relationship between media exposure and financial literacy (coefficient = -3.018, p = 0.000), suggesting that higher exposure to digital media content was linked to lower financial literacy. This may result from information overload, where unstructured, poorly curated, or misleading content confuses users and hinders learning. The finding contrasts with studies on structured educational media (Chaudhary & Luthra, 2022) and aligns with the Uses and Gratifications Theory (UGT), which emphasizes that media promotes learning only when content meets users’ informational needs.
5.2. Effect of Digital Financial Content Quality on Financial Literacy in Ilala Municipality
The study found a positive and statistically significant relationship between the quality of digital financial content and financial literacy (coefficient = 3.774, p = 0.000). Respondents exposed to accurate, clear, and relevant content showed higher financial literacy. These results support Wang and Zhou (2023) and align with the Technology Acceptance Model (TAM), indicating that content perceived as useful and reliable promotes engagement and learning. Unlike contexts with limited digital access (Mensah & Boateng, 2020), Ilala Municipality’s strong digital infrastructure allows quality content to effectively enhance financial knowledge.
5.3. Effect of Engagement with Digital Platforms on Financial Literacy in Ilala Municipality
The study found a strong, statistically significant positive relationship between engagement with digital platforms and financial literacy (coefficient = 7.995, p = 0.000). Active use of interactive tools and budgeting apps was linked to higher financial literacy. These findings align with Kim and Park (2021) but contrast with Gichuki and Mwangi (2019), likely due to Tanzania’s more user-friendly and interactive platforms. The results support the Technology Acceptance Model (TAM), highlighting that perceived usefulness, ease of use, and interactivity drive adoption and improved financial literacy.
6. Conclusions
The findings underscore the multifaceted nature of digital financial literacy. While access to digital platforms is widespread, passive consumption does not guarantee knowledge acquisition. Users benefit most from high-quality content that is accurate, clear, relevant, and interactive. The negative effect of media exposure alone aligns with the argument that excessive or uncurated information can impede comprehension (Huston, 2010). Conversely, engagement through tools, discussion forums, and practical application strengthens financial decision-making and empowerment.
In summary, the study highlights that digital financial literacy is enhanced by a combination of quality content, active engagement, and selective media use. Policymakers and financial educators should prioritize interactive, trustworthy, and personalized digital financial education programs to maximize learning outcomes
7. Limitations
The study’s cross-sectional design limits assessment of long-term effects, and reliance on quantitative data may overlook individual experiences and motivations. Findings from Ilala Municipality may not generalize to other regions with different digital access or socioeconomic conditions. Self-reported data introduces potential response bias, and observed associations cannot establish causality, as prior knowledge or offline learning may also influence financial literacy outcomes.
8. Directions for Further Study
Future research should explore how financial literacy evolves over time through sustained use of digital platforms, addressing the limitations of cross-sectional studies. The influence of social media personalities and finance bloggers, as well as differences between urban and rural populations, warrants investigation. Additionally, studies should compare learning modalities videos, interactive programs, and AI-powered advisors against traditional text-based approaches. Behavioral factors such as motivation, trust, and risk perception should also be examined to understand their impact on engagement with digital financial platforms.
Funding
No funding received to finance this research rather author’s monthly salaries.
Acknowledgments
The author thanks Dr. Deogratias Dafi for guidance, the College of Business Education for resources and support, and family, colleagues, and peers for their encouragement.
References
- AfDB. (2021). Promoting financial literacy in Sub-Saharan Africa. African Development Bank. https://www.afdb.org.
- Alam, S., & Islam, S. (2021). The Role of Digital Media in Enhancing Financial Literacy Among Youth in Bangladesh. International Journal of Media & Communication, 14(2), 121–134.
- Bank of Tanzania. (2023). Annual report on financial inclusion. BOT Publications. https://www.bot.go.tz.
- Bank of Uganda. (2022). Survey on financial literacy and inclusion. BOU Publications.
- Bonsón, E., Falco, C., & Hernández, M. (2021). Social Media and Financial Literacy: An Analysis of Platforms and Content. Journal of Financial Technology, 5(2), 30–46.
- Bryman, A. (2016). Social Research Methods (5th ed.). Oxford University Press.
- Chaudhary, P., & Luthra, S. (2022). Impact of Media Exposure on Financial Literacy in Emerging Economies. Journal of Digital Finance, 11(3), 45–61.
- Chiang, I.-C. A., Jhangiani, R. S., & Price, P. C. (2015). Reliability and Validity of Measurement. BCcampus.
- Cochran, W. G. (1977). Sampling techniques (3rd ed.). John Wiley & Sons. https://archive.org/details/cochran-1977-sampling-techniques.
- Creswell, J. W. (2014). Research Design: Qualitative, Quantitative, and Mixed Methods Approaches (4th ed.). Sage Publications. https://us.sagepub.com/en-us/nam/research-design/book246046.
- Creswell, J. W., & Creswell, J. D. (2018). Research Design: Qualitative, Quantitative, and Mixed Methods Approaches (6th ed.). Sage Publications.
- Dar es Salaam City Council. (2024). Dar es Salaam: An Overview of the City and its Administrative Regions. Ilala Municipal Council. https://www.https//mapcarta.com/12664156.
- Davis, F. D. (1989). Perceived usefulness, perceived ease of use, and user acceptance of information technology. MIS Quarterly, 13(3), 319–340.
- Ding, Y. Y., Zhang, X., & Li, J. (2023). Digital Financial Literacy and its Dimensions. International Journal for Multidisciplinary Research (IJFMR), 6(4), 1–10.
- FINRA. (2022). Financial literacy and education survey. Financial Industry Regulatory Authority. https://www.finra.org.
- Finscope Tanzania. (2022). The state of financial inclusion in Tanzania: Financial Sector Deepening Trust (FSDT). Finscope Tanzania. https://www.fsdt.or.tz.
- Fleming, J., & Zegwaard, K. E. (2018). Methodologies, methods and ethical considerations for conducting research in work-integrated learning. International Journal of Work-Integrated Learning, 19(3), 205–213.
- FSDK. (2023). Mobile money and financial literacy. Financial Sector Deepening Kenya.
- GSMA. (2023). The mobile economy in Sub-Saharan Africa. Groupe Spécial Mobile Association.
- Hair Jr., J. F., Hult, G. T. M., Ringle, C., & Sarstedt, M. (2016). A Primer on Partial Least Squares Structural Equation Modeling (PLS-SEM). Sage Publications.
- Huyler, D., & McGill, C. M. (2019). Research Design: Qualitative, Quantitative, and Mixed Methods Approaches. In New Horizons in Adult Education & Human Resources Development (Vol. 31, Issue 3). Thousand Oaks, CA: Sage Publication, Inc. [CrossRef]
- Ilala Municipal Council. (2024). Ilala District Socio economic Profile 2025. Ilala Municipal Council. www.ilalamc.go.tz.
- Katz, E., Blumler, J. G., & Gurevitch, M. (1973). Uses and gratifications research. Public Opinion Quarterly, 37(4), 509–523.
- Kim, Y., & Park, J. (2021). Engagement with Digital Platforms and Its Impact on Financial Literacy in South Korea. Journal of Consumer Education and Financial Behavior, 12(2), 98–112.
- Kothari, C. R. (2016). Research Methodology; Methods and Techniques. In New Age International Publishers (2nd ed., Vol. 6, Issue August). New Age International Publishers. www.newagepublishers.com.
- Lelissa, T. B. (2018). Research Design and Methodology. In The Methodology Choice and the Research (Issue December, p. 41). [CrossRef]
- Lin, M. (2023). The Role of Media Exposure in Enhancing Financial Literacy in Emerging Markets. Journal of Financial Media Studies, 7(2), 45–58.
- Lusardi, A., & Mitchell, O. S. (2017). The economic importance of financial literacy: Theory and evidence. Journal of Economic Literature, 52(1), 5–44. [CrossRef]
- Middleton, F. (2020). Understanding reliability vs validity. Scribbr, 5(1), 2020. https://www.scribbr.com/methodology/reliability-vs-validity/#:~:text=Reliability and validity are concepts used to evaluate,validity is about the accuracy of a measure.
- Müller, A., & Weber, T. (2022). Assessing the Influence of Digital Content Quality on Financial Literacy in Germany. Financial Literacy Journal, 15(4), 233–246.
- Munyegera, G. K., & Matsumoto, T. (2018). ICT and financial inclusion: Mobile money and household welfare in Uganda. World Development, 98(1), 255–267. [CrossRef]
- Munyegera, H., & Nsubuga, F. (2020). Digital Media and Financial Literacy in Africa: A Case Study of Uganda and Tanzania. African Journal of Economic and Social Studies, 34(4), 122–136.
- Mushi, S., Mbise, A., & Kamazima, H. (2022). The Role of Digital Platforms in Enhancing Financial Literacy in Tanzanian Urban Areas. International Journal of Digital Financial Literacy, 10(1), 45–56.
- Napier, M., Pilcher, R., & Venkatakrishnan, J. (2020). Financial inclusion and literacy: Lessons from Africa. Oxford Review of Economic Policy, 36(1), 125–141. [CrossRef]
- National Bureau of Statistics (NBS). (2022a). Dar es Salaam Population and Urban Growth Analysis. National Bureau of Statistics, United Republic of Tanzania. https://www.sensa.nbs.go.tz.
- National Bureau of Statistics (NBS). (2022b). Tanzania Population and Housing Census 2022. NBS Tanzania.
- NBS. (2023). Annual Labour Force Survey Report 2023. National Bureau of Statistics, United Republic of Tanzania. http://www.nbs.go.tz.
- Nyarugwa, A. (2023). Impact of digital financial services in Tanzania: A case study in Dar es Salaam. Journal of Digital Economics, 5(2), 87–102.
- Nyasha, S., & Odhiambo, N. M. (2020). Financial literacy and financial inclusion: A review of recent evidence. Review of International Business and Finance, 62, 101248. [CrossRef]
- OECD. (2021). OECD/INFE 2022 Financial Literacy Measurement Survey. OECD Economic Studies. https://www.oecd.org.
- OECD. (2022). Financial literacy and digital skills: Bridging gaps. Organisation for Economic Co-Operation and Development. https://www.oecd.org.
- Oluwatayo, A., & Oladimeji, R. (2022). Digital Platform Engagement and Financial Literacy in Nigeria: A Case Study of Mobile Financial Services. Journal of Financial Services, 18(3), 156–170.
- Papathanassopoulos, S., & Negrine, R. (2021). The Uses and Gratifications Theory in the Digital Age. Journal of Communication, 71(1), 62–77.
- Ruggiero, T. E. (2000). Uses and gratifications theory in the 21st century. Mass Communication & Society, 3(1), 3-37.
- Rutashobya, L., Allan, J., & Mutalemwa, D. (2021). Gender, financial literacy, and resilience in Tanzania. International Journal of Disaster Risk Reduction, 57, 102189. [CrossRef]
- Setiawan, M., Harjanto, S., & Widodo, S. (2022). Understanding Digital Financial Literacy: Dimensions and Measurement. Journal of Digital Finance, 5(1), 12–34.
- Suri, T., & Jack, W. (2016). The long-run poverty and gender impacts of mobile money. Journal of Science, 354(6317), 1288–1292. [CrossRef]
- Surucu, L., & Maslakci, A. (2020). Validity and Reliability in Quantitative Research. Business and Management Studies an International Journal, 8(3), 2694–2726. [CrossRef]
- University of Dar es Salaam. (2022). Financial literacy in Dar es Salaam: Challenges and opportunities. UDSM Publications. https://www.udsm.ac.tz.
- URT. (2023). Economic Survey Report. United Republic of Tanzania. https://www.nbs.go.tz.
- Vargo, S. L., Maglio, P. P., & Akaka, M. A. (2022). Digital Platforms as a Source of Financial Education: Opportunities and Challenges. Journal of Financial Innovation, 10(3), 10–28.
- Wang, L., & Zhou, H. (2023). Quality of Financial Content and Its Effect on Digital Financial Literacy in Urban China. Journal of Financial Technology, 9(1), 75–89.
- World Bank. (2022). Enhancing financial literacy in developing countries. World Bank. https://www.worldbank.org.
- Yamane, T. (1967). Statistics: An introductory analysis (2nd ed.). Harper and Row. https://www.gjimt.ac.in/wp-content/uploads/2017/10/2_Glenn-D.-Israel_Determining-Sample-Size.pdf.
- ZamZam, A. (2018). Methodological Approaches in Research: Response Rates and their Implications. Journal of Research Methodologies, 12(3), 45–58.
Disclaimer/Publisher’s Note: The statements, opinions and data contained in all publications are solely those of the individual author(s) and contributor(s) and not of MDPI and/or the editor(s). MDPI and/or the editor(s) disclaim responsibility for any injury to people or property resulting from any ideas, methods, instructions or products referred to in the content. |
© 2025 by the authors. Licensee MDPI, Basel, Switzerland. This article is an open access article distributed under the terms and conditions of the Creative Commons Attribution (CC BY) license (http://creativecommons.org/licenses/by/4.0/).
Copyright: This open access article is published under a Creative Commons CC BY 4.0 license, which permit the free download, distribution, and reuse, provided that the author and preprint are cited in any reuse.


