1. Introduction
Major depressive disorder (MDD) is a heterogeneous psychiatric condition characterized by mood disturbances, anhedonia, cognitive impairments, and neurovegetative symptoms [1]. MDD affects over 330 million individuals worldwide and ranks as a leading cause of disability and mortality, with significant socioeconomic burden. 2, 3 Despite its prevalence, MDD lacks reliable mechanistic biomarkers and personalized treatment stratification, due in part to clinical and genetic heterogeneity [4,5].
Recent advances in resting-state functional MRI (rs-fMRI) offer promising non-invasive approaches to characterize intrinsic brain network dysfunction in MDD. Rs-fMRI captures whole-brain connectivity patterns without task demands, enabling scalable biomarker development across diverse populations and sites [6,7]. It reveals abnormalities in key networks, such as the default mode network (DMN), frontoparietal control, and salience networks, linked to core MDD symptoms including rumination and executive dysfunction [8,9].
Dynamic functional connectivity (dFC) approaches, including Leading Eigenvector Dynamics Analysis (LEiDA), capture temporal fluctuations in network states at fine timescales, providing mechanistic insights beyond static connectivity measures. 9, 10 Prior large-scale analyses, notably the REST-meta-MDD consortium, have demonstrated heterogeneous DMN dysfunction, altered inter-network coupling, and clinical correlates across thousands of patients [7]. However, technical variability in preprocessing and analytic methods challenges reproducibility of findings [12].
This secondary data analysis leverages REST-meta-MDD rs-fMRI data to investigate altered temporal dynamics of functional networks in MDD pathophysiology without any particular network of interest and other regions that can be relevant [10]. Using LEiDA on AAL-90 parcellated time series and k-means clustering across multiple resolutions, the present study assesses group differences between MDD patients and healthy controls (HC) in the fractional occupancy (FO) of recurrent attractor states detected in brain dynamics, revealing significant alterations in the dynamical landscape of brain activity in MDD compared with controls.
2. Materials and Methods
2.1. Study Design
The analysis focused exclusively on between-group comparisons of dFC metrics, without incorporating clinical covariates such as symptom severity, depression subtypes, or behavioral measures. This restriction ensures methodological uniformity given the heterogeneity and incomplete availability of detailed clinical variables across the multisite dataset [7].
Detailed clinical covariates (e.g., symptom severity, illness duration, episode status, and depression subtypes) were not modelled in the present analysis once these measures were heterogeneous and incompletely available across REST-meta-MDD cohorts, and the preregistered analytic plan focused on robust group-level differences in dFC metrics. This choice prioritised sample size and methodological uniformity over fine-grained clinical stratification.
2.2. Quality Control and Sample Selection
The initial secondary data analytic plan included rs-fMRI data from 1,300 MDD patients and 1,128 healthy controls recruited across 25 independent cohorts in China [7]. Rigorous quality control (QC) identified significant data integrity challenges—such as spatial normalization errors, incomplete brain coverage, and motion artifacts—even at high-scoring sites. Consequently, analysis was limited to a strictly quality-assured subsample, adhering to REST-meta-MDD criteria to ensure methodological validity and reproducibility, previously performed by Yan and colleagues [7]. In more detail, QC inspection was performed through a multi-step protocol combining automated metrics and manual review. 7 Spatial normalization accuracy was verified through visual inspection of warped images against the Montreal Neurological Institute (MNI) template [7]. Subjects exhibiting normalization errors, incomplete brain field-of-view, or excessive head motion exceeding a framewise displacement threshold of 0.2 mm were excluded [13]. Furthermore, cohorts with fewer than ten subjects per group were omitted to maintain statistical robustness [7]. This rigorous criteria resulted in a final, quality-assured sample of 848 individuals with MDD and 794 HC from 17 sites (freely available for download at rfmri.org/REST-meta-MDD), following REST-meta-MDD consortium criteria to maximize data reliability and analytic validity [7].
No additional statistical harmonisation across sites (e.g., ComBat or site-specific scaling) was applied, and site was not included as a covariate in the permutation tests. Given the large number of centres and unbalanced sample sizes, the design was optimised for robust overall group differences rather than site-specific estimates [7].
2.3. Participants
Inclusion required a clinical diagnosis of MDD based on structured clinical interviews adhering to either ICD-10 or DSM-IV criteria [7]. Healthy controls were rigorously screened to exclude psychiatric and neurological disorders (Yan et al., 2019). Participant demographic data were harmonized across sites, with age inclusion restricted to 18–65 years. 7 The final sample included 67% females among the MDD group (mean age 36.2 years, SD = 12.1) and 65% females among controls (mean age 35.7 years, SD = 11.9) [7]. Education levels were standardized to comparable categories, with the majority completing secondary education or higher [7].
Clinical profiles in the MDD group comprised an average illness duration of 4.2 years (SD = 5.1), with 52% in their first episode and 48% classified as recurrent [7]. Medication status included 60% medicated and 40% unmedicated participants. 7 Symptom severity was primarily quantified using the Hamilton Depression Rating Scale (HDRS-17), with a mean score of 22.7 (SD = 5.4) [7]. Other clinical scales were variably collected across cohorts but were not analysed here due to inconsistent availability [7]. Medication status was not incorporated as a covariate or stratification factor in the current group-level comparisons, in line with the secondary analysis plan of REST-meta-MDD.
2.4. Imaging Acquisition
Rs-fMRI data from the REST-meta-MDD consortium were acquired on predominantly 3T MRI scanners across all sites, with approximately 10% of scans performed on 1.5T systems [7]. Harmonized imaging protocols were implemented, adhering to the consortium standardized sequence parameters: echo-planar imaging (EPI) sequence, repetition time (TR) ~2,000 ms, echo time (TE) ~30 ms, flip angle 90°, field of view 220 × 220 mm, matrix size 64 × 64, slice thickness 3–4 mm, and scan length ranging between 180–240 volumes [7]. Participants were uniformly instructed to remain awake and relaxed with eyes closed during scanning, and data from individuals displaying signs of sleep or excessive motion were excluded [7].
Field strength (1.5T; 3T) was not explicitly modelled as a covariate, and no separate analyses by scanner type were conducted. The QC-filtered sample reflects the distribution of field strengths in REST-meta-MDD and is determined by site-specific recruitment and diagnostic composition [7].
2.5. Preprocessing
Rs-fMRI preprocessing employed the DPARSF toolbox [7], integrated with SPM12 in MATLAB 2020b [7,17]. The pipeline involved slice timing correction, head motion realignment, co-registration of functional and anatomical images, spatial normalization to MNI space using Diffeomorphic Anatomical Registration Through Exponentiated Lie algebra (DARTEL) and smoothing with a 6 mm full-width-at-half-maximum Gaussian kernel [7]. Nuisance regression included Friston-24 motion parameters (6 motion parameters plus their derivatives and squared terms), white matter, and CSF signals, mitigating motion and physiological noise.16 Linear trend removal and temporal bandpass filtering (0.01–0.08 Hz) isolated low-frequency fluctuations relevant for resting-state connectivity analysis.7 Global signal regression was not applied, consistent with REST-meta-MDD standards to avoid artificial anti-correlations [7].
In this work, we used the data parcellated using the anatomically based AAL-90 atlas to align with previous LEiDA works methodology [11,15] and facilitate anatomical interpretability [14,15].
2.6. Data Analysis
Dynamic functional connectivity was estimated using LEiDA, applied to the Hilbert-transformed phase of preprocessed fMRI signals after the band-pass filtering described in
Section 2.5. For LEiDA, parcel-wise time series were further demeaned and detrended but no additional temporal filtering beyond the 0.01–0.08 Hz band-pass was applied before Hilbert transformation.
At each time point (TR=2 seconds), the instantaneous phase coherence matrix (90 × 90) was decomposed to extract only its leading eigenvector, representing the dominant signal phase organization across the brain [11]. Concatenating eigenvectors across all subjects and time points, k-means clustering was performed using cosine distance over cluster numbers K = 2 to 20, with 25 replicates per K to ensure stability [11]. Each clustering solution returned K recurrent ‘phase-locking’ states, which were spatially correlated with canonical RSN [11,15]. In the LEiDA framework, a 'phase-locking state' corresponds to a spatial pattern of phase alignment between signals across all brain areas, detected recurrently over time and across datasets. Each phase-locking state is described by a vector of size 1×N, where N=90 is the number of cortical and subcortical brain areas (excluding the cerebellum) in the AAL parcellation scheme [18,19,20]. The values in the vector range between −1 and 1, corresponding to the cosine of the phase difference with respect to the leading eigenvector direction. Specifically, a value of 1 corresponds to zero phase difference (cos(0°)=1), a value of −1 corresponds to a phase difference of 180 degrees (cos(180°)=−1), and a value of 0 corresponds to a phase difference of 90 degrees (cos(90°)=0) [18,19,20]. When all values in a phase-locking state are positive, the signals in all brain areas are shifted by less than 90 degrees relative to the leading direction, whereas negative values indicate a shift greater than 90 degrees [18,19,20].
It is important to note that this measure is distinct from the Phase-Locking Value (PLV) commonly used in oscillatory analysis. While PLV quantifies the temporal stability of the phase relationship between a pair of signals, a LEiDA phase-locking state captures a spatial snapshot of instantaneous phase alignment across all brain areas at each time point. A given phase-locking state may occur only briefly, but its recurrent appearance suggests the presence of a 'ghost attractor' in dynamical systems terminology—an underlying structure that governs the repeated expression of this particular configuration of phase alignment [18,19,20].
The Fractional Occupancy (FO), defined as the proportion of time points assigned to each state, was calculated for each state in each scan. Between-group comparisons used two-sided label-permutation tests with 5,000 permutations per state. To control for multiple comparisons across all clustering solutions, we applied a single Bonferroni correction over the total number of tested states (209 across K = 2–20), such that effects were considered statistically significant only if p < 0.05/209. This conservative global threshold was used for all inferential claims.
2.7. Ethics
This secondary data analysis was conducted in strict accordance with the King's College London Research Ethics Policy, the ethical standards established by the British Psychological Society (BPS) and the Medical Research Council (MRC), namely the BPS Code of Human Research Ethics and MRC Good Research Practice principles [21,22].
The original data collection adhered to ethical standards approved by institutional review boards of all participating sites, following the Declaration of Helsinki and International Committee of Medical Journal Editors (ICMJE) guidelines.
All individuals provided written informed consent, and data were fully anonymized prior to analysis. Data transfer and storage complied with GDPR and institutional data protection policies, utilizing secure encrypted servers with restricted access at Universidade do Minho. Investigators submitting analytic plans to the REST-meta-MDD consortium underwent protocol review to ensure compliance with ethical governance and data integrity standards. Adverse events reporting protocols were followed rigorously to maintain participant safety and uphold research integrity throughout.
3. Results
3.1. Identification of dFC States
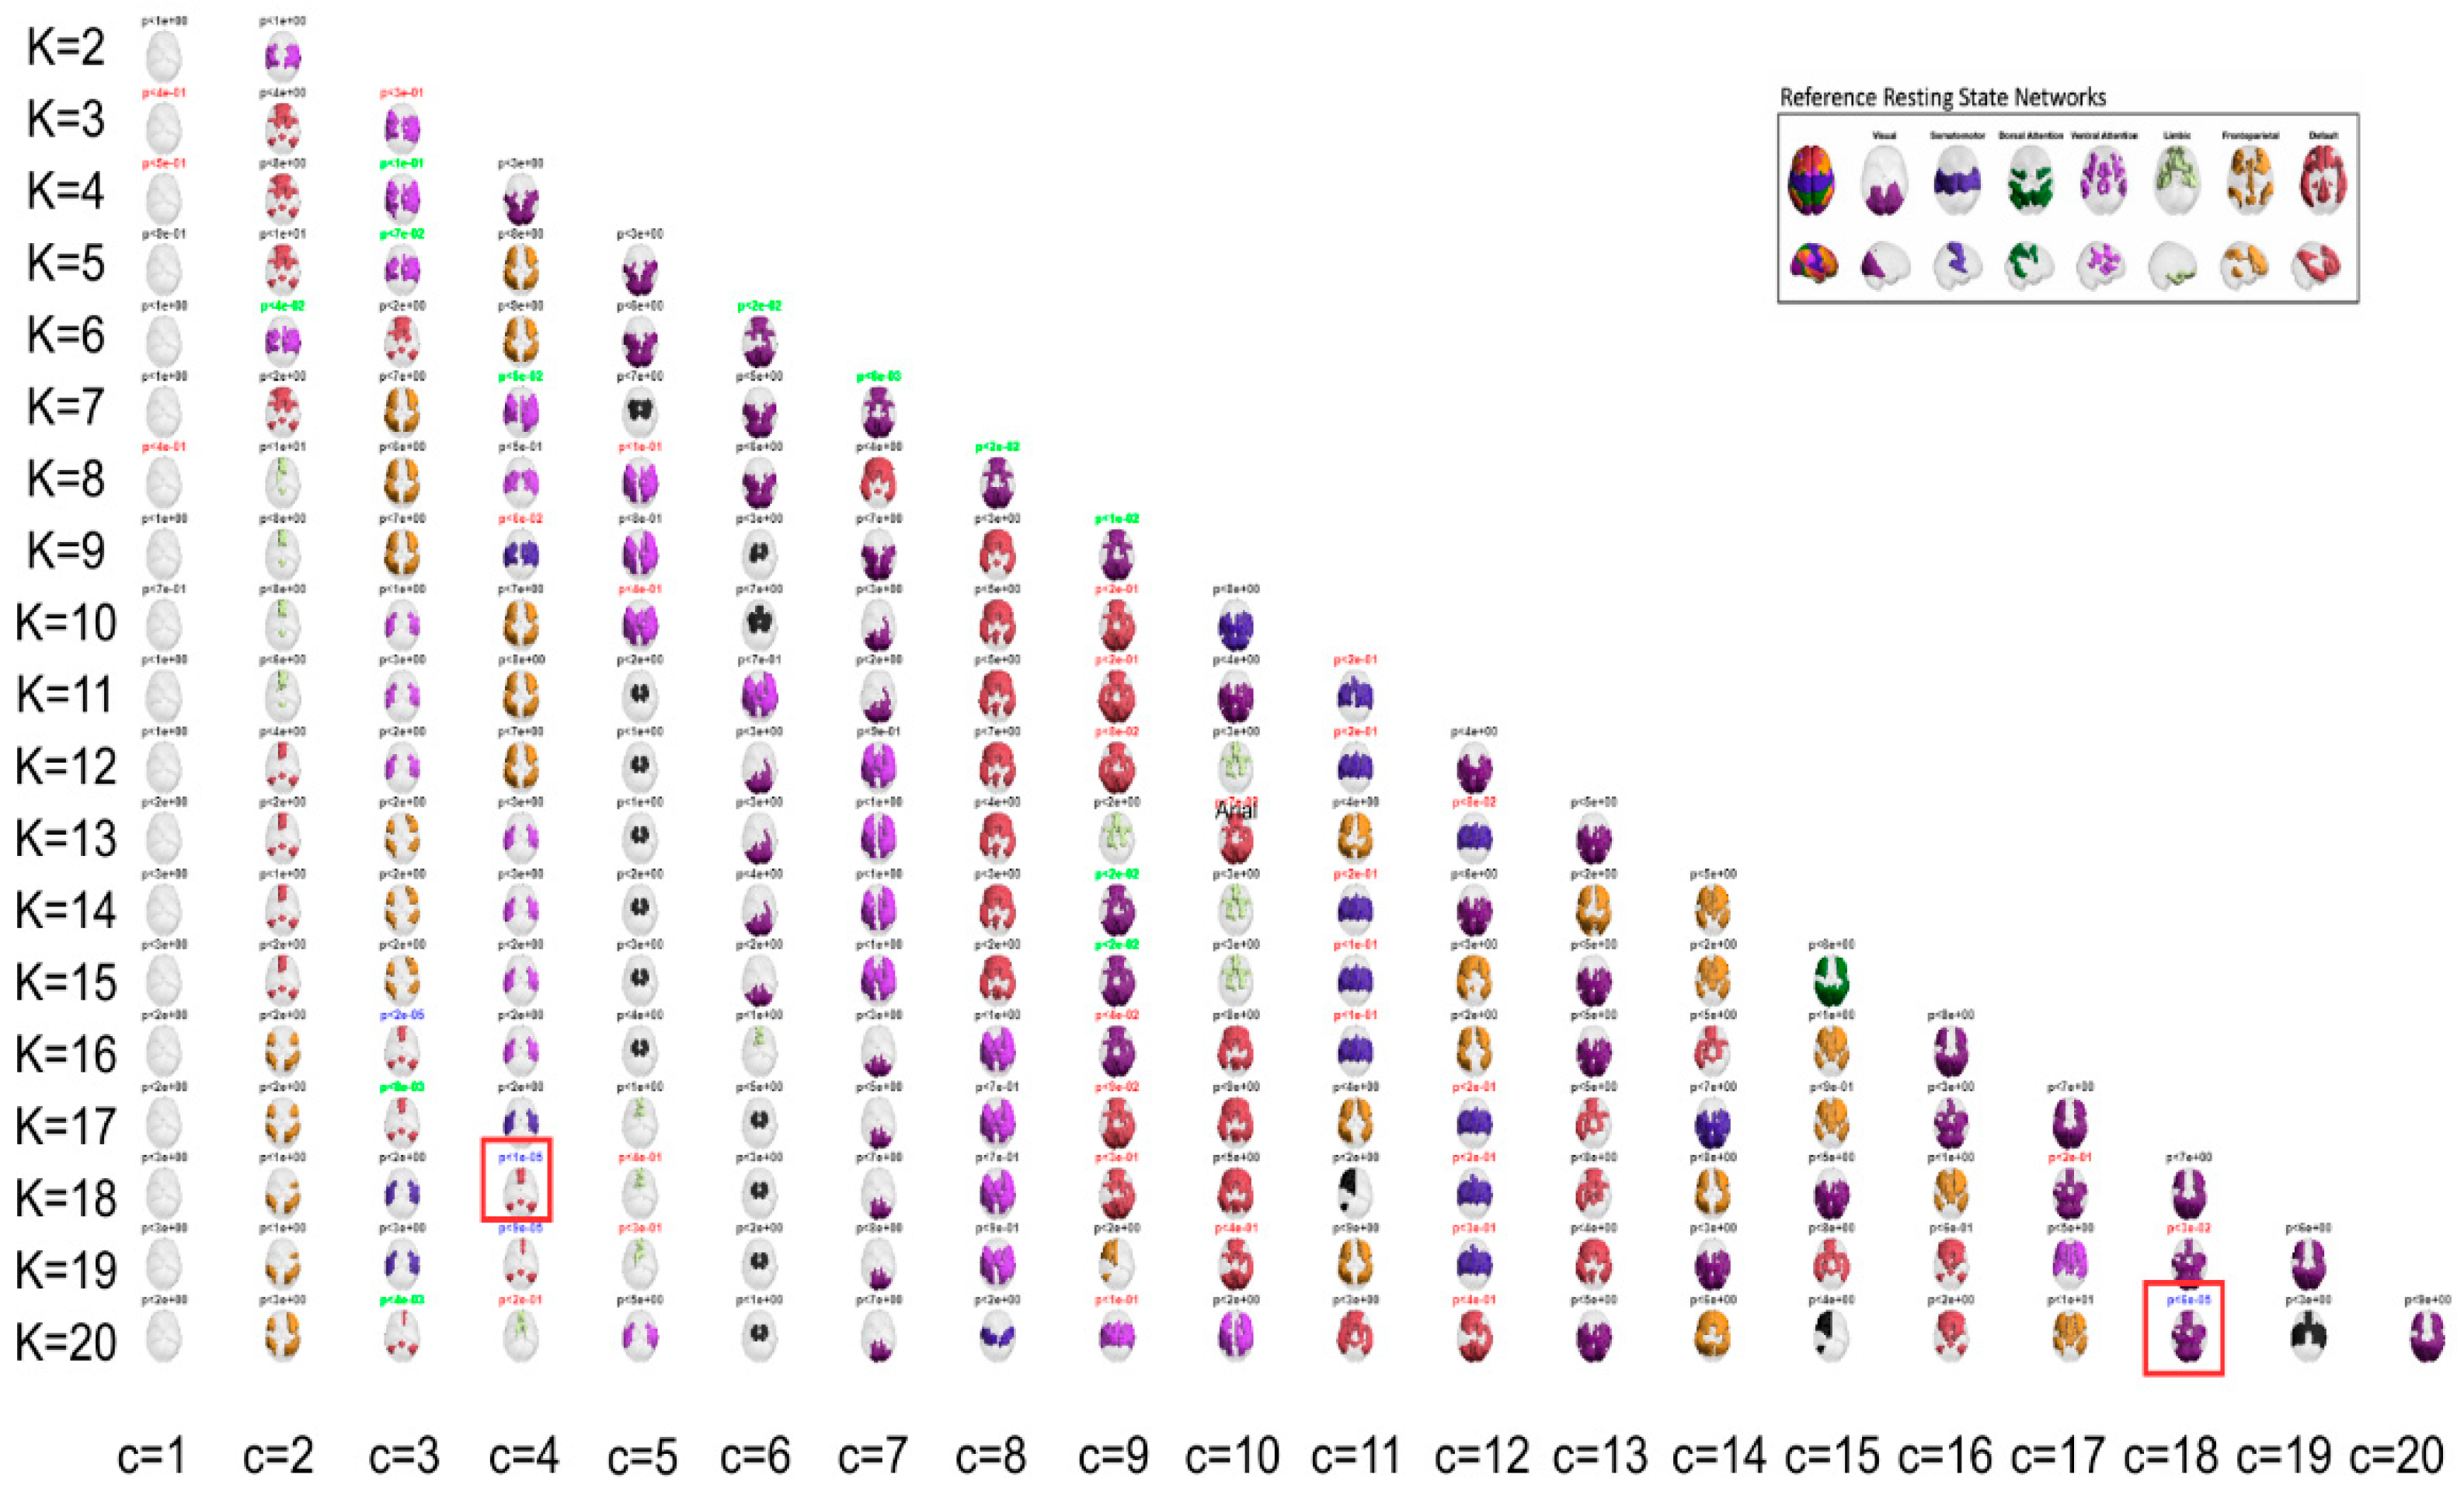
In the present study, the use of LEiDA with hierarchical k-means across K = 2–20 was employed to identify and arrange recurring phase-locking (PL) states, as defined above, into a centroid pyramid. This was done to visualise continuity and fractionation across resolutions (Figure 1). Rows represent clustering solutions at each K, and columns align corresponding states across adjacent Ks by maximizing spatial correlation. At lower K, PL states recapitulated broad intrinsic connectivity patterns. At higher K, states became more specialized and lateralized, overlapping Visual, Somatomotor, Dorsal and Ventral Attention, Limbic, Frontoparietal, and Default Mode networks [15].
Cluster reproducibility across 1,000 bootstraps per K yielded median silhouette coefficients in the moderate to high range (0.31–0.67). Intermediate to high K values (approximately 15–20) offered the most favourable balance of stability and neurobiological interpretability and were prioritized for inference.
Once clustering was performed across a range of K values (2–20), this design entails a large number of statistical tests. To avoid inflating the familywise error rate, all state-level permutation p-values were subjected to a single Bonferroni correction across the 209 states, irrespective of K. The two highlighted states (posterior DMN at K = 18; occipito-parieto-temporal at K = 20) are those that both survive this global correction and exhibit interpretable network topology; all other patterns are discussed as exploratory.
3.2. Group Differences in State FO
Group differences in FO between MDD and HC were assessed using unpaired, two-sided label-permutation tests (5,000 permutations per state). In Figure 1, colour encodes p-value significance, with blue marking p < .001 and green marking .001 ≤ p < .05. Among blue centroids (p < .001), those selected for detailed analysis are additionally marked with a red square. Primary inferences controlled within each K using Bonferroni. Cross-K summaries are descriptive.
Permutation p-values and effect sizes by K are summarized in Figure 2 and
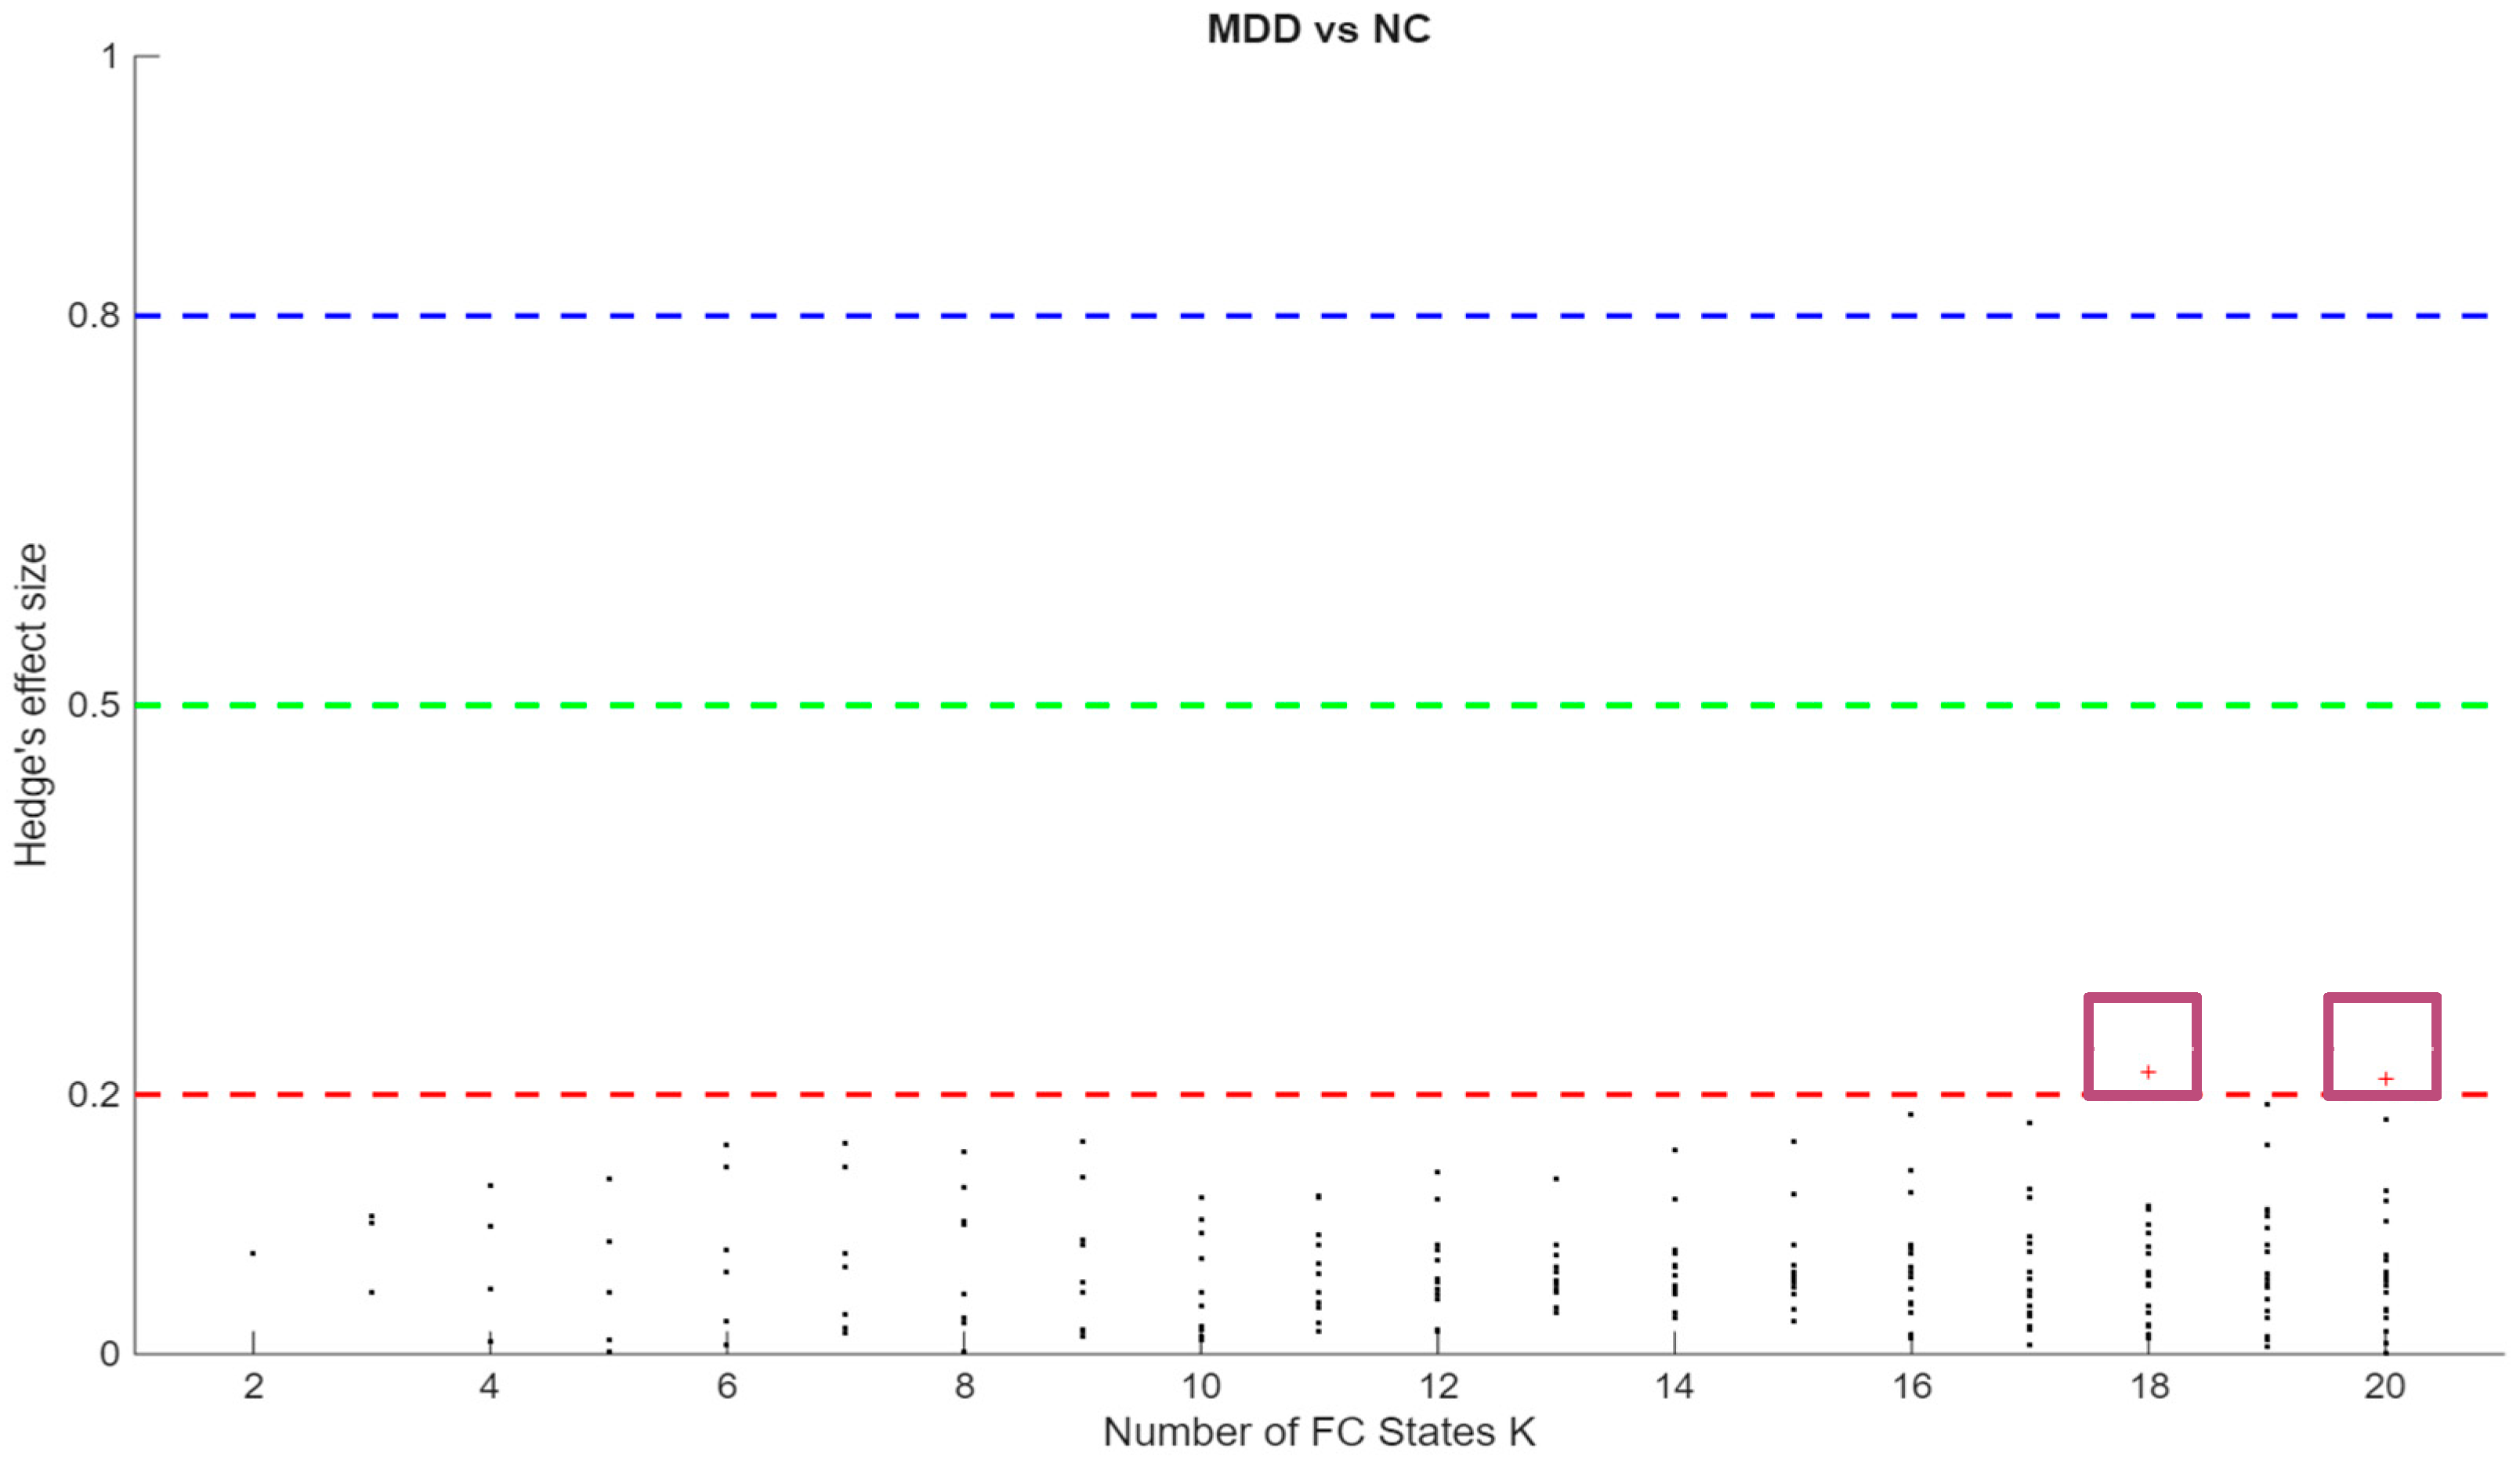
Figure 3 respectively. Effect sizes (Hedges’ g) were generally small and centred near zero, with both positive and negative values indicating bidirectional FO differences. Together, these patterns suggest redistribution of time across states rather than uniform increases or decreases within a single group.
3.3. Characterization of Key States
Two states showed statistically significant differences in FO between MDD and HC and were examined in detail: a posterior DMN state at K = 18, cluster 4 (K18C4; p < .001), and an occipito-parieto-temporal state at K = 20, cluster 18 (K20C18; p < .001).
3.4. Posterior DMN State (K18C4)
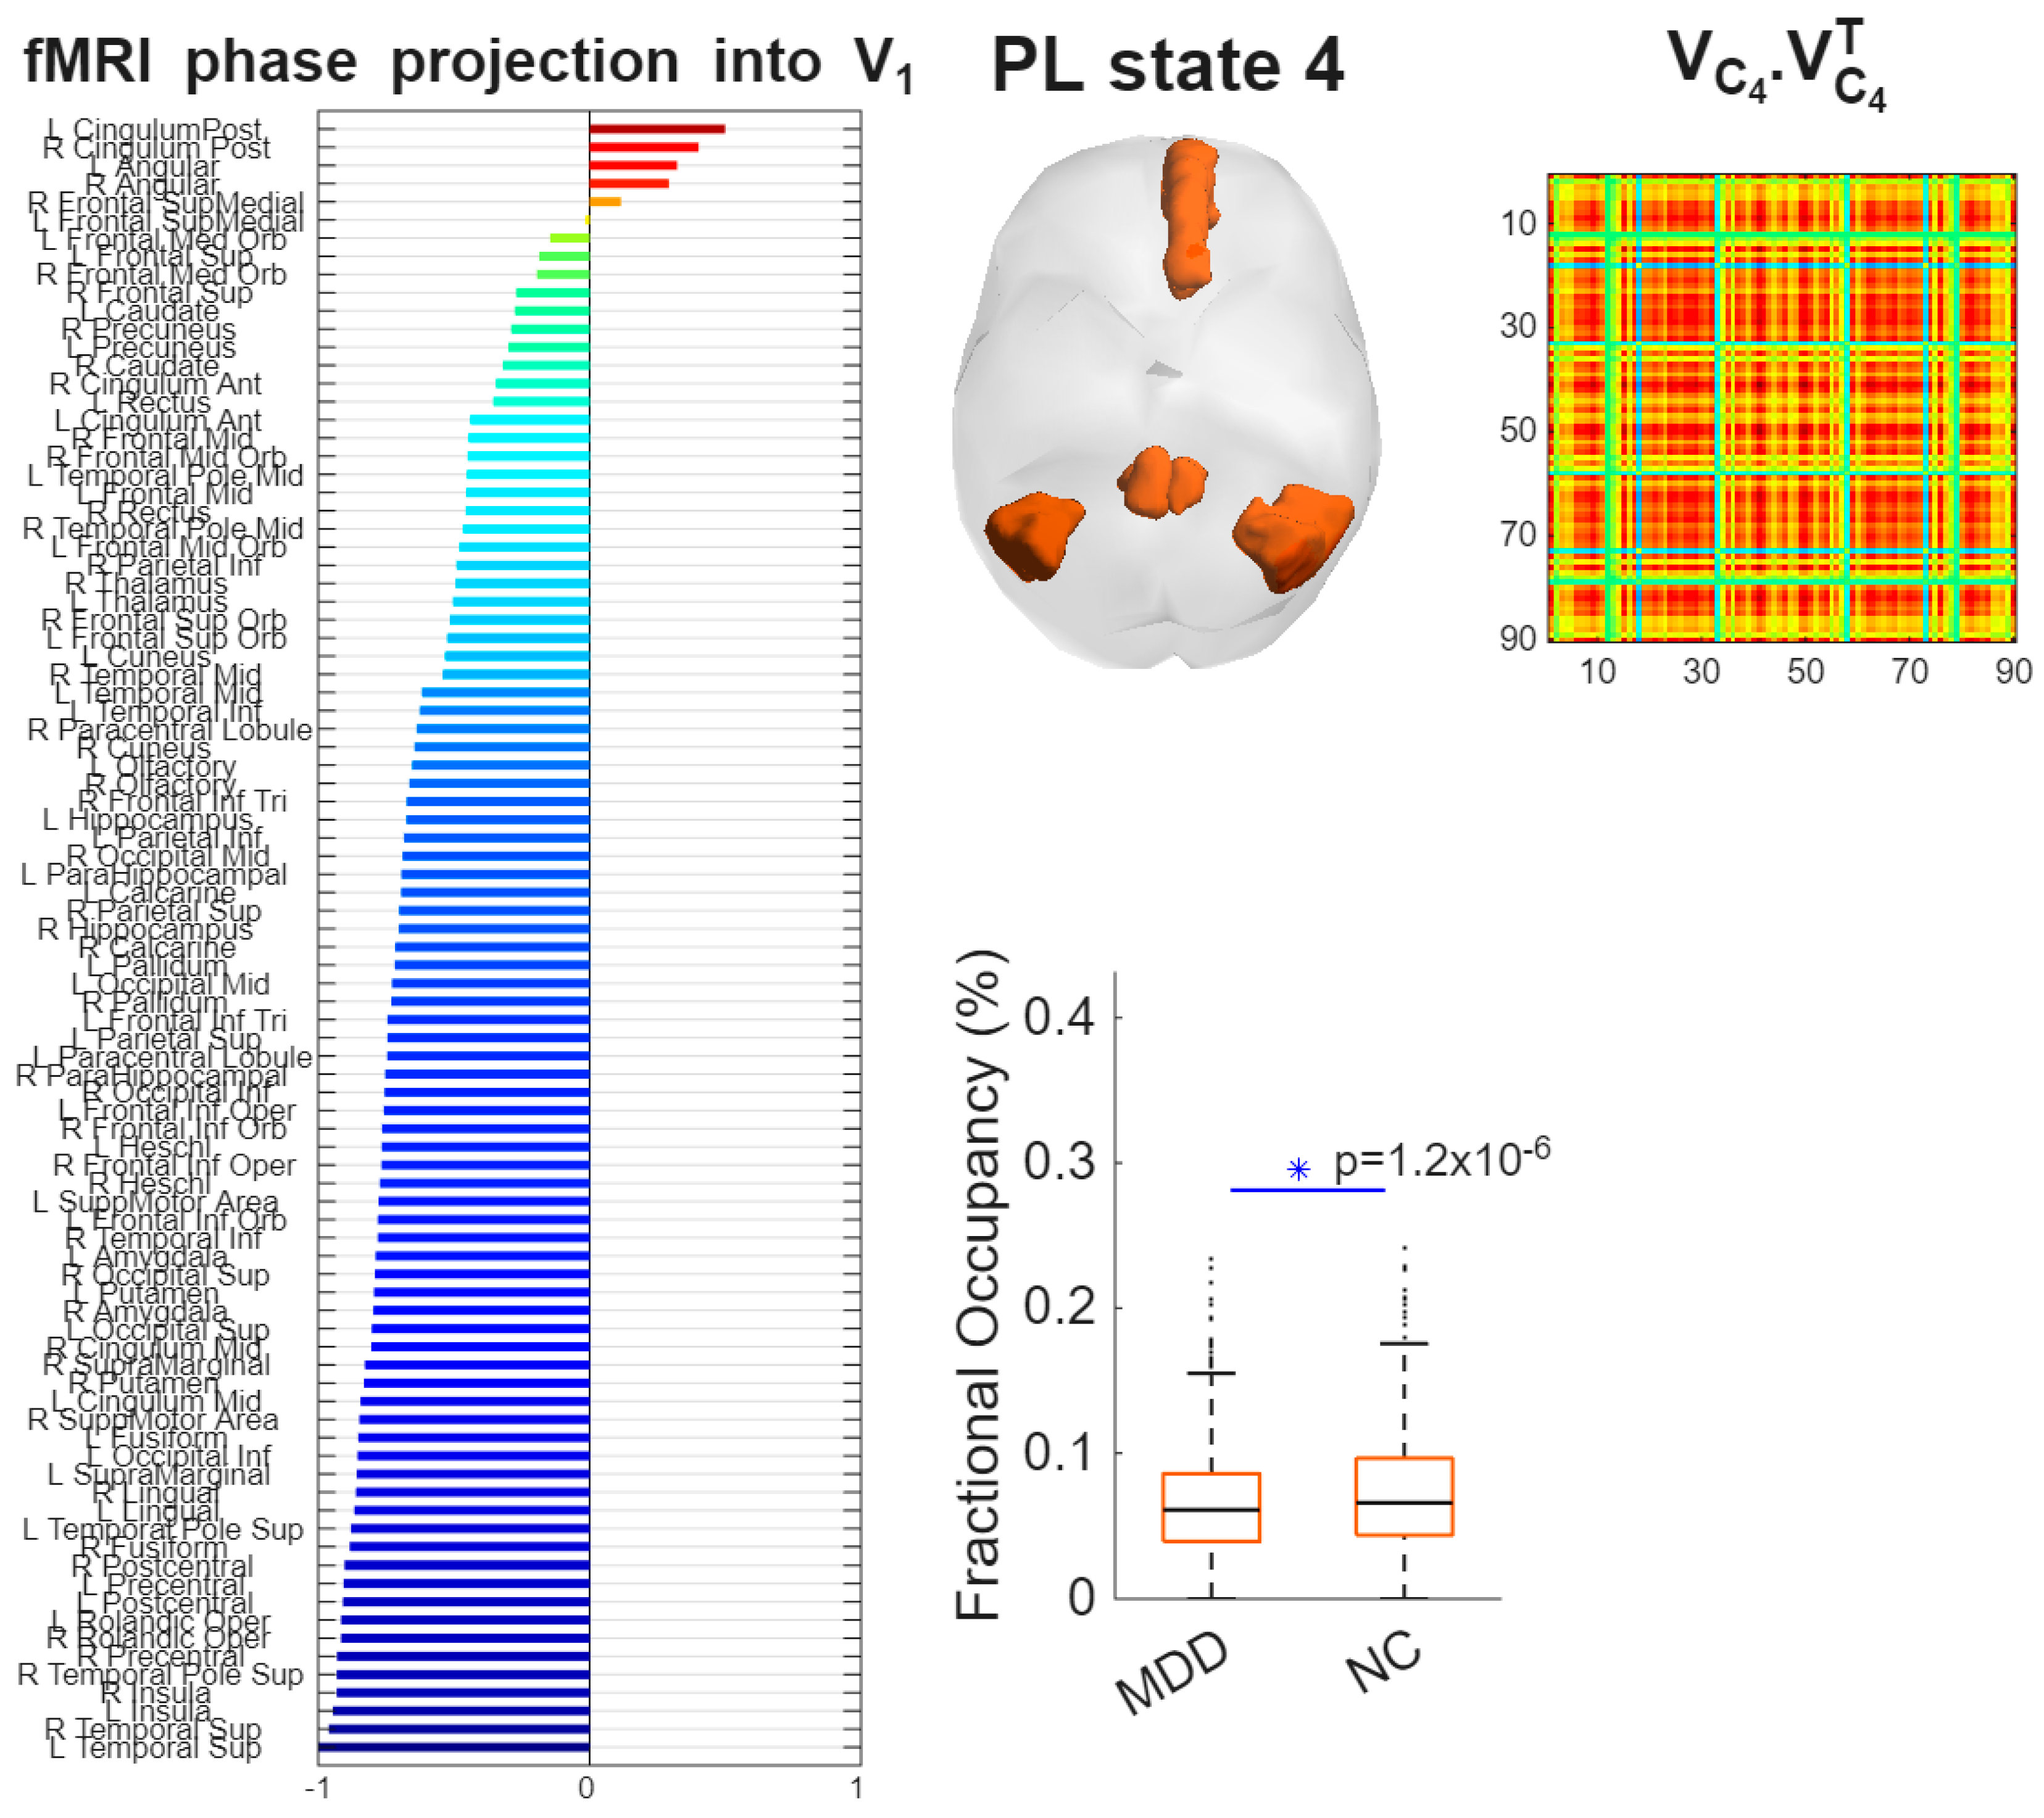
K18C4 exhibited a posterior DMN topology with dominant loading in posterior cingulate/precuneus and bilateral angular/inferior parietal cortex, extending into medial prefrontal and medial/lateral temporal regions, including hippocampal–parahippocampal areas (Figure 4).
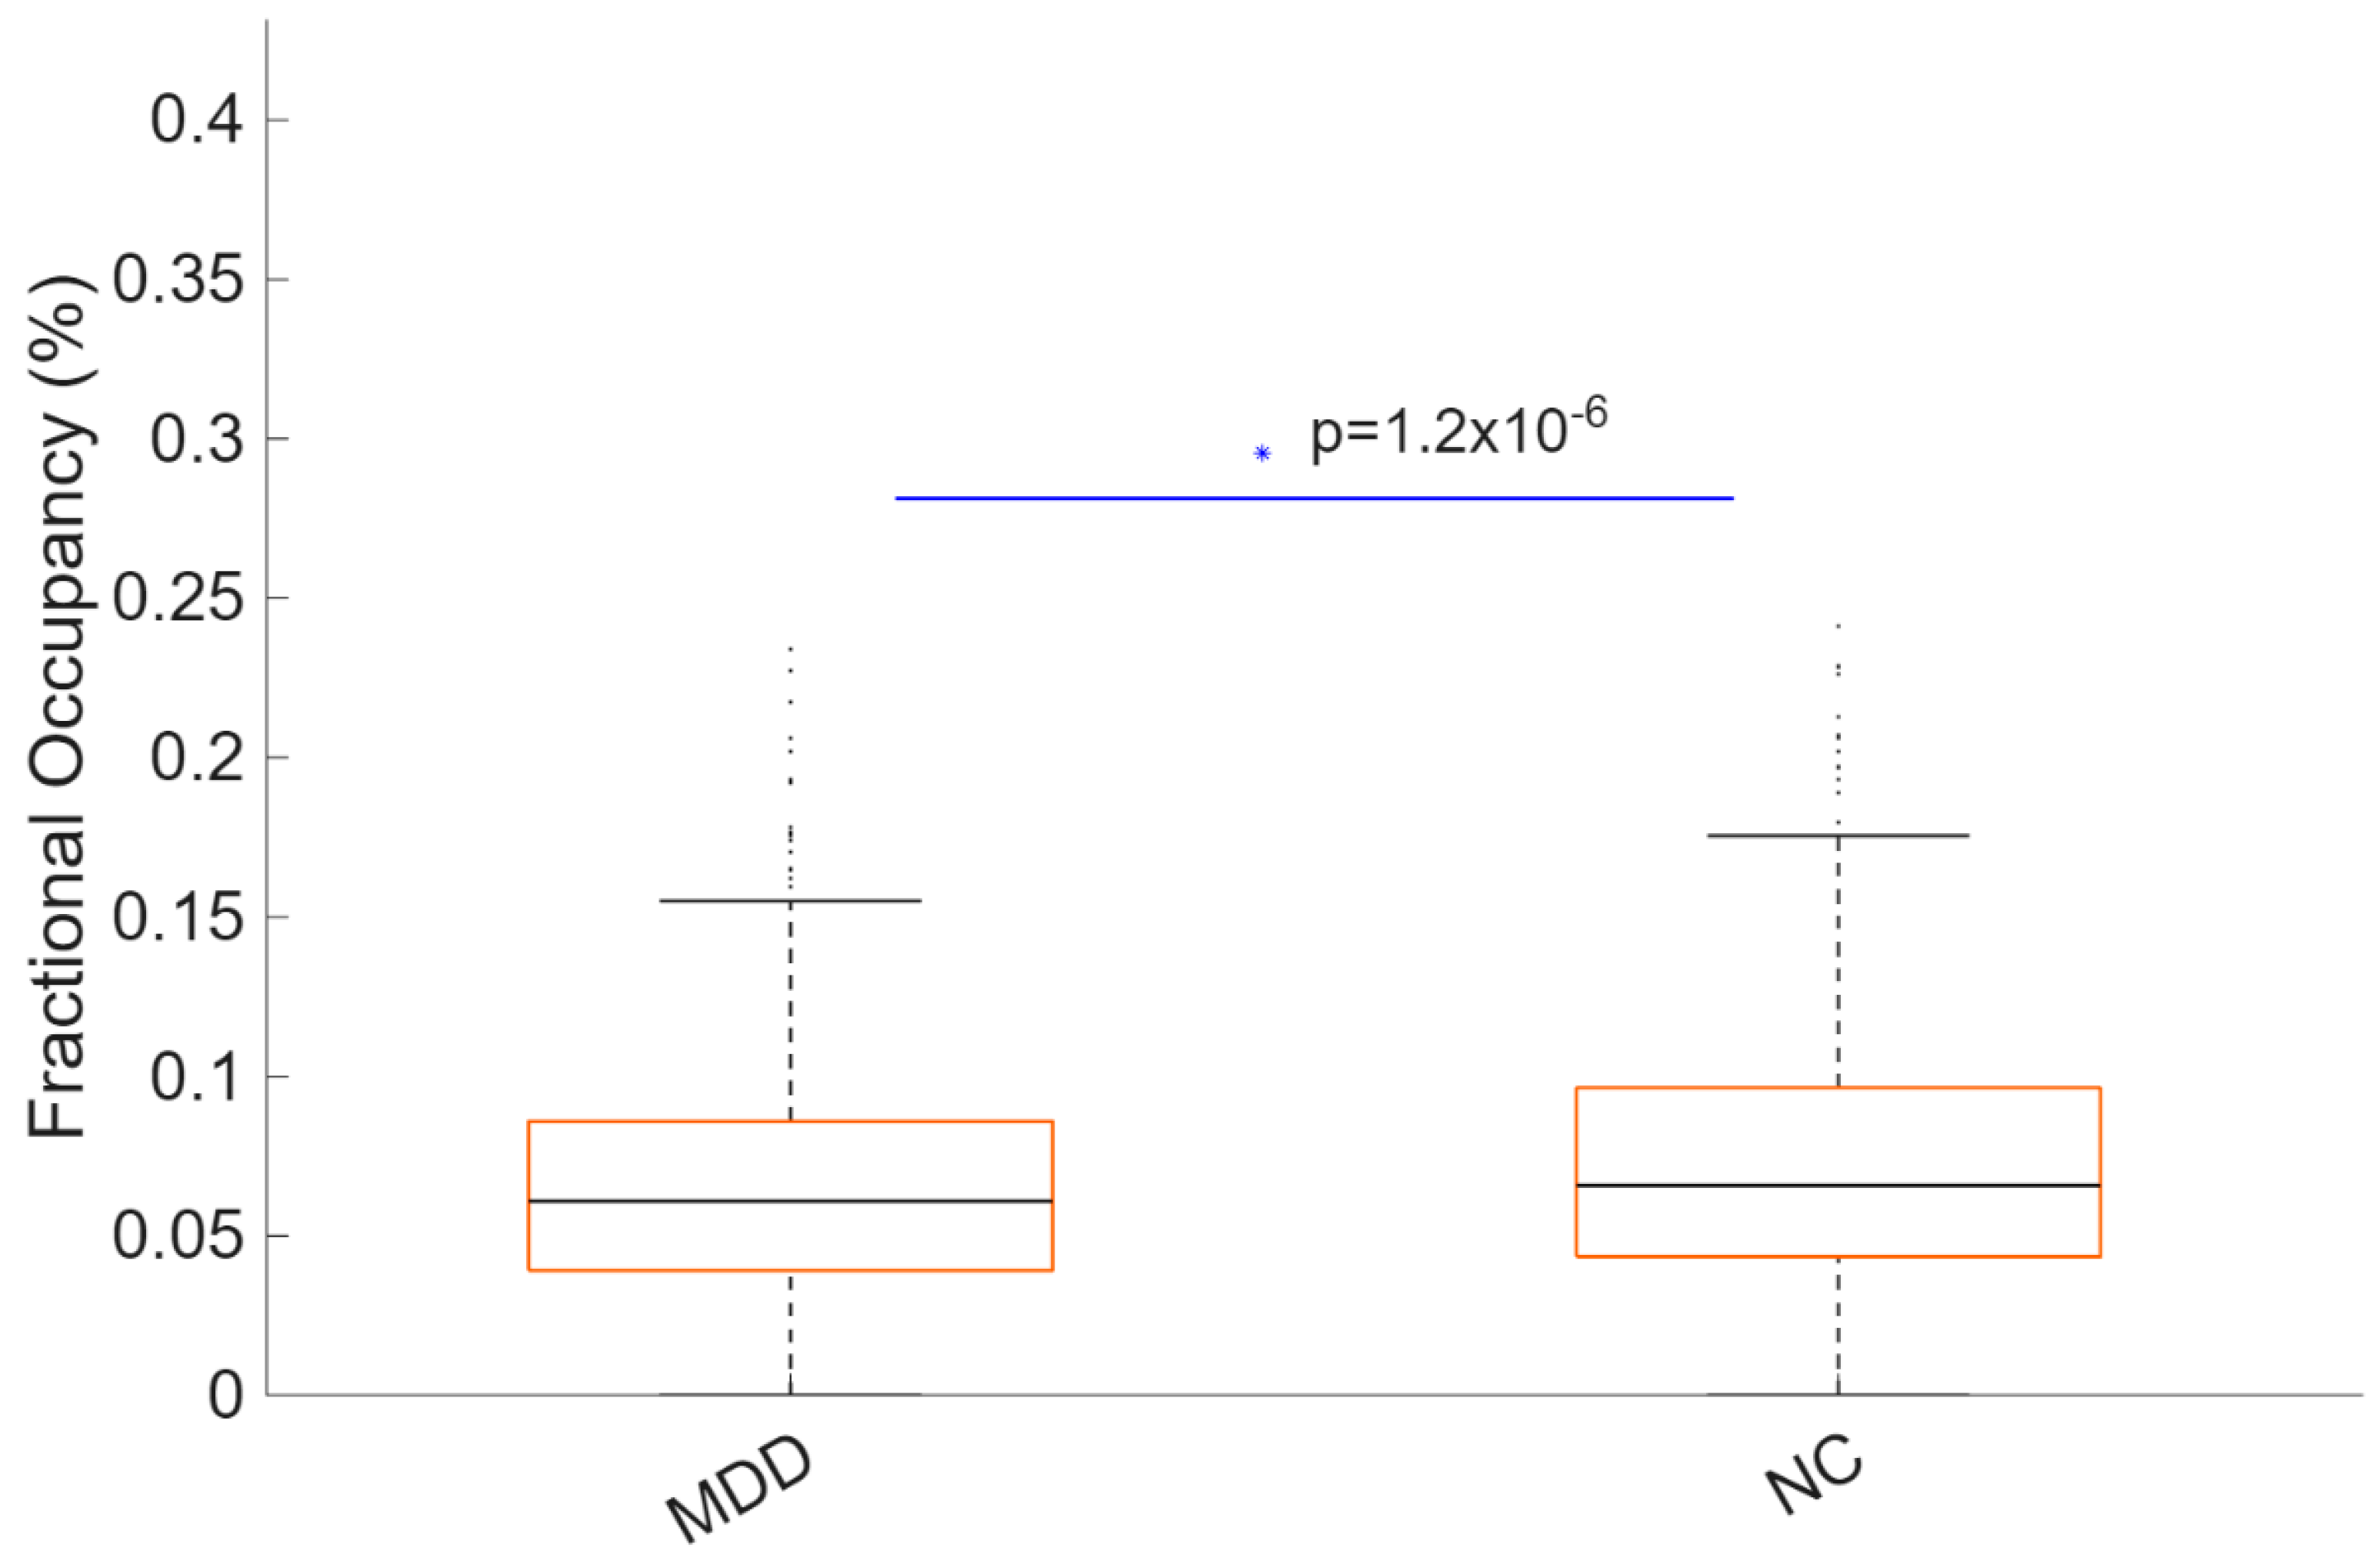
MDD showed reduced FO compared with HC (MDD: 0.052; HC: 0.071), reflecting an approximately 27% reduction. The between-group difference was statistically significant (p < .001) with a medium effect size (Hedges’ g = −0.51; 95% CI [−0.73, −0.29]) (Figure 5). Boxplots generated by LEiDA indicate a downward shift in central tendency for MDD with comparable dispersion.
3.5. Occipito-Parieto-Temporal State (K20C18)
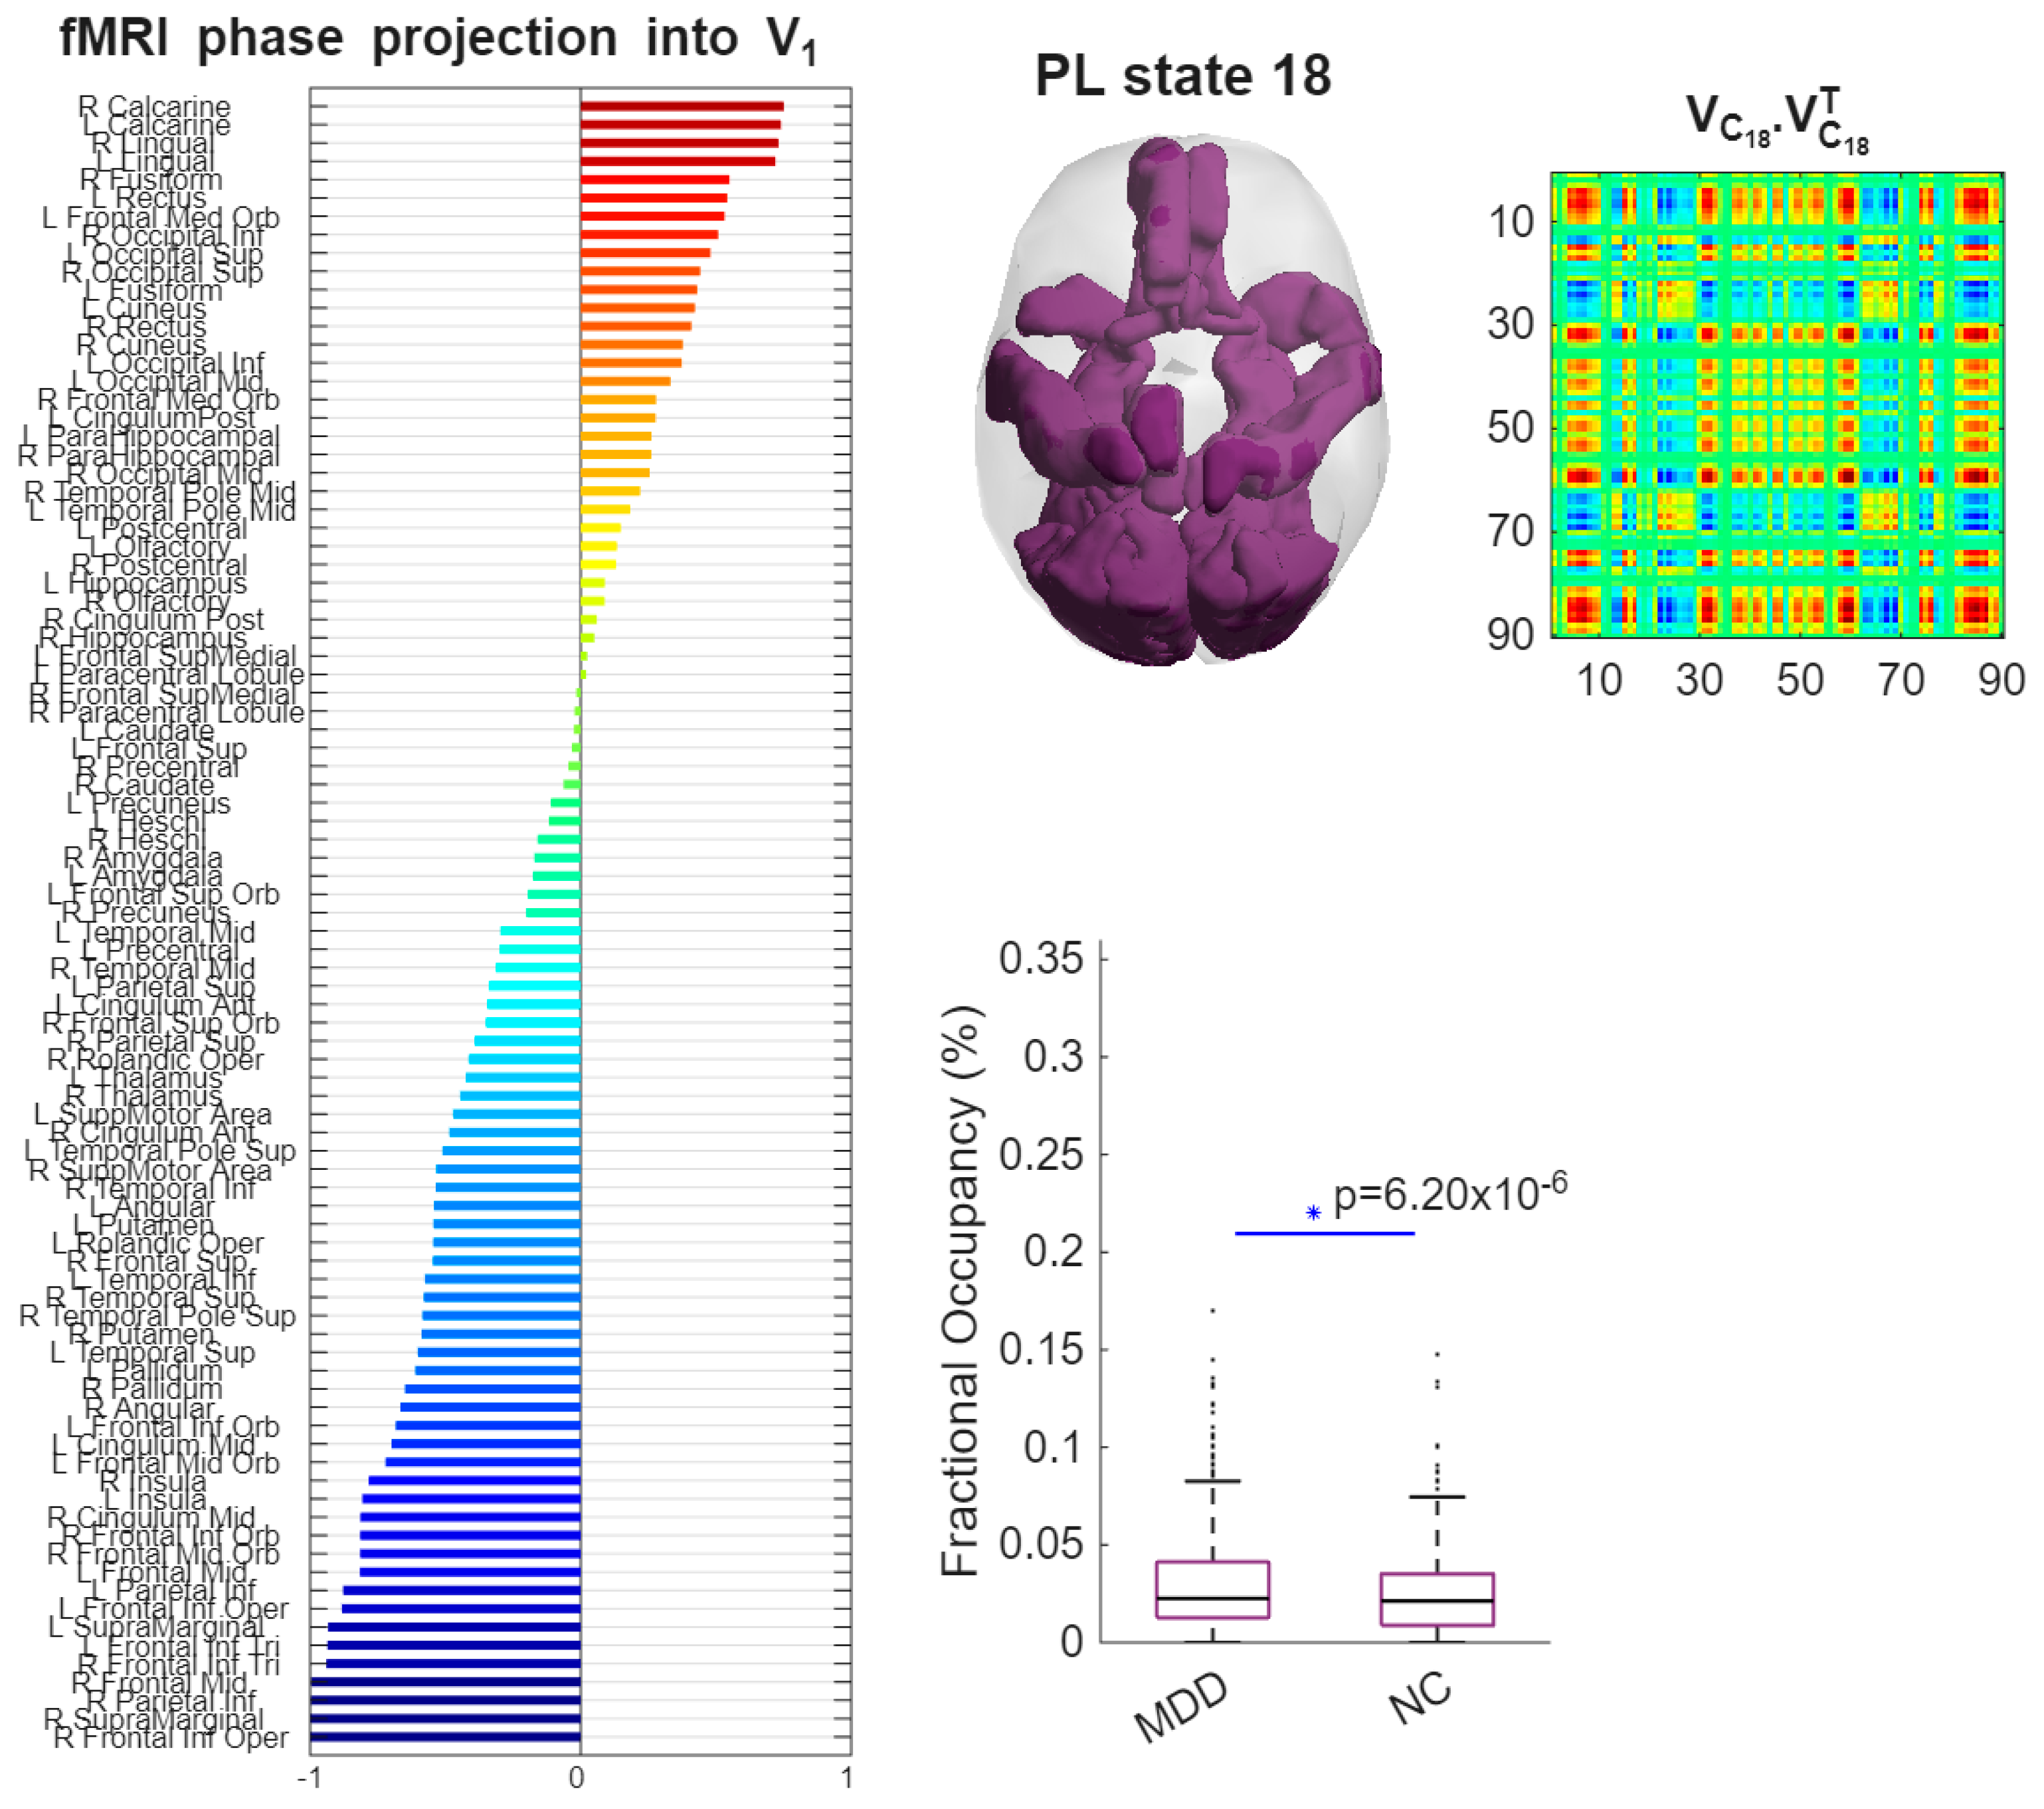
K20C18 engaged visual cortex (calcarine, cuneus, lingual, fusiform) with concurrent frontoparietal regions (superior/middle frontal, inferior frontal opercular; superior parietal/postcentral), temporal cortex (middle/inferior temporal), and hippocampal areas (Figure 6).
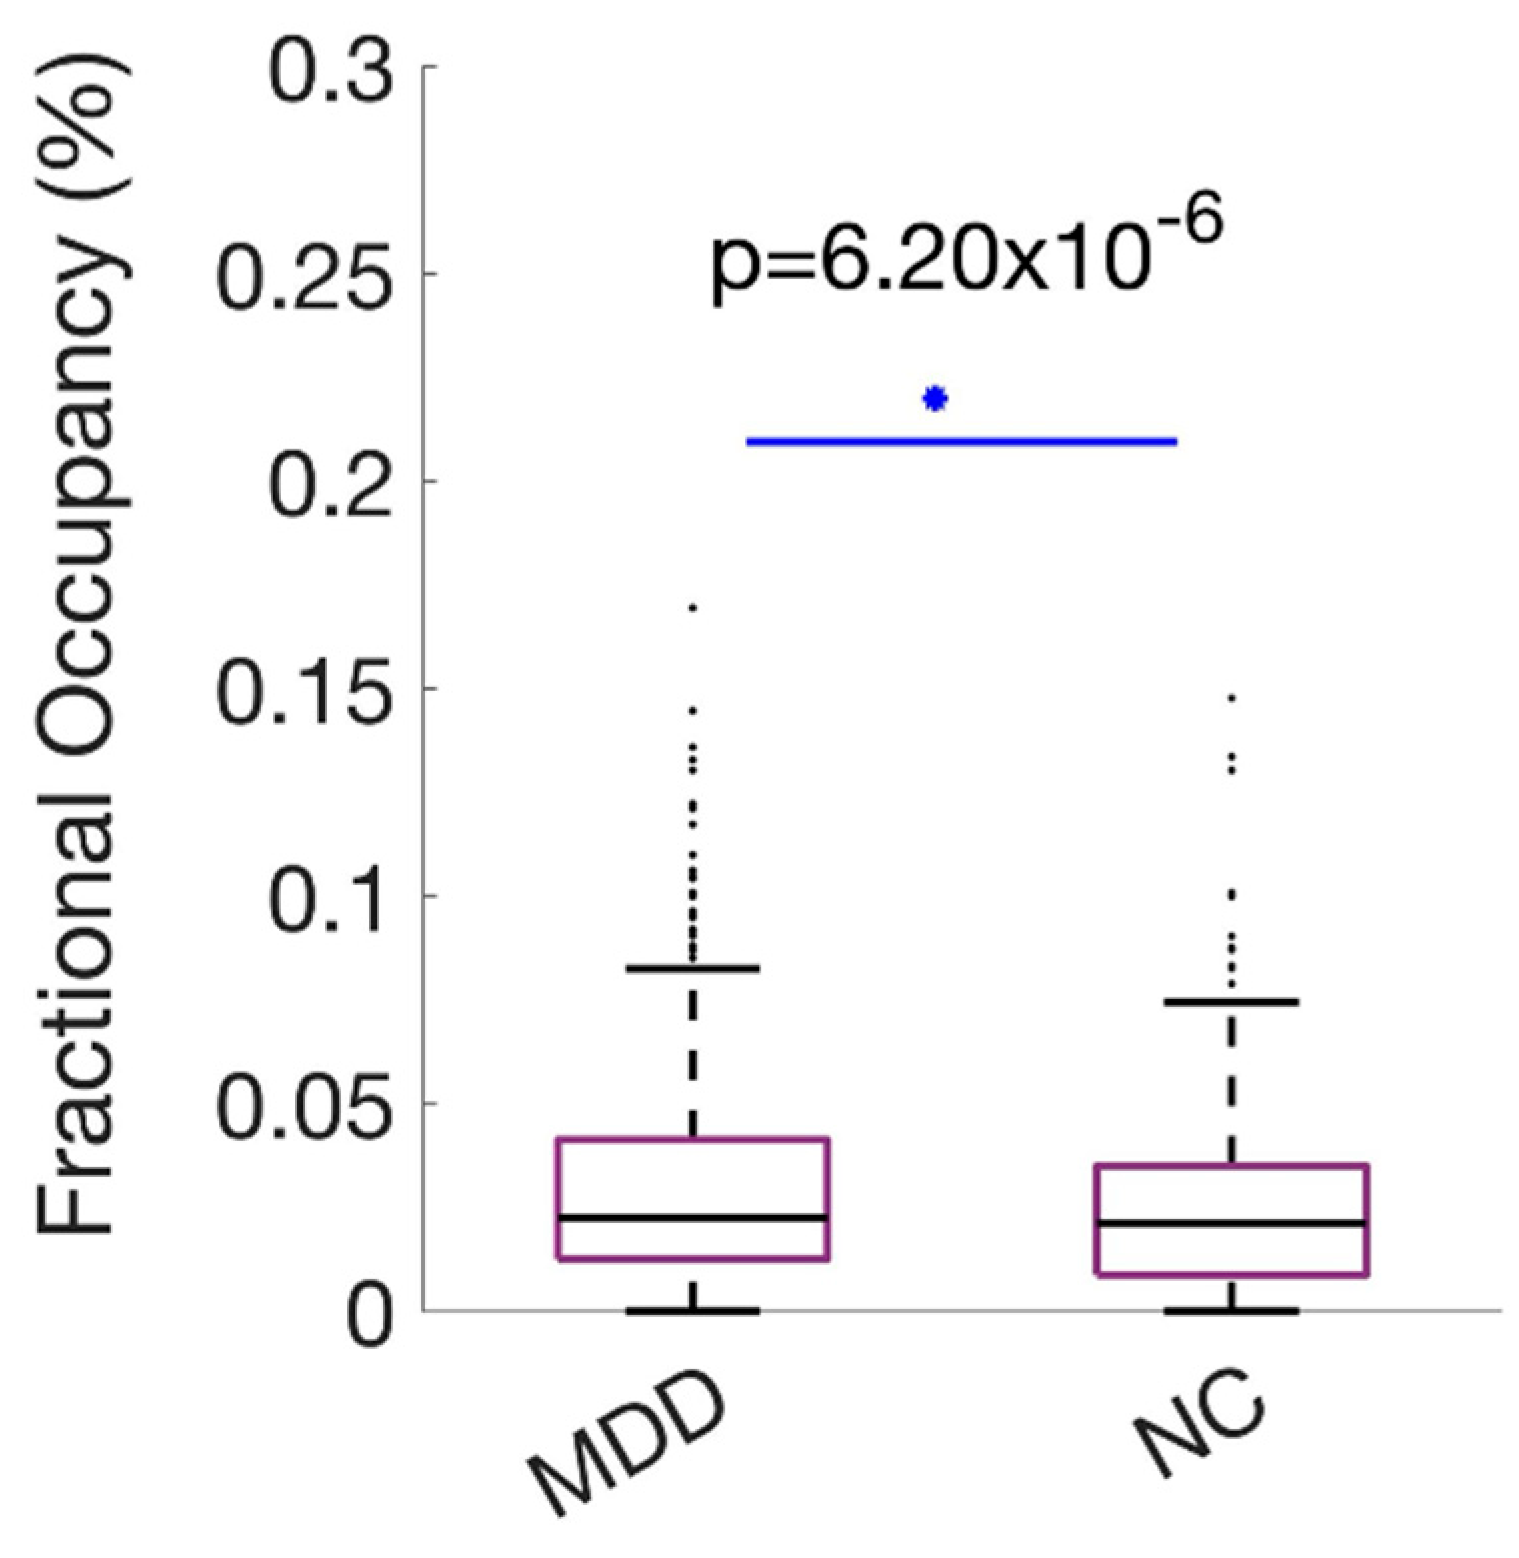
MDD showed higher FO than HC (0.028 vs. 0.022), an approximately 27% increase. The between-group difference was statistically significant (p < .001) with a small-to-moderate effect size (Hedges’ g = 0.42; 95% CI [0.20, 0.64]) (Figure 7). The spatial profile primarily aligns with the Visual network while integrating control and mnemonic regions, suggesting altered integration or compensatory dynamics in MDD.
3.6. Global Redistribution of Temporal Dynamics
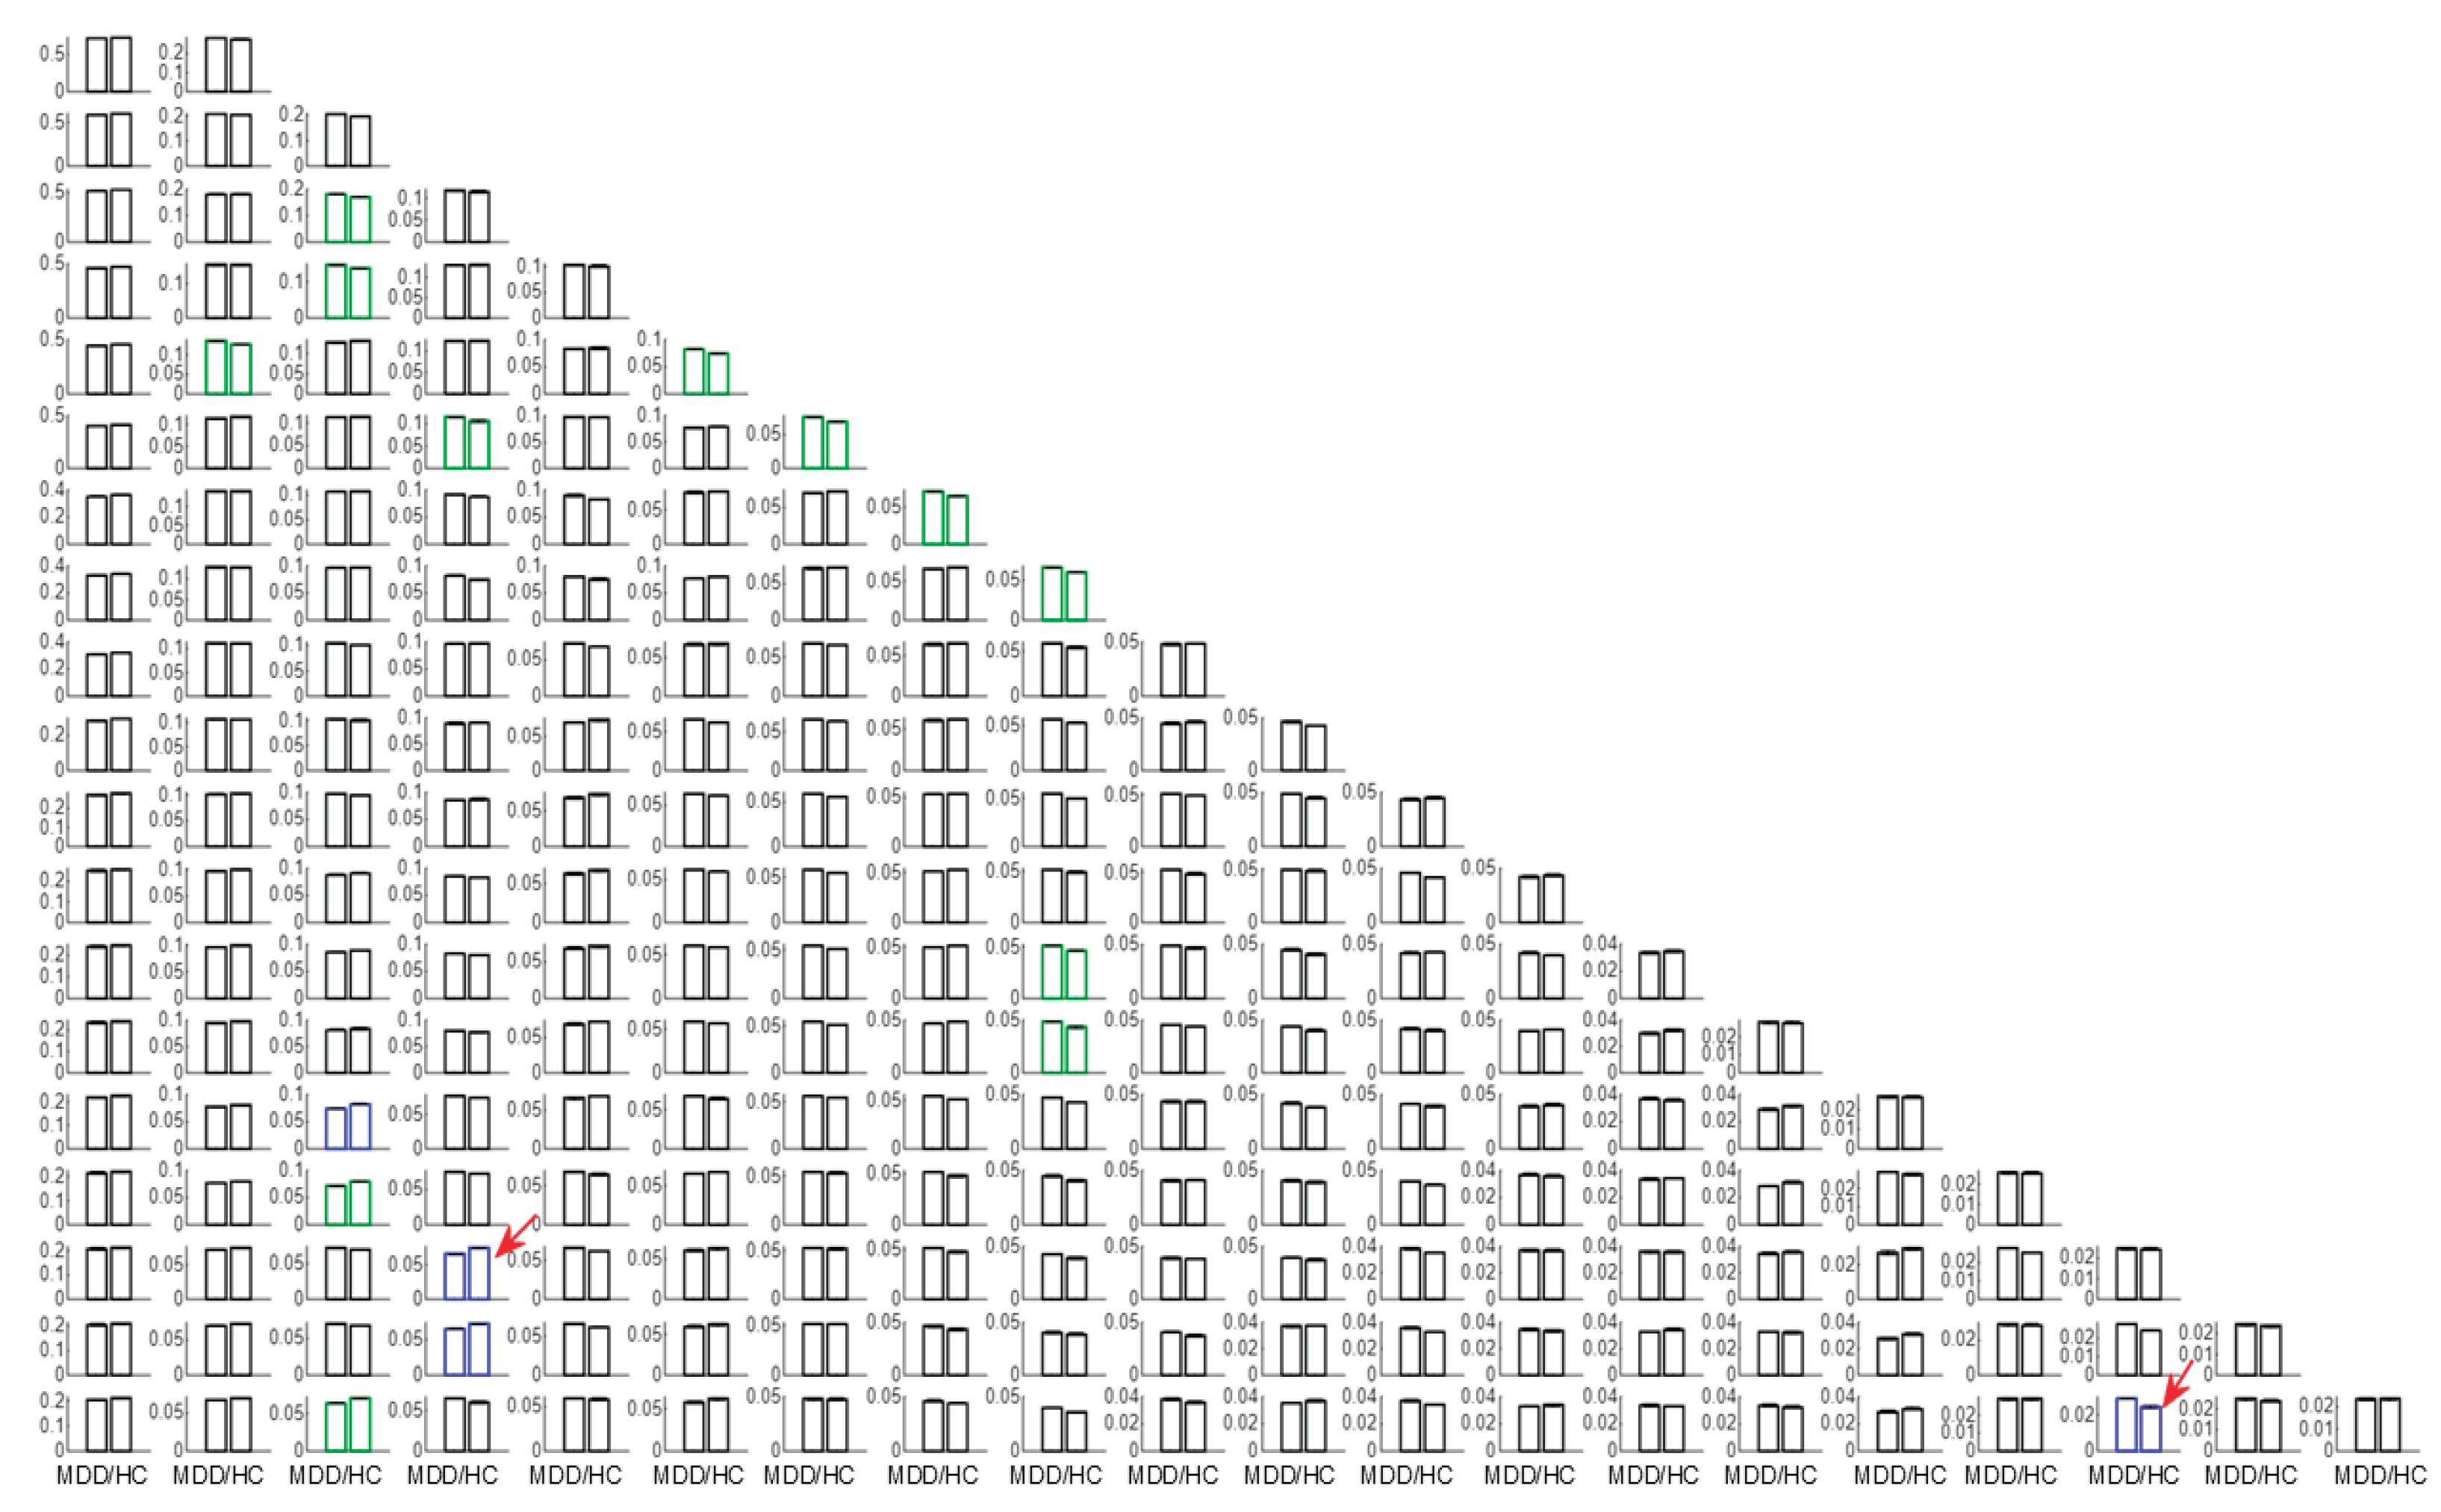
FO differences across LEiDA states were small and bidirectional, indicating redistribution rather than a uniform shift. MDD showed reduced FO in a posterior DMN state (K18C4) and increased FO in an occipito-parieto-temporal state (K20C18). Signed FO differences (MDD − HC) are shown for all states, with multiple-comparisons–corrected significance coded in blue (p < .001) and green (p < .05); the two focal states are indicated by red arrows (Figure 8).
4. Discussion
This secondary analysis of REST-meta-MDD identifies selective, bidirectional alterations in time-resolved network organization in MDD: significantly reduced FO of a posterior DMN state, alongside increased FO in an occipito-parieto-temporal network state, relative to HC.15 These findings robustly reinforce and extend prior observations from the REST-meta-MDD consortium and other international cohorts, confirming LEiDA’s sensitivity to clinically relevant network dynamics in MDD [7,10,11,23,32].
The decline in FO of the overlapping posterior DMN state, combined with shorter dwell times and elevated switching, highlights fundamental temporal instability within this canonical network in MDD [7,8,23]. Anatomically localized to the posterior cingulate cortex, angular gyrus, and hippocampal–parahippocampal regions - midline territories adjacent to ventricular and perivascular corridors where infra-slow vasomotor and CSF oscillations are prominent -, these disruptions target key substrates of self-referential and autobiographical processing [23]. The current results align consistently with an extensive literature documenting DMN hypoconnectivity across static and dynamic paradigms in MDD and reinforce the mechanistic model wherein impaired DMN stability underpins core clinical features such as rumination and emotional dysregulation [7,8,32].
Concurrently, increased FO in an occipito-parieto-temporal network suggests compensatory recruitment of perceptual and executive control systems [10,11]. This shift towards externally oriented, task-positive configurations reflects dynamic network rebalancing in response to DMN disruption, consistent with prior dynamic connectivity studies in MDD [10,11].
The present results, as well as the REST-meta-MDD results, report robust DMN alterations using harmonised pipelines, likely suppressing physiology-linked variance, in large samples [7]. Persistence of posterior DMN reductions suggests residual physiology–network coupling survives conservative denoising and topological shifts that motivate longitudinal, hypothesis-driven work [7,23]. The robustness of DMN and occipito-parieto-temporal fractional occupancy signatures despite clinical heterogeneity—60% medicated patients, Hamilton Depression Rating Scale score = 22.7 (SD = 5.4), 52% first-episode—across 848 MDD versus 794 HC (17 sites) highlights residual neurophysiological variance surviving denoising and pharmacotherapy [7]. DMN hubs overlie ventricular/perivascular corridors coupling infra-slow BOLD signals [25]. Current monoaminergic agents leave this dynamic intact. Leading eigenvector dynamics analysis-guided multimodal studies in drug-naïve cohorts targeting pulsatility/glymphatic function could dissect causal roles, advancing personalized stratification. Notably, REST-meta-MDD DIRECT’s last stage expands beyond predominantly Chinese cohorts to examine ethnicity and adopts a surface-based preprocessing pipeline that improves cross-site comparability [24]. This evolution supports the recommendation to treat preprocessing as a design factor, adopt physiology-aware modelling, and evaluate transportability across ancestry, site, and scanner using harmonisation that preserves diagnostic variance [26].
Despite LEiDA’s robust detection of DMN-linked dynamic disruptions, fundamental mechanistic questions persist.23 While the dominant hypothesis attributes these fluctuations to synchronized neuronal firing modulated by neurovascular coupling, emerging evidence implicates contributory roles for ultra-slow oscillations, anatomical resonance, and brain fluid dynamics [25,26,27].
In this context, recent findings delineate a compelling network-specific phase alignment between DMN regions—notably the medial prefrontal cortex, posterior cingulate, and angular gyrus—and ventricular signals within defined “BraVe mode II” coupling modes [25]. This provides novel empirical indications of functional interactions between large-scale brain networks and brain fluid dynamics, advancing an integrated neurofluidic-neurophysiological framework for understanding DMN fluctuations, yet demands further empirical validation [25]. While antidepressants modulate static RSN , dynamic FO residuals imply complementary neurofluidic roles [7,25]. Multimodal studies incorporating repeated-measures TMS and ECT—interventions known to modulate dFC—offer promising avenues for causal hypothesis testing [11,29] as does advanced focused ultrasound neuromodulation coupled with concurrent fMRI [26].
Methodological constraints challenge the interpretability and robustness of dFC in BOLD fMRI. BOLD signals are affected by both neural and non-neural physiological confounds, such as vascular dynamics and respiration, which manifest as phase-locking patterns in fMRI data [12]. Discriminating these components is necessary to avoid misinterpretation of dynamic brain states [25].
dFC metrics are highly sensitive to analytic choices including parcellation size, phase extraction, clustering algorithms, frequency filtering, and temporal windowing. Triangulation across methods with preregistered criteria is essential for reproducibility [10,15,32]. Although, LEiDA, can detecting recurrent, anatomically distinct dynamic modes reflecting both neural and physiological components, this does not fully mitigate analytic variability or physiological confounds, underscoring the need for multimodal data and robust analytical triangulation [25].
A further limitation is that the current LEiDA analysis was restricted to group-level comparisons between MDD and HC and was not optimized for individual-level diagnostic classification or prognosis. Developing clinically useful biomarkers would require explicitly predictive modelling with cross-validated training and test sets, harmonisation of site-related variance, and integration of longitudinal and treatment data, which the REST-meta-MDD dataset does not yet provide in a uniform way. Nonetheless, the specific pattern of decreased posterior DMN occupancy and increased occipito-parieto-temporal occupancy identified here offers a mechanistically grounded feature space that can be leveraged by future work targeting subject-level prediction in MDD.
Clinical heterogeneity and predominance of cross-sectional designs in MDD limit insight into temporal network dynamics and treatment effects. Longitudinal studies with detailed symptom profiling, stratified by medication and episode status, and ethnically diverse validation are necessary to develop generalizable biomarkers [7,29]. It remains pertinent, in the context of methodological limitations, mentioned that phase coupling detects synchrony but not causality, limiting mechanistic interpretation [25]. Technical and economic challenges for multimodal neuroimaging integrating neural, vascular, and fluid dynamics constrain clinical scalability, necessitating rigorous, multimodal, longitudinal frameworks for clinically meaningful fMRI biomarkers in MDD [24].
A key limitation is that clinical heterogeneity within MDD (e.g., episode status, illness duration, symptom severity) was not explicitly modelled, despite partial availability across cohorts. Consequently, the findings reflect average diagnostic-group effects rather than subtype-specific signatures, and the generalisability across MDD subgroups (e.g., first-episode vs recurrent) remains to be established. Future stratified analyses within REST-meta-MDD and DIRECT will be essential to test whether the observed DMN and occipito-parieto-temporal alterations generalise across, or are driven by, particular clinical profiles.
Another limitation relates to the multicentre nature of REST-meta-MDD: although harmonised protocols and stringent QC were applied, site and scanner effects were not explicitly modelled or stratified. Residual batch effects and field-strength differences (1.5T vs 3T) may therefore contribute to LEiDA state variance and slightly bias effect sizes, and the robustness of findings across individual sites cannot be formally quantified here. Site-aware harmonisation and stratified validation in future multicentre studies should be required to confirm transportability.
5. Conclusions
The present study reinforces LEiDA’s utility in characterizing the temporal reorganization of RSN in MDD and contributes significantly to the evolving understanding of the DMN’s mechanistic underpinnings. This underscores the critical need for integrative neurofluidic and neurophysiological frameworks, marking an essential advancement toward biologically informed, personalized interventions that move beyond conventional symptom-focused treatment paradigms in MDD.
Funding
This work was supported by LARSyS funding from the Portuguese Foundation for Science and Tecnhology FCT (DOI: 10.54499/LA/P/0083/2020, 10.54499).
Institutional Review Board Statement
This secondary data analysis was conducted in strict accordance with the King's College London Research Ethics Policy, the ethical standards established by the British Psychological Society (BPS) and the Medical Research Council (MRC), namely the BPS Code of Human Research Ethics and MRC Good Research Practice principles (British Psycho-logical Society, 2018; Medical Research Council, 2012). The original data collection adhered to ethical standards approved by institutional review boards of all participat-ing sites, following the Declaration of Helsinki and International Committee of Medical Journal Editors (ICMJE) guide-lines.
Data Availability Statement
REST-meta-MDD consortium data available for download at rfmri.org/REST-meta-MDD).
Conflicts of Interest
The authors declare no conflicts of interest.
Abbreviations
The following abbreviations are used in this manuscript:
| AAL: Automated Anatomical Labeling |
| BOLD: Blood Oxygenation Level–Dependent |
| BPS: British Psychological Society |
| CSF: Cerebrospinal Fluid |
| dFC: Dynamic Functional Connectivity |
| DMN: Default Mode Network |
| DPARSF: Data Processing Assistant for Resting-State fMRI |
| DSM: Diagnostic and Statistical Manual of Mental Disorders |
| ECT: Electroconvulsive Therapy |
| EPI: Echo-Planar Imaging |
| FO: Fractional Occupancy |
| FWE: Familywise Error |
| fMRI: Functional Magnetic Resonance Imaging |
| FWH: Full Width at Half Maximum |
| HC: Healthy Controls |
| HDRS-17: 17-item Hamilton Depression Rating Scale |
| ICD: International Classification of Diseases |
| ICMJE: International Committee of Medical Journal Editors |
| LEiDA: Leading Eigenvector Dynamics Analysis |
| MDD: Major Depressive Disorder |
| MNI: Montreal Neurological Institute (space/template) |
| MRC: Medical Research Council |
| MRI: Magnetic Resonance Imaging |
| PL: Phase-Locking |
| QC: Quality Control |
| REST-meta-MDD: Resting-State fMRI Meta-Analysis of Major Depressive Disorder consortium |
| RSN: Resting-State Network(s) |
| rs-fMRI: Resting-State Functional Magnetic Resonance Imaging |
| SD: Standard Deviation |
| TE: Echo Time |
| TMS: Transcranial Magnetic Stimulation |
| TR: Repetition Time |
References
- American Psychiatric Association. Diagnostic and Statistical Manual of Mental Disorders. 5th ed, text rev. Washington, DC: American Psychiatric Publishing; 2022.
- World Health Organization. Depressive Disorder (Depression). Geneva, Switzerland: World Health Organization; 2023. Accessed [15/08/2025]. https://www.who.int/news-room/fact-sheets/detail/depression.
- Rong J, Wang X, Cheng P, Li D, Zhao D. Global, regional and national burden of depressive disorders and attributable risk factors, from 1990 to 2021: Results from the 2021 Global Burden of Disease study. Br J Psychiatry. 2025;1-10. [CrossRef]
- García-Gutierrez MS, Navarrete F, Sala F, Gasparyan A, Manzanares J. Biomarkers in psychiatry: Concept, definition, types and relevance to the clinical reality. Front Psychiatry. 2020;11:432. [CrossRef]
- Turkheimer FE, Veronese M, Mondelli V, Cash D, Pariante CM. Sickness behaviour and depression: An updated model of peripheral-central immunity interactions. Brain Behav Immun. 2023;111:202-210. [CrossRef]
- Smith SM, Fox PT, Miller KL, et al. Correspondence of the brain's functional architecture during activation and rest. Proc Natl Acad Sci U S A. 2009;106(31):13040-13045. [CrossRef]
- Yan CG, Chen X, Li L, et al. Reduced default mode network functional connectivity in patients with recurrent major depressive disorder. Proc Natl Acad Sci U S A. 2019;116(18):9078-9083. [CrossRef]
- Kaiser RH, Andrews-Hanna JR, Wager TD, Pizzagalli DA. Large-scale network dysfunction in major depressive disorder: A meta-analysis of resting-state functional connectivity. JAMA Psychiatry. 2015;72(6):603-611. [CrossRef]
- Mulders PC, van Eijndhoven PF, Schene AH, Beckmann CF, Tendolkar I. Resting-state functional connectivity in major depressive disorder: A review. Neurosci Biobehav Rev. 2015;56:330-344. [CrossRef]
- Preti MG, Bolton TA, Van De Ville D. The dynamic functional connectome: State-of-the-art and perspectives. Neuroimage. 2017;160:41-54. [CrossRef]
- Cabral J, Vidaurre D, Marques P, et al. Cognitive performance in healthy older adults relates to spontaneous switching between states of functional connectivity during rest. Sci Rep. 2017;7:5135. [CrossRef]
- Murphy K, Fox MD. Towards a consensus regarding global signal regression for resting state functional connectivity MRI. Neuroimage. 2017;154:169-173.
- Power JD, Barnes KA, Snyder AZ, Schlaggar BL, Petersen SE. Spurious but systematic correlations in functional connectivity MRI networks arise from subject motion. Neuroimage. 2012;59(3):2142-2154. [CrossRef]
- Dosenbach NU, Nardos B, Cohen AL, et al. Prediction of individual brain maturity using fMRI. Science. 2010;329(5997):1358-1361. [CrossRef]
- Yeo BTT, Krienen FM, Sepulcre J, et al. The organization of the human cerebral cortex estimated by intrinsic functional connectivity. J Neurophysiol. 2011;106(3):1125-1165. [CrossRef]
- Friston KJ, Williams S, Howard R, Frackowiak RS, Turner R. Movement-related effects in fMRI time-series. Magn Reson Med. 1996;35(3):346-355. [CrossRef]
- MathWorks. MATLAB R2020b. Natick, MA: The MathWorks Inc; 2020.
- Hancock F, Cabral J, Luppi AI, Rosas FE, Mediano PAM, Dipasquale O, Turkheimer FE. Metastability, fractal scaling, and synergistic information processing: What phase relationships reveal about intrinsic brain activity. Neuroimage. 2022;259:119433. [CrossRef]
- Farinha M, Amado C, Morgado P, Cabral J. Increased excursions to functional networks in schizophrenia in the absence of task. Frontiers in Neuroscience. 2022 Mar 11;16:821179.
- Vohryzek J, Deco G, Cessac B, Kringelbach ML, Cabral J. Ghost attractors in spontaneous brain activity: Recurrent excursions into functionally-relevant BOLD phase-locking states. Frontiers in systems neuroscience. 2020 Apr 17;14:20.
- British Psychological Society. BPS Code of Human Research Ethics. 2nd ed. Leicester, UK: British Psychological Society; 2018.
- Medical Research Council. Good Research Practice: Principles and Guidelines. London, UK: Medical Research Council; 2012. Accessed [22/08/2025]. https://www.mrc.ac.uk/publications/browse/good-research-practice-principles-and-guidelines/.
- Long Y, Cao H, Yan C, et al. Altered resting-state dynamic functional brain networks in major depressive disorder: Findings from the REST-meta-MDD consortium. Neuroimage Clin. 2020;26:102163. [CrossRef]
- Chen X, Lu B, Yan CG. DIRECT consortium for the meta-analysis of depression neuroimaging studies. Psychoradiology. 2022;2(1):32-42. [CrossRef]
- Campo FF, Brattico E, Miguel V, et al. Cognitive reserve linked to network-specific brain-ventricle coupling modes. bioRxiv. 2025;2025-01. [CrossRef]
- Kiviniemi V, Wang X, Korhonen V, et al. Ultra-fast magnetic resonance encephalography of physiological brain activity–glymphatic pulsation mechanisms? J Cereb Blood Flow Metab. 2016;36(6):1033-1045. [CrossRef]
- Ogawa S, Lee TM, Kay AR, Tank DW. Brain magnetic resonance imaging with contrast dependent on blood oxygenation. Proc Natl Acad Sci U S A. 1990;87(24):9868-9872. [CrossRef]
- Pilmeyer J, Huijbers W, Lamerichs R, Jansen JF, Breeuwer M, Zinger S. Functional MRI in major depressive disorder: A review of findings, limitations, and future prospects. J Neuroimaging. 2022;32(4):582-595.
- Martin E, Roberts M, Grigoras IF, et al. Ultrasound system for precise neuromodulation of human deep brain circuits. Nat Commun. 2025;16:8024. [CrossRef]
- Fultz NE, Bonmassar G, Setsompop K, et al. Coupled electrophysiological, hemodynamic, and cerebrospinal fluid oscillations in human sleep. Science. 2019;366(6465):628-631. [CrossRef]
- Schmaal L, Hibar DP, Sämann PG, et al. Cortical abnormalities in adults and adolescents with major depression based on brain scans from 20 cohorts worldwide in the ENIGMA Major Depressive Disorder Working Group. Mol Psychiatry. 2017;22(6):900-909. [CrossRef]
- Vidaurre D, Smith SM, Woolrich MW. Brain network dynamics are hierarchically organized in time. Proc Natl Acad Sci U S A. 2017;114(48):12827-12832. [CrossRef]
- Yan C, Zang Y. DPARSF: A MATLAB toolbox for “pipeline” data analysis of resting-state fMRI. Front Syst Neurosci. 2010;4:13. [CrossRef]
- Cabral J. LEiDA: Leading Eigenvector Dynamics Analysis (MATLAB toolbox) [MATLAB 2025a]. 2016-2025. GitHub. Accessed July 30, 2025. https://github.com/juanitacabral/LEiDA.
Figure 1.
Centroid pyramid of Phase Locking (PL) states across K = 2–20. Rows depict clustering solutions at each K; columns align corresponding states across adjacent Ks by maximizing spatial correlation, illustrating continuity (stable alignment across Ks) and fractionation (lower K states splitting at higher K). Vertical placement indexes K from 2 to 20; horizontal placement groups spatially similar centroids. Frame colors encode group differences in FO (MDD − HC) from two-sided label-permutation tests (5,000 permutations per state): blue p < .001, green .001 ≤ p < .05, black p ≥ .05. Among blue centroids (p < .001), those selected for detailed analysis are additionally marked with a red circle. Panel A annotates approximate correspondence with canonical intrinsic networks.
Figure 2.
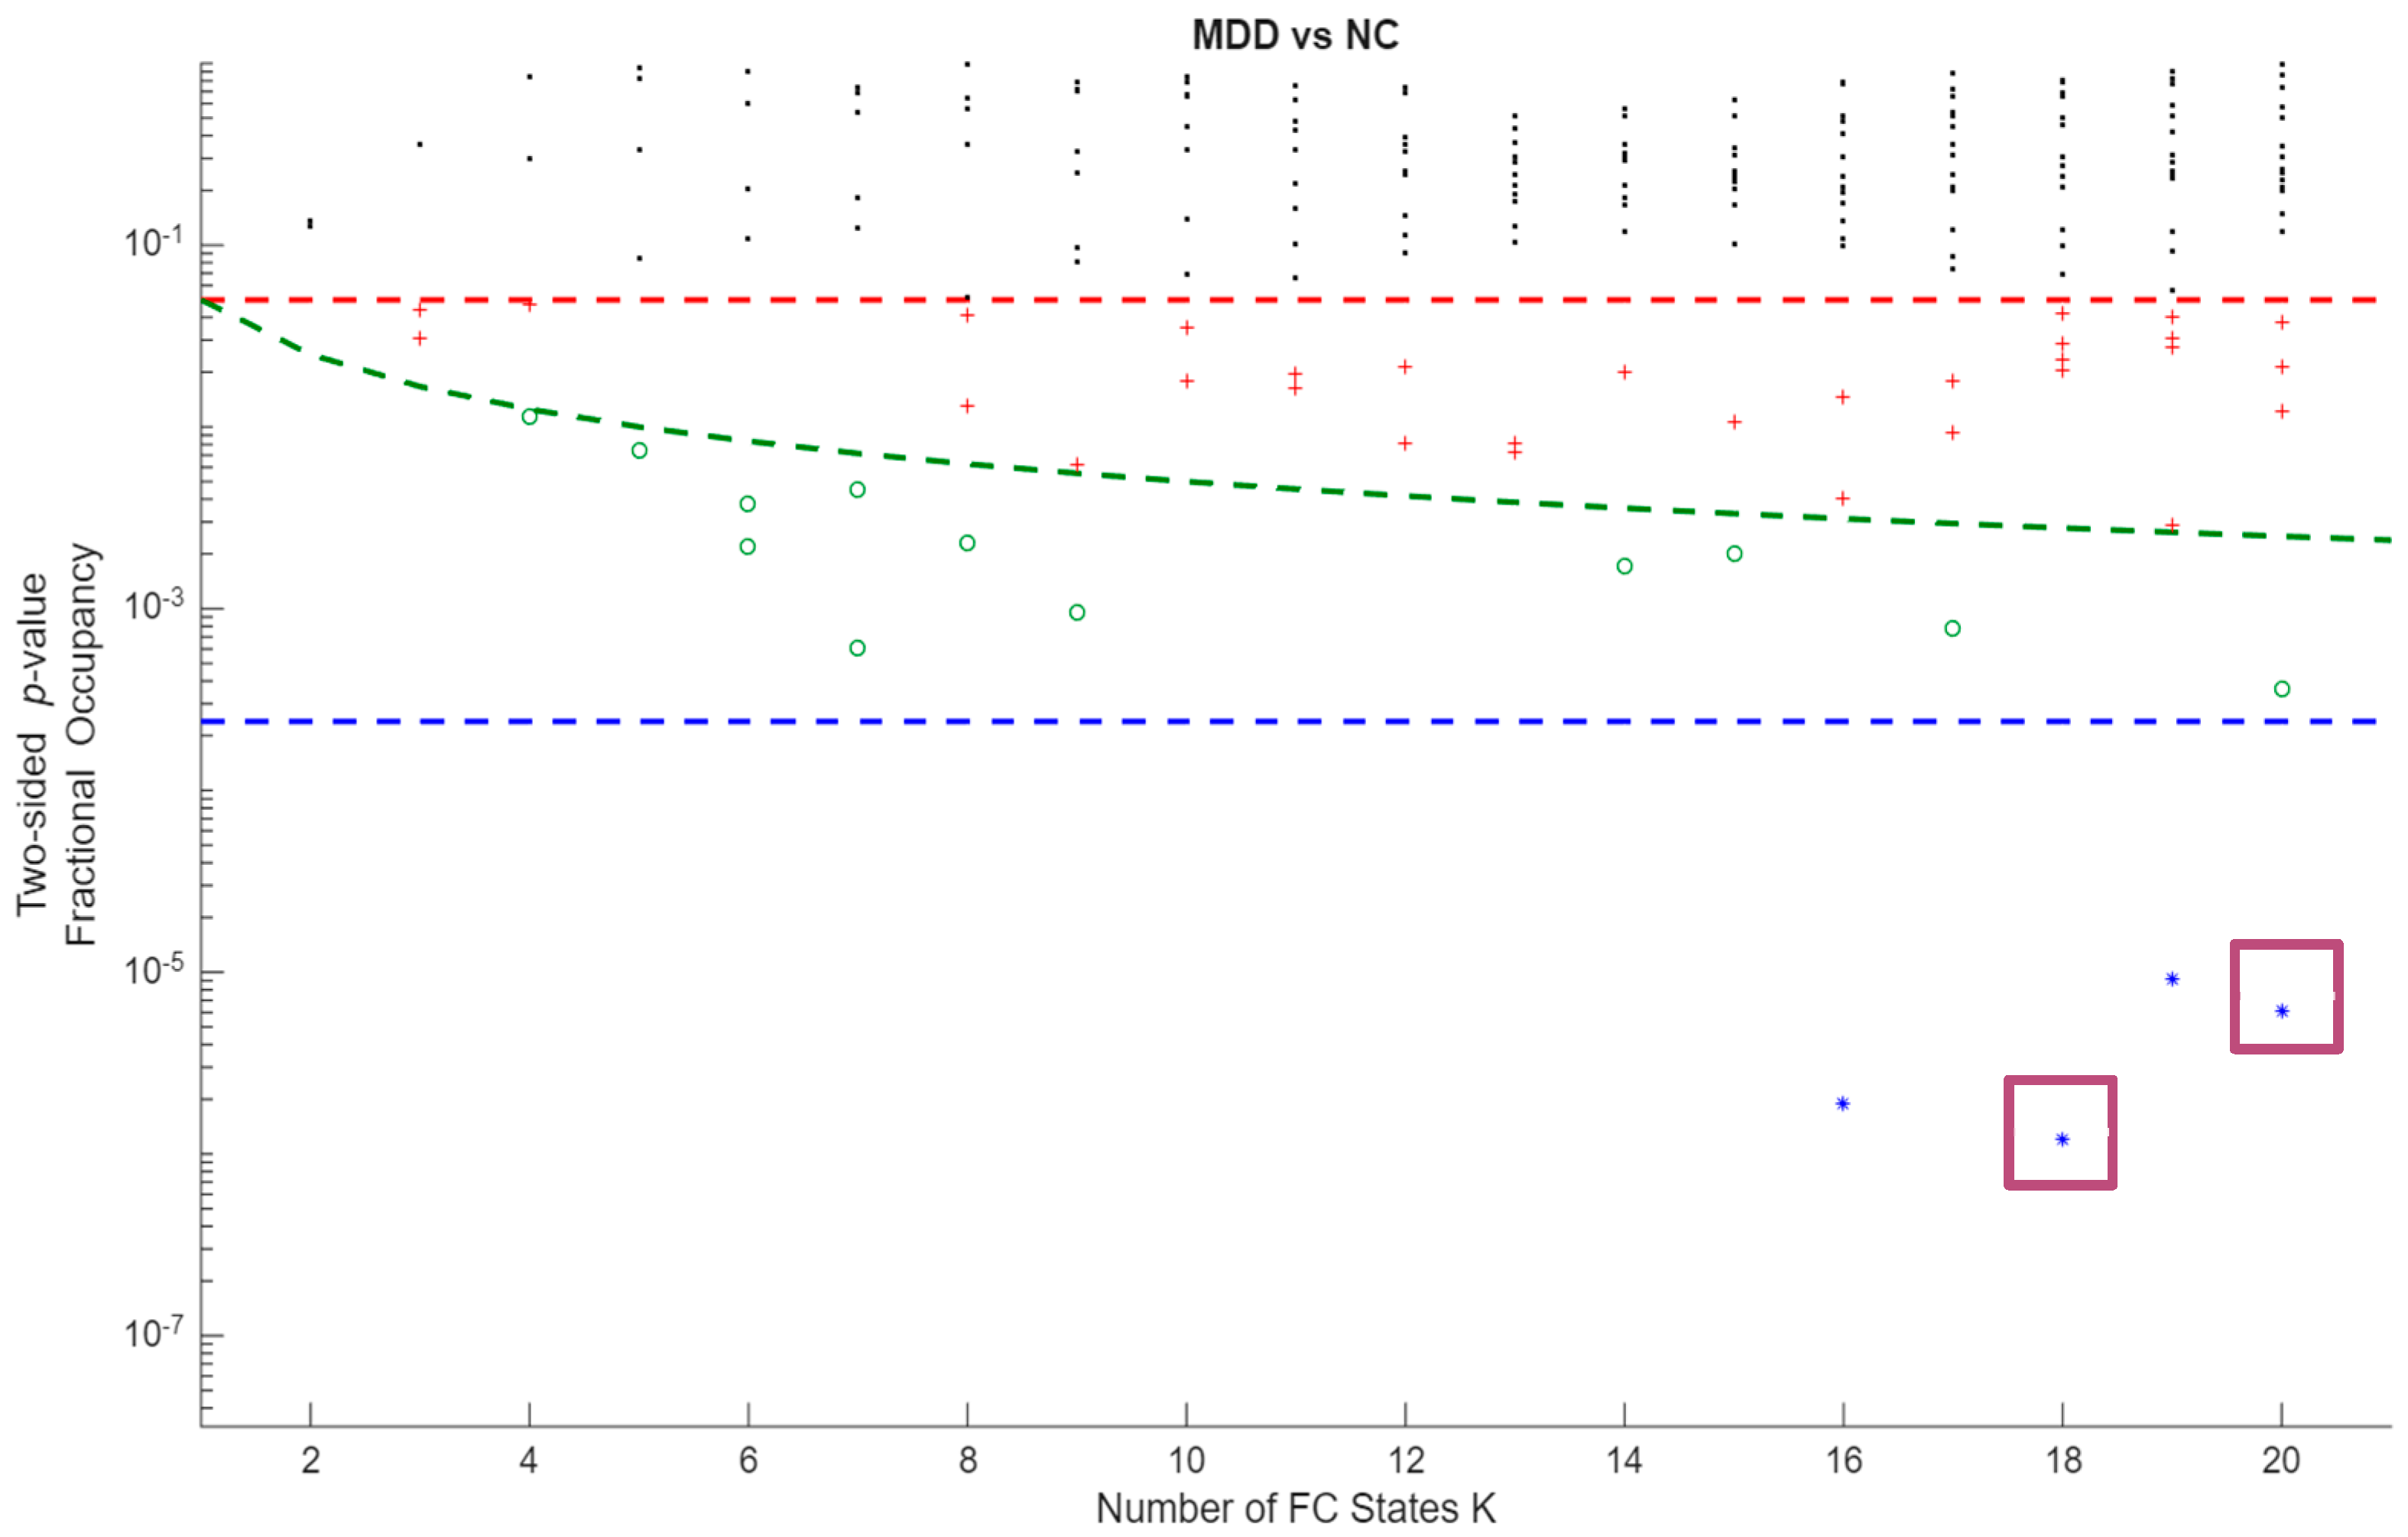
Statistical significance of differences in occupancy between MDD vs HC, for all the FC states obtained across clustering solutions. The y-axis shows state-level p-values on a logarithmic scale and the x-axis shows the number of FC states K (2–20). Each point represents the p-value for one FC state at a given K. The red horizontal dashed line denotes the nominal significance level p = 0.05; the green dashed curve denotes the within-K Bonferroni threshold p = 0.05/K, shown as a descriptive reference; and the blue horizontal dashed line denotes the global Bonferroni-corrected threshold p = 0.05/209 across all FC states and clustering resolutions, which is the criterion used to define statistical significance in the main analyses.
Figure 2.
Statistical significance of differences in occupancy between MDD vs HC, for all the FC states obtained across clustering solutions. The y-axis shows state-level p-values on a logarithmic scale and the x-axis shows the number of FC states K (2–20). Each point represents the p-value for one FC state at a given K. The red horizontal dashed line denotes the nominal significance level p = 0.05; the green dashed curve denotes the within-K Bonferroni threshold p = 0.05/K, shown as a descriptive reference; and the blue horizontal dashed line denotes the global Bonferroni-corrected threshold p = 0.05/209 across all FC states and clustering resolutions, which is the criterion used to define statistical significance in the main analyses.
Figure 3.
Hedges’ g for MDD–HC differences in Fractional Occupancy (FO) by K. The horizontal axis indexes K = 2–20. The vertical axis shows Hedges’ g. Positive values indicate higher FO in MDD; negative values indicate higher FO in HC. Dashed reference lines mark conventional benchmarks for small [≈ 0.2], medium [≈ 0.5], and large [≈ 0.8] effects.
Figure 4.
Spatial characterization of Phase Locking (PL) state overlapping posterior DMN. LEiDA Brain maps display leading-eigenvector spatial weights with strongest loadings in posterior cingulate/precuneus, bilateral angular/inferior parietal, medial prefrontal, and medial/lateral temporal (including hippocampal/parahippocampal) regions.
Figure 5.
Reduced occupancy of posterior DMN state K18C4 in MDD. Boxplots compare FO (%) between groups (MDD 0.052; HC 0.071; p < .001; Hedges’ g = −0.51). Boxes depict the interquartile range; horizontal lines mark medians; whiskers indicate variability; points represent participants. Summary statistics (median and interquartile range) are shown to facilitate distributional interpretation.
Figure 6.
Spatial characterization of Phase Locking (PL) occipito-parieto-temporal state. Brain maps highlight visual cortex (calcarine, cuneus, lingual, fusiform) with concurrent frontoparietal, temporal, and hippocampal engagement.
Figure 6.
Spatial characterization of Phase Locking (PL) occipito-parieto-temporal state. Brain maps highlight visual cortex (calcarine, cuneus, lingual, fusiform) with concurrent frontoparietal, temporal, and hippocampal engagement.
Figure 7.
Increased occupancy of occipito-parieto-temporal state K20C18 in MDD. Boxplots compare Fractional Occupancy (FO) (%) between groups (MDD 0.028; HC 0.022; p < .001; Hedges’ g = 0.42). Boxes denote IQR; medians are horizontal lines; whiskers indicate variability; points represent individuals. Summary statistics (median and interquartile range) are shown to facilitate distributional interpretation.
Figure 8.
Fractional Occupancy (FO) differences by Phase Locking (PL) state. Bars (mean ± 95% CI) indicate relative FO between MDD and HC; significance after multiple-comparisons correction is color coded (blue: p < .001; green: p < .05). Two key findings: reduced FO in a state overlapping posterior DMN (K18C4) for MDD vs. HC, and increased FO in an occipito-parieto-temporal state (K20C18) for MDD vs. HC.
|
Disclaimer/Publisher’s Note: The statements, opinions and data contained in all publications are solely those of the individual author(s) and contributor(s) and not of MDPI and/or the editor(s). MDPI and/or the editor(s) disclaim responsibility for any injury to people or property resulting from any ideas, methods, instructions or products referred to in the content. |
© 2026 by the authors. Licensee MDPI, Basel, Switzerland. This article is an open access article distributed under the terms and conditions of the Creative Commons Attribution (CC BY) license (http://creativecommons.org/licenses/by/4.0/).