1. Introduction
The corneal epithelium functions as a protective barrier and represents the first line of defense against environmental insults and pathogens. Corneal integrity, avascularity, and transparency are essential for maintaining visual acuity. Corneal homeostasis is supported by non-keratinized, non-vascularized corneal epithelial cells, which require continuous renewal mediated by limbal epithelial cells (LECs). These LECs are replenished by quiescent, limbal stem cells (LSCs) residing in the limbal stem cell niche, located at the junction between the cornea and the conjunctiva [
1,
2]. Upon activation, LSCs differentiate into transient amplifying cells that migrate centripetally toward the corneal center, where they proliferate and stratify to regenerate the corneal epithelium, thereby preserving homeostasis, transparency, and avascularity [
3,
4,
5].
Cell fate, renewal, and homeostasis are governed by a complex network of regulatory elements, including transcription factors. Among these, Paired box protein 6 (PAX6) is one of the best-characterized, acting as a master regulator of ocular cell specification and development. Previous studies have shown that Forkhead box C1 (FOXC1) is co-expressed with PAX6 in the human limbus and corneal epithelium, underscoring its complementary role in maintaining epithelial cell identity [
6]. Both FOXC1 and PAX6 reciprocally influence neural crest and ocular development, directing corneal epithelial lineage commitment [
6] and embryonic anterior segment formation [
7]. Loss of either PAX6 or FOXC1 in the limbal stem cell niche disrupts LSC identity, leading to a keratocyte-like phenotype characterized by upregulation of epidermal stratification markers. Recent evidence further suggests that FOXC1 functions as a “shared” transcription factor between LSCs and stromal or keratinocyte lineages, with higher expression levels in LSCs, where it regulates stem cell fate and modulates PAX6 activity [
2].
The Forkhead box family comprises evolutionarily conserved transcription factors characterized by a ~110-amino-acid forkhead (winged-helix) DNA-binding domain, which recognizes the consensus sequence GTAAATAAA. Structural studies have revealed distinct N-terminal transactivation, transcriptional inhibitory, and C-terminal activation domains within FOX proteins [
8]. FOXC1, a member of this family, regulates embryogenesis, cell migration, differentiation, and cell-fate determination by binding specific DNA motifs and interacting with other transcriptional regulators. In the cornea, FOXC1 controls corneal epithelial cell fate, modulates the keratinization switch, and maintains the limbal stem cell niche [
6,
9,
10,
11]. FOXC1 missense mutations, deletions, and duplications are linked to Axenfeld–Rieger syndrome, which presents with corneal neovascularization, anterior segment dysgenesis, and systemic abnormalities such as dental and hearing defects [
12,
13,
14,
15]. Beyond the eye, FOXC1 is expressed in the heart, kidney, leukocytes, and prostate, where it acts as a key regulator of embryonic development, including brain, bone, and the heart [
9,
16,
17]. FOXC1 knockout mice die shortly after birth, exhibiting severe developmental defects and hydrocephalus [
17]. In addition, FOXC1 dysregulation has been extensively studied in the context of tumorigenesis and metastasis [
12]. Initially identified as a key biomarker overexpressed in triple-negative breast cancer and basal-like breast cancer [
18], FOXC1 has since, been also recognized as an important regulator of transcriptional activation and repression, translation, post-translational modification.
Congenital aniridia is a pan-ocular disorder characterized by partial or complete iris hypoplasia, cataract, foveal and optic nerve underdevelopment, and nystagmus. Between others, pathogenic variants in PAX6, FOXC1, PITX2, CYP1B1, FOXD3 and TRIM44 have been identified in affected patients [
19] Classical aniridia is caused by heterozygous mutations in PAX6 on chromosome 11p13, whereas aniridia-associated keratopathy (AAK) can also involve FOXC1, PITX2, and CYP1B1 pathogenic variants. Nuclear transcription factors such as PAX6 and FOXC1 regulate LSC identity and fate by binding to regulatory enhancer elements, and their dysfunction contributes to limbal stem cell deficiency (LSCD). FOXC1-related aniridia, mapped to chromosome 6p25 [
20], functions downstream of PAX6 and TGF-β signaling [
10].
Beyond genetic variants, the ocular surface of aniridia patients exhibits a pro-inflammatory microenvironment. Proteomic analysis of tear fluid has revealed elevated levels of cytokines (CCL3, IL-1β, IL-9, IL-17A) and inflammatory mediators such as eotaxin, bFGF/FGF2, and VEGFA. A disrupted ratio between the anti-inflammatory IL-1RA and pro-inflammatory IL-1β further indicated a shift toward chronic inflammation in aniridia [
21,
22].
In this study, we investigated the previously uncharacterized effects of FOXC1 knockdown on gene and protein levels in human primary LECs (pLECs). To replicate inflammatory conditions in vitro, inflammation was induced using lipopolysaccharide (LPS) and interleukin-1β (IL-1β), to assess the effects of inflammation on FOXC1 siRNA knockdown in pLECs.
2. Results
2.1. FOXC1 mRNA and Proteins Levels in pLECs
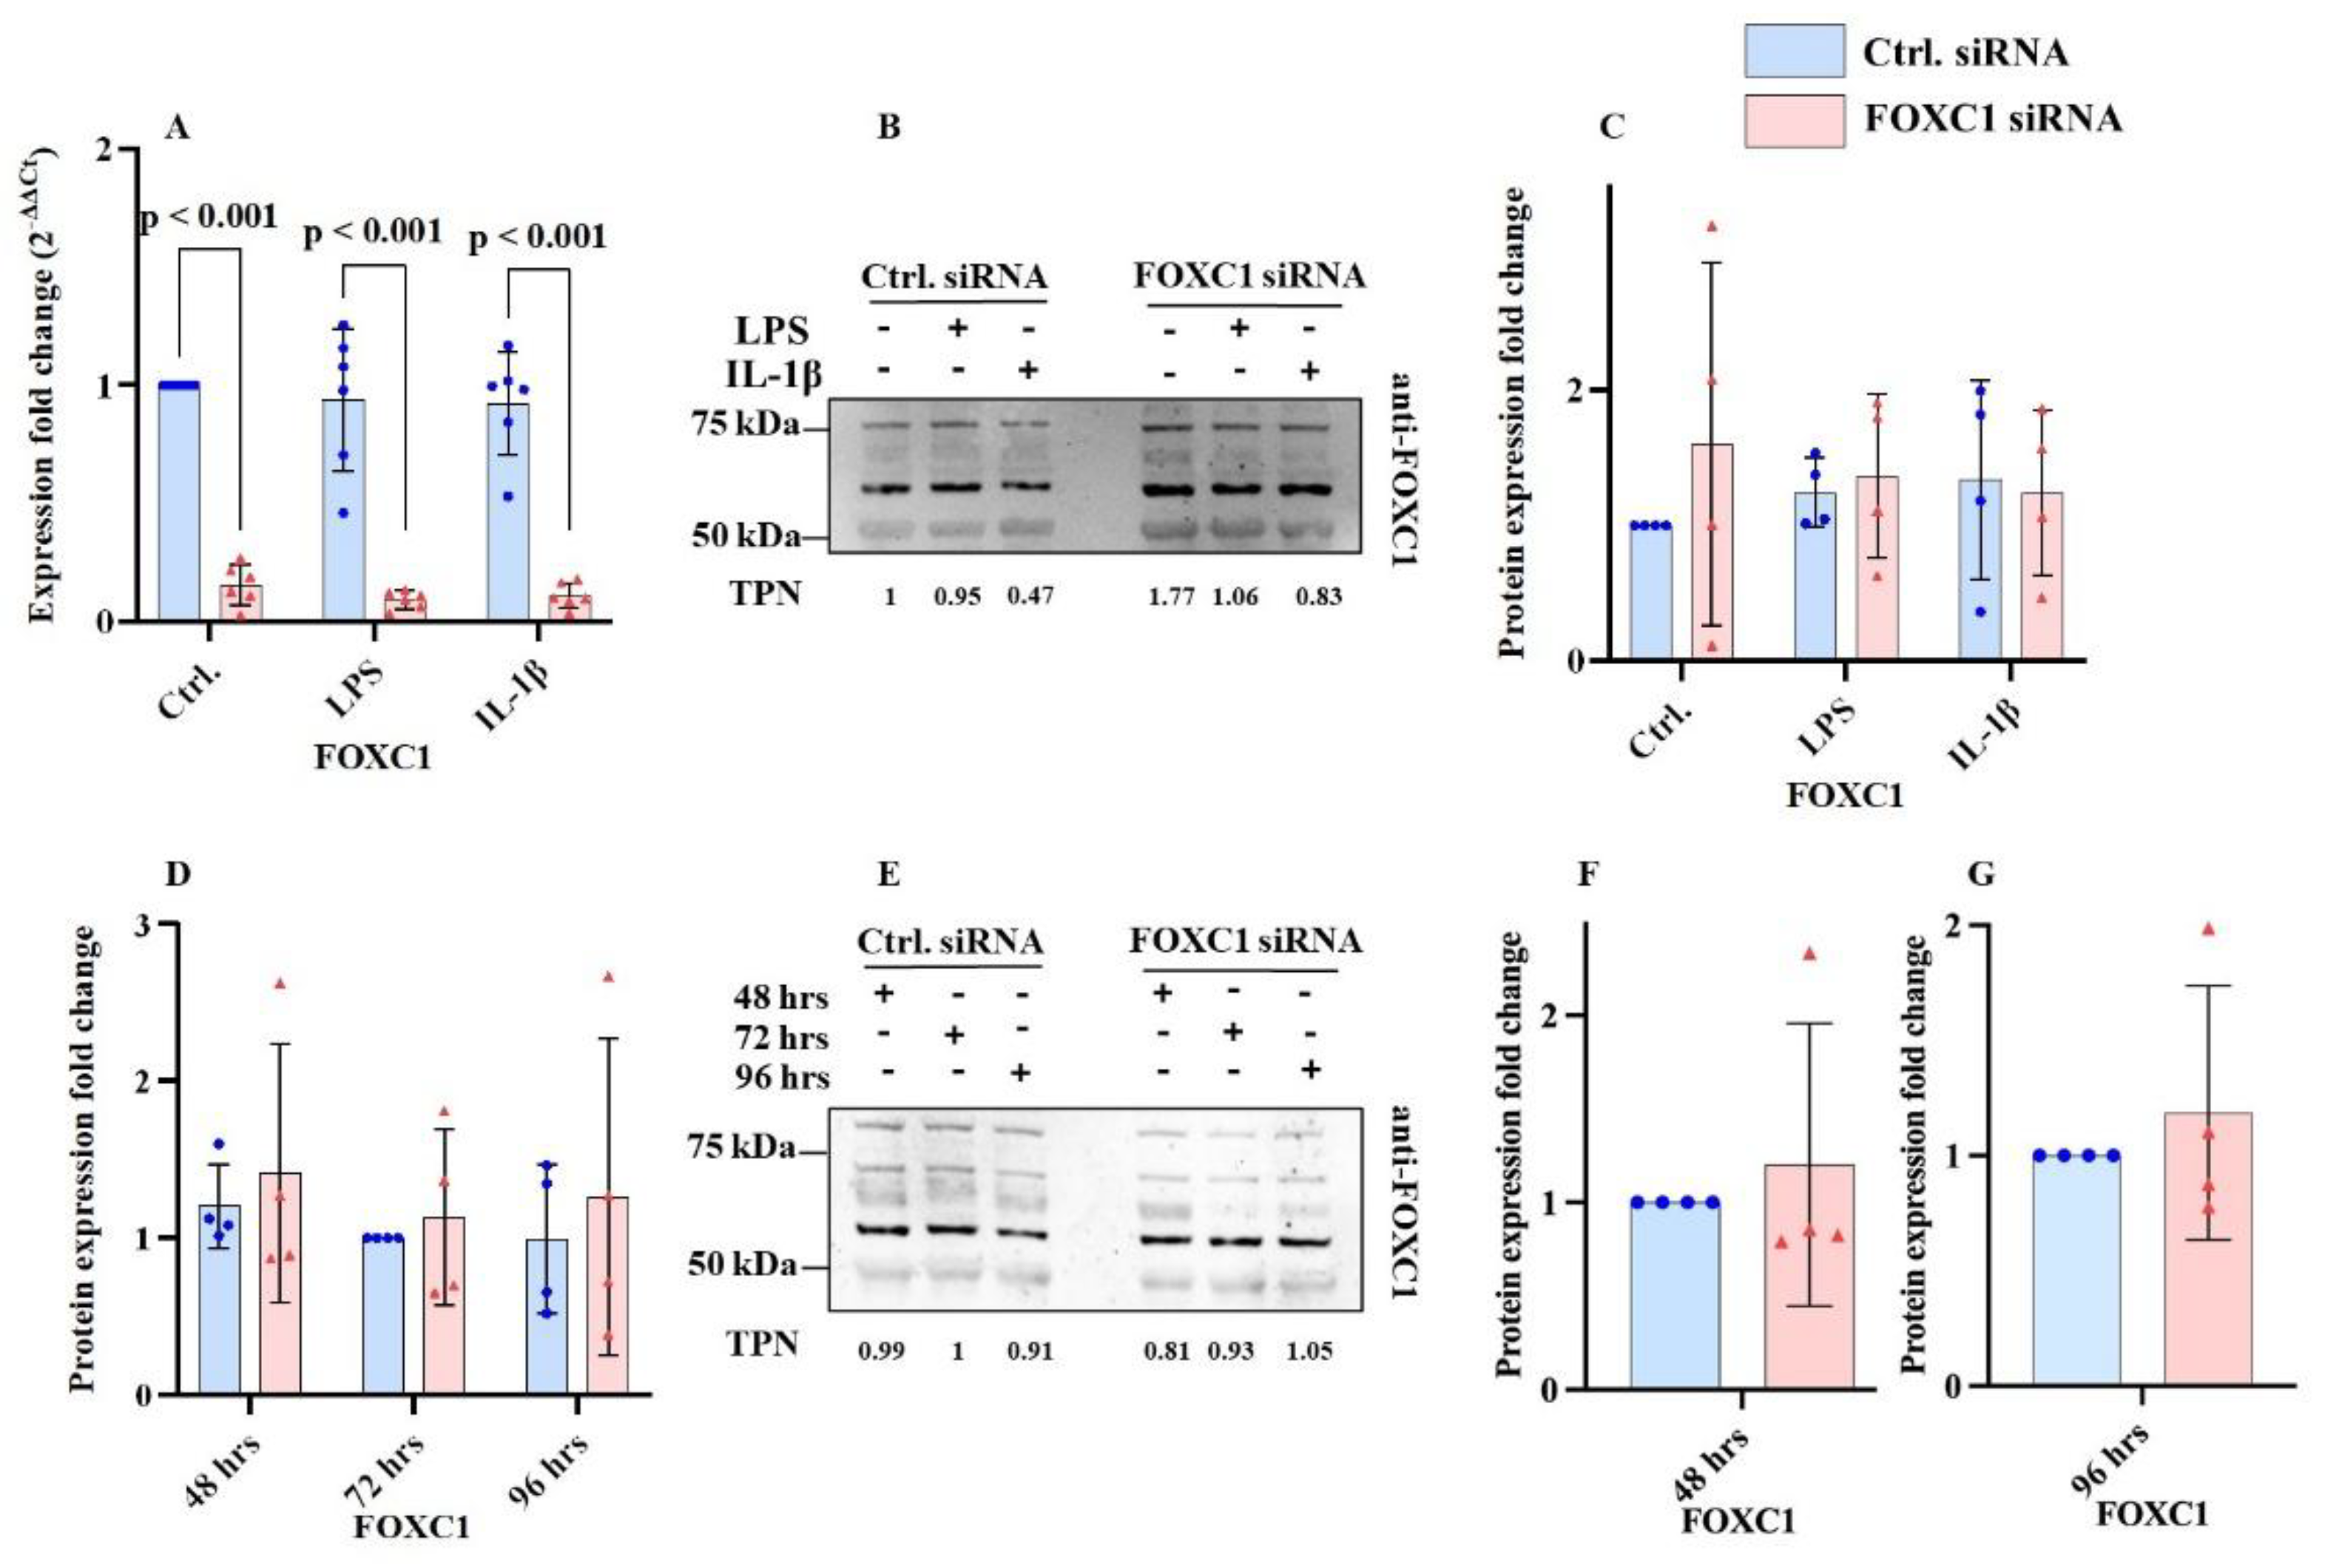
FOXC1 mRNA level was significantly reduced following FOXC1 siRNA knockdown compared with siRNA controls, both without inflammation (p<0.001) and after induction of inflammation with LPS or IL-1β (p<0.001). In contrast, FOXC1 protein levels did not differ significantly between FOXC1 siRNA-treated and control siRNA-treated cells, regardless of inflammatory stimulation (LPS or IL-1β) across all treatment groups (p≥0.423) (
Figure 1A–C).
FOXC1 protein level was analyzed at 48-, 72-, and 96-hours post-transfection. No significant differences were detected compared with siRNA controls at any time point (p≥0.189, respectively) (
Figure 1D,E and
Supplementary Figure S1A,B). Similarly, direct comparison between FOXC1 siRNA knockdown and siRNA control samples at 48- and 96-hours post-transfection using a paired two-tailed t-test revealed no significant changes (p≥0.199) (
Figure 1F,G).
FOXC1 mRNA levels were significantly lower following FOXC1 siRNA knockdown compared to siRNA controls without (p < 0.001) and with induced inflammation (either LPS or IL-1β treatment; p<0.001). However, FOXC1 protein levels were not changed significantly after FOXC1 siRNA knockdown compared to siRNA controls (p≥0.423) without or with LPS or IL-1β induced inflammation with any of the groups (A-C).
FOXC1 proteins levels (FOXC1 antibody from Proteintech) were tested at intervals of 48, 72 and 96 hours after FOXC1 siRNA knockdown without significant change to the outcome compared to siRNA controls measured at same time points (p≥0.639; p≥0.764; p≥0.552 for 48, 72, and 96 hours respectively) (
D, E). Comparing FOXC1 siRNA knockdown to siRNA controls at 48 hours and 96 hours after transfection, with paired two-tailed t-test showed no significant changes (p≥0.199) (
F, G). Western blots probed with anti-FOXC1 antibodies from additional sources (R&D Biotechne) have been included in
Supplementary Figure S1.
2.2. Cytokeratin mRNA and Protein Levels in pLECs
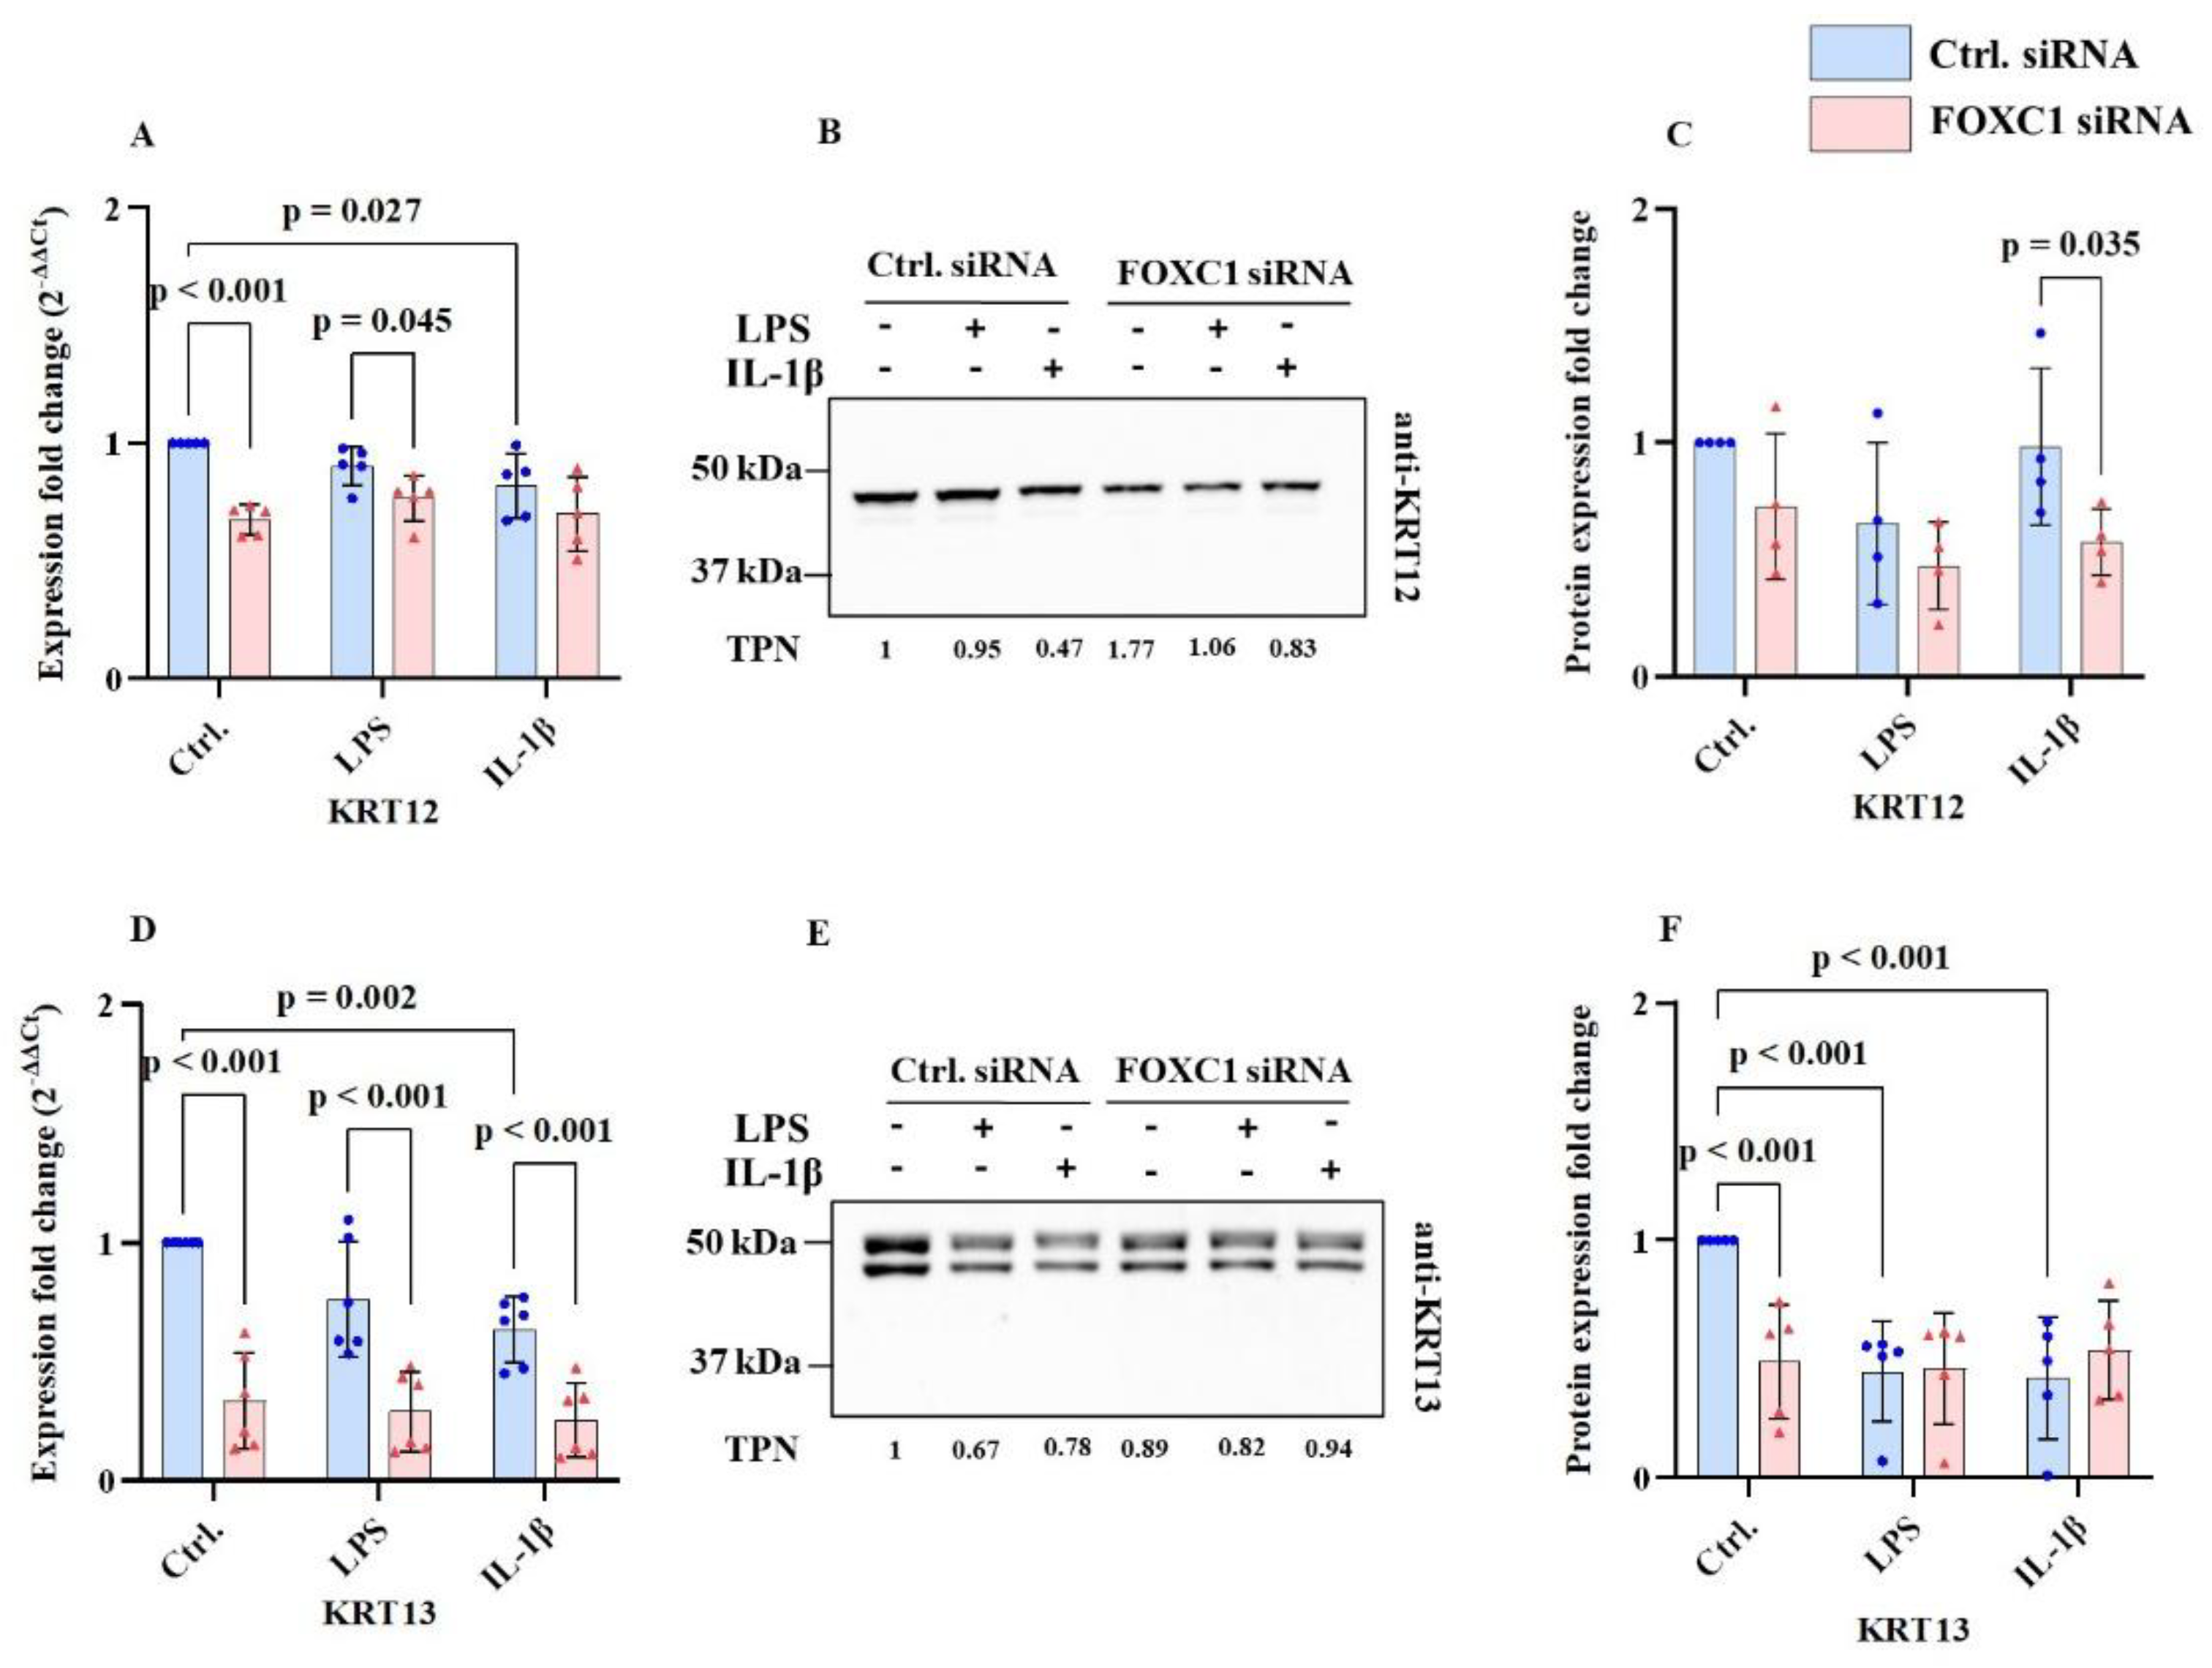
Cytokeratin mRNA and protein levels are shown at
Figure 2A-H. KRT12 (cytokeratin 12) mRNA level was significantly reduced following FOXC1 siRNA knockdown compared with siRNA controls, both without and with LPS-induced inflammatory conditions (p<0.001). In addition, KRT12 mRNA levels were lower in IL-1β–treated siRNA control cells compared with controls without inflammatory stimuli (p=0.027) (
Figure 2A). Consistently, KRT12 protein level was downregulated in FOXC1 knockdown pLECs compared to siRNA controls under IL-1β–induced inflammation (p=0.035) (
Figure 2B,C).
Similarly, KRT13 (cytokeratin 13) mRNA level was significantly reduced in FOXC1 knockdown LECs relative to siRNA controls in all groups, with or without LPS or IL-1β stimulation (p<0.001). In control siRNA-transfected cells, IL-1β also led to a significant reduction in KRT13 mRNA levels compared to cells without inflammatory stimuli (p=0.002) (
Figure 2D). At the protein level, KRT13 was significantly downregulated in FOXC1 knockdown pLECs without inflammatory stimuli (p<0.001). In addition, LPS or IL-1β–induced inflammation significantly reduced KRT13 protein level in control siRNA knockdown pLECs (p<0.001) (
Figure 2E,F).
In contrast, KRT3 (cytokeratin 3) and KRT19 (cytokeratin 19) mRNA levels remained unchanged across all treatment groups, irrespective of inflammatory stimulation (p≥0.179) (
Figure 2G,H).
KRT12 mRNA levels were significantly downregulated following FOXC1 siRNA knockdown compared to siRNA controls, with and without LPS-induced inflammation (p≥0.001). Additionally, KRT12 mRNA levels were significantly lower in IL-1β induced inflammation in control siRNA-transfected cells compared to non-inflamed conditions (p=0.027). (A) In FOXC1 knockdown pLECs, KRT12 protein levels are downregulated compared to siRNA controls with IL-1β induced inflammation (p=0.035) (B, C). KRT13 mRNA levels were downregulated in FOXC1 knockdown pLECs compared to siRNA controls without and with LPS or IL-1β (p<0.001). KRT13 mRNA levels were significantly lower in IL-1β induced inflammation in control siRNA-transfected cells compared to non-inflamed conditions (p=0.002) (D). KRT13 protein levels were significantly downregulated in FOXC1 knockdown pLECs compared to siRNA controls without inflammation (p<0.001). Additionally, KRT13 protein levels were significantly lower in LPS or IL-1β induced inflammation in control siRNA-transfected cells compared to non-inflamed conditions (p<0.001) (E, F). In contrast, KRT3, and KRT19 mRNA levels did not show significant changes between any of the groups, without or will inflammatory treatment (p≥0.179) (G, H).
2.3. Interleukin mRNA and Protein Levels in pLECs
Interleukin mRNA and protein levels are displayed at
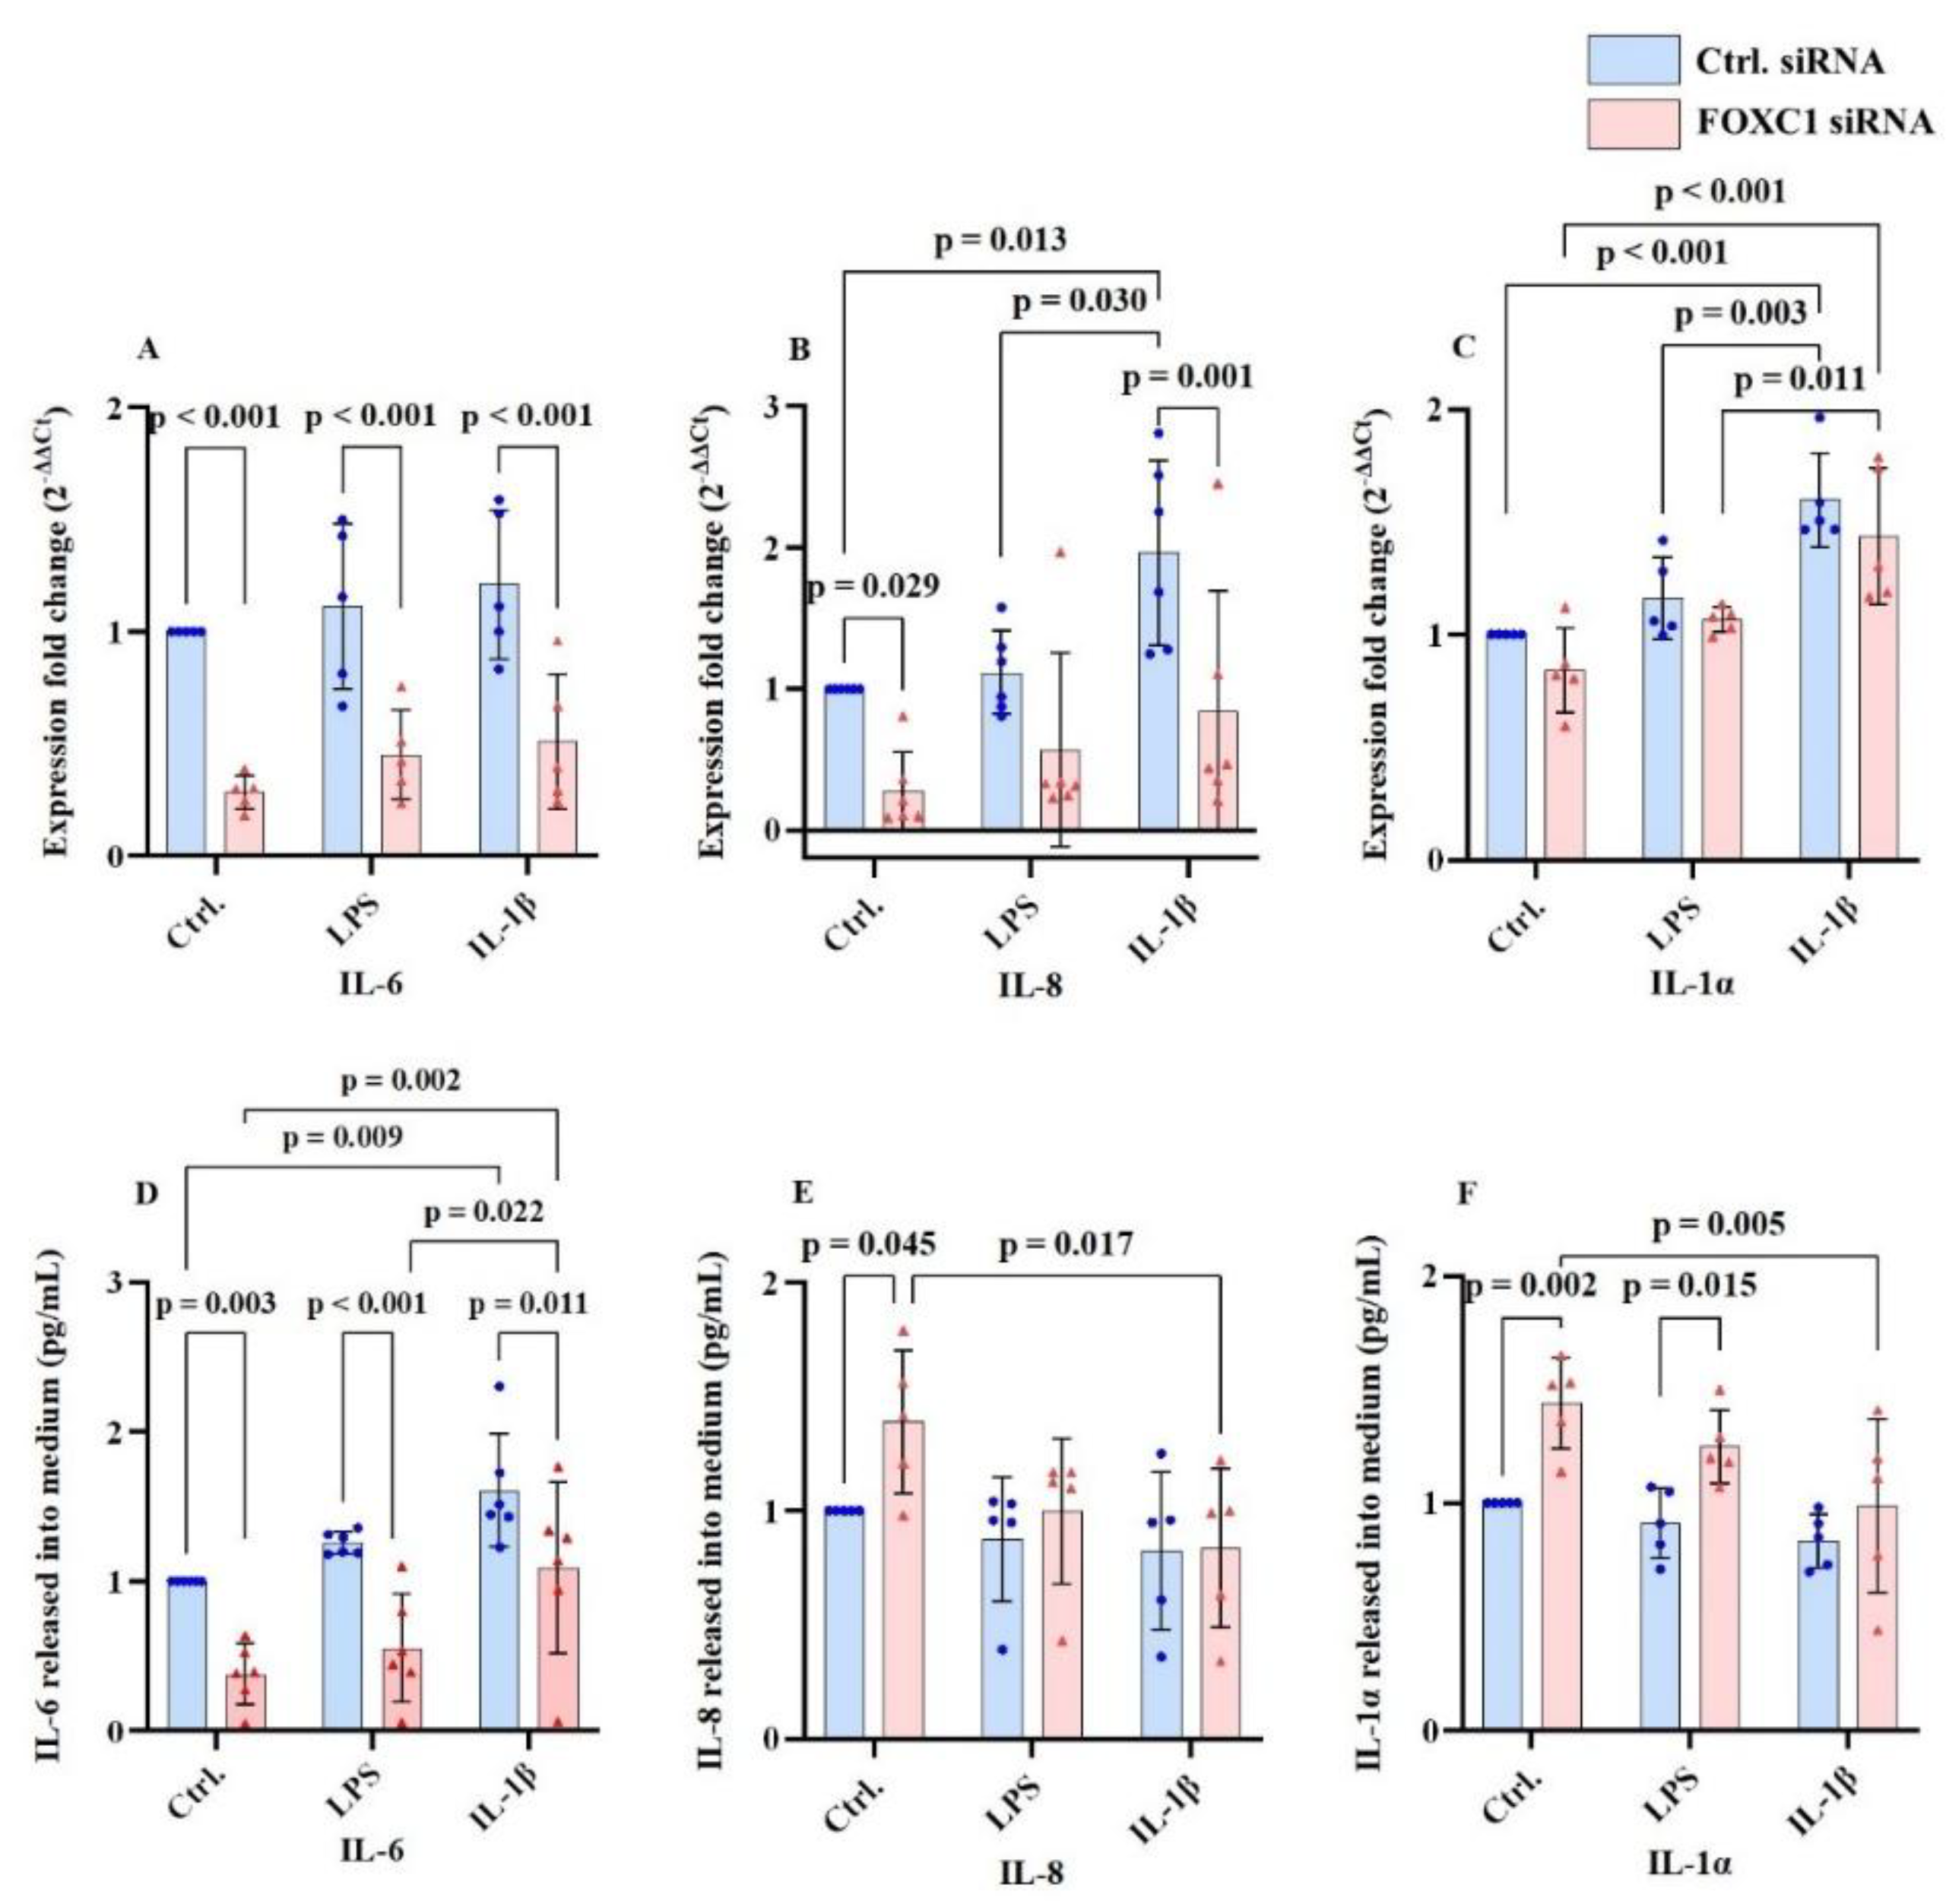
Figure 3A-F. FOXC1 siRNA knockdown significantly reduced pre/pro-inflammatory cytokine interleukin-6 (IL-6) mRNA and protein both without and with inflammatory conditions (LPS or IL-1β) compared with siRNA controls (p≤0.011). However, in FOXC1 knockdown pLECs treated with IL-1β, IL-6 protein level was significantly higher than in cells exposed to LPS (p=0.022) or cells without conditions (p=0.002). Similarly, IL-6 protein levels were elevated in control siRNA pLECs after IL-1β stimulation compared with cells without inflammatory stimuli (p=0.009) (
Figure 3A,D).
Pro-inflammatory cytokine interleukin-8 (IL-8); also known as chemokine C-X-C motif ligand 8 (CXCL8) mRNA level was downregulated following FOXC1 knockdown both without inflammatory stimuli and in IL-1β-treated conditions compared with siRNA controls (p≤0.029). In contrast, IL-8 mRNA was upregulated in control siRNA LECs with IL-1β stimulation compared to non-inflammatory conditions (p=0.013) and LPS-induced inflammation (p=0.030). At the protein level, FOXC1 knockdown increased IL-8 level under non-inflammatory conditions (p=0.045), but IL-8 protein was reduced in IL-1β-treated knockdown cells compared with untreated pLECs (p=.017) (
Figure 3B,E).
In control siRNA pLECs, pro-inflammatory cytokine interleukin 1α (IL-1α) mRNA was elevated under both LPS and IL-1β treatment compared to untreated controls (p≤0.003). For IL-1α, in FOXC1 knockdown pLECs, IL-1β stimulation resulted resulted in higher mRNA levels compared with non-inflammatory or LPS induced conditions (p≤0.011). IL-1α protein levels were significantly upregulated after FOXC1 knockdown compared with siRNA controls under basal (p=0.002) and LPS-treated (p=0.015) conditions. Interestingly, in FOXC1 knockdown pLECs, IL-1α protein levels were significantly lower in IL-1β-treated cells, than in those without inflammatory stimuli (p=0.005) (
Figure 3C,F).
FOXC1 siRNA knockdown downregulated IL-6 mRNA and proteins levels in cell culture supernatant without and with LPS or IL-1β compared to siRNA controls (p≤0.011). In addition, in FOXC1 siRNA knockdown pLECs, with IL-1β treatment, IL-6 protein levels were higher than in those without and with LPS treatment (p≥0.002). IL-6 proteins levels were upregulated in FOXC1 siRNA knockdown pLECs with IL-1β induced inflammation compared to LPS induced inflammation (p=0.022), and non-inflammatory conditions (p=0.002). Also, in control siRNA treatedp pLECs, with IL-1β induced inflammation, IL-6 was upregulated compared to non-inflammatory condition (p=0.009) (A, D). FOXC1 siRNA knockdown downregulated IL-8 mRNA levels compared to siRNA controls without and with IL-1β treatment (p≤0.029). Additionally, IL-8 mRNA level was upregulated in siRNA controls with IL-1β treatment compared to LPS induced inflammation (p=0.030) and non-inflammatory conditions (p=0.013). FOXC1 knockdown in pLECs upregulated IL-8 protein levels in cell culture supernatant compared to siRNA controls without inflammatory treatment (p=0.045). Also, in FOXC1 knockdown pLECs with IL-1β treatment, IL-8 protein levels were downregulated compared to non-inflammatory treated pLECs (p=0.017) (B, E). FOXC1 siRNA knockdown upregulated IL-1α mRNA levels in IL-1β treated pLECs compared to LPS treated or non-inflammatory condition (p≤0.011). Also, IL-1α mRNA levels were upregulated in siRNA controls with LPS or IL-1β induced inflammation compared to non-inflammatory conditions (p≤0.003). FOXC1 knockdown upregulated IL-1α protein levels in cell culture supernatant compared to siRNA controls without induced inflammatory treatment (p=0.002), and in LPS treated pLECs (p=0.015). Additionally, FOXC1 knockdown upregulated IL-1α protein levels in pLECs without inflammatory treatment compared to IL-1β treated cells (p=0.005) (C, F).
2.4. Chemokine Ligand mRNA and Protein Levels in pLECs
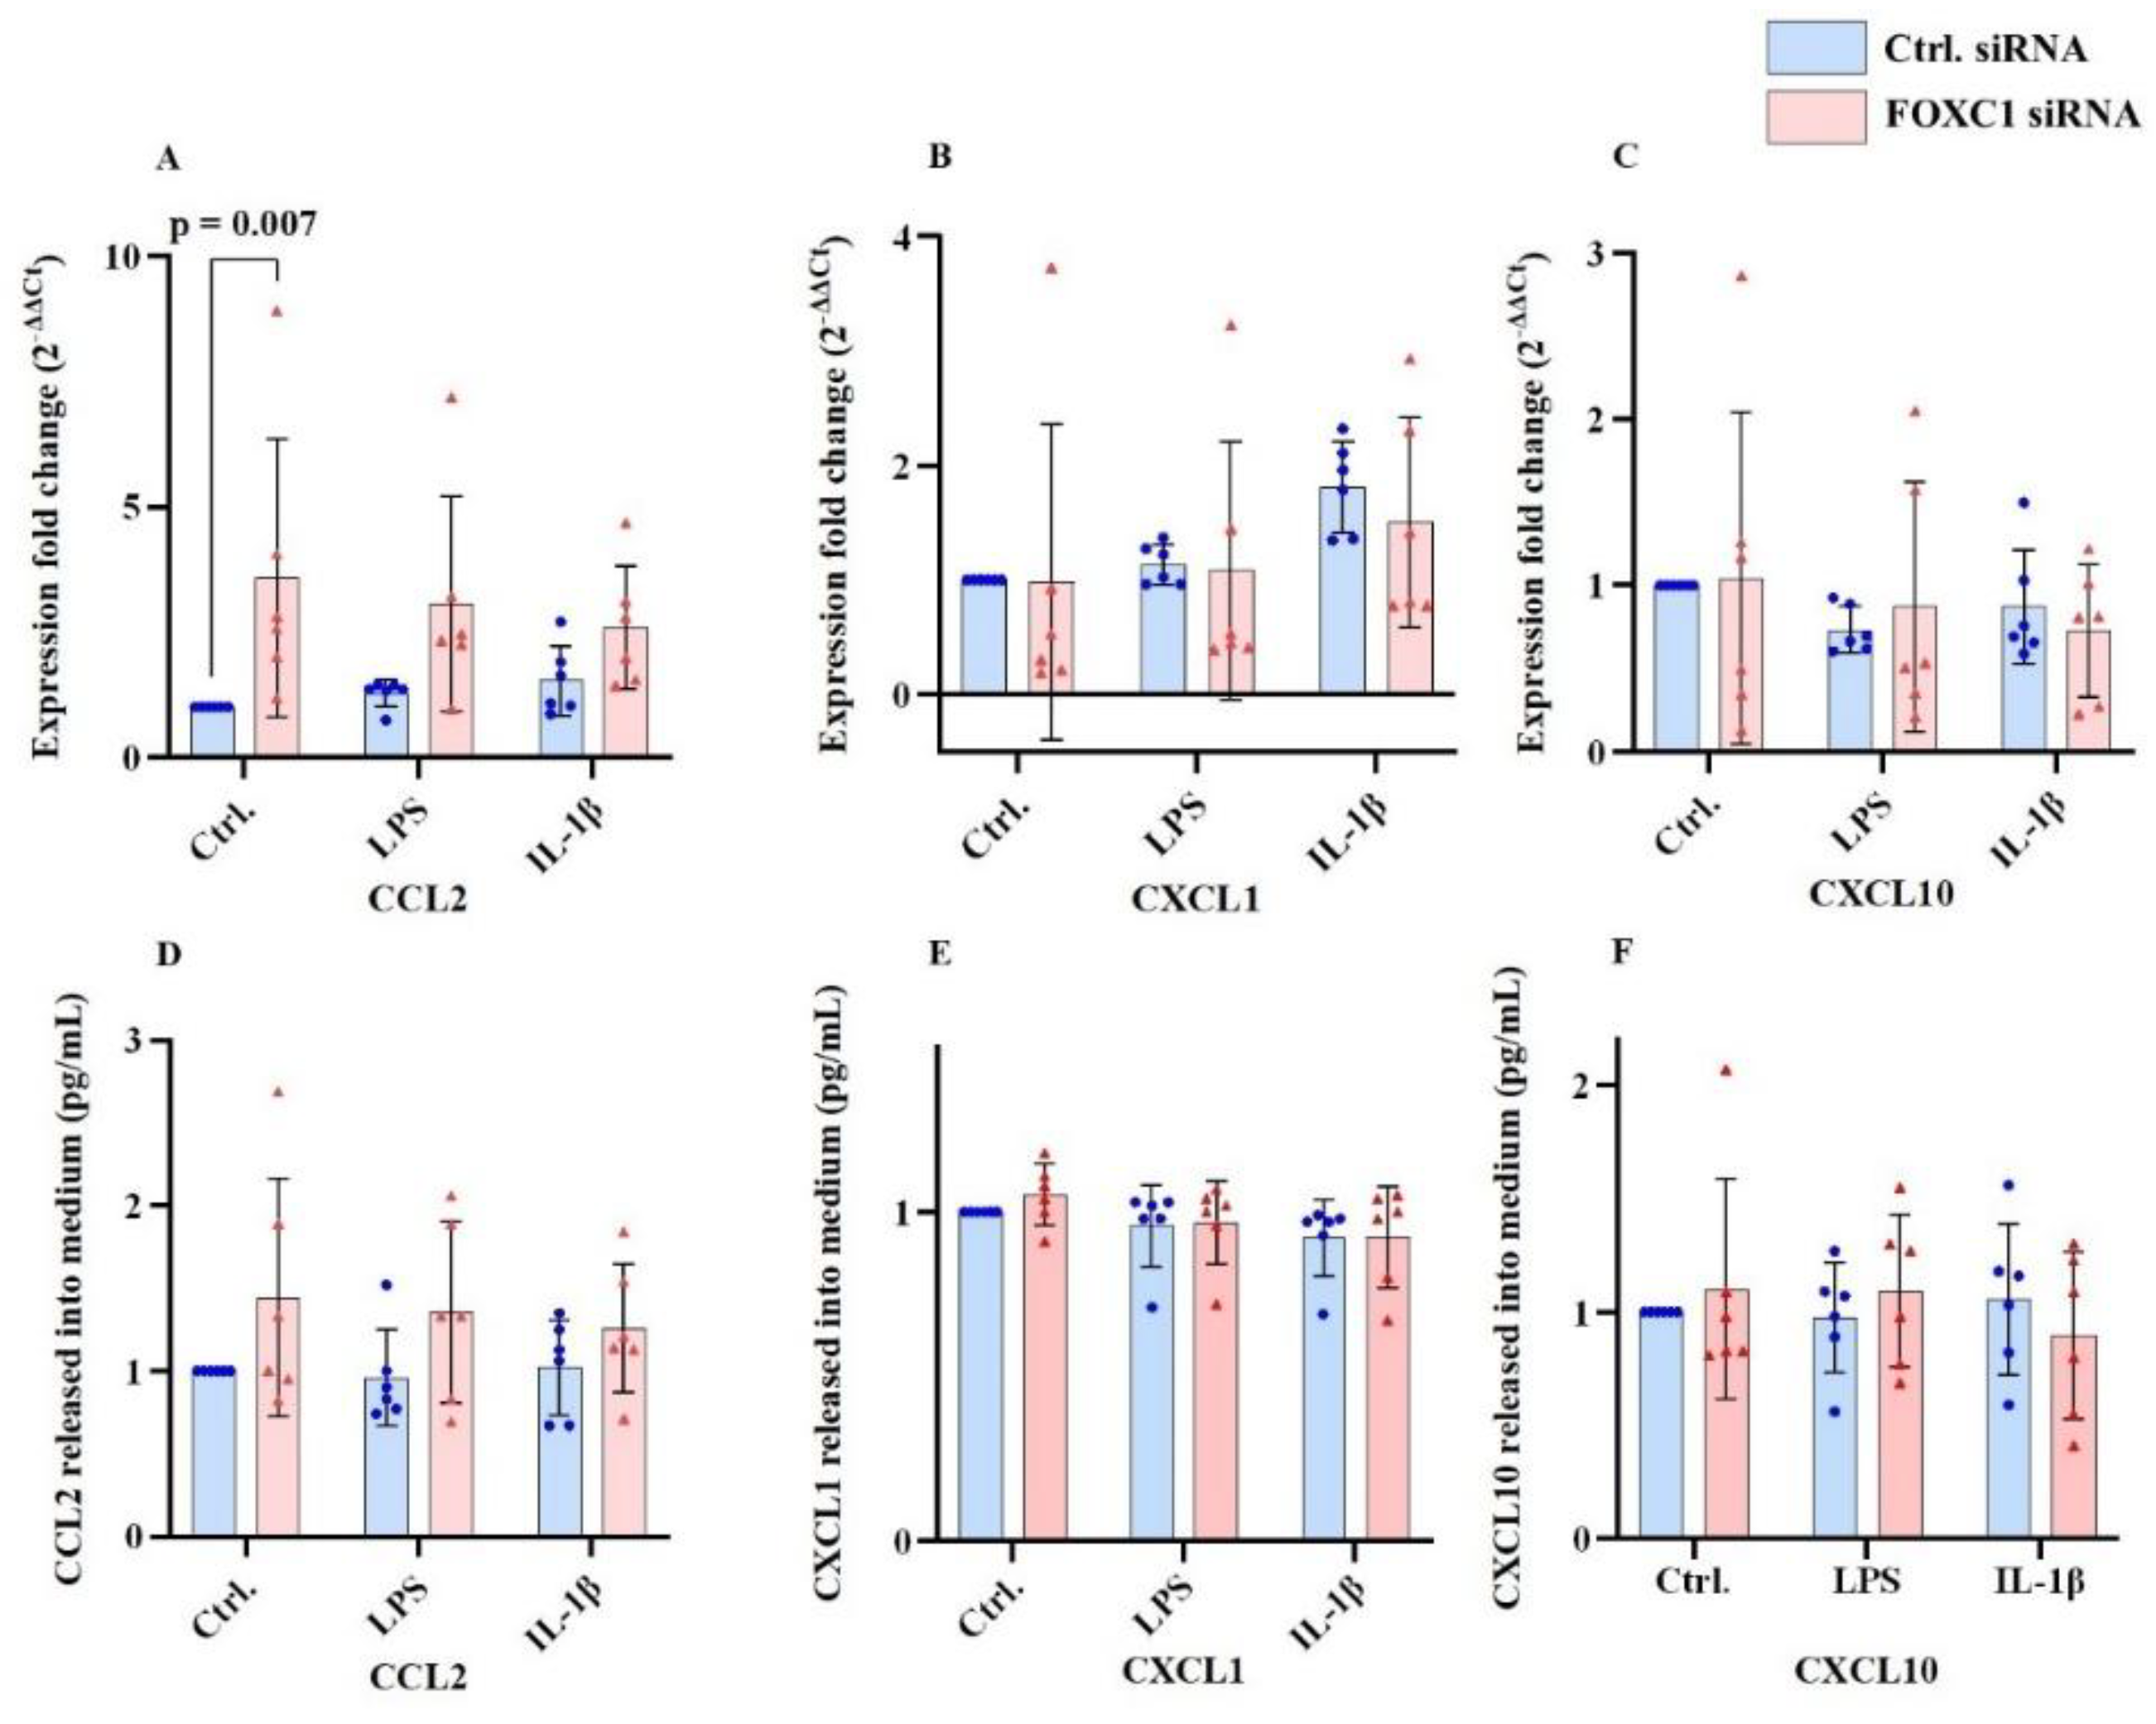
Chemokines of the C-C motif ligand family, C-C motif chemokine ligand 2 (CCL2), C-C motif chemokine ligand 1 (CCL1), and C-C motif chemokine ligand 10 (CCL10) levels are shown at
Figure 4A-F. CCL10 is also known as macrophage inflammatory protein-1γ (MIP-γ). FOXC1 siRNA knockdown in pLECs under non-inflammatory conditions (without LPS or IL-1β) significantly upregulated CCL2 mRNA level (p=0.007), whereas CCL2 protein levels in the culture supernatant remained unchanged (p≥0.127) (
Figure 4A,D). In contrast, CXCL1 and CXCL10 mRNA and protein levels showed no significant differences following FOXC1 knockdown, either under basal or inflammatory conditions (p≥0.525) (
Figure 4B,E;C,F).
FOXC1 siRNA knockdown in pLECs without inflammatory treatment (LPS or IL-1β) upregulated CCL2 at the mRNA level (p=0.007) but not at the protein level in the cell culture supernatant (p≥0.127) (A, D). CXCL1, CXCL10 mRNA, and protein levels in cell culture supernatant did not change significantly following FOXC1 siRNA knockdown without or with LPS or IL-1β treatment between any of the groups (p≥0.525) (B, C, E, F).
2.5. VEGFA, TNF-α and TGF-β mRNA and Proteins Levels in pLECs
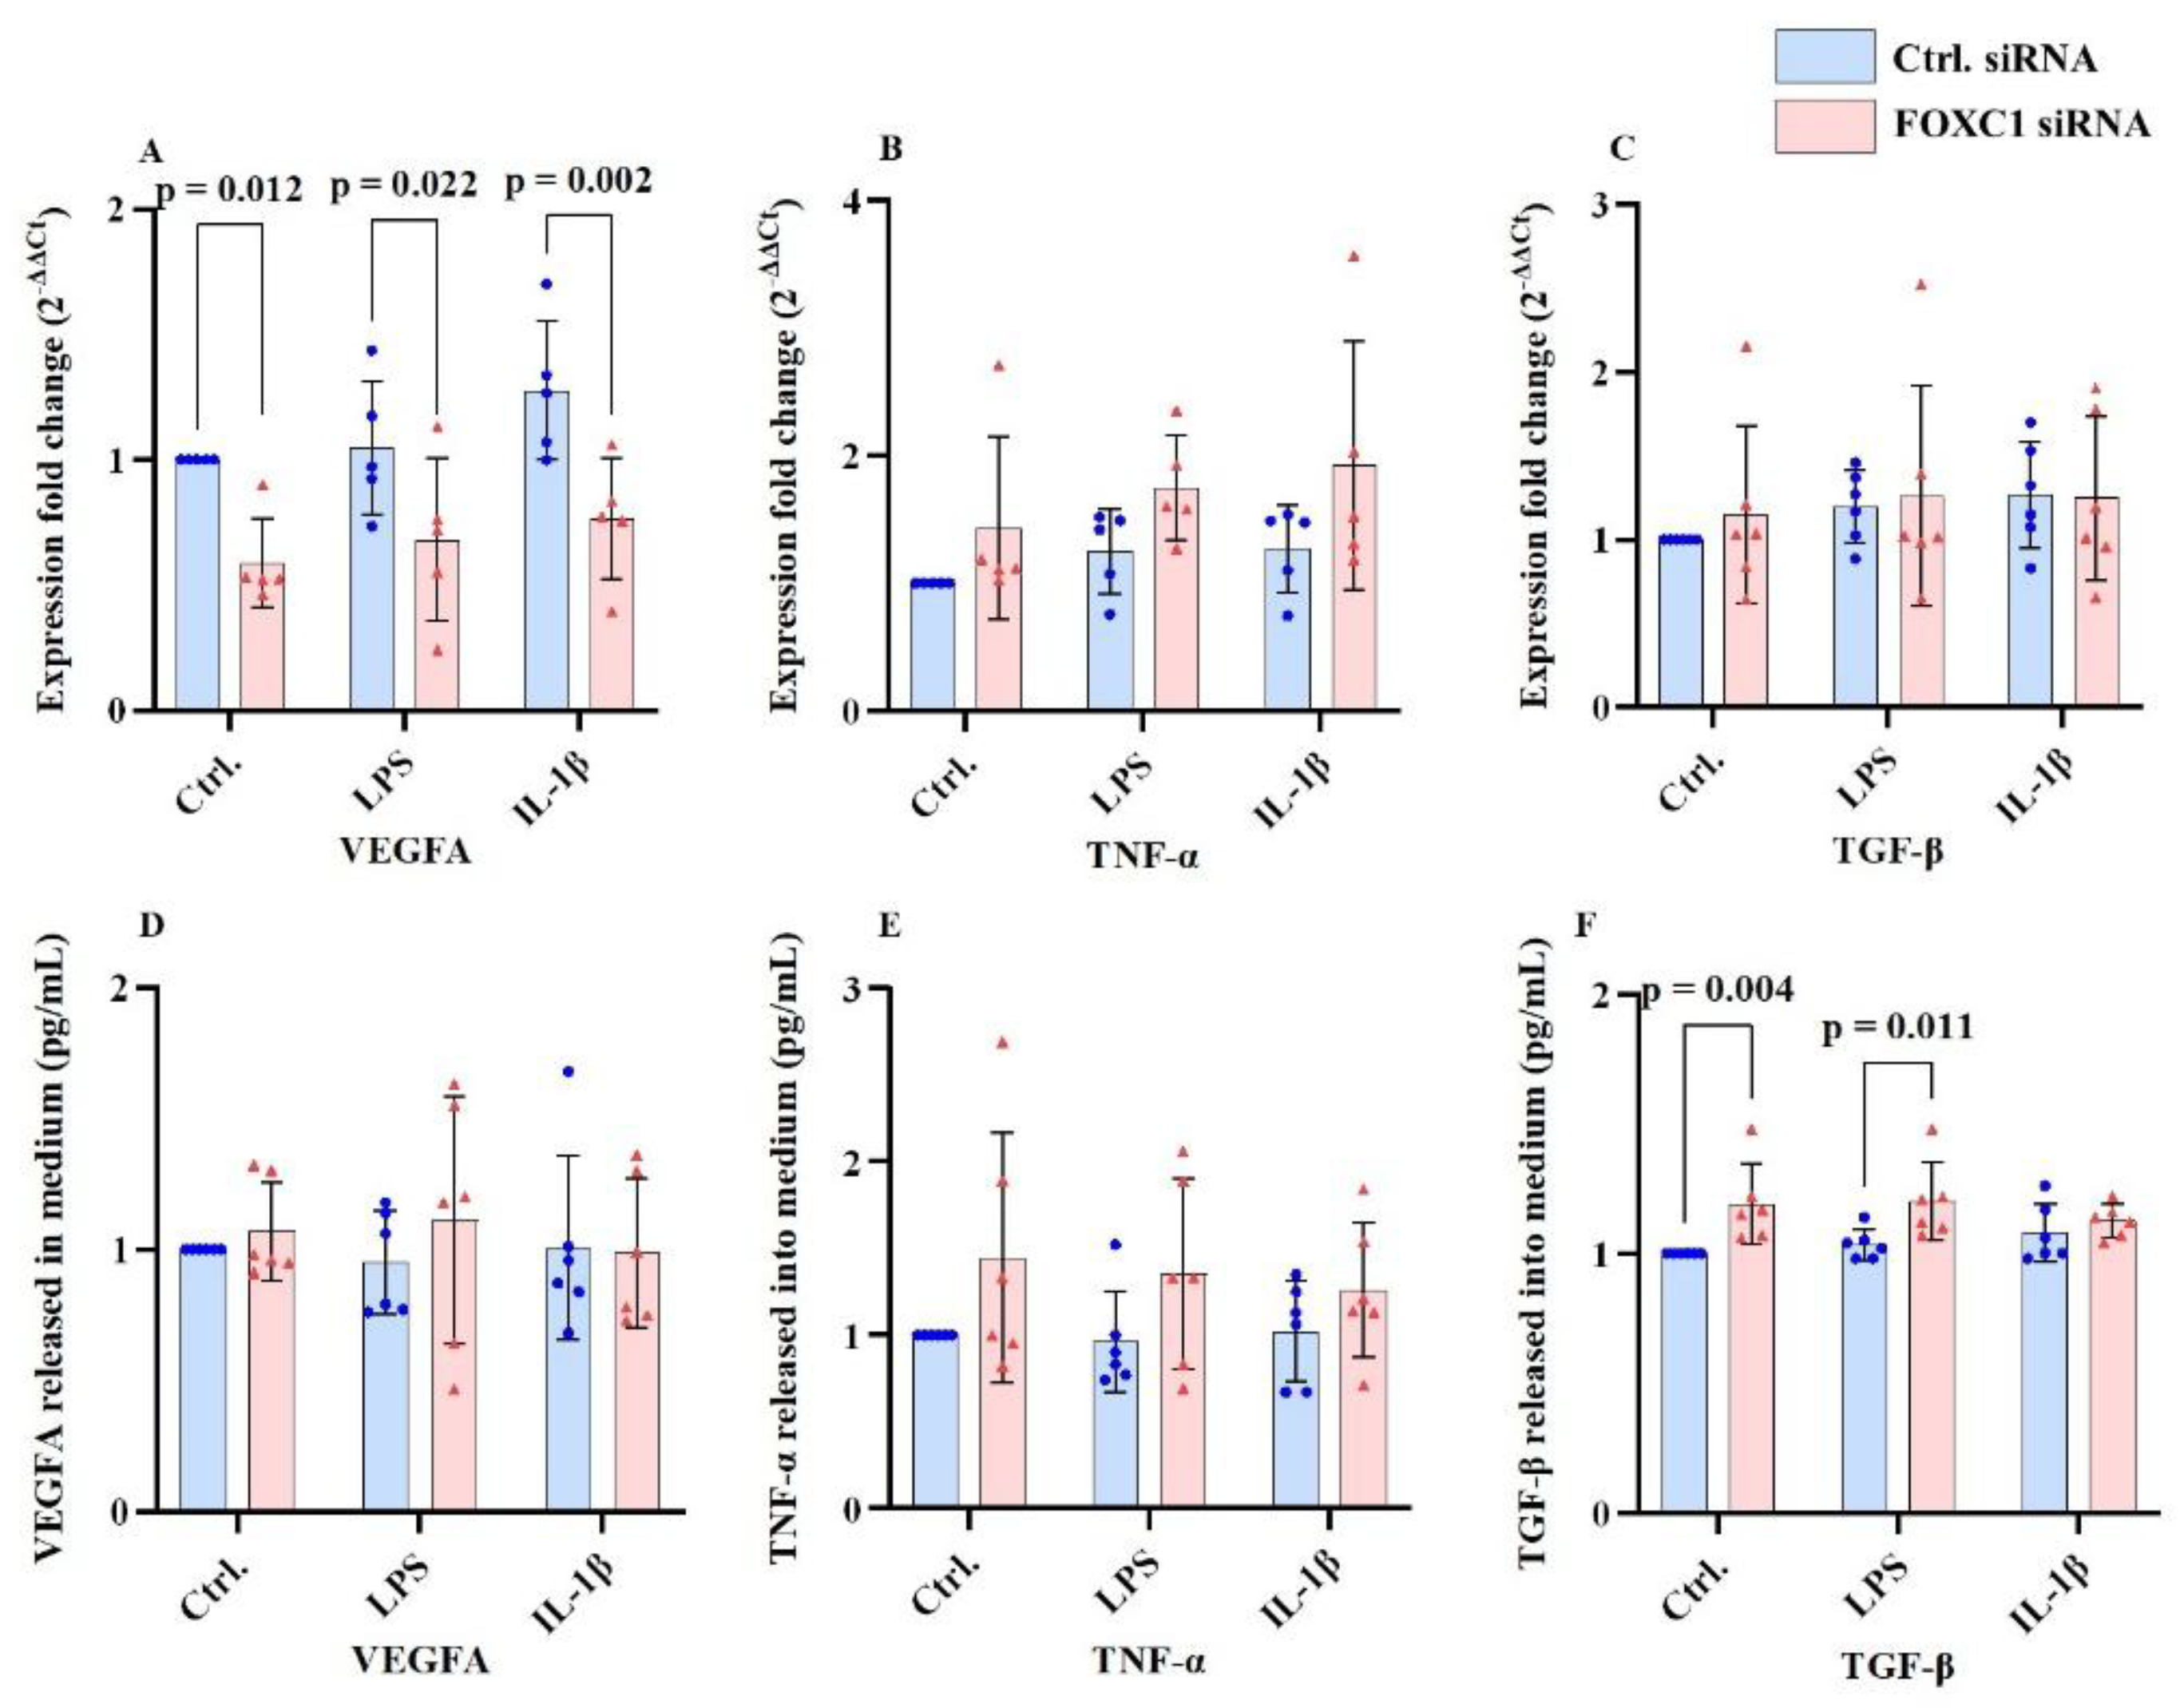
The growth factor, vascular endothelial growth factor A (VEGFA), pro-inflammatory chemokine tumor necrosis factor A (TNF-α) and, cytokine transforming growth factor β (TGF-β) mRNA and proteins levels are shown at
Figure 5A-F. FOXC1 siRNA knockdown significantly reduced VEGFA mRNA level compared with siRNA controls under basal (p=0.012), LPS-treated (p=0.022), and IL-1β-treatment conditions (p=0.002) (
Figure 5A). However, VEGFA protein levels in the culture supernatant were not significantly affected by FOXC1 knockdown under any condition (p≥0.339) (
Figure 5D).
Similarly, TNF-α mRNA (p≥0.076) and protein levels (p≥0.086) remained unchanged between FOXC1 knockdown and control cells (
Figure 5B,E), as did TGF-β mRNA level (p≥0.544) (
Figure 5C). In contrast, TGF-β protein levels were significantly upregulated in FOXC1 knockdown LECs under non-inflammatory (p=0.004) and LPS-treated conditions (p=0.011), but not after IL-1β stimulation (p=0.449) (
Figure 5F).
FOXC1 siRNA knockdown significantly reduced VEGFA mRNA levels compared to siRNA controls under non-inflammatory conditions (p=0.012) as well as after LPS (p=0.022) or IL-1β treatment (p=0.002) (A). In contrast, FOXC1 knockdown did not significantly affect VEGFA protein levels in the culture supernatant under any condition, with or without LPS or IL-1β stimulation (p≥0.339) (D). Similarly, FOXC1 knockdown did not alter TNF-α mRNA (p≥0.076) or protein levels (p≥0.086) in the culture supernatant (B, E), nor did it affect TGF-β mRNA expression (p≥0.544) (C). However, FOXC1 siRNA knockdown led to a significant increase in TGF-β protein levels under non-inflammatory (p=0.004) and LPS-treated conditions (p=0.011) but not following IL-1β stimulation (p=0.449) (F).
2.6. CYP1B1 and PAX6 mRNA and Proteins Levels in pLECs
Figure 6A-F display; cytochrome P450 family 1 subfamily B1 (CYP1B1) and paired box 6 (PAX6) mRNA and protein levels. FOXC1 siRNA knockdown significantly reduced CYP1B1 mRNA level compared with siRNA controls under basal, LPS, and IL-1β-treated conditions (p<0.001). In contrast, CYP1B1 protein levels remained unchanged following FOXC1 knockdown in all groups (p≥0.268) (
Figure 6A–C).
Using LPS treatment, PAX6 mRNA level was significantly downregulated in FOXC1 knockdown LECs compared with siRNA controls (p=0.023). However, PAX6 protein levels did not differ significantly between groups, either without or with inflammatory conditions (p≥0.393) (
Figure 6D–F).
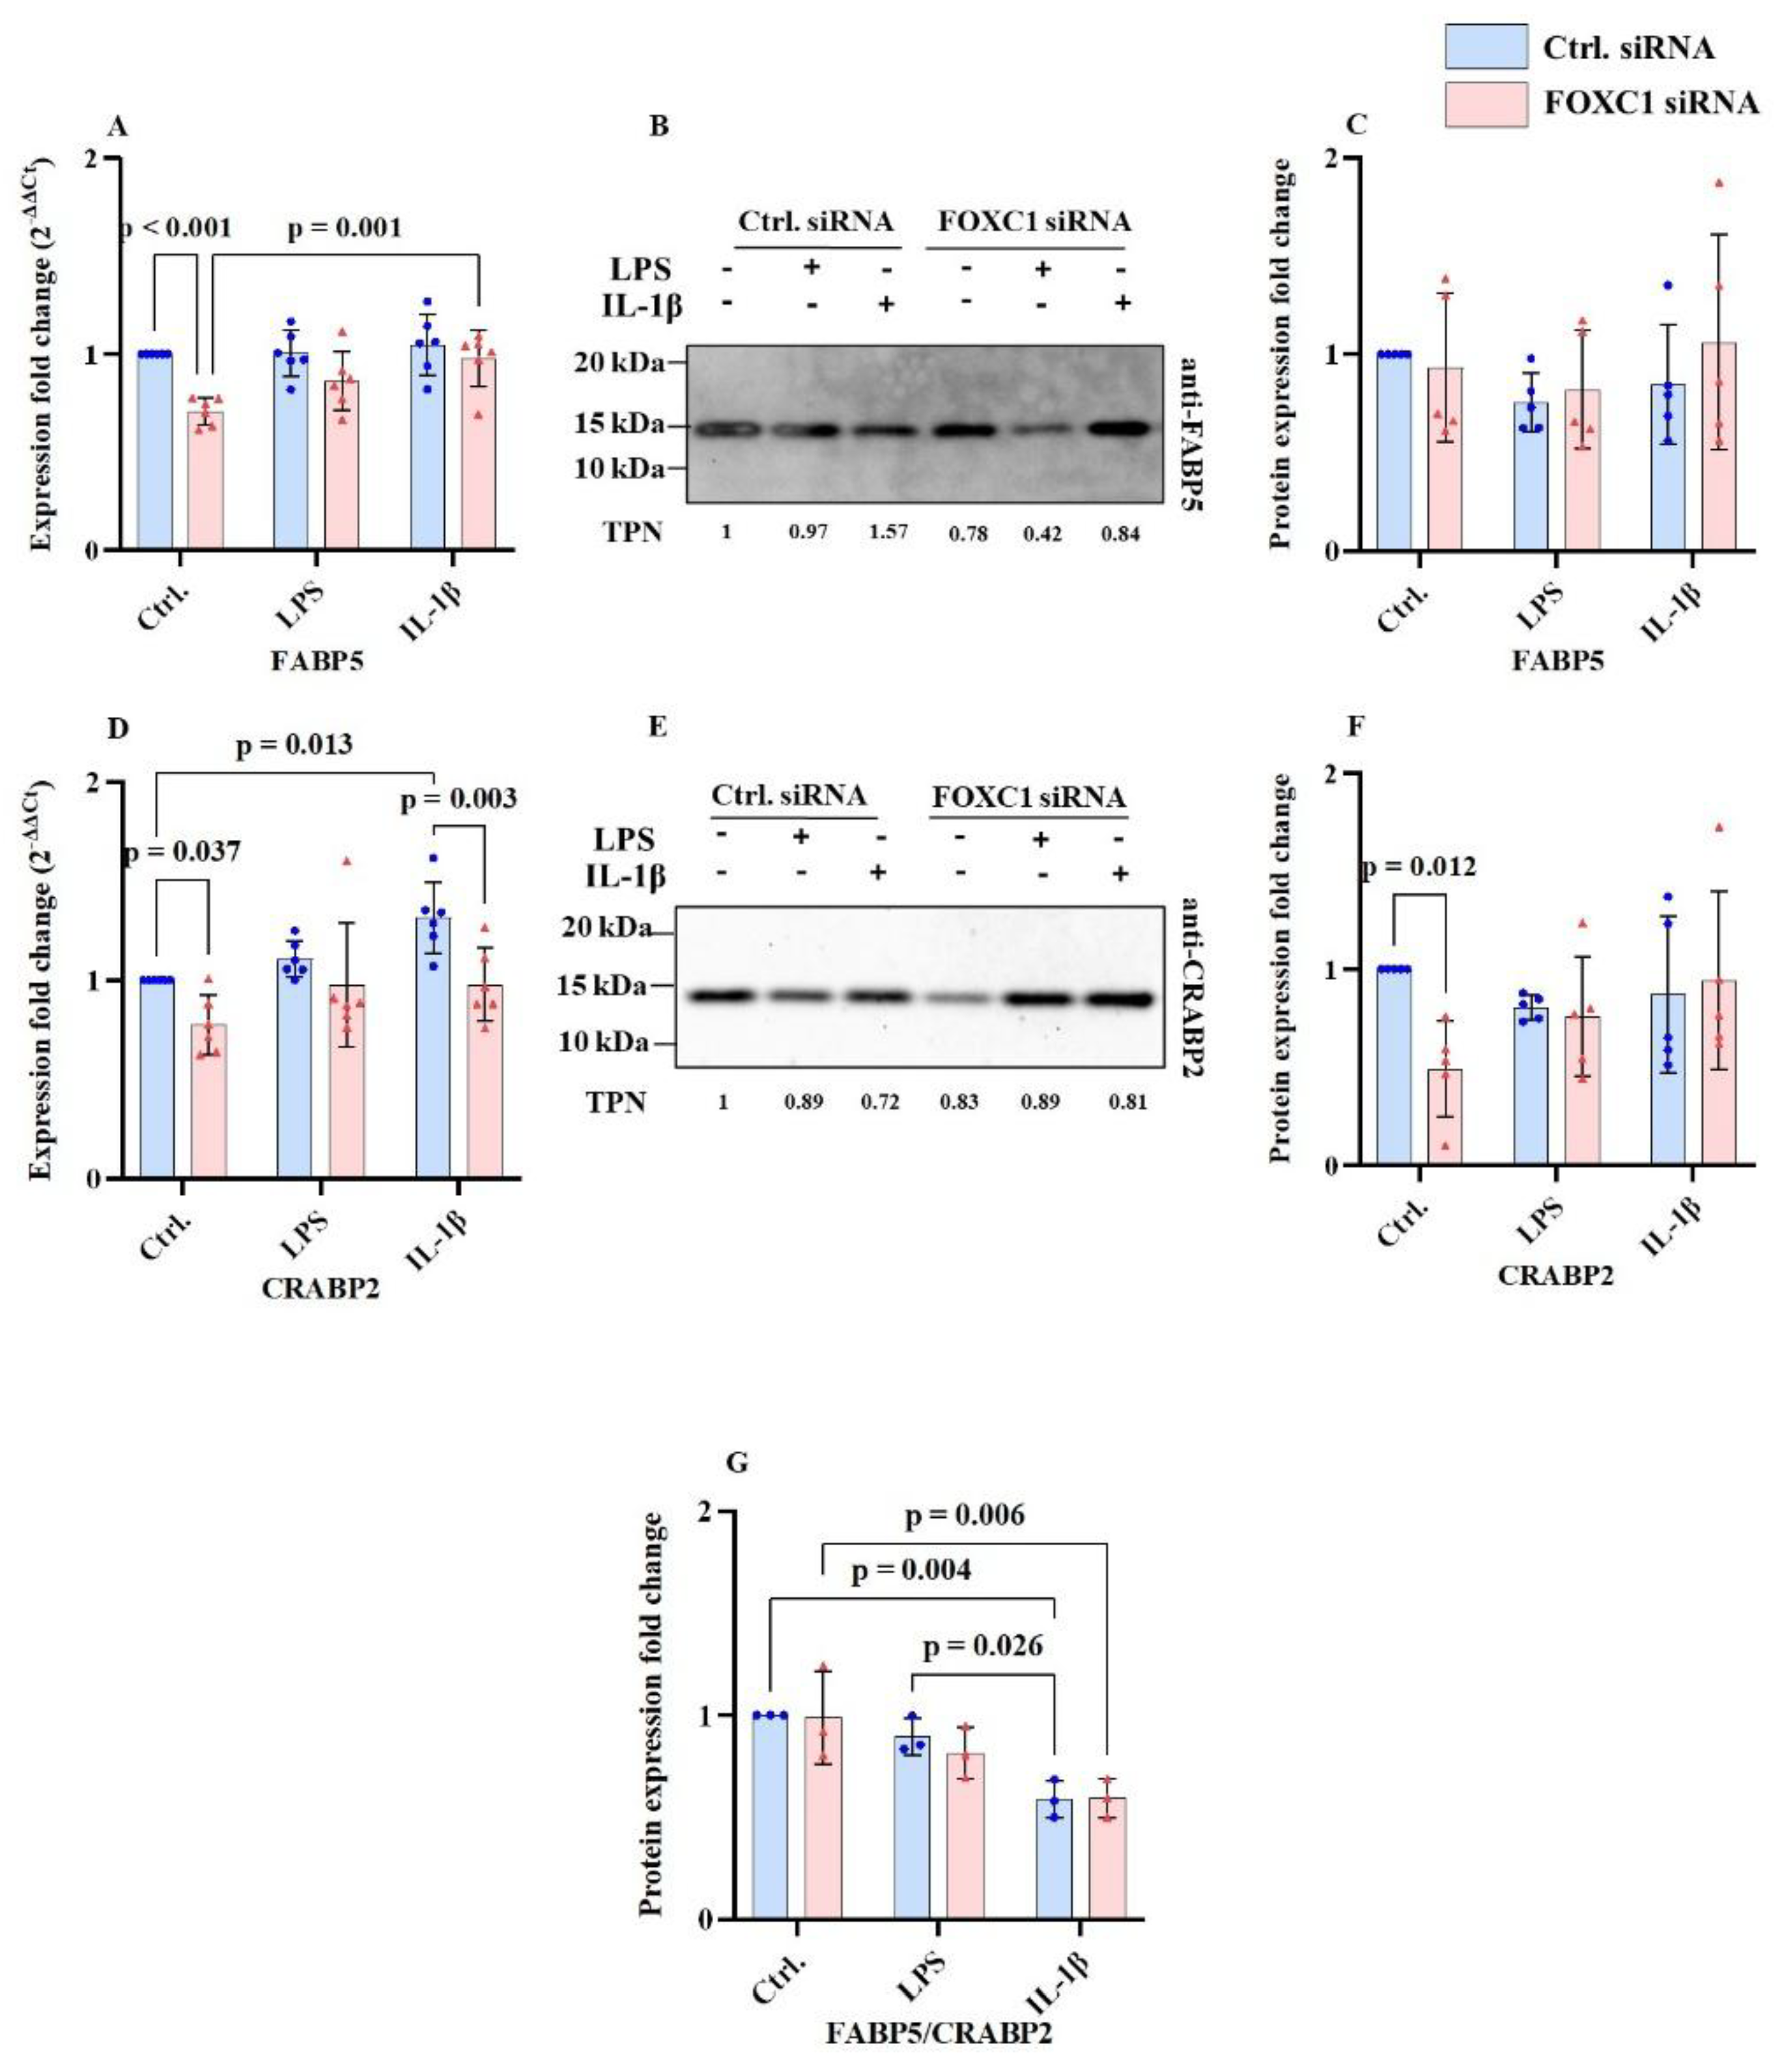
2.7. FABP5 and CRABP2 mRNA and Proteins Levels in pLECs
Fatty acid binding protein 5 (FABP5) and cellular retinoic acid-binding protein 2 (CRABP2) mRNA and proteins levels are shown at
Figure 7A-G. FOXC1 siRNA knockdown significantly reduced FABP5 mRNA level compared with siRNA controls under non-inflammatory conditions (p<0.001). In contrast, in FOXC1 knockdown pLECs, FABP5 mRNA levels were upregulated following IL-1β treatment, compared to untreated cells (p=0.001). FABP5 protein levels remained unchanged across all treatment conditions (p≥0.311) (
Figure 7A–C).
CRABP2 mRNA level was downregulated following FOXC1 knockdown under both basal (p=0.037) and IL-1β-treated conditions (p=0.003). In control siRNA-transfected LECs, CRABP2 mRNA was upregulated after IL-1β stimulation compared to non-inflammatory conditions (p=0.013). At the protein level, CRABP2 was significantly reduced in FOXC1 knockdown cells compared with siRNA controls under non-inflammatory conditions (p=0.012) (
Figure 7D–F).
In control siRNA pLECs, FABP5/CRABP2 protein ratio was higher under basal conditions compared with IL-1β treatment (p=0.004). In addition, in control siRNA pLECS, FABP5/CRABP2 protein ratio was significantly higher following LPS treatment, than after IL-1 β use (p=0.026). Analysis of the FABP5/CRABP2 protein ratio revealed, that in FOXC1 knockdown pLECs, the FABP5/CRABP2 protein ratio was significantly lower under IL-1β-induced inflammation than without inflammatory conditions (p=0.006) (
Figure 7G).
FOXC1 siRNA knockdown significantly reduced FABP5 mRNA expression compared to siRNA controls under non-inflammatory conditions (p<0.001). In contrast, FABP5 mRNA levels were upregulated in FOXC1 knockdown pLECs treated with IL-1β compared to untreated cells (p=0.001). However, FABP5 protein levels did not change significantly following FOXC1 knockdown under any condition (p≥0.311) (A-C). Similarly, FOXC1 knockdown downregulated CRABP2 mRNA expression compared to siRNA controls under both non-inflammatory (p=0.037) and IL-1β-treated (p=0.003) conditions. In siRNA control pLECs, CRABP2 mRNA was upregulated after IL-1β stimulation compared to non-inflammatory conditions (p=0.013). FOXC1 knockdown also resulted in reduced CRABP2 protein levels compared to siRNA controls under non-inflammatory conditions (p=0.012) (D-F). The ratio of FABP5:CRABP2 protein levels showed that FOXC1 knockdown decreased the FABP5/CRABP2 axis under IL-1β-induced inflammation compared to siRNA controls (p=0.006). In siRNA control pLECs, the FABP5:CRABP2 ratio was higher under non-inflammatory conditions compared to IL-1β (p=0.004) and LPS treatment (p=0.026) (G).
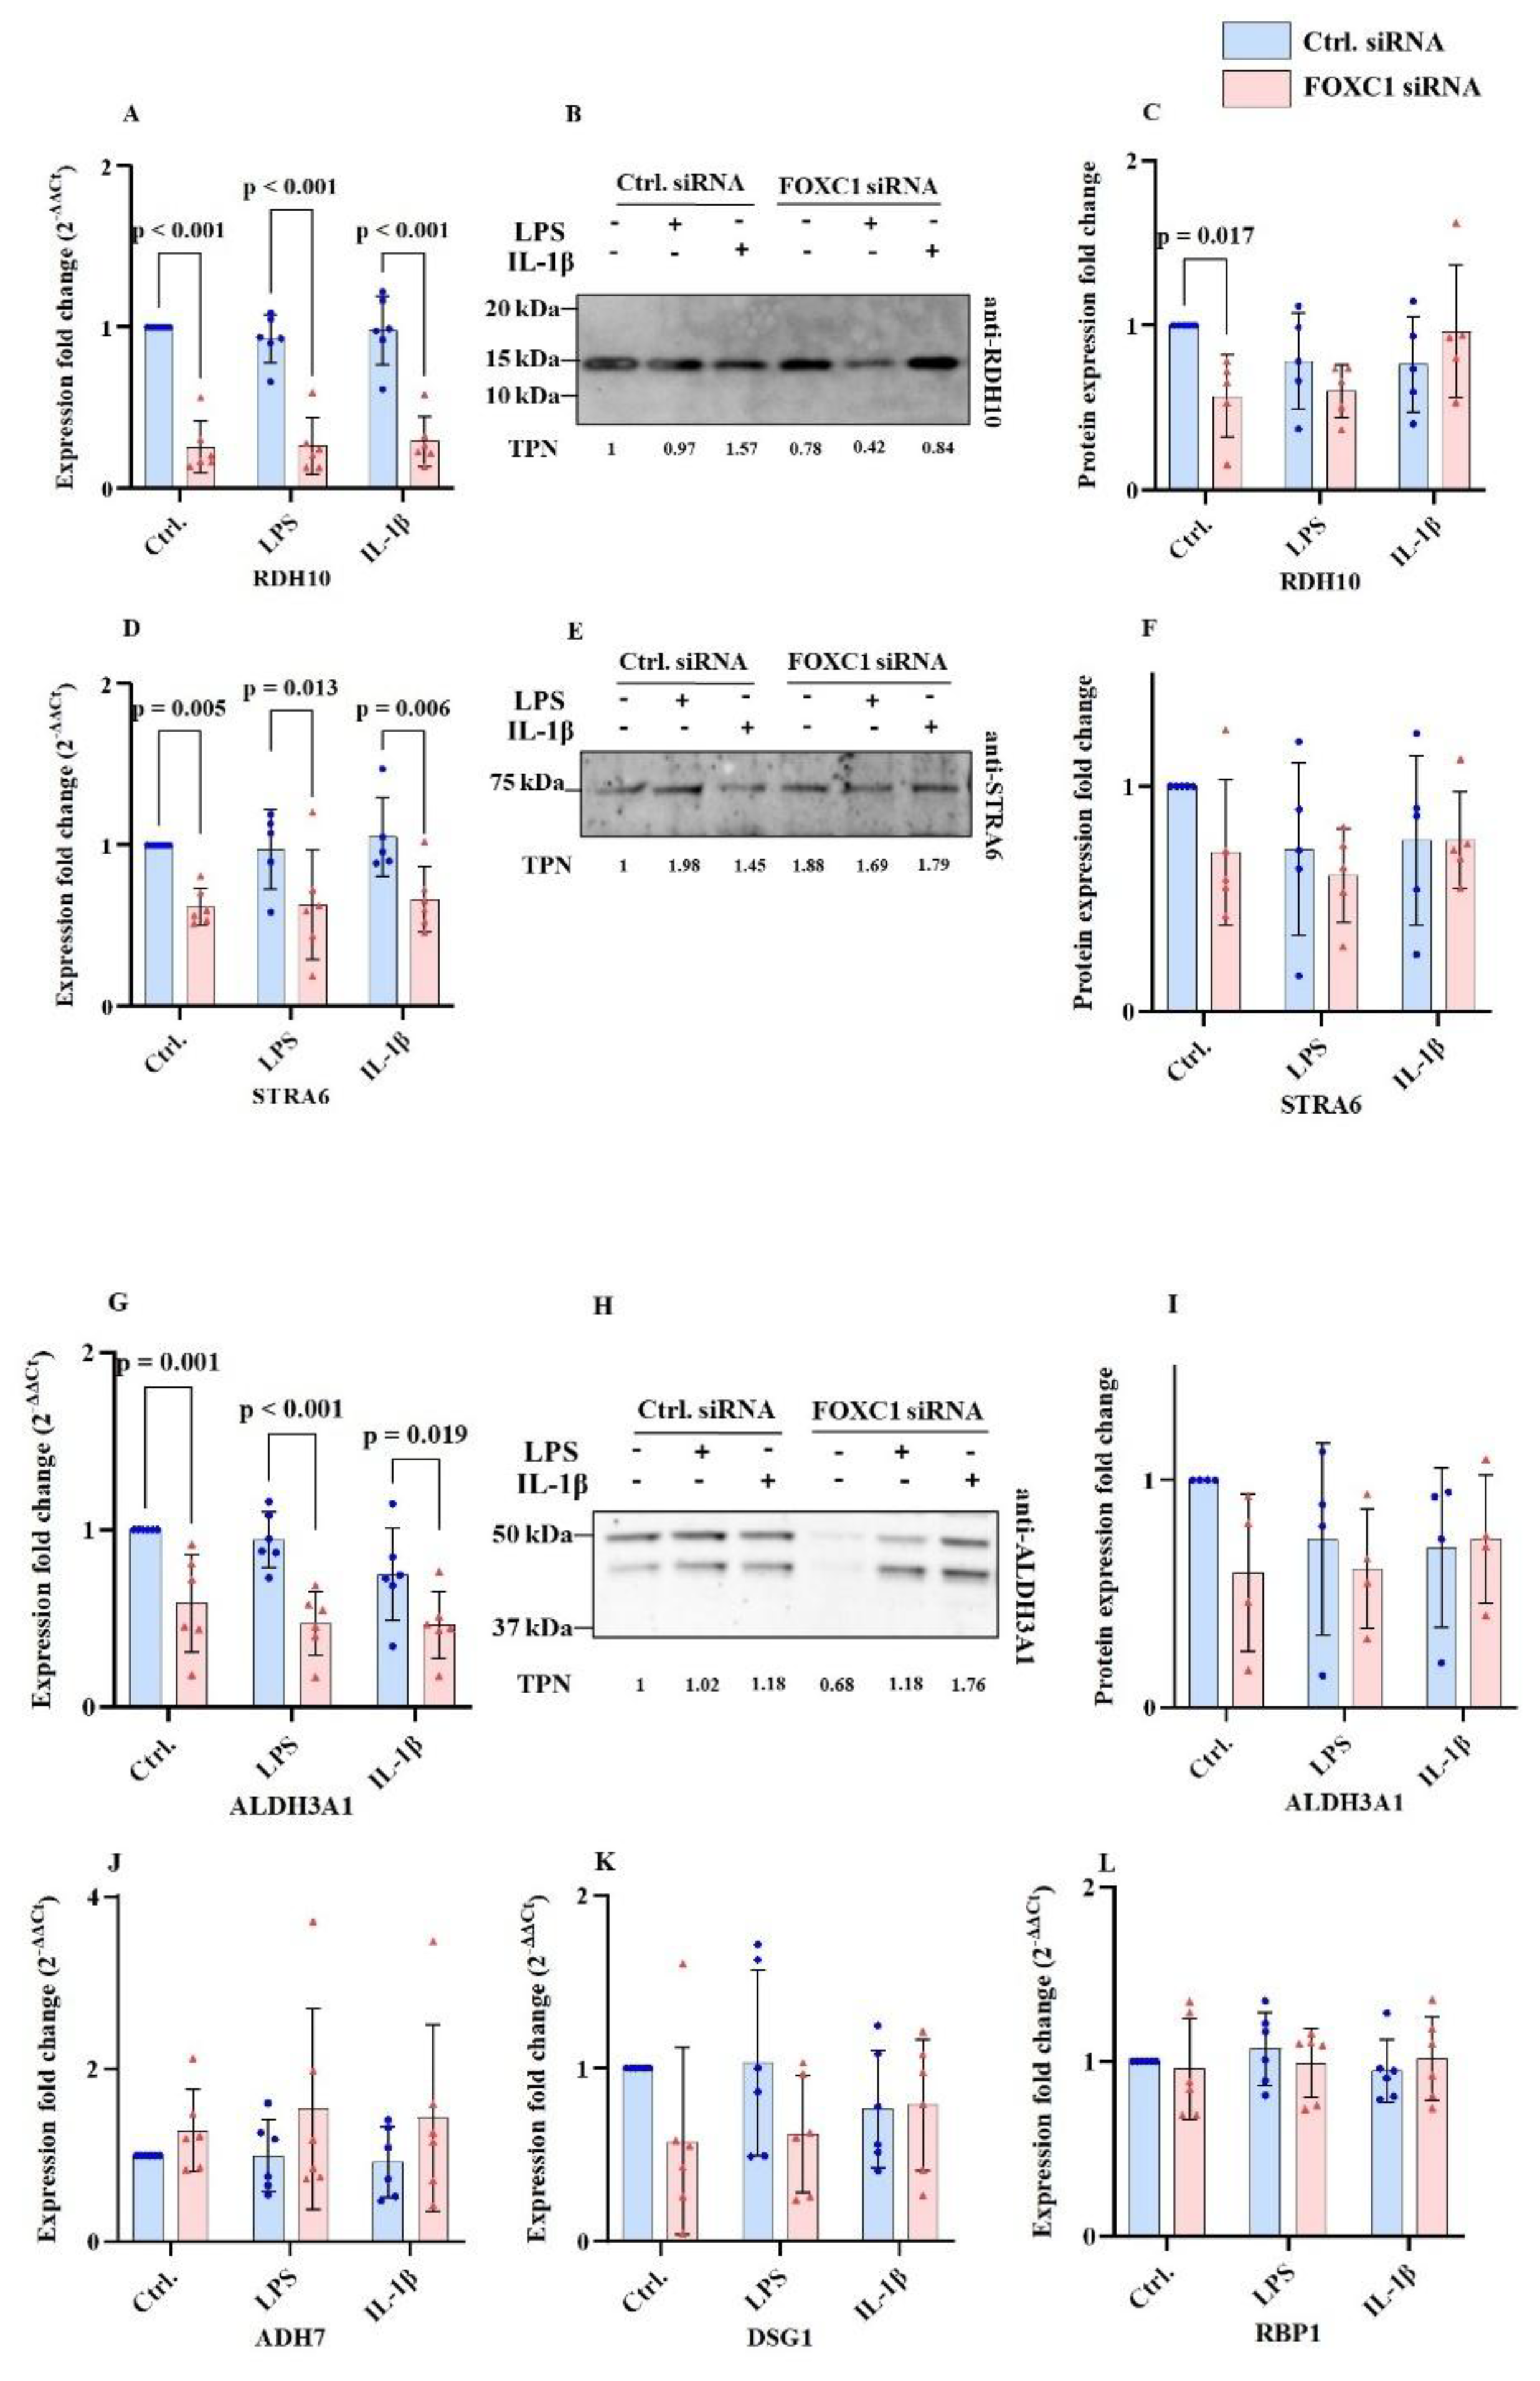
2.8. Further Retinoic Acid Signaling Pathway Related mRNA and Protein Levels in pLECs
Retinoic acid signaling pathway related mRNA and protein levels are displayed at
Figure 8A-L. FOXC1 siRNA knockdown significantly reduced retinol dehydrogenase 10 (RDH10) mRNA levels compared with siRNA controls under basal, LPS, and IL-1β-treated conditions (p<0.001). RDH10 protein levels were also decreased in FOXC1 knockdown pLECs under non-inflammatory conditions (p=0.017) (
Figure 8A–C).
Signaling receptor and transporter of retinoic acid (STRA6) mRNA levels were also significantly downregulated in FOXC1 knockdown cells compared with siRNA controls under basal (p=0.005), LPS-treated (p=0.013), and IL-1β-treated (p=0.006) conditions. However, STRA6 protein levels were not significantly affected by FOXC1 knockdown in any of the groups (p≥0.114) (
Figure 8D–F).
Enzyme aldehyde dehydrogenase 3 family member A1 (ALDH3A1) mRNA expression was likewise reduced after FOXC1 knockdown compared to siRNA controls under non-inflammatory (p=0.001), LPS (p<0.001), and IL-1β (p=0.019) conditions. In contrast, ALDH3A1 protein levels remained unchanged between all groups (p≥0.078) (
Figure 8G–I).
No significant changes were observed in aldehyde dehydrogenase 7 (ADH7), desmoglein-1 (DSG1), or retinol-binding protein 1 (RBP1) mRNA levels following FOXC1 knockdown under any experimental condition (p≥0.077) (
Figure 8J–L).
FOXC1 siRNA knockdown significantly reduced RDH10 mRNA expression compared to siRNA controls under both non-inflammatory and inflammatory conditions (LPS or IL-1β treatment) (p<0.001). Correspondingly, RDH10 protein levels were also decreased in FOXC1 knockdown pLECs under non-inflammatory conditions (p=0.017) (A-C). Similarly, STRA6 mRNA expression was significantly downregulated in FOXC1 knockdown cells compared to siRNA controls under non-inflammatory (p=0.005), LPS-treated (p=0.013), and IL-1β-treated (p=0.006) conditions. However, STRA6 protein levels were not significantly affected by FOXC1 knockdown under any treatment (p≥0.114) (D-F). FOXC1 knockdown also resulted in significantly decreased ALDH3A1 mRNA expression compared to siRNA controls under non-inflammatory (p=0.001), LPS (p<0.001), and IL-1β (p=0.019) conditions. In contrast, ALDH3A1 protein levels remained unchanged between groups across all treatments (p≥0.078) (G-I). No significant changes were observed in ADH7, DSG1, or RBP1 mRNA expression following FOXC1 knockdown under any condition (p≥0.077) (J-L).
2.9. PPARγ, FOSL2, SPINK7, MMP2, MAPK1/ERK2, MAPK3 and Mki67 mRNA Levels in pLECs
mRNA levels of peroxisome proliferator-activated receptor gamma (PPARγ), nuclear factor kappa-light-chain-enhancer of activated B cells (NF-κB), serine peptidase inhibitor kazal type 7 (SPINK7), matrix metalloproteinase 2 (MMP2), mitogen-activated protein kinase 3/ extracellular signal-regulated kinase 2 (MAPK1/ERK2), and mitogen-activated protein kinase 3 (MAPK3) showed no significant differences following FOXC1 siRNA knockdown across any group or treatment condition (p≥0.346) (
Figure 9A-H). Nevertheless, FOXC1 siRNA knockdown resulted in a significant reduction of fos-like antigen 2 (FOSL2) mRNA level in pLECs under non-inflammatory conditions compared to siRNA controls (p=0.048), while no significant differences were observed under inflammatory treatments (p≥0.080) (
Figure 9C). In contrast, FOXC1 siRNA knockdown significantly increased marker protein Ki-67 (MKi67) mRNA level in pLECs under non-inflammatory conditions compared to siRNA controls (p=0.006), with no statistically significant changes detected under inflammatory conditions (p≥0.117) (
Figure 9H).
PPARγ, NF-κB, SPINK7, MMP2, MAPK1/ERK2, and MAPK3 mRNA expression levels were not significantly affected by FOXC1 siRNA knockdown under any condition or treatment (p≥0.346) (A, B, D, E, F, G). FOXC1 knockdown significantly reduced FOSL2 mRNA expression in pLECs under non-inflammatory conditions compared to siRNA controls (p=0.048), while no significant differences were observed under inflammatory treatments (p≥0.080) (C). In contrast, FOXC1 knockdown significantly increased MKi67 mRNA expression in pLECs under non-inflammatory conditions compared to siRNA controls (p=0.006), with no statistically significant changes detected under inflammatory conditions (p≥0.117) (H).
3. Discussion
3.1. FOXC1 Transcriptional Efficiency, Protein Turnover Rate and Stability and Downstream Pathways
In our study, despite efficient FOXC1 siRNA-mediated knockdown in pLECs, we did not observe a corresponding significant reduction in FOXC1 protein levels within the 72-hour period assessed by densitometric analysis of western blots. To better understand this discrepancy between mRNA and protein level, we extended our analyses to 48-, 72-, and 96-hour time points. These experiments suggested that FOXC1 protein turnover occurs more slowly than transcriptional suppression, indicating a possible delay between mRNA downregulation and detectable protein loss. Nevertheless, we also did not observe FOXC1 protein level downregulation at the further examined time-points.
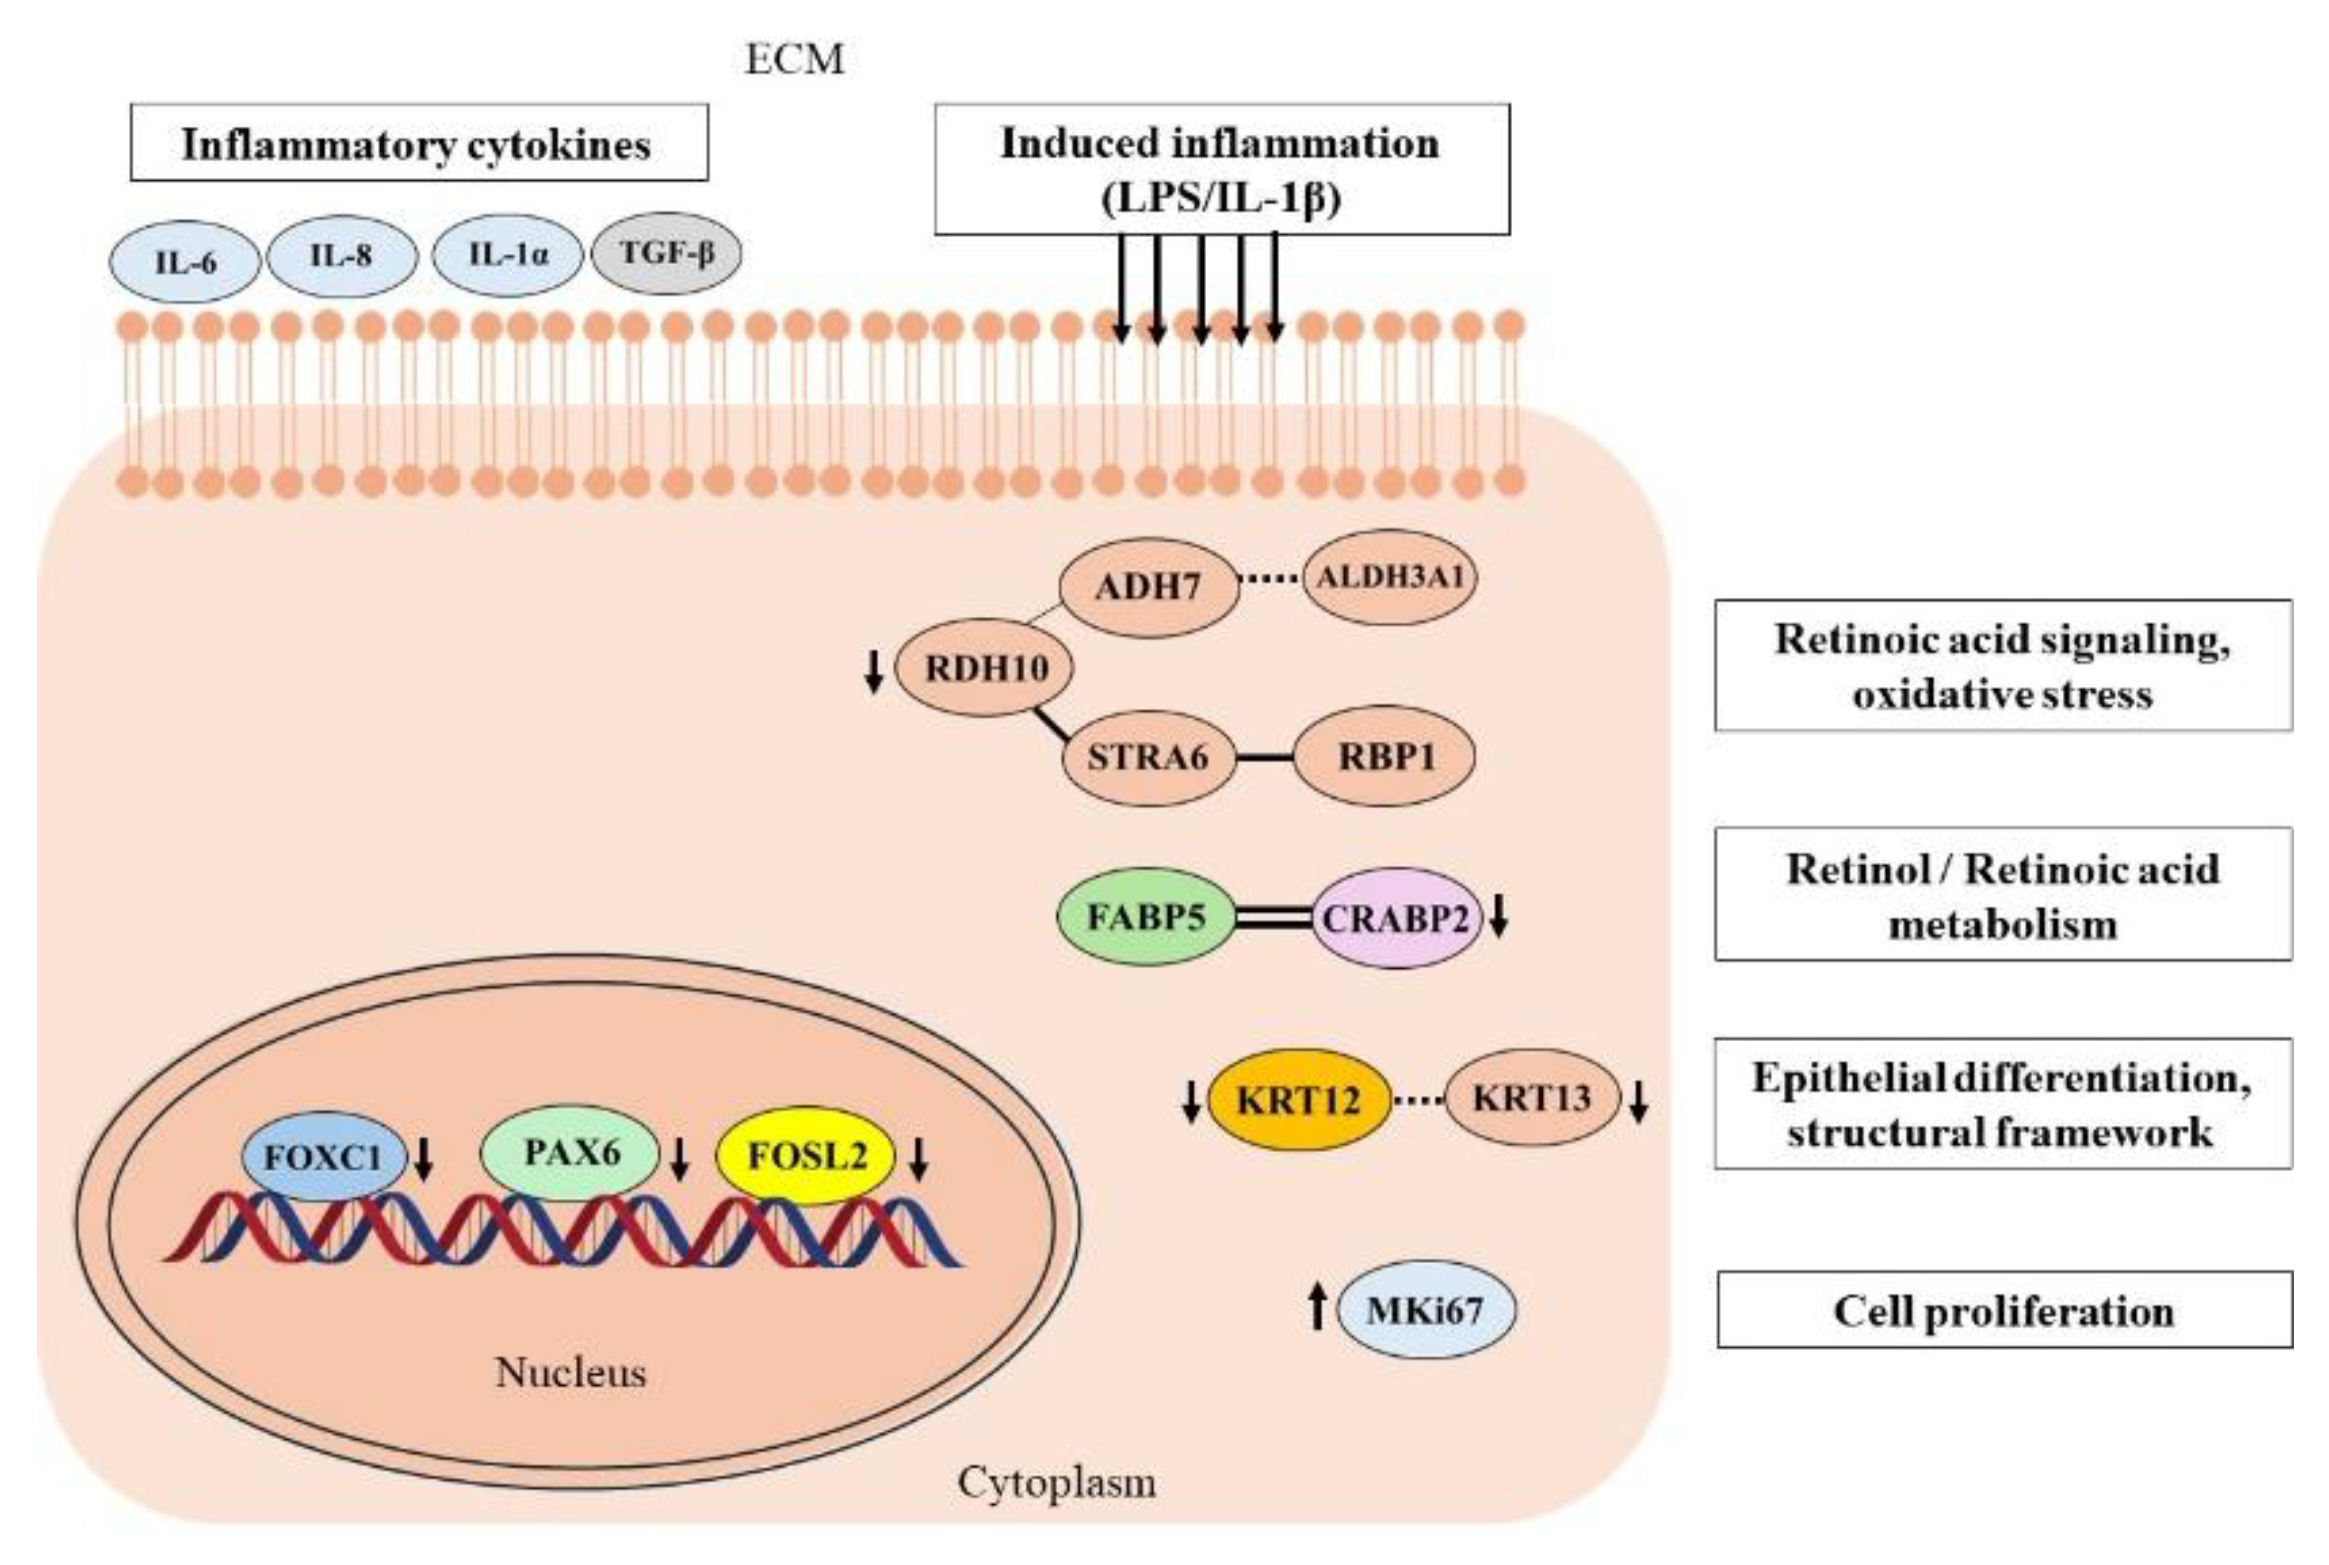
Interestingly, FOXC1 appears to exert broad regulatory influence over multiple downstream pathways, as reflected by altered expression of other key transcription factors such as FOSL2 and PAX6, both of which play essential roles in epithelial homeostasis and inflammation [
1,
4]. Furthermore, the concurrent downregulation of both mRNA and protein levels of CRABP2 and RDH10 suggests a direct role for FOXC1 in controlling components of retinoic acid signaling. Changes in the proliferation marker MKi67 and the discordant expression patterns between mRNA and protein levels of several FOXC1-regulated targets—such as TGF-β, interleukins, and chemokines—underscore the complexity of post-transcriptional and post-translational mechanisms that modulate protein abundance independently of transcriptional activity. These findings emphasize the importance of considering temporal and regulatory dynamics when interpreting FOXC1-related molecular changes (
Figure 10). This phenomenon has been well characterized in large-scale systems biology studies. Schwnhäuser et al. [
27] performed a landmark analysis combining parallel metabolic pulse labeling of RNA and proteins across diverse mammalian cell types, demonstrating that protein levels are considerably more dynamic and less tightly correlated with mRNA abundance. Although mRNA and protein levels are generally proportional, the correlation remains in some cases weak, suggesting that post-transcriptional regulation, translation efficiency, and protein degradation rates collectively determine final protein abundance. Subsequent studies confirmed that in steady-state tissues, protein stability is often favored, such that even substantial fluctuations in mRNA levels do not necessarily lead to proportional changes at the protein level [
28,
29].
In non-proliferating tissues, this decoupling is particularly evident, as cellular protein abundance depends heavily on differentiation state and post-translational control mechanisms [
28]. Reduced mRNA expression does not always equate to diminished protein synthesis, since translation efficiency and protein stability may compensate for transcriptional changes [
27,
28,
29].
3.2. FOXC1 as a Regulator of Angiogenic Pathways and Chemokine and Cytokine Signaling
In the angiogenetically privileged environment of the cornea, a delicate equilibrium between pro- and anti-angiogenic factors is essential to maintain avascularity and transparency. Pathological angiogenesis, characterized by neovascularization extending from the limbus into adjacent corneal tissue, disrupts this balance and has been investigated in murine models, where FOXC1 has emerged as a critical regulator of hematopoietic progenitor niche formation [
9,
11,
30,
31]. The presence of soluble VEGF receptors provides a potent anti-angiogenic mechanism that contributes to corneal vascular privilege [
11,
16,
31]. Moreover, FOXC1 enhances the expression of inflammation-related cytokines (CCL2, NF-κB) [
32,
33]. In our data, we observed global downregulation of VEGFA at the transcriptional level, but not at the protein level, suggesting a potential translational blockade or spatially restricted expression of VEGFA in limbal epithelial cells. Under basal conditions, FOXC1 knockdown increased CCL2 mRNA levels, yet protein secretion remained unaltered. Similarly, CXCL1, CXCL10, and VEGFA showed no significant protein-level changes despite some transcriptional alterations. These findings suggest that FOXC1 primarily modulates the transcriptional priming of chemokine and growth factor genes, highlighting the importance of transcription–protein discordance in regulating pLEC inflammatory response. It is possible that FOXC1 influences cytokine processing or stability, or that compensatory inflammatory pathways are activated upon FOXC1 depletion. Given that IL-1α mediates epithelial injury responses and immune cell recruitment [
34], FOXC1-deficient pLECs may upregulate IL-1α signaling to counterbalance dampened IL-6/IL-8 activity and preserve immune vigilance. Collectively, these data support a model in which FOXC1 maintains an anti-inflammatory, immune-quiescent state in pLECs, restraining excessive pro-inflammatory activation under homeostatic conditions.
3.3. Implications of FOXC1 mRNA Silencing on pLEC Function, Differentiation and Corneal Homeostasis – via TGF-β Signaling and Epithelial Differentiation Markers
FOXC1 functions as a downstream effector of several major epithelial-to-mesenchymal transition (EMT) signaling pathways, including TGF-β, Smad2/3, Snail, and Twist. This mechanistic positioning may explain why transcriptional changes were modest, yet alterations at the protein level were evident for TGF-β. In HeLa cell lines with homoallelic FOXC1 deletion, ectopic FOXC1 expression was shown to restore TGF-β–mediated cell cycle inhibition by arresting cells in the G0/G1 phase [
33,
35,
36,
37]. In a previous study using limbal stromal cells or limbal fibroblasts derived from aniridia and healthy donors, exposure to high glucose resulted in downregulation of TGF-β, Smad2/3, and NF-κB transcripts, accompanied by increased oxidative stress [
33]. The multifunctional cytokine TGF-β is well established as a master regulator of wound healing, fibrosis, EMT, extracellular matrix deposition, and cell proliferation and differentiation. In the current study, we observed elevated TGF-β protein levels in FOXC1-deficient pLECs under both basal and LPS-induced inflammatory conditions. This upregulation may signify a phenotypic shift toward fibrotic repair processes and pathological ocular remodeling. These findings further support a potential positive feedback loop in which secreted TGF-β modulates FOXC1 expression, thereby potentially influencing apoptotic regulation [
36,
37]. Additionally, LPS-stimulated cells activate immune signaling cascades that interact with macrophages, enhancing TGF-β secretion and secondary cytokine production [
36,
38].
Keratin expression in LECs is known to be retinoic acid metabolism–sensitive [
23,
24,
38] . The KRT3/KRT12 heterodimer, which defines corneal epithelial identity, is disrupted in several ocular disorders including aniridia, Meesmann corneal dystrophy (MECD), and corneal ulcerations. Although FOXC1 is not a universal regulator of epithelial keratin genes, it plays a targeted role in safeguarding corneal epithelial identity. Consistent with our findings, a seminal ChIP-sequencing study by Li et al., [
6] identified FOXC1 as a transcriptional regulator of corneal lineage commitment. Transcriptomic analysis further demonstrated that FOXC1 knockdown in corneal epithelial cells downregulated 468 genes, including corneal epithelial markers KRT3 and KRT12, while upregulating epidermal keratins KRT1 and KRT10, indicating a lineage identity switch. FOXC1 dysregulation also perturbs PAX6 expression, further compromising limbal stem cell lineage stability.
In our dataset, KRT12 and KRT13 were downregulated under basal and IL-1β–induced inflammatory conditions, respectively. These findings suggest that these keratins act downstream of FOXC1 and may be influenced by retinoid or cytokine-mediated regulatory networks. Notably, KRT13, a conjunctival epithelial marker implicated in enhanced stemness and metastasis via c-Myc signaling in breast cancer [
18], was reduced following FOXC1 knockdown. In contrast, KRT19, a progenitor stem cell marker expressed in the LSC niche, and KRT3, a mature corneal epithelial marker, did not exhibit significant transcriptional variation. This pattern underscores the specific and selective regulatory influence of FOXC1 on keratin gene networks. Together, these observations reveal that FOXC1 orchestrates a finely tuned balance between TGF-β–mediated EMT, keratin expression, and inflammatory signaling, thereby preserving corneal epithelial identity and preventing pathological remodeling. Alterations in FOXC1 expression disrupt this balance, predisposing the ocular surface to fibrosis, lineage instability, and inflammatory degeneration [
26].
3.4. Understanding Retinoic Acid Metabolic Pathway and Its Link to Limbal Epithelium via FOXC1 siRNA Knockdown
At the time of this study, there have been no direct reports describing the mechanistic relationship between FOXC1 and RA metabolism or signaling in pLECs. It is noteworthy that the anterior segment of the eye, along with the forebrain and meninges, originates from the neural crest during embryonic development. FOXC1 plays a crucial developmental role in this context, as FOXC1 mutant mice exhibit reduced or absent expression of RDH10 and RALDH2, key enzymes responsible for RA biosynthesis from retinal [
40,
41]. Consequently, FOXC1 deficiency disrupts RA signaling during neurogenesis, affecting Notch- and SOX2-dependent self-renewal pathways [
41]. Altered FOXC1 expression or dosage is known to underlie Axenfeld–Rieger syndrome and other neural crest-related malformations. These defects have dual ramifications: (i) central nervous system abnormalities, and (ii) altered RA signaling derived from the meninges and anterior ocular structures.
Given this developmental linkage, we investigated whether FOXC1 knockdown would influence the expression of genes involved in RA metabolism in pLECs. Notably, patients with FOXC1 haploinsufficiency—similar to ARS—often present with corneal neovascularization, further implicating FOXC1 in anterior segment homeostasis.
A central finding of our study is that FOXC1 silencing in pLECs led to the downregulation of RA pathway genes RDH10, CRABP2, and ALDH3A1, accompanied by decreased protein levels of RDH10 and CRABP2. Several studies have established RA signaling as a cornerstone of corneal epithelial differentiation, immune regulation, and stem cell maintenance, reinforcing the functional importance of these observations [
40,
42]. Interestingly, other RA metabolic genes, such as RBP1 and ADH7, remained unchanged, indicating that FOXC1 exerts a selective and targeted effect on specific RA pathway components rather than inducing a global suppression of RA metabolism. We therefore propose that impaired RA signaling resulting from FOXC1 dysregulation may compromise epithelial barrier integrity and contribute to pathological remodeling, consistent with FOXC1’s established roles in ocular development and disease [
9,
16,
17].
Furthermore, the observed alteration in the FABP5–CRABP2 axis provides additional insight into the metabolic shift within the RA network. These two binding proteins direct RA toward distinct downstream fates: FABP5 promotes proliferative, pro-survival signaling through PPARβ/δ, whereas CRABP2 mediates differentiation and apoptotic responses via RAR activation [
40,
42]. In our study, the FABP5/CRABP2 ratio decreased, particularly under IL-1β–induced inflammatory conditions following FOXC1 knockdown, suggesting a functional bias toward differentiation/apoptosis-resistant phenotypes. This finding is consistent with upregulated MKi67 expression, reflecting enhanced cellular proliferation. Notably, FOXC1 has been recognized as an oncogenic marker across multiple cancer types, while CRABP2 has been implicated in apoptotic regulation and epigenetic homeostasis in corneal epithelial cells [
42,
43]. In line with Tang et al. [
44], elevated CRABP2 expression has been shown to mitigate DNA methylation–associated mitochondrial apoptosis, suggesting a complex interplay between FOXC1, RA signaling, and cell survival mechanisms in maintaining limbal epithelial equilibrium. Collectively, these findings establish a novel connection between FOXC1 and retinoic acid metabolism in pLECs, positioning FOXC1 as a potential upstream regulator of RA-dependent epithelial homeostasis. The data highlight how disruption of FOXC1 may lead to aberrant RA flux, altered proliferative–differentiation balance, and impaired regenerative capacity at the limbal niche.
4. Materials and Methods
4.1. Ethical Considerations
The use of donor corneoscleral buttons and corneoscleral rim tissue in our experiments was approved by the Ethical Committee of Saarland/ Germany (no. 162/23). In all the experiments, requiring the handling of the human donor tissues, we adhered to the principles stated in the Declaration of Helsinki. All donors had provided written informed consent. De-identified donor data is tabulated in
Table 1.
4.2. Cell Culture
Primary limbal epithelial cell (pLEC) cultures were established as previously described [
23,
24,
25,
26]. Limbal tissue samples were obtained from healthy corneal donors and excised using a 1.5 mm biopsy punch (PFM Medical AG, Köln, Germany). The limbal epithelial punches were incubated in 700 µL of collagenase A solution (4 mg/mL; Roche Pharma AG, Basel, Switzerland) for 24 hours at 37ºC in a humidified incubator with 5% CO₂. After enzymatic digestion, the resulting cell suspension was centrifuged at 0.2 × g for 5 minutes to separate single epithelial cells from the collagenase-containing medium and residual tissue debris. The resulting cell pellet was resuspended in 800 µL of supplemented Keratinocyte Growth Medium 3 (KGM3; PromoCell GmbH, Heidelberg, Germany) containing 0.06 mM CaCl₂ and the manufacturer’s supplement mix. For subsequent experiments, pLECs were seeded into six-well, clear-bottomed culture plates (Greiner Bio-One GmbH, Frickenhausen, Germany) and maintained under standard culture conditions.
4.2.1. siRNA Transfection of pLECs, and Inflammatory Treatment
pLECs within their first or second passage were seeded onto 6-well cell culture plates and transfected with siRNA at a monolayer confluency of 60%. Experimental controls were transfected with 150 pmol of non-specific control siRNA (Catalogue no.#4390843, Thermo Fischer Scientific, Silencer
TM Select Negative Control, Waltham, USA). For FOXC1 knockdown in pLECs, the cells were transfected with 150 pmol FOXC1 siRNA (5’->3’: sense strand: GAACGGGAAUAGUAGCUGUtt, anti-sense strand: ACAGCUACUAUUCCCGUUCac; Catalogue no.#4932420, Thermo Fischer Scientific Silencer
TM Select FOXC1, Waltham, USA). Reaction dilutions per well were prepared as previously described by [
26] Kundu et al., 2025 – (i) 150 pmol of siRNA oligonucleotide was diluted in 250µl of Opti-MEM
TM (1X) + GlutaMAX
TM (Gibco, USA). (ii) To form the lipofection complex - 7.5 µl of Lipofectamine
TM2000 Transfection Reagent (Thermo Fischer Scientific, California, USA) was diluted in 250 µl of Opti-MEM
TM (1X) + GlutaMAX
TM, incubated for 5 minutes. The diluted siRNA and transfection complex was mixed and incubated for 20 minutes. Each well constituted of 509 µl siRNA + transfection complex, and 2 mL of supplemented KGM3. Transfection media was changed after 24h with fresh supplemented KGM3.
Fourty-eight hours after transfection, inflammatory conditions were induced by adding - lipopolysaccharides (LPS) (Sigma-Aldrich, Israel) and interleukin (IL)-1β (Peprotech, USA), respectively to fresh medium. Additive conditions were - 2.5 µl of lipopolysaccharides (LPS) (Sigma-Aldrich, Israel), at a concentration of 2µg/mL per well (total volume 2.5 mL); and 0.25 µl of interleukin (IL)-1β (Peprotech, USA) at a concentration of 1ng/mL per well (total volume 2.5 mL) in respective wells earmarked for specific treatment conditions. The treatment condition pairs were – (i) control siRNA/FOXC1 siRNA (without inflammatory stimuli); (ii) control siRNA/FOXC1 siRNA (LPS treatment, 2µg/mL per well); (iii) control siRNA/FOXC1 siRNA (IL-1β treatment, 1ng/mL per well). Cell supernatant of all the treatment conditions was collected to be processed for ELISA. Cell lysates were prepared 72h after transfection with SKP buffer, included in the RNA/DNA/Protein Purification Plus Micro Kit (Norgen, Thorold, ON, Canada, catalogue no. 47700).
4.3. RNA/Protein Extraction and cDNA Synthesis
Cell lysates were processed for harvesting RNA and protein using the RNA/DNA/Protein Purification Plus Micro Kit (Norgen, Thororld, ON, Canada, catalogue no. 47700) following the manufacturer’s protocol. RNA concentration was measured with UV/VIS-spectrophotometry (ScanDrop, AnalyticJena, Jena, Germany). Protein concentration was measured using a standardised Bradford test (Sigma-Aldrich GmbH, USA) with a spectrophotometric plate reader (Infinite50, TECAN, Zurich, Switzerland). cDNA was synthesized using the OneTaq RT-PCR Kit (NewEngland Biolabs, Frankfurt a.M., Germany). 1000 ng of RNA per reaction, was used to synthesize the first strand of cDNA with M-Mul V Enzyme Mix and oligo dt Primers (One Taq RT-PCR kit, NEB). The total volume of reaction was 20 µl. 30 µl of nuclease free water was added per tube before proceeding with qRT-PCR.
4.4. Reverse Transcription Quantitative Real-Time Polymerase Chain Reaction (qRT-PCR)
For each qRT-PCR reaction the reagents added to each well of a 96 well plate (MicroAmp
TM Optical Reaction plate, Applied Biosystems, USA) were as follows - 1 µl cDNA, 1 µl primer and 3 µl nuclease free water and 5 µl of the ACEq DNA SYBR Green master Mix (Vazyme, Biotech, Nanjing). Experiments were carried out in duplicates in the QuantStudio thermocycler (ThermoFischer Scientific, USA). Qiagen QuantiTect
TM primers used for qPCR are listed at
Table 2. TATA binding- protein (TBP) was used as a reference gene. The amplification conditions for all transcripts were as follows: initial denaturation at 95ºC for 5 minutes, denaturation at 95ºC for 10 seconds and primer annealing at 60ºC for 30 seconds. This was repeated for 40 cycles. The relative expression was normalised to the TBP reference gene expression. Ct and ΔΔCt values were calculated for each target gene compared to controls (control siRNA, no treatment) using QuantStudio™ design and analysis software. Data analysis and expression fold-changes (2
-ΔΔCt values) were calculated using Excel.
4.5. Western Blot Analysis
For SDS-PAGE, 15 µg of total protein from each lysate was mixed with 5 µL of Laemmli sample buffer and boiled for 5 minutes at 95 °C to ensure denaturation. The denatured samples, together with the All-Blue Precision Plus Protein™ Standard (Bio-Rad Laboratories, Munich, Germany), were electrophoretically separated on a 4–12% NuPAGE™ Bis-Tris SDS gel (Invitrogen, Waltham, MA, USA) at 80–100 V. The resolution of individual protein bands was confirmed using the molecular weight marker range (10–250 kDa). Following electrophoresis, proteins were transferred onto a nitrocellulose membrane using a semi-dry transfer method with the Trans-Blot Turbo Transfer System (Bio-Rad, Hercules, CA, USA) at 25 V and 1.3 A for 7 minutes. After transfer, the membrane was briefly rinsed with distilled water and stained with No-Stain Protein Labeling Reagent (Invitrogen, CA, USA) to enable total protein normalization (TPN). The membrane was then washed with Froxx Wash Buffer (BioFroxx GmbH, Einhausen, Germany) for 5 minutes and incubated with the appropriate primary antibodies (listed in
Table 3), diluted in the Western Blot Froxx buffer kit (BioFroxx GmbH, Einhausen, Germany), which combines blocking and secondary antibody solutions. Protein bands were visualized using the Pierce™ ECL Western Blotting Substrate (Thermo Fisher Scientific, Waltham, MA, USA) and imaged with the iBright™ 1500 Imaging System (Thermo Fisher Scientific, Waltham, MA, USA) under the universal setting. Densitometric quantification of protein expression was performed using iBright™ Analysis Software (Invitrogen, USA).
4.6. ELISA (Enzyme Linked Immunosorbent Assay) of Cell Culture Supernatant
Quantification of secreted proteins in cell culture supernatants was performed using DuoSet™ ELISA Kits (R&D Systems, Minneapolis, MN, USA), as listed in
Table 4. All measurements were carried out in duplicate. Appropriate dilutions of experimental samples were prepared to ensure readings within the linear optical range. All procedures followed the manufacturer’s instructions (kit- and lot-specific). Briefly, 96-well microplates (R&D Systems, Minneapolis, MN, USA) were coated with 100 µL per well of capture antibody and incubated overnight at room temperature. The plates were then washed three times with 400 µL of wash buffer (0.05% Tween-20 in PBS) per well, followed by blocking with 300 µL of reagent diluent (1% BSA in PBS) to prevent nonspecific binding. Subsequently, 100 µL of each supernatant sample was added to the wells and incubated under standard conditions. After washing, 100 µL of detection antibody was added to each well, followed by incubation with 100 µL of streptavidin–HRP conjugate that was provided with each ELISA-kit (R&D Systems, Minneapolis, MN, USA). Following a final wash, 100 µL of TMB substrate solution (3,3′,5,5′-tetramethylbenzidine; 1-Step Ultra TMB-ELISA Substrate Solution, Thermo Fisher Scientific, CA, USA) was added to each well. The reaction was stopped by adding 50 µL of 2 N H₂SO₄ per well. Optical density (OD) was measured at 450 nm with a reference wavelength of 540 nm using a Tecan Infinite 50 plate reader (Tecan Group AG, Männedorf, Switzerland) and Magellan software. Protein concentrations were calculated from the OD values using a non-linear standard curve fitting model.
4.7. Statistical Analysis
All statistical analyses were performed using GraphPad Prism software, version 10.2.2 (GraphPad Software, San Diego, CA, USA). Data are presented as mean ± standard deviation (SD). The Shapiro–Wilk test was used to assess normality, with a p-value threshold of 0.05. For data not following a normal (Gaussian) distribution, non-parametric tests such as the Mann–Whitney or Wilcoxon test were applied. Comparisons between different treatment conditions were analyzed using two-way ANOVA followed by Tukey’s post hoc test or a two-tailed paired t-test, as appropriate. A p-value < 0.05 was considered statistically significant. Each data set (representing one experimental condition) was examined for potential outliers using Grubbs’ test (α=0.05) via the GraphPad Prism outlier calculator. Densitometric quantification of western blot data was performed using iBright™ Analysis Software (Invitrogen, USA).
5. Conclusions
Our findings indicate that FOXC1 protein turnover occurs at a slower rate than transcriptional suppression, suggesting a temporal lag between mRNA downregulation and measurable protein depletion. This delay underscores potential post-transcriptional regulation and highlights the stability of FOXC1 as a functional transcription factor. Importantly, FOXC1 appears to exert broad regulatory control over multiple downstream pathways, integrating signals that govern inflammation, differentiation, and tissue remodeling.
Collectively, our data support a model in which FOXC1 preserves an anti-inflammatory, immune-quiescent state in pLECs, thereby preventing excessive pro-inflammatory activation under physiological conditions. Through this regulatory capacity, FOXC1 fine-tunes the interplay between TGF-β–mediated EMT, keratin expression, and inflammatory signaling, ensuring corneal epithelial integrity and homeostasis. Perturbation of FOXC1 expression disrupts this balance, predisposing the ocular surface to fibrosis, lineage instability, and inflammatory degeneration. Furthermore, our results uncover a previously unrecognized link between FOXC1 and retinoic acid metabolism in pLECs, identifying FOXC1 as a potential upstream regulator of RA-dependent epithelial maintenance. Disruption of FOXC1 alters RA flux and disturbs the proliferation–differentiation equilibrium, impairing the regenerative capacity of the limbal stem cell niche. Together, these findings position FOXC1 as a central transcriptional hub coordinating inflammatory restraint, epithelial identity, and metabolic homeostasis—processes essential for the preservation of corneal transparency and tissue renewal.
Supplementary Materials
The following supporting information can be downloaded at:
Preprints.org, Figure S1: Forkhead box C1 (FOXC1) proteins levels in primary human limbal epithelial cells (pLECs) 48, 72, 96 hours after transfection with control siRNA (blue) or with FOXC1 knockdown siRNA (pink), (n≥4) (A, B). Rabbit polyclonal anti-FOXC1 antibody from Proteintech. FOXC1 protein levels in pLECs - 72 hours after transfection with control siRNA (blue) or with FOXC1 knockdown siRNA (pink), without or with lipopolysaccharide (LPS) or interleukin 1β (IL-1β) treatment. Positive controls, 1-4 being HEK293 cell lysate, HeLa cell lysate, un-transfected pLECs lysate, and human brain lysate respectively (C). Mouse monoclonal anti-FOXC1 antibody from Bio-techne R&D.
Author Contributions
Conceptualization, Swarnali Kundu, Tanja Stachon, Nóra Szentmáry; methodology, Swarnali Kundu, Tanja Stachon, Nóra Szentmáry; software, Swarnali Kundu, Tanja Stachon, Nóra Szentmáry; validation, Swarnali Kundu; formal analysis, Swarnali Kundu; investigation, Swarnali Kundu; resources, Nóra Szentmáry; data curation, Swarnali Kundu; writing—original draft preparation, Swarnali Kundu; writing—review and editing, Swarnali Kundu, Maryam Amini, Tanja Stachon, Fabian Fries, Berthold Seitz, Zhen Li, Shuailin Li, Shanhe Liu, Shao-Lun Shu, Shweta Suiwal, Nóra Szentmáry; visualization, Nóra Szentmáry, Tanja Stachon, Swarnali Kundu; supervision, Nóra Szentmáry ; project administration, Tanja Stachon, Nóra Szentmáry; funding acquisition, Nóra Szentmáry. All authors have read and agreed to the published version of the manuscript.
Funding
This research received no external funding.
Institutional Review Board Statement
The study was conducted in accordance with the Declaration of Helsinki, and approved by the Ethics Committee of Saarland/ Germany (no. 162/23; date of approval 9 October 2023).
Informed Consent Statement
Informed consent was obtained from all subjects involved in the study.
Data Availability Statement
Data will be made available upon reasonable request.
Acknowledgments
The work of Swarnali Kundu, Maryam Amini, Tanja Stachon, Fabian Fries, Zhen Li, Shuailin Li, Shanhe Liu, Shao-Lun Shu, Shweta Suiwal and Nóra Szentmáry at the Dr. Rolf M. Schwiete Center for Limbal Stem Cell and Congenital Aniridia Research has been supported by the Dr. Rolf M. Schwiete Foundation. The work of Zhen Li, Shuailin Li and Shanhe Liu has been supported by the China Scholarship Council.
Conflicts of Interest
The authors declare no conflicts of interest relevant to the production and publication of this work. The funders had no role in the design of the study; in the collection, analyses, or interpretation of data; in the writing of the manuscript; or in the decision to publish the results.
Abbreviations
| AAK |
Aniridia associated keratopathy |
| ADH7 |
Alcohol dehydrogenase 7 |
| ALDH3A1 |
Aldehyde dehydrogenase 3 Family member A1 |
| bp |
base pairs |
| BSA |
Bovine serum albumin |
| CCL2 |
C-C motif chemokine ligand 2 |
| CXCL1 |
C-X-C motif chemokine ligand 1 |
| CXCL10 |
C-X-C motif chemokine ligand 10 |
| CRABP2 |
Cellular retinoic acid binding protein 2 |
| CYP1B1 |
Cytochrome P450 1B1 |
| Ct |
Cycle threshold (in qPCR) |
| Ctrl |
Control/ negative control |
| DSG1 |
Desmoglein 1 |
| ECL |
Enhanced chemiluminescence |
| ELISA |
Enzyme-linked immuno sorbent assay |
| FABP5 |
Fatty acid-binding protein 5 |
| FOSL2 |
Fos like transcription protein 2 |
| FOXC1 |
Forkhead Box C1 |
| HRP |
Horseradish peroxidase |
| IL-1α |
Interleukin 1α |
| IL-1β |
Interleukin 1β |
| IL-6 |
Interleukin 6 |
| IL-8 |
Interleukin 8 |
| KEGG |
Kyoto Encyclopaedia of Genes and Genomes |
| KGM |
Keratinocyte growth medium |
| KRT3 |
Keratin, type II cytoskeletal 3 |
| KRT12 |
Keratin, type II cytoskeletal 12 |
| KRT13 |
Keratin, type I cytoskeletal 13 |
| KRT19 |
Keratin, type I cytoskeletal 19 |
| LECs |
Limbal epithelial cells |
| LSCs |
Limbal stem cells |
| LSCD |
Limbal stem cell deficiency |
| LPS |
lipopolysaccharide |
| μL |
microliter |
| mL |
milliliter |
| MAPK1 |
Mitogen-activated protein kinase1 |
| MAPK3 |
Mitogen-activated protein kinase3 |
| MKi67 |
Marker of proliferation Ki-67 |
| MMP2 |
Matrix metalloproteinase-2 Protein (type IV collagenase) |
| NFkβ |
Nuclear factor kappa-light-chain-enhancer of activated B cells |
| OD |
Optical density |
| PAX6 |
Paired box protein Pax-6 |
| pmol |
picomole |
| PPARγ |
Peroxisome proliferator-activated receptor gamma |
| pg |
picogram |
| qRT-PCR |
quantitative Reverse Transcription Polymerase Chain Reaction |
| RBP1 |
Retinol binding protein 1 |
| RDH10 |
Retinol dehydrogenase 10 |
| SD |
Standard deviation |
| SDS-PAGE |
Sodium Dodecyl Sulfate–Polyacrylamide Gel Electrophoresis |
| SPINK7 |
Serine Peptidase Inhibitor, Kazal Type |
| STRA6 |
Signaling Receptor And Transporter Of Retinol 6 |
| STRING |
Search Tool for Retrieval of Interacting Genes/Proteins |
| siRNA |
Small interfering RNA |
| TBP |
TATA box binding protein |
| TMB |
3,3′,5,5′-tetramethylbenzidine |
| TNF-α |
Tumor Necrosis Factor-alpha |
| TGF-β |
Transforming Growth Factor beta |
| TPN |
Total protein normalisation |
| V |
Volts |
| VEGFA |
Vascular endothelial growth factorA |
References
- Schlötzer-Schrehardt, U; Latta, L; Gießl, A; et al. Dysfunction of the limbal epithelial stem cell niche in aniridia-associated keratopathy: Limbal niche in aniridia-associated keratopathy. Ocular Surface 2021, 21, 160–173. [Google Scholar] [CrossRef]
- Smits, JGA; Cunha, DL; Amini, M; et al. Identification of the regulatory circuit governing corneal epithelial fate determination and disease. PLoS Biol 2023, 21. [Google Scholar] [CrossRef] [PubMed]
- Ouyang, H; Xue, Y; Lin, Y; et al. WNT7A and PAX6 define corneal epithelium homeostasis and pathogenesis. Nature 2014, 511, 358–361. [Google Scholar] [CrossRef]
- Zhu, L; Chen, C; Wu, S; et al. PAX6-WNK2 Axis Governs Corneal Epithelial Homeostasis. Invest Ophthalmol Vis Sci 2024, 65, 40. [Google Scholar] [CrossRef]
- Ouyang, J; Shen, YC; Yeh, LK; et al. Pax6 overexpression suppresses cell proliferation and retards the cell cycle in corneal epithelial cells. Invest Ophthalmol Vis Sci 2006, 47, 2397–2407. [Google Scholar] [CrossRef]
- Li, M; Zhu, L; Liu, J; et al. Loss of FOXC1 contributes to the corneal epithelial fate switch and pathogenesis. Signal Transduct Target Ther 2021, 6. [Google Scholar] [CrossRef]
- Latta, L; Figueiredo, FC; Ashery-Padan, R; et al. Pathophysiology of aniridia-associated keratopathy: Developmental aspects and unanswered questions. Ocular Surface 2021, 22, 245–266. [Google Scholar] [CrossRef]
- Lewis, CJ; Hedberg-Buenz, A; DeLuca, AP; et al. Primary congenital and developmental glaucomas. Hum Mol Genet 2017, 26, R28–R36. [Google Scholar] [CrossRef] [PubMed]
- Seo, S; Singh, HP; Lacal, PM; et al. Forkhead box transcription factor FoxC1 preserves corneal transparency by regulating vascular growth. Proc Natl Acad Sci U S A 2012, 109, 2015–2020. [Google Scholar] [CrossRef] [PubMed]
- Wang, X; Shan, X; Gregory-Evans, CY. A mouse model of aniridia reveals the in vivo downstream targets of Pax6 driving iris and ciliary body development in the eye. Biochim Biophys Acta Mol Basis Dis 2017, 1863, 60–67. [Google Scholar] [CrossRef]
- Omatsu, Y; Seike, M; Sugiyama, T; et al. Foxc1 is a critical regulator of haematopoietic stem/progenitor cell niche formation. Nature 2014, 508, 536–540. [Google Scholar] [CrossRef]
- Yang, Y; Li, W; Yang, H; et al. Research progress on the regulatory mechanisms of FOXC1 expression in cancers and its role in drug resistance. Gene 2024, 897. [Google Scholar] [CrossRef] [PubMed]
- Arcot Sadagopan, K; Liu, GT; Capasso, JE; et al. Anirdia-like phenotype caused by 6p25 dosage aberrations. Am J Med Genet A 2015, 167, 524–528. [Google Scholar] [CrossRef]
- Micheal, S; Siddiqui, SN; Zafar, SN; et al. A novel homozygous mutation in FOXC1 causes axenfeld Rieger syndrome with congenital glaucoma. PLoS One 2016, 11. [Google Scholar] [CrossRef]
- Ito, YA; Footz, TK; Berry, FB; et al. Severe molecular defects of a novel FOXC1 W152G mutation result in aniridia. Invest Ophthalmol Vis Sci 2009, 50, 3573–3579. [Google Scholar] [CrossRef]
- François, M; Ramchandran, R. Studies on Axenfeld-Rieger syndrome patients and mice reveal Foxc1’s role in corneal neovascularization. Proc Natl Acad Sci U S A 2012, 109, 1818–1819. [Google Scholar] [CrossRef]
- Han, B; Bhowmick, N; Qu, Y; et al. FOXC1: An emerging marker and therapeutic target for cancer. Oncogene 2017, 36, 3957–3963. [Google Scholar] [CrossRef] [PubMed]
- Yin, L; Li, Q; Mrdenovic, S; et al. KRT13 promotes stemness and drives metastasis in breast cancer through a plakoglobin/c-Myc signaling pathway. Breast Cancer Research 2022, 24. [Google Scholar] [CrossRef]
- Tibrewal, S; Ratna, R; Gour, A; et al. Clinical and molecular aspects of congenital aniridia - A review of current concepts. Indian J Ophthalmol 2022, 70, 2280–2292. [Google Scholar] [CrossRef] [PubMed]
- Samant, M; Chauhan, BK; Lathrop, KL; et al. Congenital aniridia: Etiology, manifestations and management. Expert Rev Ophthalmol 2016, 11, 135–144. [Google Scholar] [CrossRef]
- Landsend, ECS; Utheim, ØA; Pedersen, HR; et al. The level of inflammatory tear cytokines is elevated in congenital Aniridia and associated with meibomian gland dysfunction. Invest Ophthalmol Vis Sci 2018, 59, 2197–2204. [Google Scholar] [CrossRef]
- Ihnatko, R; Edén, U; Lagali, N; et al. Analysis of protein composition and protein expression in the tear fluid of patients with congenital aniridia. J Proteomics 2013, 94, 78–88. [Google Scholar] [CrossRef]
- Latta, L; Nordström, K; Stachon, T; et al. Expression of retinoic acid signaling components ADH7 and ALDH1A1 is reduced in aniridia limbal epithelial cells and a siRNA primary cell based aniridia model. Exp Eye Res 2019, 179, 8–17. [Google Scholar] [CrossRef]
- Latta, L; Knebel, I; Bleil, C; et al. Similarities in DSG1 and KRT3 down regulation through retinoic acid treatment and PAX6 knockdown related expression profiles: Does PAX6 affect RA signaling in limbal epithelial cells? Biomolecules 2021, 11. [Google Scholar] [CrossRef] [PubMed]
- Katiyar, P; Stachon, T; Fries, FN; et al. Decreased FABP5 and DSG1 protein expression following PAX6 knockdown of differentiated human limbal epithelial cells. Exp Eye Res 2022, 215. [Google Scholar] [CrossRef] [PubMed]
- Kundu, S; Amini, M; Stachon, T; et al. Effect of isolated keratin 3 knockdown on gene expression of primary limbal epithelial cells without and with inflammatory stimuli. Annals of Anatomy 2025, 260. [Google Scholar] [CrossRef] [PubMed]
- Schwanhüusser, B; Busse, D; Li, N; et al. Global quantification of mammalian gene expression control. Nature 2011, 473, 337–342. [Google Scholar] [CrossRef]
- Perl, K; Ushakov, K; Pozniak, Y; et al. Reduced changes in protein compared to mRNA levels across non-proliferating tissues. BMC Genomics 2017, 18. [Google Scholar] [CrossRef]
- Vogel, C.; Marcotte, E. M. Insights into the regulation of protein abundance from proteomic and transcriptomic analyses. Nature Reviews Genetics 2012, 13(4), 227–232. [Google Scholar] [CrossRef]
- Koo, H-Y; Kume, T. FoxC1-dependent regulation of vascular endothelial growth factor signaling in corneal avascularity. Trends Cardiovasc Med 2013, 23(1), 1–4. [Google Scholar] [CrossRef]
- Bhakuni, T; Norden, PR; Ujiie, N; et al. FOXC1 regulates endothelial CD98 (LAT1/4F2hc) expression in retinal angiogenesis and blood-retina barrier formation. Nat Commun 2024, 15. [Google Scholar] [CrossRef]
- Ray, T; Ryusaki, T; Ray, PS. Therapeutically Targeting Cancers That Overexpress FOXC1: A Transcriptional Driver of Cell Plasticity, Partial EMT, and Cancer Metastasis. Front Oncol 2021, 11, 721959. [Google Scholar] [CrossRef]
- Liu, Y; Chen, S; Tian, M; et al. FOXC1 restrains NF-κB-mediated interleukin-1β transcription in breast cancer. MedComm (Beijing) 2023, 4(6), e440. [Google Scholar] [CrossRef]
- Suwara, MI; Green, NJ; Borthwick, LA; et al. IL-1a released from damaged epithelial cells is sufficient and essential to trigger inflammatory responses in human lung fibroblasts. Mucosal Immunol 2014, 7, 684–693. [Google Scholar] [CrossRef]
- Zhou, Y; Kato, H; Asanoma, K; et al. Identification of FOXC1 as a TGF-beta1 responsive gene and its involvement in negative regulation of cell growth. Genomics 2002, 80(5), 465–72. [Google Scholar] [CrossRef] [PubMed]
- Zhang, H; Nie, J; Bao, Z; et al. FOXC1 promotes EMT and colorectal cancer progression by attracting M2 macrophages via the TGF-β/Smad2/3/snail pathway. Cell Signal 2025, 130. [Google Scholar] [CrossRef] [PubMed]
- Yuan, Y; Yeh, LK; Liu, H; et al. Targeted overexpression of TGF-α in the corneal epithelium of adult transgenic mice induces changes in anterior segment morphology and activates noncanonical Wnt Signaling. Invest Ophthalmol Vis Sci 2013, 54, 1829–1837. [Google Scholar] [CrossRef]
- Yang, Z; Jiang, S; Cheng, Y; et al. FOXC1 in cancer development and therapy: deciphering its emerging and divergent roles. Ther Adv Med Oncol 2017, 9, 797–816. [Google Scholar] [CrossRef]
- Latta, L; Viestenz, A; Stachon, T; et al. Human aniridia limbal epithelial cells lack expression of keratins K3 and K12. Exp Eye Res 2018, 167, 100–109. [Google Scholar] [CrossRef]
- Siegenthaler, JA; Ashique, AM; Zarbalis, K; et al. Retinoic Acid from the Meninges Regulates Cortical Neuron Generation. Cell 2009, 139, 597–609. [Google Scholar] [CrossRef] [PubMed]
- Como, CN; O’Rourke, R; Winkler, C; et al. Meningeal-derived retinoic acid regulates neurogenesis via suppression of Notch and Sox2. Cell Rep 2025, 44. [Google Scholar] [CrossRef]
- Celik, SD; Ates, O. Analysis of CRABP2 and FABP5 genes in primary and recurrent pterygium tissues. Mol Biol Rep 2020, 47, 6105–6110. [Google Scholar] [CrossRef] [PubMed]
- Ramachandran, R; Ibragimova, S; Woods, LM; et al. Conserved role of FOXC1 in TNBC is parallel to FOXA1 in ER+ breast cancer. iScience 2024, 27. [Google Scholar] [CrossRef] [PubMed]
- Tang, X; Liang, Y; Sun, G; et al. Upregulation of CRABP2 by TET1-mediated DNA hydroxymethylation attenuates mitochondrial apoptosis and promotes oxaliplatin resistance in gastric cancer. Cell Death Dis. 2022, 13(10), 848. [Google Scholar] [CrossRef] [PubMed]
Figure 1.
Forkhead box C1 (FOXC1) mRNA and proteins levels (n=6; n=5) in primary human limbal epithelial cells (pLECs) 72 hours after transfection with control siRNA (blue) or with FOXC1 knockdown siRNA (pink), without or with lipopolysaccharide (LPS) or interleukin 1β (IL-1β) treatment (A-C). FOXC1 protein levels in pLECs - 48, 72, 96 hours after transfection with control siRNA (blue) or with FOXC1 knockdown siRNA (pink), without LPS or IL-1β treatment (n=4) (D-G). Data are shown as mean ± SD. Data have been tested for normal distribution with Shapiro-Wilk test. Statistical analysis has been performed using two-way ANOVA followed by Tukey’s post hoc test (A-E) or statistical analysis has been performed using t-test (F, G). p-values below 0.05 were considered statistically significant. Representative western blot images are also displayed (B, E). Each data point represents an individual donor.
Figure 2.
Cytokeratin 12 (KRT12) & cytokeratin 13 (KRT13), mRNA and proteins levels (n=6; n=5); and cytokeratin 3 (KRT3) and cytokeratin 19 (KRT19) mRNA levels in primary human limbal epithelial cells (pLECs) 72 hours after transfection with control siRNA (blue) or with FOXC1 knockdown siRNA (pink), without or with lipopolysaccharide (LPS) or interleukin 1β (IL-1β) treatment (A-H). Data are shown as mean ± SD. Data have been tested for normal distribution with Shapiro-Wilk test. Statistical analysis has been performed using two-way ANOVA followed by Tukey test. p-values below 0.05 were considered statistically significant. Representative western blot images also shown here (B, E). Each data point represents an individual donor.
Figure 3.
Interleukins 6 (IL-6), interleukin 8 (IL-8), interleukin 1α (IL-1α) mRNA and proteins levels (n=6; n=5) in primary human limbal epithelial cells (pLECs) 72 hours after transfection with control siRNA (blue) or with FOXC1 knockdown siRNA (pink), without or with lipopolysaccharide (LPS) or interleukin 1β (IL-1β) treatment (A-F). Data are shown as mean ± SD. Data have been tested for normal distribution with Shapiro-Wilk test. Statistical analysis has been performed using two-way ANOVA followed by Tukey test. p-values below 0.05 were considered statistically significant. Each data point represents an individual donor.
Figure 4.
Chemokine ligand 2 (CCL2), chemokine ligand 1 (CXCL1), chemokine ligand 10 (CXCL10) mRNA and proteins levels (n=6) in primary human limbal epithelial cells (pLECs) 72 hours after transfection with control siRNA (blue) or with FOXC1 knockdown siRNA (pink), without or with lipopolysaccharide (LPS) or interleukin 1β (IL-1β) treatment (A-F). Data are shown as mean ± SD. Data have been tested for normal distribution with Shapiro-Wilk test. Statistical analysis has been performed using two-way ANOVA followed by Tukey test. p-values below 0.05 were considered statistically significant. Each data point represents an individual donor.
Figure 5.
Vascular endothelial growth factor A (VEGFA), tumor necrosis factor α (TNF-α), transforming growth factor β (TGF-β) mRNA and proteins levels (n=6) in primary human limbal epithelial cells (pLECs) 72 hours after transfection with control siRNA (blue) or with FOXC1 knockdown siRNA (pink), without or with lipopolysaccharide (LPS) or interleukin 1β (IL-1β) treatment (A-F). Data are shown as mean ± SD. Data have been tested for normal distribution with Shapiro-Wilk test. Statistical analysis has been performed using two-way ANOVA followed by Tukey test. p-values below 0.05 were considered statistically significant. Each data point represents an individual donor.
Figure 6.
Cytochrome P450 (CYP1B1), Paired box protein 6 (PAX6), mRNA and protein levels (n=6; n=5) in primary human limbal epithelial cells (pLECs) 72 hours after transfection with control siRNA (blue) or with FOXC1 knockdown siRNA (pink), without or with lipopolysaccharide (LPS) or interleukin 1β (IL-1β) treatment (A-F). Data are shown as mean ± SD. Data have been tested for normal distribution with Shapiro-Wilk test. Statistical analysis has been performed using two-way ANOVA followed by Tukey test. p-values below 0.05 were considered statistically significant. Each data point represents an individual donor. FOXC1 siRNA knockdown significantly reduced CYP1B1 mRNA expression compared to siRNA controls under both non-inflammatory and inflammatory conditions (LPS or IL-1β treatment) (p<0.001). However, CYP1B1 protein levels did not change significantly following FOXC1 knockdown under any condition (p≥0.268) (A-C). Similarly, FOXC1 siRNA knockdown resulted in decreased PAX6 mRNA expression compared to siRNA controls after LPS treatment (p=0.023). In contrast, PAX6 protein levels remained unchanged across all conditions, regardless of inflammatory stimulation (D-F).
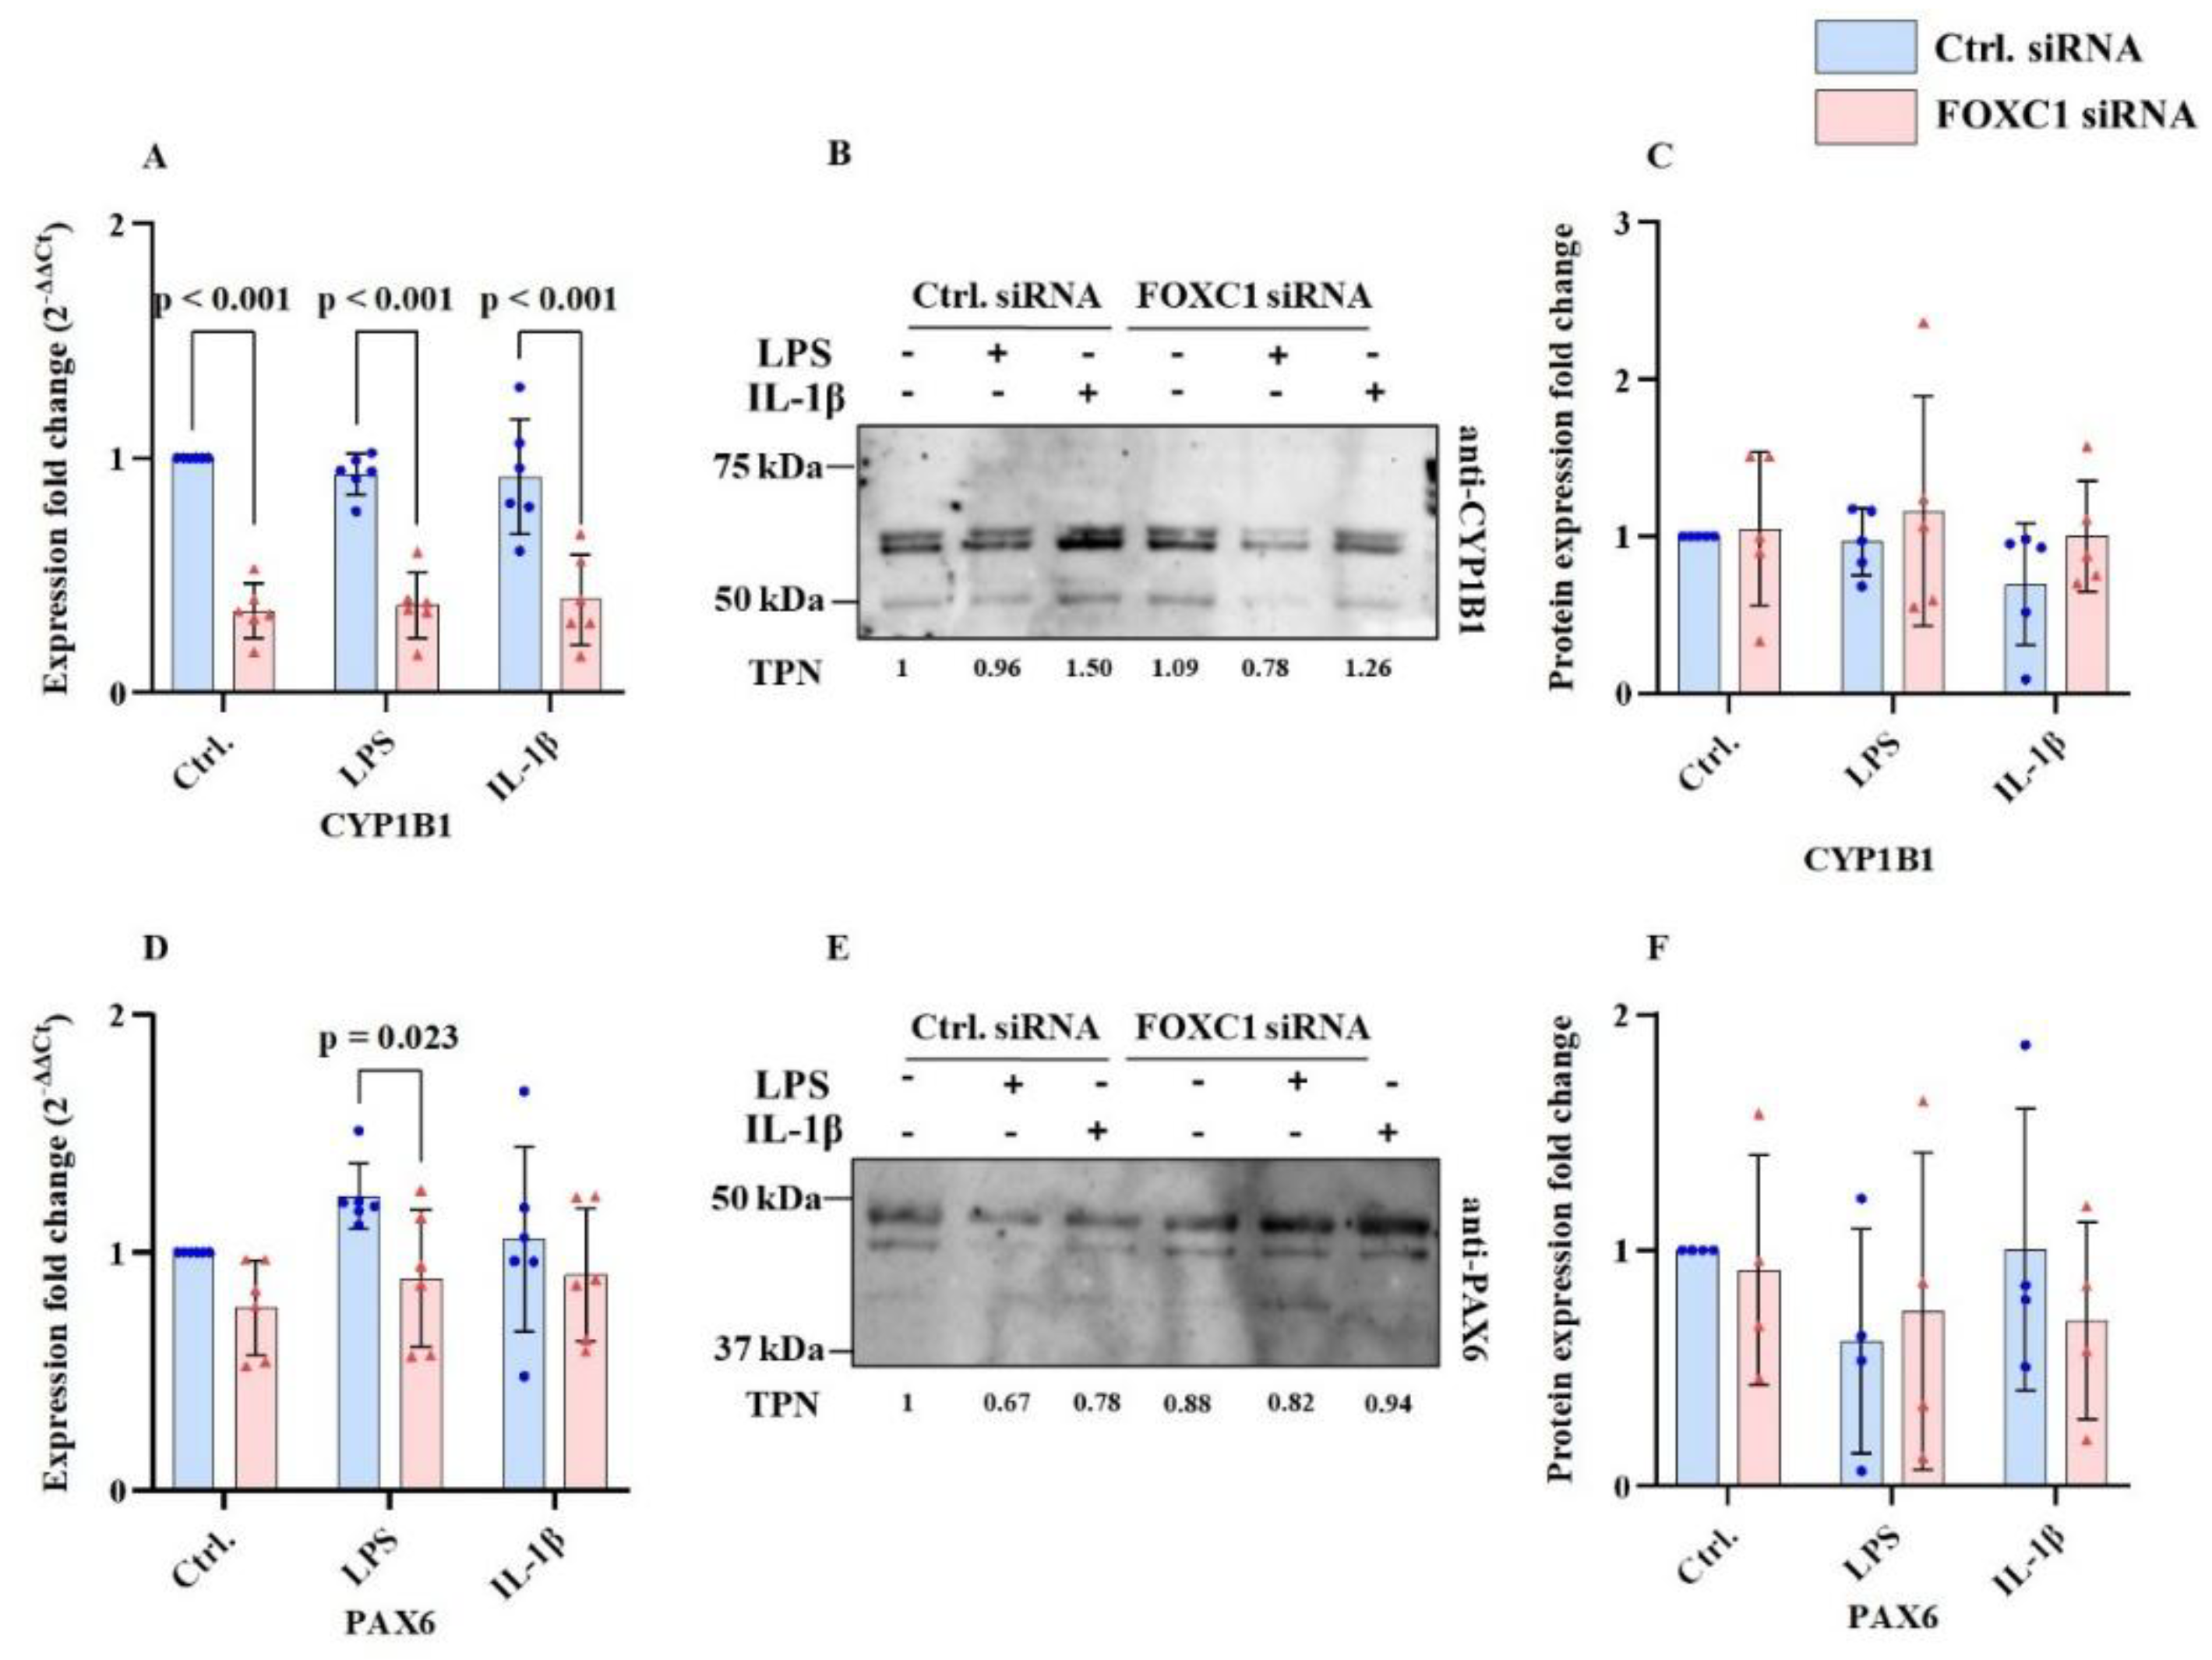
Figure 7.
Fatty acid binding protein 5 (FABP5), Cellular retinoic acid binding protein 2 (CRABP2) mRNA and protein levels (n=6; n=5) in primary human limbal epithelial cells (pLECs) 72 hours after transfection with control siRNA (blue) or with FOXC1 knockdown siRNA (pink), without or with lipopolysaccharide (LPS) or interleukin 1β (IL-1β) treatment. FABP5-CRABP2, ratio depicting FABP5-CRABP2 regulatory axis (A-G). Data are shown as mean ± SD. Data have been tested for normal distribution with Shapiro-Wilk test. Data from CRABP2 (mRNA) have been tested with Mann-Whitney/Wilcoxon test. Statistical analysis has been performed using two-way ANOVA followed by Tukey test. p-values below 0.05 were considered statistically significant. Each data point represents an individual donor.
Figure 8.
Retinol dehydrogenase 10 (RDH10), signaling receptor and transporter of retinol (STRA6), aldehyde dehydrogenase 3 family, member A1 (ALDH3A1), mRNA and proteins levels (n=6; n=5); and alcohol dehydrogenase 7 (ADH7), desmoglein 1 (DSG1), retinol binding protein 1 (RBP1) mRNA levels (n=6) in primary human limbal epithelial cells (pLECs) 72 hours after transfection with control siRNA (blue) or with FOXC1 knockdown siRNA (pink), without or with lipopolysaccharide (LPS) or interleukin 1β (IL-1β) treatment (A-L). Data are shown as mean ± SD. Data have been tested for normal distribution with Shapiro-Wilk test. Data from ADH7 have been tested with Mann-Whitney/Wilcoxon test. Statistical analysis has been performed using two-way ANOVA followed by Tukey test. p-values below 0.05 were considered statistically significant. Each data point represents an individual donor.
Figure 9.
Peroxisome proliferator-activated receptor gamma (PPARγ), nuclear factor kappa-light-chain-enhancer of activated B cells (NF-κB), Fos-like antigen 2 (FOSL2), serine peptidase inhibitor kazal type 7 (SPINK7), matrix metalloproteinase 2 (MMP2), mitogen-activated protein kinase 3/ extracellular signal-regulated kinase 2 (MAPK1/ERK2), mitogen-activated protein kinase 3 (MAPK3), & proliferation marker protein Ki-67 (Mki67) mRNA levels (n=6) in primary human limbal epithelial cells (pLECs) 72 hours after transfection with control siRNA (blue) or with FOXC1 knockdown siRNA (pink), without or with lipopolysaccharide (LPS) or interleukin 1β (IL-1β) treatment (A-H). Data are shown as mean ± SD. Data have been tested for normal distribution with Shapiro-Wilk test. Data from FOSL2 have been tested with Mann-Whitney/Wilcoxon test. Statistical analysis has been performed using two-way ANOVA followed by Tukey test. p-values below 0.05 were considered statistically significant. Each data point represents an individual donor.
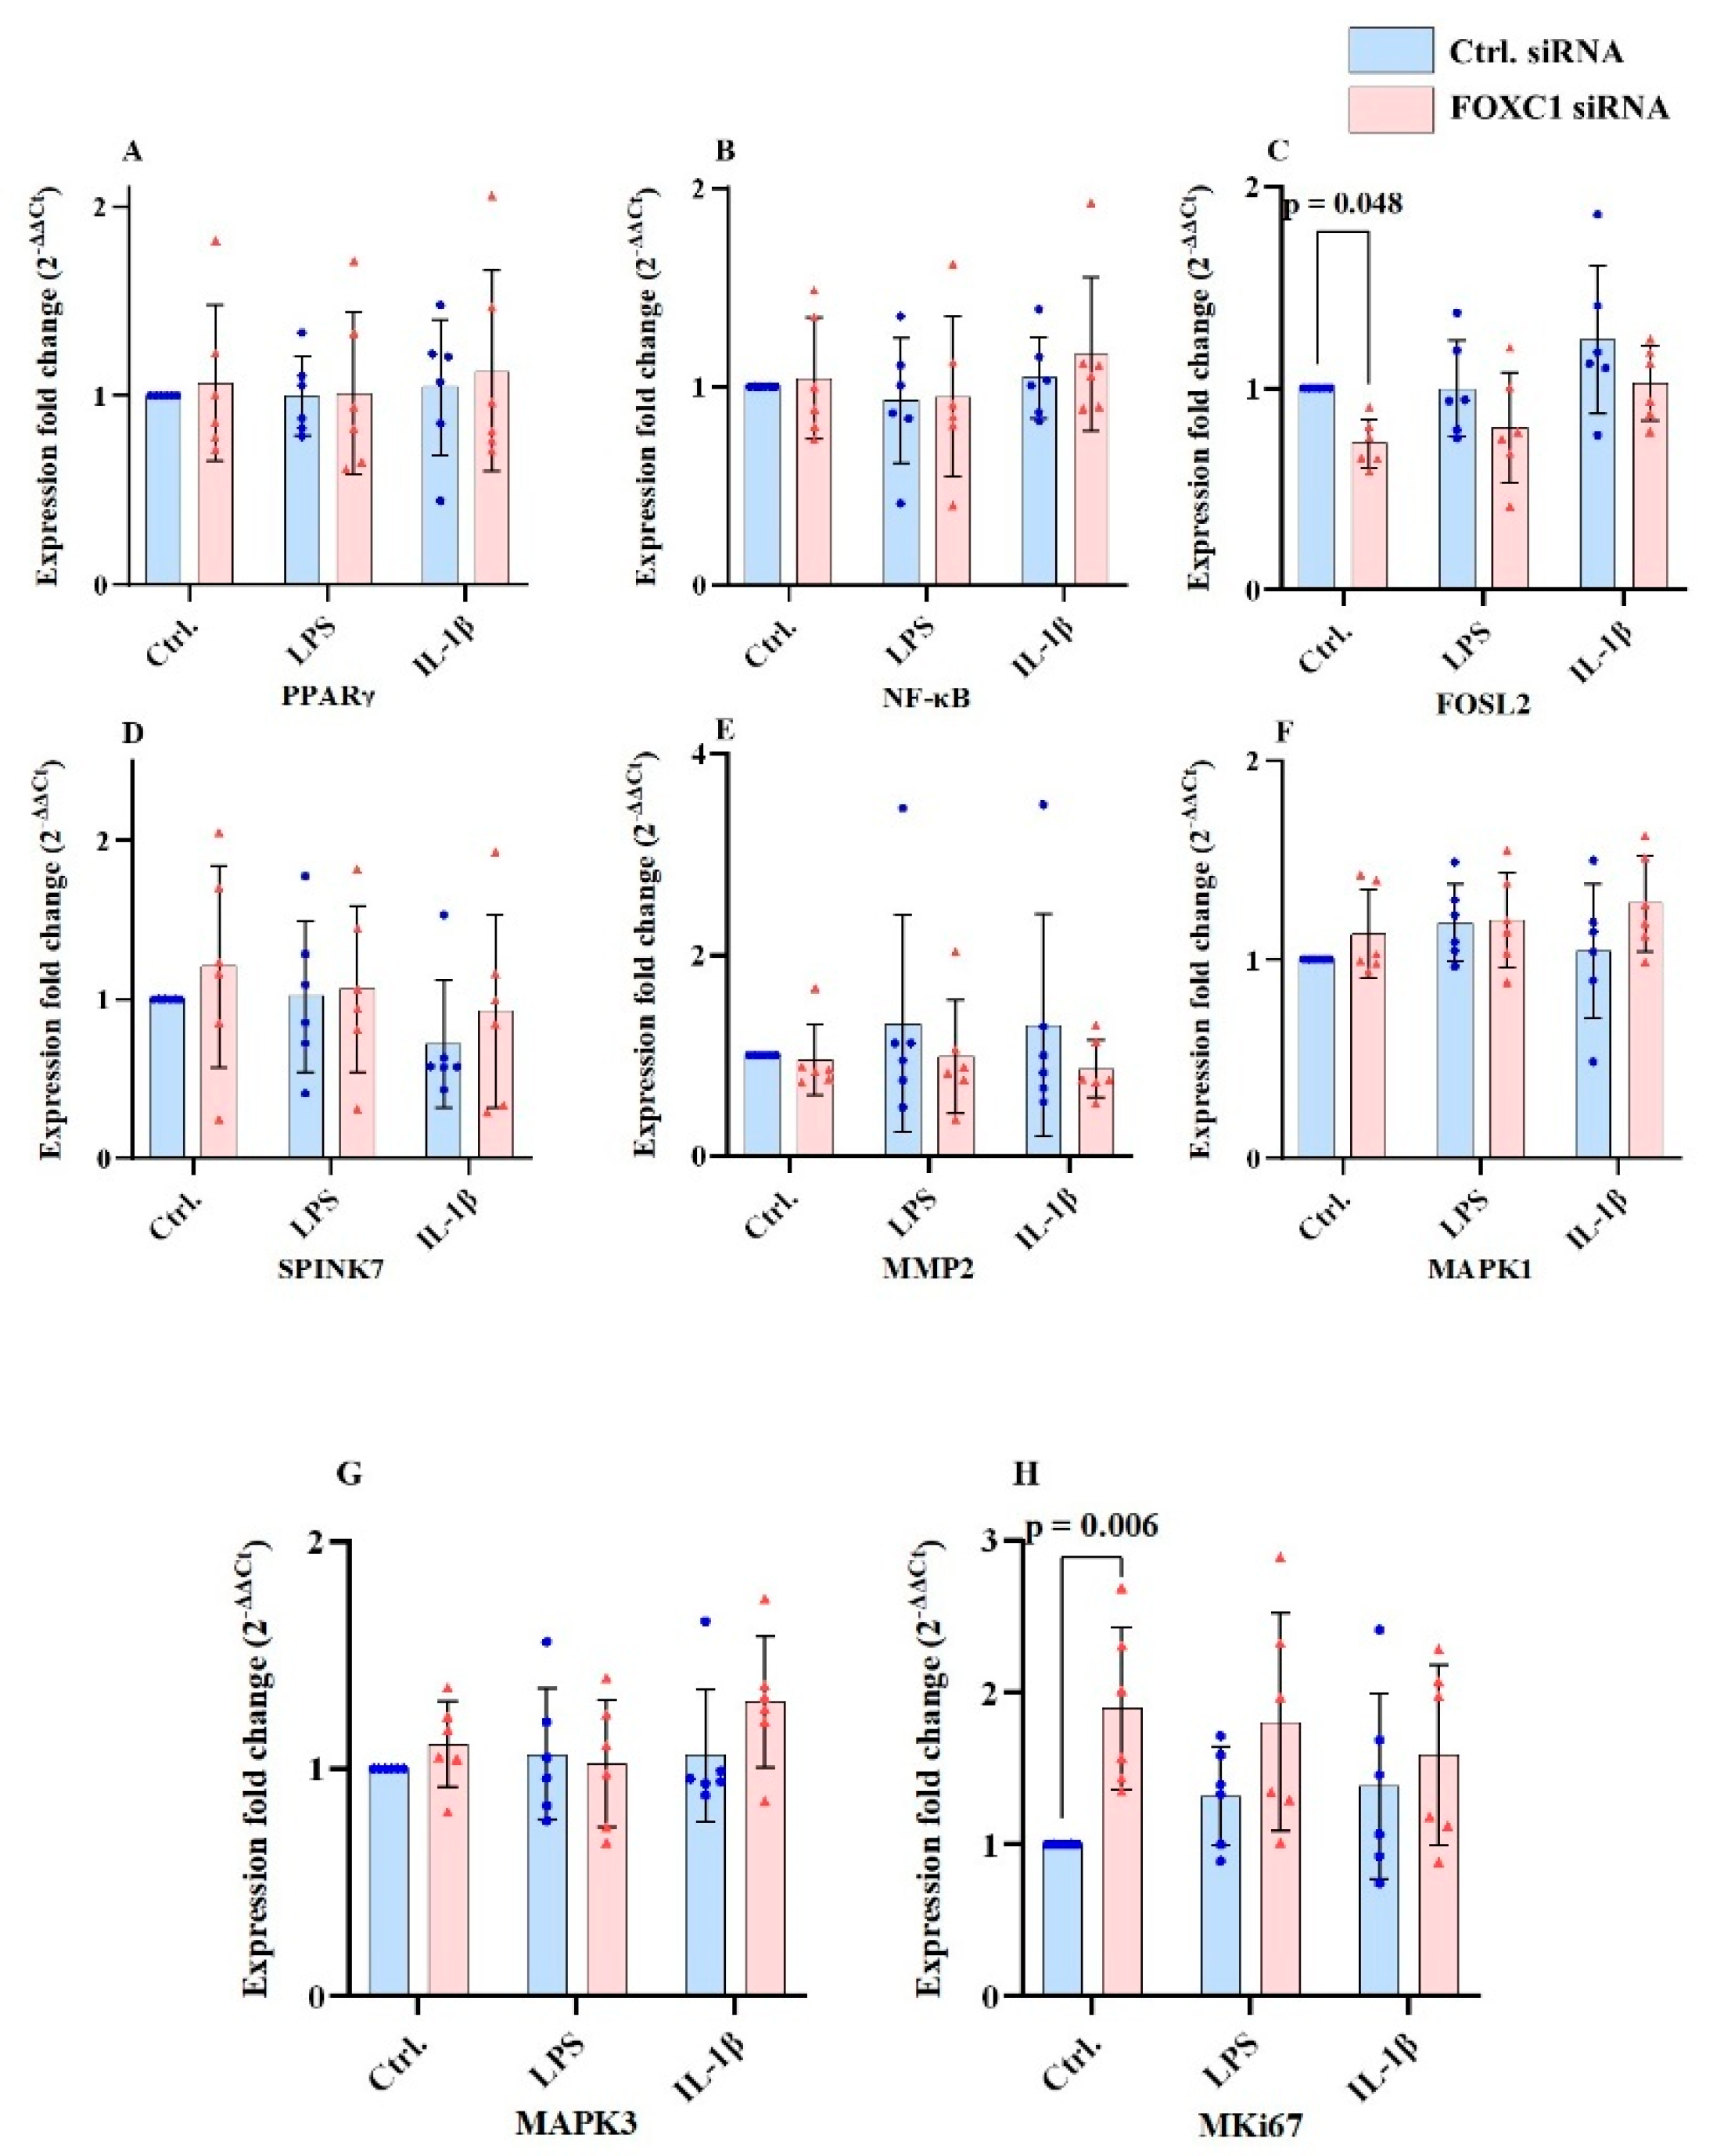
Figure 10.
The effects of FOXC1 siRNA–mediated knockdown in primary limbal epithelial cells (pLECs) on retinol metabolism, retinoic acid signaling, epithelial differentiation, cellular proliferation, and inflammatory cytokine secretion. The depicted interactions are derived from data generated in this study and integrated with information from the STRING and KEGG databases. ADH7: aldehyde dehydrogenase 7; ALDH3A1: Enzyme aldehyde dehydrogenase 3 family member A1; CRABP2: cellular retinoic acid-binding protein 2; FOSL2: fos-like antigen 2; IL-6: interleukin-6; IL-8: interleukin-8; IL-1α: interleukin-1α; KRT12: cytokeratin 12; KRT13: cytokeratin 13; MKi67: marker protein Ki-67; FABP5: Fatty acid binding protein 5; PAX6: paired box 6; RBP1: retinol-binding protein 1; RDH10: retinol dehydrogenase 10; STRA6: Signaling receptor and transporter of retinoic acid; TGF-β: transforming growth factor β.
Table 1.
Demographic information (gender and age) of de-identified healthy corneal donors used in this study has been tabulated below. The data is based on information provided by the Lions Cornea Bank Saar-Lor-Lux, Trier/Westpfalz & Klaus Faber Centre.
Table 1.
Demographic information (gender and age) of de-identified healthy corneal donors used in this study has been tabulated below. The data is based on information provided by the Lions Cornea Bank Saar-Lor-Lux, Trier/Westpfalz & Klaus Faber Centre.
| Donors |
Gender (42.85% Male) |
Age (Years)76.16 ±6.87 (67-92)
|
| Donor 1 |
Male |
67 |
| Donor 2 |
Male |
68 |
| Donor 3 |
Female |
72 |
| Donor 4 |
Male |
77 |
| Donor 5 |
Female |
81 |
| Donor 6 |
Female |
92 |
| Donor 7 |
Female |
unknown |
Table 2.
Information of QuantiTectTM primer pairs used for SYBR-Green based qRT-PCR, Qiagen (Venlo, Netherlands).
Table 2.
Information of QuantiTectTM primer pairs used for SYBR-Green based qRT-PCR, Qiagen (Venlo, Netherlands).
| Target mRNA transcript with transcript ID (source: NCBI) |
Catalogue No. |
Amplicon size (bp) |
|
ADH7: NM_000673 |
QT00000217 |
87 bp |
|
ALDH3A1: NM_000691 |
QT0240193 |
121 bp |
|
CCL2: NM_002982 |
QT00212730 |
60 bp |
|
CRABP2: NM_001199723 |
QT00063434 |
140 bp |
|
CXCL1: NM_001511 |
QT00199752 |
120 bp |
|
CXCL10: NM_001565 |
QT01003065 |
129 bp |
|
CYP1B1: NM_000104 |
QT00209496 |
114 bp |
|
DSG1: NM_001942 |
QT00001617 |
96 bp |
|
FABP5: NM_001444 |
QT00225561 |
97 bp |
|
FOSL2: NM_005253, XM_005264231, XM_006711976, XM_006711977 |
QT01000881 |
126 bp, 177 bp,
229 bp |
|
FOXC1: NM_001453 |
QT00217161 |
109 bp |
|
IL-1α: NM_000575 |
QT00001127 |
74 bp |
|
IL-6: NM_000600, XM_005249745 |
QT00083720 |
107 bp |
|
IL-8: NM_000584 |
QT00000322 |
102 bp |
|
KRT3: NM_057088, XM_006719393, XM_005268859, XM_006719392 |
QT00050365 |
118 bp |
|
KRT12: NM_000223 |
QT00011949 |
104 bp |
|
KRT13: NM_002274, NM_153490 |
QT00068747 |
60 bp |
|
KRT19: NM_002276 |
QT00081137 |
117 bp |
|
MAPK1: NM_002745, NM_138957 |
QT00065933 |
118 bp |
|
MAPK3: NM_001109891, NM_002746 |
QT02589314 |
180 bp |
|
MKi67: NM_001145966, NM_002417, XM_006717864 |
QT00014203 |
86 bp |
|
MMP2: NM_004530 |
QT02395778 |
95 bp |
|
NFkβ: (RELA 2): NM_001243984, NM_001243985, NM_001145138, NM_021975 |
QT02324308 |
136 bp |
|
PAX6: NM_000280, NM_001127612, NM_001604, NM_001258462, NM_001258463, NM_001258464, NM_001258465 |
QT00071169 |
113 bp |
|
PPARγ: NM_005037, NM_015869, NM_138711, NM_138712, XM_006713208 |
QT00029841 |
113 bp |
|
RBP1: NM_002899, NM_001130992, NM_001130993 |
QT01850296 |
126 bp |
|
RDH10: NM_172037 |
QT00029176 |
107 bp |
|
SPINK7: NM_032566 |
QT00039585 |
126 bp |
|
STRA6: NM_001142618, NM_022369, NM_001142617, NM_001199042, NM_001142619, NM_001199041, NM_001199040 |
QT00006748 |
74 bp |
|
TBP: NM_001172085, NM_003194 |
QT00000721 |
132 bp |
|
TNF-α: NM_000594 |
QT00029162 |
98 bp |
|
TGF-β: NM_000594 |
QT00029162 |
98 bp |
|
VEGA: NM_001025366, NM_001025367, NM_001025368, NM_001033756, NM_001171623, NM_001171624, NM_001171625, NM_001171626, NM_001171629, NM_003376, NM_001287044 |
QT01010184 |
150 bp 204 bp, 222 bp, 273 bp |
Table 3.
List of primary antibodies used in Western blot, immunoblotting analysis.
Table 3.
List of primary antibodies used in Western blot, immunoblotting analysis.
Antibody
|
Source
|
Molecular weight (kDa) |
Catalog No./ Manufacturer
|
Dilution
|
| ALDH3A1 |
Rabbit, polyclonal |
48 kDa |
15578-1-AP, Proteintech, USA |
1:3000 |
| CRABP2 |
Mouse, monoclonal |
14 kDa |
10225-1-AP, Proteintech, USA |
1:2500 |
| CYP1B1 |
Rabbit, polyclonal |
61 kDa |
18505-1-AP, Proteintech, USA |
1:250 |
| FABP5 |
Rabbit, polyclonal |
15 kDa |
12348-1-AP, Proteintech, USA |
1:1000 |
| FOSL2 |
Mouse, monoclonal |
50 kDa |
TA809660S, OriGene Technologies, USA |
1:2000 |
(i) FOXC1
(ii) FOXC1 |
Rabbit, polyclonal
Mouse, monoclonal |
72 kDa
55 kDa |
30082-1-AP, Proteintech, USA
MAB6329-SP, R&D Biotechne, USA |
1:500
1:500 |
| KRT12 |
Mouse, monoclonal |
54 kDa |
sc-515882, Santa Cruz Biotechnology, USA |
1:100 |
| KRT13 |
Mouse, monoclonal |
52 kDa |
sc-101460, Santa Cruz Biotechnology, USA |
1:200 |
| PAX6 |
Rabbit, polyclonal |
46-48 kDa |
AB-2237, Merck, Germany |
1:1000 |
| RDH10 |
Rabbit, polyclonal |
39 kDa |
14644-1-AP, Proteintech, USA |
1:1000 |
| STRA6 |
Rabbit, polyclonal |
73-78 kDa |
22001-1-AP, Proteintech, USA |
1:2500 |
Table 4.
List of ELISA kits used. All kits were from R&D BioTechne, (Minneapolis, USA).
Table 4.
List of ELISA kits used. All kits were from R&D BioTechne, (Minneapolis, USA).
| Detected protein |
Catalog No./Lot No. |
Range of detection |
| CCL2 |
DY279-05 / P456545 |
1000 pg/mL - 7.8 pg/mL |
| CXCL1 |
DY275-05 / P436085 |
2000 pg/mL - 15.65 pg/mL |
| CXCL10 |
DY266-05 / P432346 |
2000 pg/mL - 15.65 pg/mL |
| IL-1α |
DY200-05 / P410705 |
500 pg/mL - 3.90 pg/mL |
| IL-6 |
DY206-05 / P437281 |
600 pg/mL - 4.7 pg/mL |
| IL-8 |
DY208-05 / P445124 |
2000 pg/mL - 15.65 pg/mL |
| TNF-α |
DY210-05 / P452568 |
1000 pg/mL - 7.8 pg/mL |
| TGF-β |
DY240-05 / P424503 |
2000 pg/mL - 15.65 pg/mL |
| VEGFA |
DY293B-05 /P394527 |
2000 pg/mL - 15.65 pg/mL |
|
Disclaimer/Publisher’s Note: The statements, opinions and data contained in all publications are solely those of the individual author(s) and contributor(s) and not of MDPI and/or the editor(s). MDPI and/or the editor(s) disclaim responsibility for any injury to people or property resulting from any ideas, methods, instructions or products referred to in the content. |
© 2026 by the authors. Licensee MDPI, Basel, Switzerland. This article is an open access article distributed under the terms and conditions of the Creative Commons Attribution (CC BY) license (http://creativecommons.org/licenses/by/4.0/).