
Submitted:
05 May 2023
Posted:
06 May 2023
You are already at the latest version
Abstract
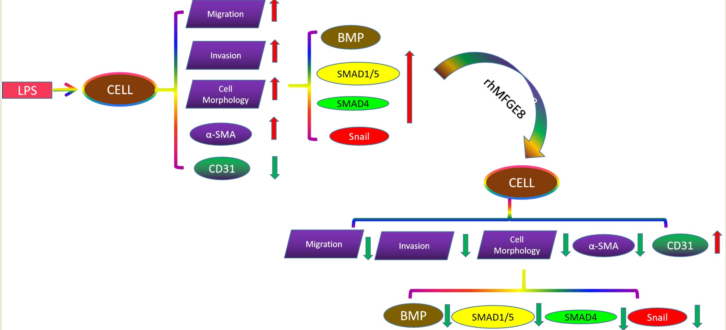
Background and Objectives: Acute lung injury (ALI) is an inflammatory response in the lung caused by bacteria, viruses, trauma and other factors that results in lack of alveolar surfactant and subsequently respiratory distress. Endothelial-to-mesenchymal transition (EndoMT) is closely related to ALI-induced pulmonary fibrosis development and progression. This study examined the effect of milk fat globulin factor 8 (MFGE8) knockdown and overexpression on lipopolysaccharide (LPS)-induced EndoMT. Methods: Total MFGE8 activity in patients with acute respiratory distress syndrome (ARDS) and healthy volunteers was assessed using a colorimetric kit. In vitro, cell morphology was observed by microscopy, and invasion and migration were tested by Transwell and scratch assays. Specific siRNAs were transfected into HLMECs to downregulate MFGE8, and CD31 and α-SMA protein expression was detected by fluorescence microscopy and FCM. MFGE8, BMP, Smad 1, Smad4, Smad5, Snail, CD31 and α-SMA protein and gene expression was assessed by western blotting (WB) and qRT‒PCR. In vivo, the changes in cell morphology and alveolar septum in the lung of mice (C57BL/6, aged 7-8 weeks, male) were observed by H&E staining. In addition, ECM deposition in lung tissue was detected by Masson staining. CD31 and α-SMA protein expression in lung tissue was measured by WB. Results: The serum level of MFGE8 was lower in the ARDS group than in the control group. MFGE8 was identified as a protective factor associated with hospital survival. In vitro, the treatment of human lung microvascular endothelial cells (HLMECs) with LPS for 96 h clearly changed the cells from the typical cobblestone shape of ECs to spindle-like fibroblasts. The scratch and Transwell assay results indicated that endothelial cell migration and invasion were enhanced in the LPS group compared with the control group. Fluorescence microscopy, FCM, WB and PCR showed that LPS greatly inhibited CD31 (endothelial marker) expression and increased α-SMA (mesenchymal marker) expression. These data showed that LPS could induce EndoMT in HLMECs. Notably, siRNA-treated HLMECs yielded the same results. The administration of rhMFGE8 to HLMECs in the LPS or LPS+siRNA group ameliorated the changes in cell morphology and decreased cell migration and invasion. rhMFGE8 attenuated the effect of LPS or LPS+siRNA on EndoMT induction by increasing CD31 and decreasing α-SMA protein and gene expression. Moreover, activation of BMP/Smad1/5-Smad4 signalling in response to LPS and Snail (related to EndoMT transcription factors) expression were increased by MFGE8 knockdown but inhibited by rhMFGE8. In vivo, H&E staining revealed a thickened alveolar septum in the LPS group, and the thickness increased over time; in contrast, rhMFGE8 reversed this effect. ECM deposition occurred early in ALI induced by LPS and increased over time, and the administration of rhMFGE8 reversed this effect. WB showed that LPS inhibited CD31 protein expression and increased α-SMA protein expression in lung tissue. Conclusions: rhMFGE8 exerts a protective effect early in LPS-induced EndoMT through BMP/Smad1/5/Smad4 signalling and could be a therapeutic target in ALI.
Keywords:
acute lung injury
; endothelial-to-mesenchymal transition
; milk fat globule factor 8
; Smad1/5/Smad4
1. Introduction
Acute lung injury (ALI) and acute respiratory distress syndrome (ARDS) are important causes of acute respiratory failure[1,2,3], and their pathological features are acute diffuse inflammatory injury accompanied by a lack of surfactant and acute respiratory distress. Traditionally, the pathological process of ALI is a continuous process that includes exudation, proliferation and fibrosis[3,4,5]. However, the process of fibrosis in ALI was recently shown to be initiated during the early stage. Ameliorating pulmonary fibrosis is beneficial for improving refractory hypoxemia, decreasing the use of ventilators and improving patient survival[3,6]. The current research aim is to alleviate pulmonary fibrosis[7,8].
Many studies have shown that pulmonary fibrosis is the result of the deposition of extracellular matrix (ECM), which is generated by myofibroblasts[9,10]. Myofibroblasts from endothelial cells (ECs) undergo a process known as endothelial-to-mesenchymal transition (EndoMT), and through this process, the cells acquire a mesenchymal phenotype[11]. Under specific physiological and pathological conditions, the polarity of EndoMT ECs is weakened, the tight junctions between ECs are lost, and the cells acquire the movement and contraction characteristics of mesenchymal cells. After these changes, the cells detach from the endothelial layer, and their migration and invasion are significantly enhanced after the cells migrate to the interstitium and transform into myofibroblasts. During this transformation, the cells change from cobblestone-like to elongated spindle-shaped cells, lose specific molecular markers of ECs [CD31/PECAM-1, von Willebrand factor (vWF), and VE-cadherin], and acquire specific molecular markers of mesenchymal cells (α-SMA, vimentin, and type I collagen)[12].
Several studies have demonstrated that the generation of myofibroblasts depends on the transforming growth factor beta (TGF-β) signalling pathway[13,14,15]. Bone morphogenetic proteins (BMPs) belong to the TGF-β family and can bind serine-threonine kinase receptors, including type II and type I receptors[10]. Studies have shown that BMP type I receptors can induce phosphorylation of Smad1, Smad5 and Smad8, and these receptors can also associate with phosphorylated Smad4, form a complex in the nucleus and cooperate with other transcription factors to regulate the transcriptional responses of target genes, which results in regulation of the EndoMT process[16,17,18].
Milk fat globule epidermal growth factor 8 (MFGE8) is an important molecule that mediates phagocytosis and is expressed in the alveolar epithelium, vascular ECs and macrophages[19]. It has been reported that this protein has crucial physiological and pathophysiological functions in various diseases, including liver, pulmonary and cardiovascular diseases. Laura W. Hansen found that MFGE8 deficiency leads to increased inflammation, tissue damage, neutrophil infiltration, and apoptosis, which causes sepsis in neonatal mice and results in elevated morbidity and mortality[20]. The Monowar Aziz study clearly indicated the importance of MFGE8 in improving neutrophil infiltration and demonstrated the potential of MFGE8 as a novel treatment for ALI[21]. Furthermore, in recent years, an increasing number of studies have highlighted the potential role of MFGE8 in organ fibrosis, as revealed by the findings that MFGE8 slows the degree of skin and renal fibrosis in mice and reduces tissue fibrosis in mouse models of liver and cardiac fibrosis[19,20,22]. However, the molecular mechanisms of MFGE8 and EndoMT remain unclear and need to be examined. We hypothesized that rhMFGE8 exerts a protective effect against EndoMT induced by lipopolysaccharide (LPS) through the BMP/Smad1/5/Smad4 signalling pathway.
2. Materials and methods
2.1. Clinical study and data collection
In this study, 44 patients with ARDS and healthy volunteers who were admitted to the Second Affiliated Hospital of Chongqing Medical University (Chongqing, China) between April 1 and August 12, 2021, were enrolled. Hospital nonsurvival was defined as death in the hospital (n = 11), and hospital survival was defined as discharge home with unassisted breathing (n = 33). The inclusion criteria were in accordance with the 2012 Berlin definition of ARDS. The exclusion criteria included congestive heart failure, interstitial lung disease, connective-tissue diseases such as polymyositis, diffuse alveolar haemorrhage due to vasculitis or Goodpasture syndrome, drug-induced lung diseases, cancer, and endobronchial tuberculosis. Blood serum samples were obtained from the patients and volunteers and cryopreserved at −80°C for subsequent experiments. All patients and volunteers provided written informed consent, and the Ethics Committee of the Second Affiliated Hospital of Chongqing Medical University approved this study.
2.2. Cell culture
Human lung microvascular endothelial cells (HLMECs) were purchased from ScienCell (ScienCell Research Laboratories, Inc., CA, USA, cat. no. 3000) and stored at the College of Life Science. We cultured the cells with DMEM/F-12 (ScienCell Research Laboratories, Inc., CA, USA, cat. no. 09421), 10% standard foetal bovine serum (HyClone, Waltham, MA, USA, cat. no. SH30084.03) and 1% penicillin–streptomycin (ScienCell Research Laboratories, Inc., CA, USA, cat. no. 0513) in a 5% CO2 incubator at 37°C.
2.3. Mouse model of ALI
Mice (C57BL/6, aged 7-8 weeks, male) were purchased from the Laboratory Animal Center of Chongqing Medical University. In this study, all experimental animals were housed in the school’s accredited animal facility, which was certified by the Association of Assessment and Accreditation of Laboratory Animal Care International (AAALAC), under a comfortable temperature (24°C) and light cycles (12-h light/12-h dark) and provided sterile mouse chow and water ad libitum. The experimental procedure was implemented in a pathogen-free manner. Forty-five mice were divided into three groups according to a completely randomized design. The mice in the control group were intraperitoneally administered physiological saline. Those in the LPS group were intraperitoneally administered 5 mg/kg LPS dissolved in physiological saline, and those in the LPS+rhMFGE8 group were intraperitoneally administered 5 mg/kg LPS and 20 µg/kg rhMFGE8. At the endpoint of the experiment, the experimental mice were anaesthetized with sodium pentobarbital (60 mg/kg) and euthanised with potassium chloride (100 mg/kg) on days 7, 14 and 28. The Animal Ethics Committee of Chongqing Medical University authorized all animal experimental protocols.
2.4. Antibodies and chemicals
LPS (from Escherichia coli 055:B5, 5 mg/ml, cat. no. L8880) was purchased from Solarbio Limited Company. LDN-2128549 (BMP receptor inhibitor, cat. no.1432597-26-6) was procured from APEXBIO Company. rh-MFGE8 (cat. no. 2767-MF) was purchased from R&D Systems, a biotech company. The MFGE8 ELISA kit (cat. no. SEB286Hu) was obtained from Cloud-Clone Limited Company. siRNA-MFGE8-1 (lot number: 430019983), siRNA-MFGE8-2 (lot number: 430084101), and siRNA-MFGE8-3 (lot number: 430048100) were obtained from Qiagen Limited Company. AB Antibody Technology provided primary antibodies, such as CD31 (1:1,000, cat. no. ab9498) and BMP4 (1:1,000, cat. no. ab39973) antibodies, and Cell Signaling Technology (Danvers, CT, USA) provided other antibodies, including α -SMA (1:1,000, cat. no. 19245), Snail (1:1,000, cat. no. 3879), Smad1 (1:1,000, cat. no. 6499), Smad4 (1:1,000, cat. no.46535), and Smad5 (1:1,000, cat. no.12534) antibodies. Fluorochrome-conjugated antibody (goat anti-rabbit IgG H&L/AF488 antibody, bs-0295G-AF488) was purchased from Bioss Antibodies Limited Company. The Beyotime Institute of Biotechnology (Shanghai, China) provided secondary antibodies, including horseradish peroxidase (HRP)-conjugated goat anti-rabbit IgG (cat. no. A0208) and anti-mouse IgG (cat. no. A0192).
2.5. Cell morphology and imaging
HLMECs were seeded in culture bottles after the cells reached logarithmic growth. The control cells were treated with administered physiological saline, the cells in the LPS group was treated with 20 μg/ml LPS dissolved in physiological saline, and those in the LPS+rhMFGE8 group were treated with 20 μg/ml LPS and 80 μg/ml rhMFGE8. The cells in the LPS+siRNA group were treated with 20 μg/ml LPS and 100 nM siRNA, and those in the LPS+siRNA+rhMFGE8 group were treated with 20 μg/ml LPS, 80 μg/ml rhMFGE8 and 100 nM siRNA. The cells were incubated for 96 h. The cell morphology was observed using an inverted system microscope provided by Olympus Company and photographed.
2.6. Transwell migration assay
Cell migration was assessed using a Transwell chamber assay (8 μm pore size, Corning, 3413) according to the manufacturer’s instructions. A total of 1 × 10⁵ HLMECs were treated with LPS (20 μg/ml), siRNA and/or rhMFGE8 and resuspended in serum-free medium, and the cells were added to the upper layer of the Transwell chambers. DMEM/F12 medium containing 10% foetal bovine serum was added to the lower layer, and the cells were incubated for 24 h. The chambers were washed, and cotton buds were used to remove the cells on the upper surface. The cells on the lower surface were fixed with 4% paraformaldehyde for 30 min and then stained with crystal violet for 30 min. The cell numbers in five randomly selected areas were counted to evaluate cell migration.
2.7. Scratch assay
Cells were seeded in 6-well plates at a density of 5.0 × 10⁵ cells/ml. When the confluence of the cells reached 90%, the cell monolayer was scratched with a sterile 200 μL pipette tip, and the wells were washed twice with PBS. Images were taken using an inverted system microscope provided by Olympus Company, and the migration distance was analysed using Image-Pro Plus 6.0
2.8. Cellular immunofluorescence
Cells were added to 24-well plates with cover slips, cultured for 96 h with stimulation, fixed in 4% paraformaldehyde for 15 min, permeabilised with 0.5% Triton X-100 for 20 min and blocked for 30 min. Subsequently, primary antibodies against CD31 and/or α-SMA were added, and the cells were incubated overnight at 4°C. Secondary antibodies conjugated to Alexa Fluor 488 were added, and the cells were incubated for 1 h. DAPI was then added for visualization. ImageJ was used to quantify the fluorescence intensity in five randomly selected areas.
2.9. Flow cytometry
After stimulation, the cells were fixed in 4% paraformaldehyde for 15 min and permeabilized with Triton X-100 (0.5%). The cells were then incubated with anti-CD31 and α-SMA antibodies, and cell fluorescence was measured with a FACSCanto II instrument (Becton Dickinson, San Jose, CA, USA) and analysed using Flow Jo software (Tree Star, San Carlos, CA, USA).
2.10. RNA interference
Small interfering RNAs (siRNAs) targeting human MFGE8 were obtained from Qiagen. According to the manufacturer’s instructions, we transiently transfected the cultured cells using Lipofectamine™ 8000 (Beyotime Institute of Biotechnology) and 100 nM siRNA. We performed western blotting and q-PCR to measure the efficiency and to obtain specific siRNAs, which were used for future experiments. The targeting sequences of the siRNAs were (a) AGTGGAGAACACGAAT, (b) TCACTCCGGAATAAAT, and (c) TGGCTGTCAGGAATTG.
2.11. Quantitative real-time PCR
Total RNA from the cells was extracted using TRIzol reagent (Takara, Code No. 9108) and transcribed into complementary DNA (cDNA) using the PrimeScript RT kit (Takara, RR047A). Quantitative real-time polymerase chain reaction (qRT‒PCR) was performed in a 50 μL reaction volume using SYBR Green (Takara, RR820A). β-Actin was used as the reference gene, and the change in mRNA was quantified using the 2-ΔΔCq method. The primer pairs are listed in Table 1.
2.12. Western blotting
Total protein was isolated from the cells, and the protein concentration was measured with a BCA protein assay kit. Equal amounts of protein (40 µg) were separated using 10-15% SDS‒PAGE. The separated proteins were subsequently transferred to PVDF (0.22 μm or 0.45 μm) membranes. The membranes were then blocked, incubated with primary antibodies overnight at 4°C, washed with TBST, and incubated with HRP-conjugated goat anti-rabbit IgG or goat anti-mouse IgG secondary antibodies. ECL reagents were used to visualize the signals. Image Lab software was used for densitometry analysis of the immunoblots.
2.13. H&E staining
Lung tissue blocks were embedded in paraffin, cut into specimens and deparaffinized with xylene. Ethanol was then used for dehydration. The sections were dyed with haematoxylin for 5 min and differentiated with hydrochloric acid in ethanol. The samples were then soaked in warm water for 15 min, transferred into eosin solution for 2 min and dehydrated with ethanol. The sections were then sealed with neutral resin.
2.14. Masson staining
The degree of lung fibrosis was determined by Masson staining. Paraffin sections of lung tissues were routinely prepared and stained with Masson’s trichrome blue. The samples were sequentially stained with haematoxylin for at least 6 min, Masson complex oil for 5 min, 5% phosphomolybdic acid for 5 min, and 2% aniline blue for 10 min. The samples were routinely dehydrated and placed on slides, and the sections were observed with an optical microscope.
2.15. Statistical analysis
All data were calculated and analysed using PSS 22.0 statistical software and GraphPad Prism 6.0. The statistical analyses were performed using two-tailed Student’s t test. Differences between the control and treated samples were considered statistically significant if P <0.01.
3. Results
3.1. MFGE8 was identified as a protective factor in ARDS patients
Serum samples were collected from patients with ARDS and healthy volunteers. The baseline characteristics of the ARDS patients and controls were not significantly different regarding age or sex. The characteristics of all the patients are listed in Supplementary Table 1 and Table 2. The expression of MFGE8 was examined by ELISA, and the results suggested that the expression of MFGE8 in the ARDS group (Figure 1A, 61.11 ± 22.77 pg/ml) was lower than that in the control group (Figure 1A, 79.36 ± 14.9 pg/ml). The MFGE8 levels were markedly higher in patients who were successfully discharged from the hospital (survivors, Figure 1B, 65.6±18.94 pg/ml) than in those who died in the hospital (nonsurvivors, Figure 1B, 45.09±10.79 pg/ml). These data showed that MFGE8 was a protective factor associated with hospital survival.
3.2. HLMEC EndoMT was induced by LPS in vitro
We cultured HLMECs with LPS (20 μg/mL) for 96 h and observed their morphology by microscopy, which revealed a clear changed from the cobblestone shape of ECs to spindle-like fibroblasts (Figure 2A). In addition, we performed a scratch assay to assess endothelial cell migration and a Transwell assay to analyse invasion. The results indicated that endothelial cell migration and invasion were enhanced in the LPS group compared with the control group (Figure 2B, C). The changes in the protein expression of the endothelial cell marker CD31 and the mesenchymal marker α-SMA were assessed by fluorescence microscopy (Figure 2D) and flow cytometry (Figure 2G), and LPS greatly inhibited the protein expression of CD31 and increased the protein expression of α-SMA. Western blotting showed the same changes at the protein level (Figure 2E). The mRNA levels of CD31 and a-SMA in the LPS group were 0.67-fold and 2.3-fold of those found in the control group. These data showed that LPS could induce EndoMT in HLMECs(Figure 2F).
3.3. HLMEC EndoMT was exacerbated by siRNA-mediated knockdown of MFGE8
The expression of MFGE8 at the protein level was decreased by approximately 40% in HLMECs treated with LPS (Figure 3A). The mRNA levels of MFGE8 in the LPS group were 0.67-fold those of the control group (Figure 3B). We examined whether MFGE8 could promote EndoMT in HLMECs. Subsequently, specific siRNAs (siRNA-MFGE8-1, siRNA-MFGE8-2, and siRNA-MFGE8-3) were transfected into HLMECs to downregulate MFGE8 expression, and the knockdown efficiency was analysed by western blotting (Figure 3C) and qRT‒PCR (Figure 3D). The results showed that siRNA-MFGE8-2 could decrease the expression of MFGE8 protein by approximately 80% compared with that found in the negative control group(Figure 3C). The mRNA levels of MFGE8 in the siRNA-MFGE8-1, siRNA-MFGE8-2 and siRNA-MFGE8-3 group were 0.28-fold, 0.07-fold, and 0.86-fold those in the negative control group, respectively(Figure 3D).
Therefore, siRNA-MFGE8-2 was used in the following experiments and referred to as siRNA. We then used a microscope to observe the cell morphology and found that the siRNA induced a change from the cobblestone shape of ECs to spindle-like fibroblasts and that this change was more obvious in the LPS+siRNA group compared with the siRNA group (Figure 4A). The results from the scratch and Transwell assays showed that siRNA dramatically promoted the effect of LPS on endothelial cell migration and invasion (Figure 4B,C). The changes in the protein expression of the endothelial cell marker CD31 and mesenchymal cell marker α-SMA were assessed by fluorescence microscopy and flow cytometry, and the results indicated that the knockdown of MFGE8 greatly inhibited the protein expression of CD31 and increased the protein expression of α-SMA. This change was significant when both LPS and siRNA were administered (Figure 4D,G). At the mRNA and protein levels, siRNA markedly attenuated the effect of LPS on EndoMT induction by increasing CD31 and decreasing α-SMA protein and gene expression (Figure 4E,F). Taken together, these results suggested that the knockdown of MFGE8 facilitated LPS-induced EndoMT in HLMECs.
3.4. rhMFGE8 attenuated EndoMT induced by LPS in HLMECs
To further assess whether exogenous MFGE8 could exert a protective effect on EndoMT, we administered recombinant human MFGE8 (rhMFGE8) to HLMECs. As shown in Figure 5A–C, rhMFGE8 ameliorated the changes in cell morphology and markedly decreased the LPS-induced migration and invasion of endothelial cells, even in the cells transfected with the siRNA. In addition, immunofluorescence staining and flow cytometry indicated that the expression of CD31 in the LPS+rhMFGE8 group was higher than that in the LPS group. The expression of CD31 in the LPS+siRNA+rhMFGE8 group was higher than that in the LPS+siRNA group, and the increase in CD31 expression in the LPS+siRNA+rhMFGE8 group was less than that in the LPS+rhMFGE8 group. The expression of α-SMA in the LPS+rhMFGE8 group was lower than that in the LPS group, the expression of α-SMA in the LPS+siRNA+rhMFGE8 group was lower than that in the LPS+siRNA group, and the decrease in α-SMA expression in the LPS+siRNA+rhMFGE8 group was less than that in the LPS+rhMFGE8 group (Figure 5D,G). The western blot results showed that rhMFGE8 markedly attenuated the effect of LPS or LPS+siRNA on EndoMT induction by increasing the CD31 protein levels and decreasing the α-SMA protein levels (Figure 5E). The changes in mRNA expression were consistent with the western blot results (Figure 5F). These data showed that the administration of rhMFGE8 could weaken LPS- or LPS+siRNA-induced EndoMT in vitro.
3.5. MFGE8 regulated EndoMT induced by LPS through the BMP/Smad1/5/Smad4 signalling pathway and altered the expression of EndoMT-associated transcription factors
A further aim of this study was to determine the mechanism of MFGE8-mediated regulation of LPS-induced EndoMT in vitro. Previous studies have shown that the Snail gene is associated with EndoMT[11]. In this study, western blotting and qRT‒PCR indicated that the protein and mRNA expression levels of Snail were higher elevated in the LPS and LPS+siRNA groups compared with the control group. The expression of Snail in the LPS+rhMFGE8 group was lower than that in the LPS group. The expression of Snail in the LPS+siRNA+rhMFGE8 group was lower than that in the LPS+siRNA group, and these data showed that rhMFGE8 ameliorated the increased expression of Snail in the LPS and LPS+siRNA groups (Figure 6A,C). BMPs are growth factors that were originally discovered to induce the formation of bone and cartilage, belong to the TGF-β superfamily and play a central role in promoting matrix accumulation in myofibroblasts. Compared with that in the control group, the expression of BMP was upregulated in the cells treated with LPS and LPS+siRNA. In contrast, rhMFGE8 blocked the upregulation of BMP expression in the LPS and LPS+siRNA groups, and the expression of Smad1/5 and Smad4 displayed uniform changes (Figure 6A,C). These results indicated that this signalling pathway may be activated by LPS and ameliorated by rhMFGE8. Furthermore, the BMP inhibitor LDN-212854 was used to verify this conclusion, and the results indicated that LDN-212854 reduced the activity of Smad1/5 and Smad4 in the LPS and LPS+siRNA groups (Figure 6B). Overall, these results showed that rhMFGE8 regulated EndoMT in ECs via the BMP/Smad1/5/Smad4 signalling pathway and altered the expression of related transcription factors.
3.6. rhMFGE8 could reverse ECM deposition and play a protective role in EndoMT at the early stage
C57 mice were used to determine whether exogenous MFGE8 could exert a similar protective effect on EndoMT induced by LPS in vivo. The mice were divided into three groups: control group, LPS group and LPS+rhMFGE8 group. Lung sections were embedded in paraffin, and H&E staining was used to observe the lung tissue. The results showed that a thickened alveolar septum was present in the LPS group and that the thickness increased over time. In contrast, rhMFGE8 reversed the increase induced by LPS (Figure 7A). Pulmonary fibrosis is associated with abnormal deposition of the ECM, and the main component of the ECM is collagen. The Masson staining results showed that LPS induced ECM deposition at the early stage, that the LPS-induced ECM deposition increased over time and the amount of deposited ECM was higher than that in the control group. The level of ECM deposition in the LPS+rhMFGE8 group was significantly lower than that in the LPS group (Figure 7B). These results indicated that fibrosis in ALI was initiated during the early stage and that rhMFGE8 could reverse ECM deposition induced by LPS. In addition, the immunofluorescence staining results indicated that the expression of blue fluorescence protein (α-SMA) was increased by LPS compared with that in the control group but decreased by rhMFGE8 (Figure 7C). In vivo, the western blot results indicated that LPS-treated group exhibited lower protein expression of CD31 and higher protein expression of α-SMA compared with the control group, and the LPS+rhMFGE8 group showed higher protein expression of CD31 and lower protein expression of α-SMA compared with the LPS group (Figure 7D). Taken together, these results suggest that rhMFGE8 regulates and plays a protective role at the early stage of EndoMT in ALI induced by LPS.
4. Discussion
In this study, we first demonstrated that LPS could induce EndoMT in HLMECs. Our previous studies showed that LPS, which is an important inflammatory inducer, could be used in cell and animal models to investigate the mechanism and feasible treatments of ALI[7,8,23]. Toshio Suzuki et al. found that EndoMT induced by LPS is dependent on the ROS levels in vitro, and transient EndoMT was observed in mice with septic ALI, which could be repaired[24]. Several environmental factors, including inflammation, hypoxia, radiation, hyperglycaemia and TGF-β, have been shown to trigger EndoMT[25,26,27]. During initiation of EndoMT, the molecular and structural properties of ECs are altered by various stimulating factors. Cells lose their endothelial properties (reduced expression of surface EC markers such as CD31 and vWF) and cell adhesion abilities and acquire high migratory potential and fibroblast-like phenotypes[11]. Our results are in agreement with previous research. This study demonstrated that LPS greatly inhibited the level of CD31 protein and increased the level of α-SMA protein, which showed that LPS could induce EndoMT.
MFGE8 is derived from macrophages and plays an important role in reducing inflammation and maintaining tissue homeostasis. Xiao Wang et al. found that LPS suppresses MFGE8 gene expression in macrophages[28]. Atabai et al. discovered that the expression of MFGE8 was decreased, which could exacerbate the severity of lung injury[29]. We confirmed these reports and also showed that MFGE8 was decreased by approximately 40% in HLMECs after LPS stimulation and in ARDS patients. In contrast to previous findings, Jun Wang et al. showed that the protein expression of MFGE8 was elevated in the serum of patients with chronic pulmonary hypertension[19]. The differences in the results of these studies are likely attributable to the differences in pathophysiological processes between ALI and pulmonary hypertension. Monowar Aziz et al. showed that exogenous supplementation with MFGE8 could reduce neutrophil and cellular infiltration induced by LPS by upregulating GRK2 expression and downregulating CXCR2 expression, which reduces lung injury[21]. A previous study revealed that MFGE8 is secreted by mesenchymal stem cells (MSCs) and acts as an autocrine factor that suppresses TGF-β signalling by binding to αvβ3 integrin and decreases ECM deposition and liver fibrosis in mice[30]. Our results that endogenous supplementation with rhMFGE8 could attenuate LPS-induced EndoMT in vitro are in accordance with Bo Wang’s study, who showed that MFGE8 could exert a protective effect on TGF-β1-induced EndoMT and may be a therapeutic strategy for cardiac fibrosis[30].
Previous studies have indicated that the transforming growth factor (TGF)-β and BMP families of growth factors act as mediators that promote EndoMT, including downstream Smad-dependent and Smad-independent proteins. After their phosphorylation, Smad1 and Smad5 recruit Smad4 and then create a complex that plays a crucial role in enhancing signal cascade conduction[13]. After translocation from the cytoplasm to the nucleus, the complexes interact with target transcription factors, such as Zeb1, Twist, Slug and Snail. We found that the expression of BMP, Smad1/5 and Smad4 was elevated in response to stimulation with LPS, and LDN-212854, a BMP/Smad1/5/4 signalling pathway inhibitor, was used to verify the involvement of this signalling pathway. The results showed that knockdown of MFGE8 increased the activity of the BMP signalling pathway, whereas the administration of rhMFGE8 reversed this effect.
In this study, we found that LPS induced the deposition of blue-stained ECM in the alveolar interstitial space and around mouse pulmonary arteries at the early stage and that the level of deposition increased over time. Kun Xiao found that proinflammatory cytokines are the most effective inducers of EndoMT, which leads to inflammatory conditions that transform ECs into myofibroblasts and thereby facilitates fibrotic diseases[31]. In the lungs, fibrosis may occur as a result of abnormal remodelling following ALI and inflammatory diseases, in the context of systemic autoimmune diseases, or as an idiopathic process[8]. Pulmonary tissue architecture is determined by the balance among collagen production, deposition and removal, which is a dynamic process. When sustained collagen production exceeds or overwhelms the mechanisms of collagen removal, excess collagen is deposited in the ECM, leading to tissue fibrosis. Atabai et al demonstrated that mice with deficiency in the MFGE8 gene exhibit collagen accumulation in pulmonary tissues after bleomycin treatment and that rhMFGE8 is effective in binding and internalizing collagen and accelerating the removal of collagen. We also found that rhMFGE8 ameliorated ECM deposition induced by LPS. Wayne W. Chaung et al. reported that rhMFGE8 sharply attenuates sepsis in rats with acute alcohol exposure and should be further developed as a safe and effective therapy for sepsis in alcohol abusers[32]. Laura W. Hansen et al. used male and female newborn mice and showed that a lack of MFGE8 exacerbates lung injury and mortality in neonatal sepsis and that rhMFGE8 has a protective effect in neonatal sepsis[20].
However, the present study has several limitations. We did not obtain patient lung tissue and were therefore unable to compare this tissue with mouse lung tissue. We detected the serum expression of MFGE8 in patients only when they were diagnosed with ARDS, and we did not detect the serum expression of MFGE8 after the patients had recovered; thus, we will conduct these experiments in future studies. We administered rhMFGE8 to mice for only six days; if we had administered rhMFGE8 to the mice for additional days, the difference between each group would have been more obvious.
In conclusion, the results obtained in this study suggested that rhMFGE8 exerted a protective effect at the early stage of LPS-induced EndoMT through the BMP/Smad1/5/Smad4 signalling pathway and could be a therapeutic target in ALI.

Table 1.
1. Clinical characteristics.
| Variables | Healthy control (n=44) | ARDS (n=44) |
|---|---|---|
| Age (years) | 68.11±9.38 | 72.02±9.26 |
| Gender (male/female) | 20/24 | 23/21 |
| BMI(kg/cm2) | 23.59±1.13 | 23.38±1.37 |
| PaO2/FiO2 (mmHg) | 431.85±22.67 | 93.61±14.64* |
| WBC counts (109/L) | 7.43±1.68 | 16.69±5.34* |
| C-reactive protein (mg/L) | 6.08±2.47 | 30.64±11.16* |
| Procalcitonin(ng/mL) | 0.54±0.29 | 2.83±1.27* |
| MFGE8(pg/ml) | 79.36±14.90 | 60.11±22.77* |
The values are presented as the means ± SDs. * p < 0.05 compared with the healthy controls.
Table 1.
2. Demographic characteristics and clinical data of 44 patients with ARDS.
| Survivors (n=33) | Nonsurvivors (n=11) | |
|---|---|---|
| Age (years) | 67.03±9.30 | 71.36±9.29 |
| Gender (male/female) | 20/13 | 3/8 |
| BMI(kg/cm2) | 23.4±1.32 | 23.34±1.58 |
| PaO2/FiO2 (mmHg) | 95.30±14.32 | 88.54±15.11 |
| WBC counts (109/L) | 17.44±5.23 | 14.43±5.26 |
| C-reactive protein (mg/L) | 30.51±11.75 | 31.02±1.02 |
| Procalcitonin (ng/mL) | 2.75±1.35 | 3.06±1.27 |
| MFGE8 (pg/ml) | 65.6±18.94 | 45.09±10.79* |
| Comorbidity | ||
| Obstructive airway disease | 10 | 6 |
| Hypertension | 14 | 4 |
| Diabetes | 6 | 3 |
| Cardiovascular disease | 6 | 3 |
| Cerebrovascular accident | 1 | 0 |
| Haematological disease | 1 | 1 |
| Chronic renal failure | 0 | 2 |
| Cancer history | 5 | 2 |
| Aetiology of ARDS, n (%) | ||
| Pulmonary aetiology | 20(60.60%) | 7(63.63%) |
| Pulmonary infection | 13(39.39%) | 5(45.45%) |
| Aspiration | 7(21.21%) | 2(18.18%) |
| Extrapulmonary aetiology | 13(39.39%) | 4(36.36%) |
| Sepsis | 8(24.24%) | 2(18.18%) |
| Pancreatitis | 5(15.15%) | 2(18.18%) |
The values are presented as the means ± SDs.* p < 0.05 compared with the survivor group.
Author Contributions
Wang Daoxing and Qi Di made significant contributions to the conception and design of this study. Shi Qingqiang conducted the experiments and helped draft this manuscript. Wang Hanghang and Tang Ling contributed to the data collection. Liu Huang interpreted and analysed the data.
Funding
The present study was funded by the Natural Science Foundation of Chongqing (Grant No. cstc2019jcyj-zdxmX0031).
Institutional Review Board Statement
The study was conducted in accordance with the Declaration of Helsinki and was approved by the Ethics Committee of the Second Affiliated Hospital of Chongqing Medical University (No. 2021-R026, approved date 11.03.2021). The Animal Ethics Committee of Chongqing Medical University authorized all animal experimental procedures (approval No. JN. No. 20210616S0546213, approved date 16.06.2021).
Informed Consent Statement
Informed consent was obtained from all the subjects involved in the study.
Data Availability Statement
The datasets used during this study are available from the corresponding authors upon reasonable request. All data generated or analysed during the current study are included in this article.
Acknowledgments
All experiments were performed at the College of Life Science, and we would like to thank all the members of the Wang laboratory for their full cooperation.
Conflicts of Interest
The authors declare that they have no competing interests.
References
- Matthay, M.A. , et al., Acute respiratory distress syndrome. Nat Rev Dis Primers 2019, 5, 18. [Google Scholar] [CrossRef] [PubMed]
- Huppert, L.A. , M.A. Matthay, and L.B. Ware, Pathogenesis of Acute Respiratory Distress Syndrome. Semin Respir Crit Care Med 2019, 40, 31–39. [Google Scholar] [PubMed]
- Thompson, B.T. , R.C. Chambers, and K.D. Liu, Acute Respiratory Distress Syndrome. N Engl J Med 2017, 377, 562–572. [Google Scholar] [CrossRef] [PubMed]
- Horie, S. , et al., Cell therapy in acute respiratory distress syndrome. Journal of Thoracic Disease 2018, 10, 5607–5620. [Google Scholar] [CrossRef] [PubMed]
- Keshari, R.S. , et al., Acute lung injury and fibrosis in a baboon model of Escherichia coli sepsis. Am J Respir Cell Mol Biol 2014, 50, 439–50. [Google Scholar] [CrossRef] [PubMed]
- Nieman, G.F. , et al., Acute lung injury: how to stabilize a broken lung. Crit Care 2018, 22, 136. [Google Scholar] [CrossRef] [PubMed]
- Suzuki, T. , et al., Vildagliptin ameliorates pulmonary fibrosis in lipopolysaccharide-induced lung injury by inhibiting endothelial-to-mesenchymal transition. Respir Res 2017, 18, 177. [Google Scholar] [CrossRef]
- Dong, Z.W. and Y.F. Yuan, Juglanin suppresses fibrosis and inflammation response caused by LPS in acute lung injury. Int J Mol Med 2018, 41, 3353–3365. [Google Scholar]
- Man, S. , et al., The therapeutic potential of targeting the endothelial-to-mesenchymal transition. Angiogenesis 2019, 22, 3–13. [Google Scholar] [CrossRef]
- Gonzalez, D.M. and D. Medici, Signaling mechanisms of the epithelial-mesenchymal transition. Sci Signal 2014, 7, re8. [Google Scholar] [CrossRef]
- Piera-Velazquez, S. , F.A. Mendoza, and S.A. Jimenez, Endothelial to Mesenchymal Transition (EndoMT) in the Pathogenesis of Human Fibrotic Diseases. J Clin Med 2016, 5. [Google Scholar] [CrossRef] [PubMed]
- Medici, D. , Endothelial-Mesenchymal Transition in Regenerative Medicine. Stem Cells Int 2016, 2016, 6962801. [Google Scholar] [CrossRef]
- Dewidar, B. , et al., TGF-beta in Hepatic Stellate Cell Activation and Liver Fibrogenesis-Updated 2019. Cells 2019, 8. [Google Scholar]
- Pardali, E. , et al., TGF-beta-Induced Endothelial-Mesenchymal Transition in Fibrotic Diseases. Int J Mol Sci 2017, 18. [Google Scholar]
- Shu, D.Y. , E. Butcher, and M. Saint-Geniez, EMT and EndMT: Emerging Roles in Age-Related Macular Degeneration. Int J Mol Sci 2020, 21. [Google Scholar] [CrossRef] [PubMed]
- Miyazono, K. , Y. Kamiya, and M. Morikawa, Bone morphogenetic protein receptors and signal transduction. J Biochem 2010, 147, 35–51. [Google Scholar] [CrossRef]
- Chandran Latha, K. , et al., Shear Stress Alterations Activate BMP4/pSMAD5 Signaling and Induce Endothelial Mesenchymal Transition in Varicose Veins. Cells 2021, 10. [Google Scholar]
- Chung, M.I. , et al., Niche-mediated BMP/SMAD signaling regulates lung alveolar stem cell proliferation and differentiation. Development 2018, 145. [Google Scholar]
- Wang, J. , et al., Absence of the MFG-E8 gene prevents hypoxia-induced pulmonary hypertension in mice. J Cell Physiol 2021, 236, 587–600. [Google Scholar] [CrossRef]
- Hansen, L.W. , et al., Deficiency in milk fat globule-epidermal growth factor-factor 8 exacerbates organ injury and mortality in neonatal sepsis. J Pediatr Surg 2017, 52, 1520–1527. [Google Scholar] [CrossRef]
- Aziz, M. , et al., Milk Fat Globule-Epidermal Growth Factor-Factor 8 Attenuates Neutrophil Infiltration in Acute Lung Injury via Modulation of CXCR2. The Journal of Immunology 2012, 189, 393–402. [Google Scholar] [CrossRef] [PubMed]
- Wang, Y. , et al., Cigarette smoke attenuates phagocytic ability of macrophages through down-regulating Milk fat globule-EGF factor 8 (MFG-E8) expressions. Sci Rep 2017, 7, 42642. [Google Scholar] [CrossRef] [PubMed]
- Russotto, V. , G. Bellani, and G. Foti, Respiratory mechanics in patients with acute respiratory distress syndrome. Ann Transl Med 2018, 6, 382. [Google Scholar] [CrossRef] [PubMed]
- Suzuki, T. , et al., Endothelial-to-mesenchymal transition in lipopolysaccharide-induced acute lung injury drives a progenitor cell-like phenotype. Am J Physiol Lung Cell Mol Physiol 2016, 310, L1185–98. [Google Scholar] [CrossRef] [PubMed]
- Ferguson, K.T. , et al., Dynamics of Influenza-induced Lung-Resident Memory T Cells, Anatomically and Functionally Distinct Lung Mesenchymal Populations, and Dampening of Acute Lung Injury by Neutrophil Transfer of Micro-RNA-223 to Lung Epithelial Cells. American Journal of Respiratory Cell and Molecular Biology 2018, 59, 397–399. [Google Scholar] [CrossRef] [PubMed]
- Niethamer, T.K. , et al., Defining the role of pulmonary endothelial cell heterogeneity in the response to acute lung injury. Elife 2020, 9. [Google Scholar]
- Hong, O.K. , et al., Gemigliptin Inhibits Interleukin-1beta-Induced Endothelial-Mesenchymal Transition via Canonical-Bone Morphogenetic Protein Pathway. Endocrinol Metab (Seoul) 2020, 35, 384–395. [Google Scholar] [CrossRef]
- Wang, X. , et al., Molecular Mechanisms Underlying the Regulation of the MFG-E8 Gene Promoter Activity in Physiological and Inflammatory Conditions. J Cell Biochem 2015, 116, 1867–79. [Google Scholar] [CrossRef]
- Atabai, K. , et al., Mfge8 diminishes the severity of tissue fibrosis in mice by binding and targeting collagen for uptake by macrophages. J Clin Invest 2009, 119, 3713–22. [Google Scholar] [CrossRef]
- Wang, B. , et al., MFGE8 is down-regulated in cardiac fibrosis and attenuates endothelial-mesenchymal transition through Smad2/3-Snail signaling pathway. J Cell Mol Med 2020, 24, 12799–12812. [Google Scholar] [CrossRef]
- Xiao, K. , et al., Mesenchymal stem cells reverse EMT process through blocking the activation of NF-kappaB and Hedgehog pathways in LPS-induced acute lung injury. Cell Death Dis 2020, 11, 863. [Google Scholar] [CrossRef] [PubMed]
- Chaung, W.W. , et al., Recombinant human milk fat globule-EGF factor VIII (rhMFG-E8) as a therapy for sepsis after acute exposure to alcohol. Mol Med 2019, 25, 52. [Google Scholar] [CrossRef] [PubMed]
Figure 1.
MFGE8 was a protective factor in ARDS patients. An ELISA kit was used to determine the MFGE8 serum concentrations in ARDS patients (n=44) and healthy volunteers (n=44). (B) MFGE8 levels in patients who survived (n=33) and in nonsurvivors (n=11). The statistical analysis was performed using Student’s t test, and an asterisk (*) indicates a significant difference (P<0.01) between the ARDS group and the control group.
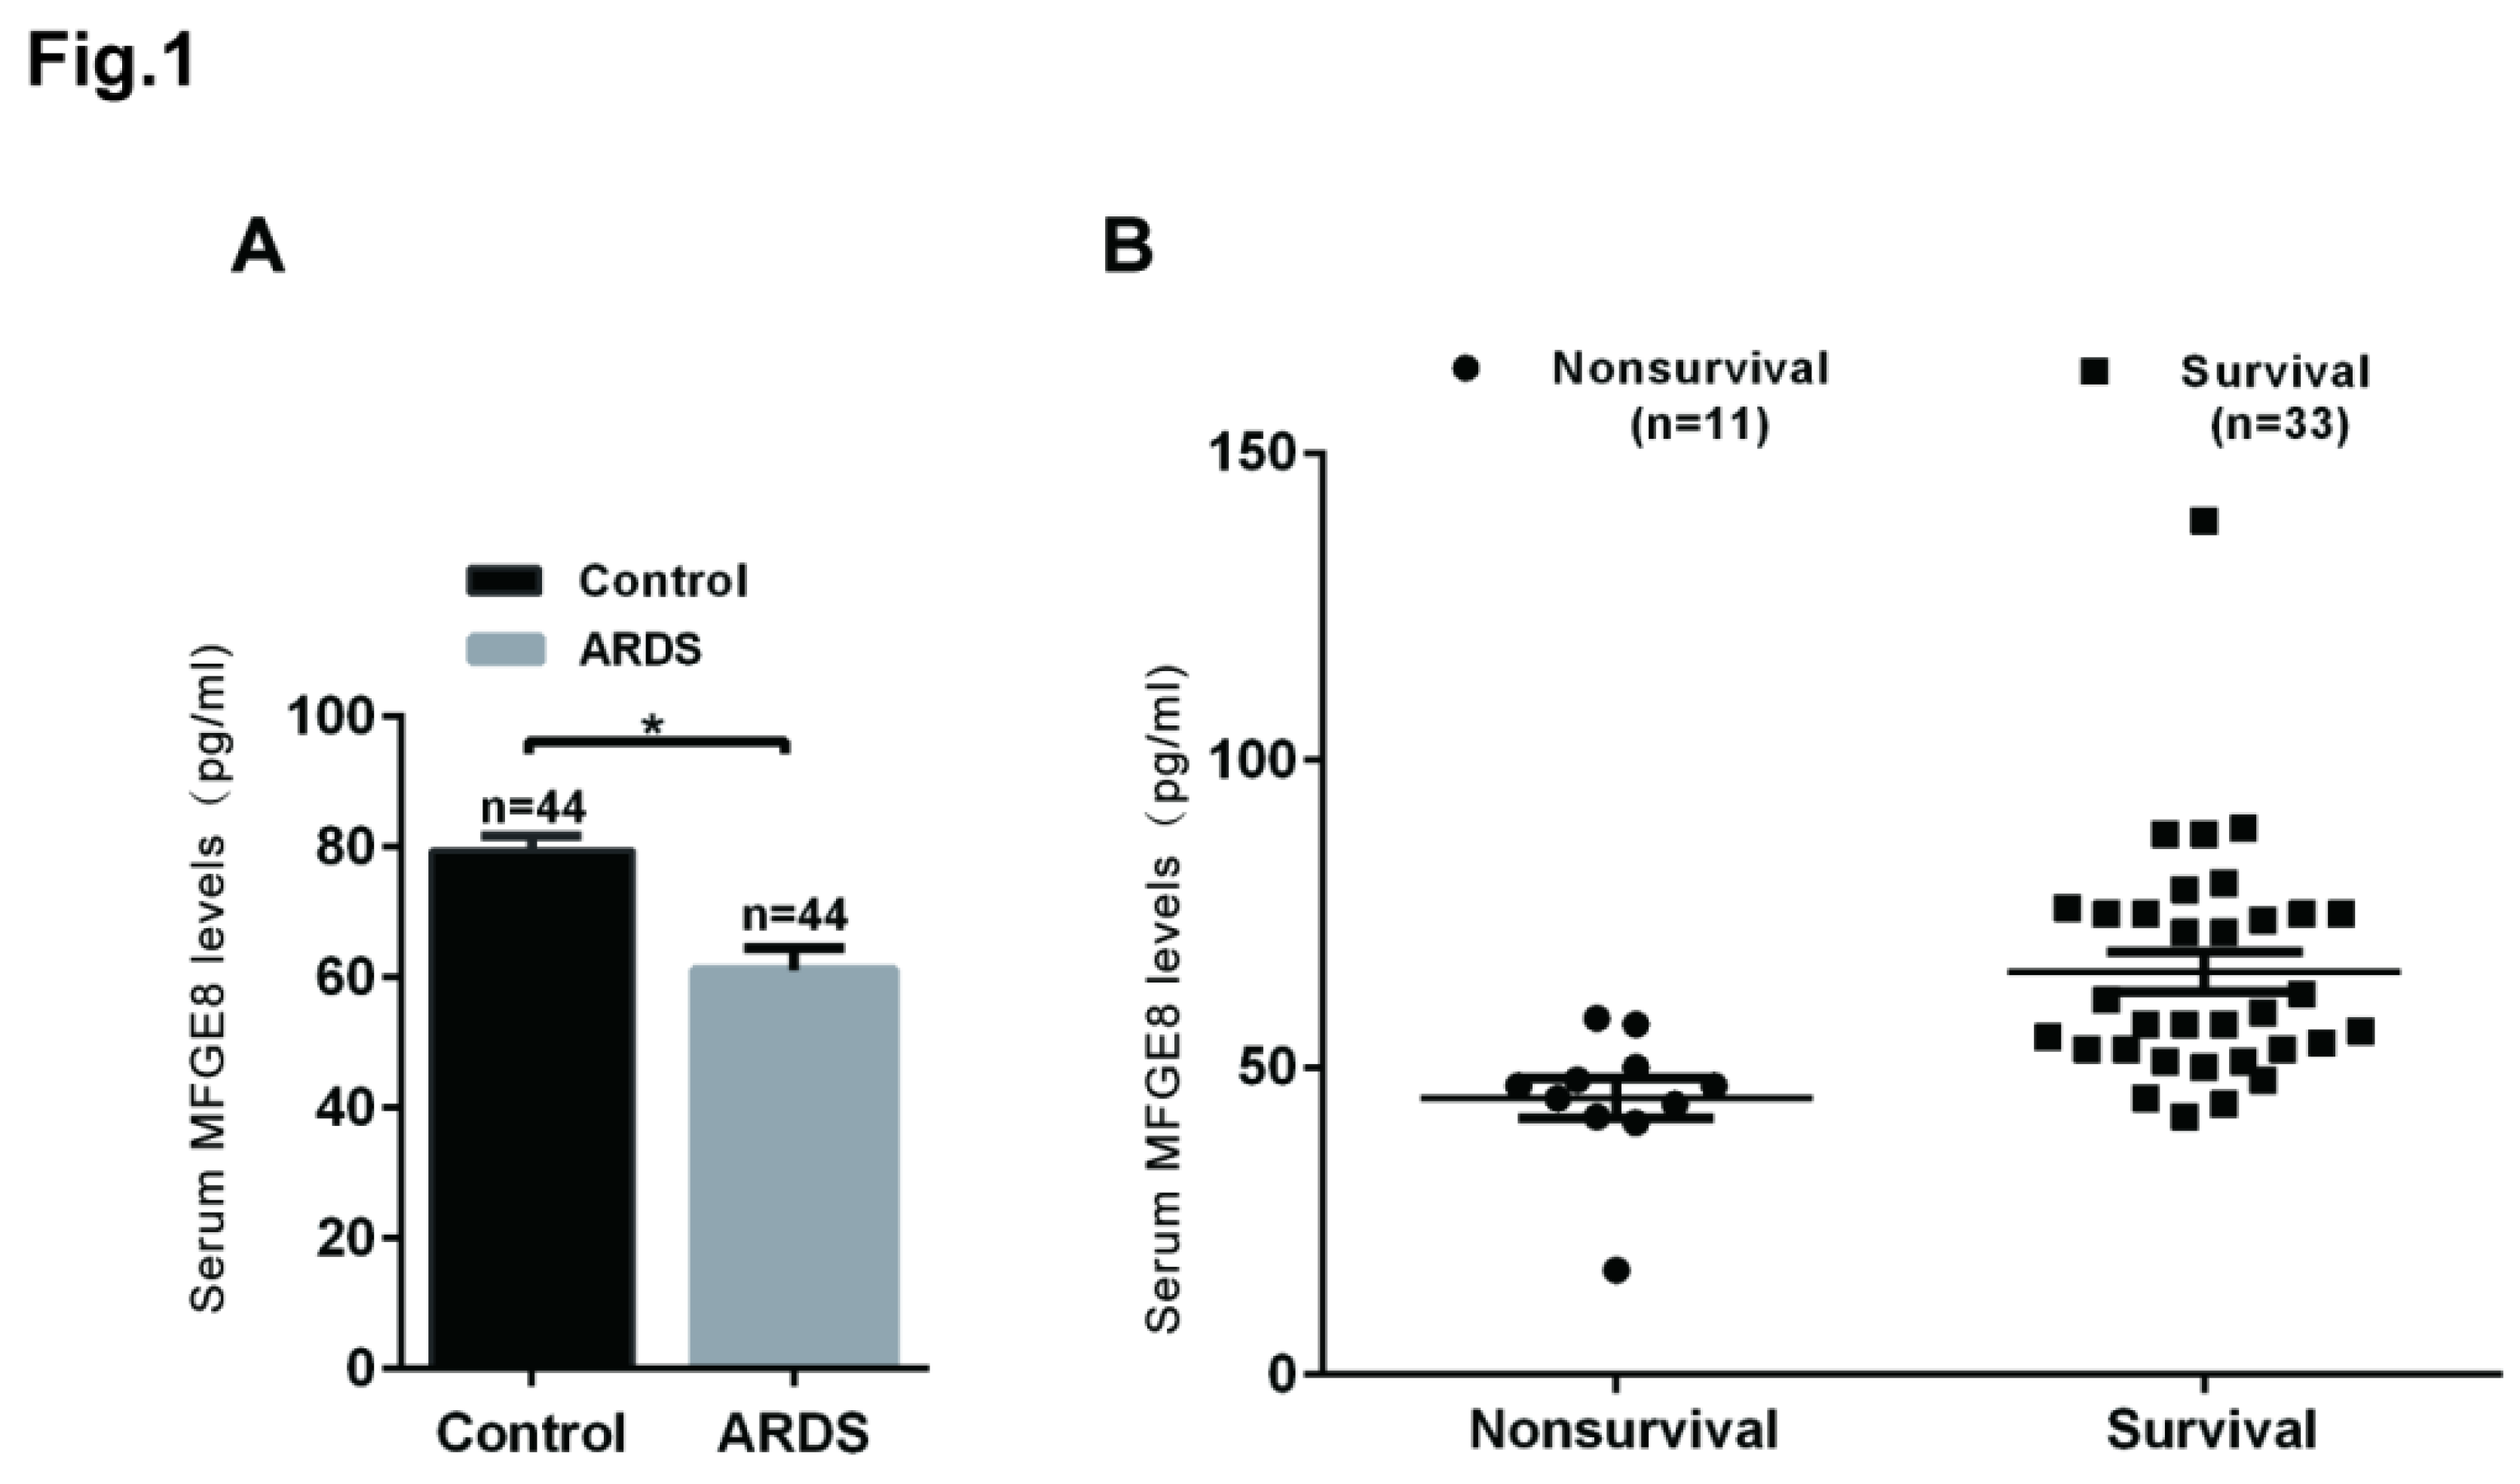
Figure 2.
HLMECs treated with LPS underwent EndoMT. Human lung microvascular endothelial cells (HLMECs) were cultured with DMEM/F-12 and 10% standard foetal bovine serum, and the cells were divided into two groups: control group and LPS group. (A) The cells were incubated with LPS (20 μg/mL) for 96 h, and microscopy was used to observe their morphology (magnification, x100, scale bar = 50 μm). (B) The cells were incubated with LPS (20 μg/mL) for 48 h, and a Transwell migration assay was performed to examine cell invasion (magnification, x100, scale bar = 50 μm). (C) The cells were incubated with LPS (20 μg/mL) for 24 h, and a scratch assay was performed to examine cell migration (magnification, x100, scale bar = 50 μm). (D) The cells were incubated with LPS (20 μg/mL) for 96 h, and fluorescence microscopy was used to examine the protein expression of CD31 and α-SMA (magnification, x200, scale bar = 20 μm). (E) The cells were incubated with LPS (20 μg/mL) for 96 h, and the protein expression of CD31 and α-SMA was examined by western blotting. β-Actin was used as a reference protein. (F) The cells were incubated with LPS (20 μg/mL) for 96 h, and the expression levels of the CD31 and α-SMA genes were examined by qRT‒PCR. (G) The cells were incubated with LPS (20 μg/mL) for 96 h, and FCM was used to examine the protein expression of CD31 and α-SMA. Representative images from three replicated independent experiments are shown. n = 3 per group. The data are presented as the means ± SDs. Statistical analysis was performed using Student’s t test, and an asterisk (*) indicates a significant difference (P<0.01) between the LPS group and the control group.
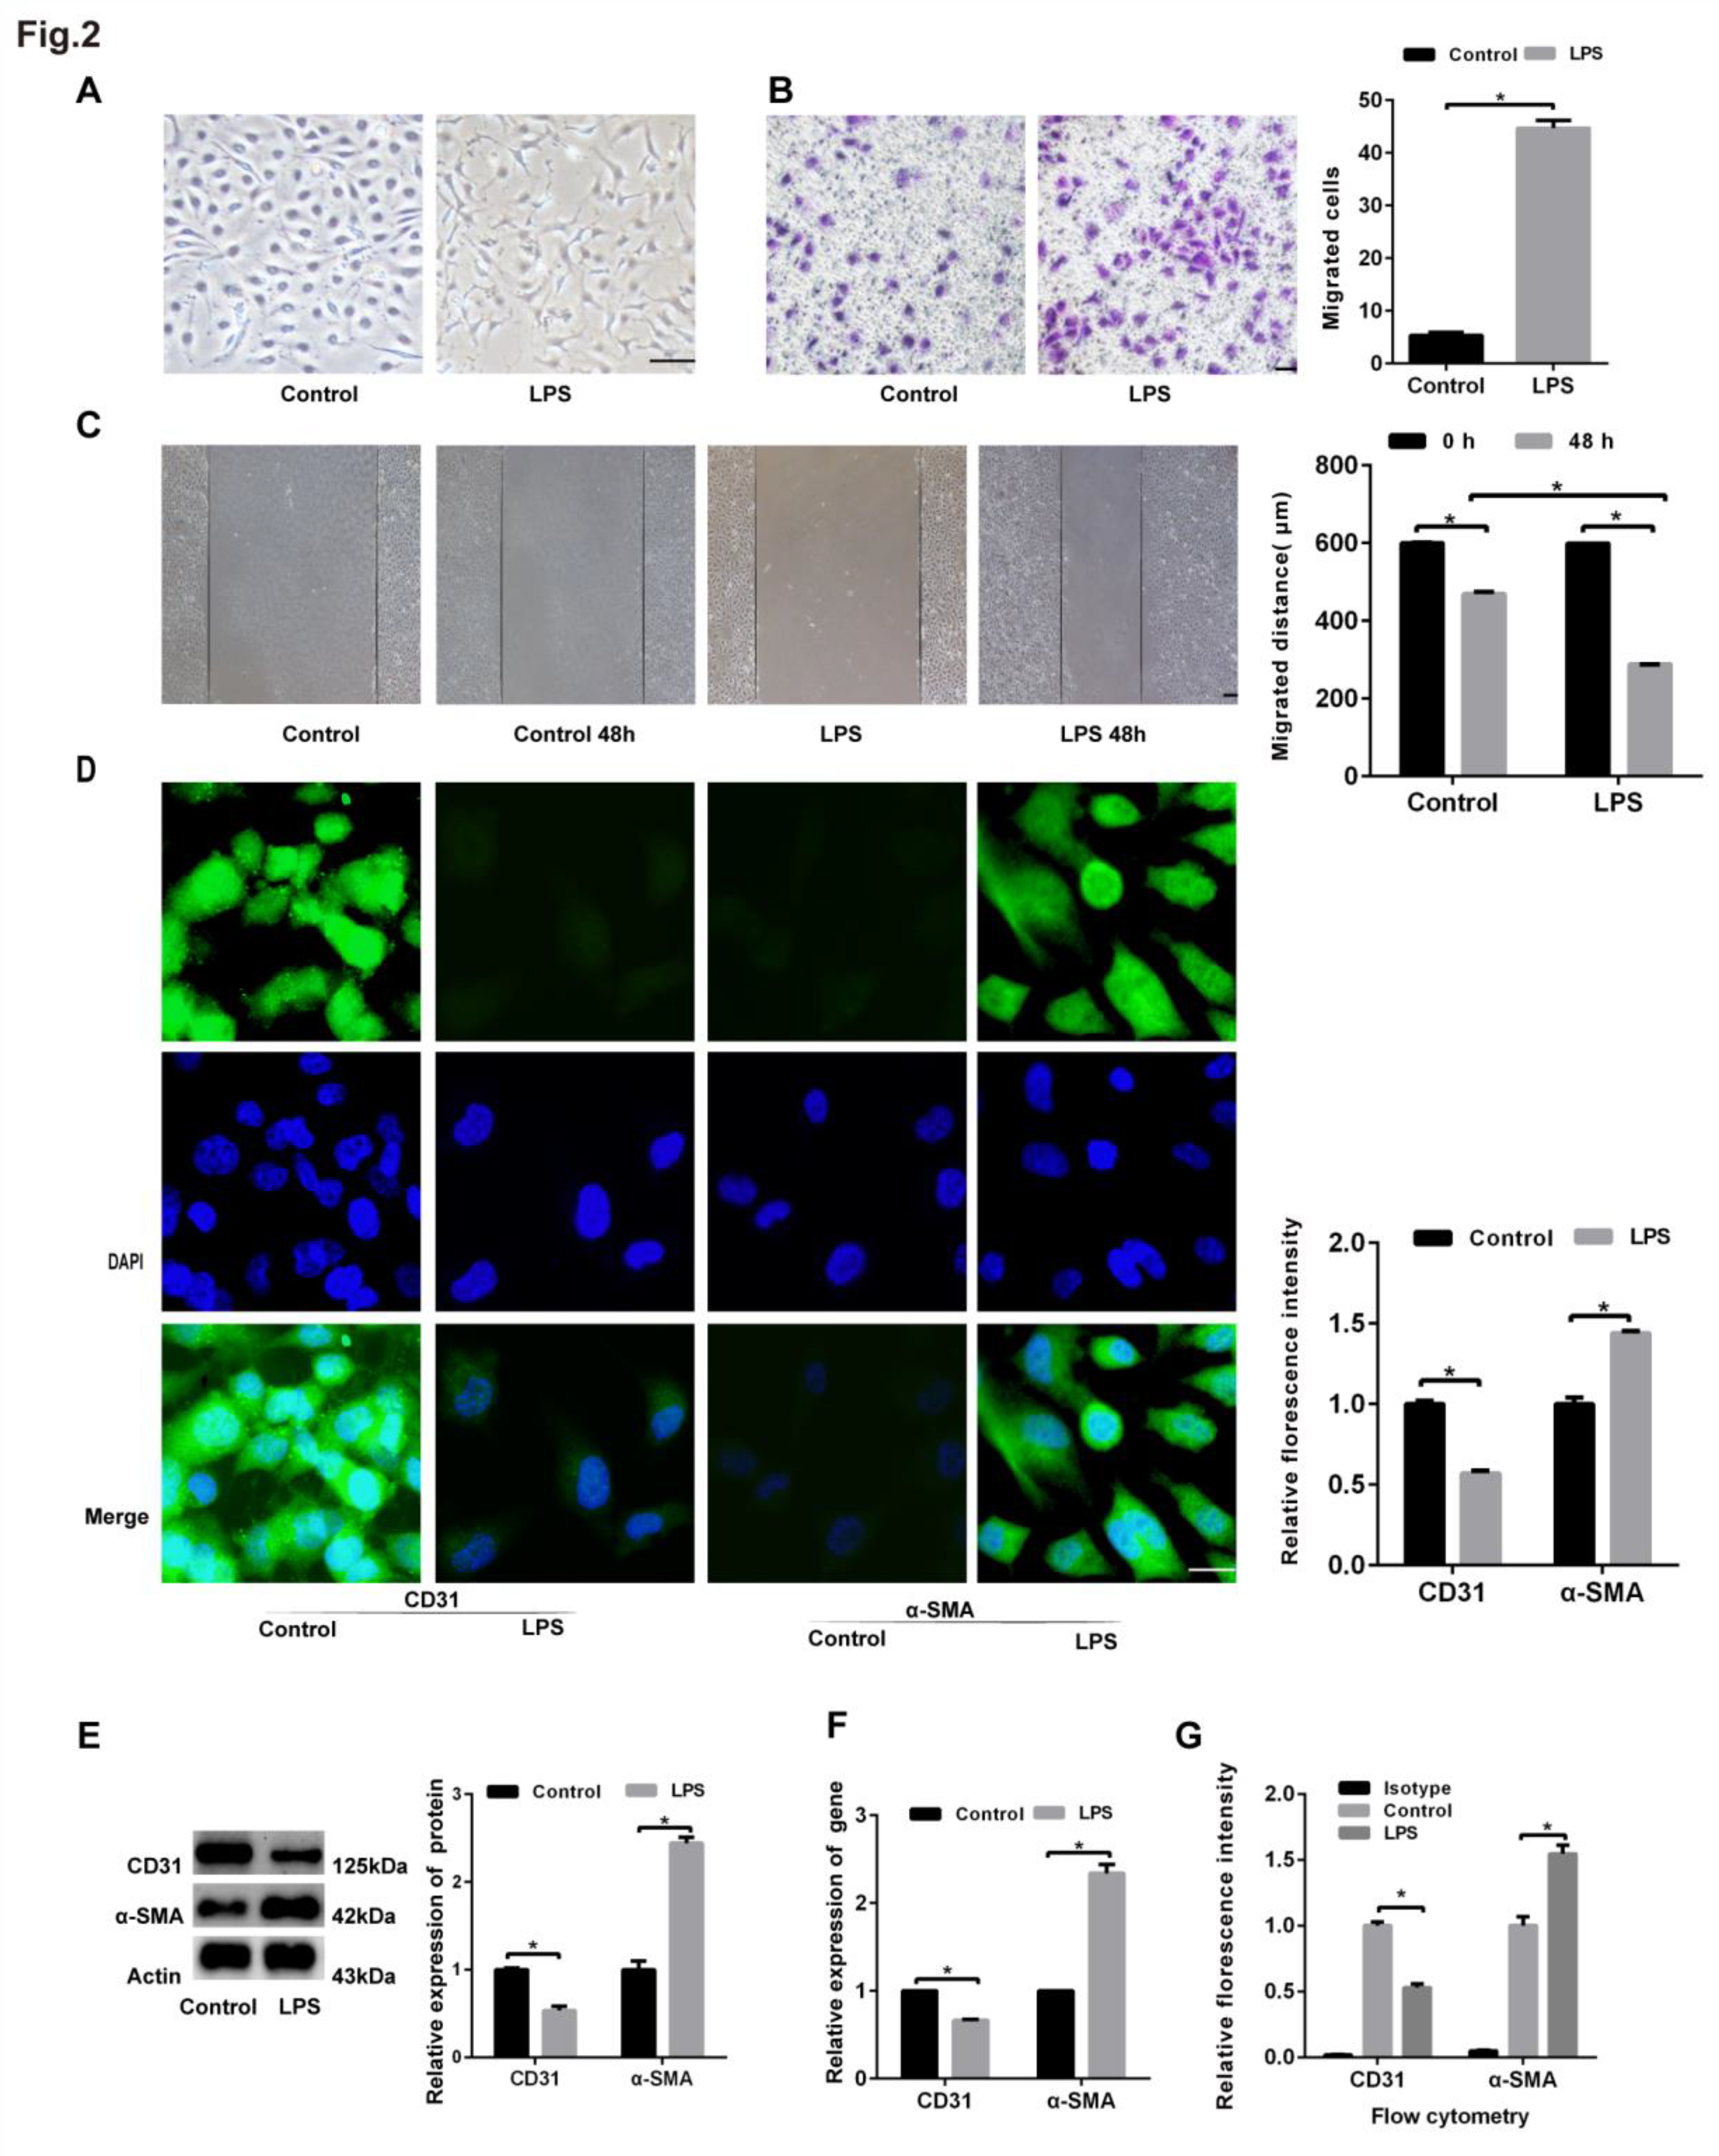
Figure 3.
Analysis of the knockdown efficiency of MFGE8. Human lung microvascular endothelial cells (HLMECs) were cultured with DMEM/F-12 and 10% standard foetal bovine serum. (A) Western blotting was used to examine the expression of MFGE8. β-Actin was used as a reference protein. (B) qRT‒PCR was used to determine the expression of MFGE8. (C, D) Three specific siRNAs (siRNA-MFGE8-1, siRNA-MFGE8-2, and siRNA-MFGE8-3) were transfected into HLMECs for 24 h to downregulate MFGE8 expression, and the knockdown efficiency was analysed by qRT‒PCR and western blotting. β-Actin was used as a reference protein. Representative images from three replicated independent experiments are shown. n = 3 per group. The data are presented as the means ± SDs. Statistical analysis was performed using Student’s t test, and an asterisk (*) indicates a significant difference (P<0.01) between the treated group and the control group.
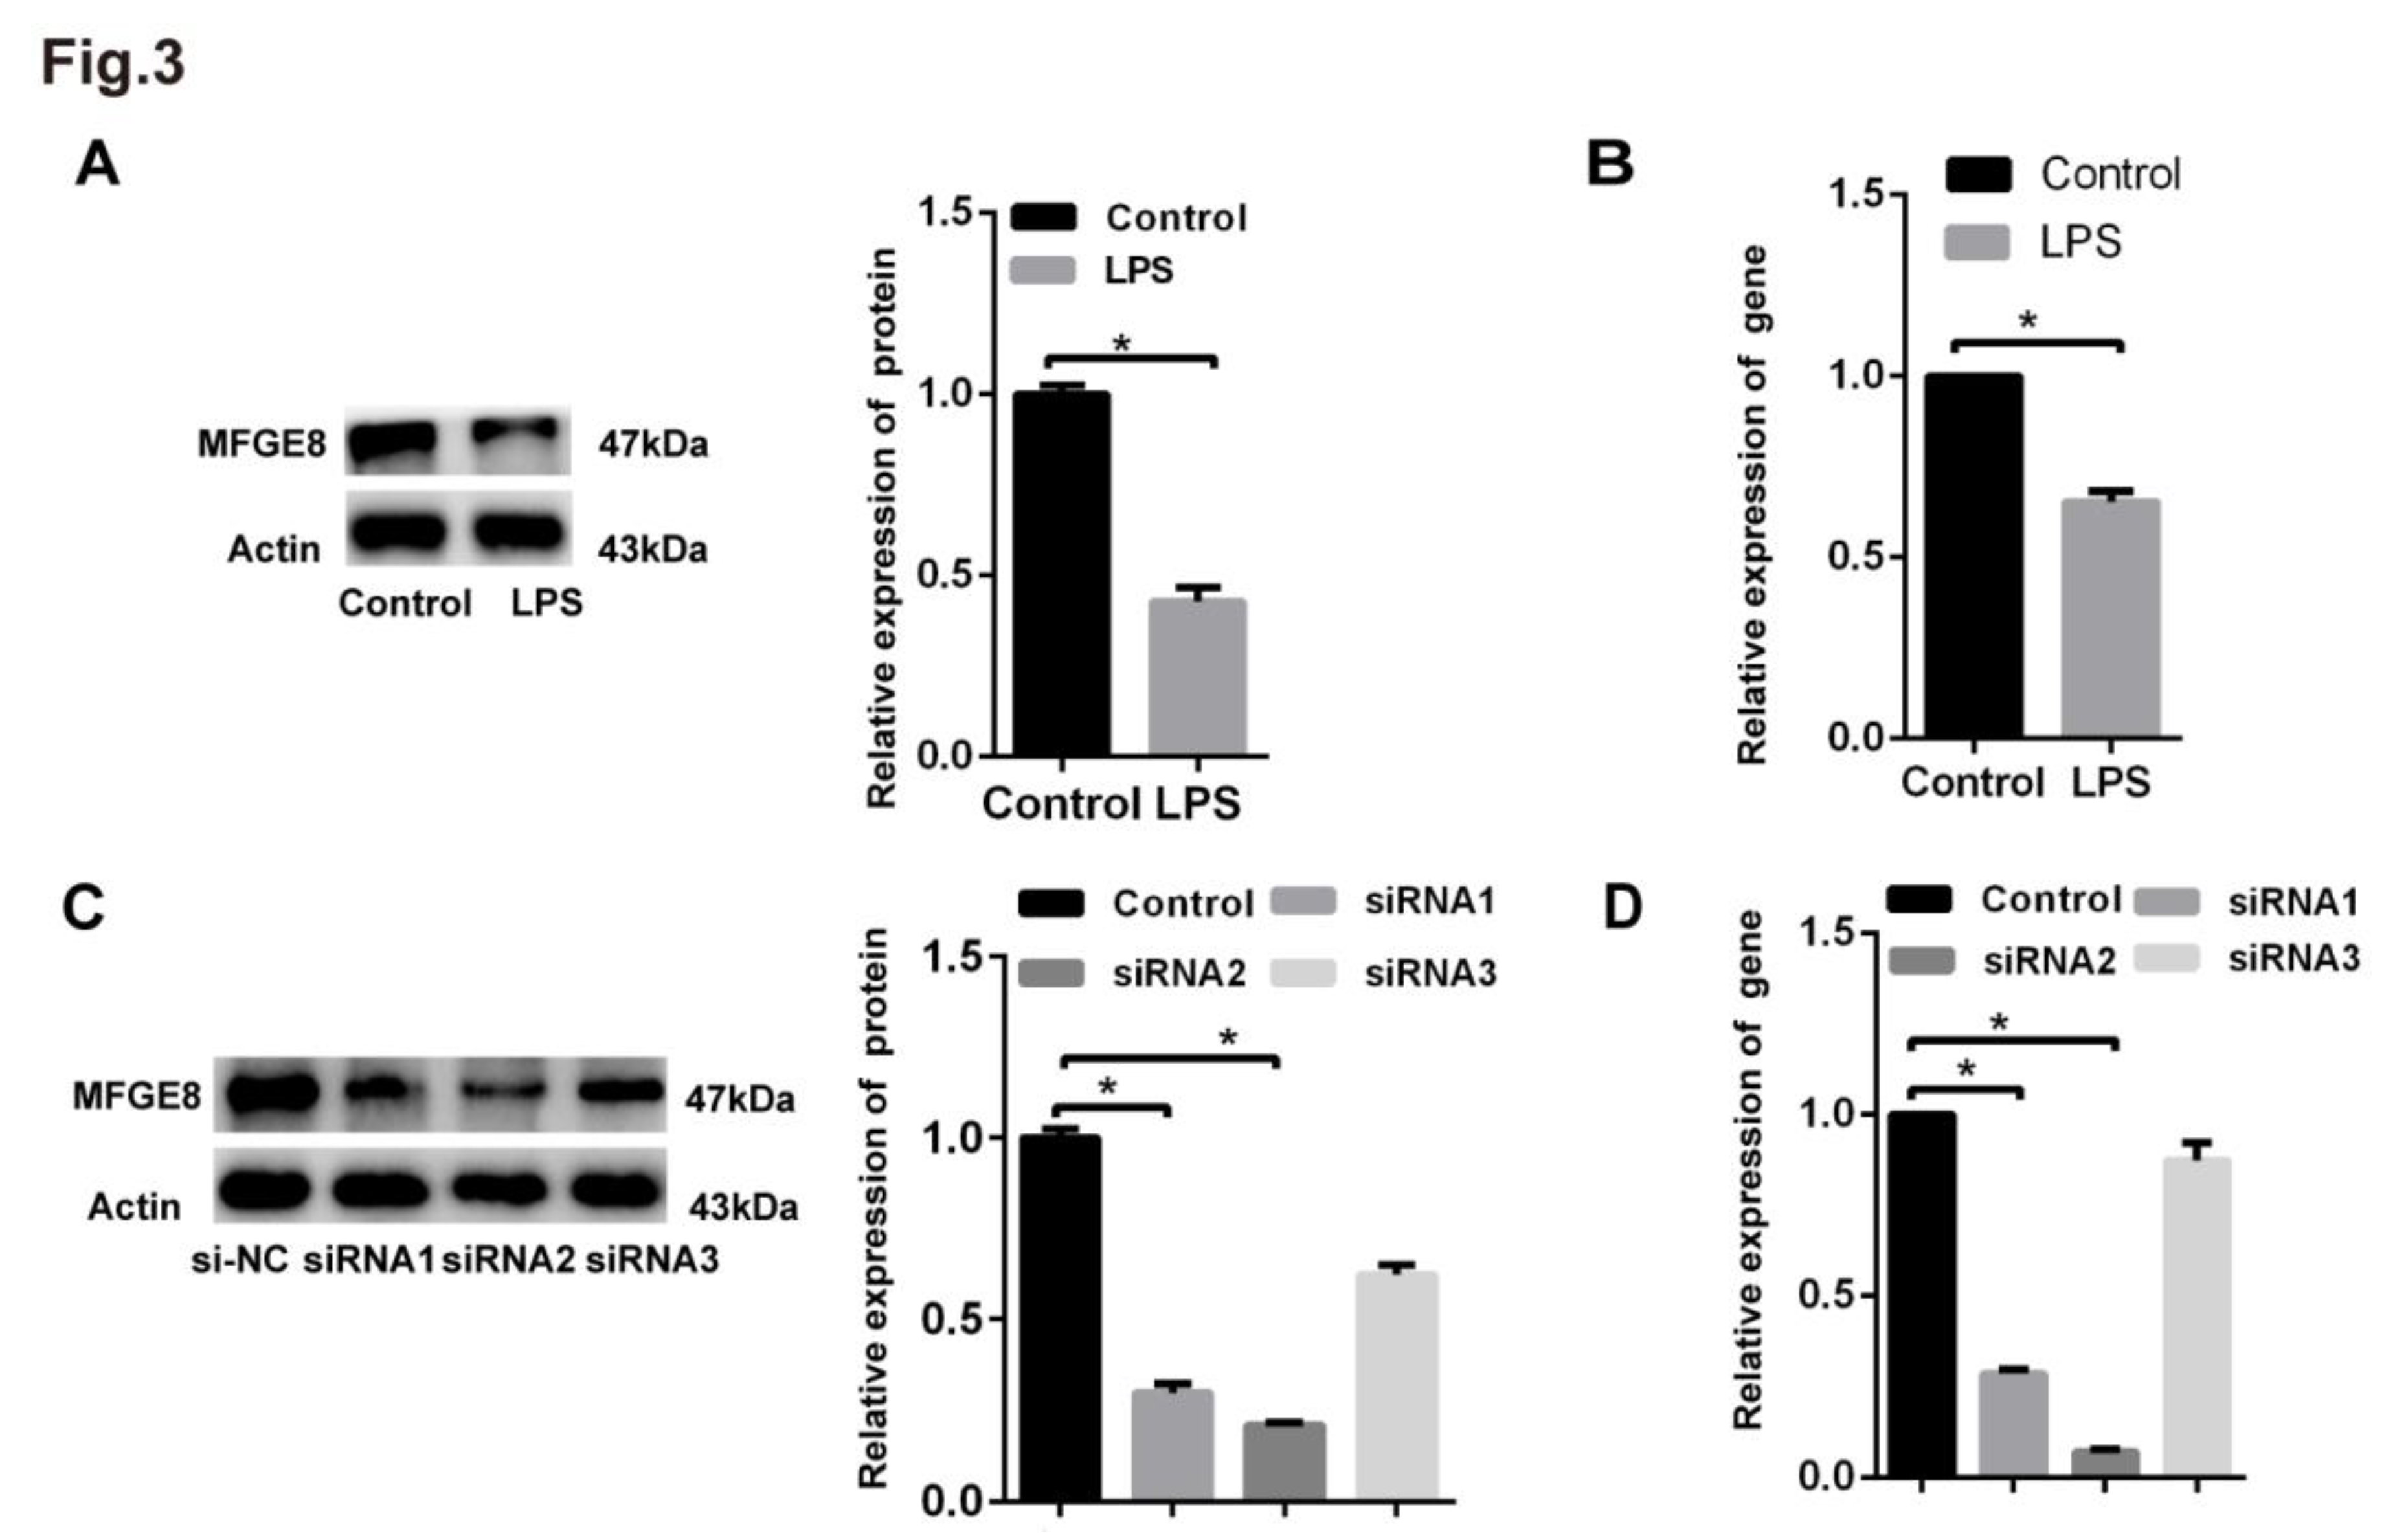
Figure 4.
The siRNA-mediated knockdown of MFGE8 exacerbated LPS-induced EndoMT in HLMECs. Human lung microvascular endothelial cells (HLMECs) were cultured with DMEM/F-12 and 10% standard foetal bovine serum, and the cells were divided into three groups: control group, siRNA group, and LPS+siRNA group. (A) Microscopy was used to observe the cell morphology (magnification, x100, scale bar = 50 μm). (B) A Transwell migration assay was performed to examine cell invasion (magnification, x100, scale bar = 50 μm). (C) A scratch assay was performed to examine cell migration (magnification, x100, scale bar = 50 μm). (D) Fluorescence microscopy was used to examine the protein expression of CD31 and α-SMA (magnification, x200, scale bar = 20 μm). (E) The protein expression of CD31 and α-SMA was examined by western blotting. β-Actin was used as a reference protein. (F) The expression levels of the CD31 and α-SMA genes were examined by qRT‒PCR. (G) FCM was used to examine the protein expression of CD31 and α-SMA. Representative images from three replicated independent experiments are shown. n = 3 per group. The data are presented as the means ± SDs. Statistical analysis was performed using Student’s t test, and an asterisk indicates a significant difference (*P<0.01) between the siRNA group and the control group and between the LPS+siRNA group and the control group.
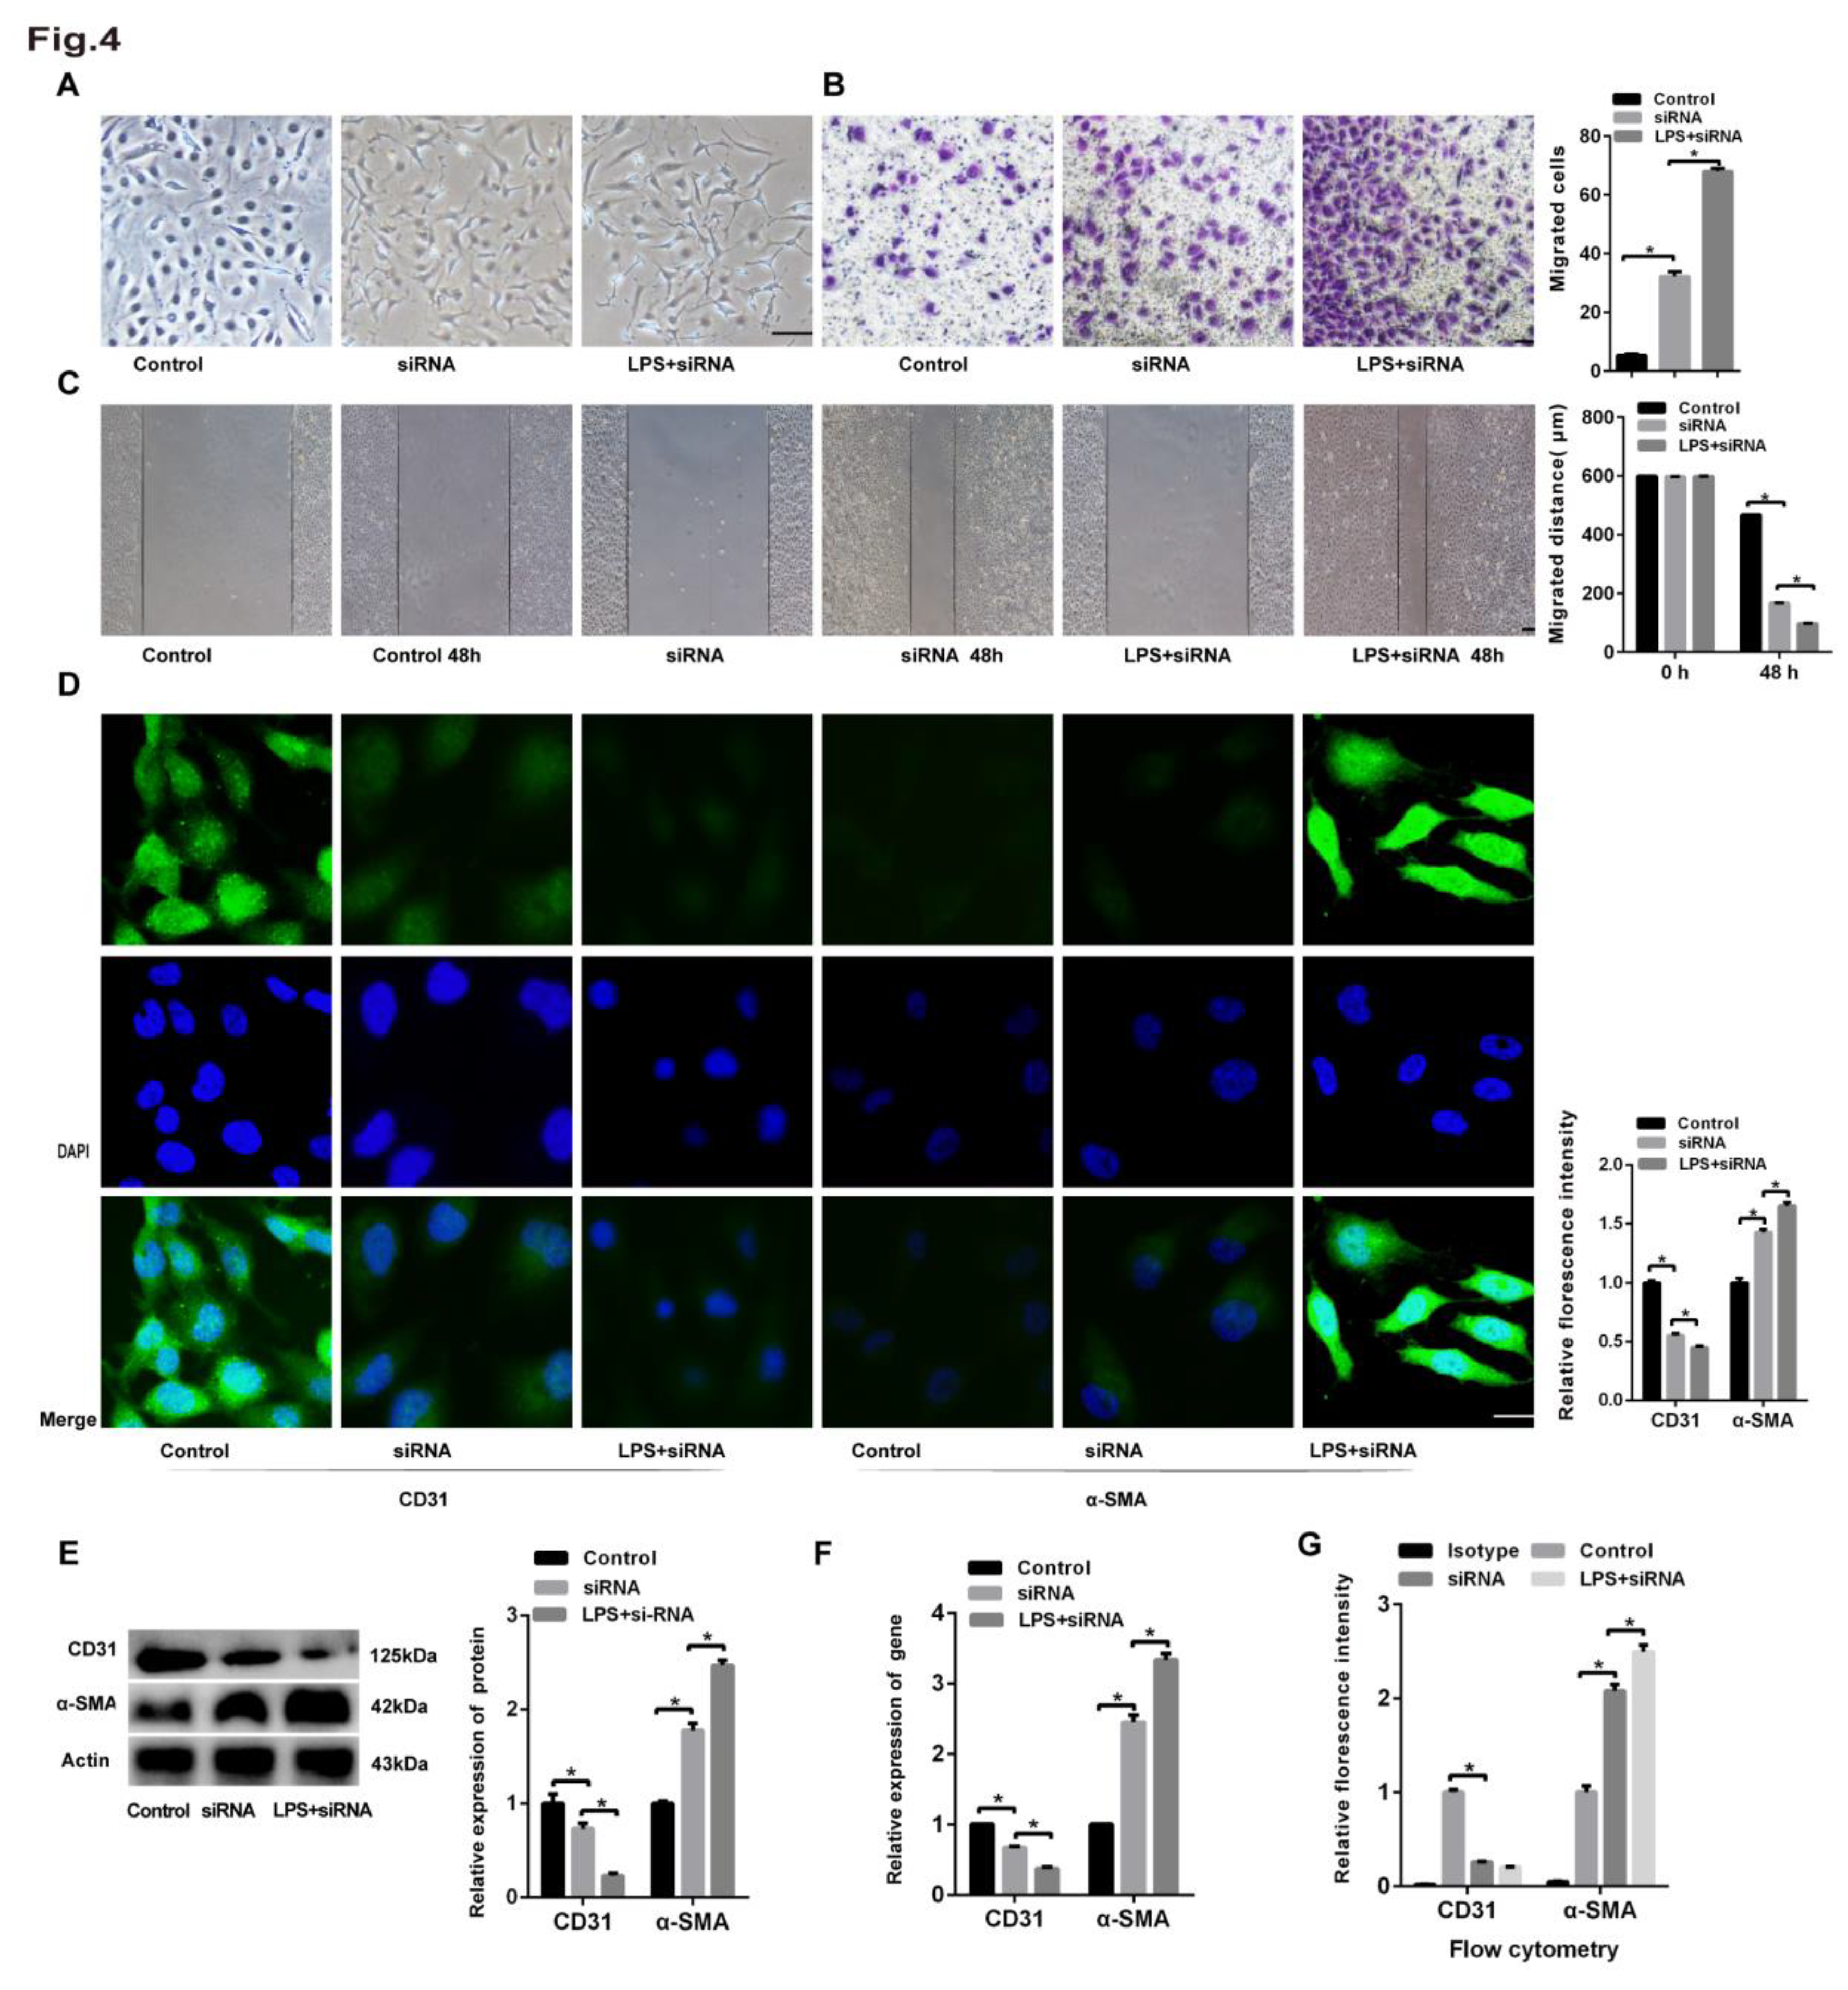
Figure 5.
rhMFGE8 attenuated LPS-induced EndoMT in HLMECs. Human lung microvascular endothelial cells (HLMECs) were cultured with DMEM/F-12 and 10% standard foetal bovine serum, and the cells were divided into five groups: control group, LPS group, LPS+siRNA group, LPS+rhMFGE8 group, and LPS+siRNA+rhMFGE8 group. (A) The cells were incubated for 96 h. (A) Microscopy was used to observe the cell morphology (magnification, x100, scale bar = 50 μm). (B) Transwell migration assays were performed to examine cell invasion (magnification, x100, scale bar = 50 μm). (C) A scratch assay was performed to examine cell migration (magnification, x100, scale bar = 50 μm). (D) Fluorescence microscopy was used to examine the protein expression of CD31 and α-SMA (magnification, x200, scale bar = 20 μm). (E) The protein expression of CD31 and α-SMA was examined by western blotting. β-Actin was used as a reference protein. (F) The expression levels of the CD31 and α-SMA genes were examined by qRT‒PCR. (G) FCM was used to examine the protein expression of CD31 and α-SMA. Representative images from three replicated independent experiments are shown. n = 3 per group. The data are presented as the means ± SDs. Statistical analysis was performed using Student’s t test, and an asterisk (*) indicates a significant difference (P<0.01) between the LPS group and the LPS+rhMFGE8 group and between the LPS+siRNA group and the LPS+siRNA+rhMFGE8 group.
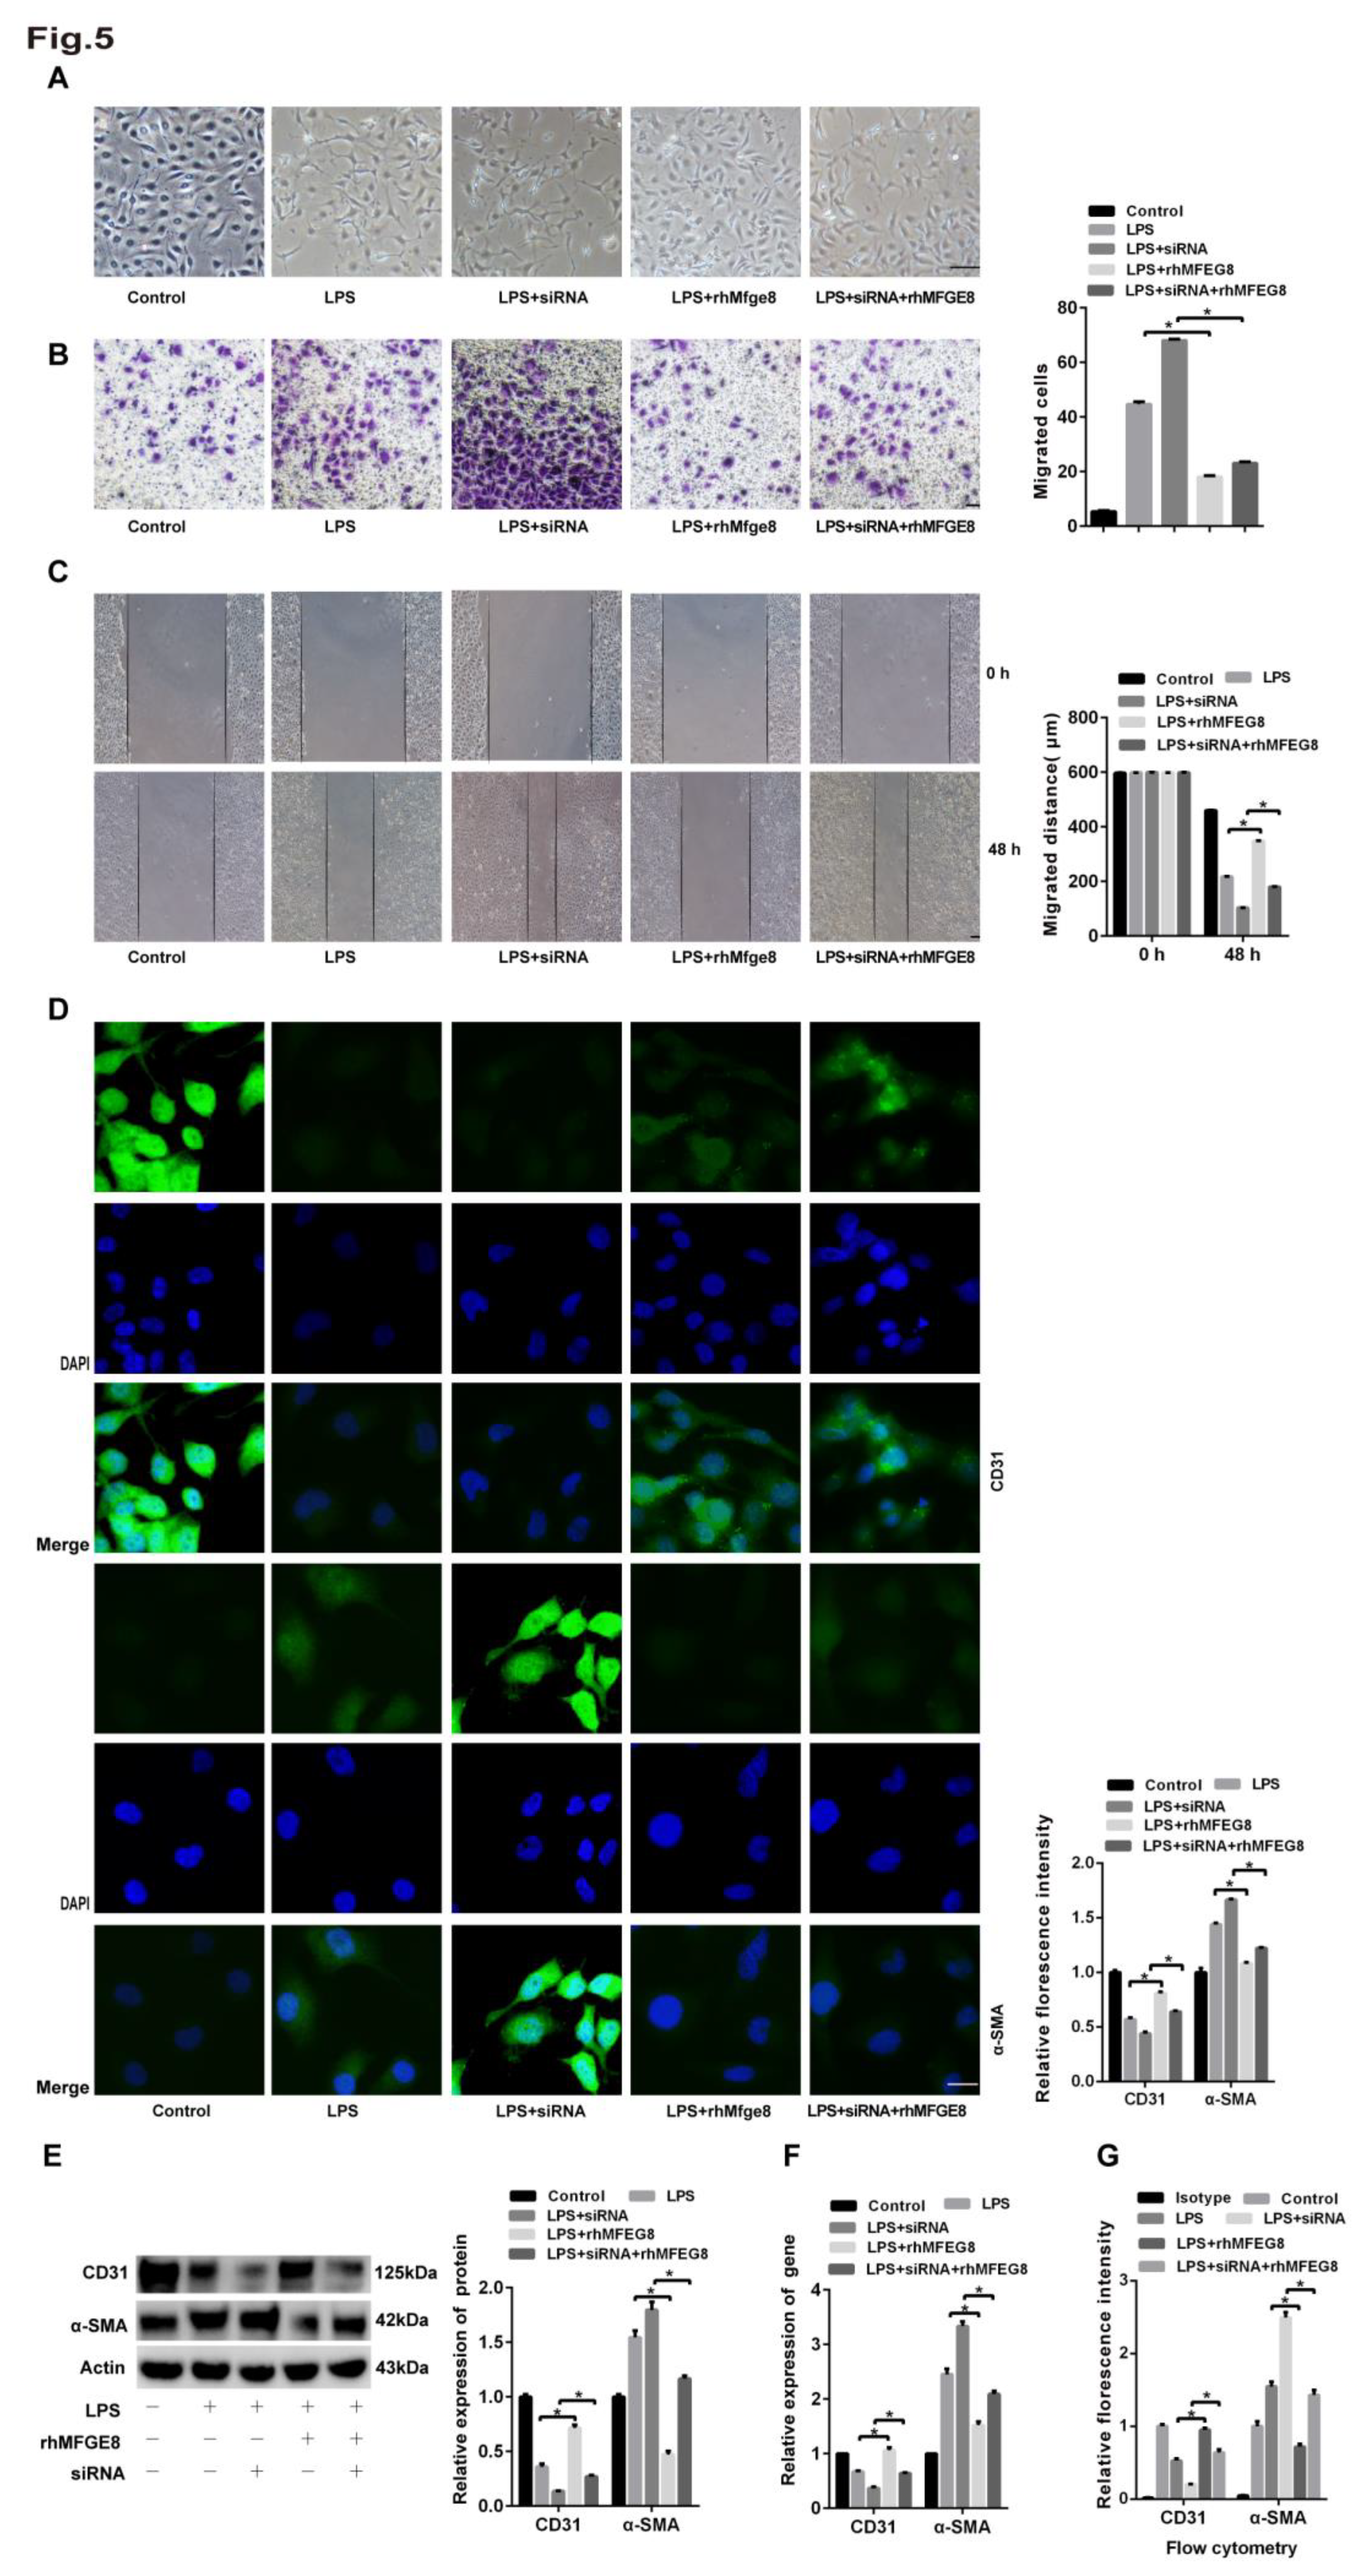
Figure 6.
The BMP/Smad1/5/Smad1/4 signalling pathway was activated by LPS. Human lung microvascular endothelial cells (HLMECs) were cultured with DMEM/F-12 and 10% standard foetal bovine serum, and the cells were divided into five groups: control group, LPS group, LPS+siRNA group, LPS+rhMFGE8 group, and LPS+siRNA+rhMFGE8 group. (A, C) Western blotting and qRT‒PCR were used to determine the protein and gene expression levels of BMP, Smad1, Smad5, Smad4 and Snail. (B) The BMP inhibitor LDN-212854 was used to verify the relationship between LPS and the BMP signalling pathway. Western blotting was used to examine the protein expression of Smad1, Smad5 and Smad4. Β-Actin was used as a reference protein. Representative images from three replicated independent experiments are shown. n = 3 per group. The data are presented as the means ± SDs. Statistical analysis was performed using Student’s t test, and an asterisk (*) indicates a significant difference between the LPS group and the control group and between the LPS group and the LPS+rhMFGE8 group.
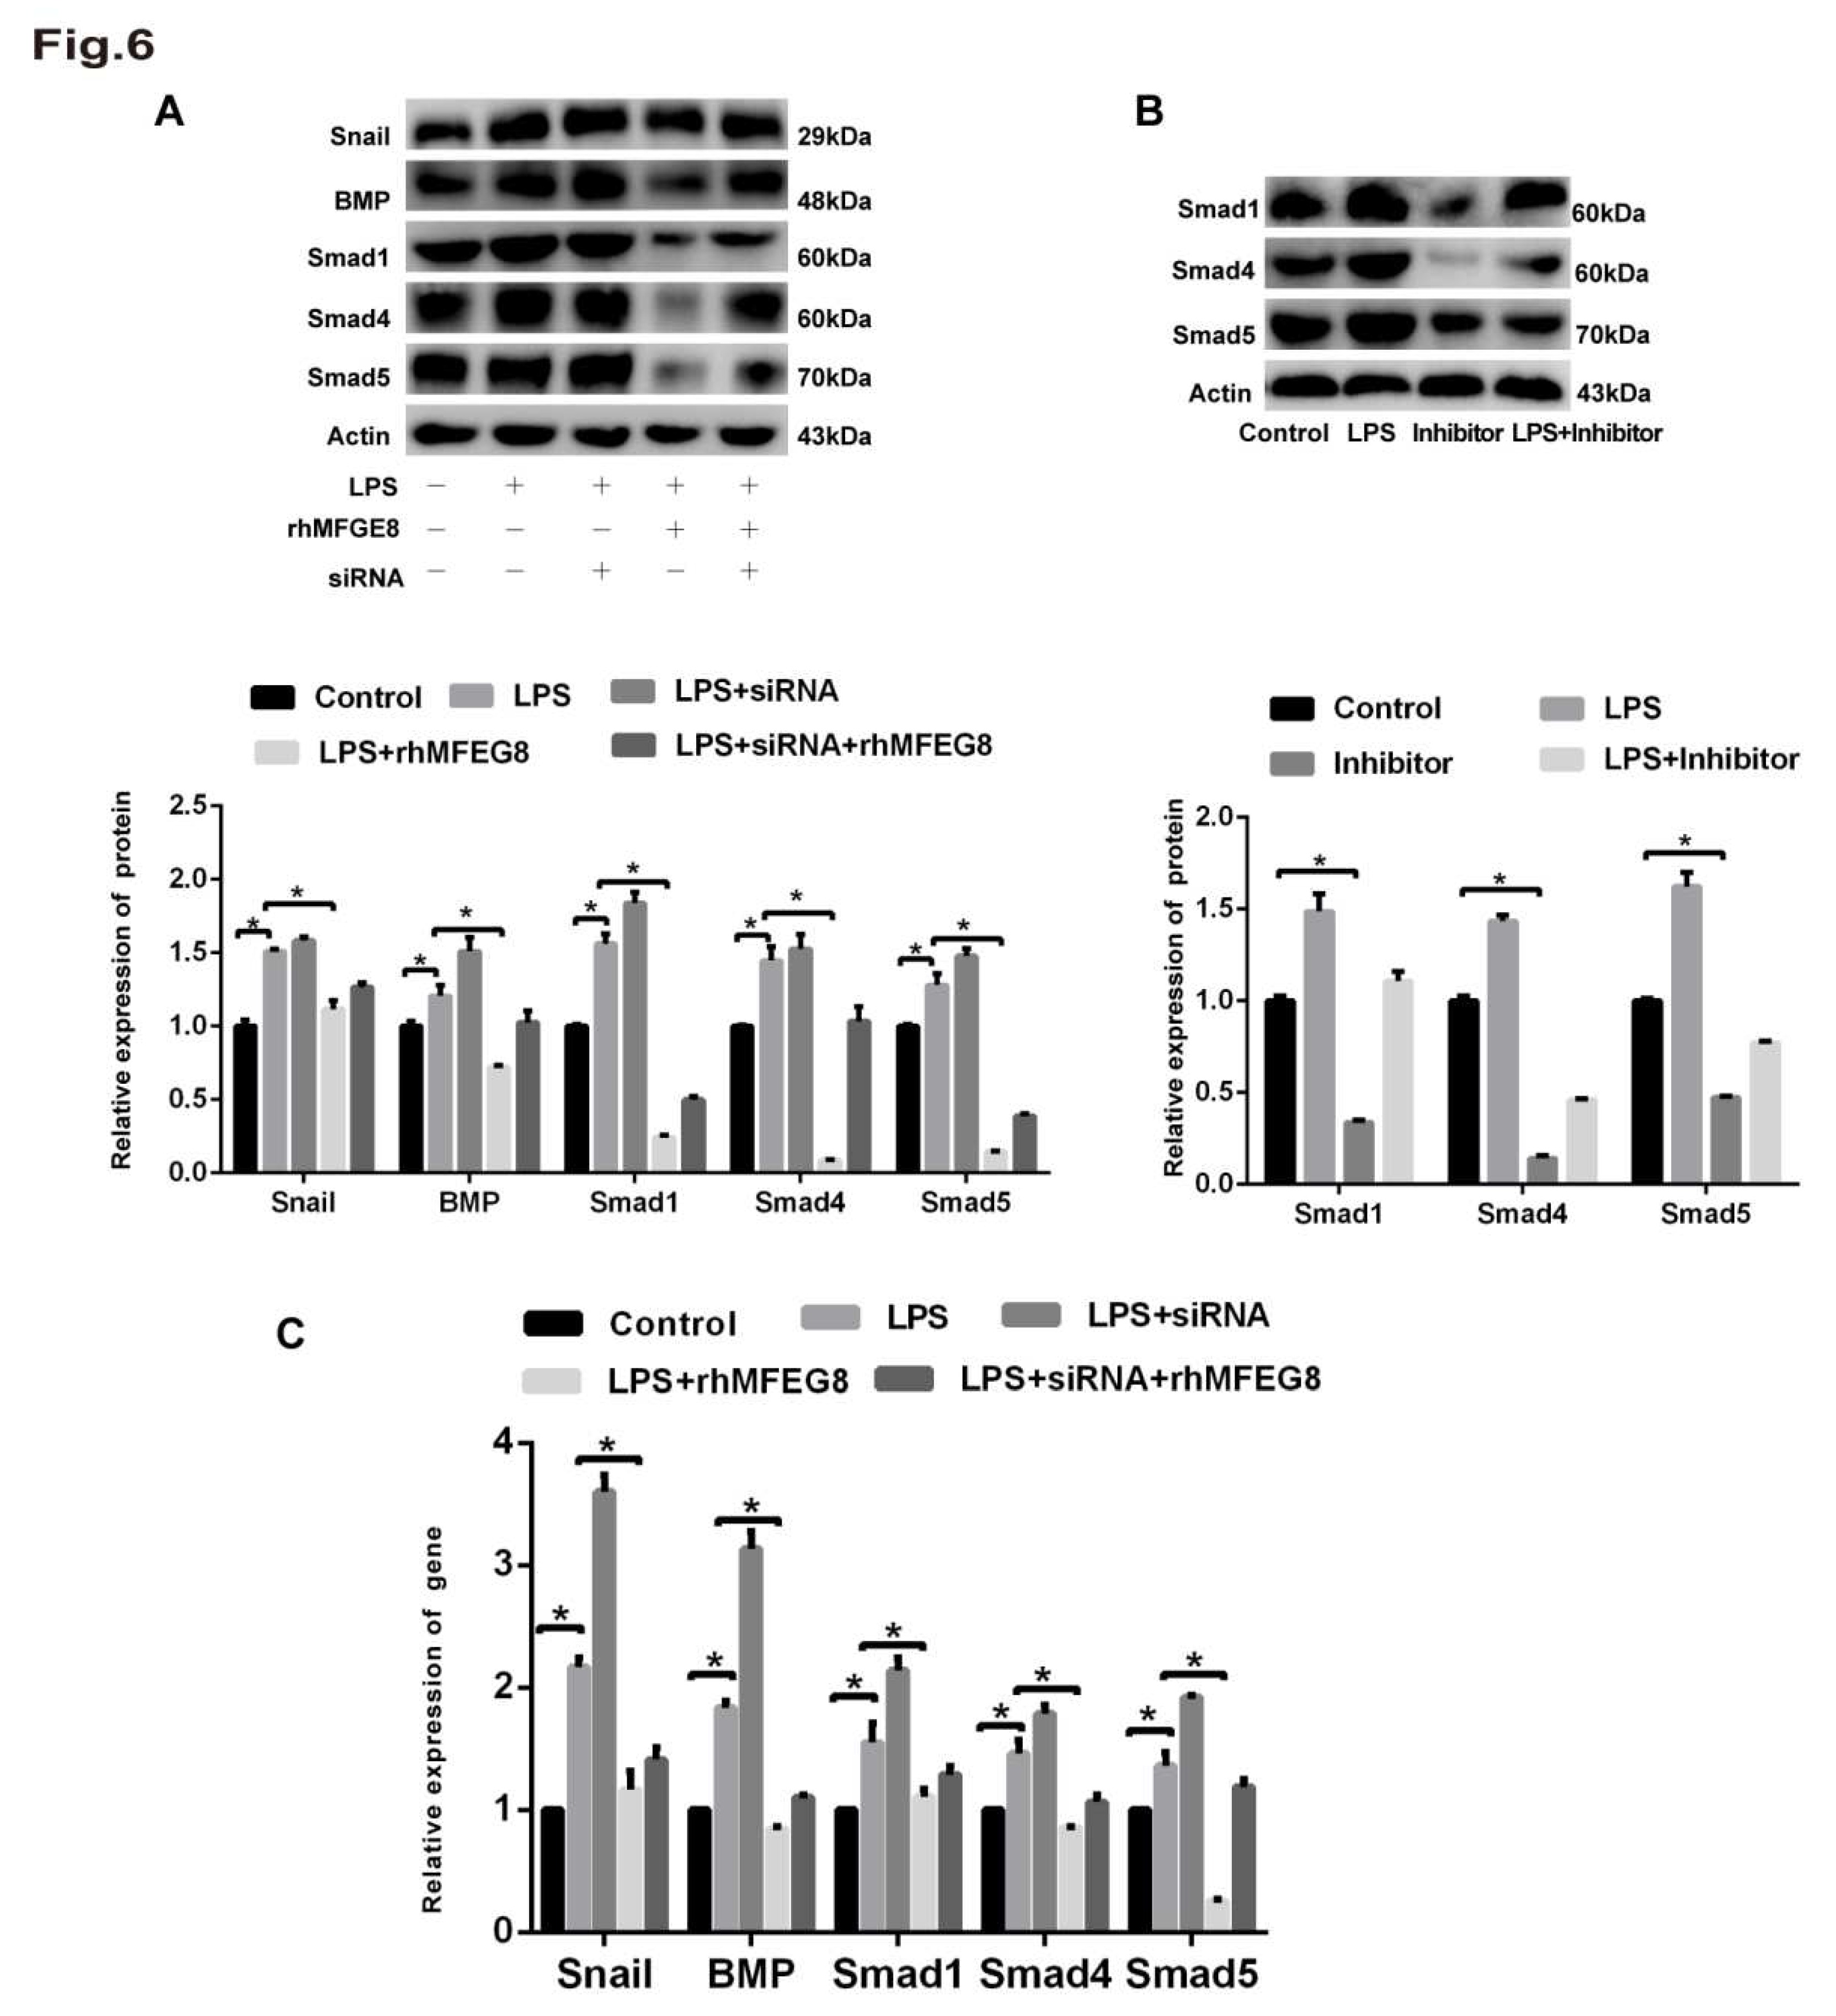
Figure 7.
rhMFGE8 attenuated ECM deposition and played a protective role in the early stage of EndoMT. Forty-five mice were divided into three groups according to a completely randomized design: control group, LPS group and LPS+rhMFGE8 group. The control group was intraperitoneally administered physiological saline. The LPS group was intraperitoneally administered 20 mg/kg LPS dissolved in physiological saline. The LPS+rhMFGE8 group was intraperitoneally administered 20 mg/kg LPS and 20 µg/kg rhMFGE8. At the endpoint of the experiment, the mice were anaesthetised with sodium pentobarbital (60 mg/kg) and euthanised with potassium chloride (100 mg/kg) on days 7, 14 and 28. (A) H&E staining was used to observe the LPS-induced changes in cell morphology and the alveolar septum in the lung (magnification, x100, scale bar = 100 μm). (B) Masson staining was used to examine ECM deposition in lung tissue (magnification, x100, scale bar = 100 μm). (C) Fluorescence microscopy was used to examine the protein expression of CD31 and α-SMA in lung tissue. CD31 is shown by red fluorescence, and α-SMA is shown by green fluorescence (magnification, x200, scale bar = 20 μm). Western blotting was used to examine the protein expression of CD31 and α-SMA. n = 5 mice per group were analysed in the experiment. The data are presented as the means ± SDs. Statistical analysis was performed using Student’s t test, and an asterisk (*) indicates a significant difference between the LPS group and the control group and between the LPS group and the LPS+rhMFGE8 group.
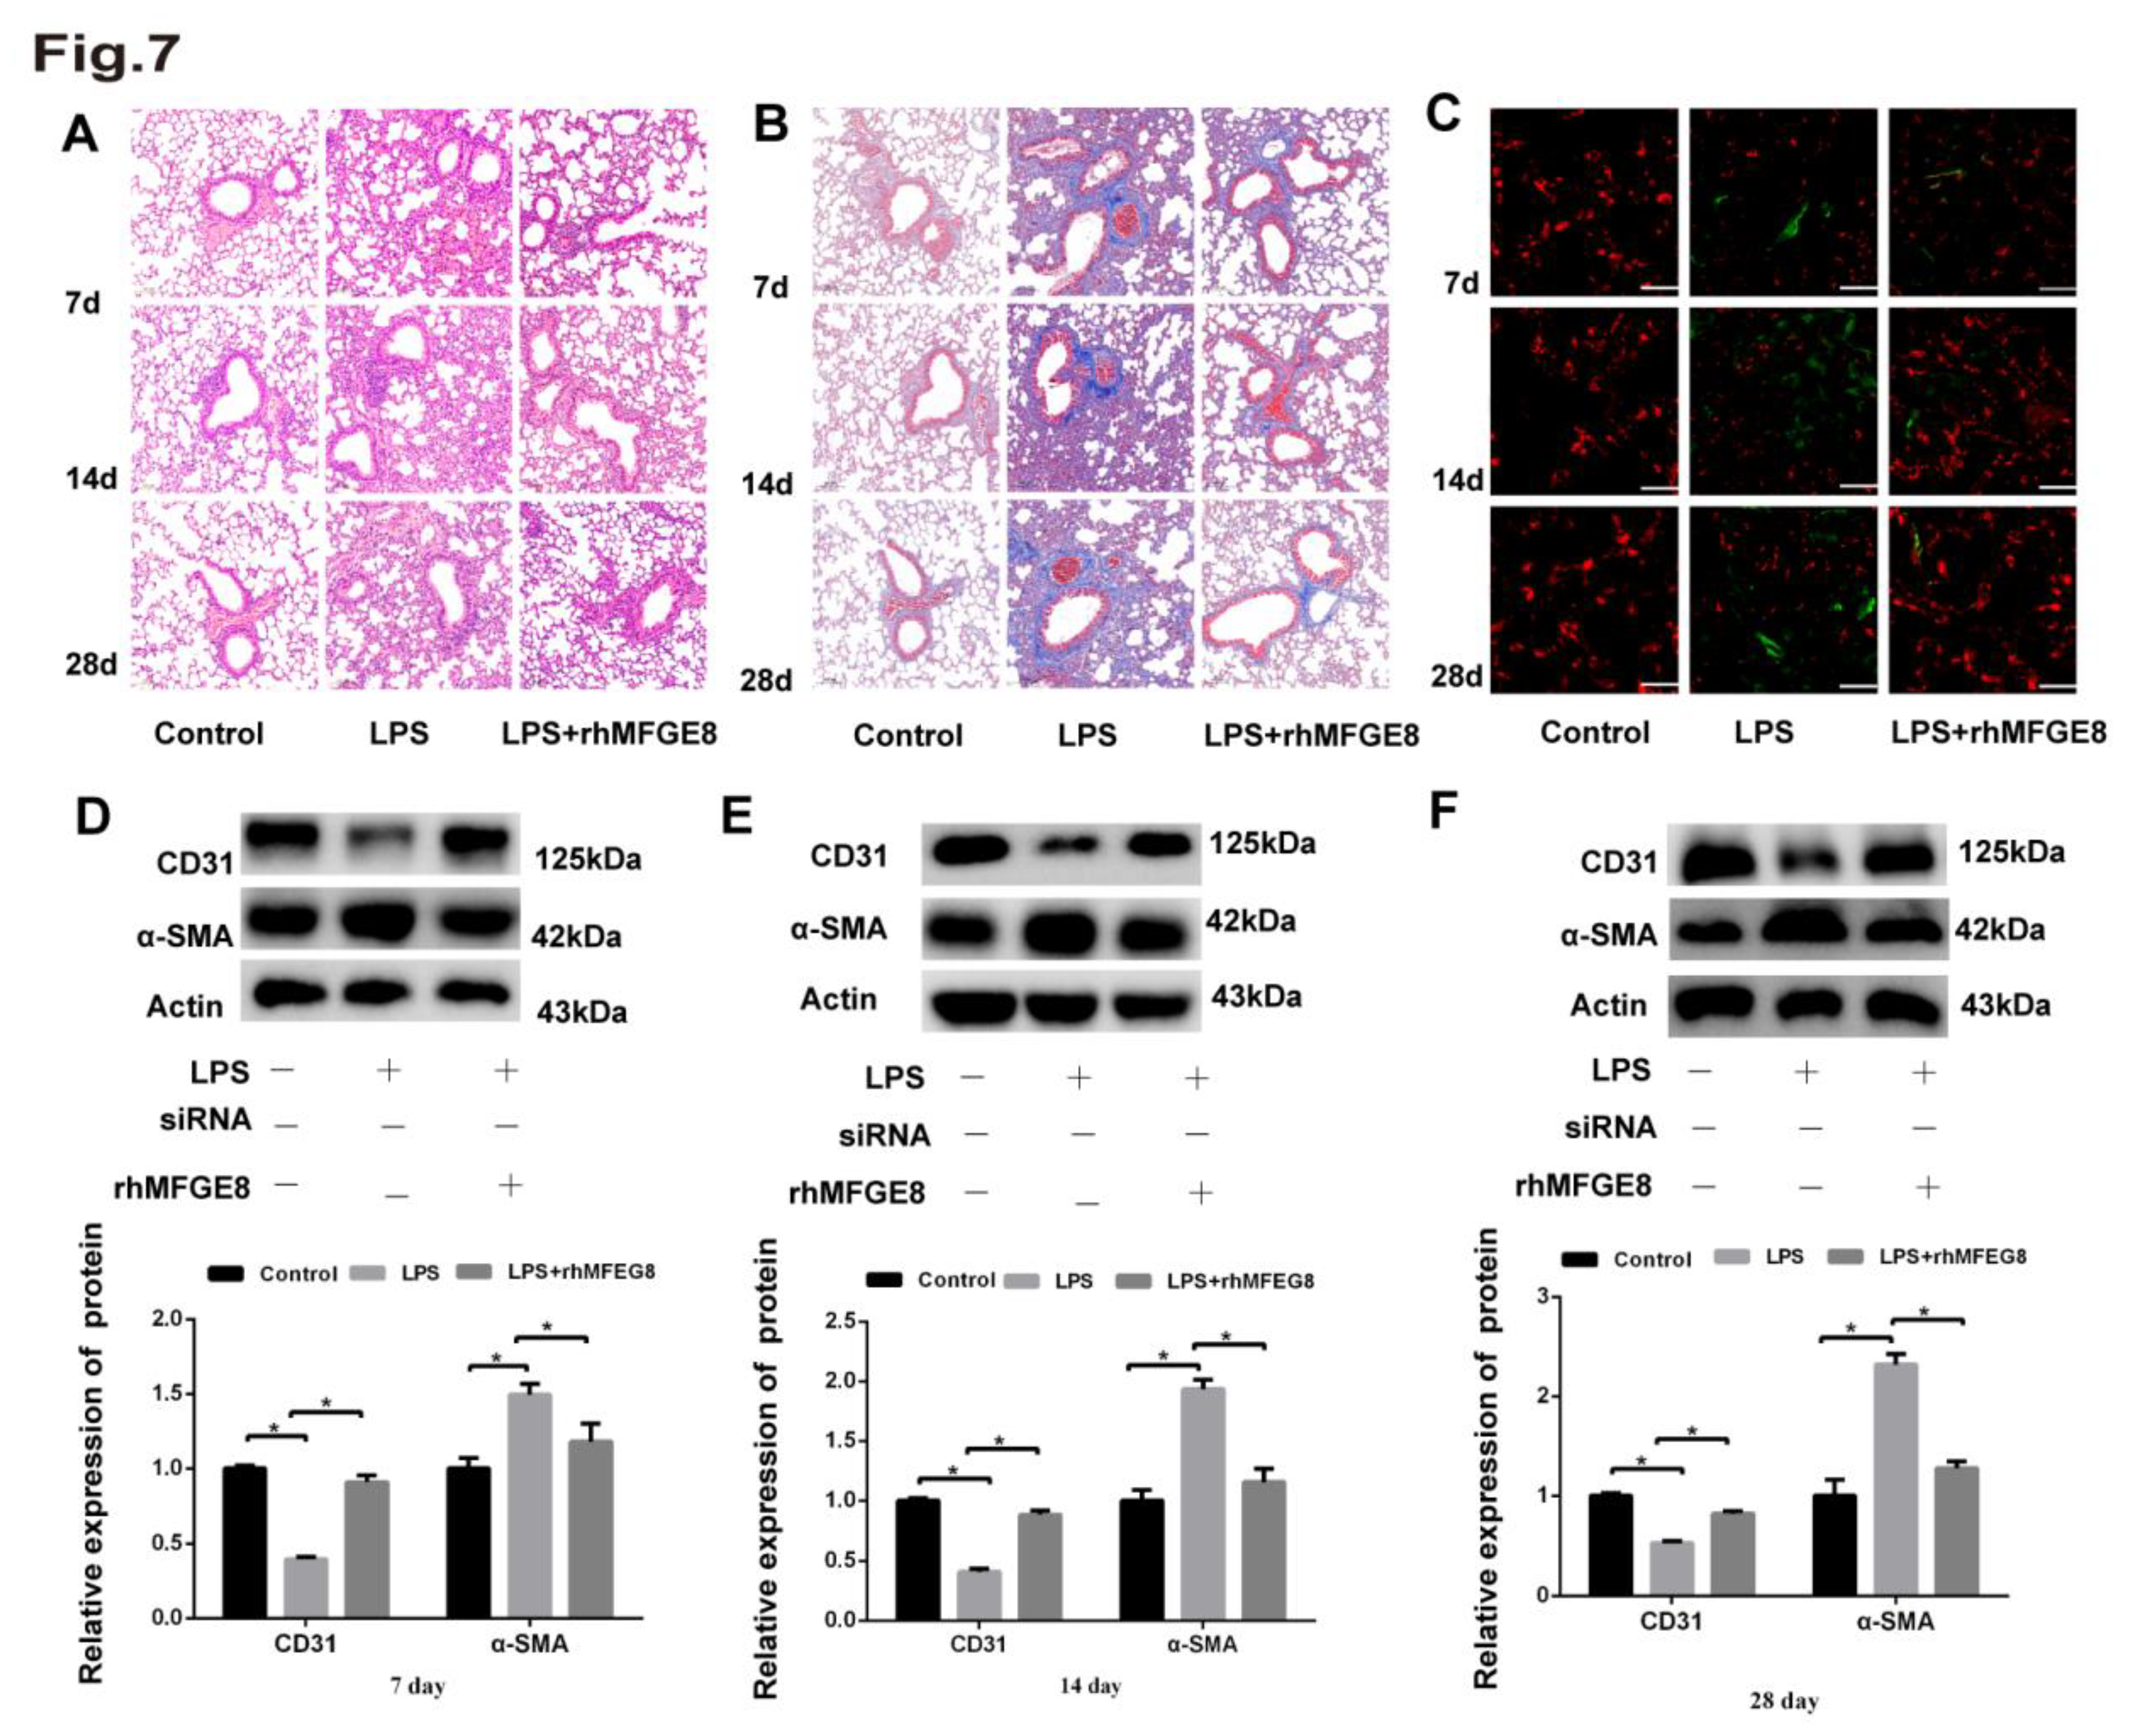
Table 1.
Primer sequences used for qRT‒PCR.
| Gene | Forward primer | Reverse primer | |
| human | MFGE8 | atgggaacattgccaactcac | ggggttatcgtcattgctgc |
| human | BMP4 | tagcccctaagcatcactcacag | cacatcgctgaagtccacatag |
| human | CD31 | ccaagatagcctcaaagtcgg | ctgggcatcataagaaatcctg |
| human | Smad1 | tctcagccgatggacacaaac | agcaaccgcctgaacatctc |
| human | Smad4 | tgagggacagccatcgttg | cacaggaatgttgggaaacttg |
| human | Smad5 | cctccagtattagtgcctcgtc | ctgtggttcattgtggctcag |
| human | Snail | aatcggaagctaactacagcg | atgagcattggcagcgagg |
| human | α -SMA | ggctgttttcccatccattg | cttttgctctgtgcttcgtca |
Disclaimer/Publisher’s Note: The statements, opinions and data contained in all publications are solely those of the individual author(s) and contributor(s) and not of MDPI and/or the editor(s). MDPI and/or the editor(s) disclaim responsibility for any injury to people or property resulting from any ideas, methods, instructions or products referred to in the content. |
© 2023 by the authors. Licensee MDPI, Basel, Switzerland. This article is an open access article distributed under the terms and conditions of the Creative Commons Attribution (CC BY) license (https://creativecommons.org/licenses/by/4.0/).
Copyright: This open access article is published under a Creative Commons CC BY 4.0 license, which permit the free download, distribution, and reuse, provided that the author and preprint are cited in any reuse.


