
Submitted:
07 January 2026
Posted:
09 January 2026
You are already at the latest version
Abstract
Invasive alien species such as Lantana camara L. have ecological impacts that affect native species and soil conditions in different areas. The context specific ecological effects of L. camara on native woody species and communities remain poorly understood, yet such understandings are essential to maintain biodiversity. Therefore, we assessed the ecological impacts of L. camara on native woody species and soil nutrients in protected and communal areas in the Kavango Zambezi Transfrontier Conservation Area (KAZA TFCA) in Zimbabwe. Stratified random sampling was used to sample 60 plots in invaded and uninvaded sites in the separate Communal and Park of the KAZA TFCA. In each plot, woody vegetation was assessed with respect to species composition and richness, stem density, canopy diameter, height and diameter at breast height. Soil samples were collected and analysed for nitrogen, organic carbon, phosphorus, potassium, and pH. The results showed that L. camara negatively affected the native species, with a significant decrease in species richness, density, height, and canopy cover in invaded plots relative uninvaded plots. However, invaded plots had lowest pH (6.1) and soil nutrients such as phosphorus and organic carbon than uninvaded plots. However, some vegetation and soils changes were likely the result of land uses and land use intensities which promote the invasion of L. camara. We conclude that L. camara invasion negatively affected native vegetation diversity and growth, which necessitates the implementation of appropriate control and the management strategies for L. camara in this species rich transfrontier conservation area. Such strategies need to be suitable for the area based on current land uses in the area.
Keywords:
invasive alien plant
; lantana camara
; native woody species
; species richness
; soil nutrients
; land use
; Kavango Zambezi Transfrontier Conservation Area
1. Introduction
One of the major drivers affecting biodiversity globally is invasive alien species (IAS) [1,2], including invasive alien plants (IAPs). One such IAP is Lantana camara L., an evergreen, aromatic shrub of the family Verbenaceae [3]. It thrives in disturbed environments [4] and can dominate invaded habitats, suppressing the growth of native vegetation.
Lantana camara has successfully invaded multiple ecosystem types, including grasslands, woodlands, and forests [5], across all continents except Antarctica. Invasions are generally, although not universally, facilitated by habitat disturbance, such that L. camara rarely invades intact forests. It cannot persist under dense forest canopies unless disturbance creates canopy gaps [6,7]. The species frequently forms pure stands, particularly in open habitats, but is also capable of growing within diverse plant communities [8,9]. Its invasive capacity is further enhanced by climate change in some regions [10].
Some impacts of L. camara are mediated through allelopathic effects, which hinder the regeneration and growth of neighbouring plant species [7,11]. Coupled with its rapid growth, L. camara invasion typically reduces native species richness and diversity, plant density, and seedling recruitment [8,12]. For example, Ruwanza [12] demonstrated in northern South Africa that L. camara contributes to major shifts in vegetation structure, favouring woody species over herbs and grasses.
The impacts of L. camara on native vegetation also have secondary effects on fauna. For instance, reductions in grazing areas and forage availability have negatively affected sable antelope (Hippotragus niger) and plains zebra (Equus quagga) in South Africa [13]. In India, habitat alteration associated with L. camara invasion has been linked to declines in insectivorous and canopy bird species [14]. In addition to allelopathy and competition, L. camara increases fire risk and fire intensity due to its high flammability associated with aromatic leaf oils [15] and increased fuel loads [6]. Altered fire regimes, in turn, affect woody species composition and density. Dar et al. [16], for example, reported positive feedbacks between L. camara invasion and fire that altered forest composition and ecosystem functioning in India.
Within soil ecosystems, L. camara invasion is often associated with changes in soil properties, including pH and nutrient composition, which may favour its own growth [17,18]. Ruwanza and Shackleton [19] showed that L. camara increased soil carbon, phosphorus, and moisture, changes likely to influence native species growth while facilitating further invasion. Other studies have reported increases in calcium, magnesium, potassium, and soil pH under L. camara invasion [20]. Similarly, Mahla and Mlambo [21] found that L. camara presence was associated with increased soil carbon, nitrogen, and pH. In contrast, Kisaakye [22] argued that L. camara does not modify soil pH directly, but instead preferentially invades sites with favourable soil pH conditions.
Despite extensive research on the impacts of L. camara on vegetation and soil properties, generalisations regarding IAS impacts remain challenging because effects are often site- and species-specific [23]. Native woody species constitute a significant component of biodiversity and provide essential ecosystem services that support local livelihoods [24]. In western Zimbabwe, the Hwange District forms part of the Kavango–Zambezi Transfrontier Conservation Area (KAZA TFCA), where the spread of L. camara has raised concerns among local leadership and Rural District Council officials. The invasion of L. camara within the KAZA TFCA potentially threatens native woody species, with implications for ecosystem functioning, resilience, and ecosystem services, including livestock fodder, medicinal and food plants, and the ecotourism-based economy. However, limited research on L. camara in Zimbabwe constrains the ability of management authorities and policymakers to develop informed control strategies, particularly within a large transfrontier conservation area. Consequently, this study aimed to determine the impacts of L. camara invasion on native woody species composition and structure, as well as soil nutrients, within the KAZA TFCA. Specifically, the study addressed two questions: (i) What is the impact of L. camara invasion on native woody species composition and structure in the KAZA TFCA? and (ii) What is the impact of L. camara invasion on soil nutrients in the KAZA TFCA?
2. Materials and Methods
2.1. Study Site
The study was conducted in Zambezi National Park (hereafter, the Park) and the adjacent Ndlovu Communal Area (hereafter, the Communal), located in northwestern Zimbabwe within the Kavango–Zambezi Transfrontier Conservation Area (KAZA TFCA). The KAZA TFCA was established in 2011 and is the world’s largest transfrontier conservation area, spanning over 520,000 km² across Angola, Botswana, Namibia, Zambia, and Zimbabwe [25]. In Zimbabwe, the KAZA TFCA is situated in the northern part of Matabeleland Province, where this study was undertaken, specifically within Zambezi National Park. The park covers approximately 56,000 ha along the Zambezi River near Victoria Falls and provides critical habitat for diverse wildlife, including elephants, lions, buffalo, and several antelope species.
The KAZA TFCA comprises a mosaic of protected areas and communal lands, where local communities engage in small-scale agriculture, livestock grazing, and fishing while coexisting with wildlife [26,27]. The region holds significant biodiversity resources that are vital for sustainable development and may buffer the area against climate change impacts [28]. Sampling was undertaken in Victoria Falls National Park (VFNP) (17.91° S, 25.84° E), the Ndlovu Communal Area (18.06° S, 26.19° E), and the Victoria Falls Rainforest (VFRF) (17.55° S, 25.51° E). All three sites fall within Hwange District, which has a population of 68,541 people [29]. Lantana camara is currently confined to four administrative wards within the district, comprising approximately 2,430 households. Household land holdings in Hwange District range from 0.5 to 6 ha, with an average usable area of approximately 3 ha per household [30].
The study area falls within Agroecological Regions IV and V of Zimbabwe, characterised by low annual precipitation of approximately 400–500 mm, most of which occurs during the summer season (October–April) [31]. Mean daily temperatures range from approximately 19 °C in winter to 30 °C in summer [32]. Soils are predominantly loose Kalahari sands characterised by heavy leaching and low fertility, although isolated patches of sandy loam soils occur [33]. Vegetation is mainly deciduous savanna woodland, dominated by Afzelia quanzensis, Baikiaea plurijuga, Brachystegia boehmii, Colophospermum mopane, Combretum collinum, and Pterocarpus angolensis [31]. Grass cover is generally low, with common species including Aristida junciformis, Dactyloctenium aegyptium, and Heteropogon contortus [34].
In the Communal Area, local communities face challenges associated with human–wildlife conflict but also benefit from ecotourism and community-based conservation initiatives linked to Park resources. The dry climatic conditions make the area susceptible to L. camara encroachment, and climate models predict that habitats vulnerable to L. camara invasion in Matabeleland Province could increase from 3% to 33% over the next 50 years, representing an additional ~6,000 km² of vulnerable land [35]. Such expansion could negatively affect rural livelihoods, biodiversity, and the tourism sector within the KAZA TFCA [36].
2.2. Data Collection
A reconnaissance survey was conducted to identify areas invaded by L. camara within both the Park and the Communal Area. Each area was subsequently stratified into “invaded” and “uninvaded” zones. Universal Transverse Mercator (UTM) grid squares were overlaid on the study area to enable random selection of 60 sampling cells. Following Chatanga et al. [37], each sample plot measured 25 m × 25 m. Eighteen plots were established in the Park (12 invaded and 6 uninvaded), while 42 plots were established in the Communal Area (34 invaded and 8 uninvaded).
2.3. Vegetation Attributes
Field data collection was conducted at the end of the rainy season (April–May 2018) to facilitate accurate plant identification. Native woody species were defined as hard-stemmed, self-supporting plants native to the region with a diameter at breast height (DBH) ≥ 5 cm. Species identification was undertaken using appropriate field guides [38]. In each plot, all woody plants were identified, and canopy cover, DBH, and stem height were measured.
Crown cover was estimated by measuring the longest canopy diameter and the diameter perpendicular to it [37]. Mean canopy diameter was calculated as:
where D represents the mean crown diameter. Values were subsequently converted to percentages.
Plant height was estimated using a ranging rod, and for multi-stemmed individuals, the height of the tallest stem was recorded [37,39]. DBH was measured using a diameter tape. For multi-stemmed individuals, mean DBH was calculated using the quadratic mean formula [40]:
where dᵢ represents the diameter of individual stems (m).
2.4. Soil Attributes
Five soil samples were collected per plot—one from each corner and one from the centre—and homogenised to form a composite sample [39]. Samples were collected at depths of 10–15 cm and sieved using a 2 mm mesh to remove stones and coarse organic matter. Although 60 composite samples were collected, only 36 (20 from the Communal Area and 16 from the Park) were analysed due to cost constraints.
Soil analyses included nitrogen (N), phosphorus (P), potassium (K), pH, and organic carbon (OC). Nitrate nitrogen (NO₃⁻–N) was determined colorimetrically using a Shimadzu UV-1800 spectrophotometer following extraction with a 1:10 soil:1 M KCl solution. Available phosphorus was measured using the Mehlich-3 extraction followed by colorimetric analysis [41]. Exchangeable potassium was analysed using flame emission spectrometry (Varian AA 200) after Mehlich extraction. Organic carbon was determined using the Walkley–Black method [42]. All analyses were conducted at the Department of Applied Chemistry Laboratory, National University of Science and Technology (NUST), Zimbabwe.
2.5. Data Analysis
Species diversity was calculated using the Shannon–Wiener diversity index (H′) in PAST software (version 2018). Species density was calculated as stems per hectare, while species frequency was calculated as the proportion of plots in which each species occurred.
Normality and homogeneity of variance were assessed using Shapiro–Wilk and Levene’s tests, respectively. Two-way permutational multivariate analysis of variance (PERMANOVA) was used to examine the effects of site and invasion status on woody species diversity and vegetation attributes. Two-way analysis of variance (ANOVA) was applied to normally distributed variables, while the non-parametric Mann–Whitney U test was used to compare invaded Communal and Park sites for L. camara structural attributes, species richness, and diversity.
A two-way analysis of similarities (ANOSIM) was used to test differences in woody species composition between sites and invasion categories [43]. Non-metric multidimensional scaling (NMDS), based on Bray–Curtis dissimilarities, was used to visualise patterns in species composition [43]. Cluster analysis was employed to illustrate similarities between invaded and uninvaded sites. ANOSIM and cluster analyses were conducted using PRIMER v6 with the PERMANOVA+ add-on, while NMDS was performed using the Vegan Community Ecology Package in R [44].
Detrended Correspondence Analysis (DCA) was used to determine gradient lengths and select an appropriate ordination model [45,46]. Canonical Correspondence Analysis (CCA) was then applied to examine relationships between woody species composition and soil variables, as gradient lengths exceeded 3.5 standard deviation units. Forward selection with Monte Carlo permutation tests (999 permutations, p < 0.05) was used to assess model significance and identify key soil variables. Pearson correlation analysis was conducted to examine relationships between soil variables and species diversity metrics. Ordination analyses were conducted in Vegan [44], while correlation analyses were performed using STATISTICA v13.
3. Results
3.1. Vegetation Structure and Diversity
Invaded plots were markedly different from uninvaded plots with respect to all investigated variables, and this pattern was consistent across both the Park and Communal areas (Table 1). Invaded plots had significantly lower woody plant stem height, stem diameter, density, canopy cover, diversity, and species richness than uninvaded plots (Table 1). The most pronounced difference was in native species canopy cover, which decreased from >70% in uninvaded plots to <10% in invaded plots. Stem density also showed a marked reduction due to invasion (p < 0.002), with uninvaded plots in both the Park and Communal areas having higher stem density than invaded plots (Table 1).
Woody plant species richness differed significantly, with the highest richness in uninvaded Park plots, followed by uninvaded Communal plots, and then invaded sites (Table 1). Consequently, the Shannon–Wiener index indicated higher diversity in uninvaded plots than in invaded ones. There were no significant differences in species diversity between sites within the same invasion category (Table 1). Comparison of L. camara between the Communal area and Park revealed approximately seven times higher density (Z = 4.5; p = 0.001) and more than four times greater canopy cover (Z = 4.2; p = 0.001) in the Communal area than in the Park. Mean height of L. camara was also approximately double in the Communal area compared to the Park (Z = 3.4; p = 0.001; Table 1).
3.2. Species Composition and Its Association with the Invasion of L. camara
Fifty native woody species from 21 families were recorded (Table 2). Uninvaded plots in the Park had the most species (48), whereas the invaded plots in the Communal area had the lowest number (25). Generally, woody species were more abundant in the uninvaded sites; this was particularly so in Communal areas (ANOSIM R = 0.8; p = 0.001) (Table 3). The same distribution pattern was evident in the Park, except for species such as Diospyros mespiliformis and Hyphaene coriacea that had equal or greater frequency in invaded plots than in uninvaded plots. Apart from the plots in the Park having more frequently-occurring species, the ANOSIM revealed that the differentials between invaded and uninvaded conditions were greater in the Communal plots (Table 3).
The most frequently occurring species, with an occupancy frequency greater than 70% across uninvaded sites were Afzelia quanzensis, Albizia harveyi, Bauhinia petersiana, Colophospermum mopane, Combretum imberbe, Dichrostachys cinerea, Diplorhynchus condylocarpon, Euclea divinorum, Grewia flavescens and Terminalia sericea. Only, Combretum imberbe had high frequencies (greater than 50%) in the invaded sites (Table 2).
3.3. Species Composition
The ordination plot revealed three distinct clusters separated on invasion status and land-use (Figure 1). Invaded Communal formed Cluster A, whilst invaded Park formed Cluster B; Cluster C consisted of uninvaded sites in both locations (Figure 1). Uninvaded plots in Cluster A favoured the assemblage of species such as C. imberbe, C. molle, G. flavescens, G. senegalensis, P. africanum, V. infausta and S. birrea among others, whereas Cluster B was positively associated with B. petersiana, C. hereroense, C. mopane, D. cinerea, F. petersii and T. emetica among others. Cluster C was associated with B. discolor, B. spiciformis, K. africana, S. potatorium and T. stuhlmanii
Assemblages in the cluster analysis revealed four distinct clusters (Figure 2). Like the NMDS ordination, the first cluster, Cluster A, consisted of invaded Communal sites, whereas Cluster B comprised mainly invaded Park sites. Uninvaded Park and Communal areas formed Cluster C, whereas Cluster D consisted of a combination of invaded Park and Communal sites (Figure 2).
3.4. Effects of L. camara on Soil Nutrients, Species Composition and Diversity
There were significant differences in soil nutrients between invaded and uninvaded areas (Table 4). The most significantly affected variables were pH, P and OC, which were higher in invaded than uninvaded sites. For example, OC was approximately two times higher in the invaded sites than the uninvaded sites in the Communal area, whereas P was 15 to 100 times less in the uninvaded sites compared to invaded sites. Generally, differences between invaded and uninvaded sites were more pronounced in the Communal area (Table 4). The CCA revealed that the first two axes explained 54% of the total variation between species composition and soil nutrient variables (Table 5). Axes 1 and 2 with eigenvalues 0.11 and 0.098 accounted for 30% and 24% of the variance, respectively.
The Monte-Carlo permutation test revealed that the CCA model was statistically significant (p<0.05), indicating that the soil variables had a significant effect on the composition of woody species in both locations. The CCA ordination plot revealed that pH and OC were the most important soil variables influencing the distribution of native woody species at the two sites (Table 5). The above-mentioned two variables indicated a strong negative association with the invaded Communal sites (Figure 3). The variables were positively associated with D. condylocarpon, G. flavescens, P. maprouneifolia, V. infausta and Z. mucronata. Conversely, pH and OC indicated positive associations with invaded and uninvaded Park sites and favoured the assemblage of species such as C. mopane, H. coriacea, O. reticulata, P. thonningii, S. potatorium and T. emetica.
Of the ten vegetation attributes considered, only three were significantly associated with soil nutrients (p < 0.05; Table 6). Native woody species DBH significantly decreased with increasing pH and OC, whereas L. camara height increased with increasing K. Conversely K negatively affected the canopy cover of L. camara (Table 6).
4. Discussion
4.1. Vegetation Structure and Diversity
This study showed that L. camara invasion negatively affected native woody species composition, diversity, and structure and was associated with changes in some soil properties. The ability of L. camara to alter ecosystem structure, function, and resource availability is well documented. For example, studies by Chatanga et al. [26], Gooden et al. [27], Goyal et al. [48], Negi et al. [7], and Ruwanza [11] have all shown the threat posed by L. camara to native plant communities through alteration of their structure and biodiversity.
In this study, L. camara contributed to a decline in species richness and diversity of native woody species in both the Communal and Park areas. This is in line with Ruwanza [11], who showed that areas invaded by L. camara had reduced plant species diversity and altered composition. Other vegetation structural attributes, such as stem height, DBH, density, and canopy cover, were also negatively impacted by the presence of L. camara. Chatanga et al. [26] support this by suggesting that L. camara invasion contributes to the reduction of native species by limiting native plant recruitment and growth potential. Indeed, Jevon and Shackleton [49] showed lower native species seedling diversity and density under L. camara.
The allelopathic properties of L. camara can also explain the low densities of native species in invaded sites. Shackleton et al. [50] and Negi et al. [7] reported that L. camara’s allelopathic chemicals affect the recruitment and growth of native species. Kumar et al. [16] also asserted that the ability of L. camara to release phytotoxic chemicals from roots suppresses the growth and recruitment of native plants in surrounding areas.
The marked difference in richness and diversity of woody species among L. camara-invaded sites was consistent in both Communal and Park areas. Shackleton et al. [50] stated that an increase in density of L. camara has a negative correlation with native species richness. Jevon and Shackleton [49] attributed differences in density and richness among invaded and uninvaded areas to L. camara slowing down successional processes.
However, Chatanga et al. [26] and Kumar et al. [16] reported that L. camara increases fire frequency and intensity, resulting in some native plants being lost during fires, thus reducing species richness and abundance. Gooden et al. [27] expressed the need to exercise caution in attributing species loss to L. camara, as native species loss may precede invasion. Factors such as fire and grazing may facilitate vegetation decline and increase invasion likelihood. This might be the case in our study, as uninvaded Communal sites showed lower woody plant densities, richness, DBH, and height than uninvaded Park sites, together with lower soil N, P, and OC.
4.2. Species Composition
Species composition varied greatly between invaded and uninvaded areas, with higher species richness and diversity in uninvaded areas (Table 2). Uninvaded Park areas had the highest species richness (48), while invaded Communal areas had the lowest (25). This is consistent with Gooden et al. [27], who found that L. camara significantly alters native species composition.
The ANOSIM results revealed that species composition differed markedly across land uses. Invaded Communal areas had lower species richness compared to invaded Park areas. This difference can be explained by relatively higher native canopy cover in invaded Park sites, which likely limits L. camara invasion, as emphasised by Gooden et al. [27]. However, soil physico-chemical modification may also contribute, as Mahla and Mlambo [22] showed that invasive alien species alter soils to favour their own growth.
4.3. Effects of L. camara on Soil Nutrients, Species Composition, and Diversity
In line with Kumar et al. [23], our results showed that L. camara invasion greatly influenced soil nutrient concentrations. Elevated OC levels in invaded areas concur with studies showing increased litterfall under L. camara thickets (Kumar et al. [16]; Mahla and Mlambo [22]; Ruwanza and Shackleton [20]). Comparable increases in soil nutrient availability under L. camara stands have been reported elsewhere [18,51].
In contrast, NO₃⁻–N was lower in invaded areas. Muvengwi and Ndagurwa [52] attributed such patterns to reduced soil moisture affecting nitrification. Soil pH was also significantly lower in invaded sites, likely due to increased litter inputs. Similar findings were reported by Muvengwi and Ndagurwa [52], who linked low NO₃⁻ to reduced nitrification under acidic conditions.
The CCA ordination showed that pH and OC had strong negative effects on species composition, particularly in invaded Communal areas. This aligns with Kumar et al. [16], who suggested that invasion-driven changes in species composition affect nutrient dynamics and promote invasive species persistence. In contrast, positive associations in Park sites suggest that invasion impacts remain below ecological thresholds, as proposed by Gooden et al. [27].
Moreover, in dry savanna ecosystems within the KAZA TFCA, climate change may further enhance the invasive potential of L. camara [53]. Similar patterns of altered understory species composition and reduced diversity due to invasive plant species have also been reported in Central Himalayan forests [54].
5. Conclusions
This study shows that L. camara invasion in both the Communal and Park locations contributed to changes in native woody species composition in the KAZA TFCA. Since the study focused on both Communal and Park areas, the results give insight into L. camara negatively affecting woody species composition despite the land use. However, there were also differences based on land use, independent of L. camara invasion, which raises questions about cause and effect in IAP studies. This study also showed that L. camara contributed to the alteration of soil properties. The results suggest that unless the invasion of L. camara is addressed it will continue to have serious negative implications for the woody plant community structure and composition, which will escalate as the invasion spreads, thereby compromising the supply of key ecosystem services. This requires that appropriate responsive and adaptive IAP policies are developed for the KAZA TFCA and then translated into feasible management and control strategies on the ground, specific to each land use system.
Author Contributions
Conceptualization, B.F. and C.S.; methodology, B.F. and C.S.; investigation, B.F.; resources, B.F.; data curation, B.F.; formal analysis, B.F.; writing—original draft preparation, B.F.; writing—review and editing, B.F. and C.S.; visualization, B.F.; supervision, C.S.; project administration, C.S.; funding acquisition, C.S. All authors have read and agreed to the published version of the manuscript.
Funding
This research was funded by the European Union under the DREAM project (grant agreement FED/2013/333-266), in partnership with the Research Platform “Production and Conservation in Partnership” (RP-PCP), CIRAD- France, Harare Office. The funders had no role in the design of the study; in the collection, analyses, or interpretation of data; in the writing of the manuscript; or in the decision to publish the results.
Data Availability Statement
The data presented in this study are available on request from the corresponding author. The data are not publicly available due to ongoing related research.
Acknowledgments
We appreciate the invaluable support from the European Union (DREAM project - FED/2013/333-266) in partnership with the Research Platform “Production and Conservation in Partnership. Also, we are grateful to the Department of Applied Chemistry at the National University of Science and Technology (NUST), Zimbabwe, for assistance with soil sample analysis. The contents of this study are the sole responsibility of the authors and can under no circumstances be regarded as reflecting the position of the European Union or the Research Platform “Production and Conservation in Partnership” (RP-PCP). During the preparation of this manuscript, the authors used Grok 4 (built by xAI) and the free version of ChatGPT (GPT-5.2 Instant, provided by OpenAI) for the purposes of drafting and refining section texts, checking formatting compliance, and suggesting structural improvements. The authors have reviewed and edited the output and take full responsibility for the content of this publication.
Conflicts of Interest
The authors declare no conflicts of interest. The funders (European Union under the DREAM project, grant agreement FED/2013/333-266, and the Research Platform “Production and Conservation in Partnership”) had no role in the design of the study; in the collection, analyses, or interpretation of data; in the writing of the manuscript; or in the decision to publish the results.
Abbreviations
The following abbreviations are used in this manuscript:
| Abbreviation | Full Form |
| KAZA TFCA | Kavango Zambezi Transfrontier Conservation Area |
| PERMANOVA | Permutational Multivariate Analysis of Variance |
| ANOSIM | Analysis of Similarities |
| IAPs | Invasive Alien Plants |
| NMDS | Non-metric Multidimensional Scaling |
| NUST | National University of Science and Technology |
| TFCA | Transfrontier Conservation Area |
| VFNP | Victoria Falls National Park |
| VFRF | Victoria Falls Rainforest |
| CCA | Canonical Correspondence Analysis |
| DBH | Diameter at Breast Height |
| DCA | Detrended Correspondence Analysis |
| IAP | Invasive Alien Plant |
| IAS | Invasive Alien Species |
| UTM | Universal Transverse Mercator |
| OC | Organic Carbon |
References
- Pyšek, P.; Hulme, P.E.; Simberloff, D.; Bacher, S.; Blackburn, T.M.; Carlton, J.T.; Dawson, W.; Essl, F.; Foxcroft, L.C.; Genovesi, P.; et al. Scientists’ warning on invasive alien species. Biol. Rev. 2020, 95, 1511–1534. [Google Scholar] [CrossRef] [PubMed]
- Gentili, R.; Schaffner, U.; Martinoli, A.; Citterio, S. Invasive alien species and biodiversity: Impacts and management. Biodiversity 2021, 22, 1–3. [Google Scholar] [CrossRef]
- Ssali, F.; Baluku, R.; Drileyo, G.; Muhumuza, M. Associations between Lantana camara L. (Verbenaceae) and common native species in an African savanna. Ecol. Solut. Evid. 2024, 5, e12375. [Google Scholar] [CrossRef]
- Dube, T.; Shoko, C.; Sibanda, M.; Madileng, P.; Maluleke, X.G.; Mokwatedi, V.R.; Tshebesebe, T. Remote sensing of invasive Lantana camara in semiarid savanna rangelands of South Africa. Rangel. Ecol. Manag. 2020, 73, 411–419. [Google Scholar] [CrossRef]
- Mondal, T.; Bhatt, D.; Ramesh, K. Bioclimatic modelling of Lantana camara invasion in the Shivalik landscape of Western Himalaya. Trop. Ecol. 2023, 64, 249–263. [Google Scholar] [CrossRef]
- Barik, S.S.; Sahoo, R.P.; Yadav, M.K. Lantana camara L.: An emerging threat to native flora and livestock: A review. J. Pharmacogn. Phytochem. 2020, 9, 2363–2366. [Google Scholar]
- Negi, G.C.; Sharma, S.; Vishvakarma, S.C.; Samant, S.S.; Maikhuri, R.K.; Palni, L.M. Ecology and use of Lantana camara in India. Bot. Rev. 2019, 85, 109–130. [Google Scholar] [CrossRef]
- Kato-Noguchi, H.; Kurniadie, D. Allelopathy of Lantana camara as an invasive plant. Plants 2021, 10, 1028. [Google Scholar] [CrossRef]
- Muvengwi, J.; Ndagurwa, H.G.T. Soil Seed Bank Dynamics and Fertility on a Seasonal Wetland Invaded by Lantana camara in a Savanna Ecosystem. S. Afr. J. Bot. 2015, 100, 190–194. [Google Scholar] [CrossRef]
- Paul, R.; Subudhi, D.K.; Sahoo, C.K.; Banerjee, K. Invasion of Lantana camara and climate change responses in Eastern Ghats. Biologia 2021, 76, 1391–1408. [Google Scholar] [CrossRef]
- Barahukwa, A.; Chapman, C. A.; Namaganda, M.; Eilu, G.; Omeja, P. A.; Lawes, M. J. The effects of the invasive species, Lantana camara, on regeneration of an African rainforest. African Journal of Ecology 2023, 61(2), 451–460. [Google Scholar] [CrossRef]
- Ruwanza, S. Effects of Lantana camara invasion on vegetation diversity and composition in the Vhembe Biosphere Reserve, Limpopo Province of South Africa. Sci. Afr. 2020, 10, e00610. [Google Scholar] [CrossRef]
- Raphela, T.D.; Duffy, K.J. Effects of the density of invasive Lantana camara plants on the biodiversity of large and small mammals in the Groenkloof Nature Reserve (GNR) in South Africa. Biology 2023, 12, 296. [Google Scholar] [CrossRef]
- Choudaj, K.; Wankhade, V. Reduction in avian diversity due to exotic tree plantations on the native savannas of Pune City, India. Trop. Ecol. 2021, 62, 499–507. [Google Scholar] [CrossRef]
- Tomat-Kelly, G.; Flory, S.L. Research gaps in invasion–fire cycles. Biol. Invasions 2023, 25, 693–711. [Google Scholar] [CrossRef]
- Dar, J.A.; Subashree, K.; Sundarapandian, S.; Saikia, P.; Khan, M.L. Invasive species and their impacts on tropical forests of Central India. In Tropical Ecosystems; Springer: Cham, Switzerland, 2019; pp. 69–109. [Google Scholar] [CrossRef]
- Kumar, M.; Kumar, S.; Verma, A.K.; Joshi, R.K.; Garkoti, S.C. Invasion of Lantana camara and Ageratina adenophora alters the soil physico-chemical characteristics and microbial biomass of chir pine forests in the central Himalaya, India. Catena 2021, 207, 105624. [Google Scholar] [CrossRef]
- Wekhanya, M.N.; Mbugua, P.K.; Mworia, J.K. The effect of invasive species Lantana camara L. on soil nutrients at Ol-Donyo Sabuk National Park, Kenya. Afr. J. Pure Appl. Sci. 2020, 1, 25–32. [Google Scholar] [CrossRef]
- Ruwanza, S.; Shackleton, C.M. Effects of the invasive shrub, Lantana camara, on soil properties in the EasternCape, South Africa. Biol. Manag. 2016, 16, 67–79. [Google Scholar] [CrossRef]
- Simba, Y.R.; Kamweya, A.M.; Mwangi, P.N.; Ochora, J.M. Impact of the invasive shrub, Lantana camara L., onsoil properties in Nairobi National Park, Kenya. Int. J. Biodivers. Conserv. 2013, 5, 803–809. [Google Scholar]
- Mahla, N.; Mlambo, D. Influence of two co-occurring invasive plant species on resident woody species and surface soil properties in Chipinge Safari Area, Zimbabwe. Trop. Ecol. 2019, 60, 129–139. [Google Scholar] [CrossRef]
- Kisaakye, P. The Effect of Lantana camara on Soil Chemical Properties and Germination of Maize Seeds in Mawu Village, Makulubita Subcounty, Luweero District. Ph.D. Thesis, Makerere University, Kampala, Uganda, 2021. Available online: https://dissertations.mak.ac.ug/handle/20.500.12281/8814.
- Dassonville, N.; Vanderhoeven, S.; Vanparys, V.; Hayez, M.; Gruber, W.; Meerts, P. Impacts of alien invasive plants on soil nutrients are correlated with initial site conditions in NW Europe. Oecologia 2008, 157, 131–140. [Google Scholar] [CrossRef]
- Hussain, S.; Sharma, S.; Bhatti, R.C.; Singh, A.N. Sustainability in the Indian Himalayan Region: Understanding the ecosystem services, climate change impacts, land use shifts and their threats. In The Himalayas in the Anthropocene: Environment and Development; Borthakur, A., Singh, P., Eds.; Springer: Cham, Switzerland, 2024; pp. 33–57. [Google Scholar] [CrossRef]
- Stoldt, M.; Göttert, T.; Mann, C.; Zeller, U. Transfrontier Conservation Areas and Human-Wildlife Conflict: The Case of the Namibian Component of the Kavango-Zambezi (KAZA) TFCA. Sci. Rep. 2020, 10, 7964. [Google Scholar] [CrossRef] [PubMed]
- Alexiou, P.; Brekl, J.; Köhler, E.; van Engelen, W. Performing multispecies studies in Southern Africa: Historical legacies, marginalised subjects, reflexive positionalities. Anthropol. S. Afr. 2024, 47, 254–267. [Google Scholar] [CrossRef] [PubMed]
- Muguti, T. Human-wildlife conflicts and livelihoods in Binga District, Zimbabwe: Local communities’ lived experiences. In Living with Wildlife in Zimbabwe; Matanzima, J., Utete, B., Eds.; Springer: Cham, Switzeland, 2024; pp. 41–57. [Google Scholar] [CrossRef]
- Kupika, O.L.; Chanyandura, A.; Chinyavada, J.; Masunga, G. Riparian-based nature-based solutions to climate change in transfrontier components of Botswana and Zimbabwe: Opportunities and challenges. In Handbook of Nature-Based Solutions; Springer: Cham, Switzerland, 2024; pp. 1–22. [Google Scholar] [CrossRef]
- Zimbabwe Vulnerability Assessment Committee (ZimVAC). Food and Nutrition Security Update Report. 2020. Available online: https://fnc.org.zw/wp-content/uploads/2020/03/ZimVAC-2020-Food-and-Nutrition-Security-Update-Report.pdf (accessed on 15 May 2024).
- Tambo, G.; Chabikwa, G.T.; Daga, O.; Dhlomo, J.L. Livestock production system in Ward 12, Tsholotsho District, Zimbabwe: Characterization and potential productivity enhancement. CGIAR Research Program on Livestock Report, 2021. Available online: https://cgspace.cgiar.org/handle/10568/80114 (accessed on 10 June 2024).
- Nhemachena, C.; Mano, R.; Mudombi, S.; Muwanigwa, V. Perceptions on Climate Change and Its Impact on Livelihoods in Hwange District, Zimbabwe. Jàmbá J. Disaster Risk Stud. 2014, 6, 123. [Google Scholar] [CrossRef]
- Nhemachena, C.; Hassan, R.; Chakwizira, J. Analysis of Determinants of Farm-Level Adaptation Measures to Climate Change in Southern Africa. J. Dev. Agric. Econ. 2014, 6, 232–241. [Google Scholar] [CrossRef]
- Arraut, E.M.; Loveridge, A.J.; Valls-Fox, H.; Chamaillé-Jammes, S.; Macdonald, D.W. The 2013–2014 vegetation structure map of Hwange National Park, Zimbabwe, produced using free satellite images and software. Koedoe 2018, 60, 1–10. [Google Scholar] [CrossRef]
- Guerbois, C.; Dufour, A.B.; Mtare, G.; Fritz, H. Insights for integrated conservation from attitudes of people toward protected areas near Hwange National Park, Zimbabwe. Conserv. Biol. 2013, 27, 844–855. [Google Scholar] [CrossRef]
- Ncube, B.; Shekede, M.D.; Gwitira, I.; Dube, T. Spatial modelling the effects of climate change on the distribution of Lantana camara in Southern Zimbabwe. Appl. Geogr. 2020, 117, 102172. [Google Scholar] [CrossRef]
- Salerno, J.; Stevens, F.R.; Gaughan, A.E.; Hilton, T.; Bailey, K.; Bowles, T.; Cassidy, L.; Mupeta-Muyamwa, P.; Biggs, D.; Pricope, N.; et al. Wildlife impacts and changing climate pose compounding threats to human foodsecurity. Curr. Biol. 2021, 31, 5077–5085.e6. [Google Scholar] [CrossRef]
- Chatanga, P.; Kamanda, M.T.; Kundhlande, A.; Imbayarwo-Chikosi, V.E.; Mujawo, T.; Magadza, C.H.; Mujuru, L. Effects of Lantana camara (L.) invasion on the native vegetation of Gonarezhou National Park, Zimbabwe. S. Afr. J. Educ. Sci. Technol. 2018, 3, 32–43. [Google Scholar] [CrossRef]
- Van Wyk, B.; van Wyk, P. Field Guide to Trees of Southern Africa; Penguin Random House South Africa: Cape Town, South Africa, 2013. [Google Scholar]
- Ngarakana, E.; Kativu, S. Soil Based Assessment of the Invasive Species Vernonanthura phosphorica (Vell.) H. Rob. (Asteraceae) in Burma Valley, Zimbabwe. Trans. R. Soc. S. Afr. 2017, 72, 225–232. [Google Scholar] [CrossRef]
- Ganamé, M.; Bayen, P.; Ouédraogo, I.; Dimobe, K.; Thiombiano, A. Woody species composition, diversity and vegetation structure of two protected areas along a climatic gradient in Burkina Faso (West Africa). Folia Geobot. 2019, 54, 163–175. [Google Scholar] [CrossRef]
- Gentili, R.; Ambrosini, R.; Montagnani, C.; Caronni, S.; Citterio, S. Effect of soil pH on the growth, reproductive investment and pollen allergenicity of Ambrosia artemisiifolia L. Front. Plant Sci. 2018, 9, 1335. [Google Scholar] [CrossRef]
- Sato, J.H.; Figueiredo, C.C.; Marchão, R.L.; Madari, B.E.; Benedito, L.E.C.; Busato, J.G.; Souza, D.M. Methods of soil organic carbon determination in Brazilian savannah soils. Sci. Agric. 2014, 71, 302–308. [Google Scholar] [CrossRef]
- Clarke, K.R.; Warwick, R.M. Similarity-based testing for community pattern: the two-way layout with no replication. Mar. Biol. 1994, 118, 167–176. [Google Scholar] [CrossRef]
- Oksanen, J.; Blanchet, F.G.; Friendly, M.; Kindt, R.; Legendre, P.; McGlinn, D.; Minchin, P.R.; O’Hara, R.B.; Simpson, G.L.; Solymos, P.; et al. vegan: Community Ecology Package. R Package Version 2.5-7. 2020. [Google Scholar]
- Chen, Y.; Yuan, Z.; Li, P.; Cao, R.; Jia, H.; Ye, Y. Effects of Environment and Space on Species Turnover of Woody Plants across Multiple Forest Dynamic Plots in East Asia. Front. Plant Sci. 2016, 7, 1533. [Google Scholar] [CrossRef]
- Lepš, J.; Šmilauer, P. Multivariate Analysis of Ecological Data Using CANOCO; Cambridge University Press: Cambridge, UK, 2003. [Google Scholar] [CrossRef]
- Chatanga, P.; Kamanda, M.T.; Kundhlande, A.; Imbayarwo-Chikosi, V.E.; Mujawo, T.; Magadza, C.H.; Mujuru, L. Effects of Lantana camara (L.) Invasion on the Native Vegetation of Gonarezhou National Park,Zimbabwe. South. Afr. J. Educ. Sci. Technol. 2018, 3, 32–43. [Google Scholar] [CrossRef]
- Gooden, B.; French, K.; Turner, P.J.; Downey, P.O. Impact thresholds for Lantana camara L. on native plantcommunities. Biol. Conserv. 2009, 142, 2631–2641. [Google Scholar] [CrossRef]
- Goyal, N.; Esler, K.J.; Sharma, G.P. What drives performance potential of Lantana camara L. (Sensu lato) in the invaded range? Trop. Ecol. 2018, 59, 57–68. [Google Scholar]
- Lone, P.A.; Dar, J.A.; Subashree, K.; Raha, D.; Pandey, P.K.; Ray, T.; Khare, P.K. Invasive Shrub Lantana camara L. Alters the Flora and Soils in Tropical Dry Deciduous Forests of Central India. Biotropica 2022, 54, 1412–1427. [Google Scholar] [CrossRef]
- Ruwanza, S. Effects of Lantana camara Invasion on Vegetation Diversity and Composition in the Vhembe Biosphere Reserve, Limpopo Province of South Africa. Sci. Afr. 2020, 10, e00610. [Google Scholar] [CrossRef]
- Jevon, T.; Shackleton, C.M. Integrating local knowledge and forest surveys to assess Lantana camara impacts on indigenous species recruitment in Mazeppa Bay, South Africa. Hum. Ecol. 2015, 43, 247–254. [Google Scholar] [CrossRef]
- Taylor, S.; Kumar, L.; Reid, N.; Kriticos, D.J. Climate Change and the Potential Distribution of an Invasive Shrub, Lantana camara L. PLoS ONE 2012, 7, e35565. [Google Scholar] [CrossRef] [PubMed]
- Kumar, M.; Verma, A.K.; Garkoti, S.C. Lantana camara and Ageratina adenophora Invasion Alter the Understory Species Composition and Diversity of Chir Pine Forest in Central Himalaya, India. Acta Oecol 2020, 109, 103642. [Google Scholar] [CrossRef]
Figure 1.
NMDS ordination plot showing the relationship between the invasion conditions and native woody species. Abbreviations: Communal invaded (COM_IN), Communal uninvaded (COM_UN), Victoria Falls National Park invaded (VFN_IN) Victoria Falls Park uninvaded, (VFN_UN). Full species names are in Table 2.2.
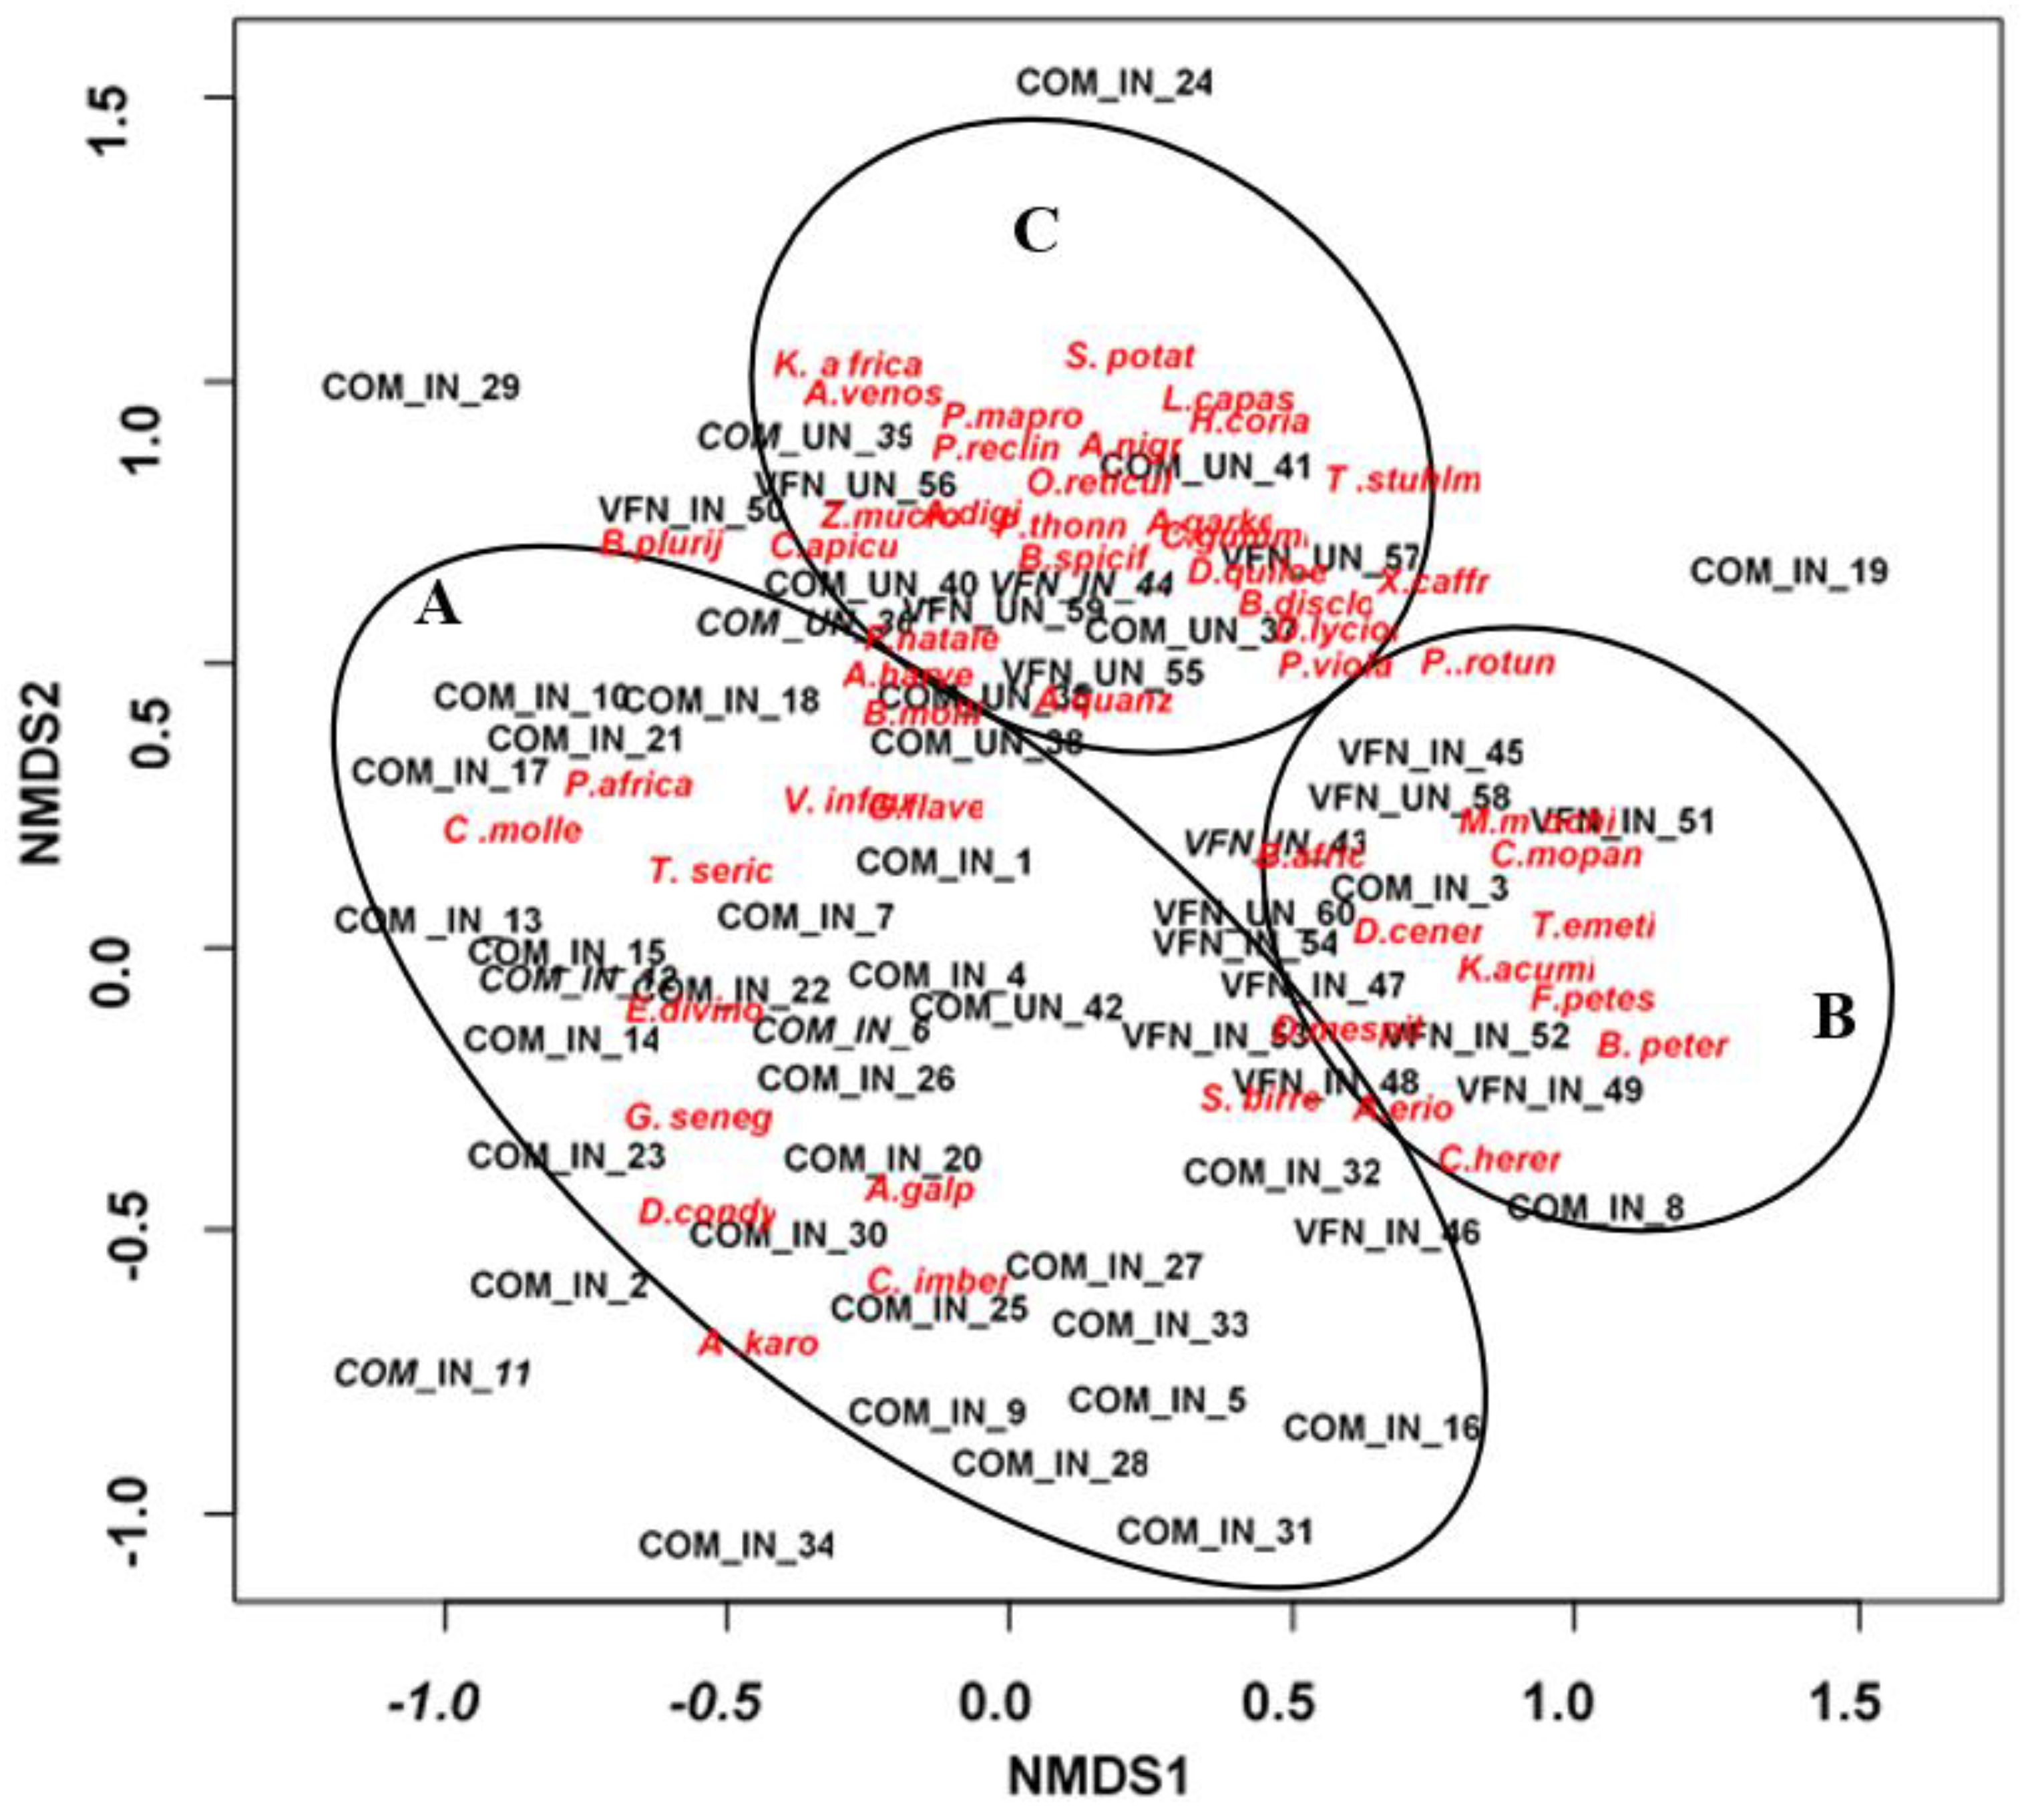
Figure 2.
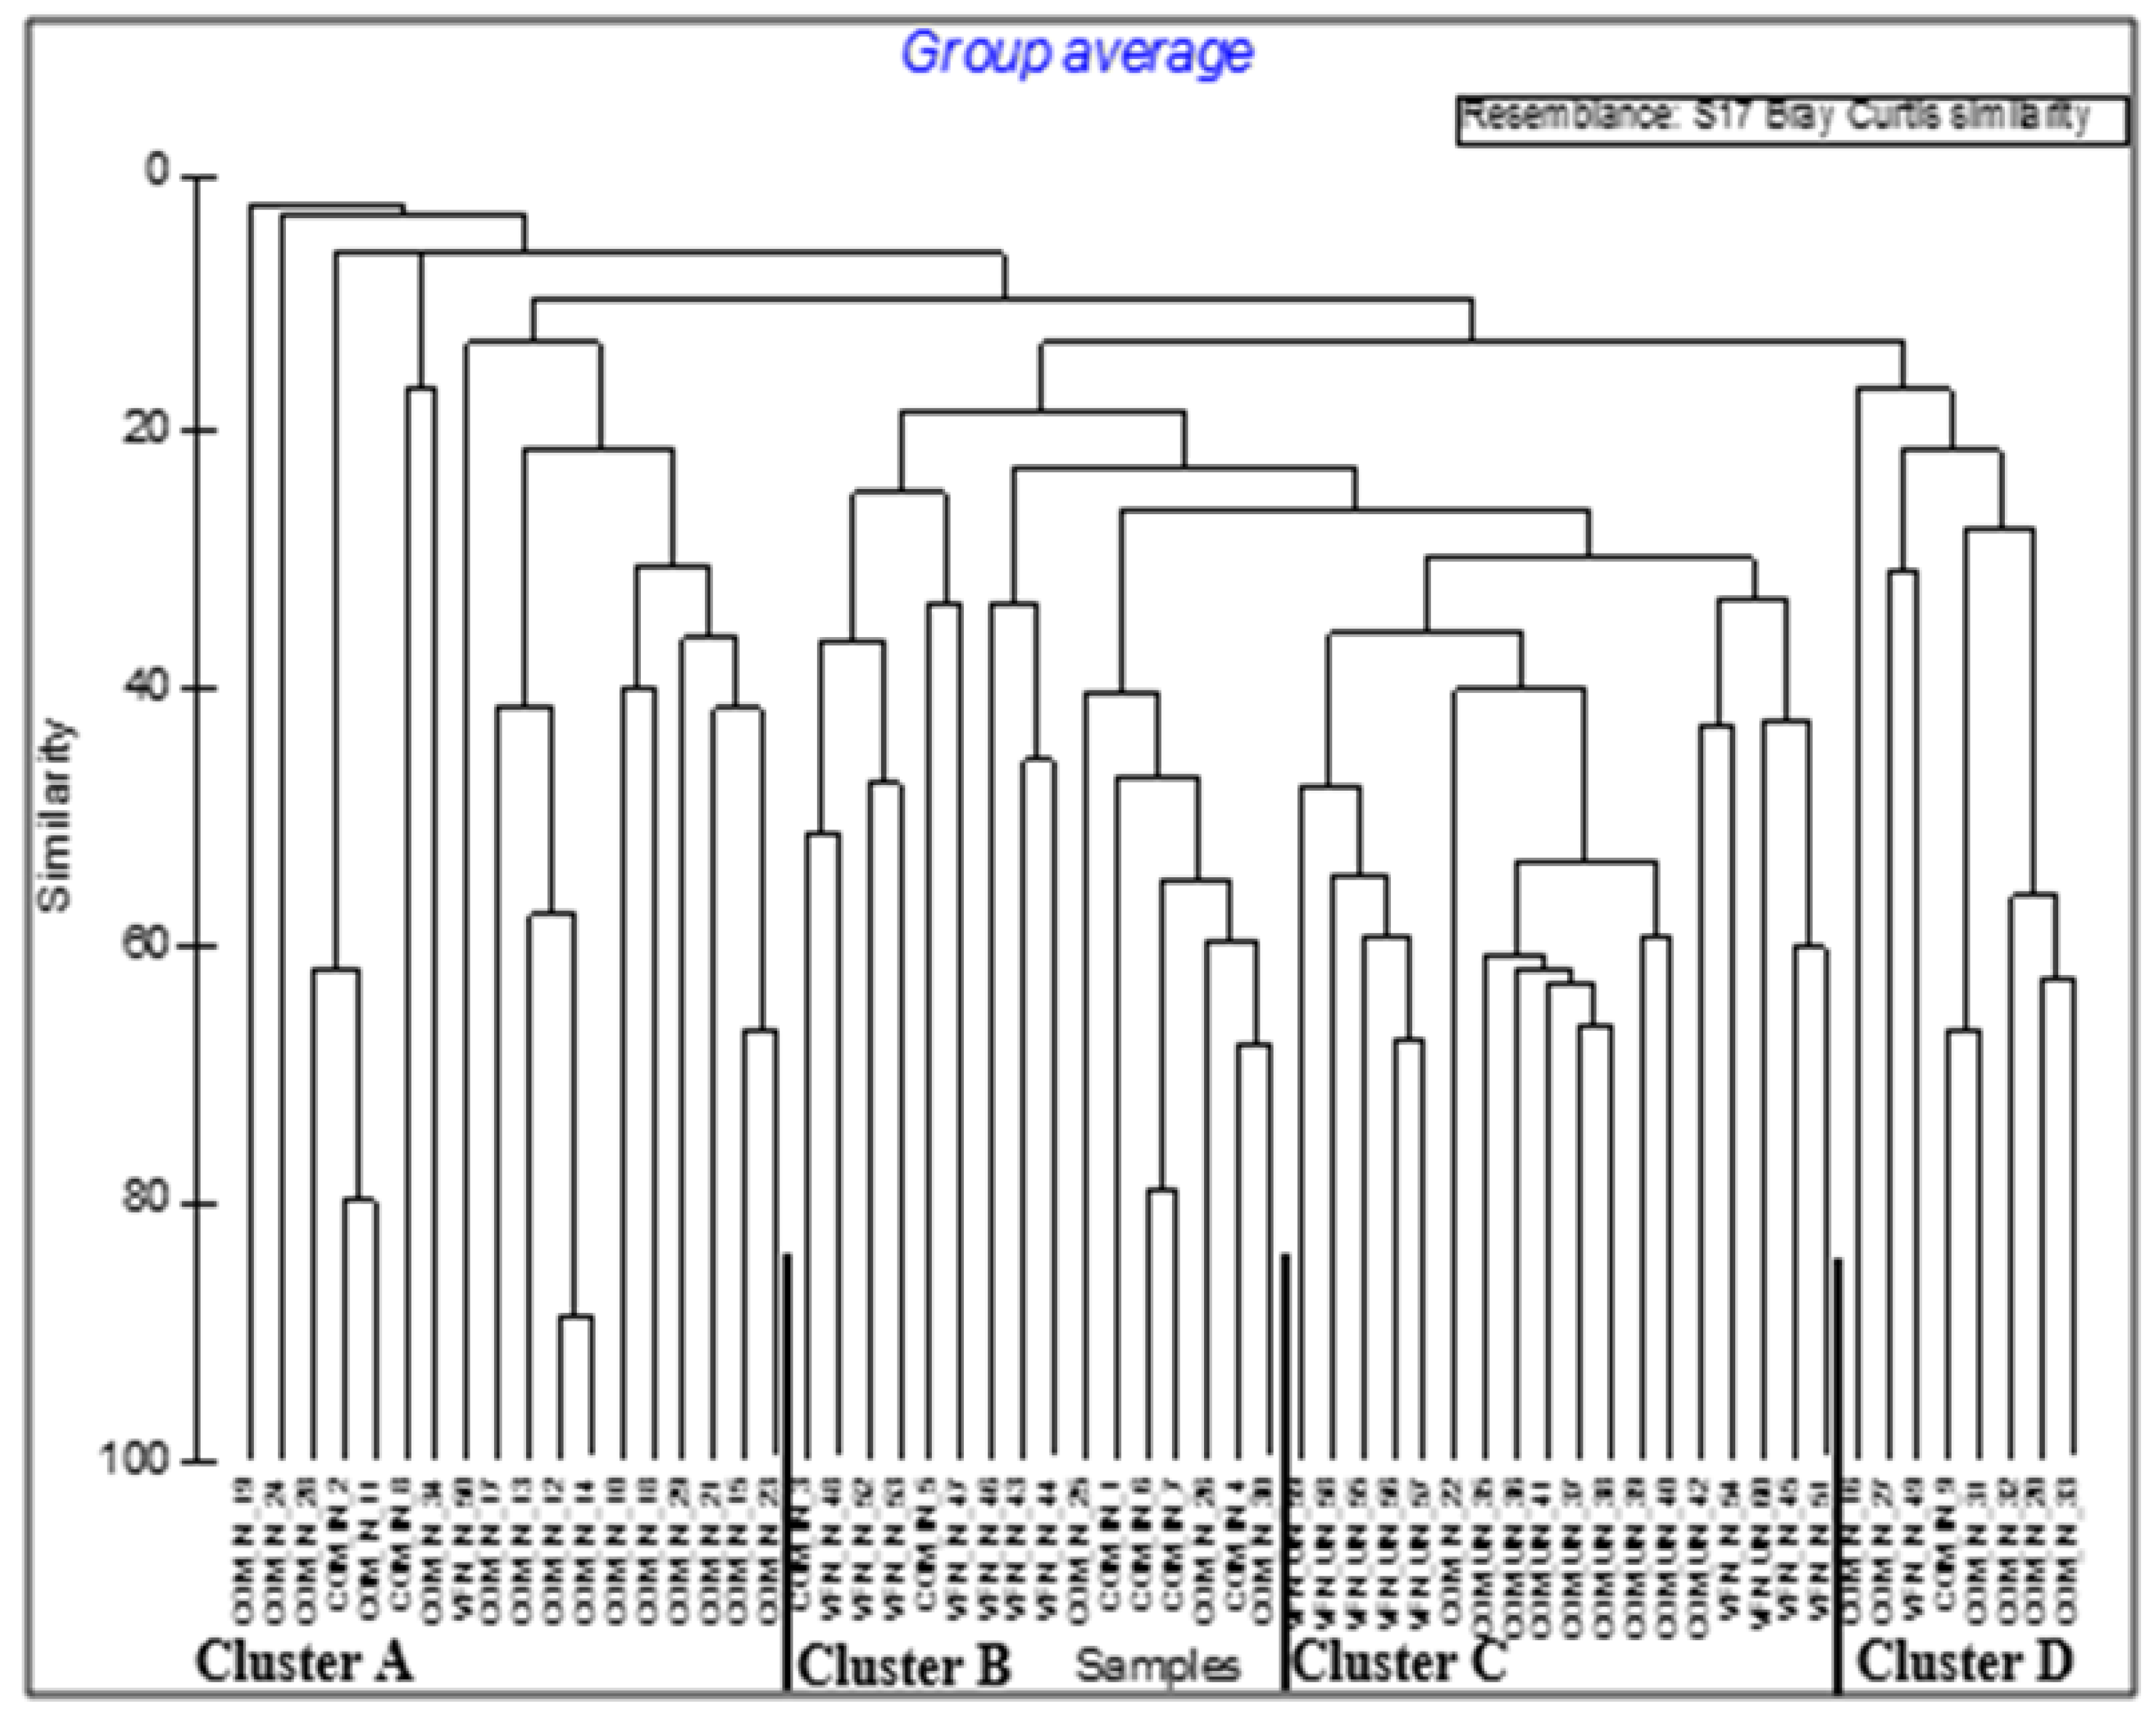
Figure 3.
CCA ordination plot of the relationships between soil variables and native vegetation.
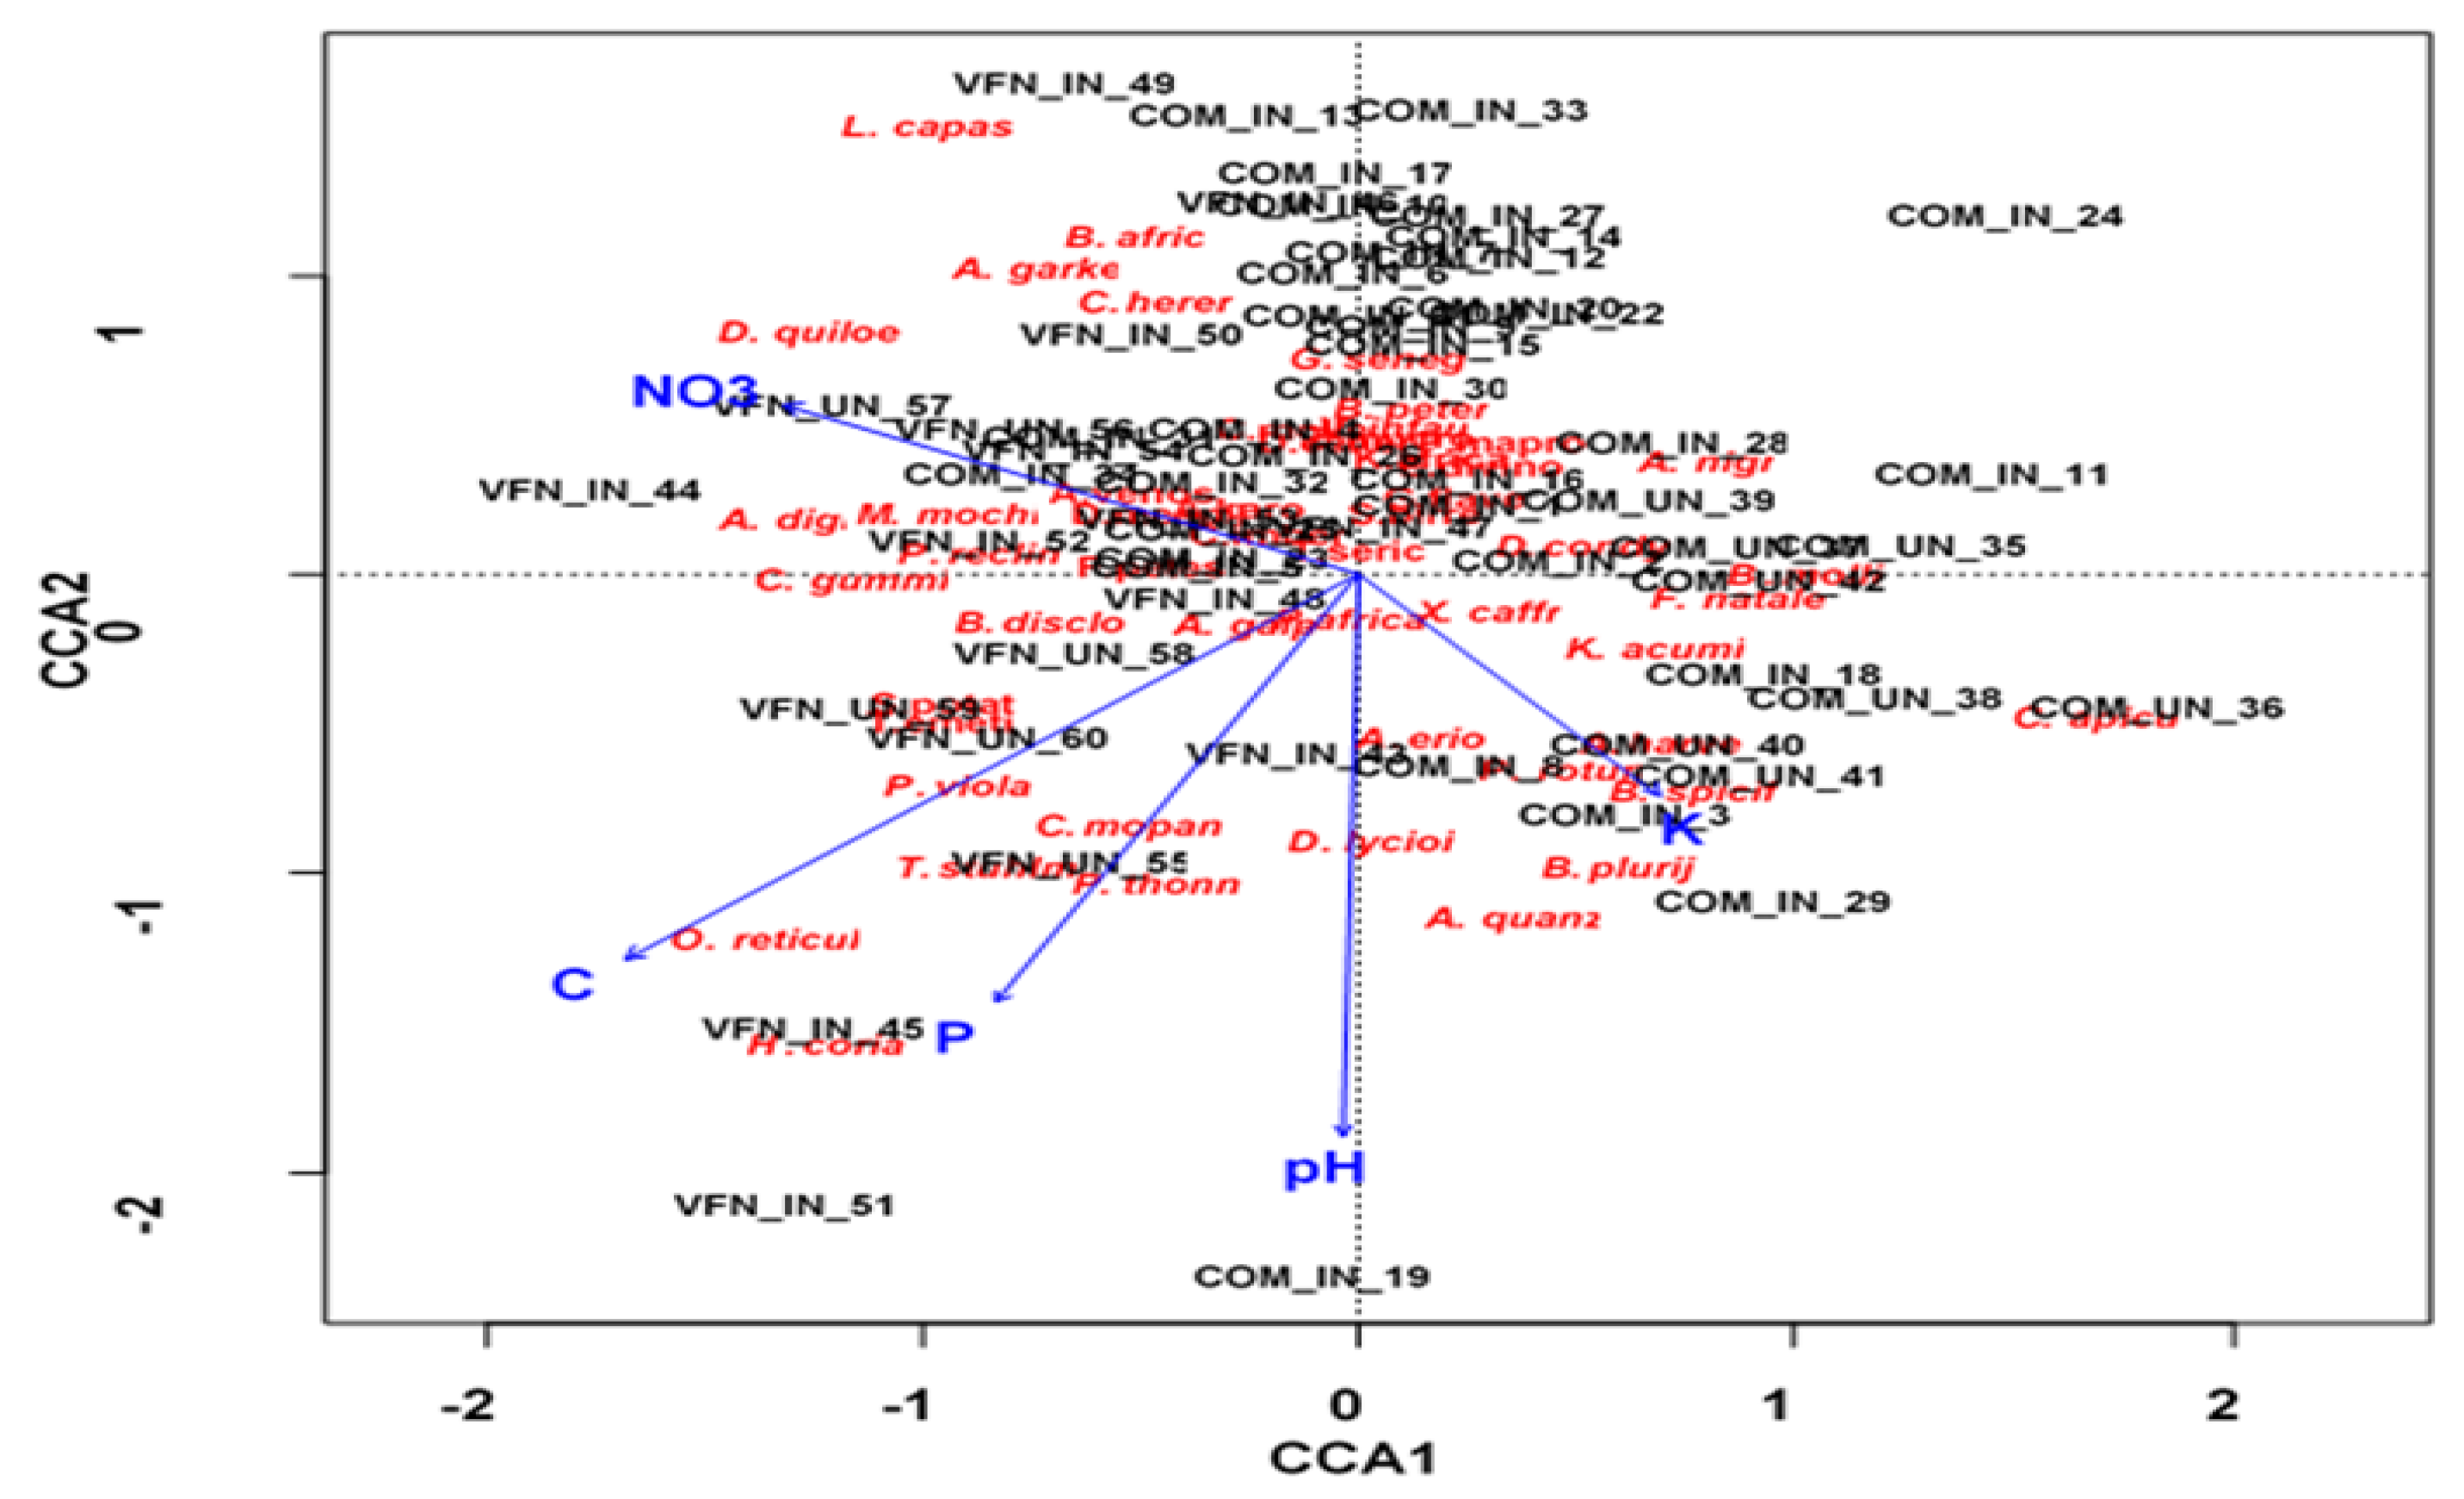

Table 1.
Mean (±SD) stem height, diameter, density and canopy cover for woody species and L. camara in invaded and uninvaded plots in the Communal and Park areas. (Means with different superscripts indicate significant differences between invasions).
Table 1.
Mean (±SD) stem height, diameter, density and canopy cover for woody species and L. camara in invaded and uninvaded plots in the Communal and Park areas. (Means with different superscripts indicate significant differences between invasions).
| Variables | Communal area | Park area | Test Statistic | |||
|---|---|---|---|---|---|---|
| Invaded | Uninvaded | Invaded | Uninvaded | value | p-value | |
| Native Woody Species | ||||||
| Stem height (m) | 5.1±1.6c | 9.5±0.6ab | 8.5±2.0b | 10.7±0.8a | 31.52 | 0.001 |
| Stem diameter (m) | 0.4±0.1b | 0.6±0.02a | 0.7±0.4a | 0.8±0.1a | 24.68 | 0.001 |
| Density/ha | 228±308b | 1 308±432a | 479±284a | 1 561±706a | 18.59 | 0.002 |
| Canopy cover (%) | 6.6±5.9b | 81±14.7a | 9±10.5b | 72.5±9.4a | 7.26 | 0.01 |
| Shannon-Wiener index | 0.4±0.6c | 2.8±0.4a | 1.6±0.5b | 3.2±0.4a | 74.97 | 0.001 |
| Species richness | 5.4±3.3d | 21.3±5.1b | 12.7±4.1c | 33.5±0.3a | 51.02 | 0.001 |
| L. camara | Z-value | p-value | ||||
| Stem height (m) | 2.2±0.8a | N/A | 1.8±0.1b | N/A | 3.4 | 0.001 |
| Stem diameter (m) | 0.04±0.01b | N/A | 0.07±0.10a | N/A | 1.1 | 0.04 |
| Density/ha | 5 542±4 747a | N/A | 747±567b | N/A | 4.5 | 0.001 |
| Canopy (%) | 47.4±27.8a | N/A | 10.3 ±2.0b | N/A | 4.2 | 0.001 |
Table 2.
Fifty species that frequently occur in sites invaded and uninvaded by L. camara. Values show frequencies of occupancy for each species (%).
Table 2.
Fifty species that frequently occur in sites invaded and uninvaded by L. camara. Values show frequencies of occupancy for each species (%).
| Species Name | Communal area | Park area | ||
|---|---|---|---|---|
| Invaded | Uninvaded | Invaded | Uninvaded | |
| Adansonia digitata | 0 | 0 | 9 | 100 |
| Afzelia quanzensis | 3 | 75 | 17 | 83 |
| Albizia harveyi | 12 | 100 | 25 | 100 |
| Antidesma venosum | 0 | 0 | 9 | 50 |
| Azanza garkeana | 0 | 0 | 0 | 50 |
| Baikiaea plurijuga | 3 | 63 | 33 | 33 |
| Bauhinia petersiana | 30 | 100 | 68 | 83 |
| Berchemia discolor | 0 | 0 | 33 | 83 |
| Brachystegia spiciformis | 12 | 75 | 9 | 50 |
| Bridelia mollis | 0 | 0 | 25 | 67 |
| Burkea africana | 6 | 75 | 0 | 0 |
| Colophospermum mopane | 15 | 75 | 50 | 83 |
| Combretum apiculatum | 0 | 63 | 9 | 17 |
| Combretum hereroense | 0 | 0 | 17 | 83 |
| Combretum imberbe | 53 | 88 | 92 | 100 |
| Combretum molle | 44 | 75 | 17 | 33 |
| Corymbia gummifera | 0 | 0 | 0 | 67 |
| Dichrostachys cinerea | 9 | 75 | 50 | 100 |
| Diospyros lycioides | 0 | 0 | 17 | 83 |
| Diospyros mespiliformis | 0 | 0 | 50 | 50 |
| Diospyros quiloensis | 0 | 0 | 42 | 33 |
| Diplorhynchus condylocarpon | 21 | 100 | 17 | 100 |
| Euclea divinorum | 38 | 88 | 33 | 100 |
| Ficus natalensis | 6 | 88 | 17 | 33 |
| Ficus petersii | 0 | 0 | 9 | 50 |
| Grewia flavescens | 24 | 100 | 75 | 100 |
| Gymosporia senegalensis | 9 | 75 | 25 | 50 |
| Hyphaene coriacea | 0 | 0 | 9 | 8 |
| Kigelia africana | 0 | 0 | 9 | 33 |
| Lantana camara | 100 | 0 | 100 | 0 |
| Manilkara mochisia | 0 | 0 | 9 | 50 |
| Ozoroa reticulata | 0 | 0 | 33 | 67 |
| Peltophorum africanum | 0 | 0 | 25 | 83 |
| Philenoptera violacea | 0 | 0 | 17 | 50 |
| Phoenix reclinata | 0 | 0 | 9 | 83 |
| Piliostigma thonningii | 0 | 0 | 9 | 100 |
| Pseudolachnostylis maprouneifolia | 0 | 0 | 17 | 50 |
| Pterocarpus rotundifolius | 3 | 100 | 25 | 33 |
| Sclerocarya birrea subsp. caffra | 18 | 75 | 25 | 33 |
| Senegalia galpinii | 32 | 63 | 33 | 67 |
| Senegalia nigrescens | 12 | 88 | 9 | 17 |
| Strychnos potatorum | 0 | 0 | 0 | 50 |
| Terminalia sericea | 21 | 88 | 67 | 100 |
| Terminalia stuhlmanii | 0 | 0 | 42 | 67 |
| Trichilia emetica | 0 | 0 | 17 | 100 |
| Vachellia erioloba | 15 | 50 | 25 | 83 |
| Vachellia karroo | 12 | 63 | 33 | 67 |
| Vangueria infausta | 24 | 50 | 8 | 100 |
| Ximenia caffra | 0 | 0 | 17 | 33 |
| Ziziphus mucronata | 15 | 88 | 25 | 83 |
Table 3.
ANOSIM results showing the significant difference between sample pairs.
| Groups | Global R: 0.62; p = 0.001 | |
|---|---|---|
| R-Statistic | Significance Level (p-value) | |
| Invaded Communal, Uninvaded Communal | 0.8 | 0.001 |
| Invaded Communal, Invaded Park | 0.4 | 0.002 |
| Invaded Communal, Uninvaded Park | 0.9 | 0.001 |
| Invaded Communal, Invaded Park | 0.7 | 0.001 |
| Uninvaded Communal, Uninvaded Park | 0.5 | 0.001 |
| Invaded Park, Uninvaded Park | 0.6 | 0.002 |
Table 4.
Comparison of soil pH, N, P, K and OC in invaded and uninvaded Communal and Park areas. Data are mean ± SD and ANOVA results are shown.
Table 4.
Comparison of soil pH, N, P, K and OC in invaded and uninvaded Communal and Park areas. Data are mean ± SD and ANOVA results are shown.
| Variable | Communal area | Park area | F-value | p-value | ||
| Invaded | Uninvaded | Invaded | Uninvaded | |||
| pH | 6.8±0.5bc | 7.6±0.6a | 6.1±0.3c | 7.0±0.8ac | 6.3 | 0.001 |
| NO3--N (mg/kg) | 2.3±1.5a | 1.1± 0.7a | 6.7±6.2a | 7.5±13a | 1.4 | 0.3 |
| P (mg/kg) | 3.8±5.6ab | 0.2±0.4b | 10.7±8.8a | 10.5±0.001a | 3.5 | 0.03 |
| K (mg/kg) | 4 040±3 453a | 2 050±1 629a | 1 660±523a | 1 087±554a | 1.8 | 0.2 |
| OC (%) | 1.8± 1.1ab | 0.95±0.93b | 1.9± 0.84ab | 2.9± 0.6a | 2.6 | 0.04 |
Table 5.
Summary statistics of CCA ordination on nutrient variables and woody species vegetation in the Communal and Park sites.
Table 5.
Summary statistics of CCA ordination on nutrient variables and woody species vegetation in the Communal and Park sites.
| CCA properties | CCA1 | CCA2 |
|---|---|---|
| Eigen value | 0.21 | 0.24 |
| Variance explained | 0.21 | 0.24 |
| Cumulative variance | 0.21 | 0.54 |
| Soil variables | F-value | p-value |
| pH | 1.52 | 0.03 |
| NO3- | 1.65 | 0.11 |
| P | 1.53 | 0.01 |
| K | 1.02 | 0.37 |
| C | 1.74 | 0.03 |
Table 6.
Correlation between species diversity, vegetation and soil nutrient variables. The positive and negative values indicate positive and negative correlations respectively. The asterisk (*) represents level of significance (p<0.05 *) and p<0.001**).
Table 6.
Correlation between species diversity, vegetation and soil nutrient variables. The positive and negative values indicate positive and negative correlations respectively. The asterisk (*) represents level of significance (p<0.05 *) and p<0.001**).
| Species diversity/vegetation attributes | pH | NO3- | P | K | OC |
|---|---|---|---|---|---|
| Shannon index | 0.20 | 0.15 | -0.06 | -0.09 | 0.14 |
| Species richness | 0.21 | 0.28 | -0.09 | -0.09 | 0.18 |
| Native woody species density/ha | -0.19 | -0.10 | -0.10 | -0.13 | -0.19 |
| Native woody species height (m) | 0.13 | 0.21 | -0.04 | -0.21 | 0.12 |
| Native woody species diameter (m) | -0.008** | 0.09 | -0.07 | -0.18 | -0.04* |
| Native woody species cover (%) | 0.28 | 0.10 | -0.19 | -0.01 | 0.17 |
| L. camara density/ha | -0.20 | -0.12 | -0.08 | -0.11 | -0.19 |
| L. camara height (m) | -0.27 | -0.11 | 0.15 | 0.043* | -0.17 |
| L. camara canopy (%) | -0.17 | -0.06 | -0.02 | -0.03* | -0.12 |
| L. camara diameter (m) | -0.03 | 0.02 | -0.06 | 0.04 | 0.24 |
Disclaimer/Publisher’s Note: The statements, opinions and data contained in all publications are solely those of the individual author(s) and contributor(s) and not of MDPI and/or the editor(s). MDPI and/or the editor(s) disclaim responsibility for any injury to people or property resulting from any ideas, methods, instructions or products referred to in the content. |
© 2026 by the authors. Licensee MDPI, Basel, Switzerland. This article is an open access article distributed under the terms and conditions of the Creative Commons Attribution (CC BY) license (http://creativecommons.org/licenses/by/4.0/).
Copyright: This open access article is published under a Creative Commons CC BY 4.0 license, which permit the free download, distribution, and reuse, provided that the author and preprint are cited in any reuse.


