
Submitted:
07 January 2026
Posted:
08 January 2026
You are already at the latest version
Abstract
This paper introduces a hybrid framework for assessing the technical feasibility and system readiness of emerging multimodal mobility concepts, with a focus on the Pods4Rail project. The methodology combines qualitative and quantitative approaches to address the inherent uncertainty of early design phases. The qualitative component evaluates Technology Readiness Levels (TRLs) for individual subsystems using expert judgment and visual heat maps, identifying critical challenges in automation, digitalization, and sustainability. The quantitative approach distinguishes between the probabilistic model—representing the uncertainties in TRL and IRL—the problem of propagating these uncertainties to estimate the System Readiness Level (SRL), and the algorithm used to solve this problem, which in this case is Monte Carlo simulation. This framework enables SRL estimation under uncertainty, where explicit quantification of uncertainties is essential for sound decision-making. Results indicate that Pods4Rail project currently falls between SRL 1 and SRL 2, corresponding to concept refinement and technology development stages. While subsystems such as the Transport Unit and Rail Carrier Unit exhibit higher maturity, planning and logistics remain less developed. By combining interpretative insights with statistical rigor, this framework provides a comprehensive readiness assessment and supports informed decision-making for future integration and risk management. The proposed approach is transferable to other innovative mobility systems facing similar challenges in early development stages.
Keywords:
technical feasibility
; system readiness level
; technology readiness level
; integration readiness level
; hybrid framework
; Monte Carlo simulation
; emerging multimodal systems
1. Introduction
Assessing the readiness of complex systems during their conceptual phase is a critical challenge in systems engineering, particularly for emerging multimodal mobility solutions. Traditional evaluation tools, such as the Technology Readiness Level (TRL) scale, have proven useful for measuring the maturity of individual technologies [1]. However, these tools fall short when applied to integrated systems, where readiness depends not only on the maturity of isolated components but also on their ability to interact seamlessly within a dynamic operational environment. As transportation systems evolve toward highly adaptive and interconnected architectures, readiness must be understood as a multidimensional concept encompassing technological maturity, integration capability, and systemic performance.
To address this complexity, the concept of Integration Readiness Level (IRL) has been introduced as a complementary metric to TRL. While TRL focuses on the development stage of individual technologies, IRL evaluates the maturity of their interfaces and the degree to which subsystems can be integrated effectively. IRL provides a structured way to measure compatibility, interoperability, and interface stability, which are essential for achieving system-level functionality. Together, TRL and IRL provide the foundation for estimating the SRL, a holistic indicator that reflects the overall maturity of a system by integrating component-level readiness with integration performance. In this work, SRLs are jointly estimated by accounting for stochastic dependencies and correlations between TRL and IRL, ensuring a more realistic representation of system uncertainty and interrelationships [2,3].
Despite its conceptual advantages, estimating SRL during early design phases remains inherently difficult [4,5]. This difficulty arises from several factors: limited empirical data on subsystem interactions, uncertainty regarding interface compatibility, and the absence of standardized methodologies for integrating TRL and IRL into a unified readiness metric. These limitations hinder effective planning, risk management, and resource allocation, often resulting in delays or cost overruns during later stages of development.
The need for robust and adaptable frameworks for SRL estimation is particularly evident in the context of innovative mobility concepts such as Pods4Rail [6]. This European research initiative aims to develop an autonomous, modular, and multimodal transport system capable of operating across rail, road, and ropeway modes. The complexity of this concept—combining autonomous control, advanced coupling mechanisms, and multimodal logistics—introduces significant integration challenges that cannot be fully addressed through traditional readiness assessment methods. Furthermore, sustainability requirements and digitalization trends add layers of complexity, demanding a comprehensive approach that accounts for technical, operational, and regulatory dimensions.
To address these challenges, this paper proposes a hybrid framework that combines qualitative and quantitative methods for SRL estimation during early development stages. The qualitative component relies on expert judgment and visual heat maps to assess TRL across subsystems, providing interpretative insights into technological maturity. The quantitative approach explicitly distinguishes between the probabilistic model—representing uncertainties in TRL and IRL—the problem of propagating these uncertainties to estimate the SRL, and the algorithm used to solve this problem, which in this case is Monte Carlo simulation. This structure enables SRL estimation under uncertainty, where explicit quantification of uncertainties is essential for sound decision-making. By applying this methodology to the Pods4Rail project, the study aims to deliver a replicable and transferable approach for readiness assessment in complex mobility systems. The framework not only supports informed decision-making but also facilitates risk mitigation and strategic planning, ensuring that technological innovation aligns with operational feasibility and long-term sustainability.
1.1. State of the Art
Assessing the System Readiness Level (SRL) is inherently challenging because it requires the integration of technical, operational, and safety dimensions into a single metric while accounting for subsystem interdependencies and uncertainty. Unlike the Technology Readiness Level (TRL), which focuses exclusively on individual components, SRL must capture the complexity of integration and the variability of future system performance. These factors, combined with subjective expert judgment and the absence of standardized benchmarks, make SRL evaluation particularly difficult.
Considering these challenges and based on the analysis of existing literature, studies suggest that when only component-level technological maturity is known and detailed information on subsystem interrelationships is lacking, a composite measure of system maturity can be achieved by supplementing component scores with integration estimates. Building on these findings, this paper structures the review of current methodologies for SRL estimation through a taxonomy comprising five complementary categories. These categories reflect the main methodological perspectives identified in the literature and illustrate the diverse strategies employed by researchers to address integration challenges, manage uncertainty, and evaluate readiness in complex systems.
The proposed taxonomy is based on two guiding principles: (i) the nature of the method—whether it is primarily quantitative, qualitative, or hybrid; and (ii) the analytical focus—whether the approach emphasizes technology maturity, system integration, or stakeholder involvement. This classification enables a structured comparison of heterogeneous studies and highlights their individual contributions to SRL estimation. The state-of-the-art analysis considers the following categories:
- Quantitative Evaluation Tools: Include methods that introduce mathematical or computational formalisms (e.g., probabilistic models, algebraic formulations, or Multi-Criteria-Decision-Methods) to obtain numerical values as their core contribution. These approaches distinguish themselves from other categories by prioritizing formal quantification and automation over procedural guidance.
- TRL/SRL Hybrid Approaches: Comprise frameworks distinguished by their explicit combination of Technology Readiness Level (TRL), Integration Readiness (IRL), and, in some cases, Manufacturing Readiness Level (MRL) into a unified SRL scale. They concentrate on establishing mathematical relationships between component-level maturity and integration maturity.
- Readiness Assessment Models: These models offer structured frameworks or toolkits for assessing maturity across technological, programmatic, or organizational domains. Unlike the previous categories, they prioritize process-oriented guidance and decision-making support over formal mathematical modelling.
- System Integration Frameworks: Concentrate on the architectural and interface dimensions of system development. What differentiates this category is its focus on integration readiness rather than evaluating the maturity of each technology in isolation.
- Stakeholder-Centered Methods: Place stakeholder participation at the core of the readiness assessment process. They rely on co-design activities, expert consultation, and value-based weighting to ensure that diverse perspectives are fully represented.
This classification serves not only to enable systematic comparison across diverse SRL estimation approaches but also highlights emerging directions in current research. Table 1 presents the five categories structured according to the two guiding principles previously described:
Table 2 summarizes the state-of-the-art analysis, which considers the presented taxonomy. This table includes the main references, a brief explanation of why they are considered relevant and its content.
Across the reviewed literature, a variety of methodological strategies have been defined to estimate SRL under conditions of partial knowledge and lack of data.
Mathematical and computational models—such as matrix algebra [2,19], tropical algebra [12], and scalar contraction [16]— represent early attempts to combine TRL and IRL (in some studies MRL was also considered) into a composite System Readiness Level. While these approaches provide numerical outcomes, their limitations reside in their need of at least some estimation of integration readiness, which is often unavailable in early design phases.
Probabilistic approaches, including Monte Carlo simulation [3] and Bayesian inference [8] aim to address these limitations by assigning statistical distributions to main variables as TRL and IRL. These methods can accommodate uncertainty and lack of precise interrelationship data but still require assumptions or expert input about possible integration scenarios. These methods explicitly model uncertainty in component relationships, providing confidence intervals or distributions for SRL.
Graphical and Architecture-Based Models, such as Petri nets [7] or architecture views like Design Structure Matrix and Design Maturity Matrix [35], focus on modelling system interactions, allowing for dynamic or iterative refinement as more information becomes available, and demonstrate that mapping of interconnections benefits from any notional system architecture.
Other studies rely on maturity gates [27], checklists [27], or staged criteria to assess readiness. These can be applied with limited information, but their minimal granularity or specificity may lead to overlooking emergent system-level behaviors.
In terms of application domains, most SRL-related studies have developed in sectors characterized by high system complexity – aerospace, defense, and energy – while emerging contributions have extended the concept to manufacturing, construction and general public sectors.
Similarly, the aerospace and aviation domains have seen extensive application of SRL frameworks such as [2,7,8,9,10,12,16,19,35].
In the energy sector – including nuclear, fusion and hydrogen system – recent studies such as [7,30,36,37,38,39,40] highlight the growing relevance of readiness assessment for sustainable technologies.
Further applications can be found in manufacturing and industrial engineering, for instance: [14,24,25,26,28,41,42].
Within Intelligent Transportation Systems (ITS) and automotive contexts, [18] presents an SRL-based model for highway ITS projects and analyses their spatiotemporal characteristics, such as distributed computing, uneven information and communication technologies (ICT) development, and existing infrastructure limitations. The study highlights the importance of economic factors in ITS planning and enhances the SRL model with value engineering.
Additionally, [43] presents the case study of the application of the 12 Principles of Green Engineering, currently in TRL 1–3, to an energy-harvesting platform in the early technology development phase.
When comparing the different approaches, mathematical and probabilistic methods – such as matrix algebra, probabilistic simulation, and automated validation metrics – provide numerical SRL outputs, often with sensitivity or uncertainty analysis. While these methods provide quantitative precision, their reliability depends strongly on input data and expert assumptions.
Conversely, qualitative methods such as maturity gates, checklists, expert panels, and multi-attribute decision-making (e.g., analytic hierarchy process (AHP), technique for order of preference by similarity to ideal solution (TOPSIS)) offer flexibility when quantitative data is missing but often lack precision or specificity.
Finally, hybrid frameworks combine quantitative scoring with qualitative expert input or stakeholder engagement (e.g., Systematic SME Technology Readiness Assessment, Integration System Readiness Level Matrix, Technology Performance Level), thus enabling more comprehensive readiness evaluation.
In summary, significant progress has been made in formalizing SRL estimation through quantitative, qualitative and hybrid approaches that integrate technology maturity, system integration and stakeholder involvement. However, a universally accepted methodology remains elusive for early design stages, particularly when only component TRLs are available and system-level interdependencies are not yet defined. This persistent gap underscores the necessity for a structured, hybrid framework that can effectively address uncertainty, guide integration assumptions, and facilitate decision-making in the initial phases of system development. The framework introduced in this study is designed to meet precisely these needs.
1.2. Objective of the Paper
Practitioner surveys indicate that system complexity represents the most critical challenge, with integration, interface management, and overall system maturity ranking as top concerns [1]. Furthermore, [4] highlight the lack of guidance regarding assessment scope, incremental improvements, and alignment with technology roadmaps as persistent obstacles. [44] emphasize the importance of clear definitions and the mapping of maturity and readiness concepts to the system development lifecycle, noting that inadequate understanding of these relationships often leads to unforeseen implementation issues.
Consequently, evaluating SRL during early design stages requires a multidisciplinary approach that integrates model-based systems engineering (MBSE) tools [45], advanced simulation of subsystem interactions [46], expert judgment [20], risk management strategies [5], and progressive validation techniques [47]. Until the system advances to later phases—where integration tests, prototype demonstrations, and verification under realistic conditions become feasible—SRL remains primarily a qualitative indicator of potential readiness rather than a precise quantitative measure.
Overall, early-phase evaluation of a new vehicular system concept is inherently challenging due to limited empirical validation of subsystem integration, reliance on assumptions regarding interfaces and interoperability, the non-linear relationship between TRL and SRL, and the absence of standardized assessment procedures.
To address these challenges, this paper introduces a structured framework for SRL estimation during early design phases characterized by high uncertainty. The proposed approach adopts a hybrid methodology that combines qualitative and quantitative assessments to evaluate system readiness. Its primary objective is to provide a practical tool for estimating SRL, thereby enabling informed planning and effective risk management throughout subsequent stages of the system lifecycle.
Then, this paper advances the state of the art in system readiness assessment by introducing a structured hybrid framework that explicitly addresses uncertainty during early design phases of complex multimodal mobility systems. Unlike traditional TRL-based evaluations or existing SRL approaches that often rely on deterministic scoring or incomplete integration assumptions, our methodology combines qualitative expert-driven TRL assessment with a quantitative probabilistic model that distinguishes between three key elements: the model representing uncertainties in TRL and IRL, the problem of propagating these uncertainties to estimate SRL, and the algorithm used to solve this problem—Monte Carlo simulation. This distinction ensures methodological transparency and rigor, enabling the generation of SRL distributions rather than single-point estimates. Furthermore, the framework incorporates stochastic dependencies and correlations between TRL and IRL, providing a more realistic representation of system-level uncertainty. By applying this approach to the Pods4Rail project, the study demonstrates its applicability to emerging mobility concepts characterized by high complexity and limited empirical data, offering a replicable and transferable tool for informed decision-making, risk mitigation, and strategic planning—capabilities that existing methods rarely achieve in early development stages.
1.3. The Pods4Rail Project
Pods4Rail [6] is a European research project supported by the EU-Rail Joint Undertaking that explores new concepts of intermodal rail-bound autonomous system and its autonomous transshipment to road and ropeway modes. Its design is intended to be coupled capsules/Pods (Transport Units) with an autonomous electric-propulsed underframe (Rail Carrier Unit) that is primarily designed for rail mode but can be operated in other modes (Figure 1). It is meant to serve passenger, freight, and combined transport needs using mainly already installed infrastructure. The on-development design includes a pod coordination and mobility management system for operations and logistics, as well as all aspects of on-demand mobility across multiple modes [48].
This represents a completely new mobility concept and will constitute the main subject for the application of the proposed framework for system-readiness calculation.
1.4. Paper’s Organization
The remainder of this paper is organized into five main sections. Section 2, Materials and Methods, introduces the essential definitions of Technology Readiness Level (TRL), Integration Readiness Level (IRL), and System Readiness Level (SRL). It then describes the hybrid methodology adopted in this study, which combines qualitative and quantitative approaches. This section explains the system breakdown structure, the procedure for TRL assessment using expert judgment and heat maps, and the probabilistic approach for SRL estimation through Monte Carlo simulation.
Section 3, Results, summarizes findings from qualitative and quantitative analyses, including TRL heat maps for key subsystems, descriptive statistics for individual SRLs and the Composite SRL (CSRL), confidence interval analysis, correlation matrices, and assessment of how subsystem interrelationships affect overall readiness.
Section 4, Discussion, interprets these results in the broader context of system readiness assessment. It emphasizes the role of integration readiness and uncertainty management, discusses the implications for system engineering practice, and identifies critical areas for improvement in Pods4Rail. This section also outlines recommendations for future research and methodological refinements.
Finally, Section 5, Conclusions, summarizes the main contributions of the study. It highlights the effectiveness of the proposed hybrid framework for early-phase SRL estimation, its applicability to complex multimodal mobility systems, and its potential to support informed decision-making and risk management.
2. Materials and Methods
2.1. Definitions
To facilitate understanding and maintain consistency, the essential definitions are presented:
Technology Readiness Level (TRL): A nine-level scale that measures the maturity of individual technologies, ranging from basic principles observed (TRL 1) to proven systems in operational environments (TRL 9). While widely used, TRL does not account for integration challenges or system-level performance. The scale for the different TRLs is included in Appendix A.
Integration Readiness Level (IRL): A complementary metric that evaluates the maturity of interfaces between technologies or subsystems. IRL measures compatibility, interoperability, and interface stability, which are critical for achieving system-level functionality. Levels range from conceptual understanding of integration (IRL 1) to proven integration in operational environments (IRL 9) [5,49,50]. These levels and their corresponding descriptions are included in Appendix B.
System Readiness Level (SRL): A holistic indicator that combines TRL and IRL to assess overall system maturity. SRL reflects not only component readiness but also integration performance and operational feasibility. In this study, SRL is expressed on a five-level scale (1–5), corresponding to stages from concept refinement to operations and support [5,49,50]. The mentioned scale can be found in Appendix C.
2.2. General Methodology
Among the methodologies reviewed in the state-of-the-art analysis, several serve as the foundation for the approach proposed in this paper. As discussed, the framework combines both qualitative and quantitative methods to provide a comprehensive assessment of system readiness.
For the qualitative component, the approach draws on the taxonomy category of Readiness Assessment Models identified in the literature, particularly those described by [21,25,26,30,31]. These models rely on expert judgment, checklists, document reviews, and consensus-based evaluations. In this study, TRLs were assigned using external references and the collective insights of project experts gathered during periodic meetings. Further details of this assignment process are provided in Section 2.3. No formal method such as Delphi was used.
This approach is considered appropriate for several reasons. Expert judgment is widely recognized in the literature as a reliable mean of assessing readiness, particularly during the early conceptual stages of system development when empirical data are scarce. Additionally, documenting the discussions and rationale behind each TRL assignment enhances transparency and ensures that the process can be reviewed or replicated. Finally, combining this qualitative assessment with quantitative methods results in a more complete and evidence-based evaluation.
For the quantitative component, this study follows the methodology described by [3]. This approach, classified under the taxonomy category of TRL/SRL Hybrid Approaches, integrates component-level TRLs with IRLs to estimate overall system readiness. By incorporating both technological maturity and integration performance, this method provides a holistic perspective on system development.
The following sections present a detailed description of the qualitative and quantitative methods employed in this study, including the procedures, criteria, and tools used for system readiness assessment.
2.3. Methodology for Qualitative Analysis
As outlined in the General Methodology section, Technology Readiness Levels (TRLs) were assigned based on both external references and the collective expertise of the project team. To provide a clearer context for this assessment, it is essential to define the system and its components prior to evaluation.
A structured breakdown of the Pods4Rail vehicle was developed to decompose the overall system into subsystems and components. This hierarchical structure was derived from the project’s Functional Requirements Specification (FRS), which establishes the functional and performance expectations for the system. The FRS [51] was produced in an earlier work package dedicated to defining the initial set of requirements for the Pods4Rail concept.
For the purpose of evaluating the readiness metrics described in this study, the conceptual design of the Pods4Rail vehicle was divided into seven primary subsystems. Each subsystem was further disaggregated into its constituent components to enable a detailed analysis of technological maturity. The complete breakdown structure is illustrated in Figure 2.
This structure serves as the basis for evaluating the TRL of the seven core subsystems in the Pods4Rail concept: 1 Planning and Operation System; 2 Logistics, Storage, Ticketing and Booking; 3 Passenger Information System (PIS) and Incident Management; 4 Handling System; 5 Transport Unit; 6 Rail Carrier Unit and 7 Coupling System.
Once these subjects had been defined, the TRL assessment was carried out by evaluating them against specific criteria. These criteria are derived from FRS. The FRS consolidates the high-level operational requirements for the Pods4Rail system and therefore serves as the reference framework for determining the TRL of each subsystem.
These evaluation criteria represent concrete, measurable aspects of the subsystems and their components, allowing their level of technological readiness to be assessed. The criteria were derived from the requirements most relevant to maturity evaluation, ensuring a focused and coherent TRL assessment.
Each criterion is linked to a specific functional requirement and is used to evaluate an individual component through its associated technology, whose development level can be measured. For example, within the Rail Carrier Unit subsystem and its Brake component, one of the established criteria was: “The braking system shall contemplate components related to the active safety of the vehicle (e.g., Wheel Slide Protection)”. In this case, the technology associated with meeting this criterion is WSP (Wheel Slide Protection) or similar solutions. Since these technologies are already well established and widely used, a TRL of 7 was assigned to this specific criterion–component–subsystem chain.
Each component could be evaluated against multiple criteria. Because TRL values were assigned during periodic expert meetings, some degree of uncertainty was inevitable. To capture this variability, the minimum and maximum TRL values for each component were identified, providing a concise representation of its maturity. This hierarchical approach—from system to subsystem, component, and associated technologies—offers a clear and structured view of overall technological readiness (Figure 3).
To facilitate interpretation, heat maps were created for each subsystem to display TRL assignments and related analyses. These visualizations highlight components with the highest and lowest technological readiness and link the number of evaluation criteria to their TRL values. This approach enables the calculation of absolute and relative frequencies, providing a clear overview of maturity levels across the Pods4Rail system.
The described methodology has been applied in one of the work packages of the Pods4Rail project [52]. Accordingly, only the analysis and results of one of the most representative subsystems are presented here. For this paper, the Rail Carrier Unit subsystem was selected, as it represents one of the core subsystems of the Pods4Rail concept, given that the system is designed to operate through the coupling of pods with an autonomous underframe.
Table 3 shows the results of the TRL assignment process for the Rail Carrier Unit subsystem components. As an example, the Vehicle Linkage Devices component was evaluated against 5 requirements derived from the FRS (“Number of criteria” column). According to the table below, the 5 associated technologies or functionalities fall within a TRL range of 3 to 4, indicating that further development is required, as the component remains at the Observation of Basic Principles stage. It is important to note that components included in the breakdown structure but not listed in this table were excluded because no assessment criteria were identified for them, and therefore no TRL evaluation could be performed. This clarification applies to all components and subsystems considered in this study.
A broader interpretation of these findings can also be drawn from the corresponding heat map. This evaluation process was applied to all subsystems and their respective components.
Figure 4 presents the heat map for the Rail Carrier Unit, showing the distribution of TRL levels (1–9) across its components and the number of criteria used for each evaluation. The color scale indicates the development stage of the associated technologies, supporting the assessment of the project’s technical feasibility. Absolute and relative frequencies are also included, which are essential for the subsequent quantitative analysis
By combining hierarchical evaluation with visual representations, the methodology delivers a comprehensive view of the Pods4Rail concept’s technological maturity. It enables detailed assessment of individual subsystems, components, and associated technologies, while supporting a robust evaluation of the system’s overall technical feasibility.
2.4. Methodology for Quantitative Analysis
Once the main subsystems and components were identified, TRL and IRL values were assigned based on expert judgment and external references, following the procedure described in the General Methodology section. Although structured approaches such as the Delphi method can reduce uncertainty, they cannot eliminate it entirely, and some variability remains inherent in human assessments. To address this subjectivity and the uncertainty regarding component contributions and integration effects, a statistical approach was adopted. Following [3], Monte Carlo has been applied to solve the propagation of uncertainties (from TRL and IRL to SRL) problem, thereby mitigating the risks associated with prescriptive metrics in early-phase evaluations.
In this context, the calculation of the SRL for the Pods4Rail system follows these main steps:
- Construction of TRL Scaled Matrix (TRLSc): TRL levels for each subsystem are identified and linked to their frequencies, which are interpreted as probabilities based on the qualitative heat map analysis. These probabilities serve as input for the Monte Carlo simulation. Using these probability inputs, the TRL Scaled matrix is subsequently constructed for it to be employed in further matrix-based operations.
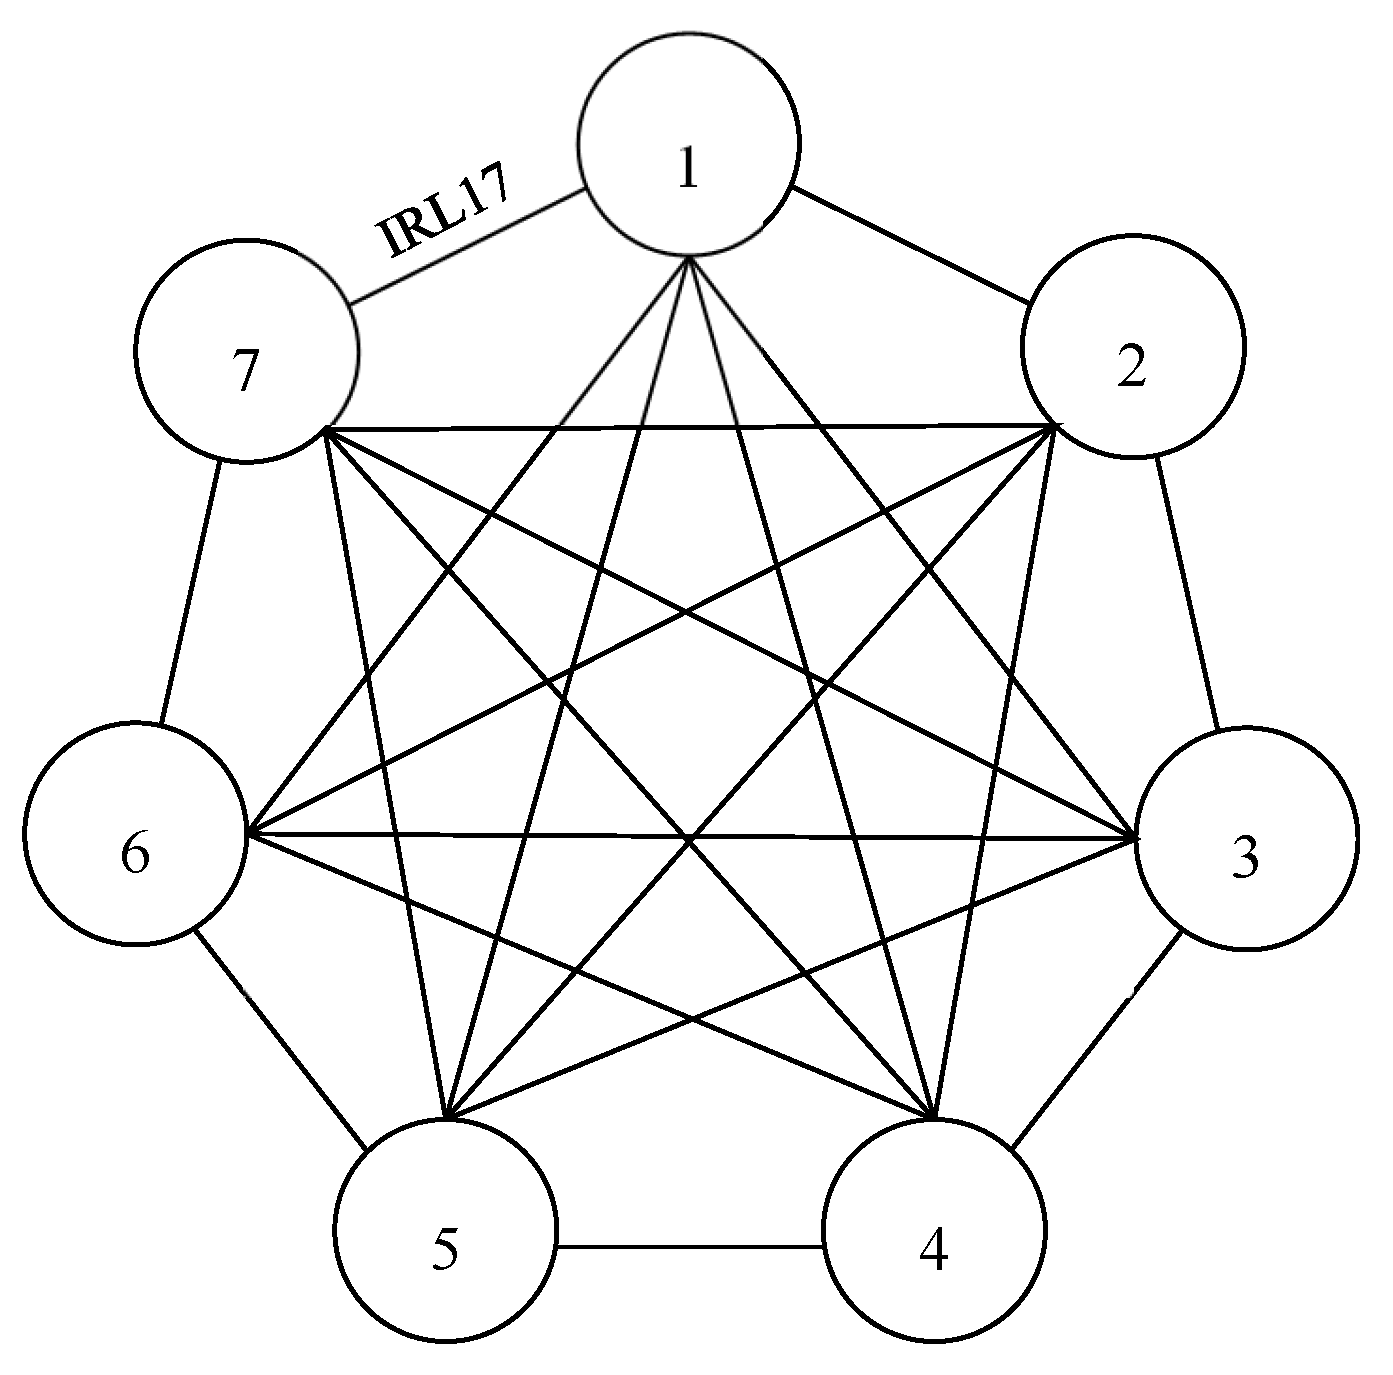
- Construction of IRL Probability Matrix () and IRL Scaled Matrix (between subsystems i and j : Relationships among the seven subsystems are defined under the assumption of full interaction. Figure 5 illustrates these connections, and IRL probabilities are assigned according to integration assumptions.
- Construction of SRL Scaled Matrixand determination of CSRL: Using the approach proposed in [3], SRL values are computed for each subsystem through matrix-based operations, being SRLs linear combinations of products of TRLs and IRLs. The Composite SRL (CSRL) is then obtained as the arithmetic mean of individual subsystem SRL values. CSRL provides an overall measure of system maturity.
Figure 5.
Estimated relationships between the seven Pods4Rail subsystems.
2.4.1. Construction of TRL Scaled Matrix TRLSc
The Monte Carlo method relies on repeated random sampling (N iterations) to address uncertainty propagation, such as variability in TRL and IRL assignments. This approach enables the estimation of system behavior and the derivation of probability distributions, requiring predefined distributions for all uncertain variables. The first step involves constructing a TRL Scaled Matrix for the seven subsystems. To this end, probability distributions for the TRL levels of each subsystem are required.
Relative frequencies from the qualitative assessment (Figure 4) are interpreted as probabilities associated with each TRL level, representing the likelihood of subsystem maturity. These probabilities form the basis for the simulation. Table 4 summarizes the TRL probability values derived from the Pods4Rail project outcomes [52], where the probabilities add up to 1 in each row.
During the Monte Carlo simulation, TRL values for each subsystem are sampled from their respective probability distributions. For each of the N iterations, the algorithm randomly selects TRL levels from 1 to 9, weighted according to the subsystem’s probability distribution (which must sum to 1). This process generates a set of seven TRL values per sample, capturing variability and uncertainty inherent in expert-based assessments. Unlike deterministic approaches, this method leverages probability distributions to represent maturity levels realistically. Once sampled, TRL values are linearly scaled to the [0, 1] range, ensuring TRL 1 corresponds to 0 and TRL 9 to 1, thereby standardizing values for subsequent matrix operations. The scaling function is defined as in (1):
After generating N samples and applying the scaling, the resulting TRLSc matrix (Sc subindex denotes the scaled matrix) is structured as indicated in (2):
where TRLSc is a matrix, with 7 representing the number of subsystems and N the number of samples, and denotes the scaled TRL value of subsystem k in sample l.
This scaled matrix constitutes the input for the subsequent matrix-based calculations that combine TRL and IRL information to compute the SRL of each subsystem and, ultimately, the composite SRL (CSRL) of the overall system.
2.4.2. Construction of IRL Probability Matrix (IRLP) and IRL Scaled Matrix (IRLSc)
Integration Readiness Level (IRL) values are generated to characterize subsystem interactions using a procedure similar to matrix construction. Unlike TRL, which spans nine levels, IRL values in this study are restricted to levels 4, 5, and 6, reflecting the transition from Conceptual understanding of integration (IRL 4) to Implementation and testing in controlled or relevant environments (IRL 6) [5]. This range aligns with the current maturity of Pods4Rail, where integration efforts are moving toward realistic testing.
Probabilities for IRL assignments are summarized in Table 5. For self-interactions, IRL 6 is given the highest probability (0.8), as subsystems are inherently integrated with themselves. For interactions between different subsystems, IRL 5 receives the highest probability (0.5), while IRL 4 and IRL 6 are each assigned 0.25. This ensures balanced distributions that sum to 1 and provide a coherent representation of integration readiness. Note that self-interactions will later be recoded as IRL 9 to reflect full integration status.
Once the IRL values and their corresponding probabilities are defined, the full IRL Probability Matrix () can be constructed. This is a three-dimensional matrix of size , where rows correspond to subsystem , columns to subsystem , and the third dimension represents the probability of IRL being equal to 4, 5, and 6 for each subsystem pair (three layers corresponding to the three restricted IRL values).
Each element of the matrix, is a vector that describes the likelihood of each IRL level between a pair of subsystems. This structure ensures that the readiness assessment reflects both the current development stage and the practical feasibility of subsystem integration.
Mathematically, the three-dimensional matrix can be represented as (3):
As an example, the second layer corresponding to probabilities of IRL 5 () can be expressed as the following two-dimensional matrix (4). Each row and column represents a subsystem, and each element indicates the probability that the interaction between subsystems and reaches IRL level 5. The other layers (IRL 4 and IRL 6) are structured in a similar way. The three probabilities for each i, j pair also add up to 1.
Once is defined and constructed, the next step is to generate the IRL Scaled Matrix denoted as . Similar to the matrix, the values in are scaled to be in the range of 0 to 1 using the same scaling function as in (1).
The following conditions are applied when constructing : (Condition A) the probabilities used for the construction are stored in matrix, (Condition B) the matrix is symmetric where and (Condition C) the scaled IRL values for self-interactions (diagonal elements) are set to one.
Considering these requirements, a three-dimensional IRL matrix of size is generated composed by bi-dimensional matrices of size for each of the N samples, with random numbers in the [0, 1] range. These random IRL values are generated by sampling from the probability distributions defined in , ensuring that each layer reflects the assigned likelihoods rather than arbitrary randomness. Each layer of the resulting three-dimensional matrix is a symmetric and diagonal elements are equal to 1. In the final structure, rows correspond to subsystem , columns to subsystem , and the third dimension corresponds to the sample index.
Mathematically, the resulting matrix can be expressed as:
where represents the scaled IRL value between subsystems and in the -th sample.
2.4.3. Construction of SRL Scaled Matrix (SRLSc) and Determination of CSRL
Following the formulation proposed in [3], the SRL Scaled Matrix is computed as (6):
where w denotes the total number of evaluated subsystems which, in this case, equals 7, and where denotes matrix multiplication.
The normalization matrix is a diagonal matrix used to re-scale SRL values from [0 - ] to [0, 1]. It is defined as (7):
where represents the total number of integrations of subsystem with itself and with all other subsystems. Since each subsystem in Pods4Rail interacts with six other subsystems in addition to itself, all subsystems share the same value . Consequently, the normalization matrix reduces to a 77 diagonal matrix with constant diagonal elements equal to 1/7. For simplicity, this matrix is hereafter denoted as The proposed Monte Carlo method for SRL calculation combines the two bi-dimensional matrices, and , with the three-dimensional , which contains elements. At each iteration, the corresponding bi-dimensional IRL layer is extracted and integrated with the normalization and TRL matrices. The SRL vector for iteration is computed as (8):
where corresponds to the -th column of matrix. This procedure is repeated across all samples, where g is an auxiliary index running from 1 to N.
As a result, an SRL matrix of dimensions 7 is obtained, where each row corresponds to a subsystem and each column contains the results for each sampled scenario from 1 to N. This structure captures the variability in subsystem readiness arising from the uncertainty embedded in the TRL and IRL inputs.
The resulting matrix can be expressed as (9):
where represents the obtained SRL value for subsystem i in the g-th sample.
To obtain a system-level maturity indicator, Composite SRL (CSRL) is introduced as the arithmetic mean of all the individual SRLs (10):
In that line, according to the Monte Carlo procedure, N different results for CSRL will be obtained. This empirical distribution will allow the statistical analysis of the resulting range and the study of the statistical related variables arising from the application of the Monte Carlo method and, in turn, arising from the subjective assignment of TRL and IRL values.
3. Results
3.1. Qualitative Analysis Results
The qualitative assessment focused on evaluating the technological maturity of Pods4Rail subsystems through expert judgment, bar charts, and heat maps based on TRLs. The analysis covered seven major groups of criteria derived from high-level functional requirements, including planning and operation systems, logistics and storage, ticketing and booking, passenger information systems, incident management, handling systems, transport units, rail carrier units, coupling systems, and rail-road interfacing.
Overall, most criteria apply to both passenger and freight scenarios, with a slight predominance of passenger-related requirements. Categories such as efficiency, sustainability, and safety emerged as critical for both operational contexts, while aspects like passenger comfort or specific freight packaging were less influential at the system level. The greatest technological challenges were identified in areas linked to automation, digitalization, and sustainability, reflecting the complexity of integrating advanced control systems, smart infrastructure, and energy optimization technologies.
Heat maps revealed heterogeneous maturity levels across subsystems. Components such as Transport Units and Rail Carrier Units exhibit relatively high TRLs (up to 7) for structural and conventional railway technologies, whereas elements related to planning and operation, incident management, and handling systems remain at early development stages (TRL 2–4), indicating significant gaps in automation and interoperability. Coupling mechanisms and multimodal interfacing also show low maturity for critical integration features, despite some advanced mechanical components.
In summary, the qualitative analysis highlights a fragmented readiness landscape: while certain hardware subsystems approach operational maturity, software-driven functionalities and integration capabilities require substantial development. These findings underscore the need for targeted efforts in automation, data management, and safety-critical systems to achieve coherent system-level feasibility.
3.2. Quantitative Analysis Results
The system parameters used in the quantitative analysis are summarized in Table 6:
These parameters serve as the input for generating the , and matrices. Of the N samples, (8)–(10) show the results obtained for the first sample run.
3.2.1. Descriptive Statistical Analysis for Individual and
For each SRL and the composite CSRL, descriptive statistics (mean, median, standard deviation, and percentiles 5%–95%) were calculated. Results of the statistical analysis can be seen in Figure 6 where a color scale was used in the following table to visually distinguish higher values (darker) from lower ones:
Analyzing the results, the mean SRL values from subsystems 5 (0.2387), 6 (0.2324) and 7 (0.2247) show higher values than the CSRL mean (0.2223), indicating that these subsystems are ahead in terms of maturity and development within the Pods4Rail system. In contrast, components 1 (Planning and Operation System), 2 (Logistics, Storage, Ticketing and Booking), 3 (PIS and Incident Management) and 4 (Handling System) have mean values below the CSRL suggesting that they have a lower level of development and are behind the whole system life cycle’s phase.
The CSRL median (0.2229) is slightly above its mean, suggesting the presence of a negative bias; that is, there are several lower values that are slightly pulling the mean to the left. A similar pattern of small negative or positive biases is observed across the individual SRLs, although the differences are small, suggesting that the distributions are approximately symmetrical.
The standard deviations, which are generally low, indicate controlled variability and that the individual SRLs and CSRL are not too scattered. SRL 7 exhibits the highest variability (0.0499), while SRL 4 (0.0397) shows the most consistent values. The CSRL has a moderate variability with a standard deviation of 0.0409.
Percentiles provide further insight into data dispersion: both percentile 5% and percentile 95% for each variable (SRLs and CSRL) define a central 90% probability interval of the empirical distribution. However, these percentiles reflect the variability of the simulated outcomes rather than the precision of the estimated mean values. To quantify the statistical reliability of the mean estimates, 90% confidence intervals are therefore computed for all variables.
3.2.2. Confidence Interval Analysis for Individual
and The 90% Confidence Interval (CI) of the mean for all the variables were calculated obtaining the results thar appear in Figure 7.
These results enable a more nuanced analysis of which components are performing above or below the overall development level of the Pods4Rail system, going beyond what a simple comparison of means can reveal. A more robust evaluation is achieved by considering not only the mean values but also the 90% probability interval of its means for each variable.
In Figure 8, each individual SRL is shown with its corresponding 90% probability interval of its means, represented as blue ranges indicating both the lower and upper limits. The main variable, CSRL, is represented as a solid red line with its 90% probability interval clearly visible, facilitating comparison with the seven individual SRLs.
Notably, there are no overlaps between the probability intervals of the component SRLs and the CSRL, confirming the observations previously drawn from mean comparisons. This consistent pattern allows extending the interpretation to the population level: subsystems 5, 6, and 7 are above the whole state of development of the Pods4Rail system. On the other hand, subsystems 1, 2, 3 and 4 are behind the maturity of the whole system with subsystem 4 being the one that needs more work to develop individually and achieve a level of development appropriate for the system. The lower level of development of the component 4 (PIS and Incident Management) can be explained by the presence of disturbed operational modes and the unavailability of specific requirements for the appropriate handling of these modes.
3.2.3. Histogram for Individual (SRLS and CSRL)
A histogram was generated to illustrate the distribution of CSRL values obtained from the simulation with samples (Figure 9). The X-axis represents CSRL values, which generally range between 0 and 0.4, with some values falling below 0.1 and a few exceeding 0.35. These values are grouped into intervals of 0.005 across the entire range. The Y-axis shows the frequency of values within each interval on the X-axis; notably, the maximum frequency for any interval does not exceed 2500.
The histogram also includes two vertical red lines marking the 5% and 95% percentiles. The 5th percentile corresponds to 0.15, and the 95th percentile to 0.29. Therefore, 90% of the CSRL values lie within the range of 0.15 to 0.29.
Based on this result and according to the theoretical framework, the CSRL—representing the System Readiness Level of the Pods4Rail system—falls between SRL1 (Concept Refinement) and SRL2 (Technology Development) stages, as defined in Appendix C (Figure 9).
It is important to emphasize that this histogram represents the behavior of CSRL values within the sample and should not be interpreted as an extension to the population or as a confidence interval. Unlike a 90% confidence interval, which estimates the precision of the population mean, the histogram provides a comprehensive view of the sample distribution, highlighting both dispersion and concentration of values without relying on statistical assumptions. Whereas confidence interval analysis focuses on the mean and its margin of error, the histogram captures the variability across all Monte Carlo scenarios. Given the large number of samples used in this study, the histogram effectively represents the variability of CSRL, making it the primary tool for interpreting the System Readiness Level of Pods4Rail, while the CI has been used solely to compare the range of means across the seven component SRLs and the CSRL.
3.2.4. Correlation Analysis for SRLS
A correlation analysis has been performed between the seven individual components’ SRLs, as shown in (11). As expected, this matrix is symmetrical since the correlation coefficient between component i and component j must be the same as the one between component j and component i independently of the order of analysis. The diagonal shows a value of 1 because the relationship of one variable with itself must have the highest value of Pearson’s coefficient since it is perfectly related to itself.
Figure 10 presents the same information as the previous array, but in graphical form. The scatter plot matrix reveals that the relationships between all pairs of variables are positively linear, with correlation coefficients close to 0.8, indicating a strong interdependence among them.
The diagonal contains histograms representing each variable’s distribution. These histograms suggest that the variables approximately follow a normal distribution, which supports the validity of using Pearson’s correlation coefficient—an approach that assumes a linear relationship between normally distributed variables. However, the justification for Pearson’s correlation lies in the assumption that the joint distribution of the two variables is normal, not merely their individual distributions. This can be visualized as a 3D plot of the two variables, where the normality of their joint distribution becomes evident. The normality of the data also reinforces the appropriateness of parametric statistical methods for subsequent analyses, providing a more robust foundation for drawing conclusions.
The off-diagonal cells display scatter plots of variable pairs. Correlation coefficients in the range of [0.81, 0.84] confirm that all variables are strongly related. Nevertheless, the components are not fully dependent on each other, suggesting that while the relationship is significant, additional variability exists that is not captured by correlation alone.
Despite the strong correlations observed, these results should be interpreted with caution. A high correlation coefficient indicates a strong association but does not imply causation. External factors or underlying dependencies may influence these correlations, meaning that changes in one variable might coincide with changes in another without necessarily being the cause of those variations.
3.2.5. Influence of the Initial Assumption of the Interrelationship Between the Components in the CSRL Results
Three different interrelationships’ configurations (including the initial one of Figure 5) have been tested to determine its influence in the percentiles 5% and 95% of the CSRL. Figure 11 includes the comparison carried out:
As observed, the tendency indicates that when fewer connections between components are considered, both percentiles of the CSRL tend to take higher values. In this sense, the initial assumption of interrelationship remains the most conservative and appropriate approach for evaluating the system’s overall System Readiness Level.
Despite the observed trend in response to changes in component relationships, at the current stage of the project, the overall SRL of the Pods4Rail system remains primarily near to level 2. At this phase, the system is in a stage of its lifecycle where efforts are focused on reducing technological risks and identifying the most suitable set of technologies to integrate into a fully functional system.
4. Discussion
It is important to emphasize that this evaluation is being conducted before the final system proposal is completed. While modifications to the connections between components have been considered, they do not result in significant changes to the system’s SRL. As seen in previous analyses, the Pods4Rail’s SRL considered percentiles range from 0.15 to 0.29, reinforcing the stability of the system’s readiness level despite variations in interconnections.
The findings of this study underscore the complexity of evaluating system readiness in early design phases and highlight the advantages of adopting a hybrid approach that integrates qualitative and quantitative perspectives. The qualitative analysis provided a detailed view of technological maturity across Pods4Rail subsystems, revealing significant disparities that reflect the heterogeneous nature of the system architecture. Components such as braking systems, electrical wiring, and structural elements demonstrated high TRL values, indicating near-operational readiness. In contrast, subsystems related to planning, logistics, and incident management exhibited lower TRL levels, suggesting that these areas require substantial development before achieving integration feasibility. These findings emphasize the need for targeted resource allocation and development strategies to address critical gaps in automation, digitalization, and sustainability.
The quantitative analysis builds on the qualitative insights by incorporating IRL into the estimation process, offering a more holistic view of system maturity. While TRL reflects the technological development of individual components, IRL captures the stability and compatibility of subsystem interfaces—an aspect often overlooked in early-phase assessments.
To address uncertainty, the proposed methodology integrates TRL and IRL through a probabilistic model and applies Monte Carlo simulation to propagate these uncertainties toward SRL estimation. This approach generates a distribution of SRL values rather than a single deterministic figure, providing a realistic representation of system readiness under incomplete information.
Simulation results indicate that Pods4Rail currently falls between SRL 1 and SRL 2, corresponding to concept refinement and technology development stages. This outcome aligns with the project’s lifecycle phase, where efforts focus on reducing technological risks, validating integration assumptions, and defining operational strategies. Subsystems such as the Transport Unit and Rail Carrier Unit exhibit higher readiness levels compared to planning and logistics components, suggesting that hardware development is advancing more rapidly than software-driven functionalities. Nevertheless, IRL analysis reveals that even mature subsystems face integration challenges, particularly in data exchange, interface management, and coupling mechanisms. These findings confirm that achieving system-level readiness requires not only technological progress but also robust integration strategies.
Beyond the Pods4Rail case, the implications of this work are significant. First, overall system readiness cannot be inferred solely from component maturity; integration readiness is a decisive factor for feasibility. Second, the quantitative approach explicitly distinguishes between the probabilistic model (representing uncertainties in TRL and IRL), the problem of uncertainty propagation to SRL, and the algorithm used to solve this problem—Monte Carlo simulation. This structure provides a robust mechanism for managing uncertainty, enabling decision-makers to plan for a range of possible outcomes rather than relying on single-point estimates. Such capability is particularly valuable in early design phases, where assumptions about subsystem interactions and operational conditions are subject to change. Finally, the methodology establishes a foundation for iterative refinement as new data becomes available, supporting continuous improvement throughout the system development lifecycle.
Future research should focus on validating the proposed framework with empirical integration data, incorporating advanced simulation techniques for subsystem interactions, and extending the approach to include economic and sustainability considerations. Additionally, integrating stakeholder perspectives into the readiness assessment process could enhance its comprehensiveness, ensuring that technical feasibility aligns with operational requirements and strategic objectives. By addressing these dimensions, readiness assessment can evolve from a purely technical exercise into a holistic decision-support tool that guides innovation toward successful implementation.
5. Conclusions
This study demonstrates the effectiveness of a hybrid framework for assessing system readiness in the early design phases of complex multimodal mobility systems. By integrating qualitative and quantitative approaches, the methodology addresses the inherent uncertainty associated with limited empirical data and incomplete subsystem integration. The qualitative analysis, based on expert judgment and visual heat maps, provided a detailed view of technological maturity across Pods4Rail subsystems, highlighting critical challenges in automation, digitalization, and sustainability. These findings underscore the importance of prioritizing development efforts in areas that exhibit lower readiness levels, such as planning and logistics.
The quantitative analysis, implemented through Monte Carlo simulation, enabled the estimation of SRL under uncertainty by combining TRLs and IRLs. Results indicate that Pods4Rail currently falls between SRL 1 and SRL 2, corresponding to concept refinement and technology development stages. While subsystems such as the Transport Unit and Rail Carrier Unit exhibit relatively higher maturity, others remain at early development stages, requiring significant progress to achieve system-level integration and operational feasibility.
Overall, the proposed methodology offers a replicable and transferable approach for evaluating readiness in emerging mobility systems. Its ability to combine interpretative insights with statistical rigor provides decision-makers with a robust tool for risk mitigation, resource allocation, and strategic planning. Future work should focus on refining integration assumptions, incorporating real-world testing data, and extending the framework to other domains where uncertainty and complexity pose similar challenges.
Author Contributions
Conceptualization, J.F., F.C. and J.M.M.; methodology, J.F., F.C., G.R. and J.M.M.; formal analysis, J.F., F.C. and J.M.M.; investigation, J.F., F.C. and G.R.; validation, J.F., F.C. and G.R.; writing—original draft preparation, J.F. and F.C.; writing—review and editing, J.F., F.C. and J.M.M.; supervision, J.F. All authors have read and agreed to the published version of the manuscript.
Funding
The project Pods4Rail project HORIZON-ER-JU-2022-FA7-01 is supported by the Europe’s Rail Joint Undertaking and its members under the Horizon Europe Programme with the grant agreement no. 101121853. Funded by the European Union. Views and opinion expressed are however those of the author(s) only and do not necessarily reflect those of the European Union or the Europe’s Rail Joint Undertaking. Neither the European Union nor the granting authority can be held responsible for them. The project Pods4Rail project is supported by the Europe’s Rail Joint Undertaking and its members.

Institutional Review Board Statement
Not applicable.
Informed Consent Statement
Not applicable.
Data Availability Statement
Data are contained within the paper.
Conflicts of Interest
The authors declare that the research was conducted in the absence of any commercial or financial relationships that could be construed as a potential conflict of interest.
Abbreviations
The following abbreviations are used in this manuscript:
| AHP | Analytic Hierarchy Process |
| CI | Confidence Interval |
| COPRAS | Complex Proportional Assessment |
| CSRL | Composite SRL |
| CTE | Critical Technology Element |
| DFMA | Design for Manufacturing and Assembly |
| DMM | Design Mapping Matrix |
| DSM | Design Structure Matrix |
| FRS | Functional Requirements Specification |
| GAO | Government Accountability Office |
| HW/SW/IF | Hardware / Software / Interface |
| IRL | Integration Readiness Level |
| IRL between subsystems i and j | |
| IRL probability matrix | |
| IRL Scaled matrix | |
| ISRLM | Industrial Symbiosis Readiness Level Matrix |
| LCA | Life Cycle Assessment |
| LCOE | Levelized Cost of Energy |
| LCOH | Levelized Cost of Hydrogen |
| MBD | Model-Based Design |
| MBSE | Model-based Systems Engineering |
| MCDM | Multi-Criteria Decision Making |
| MIA | Multi-Index Analysis |
| MRL | Manufacturing Readiness Level |
| PNSRL | Petri Net SRL |
| QA | Quality Assurance |
| R&D | Research and Development |
| SME | Small and Medium-sized Enterprise |
| SoS | System of Systems |
| SRLs scaled matrix | |
| SRA | System Readiness Assessment |
| SRL | System Readiness Level |
| SSTRA | Smart SME Technology Readiness Assessment |
| TEA | Techno-Economic Assessment |
| TOPSIS | Technique for Order Preference by Similarity to Ideal Solution |
| TPL | Technology Performance Level |
| Two-dimensional TRL Scaled matrix | |
| TRA | Technology Readiness Assessment |
| TRL | Technology Readiness Level |
| VE | Value Engineering |
| WSP | Wheel Slide Protection |
Appendix A
This appendix presents the definitions of the Technology Readiness Levels (TRLs) used throughout this paper. The purpose of this section is to provide a clear and consistent reference for readers, ensuring a shared understanding of how the maturity of each technology has been assessed. Definitions from TRL 1-9 are generally known and they vary, in a minimum way, depending on the source of consultation. For this paper, [5] scales has been used.

Table A1.
TRL scale definitions.
| Stages | TRL | Definition |
|---|---|---|
| Observation of basic principles | 1 | Basic Principals Observed and Reported |
| 2 | Technology Concept and/or Application Formulated |
|
| 3 | Experimental Proof-of-Concept | |
| Technological development stage | 4 | Component Validation in Laboratory Environment |
| 5 | Component Validation in Relevant Environment | |
| 6 | System/Subsystem Model or Prototype Demonstration in Relevant Environment | |
| Maturity and commercialization stage | 7 | System Prototype Demonstration in Relevant/Operational Environment |
| 8 | Actual System Completed and Qualified Through Test and Demonstration | |
| 9 | Actual System Proven Through Successful Mission Operations |
Appendix B
This appendix provides the definitions of the Integration Readiness Levels (IRLs) referenced in this study. The aim is to offer a clear framework for understanding how the integration maturity of the involved systems and components has been evaluated. The IRL scale describes progressive stages of integration, from initial interface assumptions to verified performance in an operational environment. For this paper, IRL definitions from [5] have been used.
Table B1.
IRL scale definitions.
| IRL | Definition |
|---|---|
| 1 | An interface between technologies has been identified with sufficient detail to allow characterization of the relationship. |
| 2 | There is some level of specificity to characterize the interaction between technologies through their interface. |
| 3 | There is compatibility between technologies such that proper and efficient integration and interaction is possible. |
| 4 | There is sufficient detail in the quality and assurance of the integration between the technologies. |
| 5 | There is sufficient control between the technologies required to establish, manage, and terminate integration. |
| 6 | The integration technologies can accept, translate, and structure information for the intended application. |
| 7 | The integration of the technologies has been verified and validated with sufficient detail to be actionable. |
| 8 | The actual integration completed and qualified for use through testing and demonstration in the system environment. |
| 9 | The integration has been proven through successful mission operations. |
Appendix C
This appendix defines the System Readiness Levels (SRLs) referenced in this paper. Unlike technology or integration readiness, SRLs focus on the maturity of the system as a complete entity, considering its performance, reliability, and operational capability in real-world conditions. The presented scales have been extracted from [5].
Table C1.
SRL scale definitions.
| Level | 0-1 Scale | Name | Definition |
|---|---|---|---|
| 1 | 0.1 to 0.2 | Concept refinement | Refine the initial concept. Develop system / Technology development strategy. |
| 2 | 0.2 to 0.5 | Technology development | Reduce technology risks and determine and appropriate set of technologies to integrate into a full system. |
| 3 | 0.5 to 0.8 | System development and demonstration | Develop the system while minimizing risks, ensuring supportability, affordability, safety, and operational effectiveness, and demonstrating integration and interoperability. |
| 4 | 0.8 to 0.9 | Production and development | Achieve operational capability that satisfies mission needs. |
| 5 | 0.9 to 1.0 | Operations and support | Execute a support program that meets operational support performance requirements and sustains the system in the most cost-effective manner over its total life cycle. |
References
- Olechowski; Eppinger, S. D.; Joglekar, N. ‘Technology readiness levels at 40: A study of state-of-the-art use, challenges, and opportunities’. 2015 Portland International Conference on Management of Engineering and Technology (PICMET), Portland, OR, USA, Aug. 2015; IEEE; pp. 2084–2094. [Google Scholar] [CrossRef]
- Sauser, J.; Marquez, J. E. R.; Henry, D.; DiMarzio, D. ‘A system maturity index for the systems engineering life cycle’. Int. J. Ind. Syst. Eng. 2008, vol. 3(no. 6), 673. [Google Scholar] [CrossRef]
- Tan, W.; Ramirez-Marquez, J.; Sauser, B. ‘A probabilistic approach to system maturity assessment’. Syst. Eng. 2011, vol. 14(no. 3), 279–293. [Google Scholar] [CrossRef]
- Olechowski, A. L.; Eppinger, S. D.; Joglekar, N.; Tomaschek, K. ‘Technology readiness levels: Shortcomings and improvement opportunities’. Syst. Eng. 2020, vol. 23(no. 4), 395–408. [Google Scholar] [CrossRef]
- Ashkavand, M.; Jentsch, S.; Eggers, N.; Birth, T. ‘READINESS LEVELS - Indicators for systems engineering evaluation - An overview’. 2023. [Google Scholar] [CrossRef]
- Pods4Rail, ‘Pods4Rail: a European Research Project exploring the future of rail transportation’. 2023. Available online: https://pods4rail.eu/.
- Thal, B. Olson; Blessner, P. ‘A robust system maturity model for complex systems utilizing system readiness level and Petri nets’. Complex Intell. Syst. 2018, vol. 4(no. 4), 241–250. [Google Scholar] [CrossRef]
- Austin, M. F.; Ahalt, V.; Doolittle, E.; Homberger, C.; Polacek, G. A.; York, D. M. ‘Applying Bayesian Networks to TRL Assessments – Innovation in Systems Engineering’. INSIGHT 2024, vol. 27(no. 6), 47–54. [Google Scholar] [CrossRef]
- Malone, P.; Smoker, R.; Apgar, H.; Wolfarth, L. ‘The application of TRL metrics to existing cost prediction models’. 2011 Aerospace Conference, Mar. 2011; IEEE: Big Sky, USA; pp. 1–12. [Google Scholar] [CrossRef]
- Shimabukuro, J.; Mitalo, E. ‘Automating Model Validation for Quantifying System Maturity & Quality Assurance’. 2024 IEEE Aerospace Conference, Mar. 2024; IEEE: Big Sky, MT, USA; pp. 1–7. [Google Scholar] [CrossRef]
- Halicka, K. ‘Technology Selection Using the TOPSIS Method’. Foresight STI Gov. 2020, vol. 14(no. 1), 85–96. [Google Scholar] [CrossRef]
- McConkie; Mazzuchi, T. A.; Sarkani, S.; Marchette, D. ‘Mathematical properties of System Readiness Levels’. Syst. Eng. 2013, vol. 16(no. 4), 391–400. [Google Scholar] [CrossRef]
- Lowe, C.; Justham, L.; Everitt, M. J. ‘Multi-index analysis with readiness levels for decision support in product design’. Technol. Forecast. Soc. Change 2024, vol. 206, 123559. [Google Scholar] [CrossRef]
- Ullah, K.; Witt, E.; Lill, I.; Banaitienė, N.; Statulevičius, M. ‘READINESS ASSESSMENT FOR BIM-BASED BUILDING PERMIT PROCESSES USING FUZZY-COPRAS’. J. Civ. Eng. Manag. 2022, vol. 28(no. 8), 620–633. [Google Scholar] [CrossRef]
- Marlyana, N.; Tontowi, A. E.; Yuniarto, H. A. A Quantitative Analysis of System Readiness Level Plus (SRL+ ): Development of Readiness Level Measurement’. MATEC Web Conf. 2018, vol. 159, 02067. [Google Scholar] [CrossRef]
- Ross, S. ‘Application of System and Integration Readiness Levels to Department of Defense Research and Development’. Def. ARJ 2016, vol. 23(no. 3), 248–273. [Google Scholar]
- Sauser, B.; Verma, D.; Ramirez-Marquez, J.; Gove, R. ‘From TRL to SRL: The Concept of Systems Readiness Levels’. Conference on Systems Engineering Research, Los Angeles, 2006; pp. 1–16. [Google Scholar]
- Wang, L. ‘System Readiness Level Model of Highway Intelligent Transportation System by Integrating a Value Engineering Process’. 2021 IEEE International Conference on Industrial Engineering and Engineering Management (IEEM), Singapore, Singapore, Dec. 2021; IEEE; pp. 1343–1350. [Google Scholar] [CrossRef]
- Austin, M. F.; York, D. M. ‘System Readiness Assessment (SRA) an Illustrative Example’. Procedia Comput. Sci. 2015, vol. 44, 486–496. [Google Scholar] [CrossRef]
- Austin, M. F.; York, D. M. System Readiness Assessment (SRA) a Vade Mecum’, in Complex Systems Design & Management; Auvray, G., Bocquet, J.-C., Bonjour, E., Krob, D., Eds.; Springer International Publishing: Cham, 2016; pp. 53–68. [Google Scholar] [CrossRef]
- Cobos, M. P.; Quezada, V. F.; Morloy, L. I. Z.; Alvarez, P. V.; Gonzalez, S. P. ‘A model based on the Technology Readiness Level (TRL) scale to measure the maturity level of research projects that can become spinoffs in Higher Education Institutions’. In 2021 Congreso Internacional de Innovación y Tendencias en Ingeniería (CONIITI); IEEE: Bogotá, Colombia, Sep 2021; pp. 1–6. [Google Scholar] [CrossRef]
- Waseem, A. A.; Shaikh, Z. Ahmed; Rehman, A. Ur. ‘A Toolkit for Prototype Implementation of E-Governance Service System Readiness Assessment Framework’. In HCI in Business, Government, and Organizations: Information Systems; Lecture Notes in Computer Science; Nah, F. F.-H., Tan, C.-H., Eds.; Springer International Publishing: Cham, 2016; vol. 9752 vol. 9752. pp. 259–270. [Google Scholar] [CrossRef]
- Wang, W.; Zhang, Q.; Li, Y.; Feng, W.; Zhang, W.; Liu, H. ‘A TRL Assessment Method Considering Reliability Requirements’. MATEC Web Conf. 2018, vol. 221, 02004. [Google Scholar] [CrossRef]
- Lukhmanov, Y.; Dikhanbayeva, D.; Yertayev, B.; Shehab, E.; Turkyilmaz, A. ‘An advisory system to support Industry 4.0 readiness improvement’. Procedia CIRP 2022, vol. 107, 1361–1366. [Google Scholar] [CrossRef]
- Santacruz, R. F. B.; Sullivan, B. P.; Terzi, S.; Sassanelli, C. Developing a Technology Readiness Level Template for Model-Based Design Methods and Tools in a Collaborative Environment’, in Product Lifecycle Management. In PLM in Transition Times: The Place of Humans and Transformative Technologies; IFIP Advances in Information and Communication Technology; Noël, F., Nyffenegger, F., Rivest, L., Bouras, A., Eds.; Springer Nature Switzerland: Cham, 2023; vol. 667 vol. 667. pp. 237–249. [Google Scholar] [CrossRef]
- Harfeldt-Berg, Lovisa.; Wallin, Elin.; Löwgren, Annika.; Sommarin, Per. ‘Industrial symbiosis readiness level assessment—A stakeholder co-designed matrix tool for guidance and evaluation’. Resour. Conserv. Recycl. Adv. 2025, vol. 27, 200270. [Google Scholar] [CrossRef]
- Gomez, A.; Fonck, B.; Ayoun, A.; Inzerillo, G. ‘Lessons Learnt in System Engineering for the SESAR Programme’. In Complex Systems Design & Management; Auvray, G., Bocquet, J.-C., Bonjour, E., Krob, D., Eds.; Springer International Publishing: Cham, 2016; pp. 3–17. [Google Scholar] [CrossRef]
- Pishdad-Bozorgi, P.; De La Garza, J. M.; Austin, R. B. ‘Readiness Assessment for Flash Tracking’. J. Constr. Eng. Manag. 2016, vol. 142(no. 12), 06016005. [Google Scholar] [CrossRef]
- Saad, S. M.; Bahadori, R.; Jafarnejad, H.; Putra, M. F. ‘Smart Production Planning and Control: Technology Readiness Assessment’. Procedia Comput. Sci. 2021, vol. 180, 618–627. [Google Scholar] [CrossRef]
- Brañas, B. ‘TRL analysis of IFMIF-DONES’. Fusion Eng. Des. 2024, vol. 202, 114328. [Google Scholar] [CrossRef]
- Bakke, K.; Haskins, C. ‘Use of TRL in the systems engineering toolbox’. INCOSE Int. Symp. 2018, vol. 28(no. 1), 587–601. [Google Scholar] [CrossRef]
- Eder, C.; Muzzuchi, T.; Sarkani, S. ‘Beyond Integration Readiness Level (IRL): A Multidimensional Framework to Facilitate the Integration of System of Systems’. Def. Acquis. Res. J. 2017, vol. 24(no. 3), 488–533. [Google Scholar] [CrossRef]
- Jimenez, H.; Mavris, D. N. ‘Characterization of Technology Integration Based on Technology Readiness Levels’. J. Aircr. 2014, vol. 51(no. 1), 291–302. [Google Scholar] [CrossRef]
- Koo, J.-I.; Jeong, S.-J. ‘Improved Technology Readiness Assessment Framework for System-of-Systems From a System Integration Perspective’. IEEE Access 2024, vol. 12, 23827–23853. [Google Scholar] [CrossRef]
- Jesus, T.; Chagas Junior, M. F. ‘Using Systems Architecture Views to Assess Integration Readiness Levels’. IEEE Trans. Eng. Manag. 2022, vol. 69(no. 6), 3902–3912. [Google Scholar] [CrossRef]
- Mendoza, N. ‘Adapting the Technology Performance Level Integrated Assessment Framework to Low-TRL Technologies Within the Carbon Capture, Utilization, and Storage Industry, Part I’. Front. Clim. 2022, vol. 4, 818786. [Google Scholar] [CrossRef]
- Jiménez-Martín. ‘Techno-economic feasibility of solid oxide electrolysis hybridization with solar photovoltaics and batteries for green hydrogen production’. Energy Convers. Manag. X 2025, vol. 27, 101131. [Google Scholar] [CrossRef]
- Scuiller, E.; Bennici, S.; Dutournié, P.; Principaud, F. ‘Towards industrial-scale adsorptive heat storage systems: From state-of-the-art selected examples to preliminary conception guidelines’. J. Energy Storage 2022, vol. 53, 105103. [Google Scholar] [CrossRef]
- Li, Y.; Lin, R.; O’Shea, R.; Thaore, V.; Wall, D.; Murphy, J. D. ‘A perspective on three sustainable hydrogen production technologies with a focus on technology readiness level, cost of production and life cycle environmental impacts’. Heliyon 2024, vol. 10(no. 5), e26637. [Google Scholar] [CrossRef]
- Franco, A. ‘Green Hydrogen and the Energy Transition: Hopes, Challenges, and Realistic Opportunities’. Hydrogen 2025, vol. 6(no. 2), 28. [Google Scholar] [CrossRef]
- Ferreira, C. V.; Biesek, F. L.; Scalice, R. K. ‘Product innovation management model based on manufacturing readiness level (MRL), design for manufacturing and assembly (DFMA) and technology readiness level (TRL)’. J. Braz. Soc. Mech. Sci. Eng. 2021, vol. 43(no. 7), 360. [Google Scholar] [CrossRef]
- Uthirasamy, R. ‘Design of Boosted Multilevel DC-DC Converter for Solar Photovoltaic System’. Int. J. Photoenergy 2022, vol. 2022, 1–23. [Google Scholar] [CrossRef]
- Doyle, L.; Cavero, G.; Modreanu, M. ‘Applying the 12 Principles of Green Engineering in Low TRL Electronics: A Case Study of an Energy-Harvesting Platform’. Sustainability 2023, vol. 15(no. 14), 11227. [Google Scholar] [CrossRef]
- Tetlay, M. A.; John, P. ‘Determining the Lines of System Maturity, System Readiness and Capability Readiness in the System Development Lifecycle’. 2009. [Google Scholar]
- Popovich, W. ‘The TRA Tool: Modeling and Projecting Readiness Levels with MBSE’. INCOSE Int. Symp. 2025, vol. 35(no. 1), 188–210. [Google Scholar] [CrossRef]
- Tan, W.; Sauser, B.; Ramírez-Márquez, J. ‘Monte-Carlo Simulation Approach for System Readiness Level Estimation’. INCOSE Int. Symp. 2009, vol. 19(no. 1), 1154–1166. [Google Scholar] [CrossRef]
- Jesus, T.; Milton, F. C., Jr. ‘Integration Readiness levels Evaluation and Systems Architecture: A Literature Review’. Int. J. Adv. Eng. Res. Sci. 2018, vol. 5(no. 4), 73–84. [Google Scholar] [CrossRef]
- Paz Martinez, A.; Adams, Y. K.; Nagele, S.; Laqua, V.; Winkler, D. ‘Assessing Multimodal Mobility Systems for Benchmarking Rail-Bound Intermodal Pods in ERJU’s FA7-Projekt Pods4Rail’. presented at the The Sixth International Conference on Railway Technology: Research, Development and Maintenance, Prague, Czech Republic, 2024; pp. 1–14. [Google Scholar] [CrossRef]
- Tan, Z.; Cheng, J.; Chen, L. ‘A Decision Support System with the Plan of Loading and Reinforcing Dimension Freight’. In ICTE 2011; American Society of Civil Engineers: Chengdu, China, Jul 2011; pp. 2461–2466. [Google Scholar] [CrossRef]
- Sandu, Dragos. ‘TRL-MRL-SRL’. Unitatea Horizon Europe NCP, Jan. 2022. Accessed: Oct. 30, 2025. Available online: https://uploads-ssl.webflow.com/61de9faf3e98d5e793174909/623997b9292d754d358a8815_AVF-DS-TRL-MRL-SRL-Jan2022.pdf.
- Pods4Rail, *!!! REPLACE !!!*. ‘D4.4 High-Level functional requirements specification’. 26 Nov 2025. Available online: https://pods4rail.eu/#deliverables.
- Pods4Rail, ‘D6.1 Evaluation Report’. 26 Nov 2025. Available online: https://pods4rail.eu/#deliverables.
Figure 1.
Overview over the Pods4Rail approach [6].
Figure 1.
Overview over the Pods4Rail approach [6].
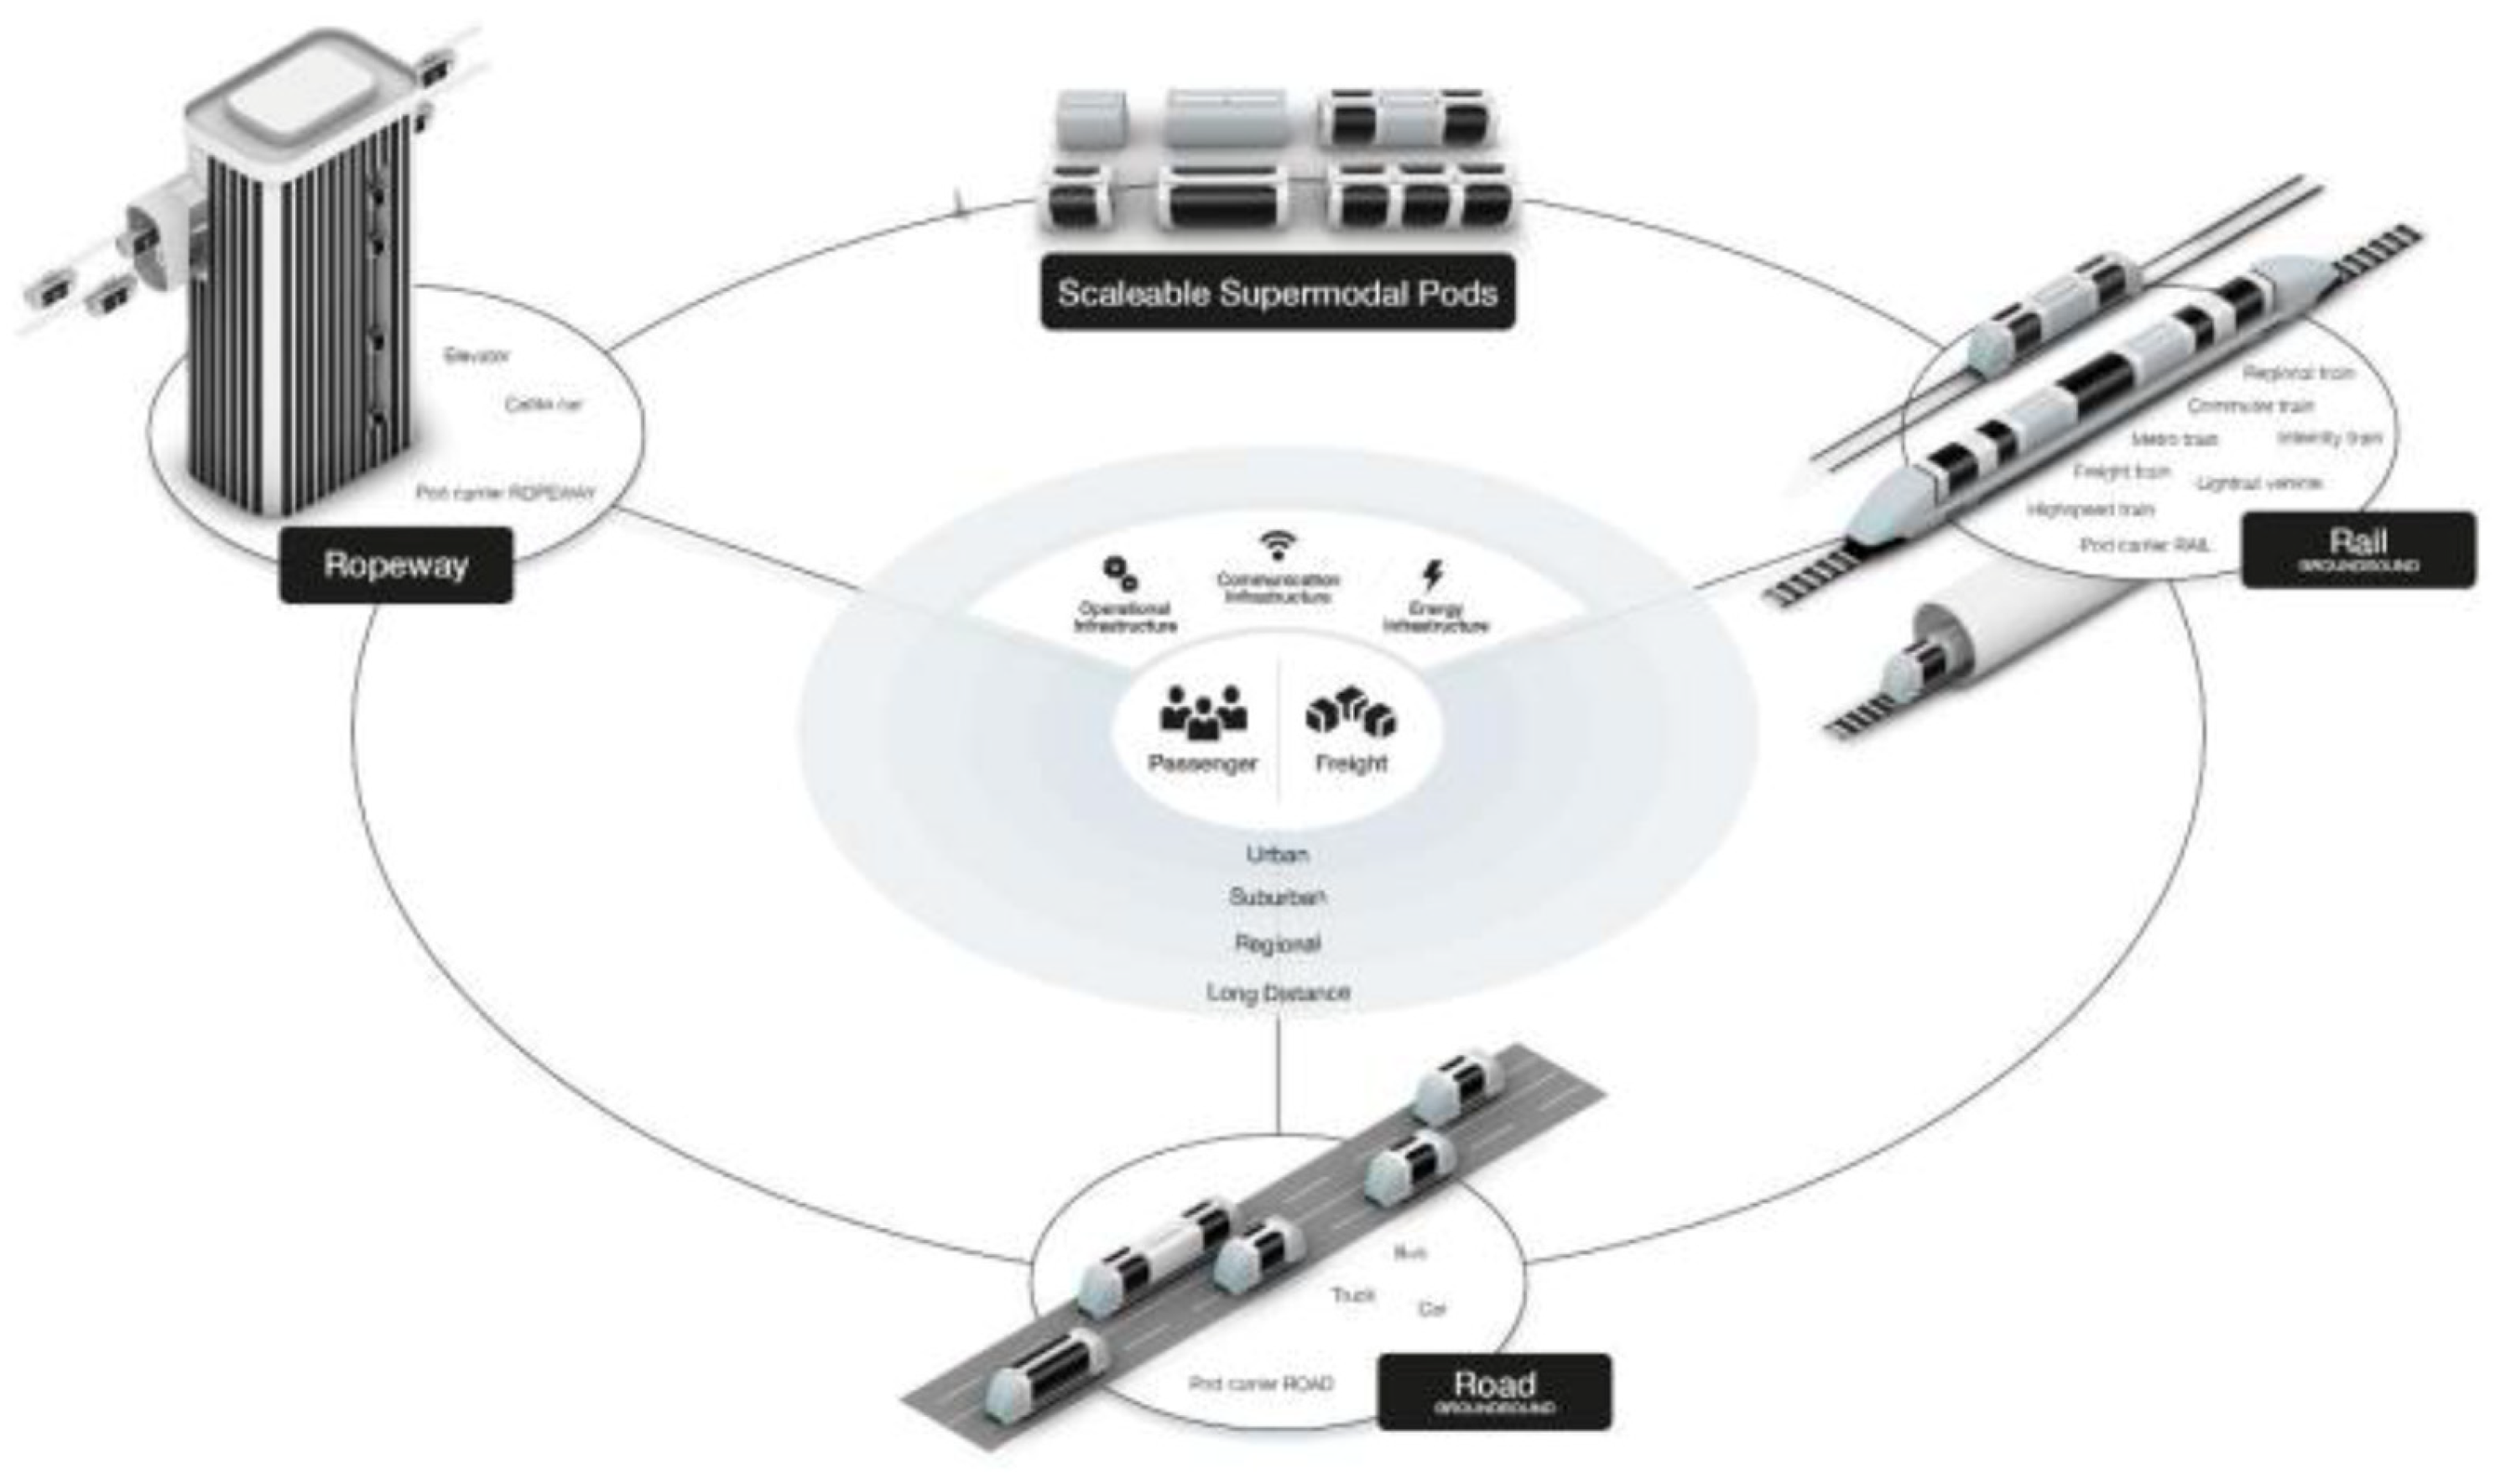
Figure 2.
Pods4Rail Breakdown Structure.
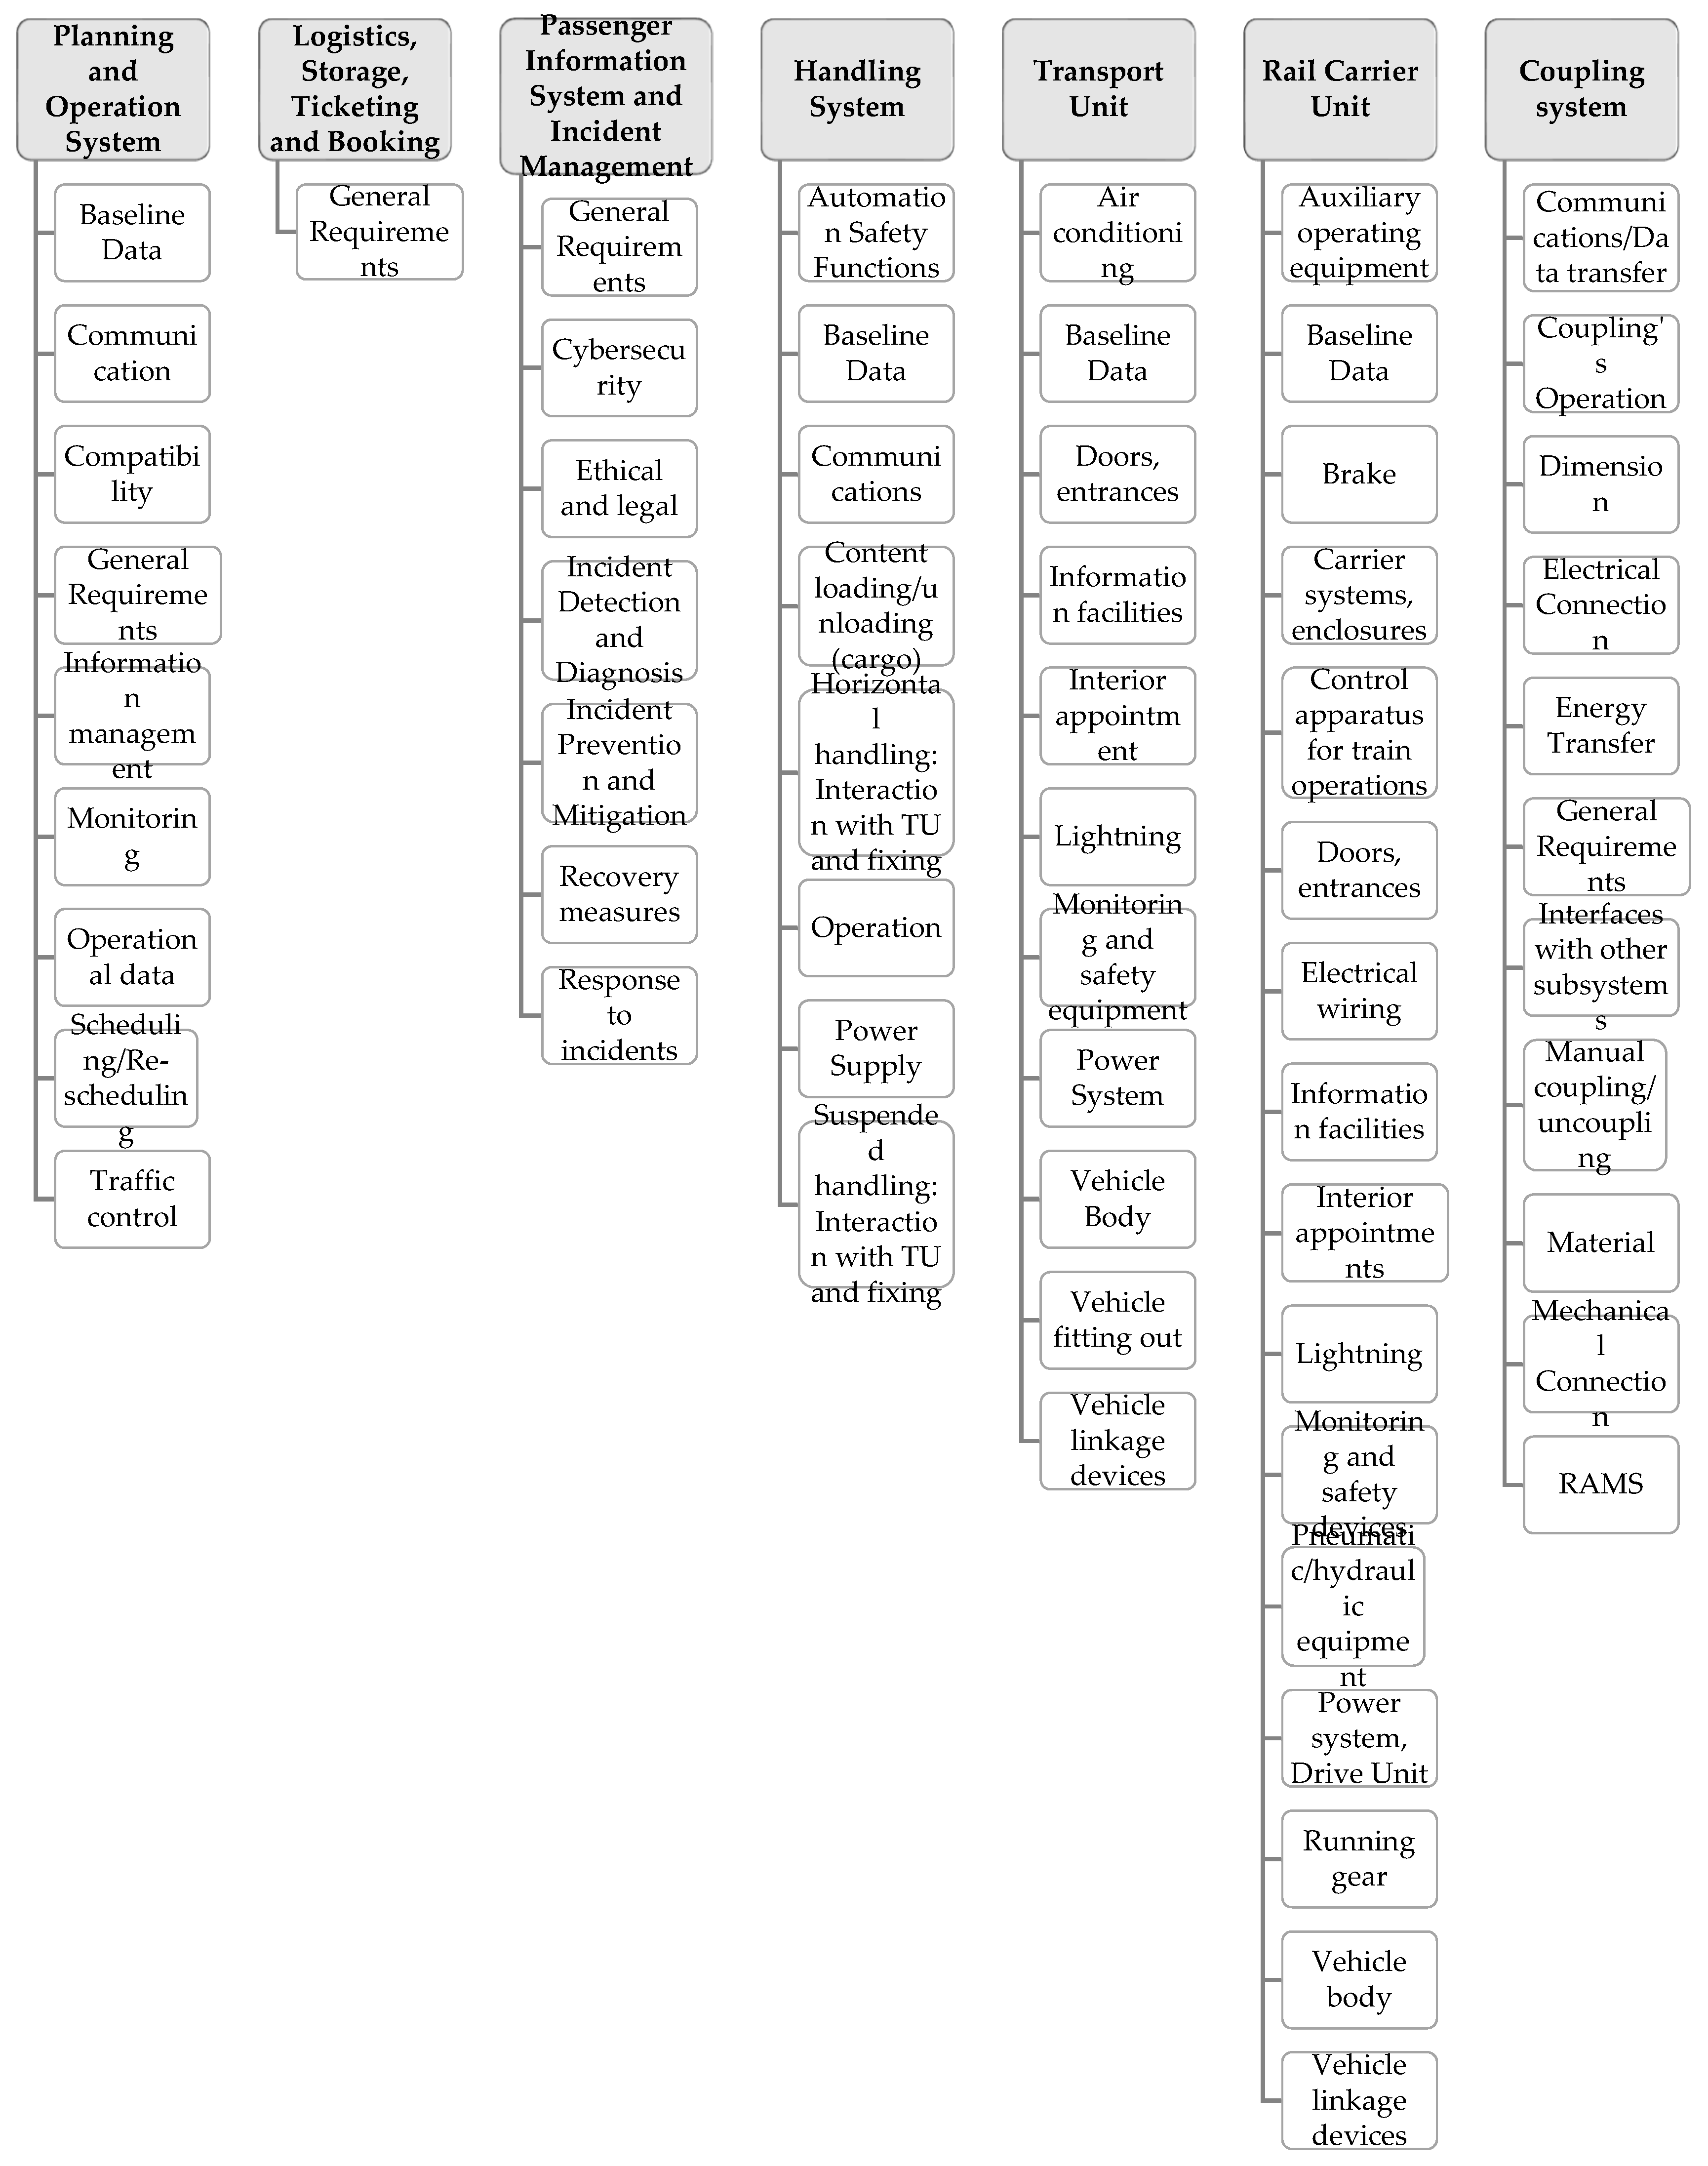
Figure 3.
Steps for TRL evaluation through the selected hierarchy for Pods4Rail project.
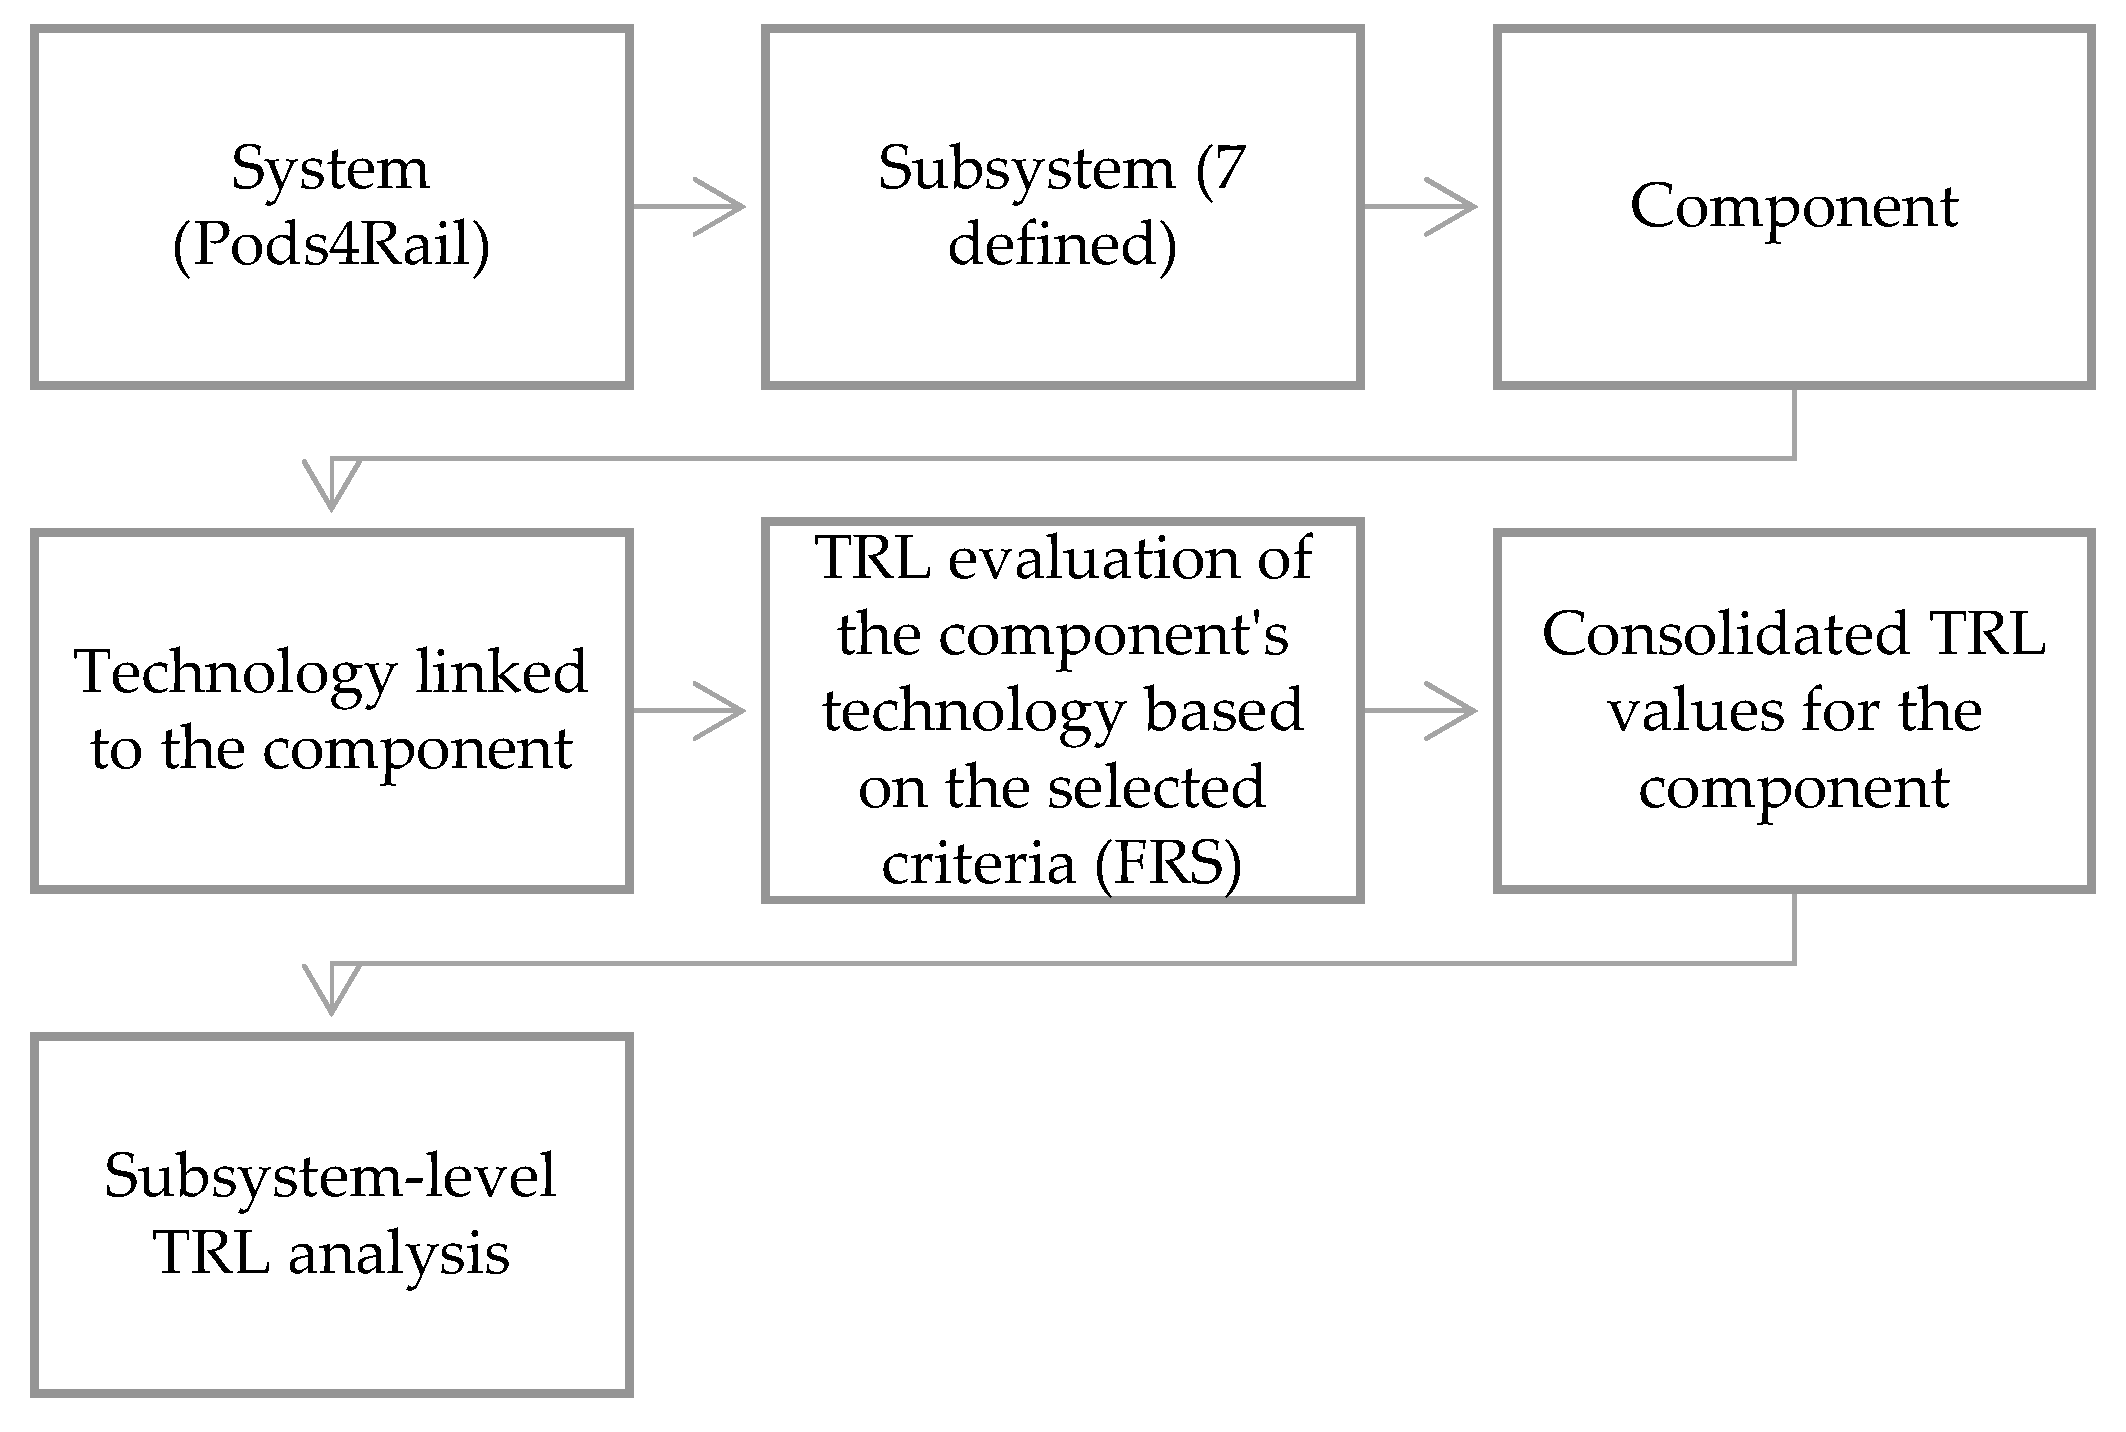
Figure 4.
Rail Carrier Unit Heat Map.
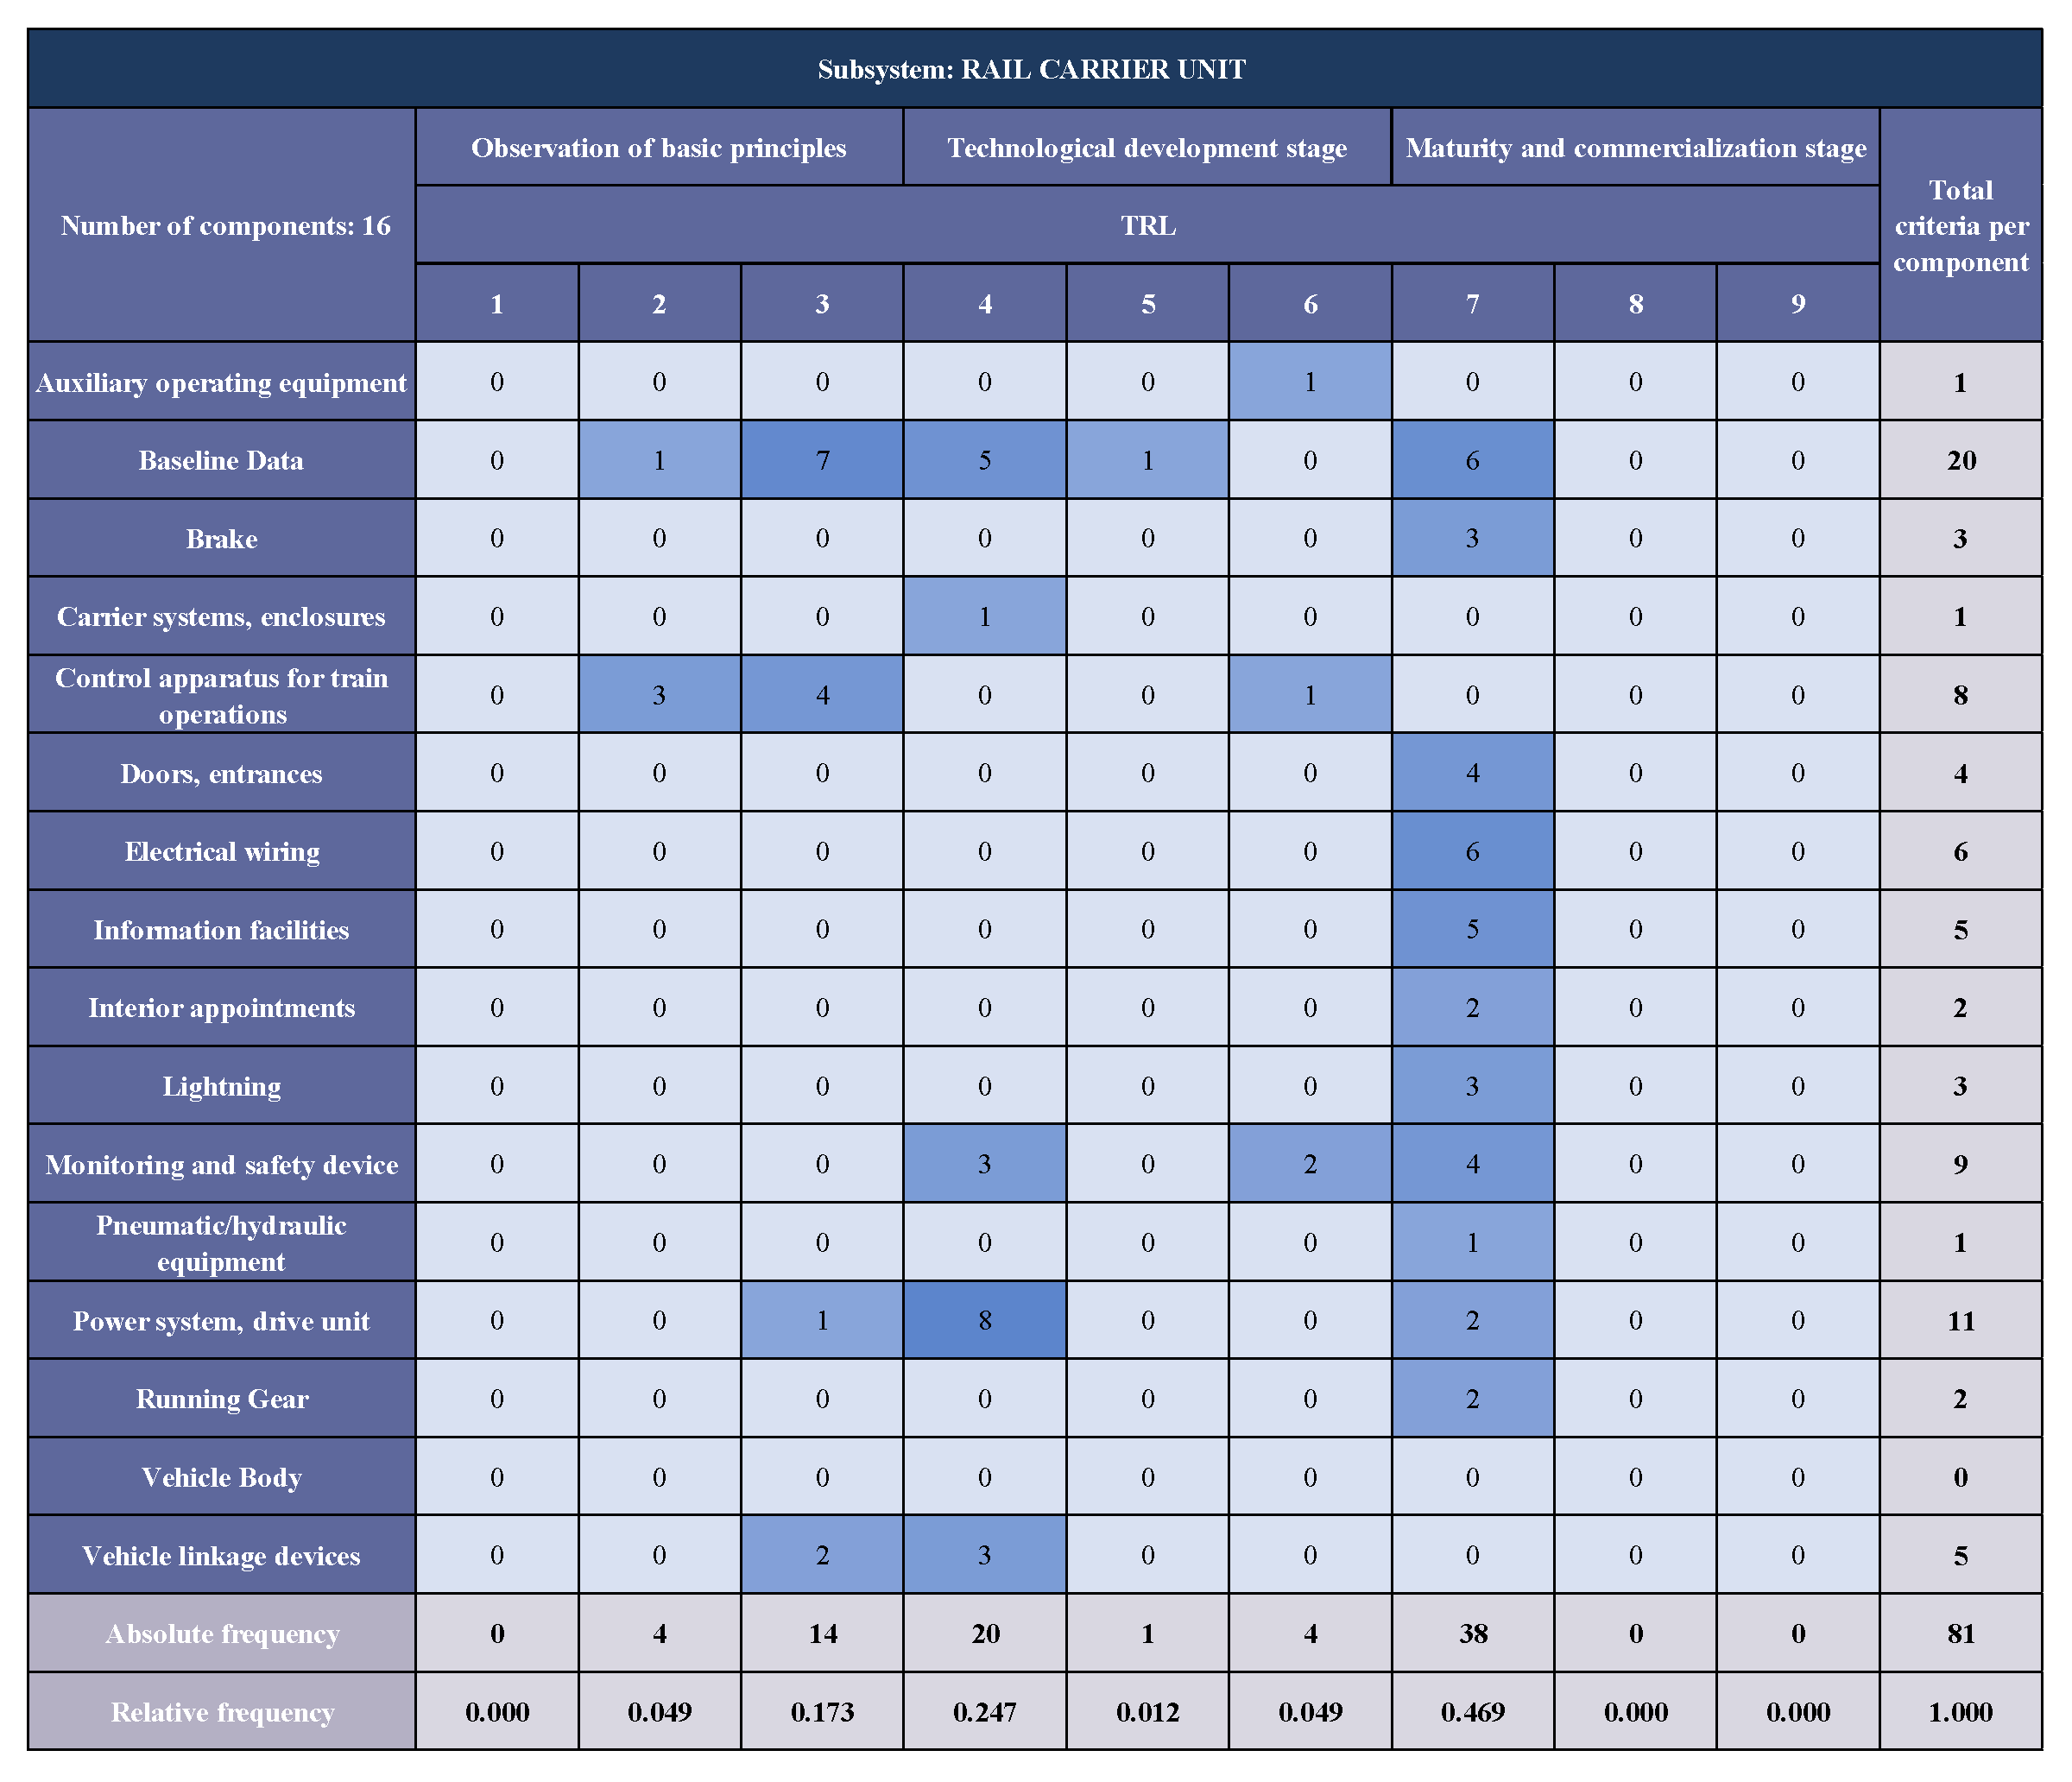
Figure 6.
Descriptive statistical results.
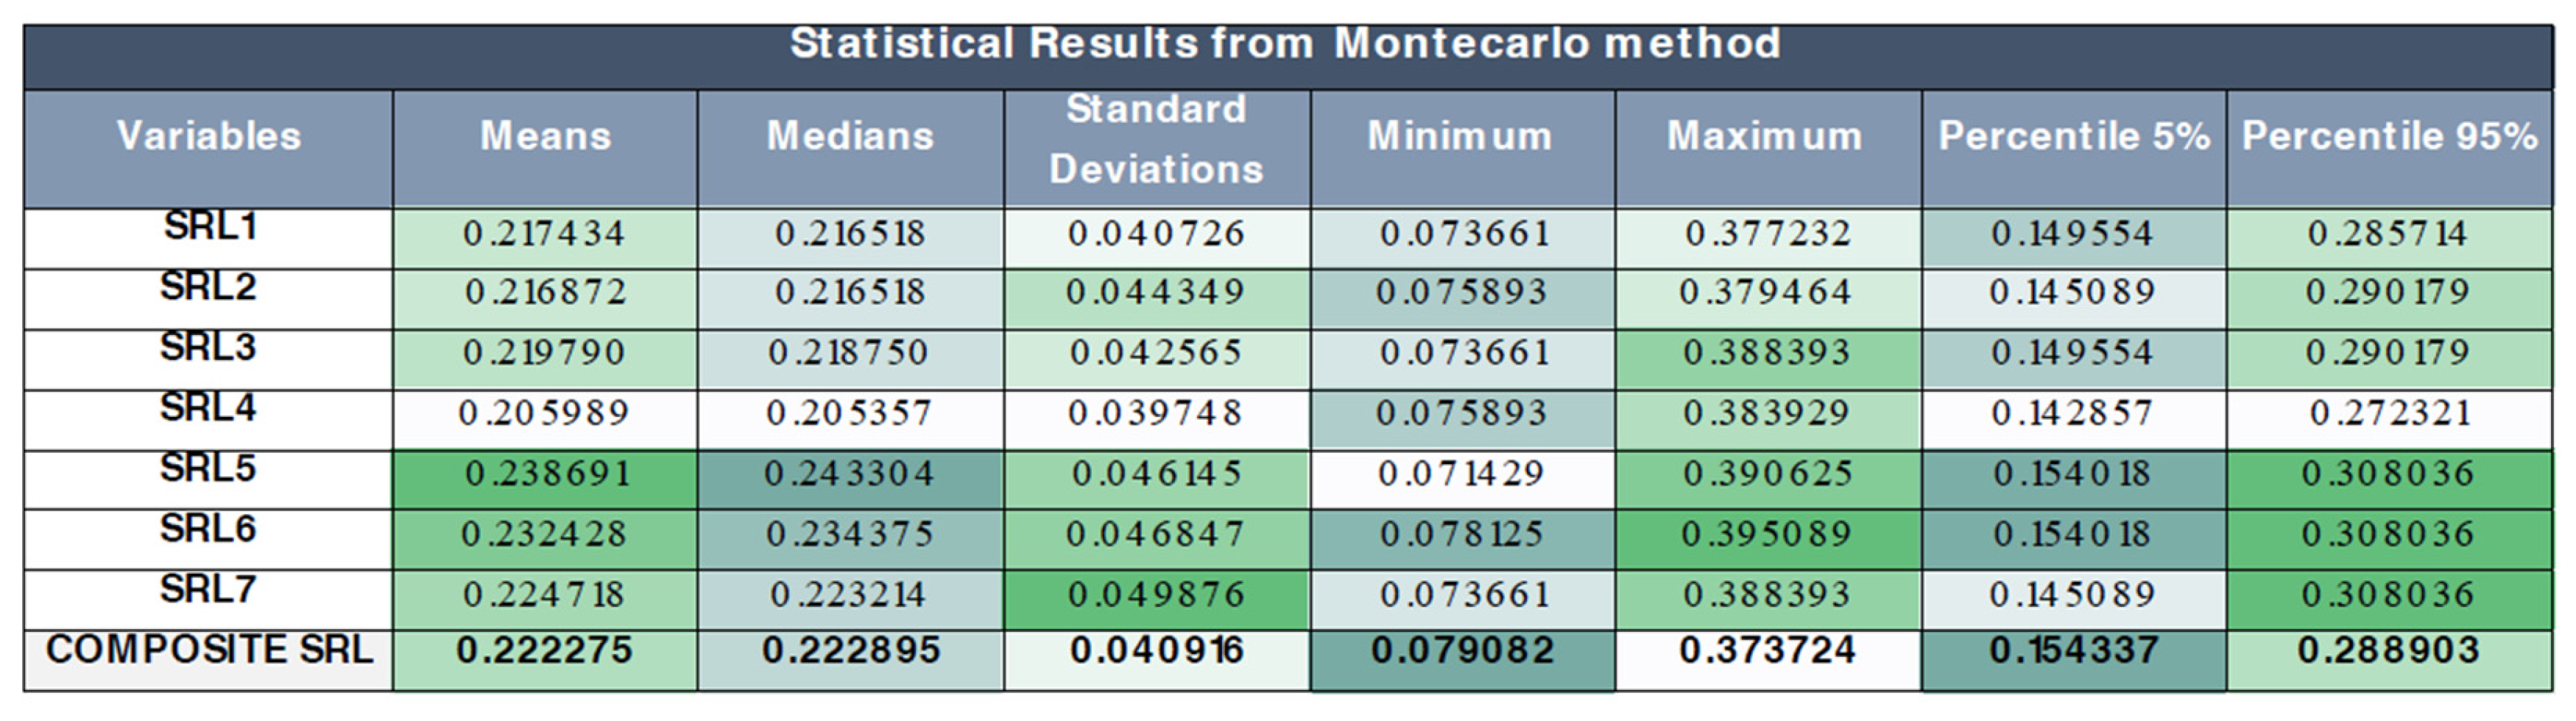
Figure 7.
Results for the CI analysis.
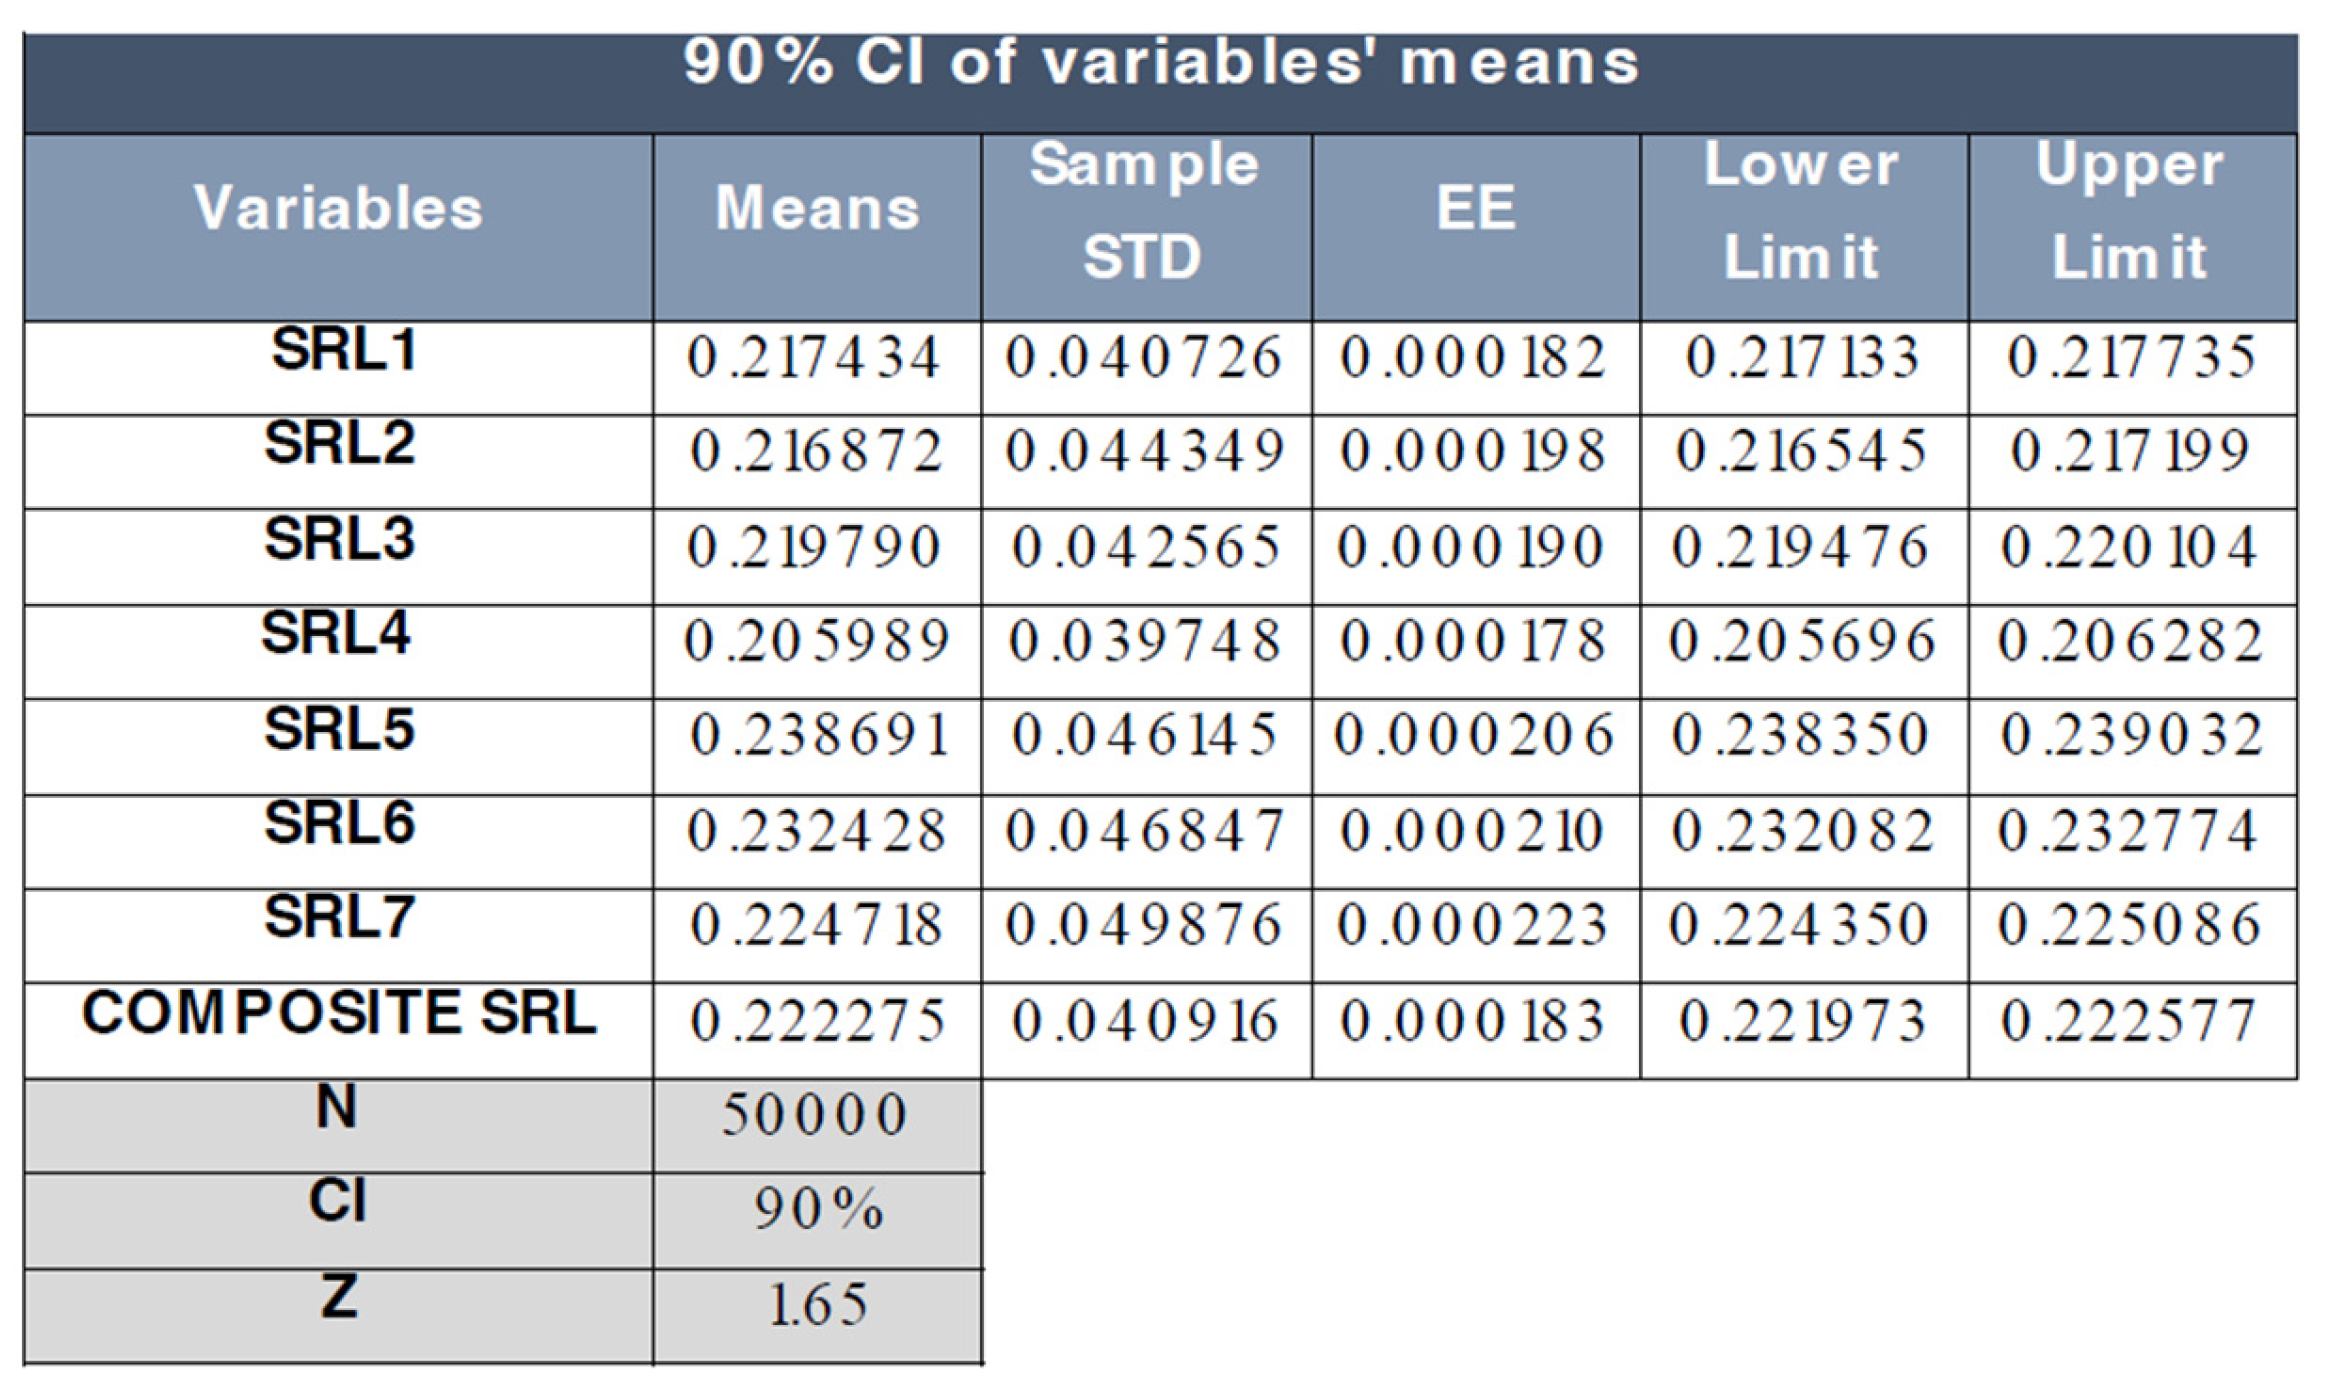
Figure 8.
90% CI of the analyzed variables.
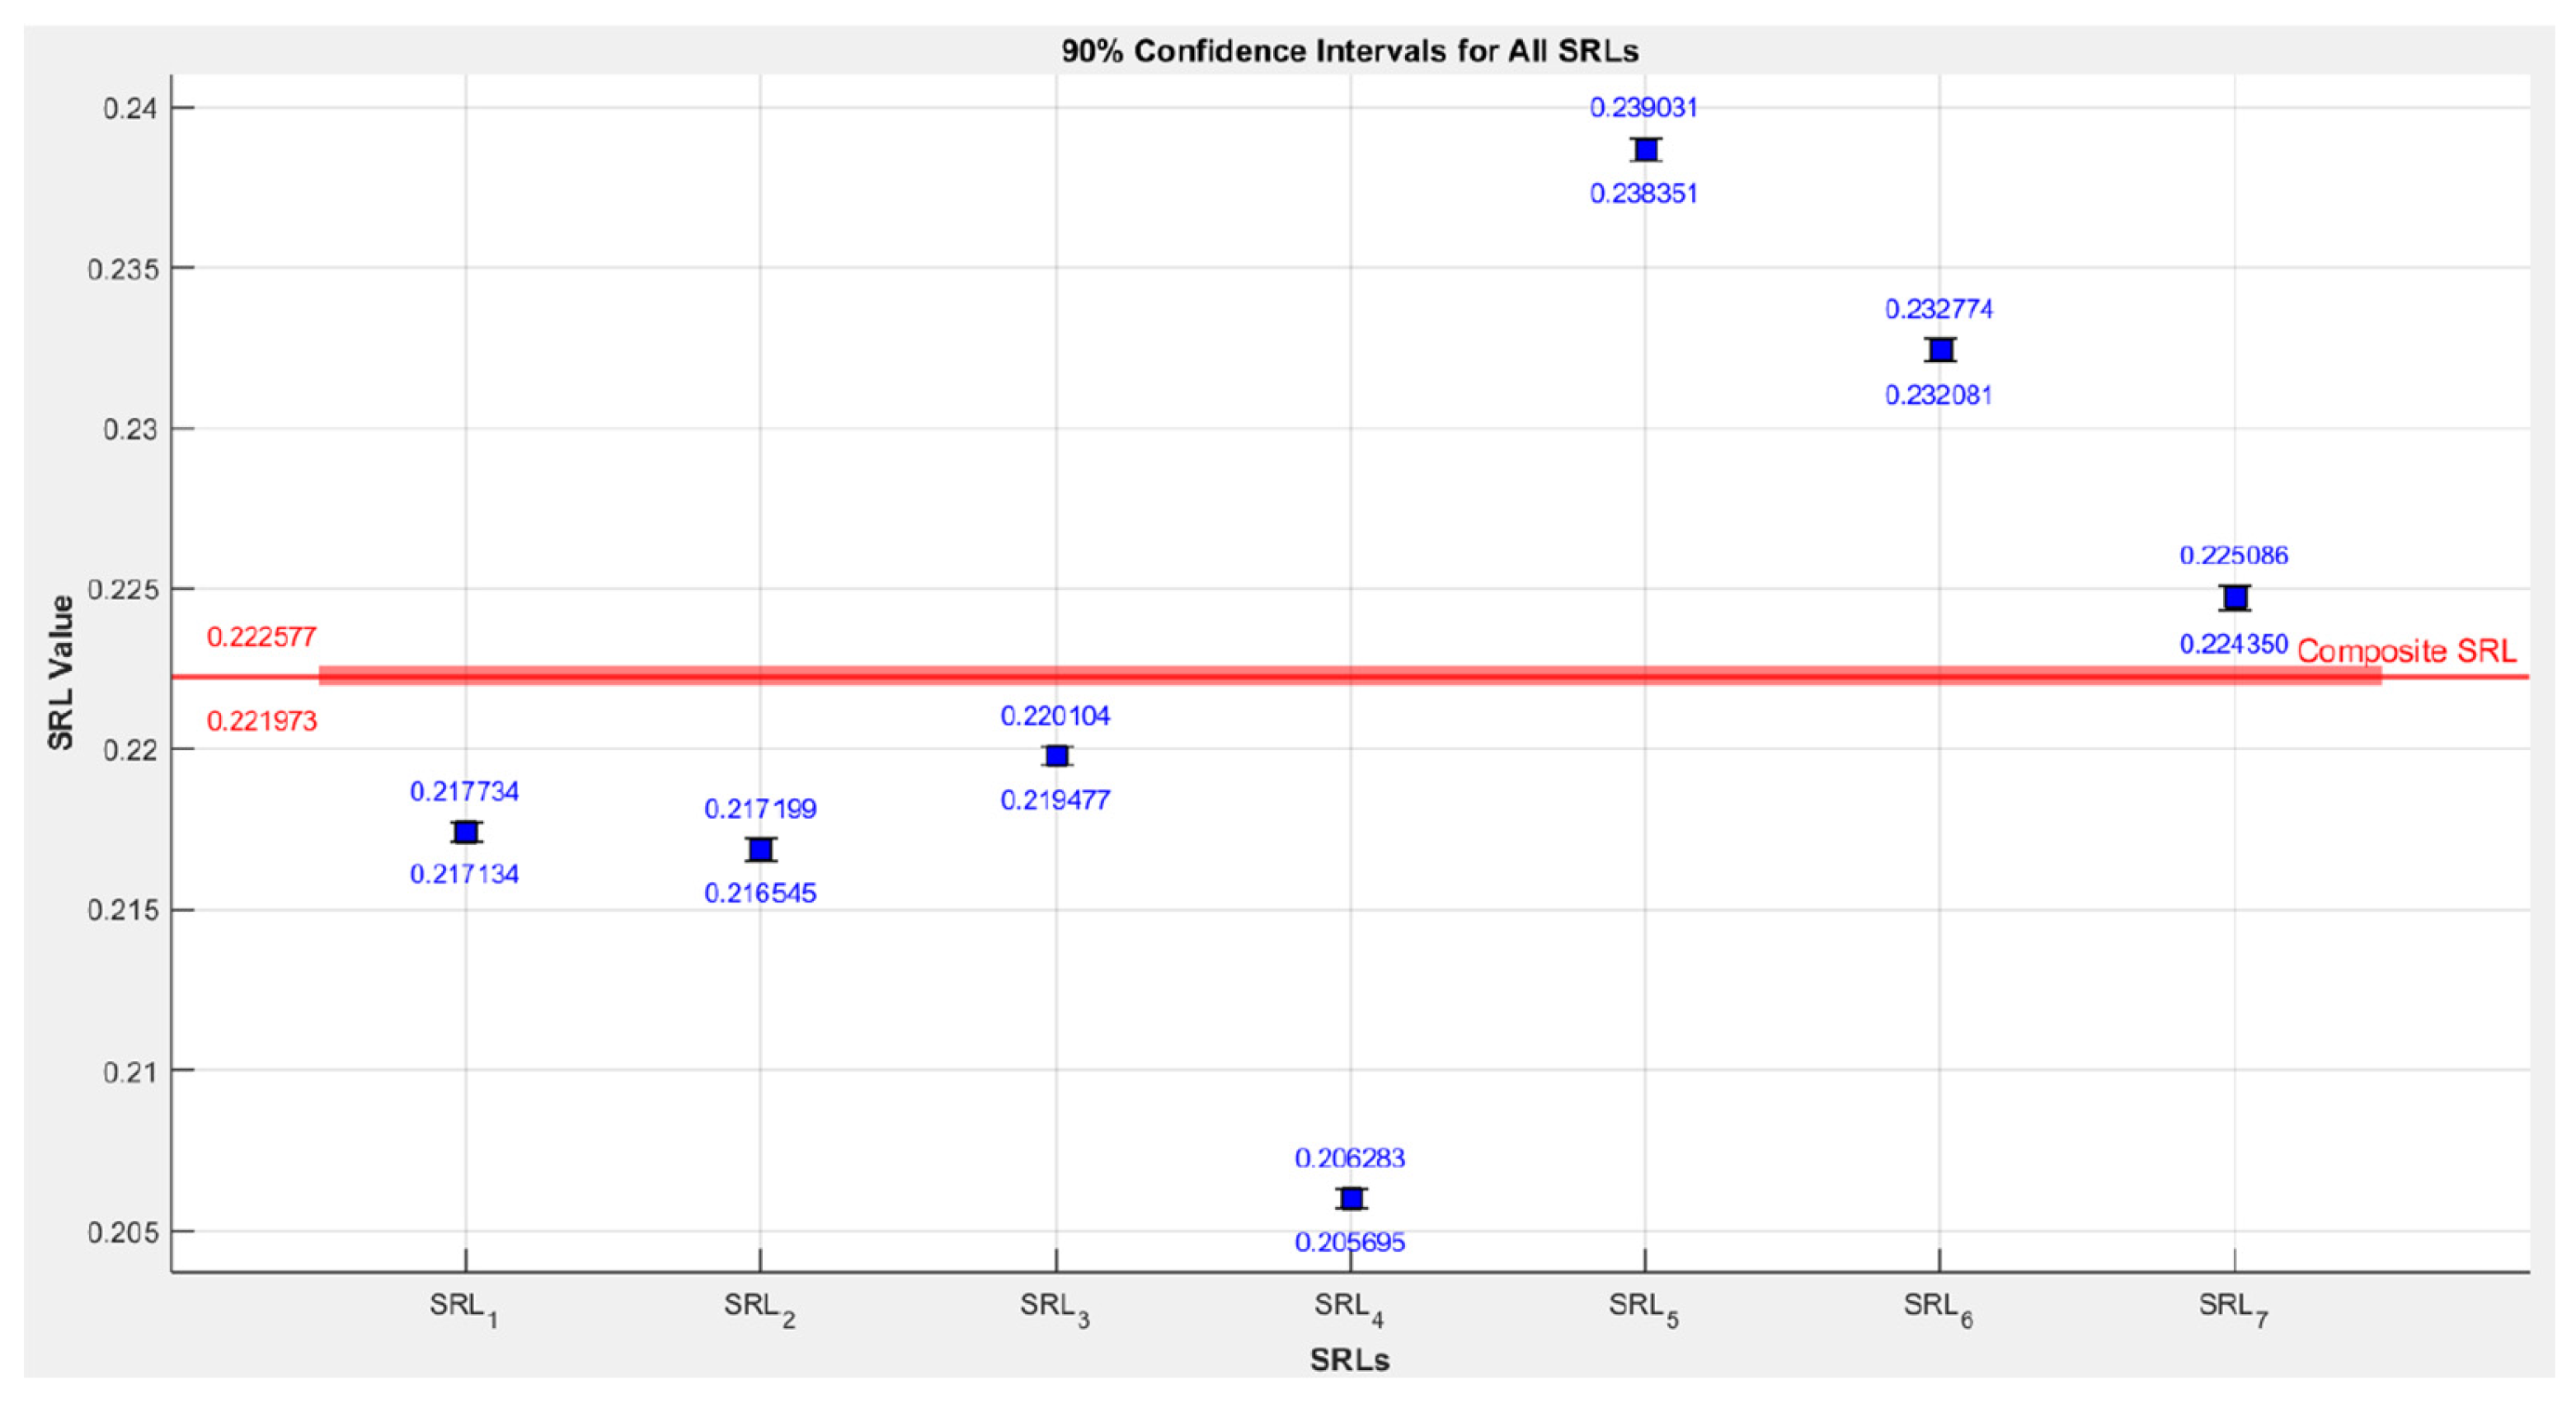
Figure 9.
Histogram for the CSRL.
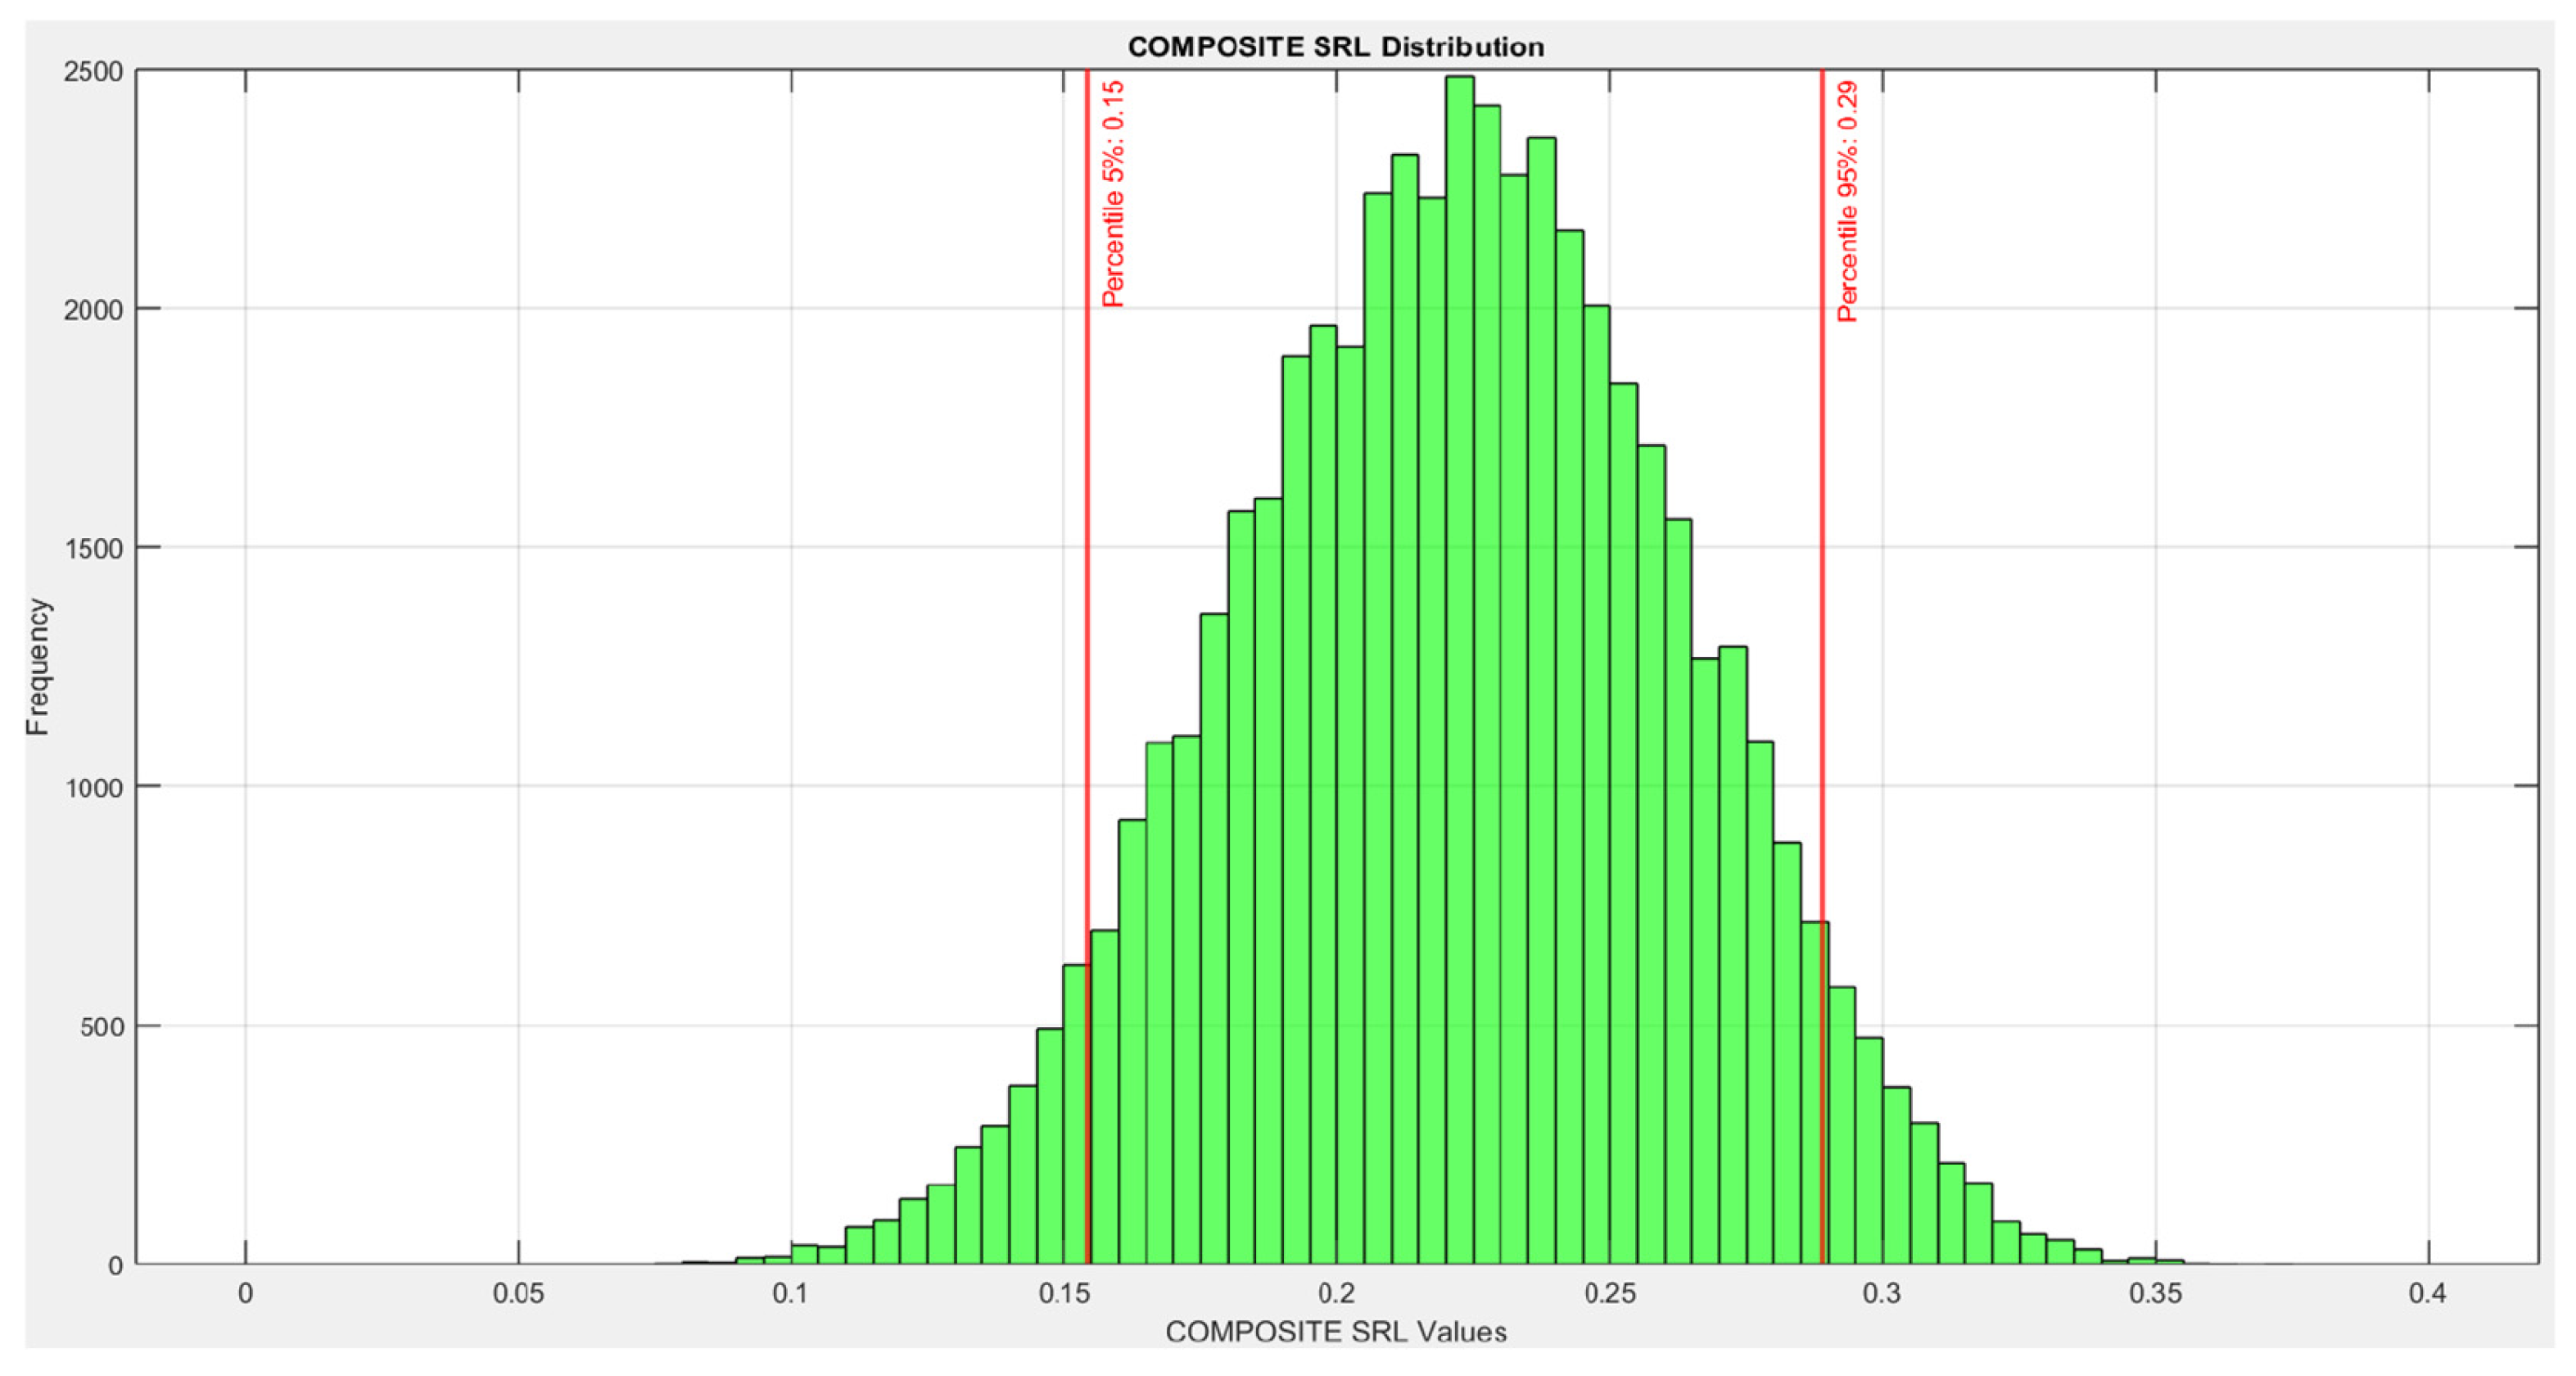
Figure 10.
Correlation analysis for SRLS.
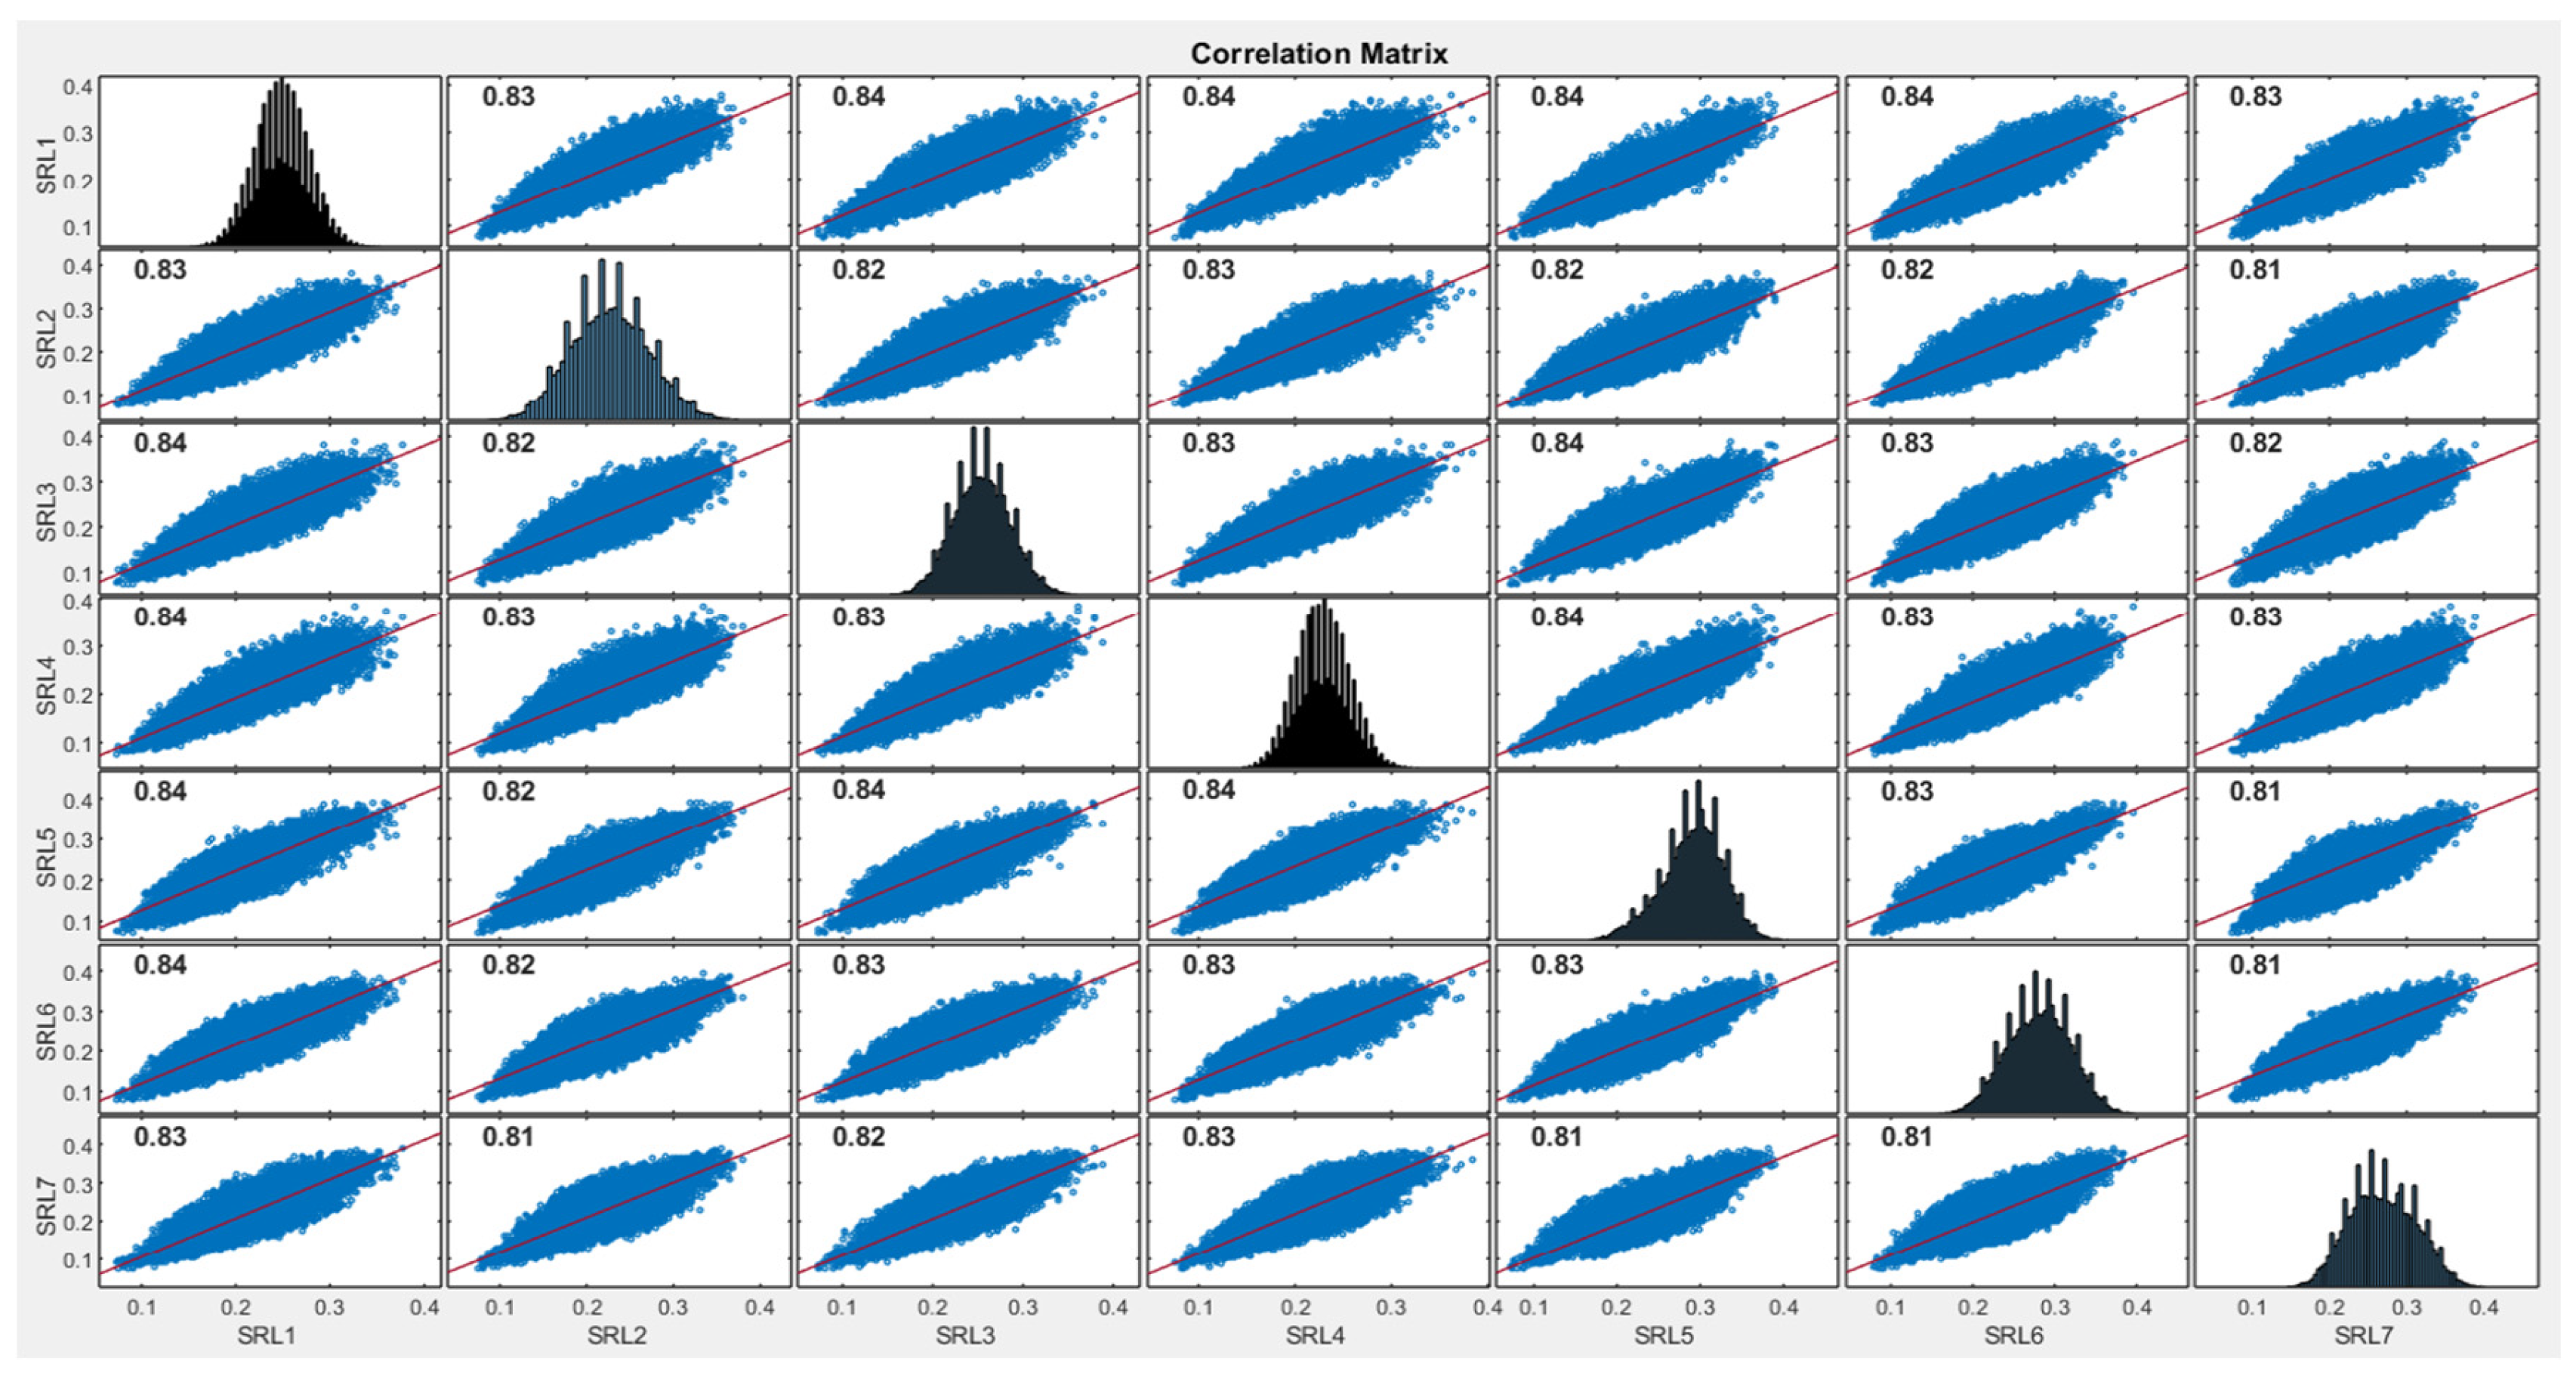
Figure 11.
Assumptions of the interrelationship between the components in the CSRL results.
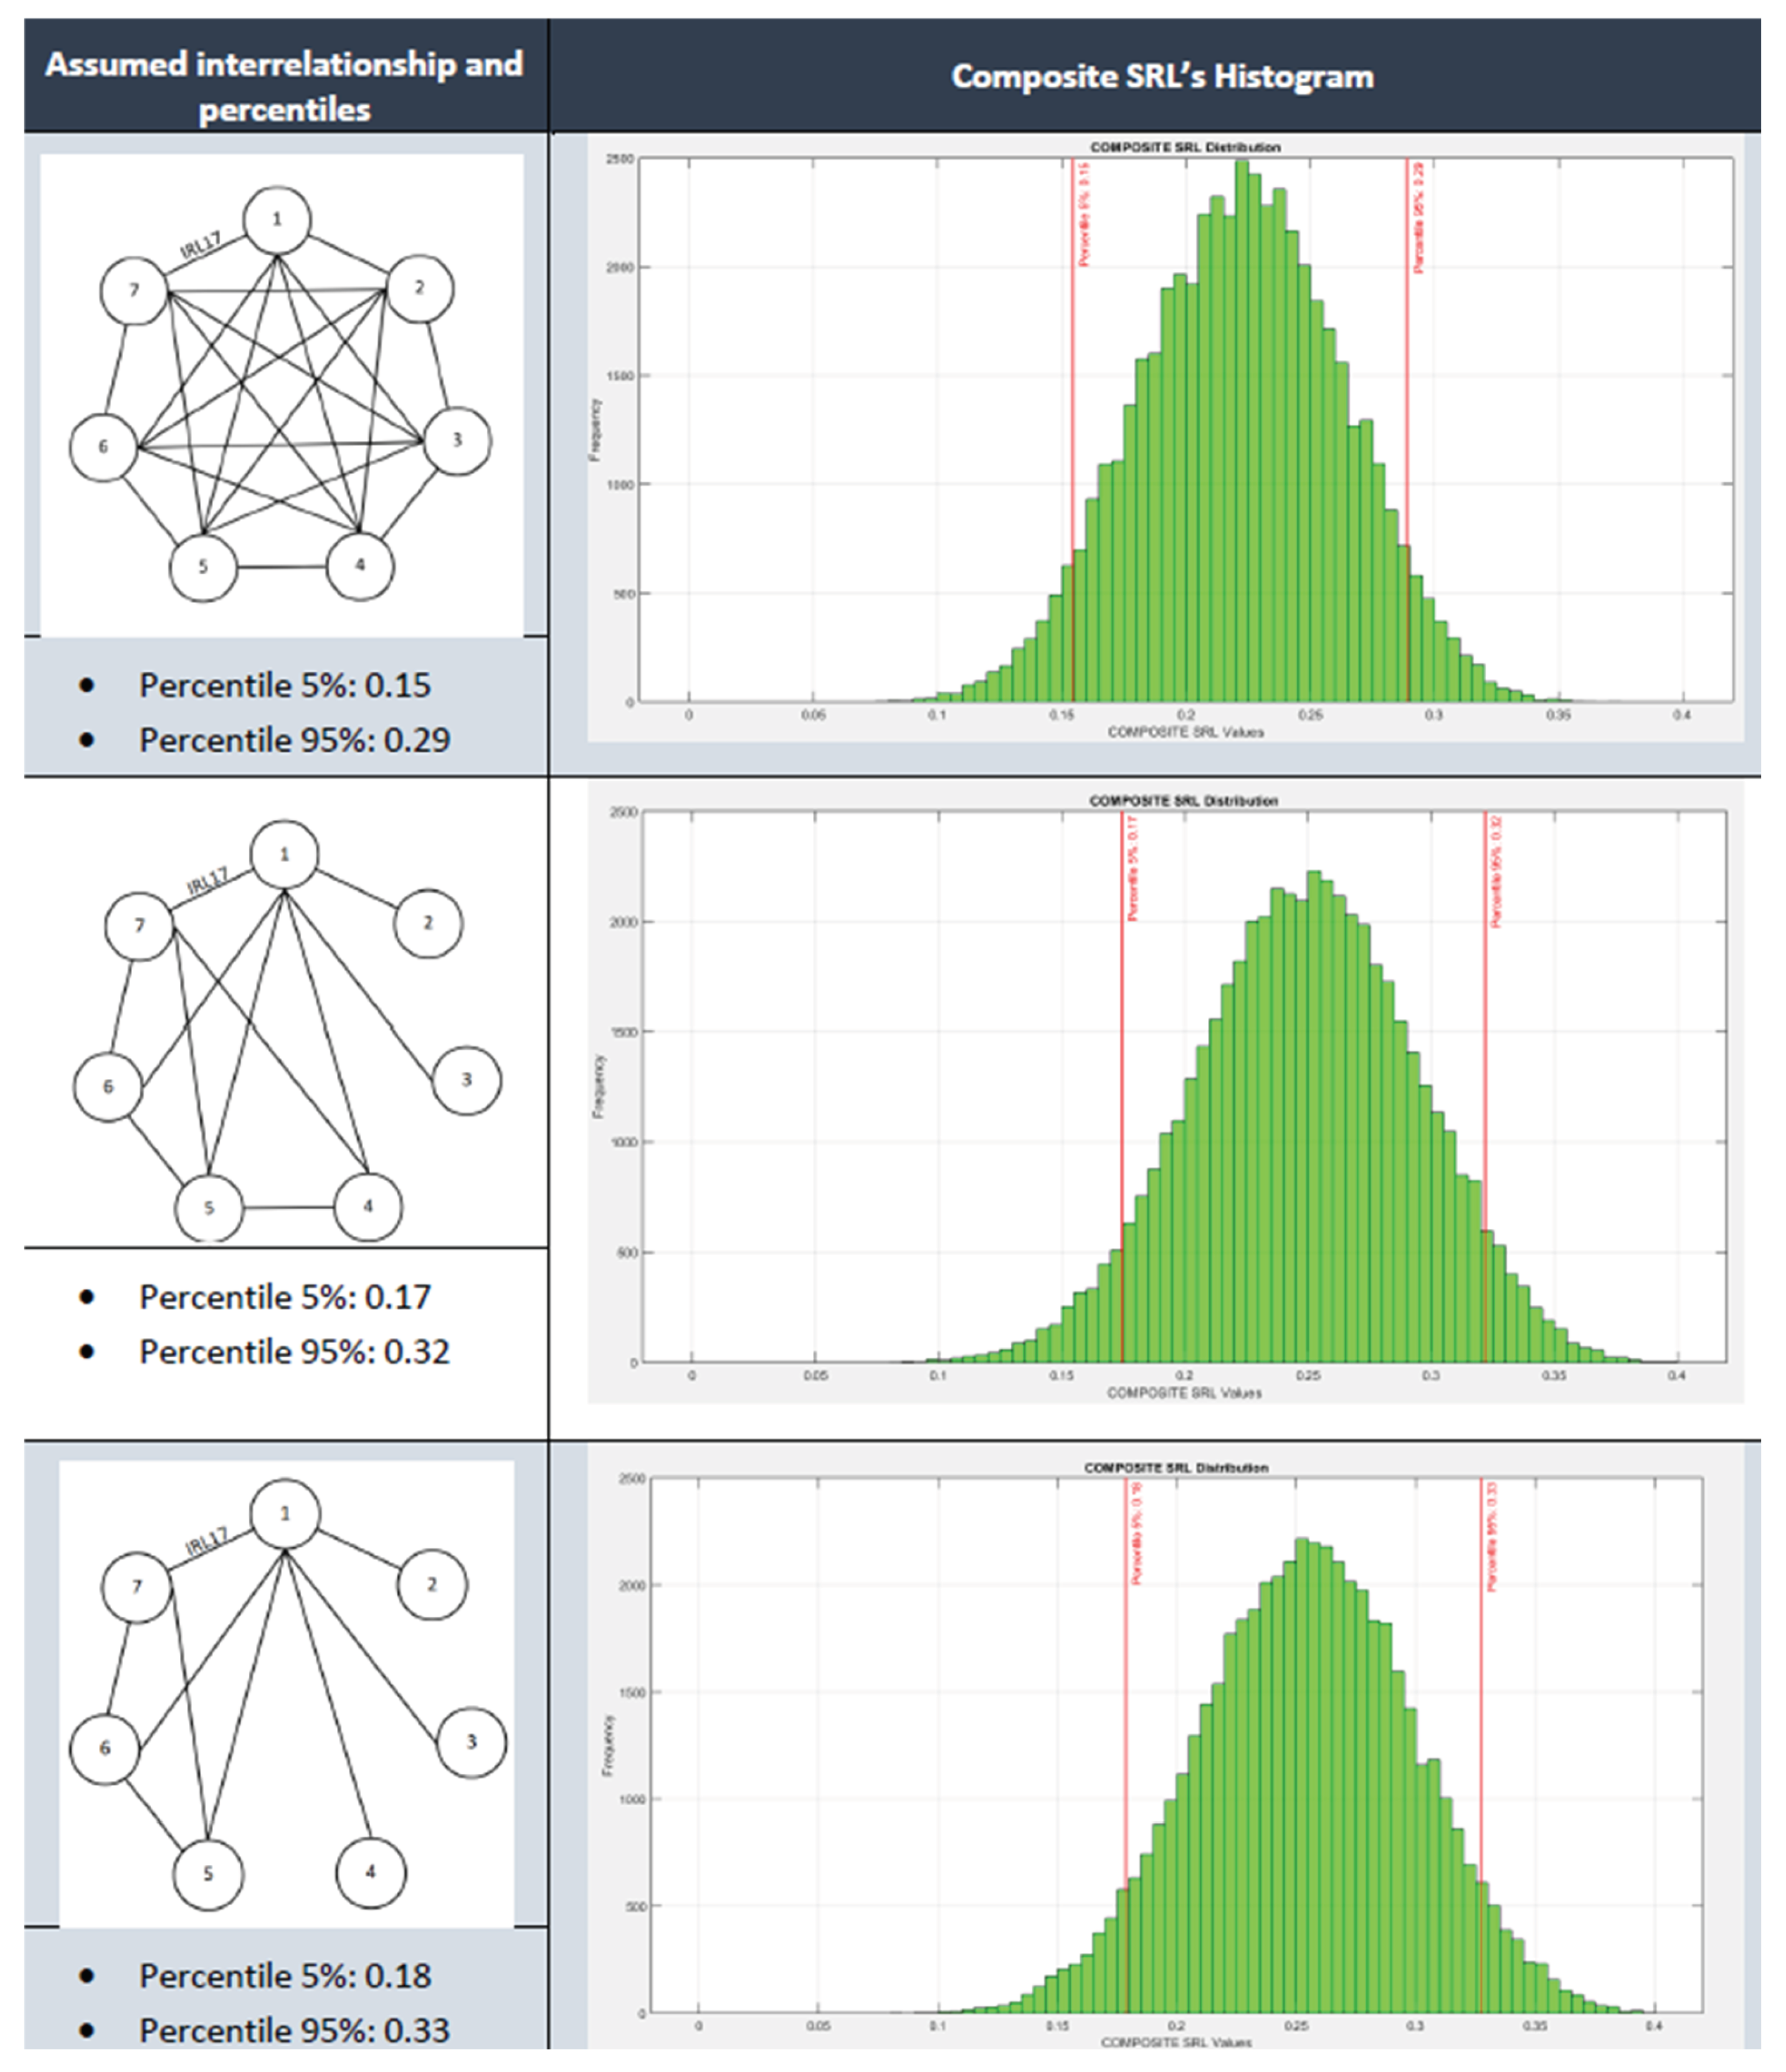
Table 1.
Taxonomy’s categories.
| Taxonomy Categories | Nature of the Method | Analytical Focus |
| Quantitative Evaluation Tools | Quantitative | Technology Maturity + System Integration |
| TRL/SRL Hybrid Approaches |
Hybrid | Technology Maturity + System Integration |
| Readiness Assessment Models |
Qualitative + Hybrid | Technology Maturity + System Integration + Stakeholder Involvement |
| System Integration Frameworks |
Quantitative + Hybrid | System Integration |
| Stakeholder-Centered Methods |
Qualitative | Stakeholder Involvement |
Table 2.
Criteria and References for the state-of-the art analysis.
| Criterion | References |
|
Quantitative Evaluation Tools |
[7] — Uses Petri nets to model how different system elements interact over time. This is applied for SRL capacity modelling. [8,9] — Applies Bayesian statistical methods to estimate TRL and feed SRL calculations. [9]— Explores how TRL values can be incorporated into cost prediction models. [10] — Presents an automated framework for validating engineering models and quantifying their maturity. [11] — Uses multi-criteria decision-making (MCDM). It involves the application of TOPSIS with entropy weighting (MCDM method). [12] — Compares tropical algebra vs. matrix algebra for ordinal SRL scoring. [13] — Introduces composite multi-index scoring method to assist decision-making in product design. [14] — Applies a fuzzy decision-making method (COPRAS) for readiness assessment. |
| TRL/SRL Hybrid Approaches | [3] — Combines TRL and IRL parameters using probability distributions to compute SRL. [15] — Integrates TRL, IRL and MRL into a unified system readiness metric. [16] — Standardizes how TRL, IRL and MRL should be normalized and mathematically combined to produce SRL. [17] — Introduces a formal relationship between TRL, IRL and SRL. [18,19] — Uses SRL index for integration with Value Engineering (VE) considerations. [19] — Computes Composite SRL from the combination of TRL and IRL. [20] — Provides a framework for System Readiness Assessment (SRA) through TRL and IRL. |
|
Readiness Assessment Models |
[21] — Proposes a TRL-based assessment model to evaluate the maturity of research projects. [22] — Introduces SRA toolkit for evaluating the readiness of public-sector services. [23]— Extends Technological Readiness Assessment (TRA) by explicitly incorporating reliability requirements. [24] — Develops a decision-support system built on maturity models. [25] — Creates a TRL-evaluation template for model-based design (MBD) methods/tools. [26] —Presents a stakeholder co-designed matrix tool for guidance and evaluation. [27] — Describes a programmatic maturity framework with gates from System Engineering perspective. [28] — Develops a domain-specific readiness algorithm using weighted criteria (AHP-based). [29] — Proposes a TRA for small and medium-sized enterprises SMEs (Industry 4.0). [30] — Applies TRL assessment of critical technology elements (CTEs). [31] — Reviews the use of TRL in systems engineering practice through surveys and reviews. |
| System Integration Frameworks | [32] — Proposes a multidimensional framework for assessing integration readiness in system-of-systems (SoS) environment. [33] — Includes integration parameter as an explicit TRL sub-attribute. [34] — Develops an improved TRA focused on hardware, software and interface integration. [35] — Uses architectural tools such as Design Structure Matrices (DSM/DMM) to evaluate IRL. |
| Stakeholder-Centered Methods | [36] — Incorporates stakeholder preferences into technology performance level (TPL) evaluation. It also integrates techno-economic assessment (TEA). [26] — Presents tools co-designed with stakeholders in information systems (IS) networks. [28] — Uses industry experts’ panels to assign weights to different readiness criteria (through AHP). [24] — Relies on practitioner inputs to develop maturity-model recommendations. |
Table 3.
Rail Carrier Unit TRL Evaluation.
| Rail Carrier Unit | |||
|---|---|---|---|
| Components | Min TRL | Max TRL | Number of criteria |
| Auxiliary operating equipment | 6 | 6 | 1 |
| Baseline data | 2 | 7 | 20 |
| Brake | 7 | 7 | 3 |
| Carrier systems, enclosures | 4 | 4 | 1 |
| Control apparatus for train operations | 2 | 6 | 8 |
| Doors, entrances | 7 | 7 | 4 |
| Electrical wiring | 7 | 7 | 6 |
| Information facilities | 7 | 7 | 5 |
| Interior appointments | 7 | 7 | 2 |
| Lightning | 7 | 7 | 3 |
| Monitoring and safety device | 4 | 7 | 9 |
| Pneumatic/hydraulic equipment | 7 | 7 | 1 |
| Power system, drive unit | 3 | 7 | 11 |
| Running gear | 7 | 7 | 2 |
| Vehicle linkage devices | 3 | 4 | 5 |
Table 4.
TRL probabilities for subsystems.
| Subsystem | Probabilities for each TRL | ||||||||
|---|---|---|---|---|---|---|---|---|---|
| TRL1 | TRL2 | TRL3 | TRL4 | TRL5 | TRL6 | TRL7 | TRL8 | TRL9 | |
| 1. Operations and Planning System | 0.000 | 0.190 | 0.143 | 0.587 | 0.064 | 0.016 | 0.000 | 0.000 | 0.000 |
| 2. Logistics, Storage, Ticketing and Booking | 0.000 | 0.429 | 0.048 | 0.190 | 0.238 | 0.095 | 0.000 | 0.000 | 0.000 |
| 3. PSI and Incident Management | 0.000 | 0.173 | 0.250 | 0.250 | 0.231 | 0.096 | 0.000 | 0.000 | 0.000 |
| 4. Handling System | 0.000 | 0.833 | 0.056 | 0.111 | 0.000 | 0.000 | 0.000 | 0.000 | 0.000 |
| 5. Transport Unit (TU) | 0.000 | 0.111 | 0.000 | 0.125 | 0.056 | 0.000 | 0.708 | 0.000 | 0.000 |
| 6. Rail Carrier Unit (RCU) | 0.000 | 0.049 | 0.173 | 0.247 | 0.013 | 0.049 | 0.469 | 0.000 | 0.000 |
| 7. Coupling System | 0.000 | 0.278 | 0.167 | 0.167 | 0.028 | 0.000 | 0.360 | 0.000 | 0.000 |
Table 5.
IRL probabilities.
| Assignation of IRL probabilities | |||||
|---|---|---|---|---|---|
| Integration of subsystem i with subsystem j | Integration of subsystem i with itself | ||||
| IRL = 4 | IRL = 5 | IRL = 6 | IRL = 4 | IRL = 5 | IRL = 6 |
| 0.25 | 0.5 | 0.25 | 0.1 | 0.1 | 0.8 |
Table 6.
System parameters used in the quantitative analysis.
| Monte Carlo method used parameters | ||
|---|---|---|
| 50000 | 7 | 7 |
Disclaimer/Publisher’s Note: The statements, opinions and data contained in all publications are solely those of the individual author(s) and contributor(s) and not of MDPI and/or the editor(s). MDPI and/or the editor(s) disclaim responsibility for any injury to people or property resulting from any ideas, methods, instructions or products referred to in the content. |
© 2026 by the authors. Licensee MDPI, Basel, Switzerland. This article is an open access article distributed under the terms and conditions of the Creative Commons Attribution (CC BY) license (http://creativecommons.org/licenses/by/4.0/).
Copyright: This open access article is published under a Creative Commons CC BY 4.0 license, which permit the free download, distribution, and reuse, provided that the author and preprint are cited in any reuse.


