
Submitted:
07 January 2026
Posted:
08 January 2026
You are already at the latest version
Abstract
Tourism destinations exposed to chronic natural hazards require robust analytical frameworks to understand and prioritize the factors that sustain post-disaster resilience. This study examines Baños de Agua Santa (Ecuador), a volcano-exposed destination whose long recovery trajectory illustrates the complexity of socioecological adaptation. Using a multidi-mensional FAHP model grounded in expert judgments, eight dimensions and fifty-six criteria were evaluated through fuzzy triangular numbers and the extended analysis method of Chang to capture uncertainty and ambiguity in decision-making. Results show a consistent and hierarchical structure of resilience, with experiential, economic-entrepreneurial, and sociocommunitarian dimensions emerging as the most influential drivers of post-disaster adaptability. Fifteen criteria—primarily perceptual, community-based, and endogenous—achieved “very high impact” status, including risk perception, basic education, individual resilience capacities, institutional coordination, and entrepreneurial environment. Conversely, limited healthcare infrastructure, low economic diversification, and national-level vulnerabilities were identified as critical weaknesses. The study concludes that post-disaster recovery in Baños is shaped by a bot-tom-up dynamic emphasizing agency, learning, and socioecological memory, and proposes an evidence-based Action Matrix for adaptive governance to guide prioritized, time-phased interventions. The FAHP model proves effective for transparent, context-sensitive prioritization in highly uncertain tourism environments.
Keywords:
tourism resilience
; post-disaster recovery
; FAHP
; multi-criteria analysis
; volcanic risk
; adaptive governance
; socioecological systems
; Ecuador
1. Introduction
Tourism, a driver of economic growth, investment and regional development (Cheng & Zhang, 2020; Estevão & Costa, 2020; Urbani et al., 2025), ranks among the industries most exposed to external shocks, particularly natural disasters (Estevão & Costa, 2020; Guo et al., 2018a; Hu & Xu, 2022). The increasing frequency and intensity of hurricanes, wildfires, tsunamis and volcanic eruptions associated with climate change generate damage to infrastructure, image deterioration and protracted recovery processes (Cheng & Zhang, 2020; Liu-Lastres et al., 2020; Urbani et al., 2025).
In the face of this uncertainty (Chowdhury et al., 2019), resilience has become a key focus of research on sustainable tourism (Guo et al., 2018a). It is understood as the capacity of social-ecological systems to withstand, absorb, self-organise and recover while maintaining essential functions (Barbhuiya & Chatterjee, 2020; Carpenter et al., 2012; Fountain & Cradock-Henry, 2020; Herrera-Enríquez & Rodríguez-Rodríguez, 2016) and, where possible, to improve their condition (“building back better”) (Lee & Pennington-Gray, 2025; Liu-Lastres et al., 2020; Rindrasih, 2018). This approach shifts the reactive logic of crisis management towards a proactive, resilience-centred perspective (Oliva & Lazzeretti, 2018; Putera et al., 2025).
1.1. Contextualisation of the Case: Baños de Agua Santa, Ecuador
Baños de Agua Santa operates under conditions of chronic risk (Few et al., 2017; Lane et al., 2003). Located at 1,800 m above sea level on the slopes of the Tungurahua volcano (5,023 m), it is exposed to pyroclastic flows, lahars, lava, earthquakes and landslides (Herrera-Enríquez & Rodríguez-Rodríguez, 2016; Lupiano et al., 2020; Few et al., 2017; Lane et al., 2003). The eruptive phase that began in 1999 forced the evacuation of 16,000 inhabitants and caused the collapse of tourism (Lane et al., 2003; Few et al., 2017).
Despite the official orders, residents returned owing to the need to secure their livelihoods (Few et al., 2017; Lane et al., 2003). After more than 25 years of adaptation, the United Nations recognised the town as a “Resilient City to Volcanic Events” (Herrera-Enríquez & Rodríguez-Rodríguez, 2016). Dependent on secular, religious and adventure tourism, the community promoted a marketing strategy that capitalised on the eruption as an attraction, combining recovery with a partial denial of risk (Few et al., 2017).
1.2. From Conceptual Assessment to Operational Prioritisation
Destination resilience is dynamic and multifaceted (Han & Yang, 2025), encompassing economic, social, institutional and infrastructure dimensions (Barbhuiya & Chatterjee, 2020; Guo et al., 2018b; Ha-Mim et al., 2024). The emphasis remains largely conceptual and exploratory (Guo et al., 2018a, 2018b; Lee & Pennington-Gray, 2025). Measuring it is crucial for building cumulative knowledge and guiding the allocation of resources (Lee & Pennington-Gray, 2025).
In disaster contexts, recovery requires urgent decision-making under conditions of scarcity (Khan et al., 2024; Mushtaha et al., 2025). To move from diagnosis (what confers resilience) to prioritisation (which factors are critical), a methodology is needed that quantifies and weights the drivers of resilience (Asadzadeh et al., 2017; Herrera-Enríquez & Rodríguez-Rodríguez, 2017; Lee & Pennington-Gray, 2025).
1.3. Research Gap and Study Significance
The literature remains focused on the conceptual level, with a limited understanding of the drivers of resilience and vulnerability (Guo et al., 2018b). There is a need to move from the “what” to the “which” and “how much” through methods that estimate relative importance and guide efficient allocation (Asadzadeh et al., 2017; Lee & Pennington-Gray, 2025). Holistic frameworks that integrate economic, social, environmental and security interdependencies are lacking; partial lists still predominate (Mushtaha et al., 2025). Retrospective measurement contrasts with the prospective nature of resilience, which requires ex ante metrics (Lee & Pennington-Gray, 2025).
Methodologically, subjective biases persist (e.g. in the assessment of social capital) and, even when MCDA is employed, indicator selection is often ad hoc, undermining comparability and validity (Ha-Mim et al., 2024; Lv et al., 2024). Long-term resilience objectives are rarely articulated in conjunction with immediate needs, nor are allocation dilemmas under severe constraints explicitly incorporated (Mushtaha et al., 2025).
This study addresses the gap through two contributions: (i) an actionable diagnosis of critical factors in a highly vulnerable destination, to target resources at the leverage points with the greatest post-disaster impact; and (ii) a robust framework of eight dimensions—regional-economic, firm-level economic, socio-regional, socio-community, institutional, infrastructure, ecological and experiential—that specifies 56 criteria, consistent with a systemic approach (Mushtaha et al., 2025). The framework is operationalised through the Fuzzy Analytic Hierarchy Process (FAHP), which combines AHP and fuzzy logic to capture ambiguity in expert judgements (Das et al., 2024), yielding a hierarchical architecture that is coherent with the socio-ecological paradigm and articulated across macro-territorial, micro-enterprise and community scales.
2. Theoretical Framework: Critical Dimensions of Resilience
Resilience analysis seeks to assess the capacity of the system to withstand and adapt (Asadzadeh et al., 2017; Parsons et al., 2016). A holistic perspective balances economic, social and environmental capital in order to sustain strong and sustainable communities (Gocer et al., 2024; Lin et al., 2021). For post-disaster tourism recovery in Baños, eight dimensions are prioritised that integrate macro (territorial) and micro (business and community) perspectives, in line with current frameworks (Badoc-Gonzales et al., 2022; Barbhuiya & Chatterjee, 2020; L.-W. Liu et al., 2024):
A. Regional-economic resilience. The region’s capacity to absorb and recover from the shock (Cheng & Zhang, 2020; Urbani et al., 2025). It includes diversification—tourism dependence heightens vulnerability in Baños—employment, equity and socio-economic vulnerability (Cheng & Zhang, 2020; Chouhan et al., 2023; Yadav & Barve, 2017). A resilient economy mobilises investment and raises local incomes (Cheng & Zhang, 2020).
B. Firm-level economic resilience. At the micro level, it measures the capacity of tourism organisations and micro, small and medium-sized enterprises (MSMEs) to withstand, adapt and resume operations (Badoc-Gonzales et al., 2022; Nguyen et al., 2022; Praptika et al., 2024). Key factors include entrepreneurial vision, opportunity- and innovation-driven entrepreneurship (Ribeiro et al., 2025) and planning (business continuity and proactive preparedness) to mitigate impacts (Nguyen et al., 2022).
C. Socio-regional resilience. This encompasses education, social vulnerability (poverty and gender) and cultural identity, factors that shape risk-coping capacity and residents’ attitudes during recovery (Parsons et al., 2016; Chouhan et al., 2023; Pu & Chang-Richards, 2024; Yadav & Barve, 2017; Liu-Lastres et al., 2020).
D. Socio-community resilience. This dimension emphasises social capital and networks: cohesion and mutual assistance, leadership, inter-institutional and peer trust, and social responsibility; all of these support self-organisation and adaptability (Guo et al., 2018b; C.-F. Liu & Mostafavi, 2025; Ruslanjari et al., 2025; Gu et al., 2025; Hu & Xu, 2022; Herrera-Enríquez & Rodríguez-Rodríguez, 2017).
E. Institutional resilience. This comprises governance, policies and processes for risk management—prevention, mitigation and public–private–community coordination; the existence of plans and drills is a key indicator (Al-Manji et al., 2021; Badoc-Gonzales et al., 2022; Carpenter et al., 2012; Hu & Xu, 2022; Praptika et al., 2024).
F. Infrastructure resilience. The physical capital that underpins livelihoods: the availability and functioning of critical infrastructure (services, health care and urban planning with a risk-sensitive focus) for effective response and sustained recovery (Liu-Lastres et al., 2020; Asadzadeh et al., 2017; Guo et al., 2018b; Ma et al., 2024; Mushtaha et al., 2025).
G. Ecological resilience. The tourism–environment interface in a hazardscape such as Baños: exposure, biodiversity protection and restoration capacity. Reconstruction should avoid further damage and promote assisted natural restoration, in line with the Building Back Better approach (Fountain & Cradock-Henry, 2020; Badoc-Gonzales et al., 2022; Gocer et al., 2024; Zhao et al., 2023).
H. Experiential resilience. The tourist component: risk and safety perception, experience and expectations. Perceived risk suppresses demand, whereas safety and trust facilitate the return of tourists (L.-W. Liu et al., 2024; Urbani et al., 2025; Fountain & Cradock-Henry, 2020; Putera et al., 2025).
3. Study Aim and Contribution
Measuring resilience through indicators is essential for establishing baselines and allocating resources; in dynamic environments, multicriteria decision analysis (MCDA) methods make it possible to weight alternatives and criteria under conditions of limited information (Lee & Pennington-Gray, 2025; Ha-Mim et al., 2024; Zhang et al., 2023).
The Fuzzy Analytic Hierarchy Process (FAHP) combines AHP and fuzzy sets to manage uncertainty and ambiguity in expert judgements, providing a structured evaluation and effective prioritisation (Das et al., 2024; Herrera-Enríquez & Rodríguez-Rodríguez, 2017; Zhang et al., 2023; Khan et al., 2024).
Aim: to prioritise the relative importance of eight dimensions and their associated criteria that shape critical resilience for post-disaster tourism recovery in Baños de Agua Santa, using FAHP.
Contribution: (i) an actionable diagnosis of critical factors to target resources at the levers with the greatest impact (Mushtaha et al., 2025); and (ii) a transparent, replicable FAHP protocol for weighting and prioritising resilience dimensions in post-disaster tourism, thereby strengthening measurement tools (Lee & Pennington-Gray, 2025).
4. Materials and Methods
4.1. Sampling Strategy and Participant Selection
For the multidimensional resilience model and its prioritisation through FAHP, purposive and theoretical sampling was employed, which is appropriate when credibility depends on situated experience and direct involvement in risk management and tourism recovery. This approach ensured informants with cumulative knowledge of the socio-economic and territorial dynamics of Baños de Agua Santa and of its response to disruptive events.
Selection followed explicit inclusion criteria:
(i) demonstrable experience in risk management, disaster studies or tourism recovery;
(ii) direct participation in eruptions, evacuations, reconstruction or local governance;
(iii) technical or academic knowledge of Tungurahua or territories with comparable risks.
Professionals without a verifiable track record, without a connection to the area or with conflicts of interest were excluded.
Under these criteria, the FAHP panel comprised 26 experts, ensuring cognitive diversity and representation of the model’s eight dimensions. It included a specialist from the Geophysical Institute (with more than 20 years’ experience monitoring Tungurahua), the former mayor of Baños, the local coordinator of the Risk Management Secretariat, an academic with a trajectory in eruption studies and an international adviser with experience in the 2010 earthquake–tsunami in Chile. They were joined by experts in regional and business economics, socio-regional and community dynamics, tourist experience, infrastructure, institutions and ecology. This structure is consistent with standards that regard panels of 20 or more as adequate for fuzzy weighting.
Complementarily, evidence was collected from approximately 600 local actors through purposive sampling: 306 businesses, 290 households and 372 tourists. This volume made it possible to normalise and contrast the model indicators using z-scores, min–max rescaling and categorisation, thereby providing representativeness in relation to the territory’s socio-economic structure and consistency with the requirements of FAHP.
The model is organised in a multidimensional, hierarchical form, with eight dimensions grouping 56 resilience criteria: regional-economic, firm-level economic, socio-regional, socio-community, institutional, infrastructure, ecological and experiential.
To address complexity, uncertainty and ambiguity, the Fuzzy Analytic Hierarchy Process (FAHP) is employed, an evolution of Saaty’s AHP that incorporates triangular fuzzy numbers (TFNs) to overcome the rigidity of scales and capture the imprecision and subjectivity of expert judgements (Chang’s 1996 extent analysis method).
4.2. Modelling Phases
Selection and validation of criteria. A total of 103 criteria were identified and refined to 56 by assessing their relevance, functionality, availability, reliability and usefulness. The weighting of these judgements was carried out using FAHP by an interdisciplinary panel (statistics, economics, sociology and management).
Hierarchical weighting. FAHP was applied to rank and weight the eight dimensions (upper level) and the 56 criteria (lower level), based on the judgements of 26 experts in risk management and recovery. The consistency ratio (CR) was used to ensure the reliability of the matrices. To guarantee the internal coherence of the pairwise comparisons, matrix consistency was evaluated using Saaty’s CR. Only matrices with CR < 0.1 were accepted, ensuring that expert judgements maintained an adequate level of consistency for the application of FAHP.
Structural adjustment. Weights were normalised to correct for the unequal number of criteria per dimension, thereby allowing comparability in aggregation.
4.3. Aplicación Empírica y Tratamiento de Datos
The model was applied in Baños de Agua Santa (Ecuador), which has been affected by 25 years of activity of the Tungurahua volcano.
- Primary sources: surveys of 306 businesses, 290 households, community leaders, technical staff and scientists, together with interviews with experts.
- Secondary sources: official records and databases (e.g. INEC, census data).
Qualitative and quantitative indicators were normalised to the [0,1] interval using z-scores, scale categorisation, above/below-average thresholds and min–max rescaling. Multicriteria evaluation followed Chang’s (1996) extent analysis: FAHP represents the uncertainty of human judgements through TFNs, mitigating the rigidity and inconsistencies of strictly numerical assessments. The technique is particularly suitable when perceptions and expert knowledge are ambiguous and robust weights are required under conditions of uncertainty.
4.4. Representación Difusa de los Juicios Expertos
Chang’s (1996) FAHP method starts from the notion of a fuzzy number. Following Büyüközkan et al. (2004), it is understood as a special fuzzy set , where x takes its values on the real line , and is a continuous mapping from to the closed interval . A triangular fuzzy number can be denoted as . Its membership function is equal to:
Where , and y represent the lower and upper bounds of the support of , espectively, and m is the modal value of . When , this is a non-fuzzy number. The main operational laws for two triangular fuzzy numbers and are as follows:
Throughout this study, decision-makers use the linguistic weighting set W= , where IM denotes equal importance, MI denotes that one criterion is moderately more important than another, FI denotes strong importance of one criterion over another, MFI denotes very strong importance of one criterion over another, and EI denotes extreme importance of one criterion over another.
The triangular fuzzy conversion scale given in Table 1 is used to evaluate this model.
Fuente: Determining the Importance Weights for the Design Requirements in the House of Quality Using the Fuzzy Analytic Network Approach (Büyüközkan et al., 2004).
Once the concept of triangular fuzzy numbers is understood, the fuzzy AHP extent analysis model (Büyüközkan et al., 2004) proposed by Chang (1996), Chang and Yang (2011) and Zhu et al. (1999) is described as follows:
If is a set of objects and is a set of goals, then, according to Chang’s (1996) extent analysis method, the extent analysis is carried out for each object with respect to each goal; in this way, m extent values can be obtained for each goal valores de los objetos; de este modo se pueden obtener para cada objetivo . Therefore, the m extent analysis values can be expressed using the following notation:
Where all are triangular fuzzy numbers.
Key steps of the model proposed by Chang (1996):
Step 1: The value of the -th object in the extent analysis is defined as:
To obtain , the fuzzy addition operation is performed on the extent analysis values for a particular matrix, such that:
To obtain , the fuzzy addition operation is applied to the values , such that:
The inverse vector of the equation is then computed as follows:
Step 2: The degree of possibility that is defined as:
and it can be expressed equivalently as follows:
Step 3: The degree of possibility that a convex fuzzy number is greater than k convex numbers is defined as:
Then, assuming that:
For The weight vector is then given by:
Where , are n elements
Step 4: Normalisation of the vector is presented as follows:
Where W is not a fuzzy number, but rather the set of weights for each matrix.
4.5. Empirical Application of the FAHP Model for Prioritising Resilience Dimensions
After outlining fuzzy logic and Chang’s extent analysis method, the next step is to show how these foundations are applied empirically to the prioritisation process. The initial matrix presented in Table 2 plays a central role: it synthesises, via the geometric mean, the experts’ pairwise comparisons, integrating the linguistic scale, the hierarchical structure, and triangular fuzzy numbers (TFNs). This matrix constitutes the starting point for calculating the fuzzy synthetic extent values and the degrees of possibility that enable dimensions to be compared under conditions of uncertainty.
The normalised matrix, considering for the values corresponding to the experts’ geometric means, is as follows:
Where
Since 0.018 ≤ 0.1, the matrix is consistent.
Saaty’s extent analysis method and the principles for comparing fuzzy numbers are used to obtain estimates of the weight vectors for the individual levels of a hierarchy (Chang, 1996). Based on the fuzzy values in Table 3, and applying the extent analysis method, the following fuzzy synthetic extent values are obtained:
A similar procedure is followed for the remaining criteria, yielding the following values:

Table 3.
Normalised data from experts in the dimensional analysis of resilience.
| Ecological | Economic–Business | Economic–Regional | Experiential | Infrastructure | Institutional | Socio-Community | Socio-Regional | Sum | Priority vector | |
| Ecological | 1.000 | 0.975 | 1.010 | 0.766 | 0.642 | 0.641 | 0.818 | 0.716 | 6.569 | 0.097 |
| Economic–Business | 1.059 | 1.000 | 0.888 | 0.827 | 0.526 | 0.843 | 0.844 | 0.845 | 6.834 | 0.101 |
| Economic–Regional | 1.047 | 1.184 | 1.000 | 0.592 | 0.578 | 0.833 | 0.766 | 0.761 | 6.760 | 0.100 |
| Experiential | 1.349 | 1.293 | 1.749 | 1.000 | 1.036 | 1.437 | 1.075 | 1.075 | 10.014 | 0.149 |
| Infrastructure | 1.619 | 1.948 | 1.782 | 1.000 | 1.000 | 1.131 | 1.011 | 0.897 | 10.388 | 0.154 |
| Institutional | 1.592 | 1.248 | 1.232 | 0.714 | 0.931 | 1.000 | 0.974 | 1.068 | 8.757 | 0.130 |
| Socio-Community | 1.279 | 1.267 | 1.335 | 0.974 | 1.031 | 1.075 | 1.000 | 1.027 | 8.988 | 0.133 |
| Socio-Regional | 1.442 | 1.215 | 1.351 | 0.974 | 1.064 | 0.990 | 1.048 | 1.000 | 9.084 | 0.135 |
| 10.387 | 10.131 | 10.347 | 6.847 | 6.809 | 7.950 | 7.535 | 7.389 | 67.394 |
Table 4.
Fuzzy synthetic vectors from experts for resilience dimensions.
| Dimensión | l | m | n |
| D1 | 0.05 | 0.10 | 0.20 |
| D2 | 0.05 | 0.10 | 0.22 |
| D3 | 0.05 | 0.10 | 0.21 |
| D4 | 0.07 | 0.15 | 0.31 |
| D5 | 0.08 | 0.16 | 0.32 |
| D6 | 0.06 | 0.13 | 0.26 |
| D7 | 0.06 | 0.13 | 0.28 |
| D8 | 0.07 | 0.13 | 0.28 |
Next, the weighting vectors for the value level of the hierarchy are computed on a comparative basis, considering the degree of possibility that , which is defined as:
where (x, y) is a pair such that and and . Let and be convex fuzzy numbers; then:
It follows that:
| D(D1>D2) | 0.992 | D(D2>D1) | 1.000 | D(D3>D1) | 1.000 | ||
| D(D1>D3) | 0.982 | D(D2>D3) | 0.990 | D(D3>D2) | 1.000 | ||
| D(D1>D4) | 0.717 | D(D2>D4) | 0.741 | D(D3>D4) | 0.732 | ||
| D(D1>D5) | 0.669 | D(D2>D5) | 0.695 | D(D3>D5) | 0.684 | ||
| D(D1>D6) | 0.818 | D(D2>D6) | 0.837 | D(D3>D6) | 0.835 | ||
| D(D1>D7) | 0.800 | D(D2>D7) | 0.820 | D(D3>D7) | 0.816 | ||
| D(D1>D8) | 0.791 | D(D2>D8) | 0.812 | D(D3>D8) | 0.808 | ||
| D(D4>D1) | 1.000 | D(D5>D1) | 1.000 | D(D6>D1) | 1.000 | ||
| D(D4>D2) | 1.000 | D(D5>D2) | 1.000 | D(D6>D2) | 1.000 | ||
| D(D4>D3) | 1.000 | D(D5>D3) | 1.000 | D(D6>D3) | 1.000 | ||
| D(D4>D5) | 0.956 | D(D5>D4) | 1.000 | D(D6>D4) | 0.901 | ||
| D(D4>D6) | 1.000 | D(D5>D6) | 1.000 | D(D6>D5) | 0.855 | ||
| D(D4>D7) | 1.000 | D(D5>D7) | 1.000 | D(D6>D7) | 1.000 | ||
| D(D4>D8) | 1.000 | D(D5>D8) | 1.000 | D(D6>D8) | 0.976 | ||
| D(D7>D1) | 1.000 | D(D8>D1) | 1.000 | ||||
| D(D7>D2) | 1.000 | D(D8>D2) | 1.000 | ||||
| D(D7>D3) | 1.000 | D(D8>D3) | 1.000 | ||||
| D(D7>D4) | 0.925 | D(D8>D4) | 0.930 | ||||
| D(D7>D5) | 0.881 | D(D8>D5) | 0.886 | ||||
| D(D7>D6) | 1.000 | D(D8>D6) | 1.000 | ||||
| D(D7>D8) | 0.996 | D(D8>D7) | 1.000 |
The degree of possibility that a convex fuzzy number is greater than convex numbers is defined as:Then, assuming that: For The weight vector is:
Where:
Normalising, the weight vector becomes:
The vector corresponds to the weighted priorities of the eight resilience dimensions. For each dimension, the same procedure is applied to the corresponding criteria , and the results are then integrated into the multicriteria decision model by applying the appropriate structural adjustment.
5. Results
Using Chang’s (1996) extent analysis method, the linguistic judgements were converted into triangular fuzzy numbers (TFNs) to capture uncertainty in the comparison of criteria. The extent analysis values, the degrees of possibility between criteria, and the composite possibility vector were then computed, culminating in the final crisp weights, in accordance with the established methodological steps.
The process yields a final ranking that estimates the relative contribution of each criterion to resilience. These weights are incorporated into Table 1, which summarises the structural adjustment of the multicriteria model and demonstrates coherence across criteria, subcriteria, and dimensions. The table synthesises the relative importance by dimension and enables validation of whether the proposed structure aligns with the prioritisation logic elicited from the experts.
Table 5.
Structural adjustment of the multicriteria decision model.
| Dimension k |
n | Structural adjustment of priorities | ||
|---|---|---|---|---|
| Ecological | 2 | 0.1000 | 0.0036 | 0.0283 |
| Economic–Business | 5 | 0.1110 | 0.0099 | 0.0784 |
| Economic–Regional | 11 | 0.1030 | 0.0202 | 0.1601 |
| Experiential | 7 | 0.1430 | 0.0179 | 0.1414 |
| Infrastructure | 6 | 0.1500 | 0.0161 | 0.1272 |
| Institutional | 5 | 0.1280 | 0.0114 | 0.0904 |
| Socio-Community | 12 | 0.1320 | 0.0283 | 0.2238 |
| Socio-Regional | 8 | 0.1330 | 0.0190 | 0.1503 |
| Total sum: | N=56 | 1.0000 | 0.1264 | 1.0000 |
Figure 1, derived from these normalised weights, presents the multidimensional resilience analysis model, in which dimensions and criteria emerge with clear proportions of influence, indicating which factors are most decisive in explaining organisational or territorial resilience (depending on the study’s focus). This graphical representation makes it possible to visualise the hierarchical structure and the relative intensity of each component, thereby reinforcing the robustness of the model and facilitating its applied interpretation.
The validated FAHP weighting indicates that the model exhibits internal coherence, a consistent ranking, and an empirically supported structure, thereby constituting a robust analytical framework for the study of resilience.
Based on the 56 criteria weighted using FAHP, adjusted weights were calculated by incorporating the structural adjustment according to the number of criteria within each dimension. On this basis, the distribution of the adjusted weights was examined (Table 6), yielding a mean of 0.017857 for the full set of criteria.
Consistent with the hierarchical approach, four impact groups (high, relatively high, relatively low, and low) were established using percentiles as cut-off points. The set of 15 critical factors constitutes the “very high” impact group—an operational label for the upper segment—defined by adjusted weighted scores . This threshold, slightly below the overall mean (0.017857), captures the right tail of the distribution without undermining robustness or overpopulating the list of factors.
From the model’s hierarchy, these criteria account for a substantial share of the total weight and are endogenous, being linked to individual conditions, social capital, and community action (e.g., actual risk perception, basic education, individual resilience capacities, institutional coordination, the business environment, and female entrepreneurial activity). Accordingly, the 15 factors are treated as structural cores of resilience, providing the basis for the Action Matrix and for prioritising post-disaster tourism recovery policies.
The critical and relevant factors identified by the multidimensional model are:
- Most relevant dimensions. The experiential dimension makes the largest contribution to resilience, followed by the economic–business and socio-community dimensions.
- Critical adaptability factors. Fifteen very high-impact factors were identified (adjusted score > 0.0170), predominantly endogenous in nature—associated with individual conditions and community action—including actual risk perception, basic education (low illiteracy), individual resilience capacities (RSA), institutional coordination and prevention, the business environment, and female entrepreneurial activity.
- Factors that hinder adaptability. Those of very low relevance include the country’s economic vulnerability, low economic diversity, insufficient health infrastructure, and limited medical coverage.
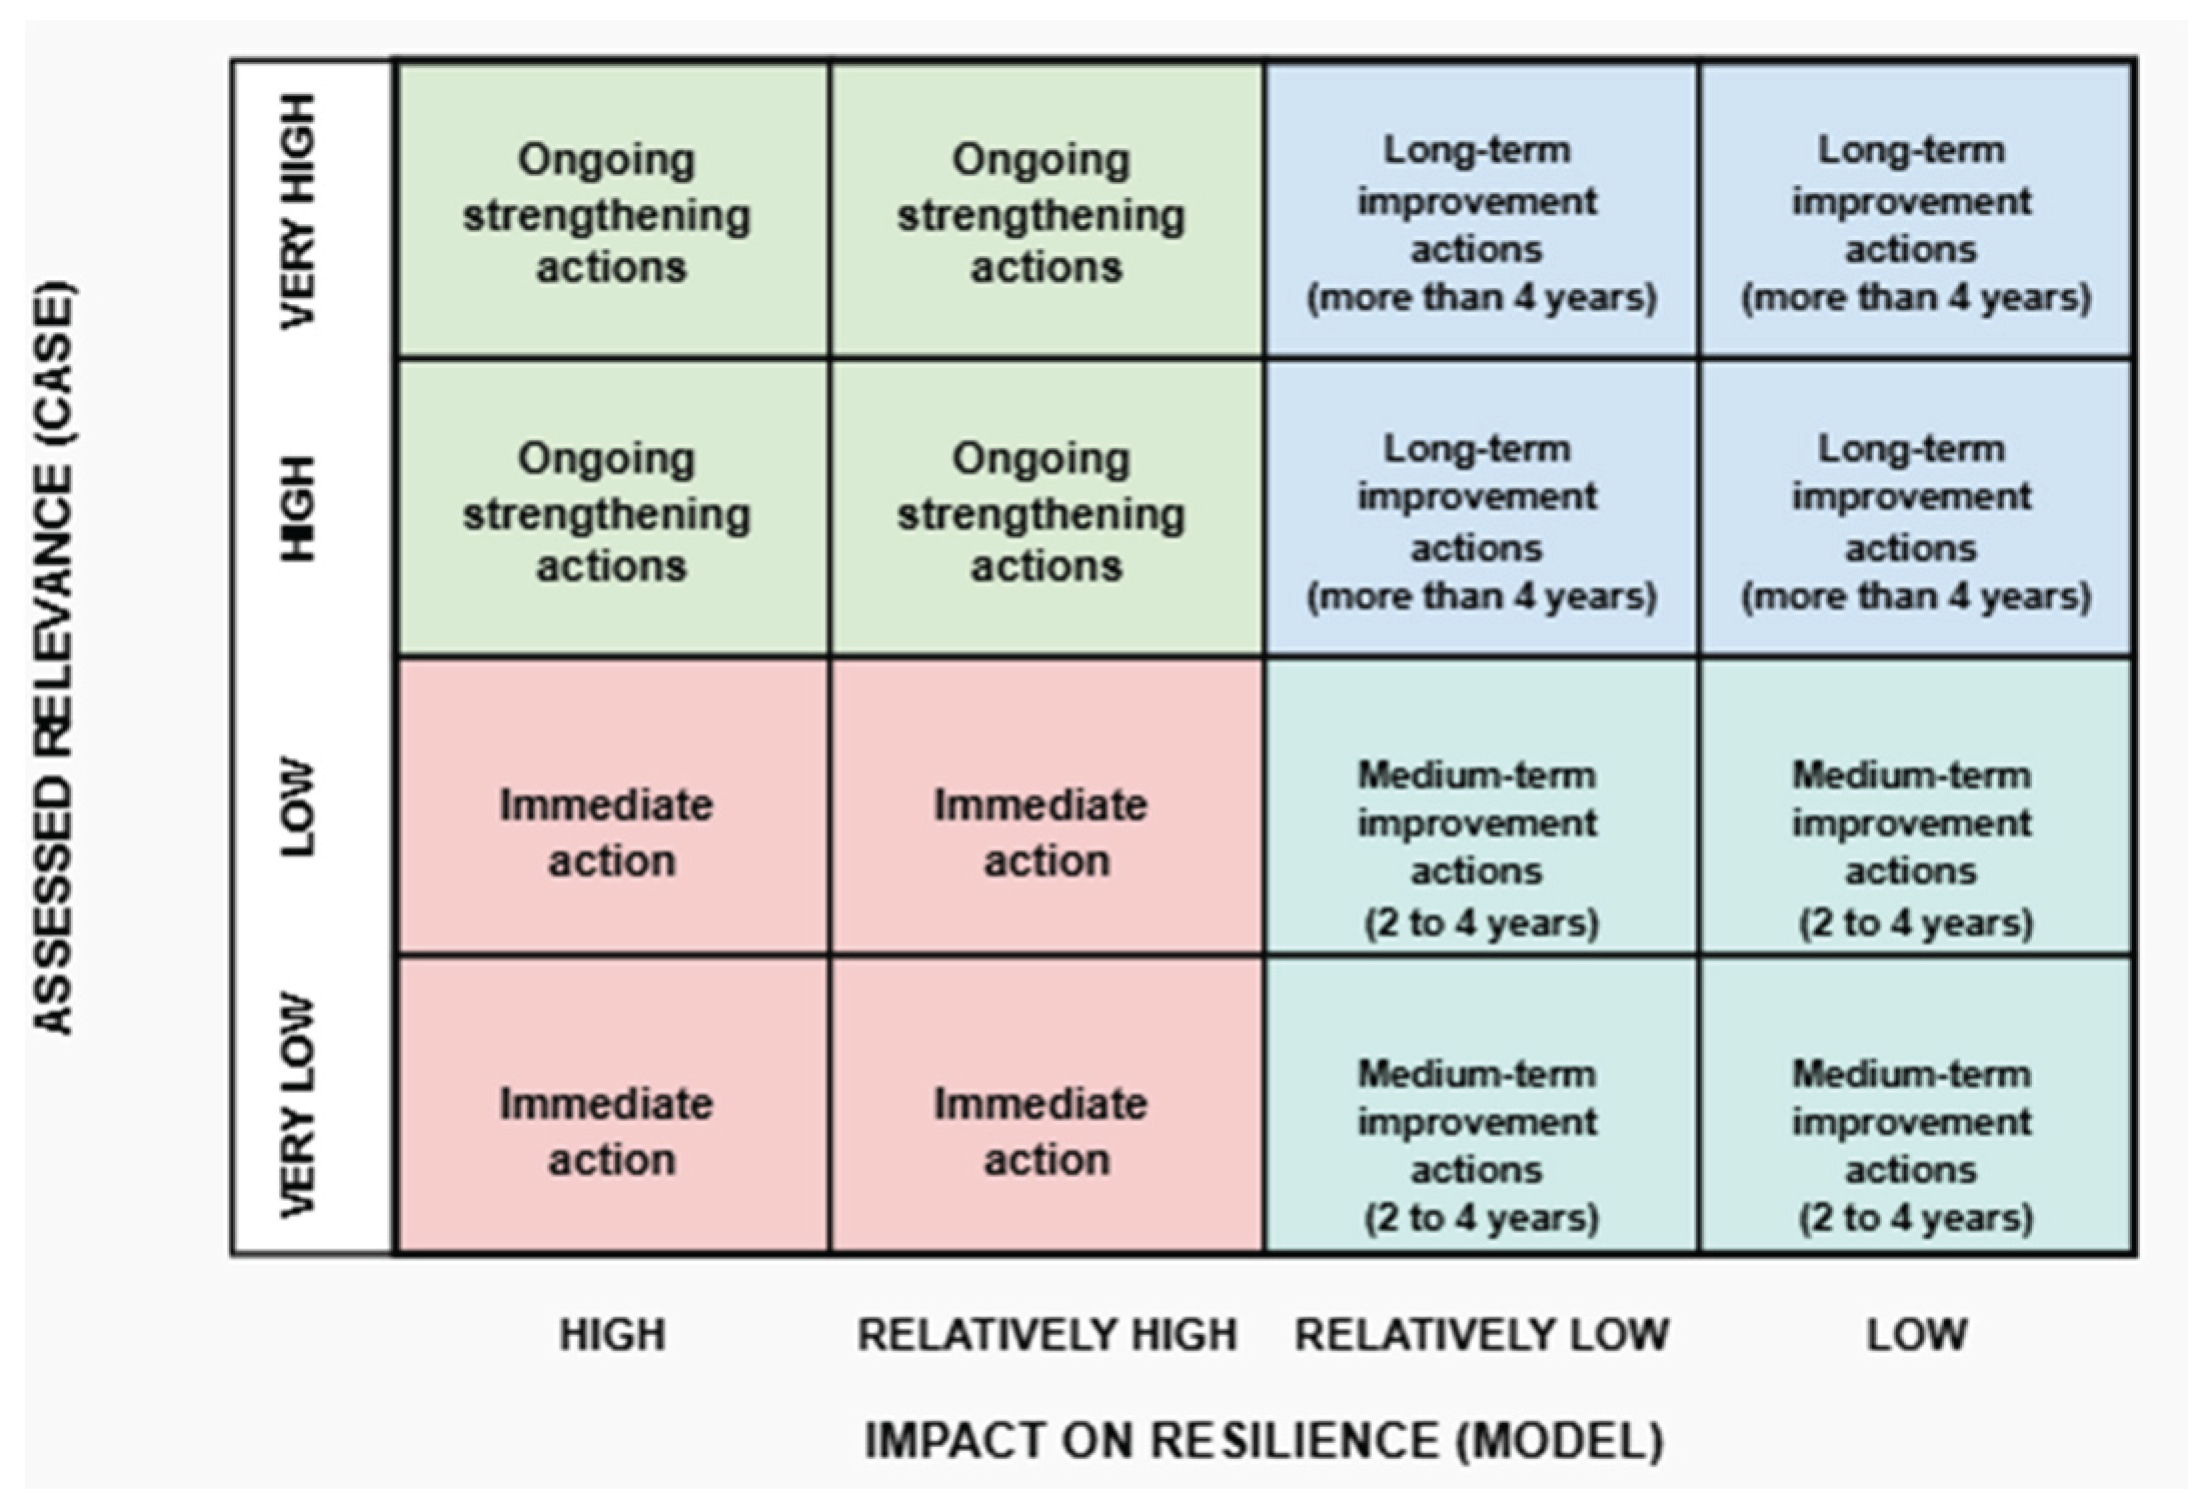
Action Matrix: Adaptive Governance
Adaptive governance is understood as resilience management oriented towards learning, self-organisation, and regional adaptability. FAHP supports this form of governance by comparing the model’s ideal structure (the theoretical impact of the criteria) with the real situation (the observed relevance in Baños), generating a prioritisation matrix for resource allocation and policy design.
Action options (ranked by timeframe):
- Immediate actions. High-impact criteria with low local relevance (critical weaknesses). They require clear policies on medical coverage, urban planning, lifelines and safe evacuation, health infrastructure, and income equity.
- Ongoing strengthening. Criteria with high relevance and high/relatively high impact (core strengths): disaster risk perception and experience, institutional coordination, prevention, the business environment, and community cohesion.
- Medium-term improvement (2–4 years). Weaknesses with relatively low/low impact that may become critical if neglected: economic diversification, institutional trust, and associativity.
- Long-term improvement (>4 years). Strengths with low impact on overall resilience that should nonetheless be preserved: high levels of entrepreneurship, low poverty, low economic dependency, and a young population.
The summary of this prioritisation is visualised as follows:
Figure 2.
Action matrix for resilience development.
The Action Matrix classifies critical factors according to: (i) their relative importance in the model (FAHP) and (ii) the level of governability of the local government to intervene. The combination of these two dimensions organises the results into four categories: immediate actions, actions requiring external coordination, incremental interventions, and factors to be monitored.
- High importance + high governability: these comprise the priority agenda; the municipality can intervene directly (e.g., risk management, institutional capacities).
- High importance + low governability: these require intergovernmental coordination (ministries, provincial GADs, national entities), as they concern critical areas outside municipal jurisdiction (e.g., major infrastructure, large-scale territorial planning).
- Low importance + high governability: these enable gradual improvements through incremental interventions.
- Low importance + low governability: these are incorporated into a monitoring agenda to prevent emerging vulnerabilities.
In practice, the matrix guides investment decisions, prioritises projects, coordinates responsibilities, and structures evidence-based resilience plans, ensuring that interventions are consistent with real management capacities and with the territory’s needs.
6. Discussion
The central finding indicates that the Experiential Dimension is the most decisive for resilience and tourism recovery in Baños de Agua Santa, followed by the economic–business and socio-community dimensions. This pattern contrasts with the literature, which in the early post-disaster phases prioritises institutional, economic, or infrastructure factors (Mushtaha et al., 2025). These results derive directly from the hierarchical structure weighted through FAHP, whose consistent matrix made it possible to identify robust priority patterns across dimensions. This methodological architecture enables the discussion to link the resulting weights to theoretical frameworks on resilience and tourism recovery, explaining why certain components—such as the visitor experience or community agency—emerge as structural factors in the adaptive process.
- Institutional dominance vs. community agency. In multiple contexts, governance shapes recovery: in L’Aquila, economic convergence was lacking after the earthquake (Urbani et al., 2025); in Indonesia, regulation led the IWN (Lestari et al., 2023); and in Mandalika, centralisation reduced the community’s role (Putera et al., 2025). In Baños, self-organisation and local agency—the return after evacuation—drove a bottom-up recovery, with entrepreneurial dynamism (e.g., female entrepreneurship) prevailing over the institutional response (Herrera-Enríquez & Rodríguez-Rodríguez, 2017; Lane et al., 2003).
- Economic recovery and infrastructure. In Kaikōura, damage to critical infrastructure directly affected tourism (Estevão & Costa, 2020; Fountain & Cradock-Henry, 2020); in Lombok, the reactivation of MSMEs was associated with planned resilience and connectivity (Nguyen et al., 2022). In Baños, the economic–business dimension ranks second due to adaptive specialisation and innovation (a shift towards adventure/ecotourism), rather than infrastructure or external financing (Herrera-Enríquez & Rodríguez-Rodríguez, 2016).
- Dark tourism and culture. Some destinations capitalise on disaster—such as tsunami museums and sites in Aceh—generating economic and social capital (Liu-Lastres et al., 2020; Pu & Chang-Richards, 2024). In Baños, the promotion of the erupting volcano strengthened the Experiential Dimension and dark tourism (Liu-Lastres et al., 2020).
The prominence of the experiential dimension reflects the nature of the risk and the community response:
a) Chronic risk and perception. Under prolonged volcanic risk, realistic risk perception and territorial identity are decisive; the hierarchy validates milieu and historical memory as supports for destination reconfiguration (Lane et al., 2003; Guo et al., 2018b; Lundin & Soulard, 2025; Herrera-Enríquez & Rodríguez-Rodríguez, 2016).
b) Product transformation. The shift from religious/thermal tourism towards adventure/ecotourism linked experience and the economy: the experiential offer drove business recovery.
c) Agency and local leadership. The greater weight assigned to the experiential dimension reflects learning, self-organisation, and community adaptability (Gocer et al., 2024; Herrera-Enríquez & Rodríguez-Rodríguez, 2017).
The findings relate to advanced theoretical frameworks such as:
Panarchy. The 1999 evacuation and tourism collapse correspond to (release); the return and reorganisation reveal and a new cycle (Herrera-Enríquez & Rodríguez-Rodríguez, 2016; Altuntas Vural et al., 2025).
Risk and socio-political vulnerability theory. The return reflects economic vulnerability and a lack of alternatives, showing the interaction between structure and agency in risk management (Few et al., 2017; Lane et al., 2003).
Socio-ecological resilience and transformability. Portfolio reconfiguration and the valorisation of the volcano illustrate transformative resilience; the high weights of experiential and business dimensions express adaptability and self-organisation (Bhati et al., 2016; Maurischa et al., 2023; Estevão & Costa, 2020).
7. Conclusiones
The Fuzzy AHP results confirm that territorial resilience is multidimensional and hierarchical, with factors interacting simultaneously within a complex adaptive system. Integrating eight dimensions—economic–regional, economic–business, socio-regional, socio-community, institutional, infrastructure, ecological, and experiential—enabled a robust assessment framework, quantifying the relevance of 56 criteria and delineating a structural pattern consistent with socio-ecological resilience.
The adjusted weighted analysis reveals an unequal distribution of resilience across dimensions. Social cohesion, territorial identity, community organisational capacity, accumulated learning, and the strength of the economic–business fabric stand out as structural cores. These elements underpin self-organisation and adaptation, and they indicate panarchic cycles within the territory’s evolutionary dynamics.
Empirically, Baños de Agua Santa exhibits consolidated resilience following prolonged exposure to volcanic risk, characterised by strong community agency, economic innovation, local leadership, and institutional articulation. Contrasting the “ideal model” (FAHP) with observed values made it possible to identify gaps and strengths and to design an Action Matrix for Adaptive Governance, which guides differentiated policies by time horizon (immediate actions, ongoing strengthening, and medium- and long-term measures).
Overall, the findings corroborate the evolutionary nature of resilience, mediated by socio-ecological interactions, risk perceptions, institutional capacities, and collective learning. The FAHP methodology proved well suited to this complexity, narrowing expert subjectivity and enabling transparent prioritisation of critical factors.
8. Future Research Directions
Future research could benefit from incorporating dynamic models using time-series data. Although the present study employed a cross-sectional design, integrating longitudinal SEM approaches—such as latent change analysis—would allow researchers to track the evolution of the system across different risk phases. Methodological refinement is also encouraged through the use of hybrid decision-making techniques, particularly combinations of FAHP with Fuzzy TOPSIS or DEMATEL. Such approaches would complement hierarchical weighting by capturing influence–dependence relationships among criteria, thereby revealing the internal network structure within and across dimensions.
Extending the application of the model to diverse territorial contexts represents another promising avenue. Testing the framework in coastal, Amazonian, and urban regions of Ecuador, as well as in other Latin American cases, would enable the identification of common patterns and context-specific divergences in critical resilience factors. In parallel, future research could enhance the operational relevance of the action matrix by transforming it into a tool for adaptive governance and territorial planning. This would make it possible to evaluate its effectiveness by monitoring institutional and community responses over time.
Finally, closer attention should be paid to the role of risk perception and cultural factors. Understanding how experiential criteria and territorial identity interact with economic and social decision-making in post-disaster settings may offer nuanced insights into community behaviour and resilience pathways. Such perspectives would enrich theoretical development while informing more culturally responsive recovery strategies.
Supplementary Materials
The following supporting information can be downloaded at: https://resilienciamultidimensional.blogspot.com/.
Author Contributions
Conceptualization, G. Herrera-Enríquez and E. Castillo-Montesdeoca; methodology, G. Herrera-Enríquez; software, L. Simbaña-Taipe; validation, G. Herrera-Enríquez, E. Castillo-Montesdeoca and J. G. Martínez-Navalón; formal analysis, G. Herrera-Enríquez; investigation, G. Herrera-Enríquez and E. Castillo-Montesdeoca; resources, E. Castillo-Montesdeoca; data curation, L. Simbaña-Taipe; writing—original draft preparation, G. Herrera-Enríquez; writing—review and editing, G. Herrera-Enríquez, J. G. Martínez-Navalón and E. Castillo-Montesdeoca; visualization, L. Simbaña-Taipe; supervision, G. Herrera-Enríquez; project administration, G. Herrera-Enríquez; funding acquisition, J. G. Martínez-Navalón. All authors have read and agreed to the published version of the manuscript.
Institutional Review Board Statement
Not applicable.
Informed Consent Statement
Not applicable.
Data Availability Statement
Conflicts of Interest
The authors declare no conflict of interest. The funders had no role in the design of the study; in the collection, analyses, or interpretation of data; in the writing of the manuscript; or in the decision to publish the results.
References
- Al-Manji, S., Lovett, J., & Mitchell, G. (2021). Factors Affecting Disaster Resilience in Oman: Integrating Stakeholder Analysis and Fuzzy Cognitive Mapping. Risk, Hazards & Crisis in Public Policy, 12(1), 29-50. [CrossRef]
- Altuntas Vural, C., Balci, G., Surucu Balci, E., & Gocer, A. (2025). Looking inside the panarchy: Reorganisation capabilities for food supply chain resilience against geopolitical crises. Supply Chain Management: An International Journal, 30(7), 1-19. [CrossRef]
- Asadzadeh, A., Kötter, T., Salehi, P., & Birkmann, J. (2017). Operationalizing a concept: The systematic review of composite indicator building for measuring community disaster resilience. International Journal of Disaster Risk Reduction, 25, 147-162. [CrossRef]
- Badoc-Gonzales, B. P., Mandigma, Ma. B. S., & Tan, J. J. (2022). SME resilience as a catalyst for tourism destinations: A literature review. Journal of Global Entrepreneurship Research, 12(1), 23-44. [CrossRef]
- Barbhuiya, M. R., & Chatterjee, D. (2020). Vulnerability and resilience of the tourism sector in India: Effects of natural disasters and internal conflict. Tourism Management Perspectives, 33, 100616. [CrossRef]
- Bhati, A., Upadhayaya, A., & Sharma, A. (2016). National disaster management in the ASEAN-5: An analysis of tourism resilience. Tourism Review, 71(2), 148-164. [CrossRef]
- Büyüközkan, G., Ertay, T., Kahraman, C., & Ruan, D. (2004). Determining the importance weights for the design requirements in the house of quality using the fuzzy analytic network approach. [CrossRef]
- Carpenter, S., Arrow, K., Barrett, S., Biggs, R., Brock, W., Crépin, A.-S., Engström, G., Folke, C., Hughes, T., Kautsky, N., Li, C.-Z., McCarney, G., Meng, K., Mäler, K.-G., Polasky, S., Scheffer, M., Shogren, J., Sterner, T., Vincent, J., … Zeeuw, A. (2012). General Resilience to Cope with Extreme Events. Sustainability, 4(12), 3248-3259. [CrossRef]
- Chang, D.-Y. (1996). Applications of the extent analysis method on fuzzy AHP. European Journal of Operational Research, 95(3), 649-655. [CrossRef]
- Cheng, L., & Zhang, J. (2020). Is tourism development a catalyst of economic recovery following natural disaster? An analysis of economic resilience and spatial variability. Current Issues in Tourism, 23(20), 2602-2623. [CrossRef]
- Chouhan, S., Thieken, A. H., Bubeck, P., & Mukherjee, M. (2023). Role of tourism on disaster recovery: A case study of Uttarakhand, India. International Journal of Disaster Risk Reduction, 95, 103878. [CrossRef]
- Chowdhury, M., Prayag, G., Orchiston, C., & Spector, S. (2019). Postdisaster Social Capital, Adaptive Resilience and Business Performance of Tourism Organizations in Christchurch, New Zealand. Journal of Travel Research, 58(7), 1209-1226. [CrossRef]
- Das, T., Talukdar, S., Shahfahad, Naikoo, M. W., Ahmed, I. A., Rahman, A., Islam, M. K., & Alam, E. (2024). Integration of fuzzy AHP and explainable AI for effective coastal risk management: A micro-scale risk analysis of tropical cyclones. Progress in Disaster Science, 23, 100357. [CrossRef]
- Estevão, C., & Costa, C. (2020). Natural disaster management in tourist destinations: A systematic literature review. European Journal of Tourism Research, 25, 2502. [CrossRef]
- Few, R., Armijos, M. T., & Barclay, J. (2017). Living with Volcan Tungurahua: The dynamics of vulnerability during prolonged volcanic activity. Geoforum, 80, 72-81. [CrossRef]
- Fountain, J., & Cradock-Henry, N. A. (2020). Recovery, risk and resilience: Post-disaster tourism experiences in Kaikōura, New Zealand. Tourism Management Perspectives, 35, 100695. [CrossRef]
- Gocer, O., Boyacioglu, D., Karahan, E. E., & Shrestha, P. (2024). Cultural tourism and rural community resilience: A framework and its application. Journal of Rural Studies, 107, 103238. [CrossRef]
- Gu, T., Chang, W., Li, Y., & Wang, Y. (2025). Exploring factors influencing the resilience of flood disaster response networks for old communities in China through an enhanced DNA-ISM framework. Urban Climate, 60, 102336. [CrossRef]
- Guo, Y., Zhang, J., Zhang, Y., & Zheng, C. (2018a). Catalyst or Barrier? The Influence of Place Attachment on Perceived Community Resilience in Tourism Destinations. Sustainability, 10(7), 2347. [CrossRef]
- Guo, Y., Zhang, J., Zhang, Y., & Zheng, C. (2018b). Examining the relationship between social capital and community residents’ perceived resilience in tourism destinations. Journal of Sustainable Tourism, 26(6), 973-986. [CrossRef]
- Ha-Mim, N. M., Hossain, Md. Z., Islam, Md. T., & Rahaman, K. R. (2024). Evaluating resilience of coastal communities upon integrating PRISMA protocol, composite resilience index and analytical hierarchy process. International Journal of Disaster Risk Reduction, 101, 104256. [CrossRef]
- Han, G., & Yang, E. (2025). How do multidimensional tourism factors affect community resilience? Applied Geography, 178, 103597. [CrossRef]
- Herrera-Enríquez, G., & Rodríguez-Rodríguez, G. (2016). Resiliencia y Turismo: El caso de la ciudad de Baños de Agua Santa - Ecuador. HOLOS, 3, 229-250. [CrossRef]
- Herrera-Enríquez, G., & Rodríguez-Rodríguez, G. (2017). Turismo y Sistemas Empresariales Resilientes: Factores Críticos de Adaptabilidad en Baños de Agua Santa – Ecuador. Revista de Gestão e Secretariado, 8(1), 01-25. [CrossRef]
- Hu, H., & Xu, K. (2022). Visualizing the Development of Research on Tourism Resilience With Mixed Methods. Sage Open, 12(3), 21582440221126684. [CrossRef]
- Khan, A., Shah, A. A., Alotaibi, B. A., & Khan, I. (2024). Prioritizing Resource and Policy Barriers to Post-Disaster Recovery in Pakistan: A Multi-Expert Fermatean Fuzzy AHP Analysis. Sustainability, 16(23), 10414. [CrossRef]
- Lane, L. R., Tobin, G. A., & Whiteford, L. M. (2003). Volcanic hazard or economic destitution: Hard choices in Banños, Ecuador. Environmental Hazards, 5(1), 23-34. [CrossRef]
- Lee, S., & Pennington-Gray, L. (2025). Measuring resilience of the tourism sector: Reflective Resilience Index (REFLEX) approach. Annals of Tourism Research, 114, 103983. [CrossRef]
- Lestari, Y. D., Sukmana, R., Beik, I. S., & Sholihin, M. (2023). The development of national waqf index in Indonesia: A fuzzy AHP approach. Heliyon, 9(5), e15783. [CrossRef]
- Lin, Y., Kelemen, M., & Kiyomiya, T. (2021). Bridging community resilience and sustainable tourism development via post-disaster education tourism in rural Japan. The Journal of Organization and Discourse, 2(1), 32-44. [CrossRef]
- Liu, C.-F., & Mostafavi, A. (2025). Network dynamics of community resilience and recovery: New frontier in disaster research. International Journal of Disaster Risk Reduction, 123, 105489. [CrossRef]
- Liu, L.-W., Pahrudin, P., Tsai, C.-Y., & Hao, L. (2024). Disaster, risk and crises in tourism and hospitality field: A pathway toward tourism and hospitality management framework for resilience and recovery process. Natural Hazards Research, 4(4), 653-668. [CrossRef]
- Liu-Lastres, B., Mariska, D., Tan, X., & Ying, T. (2020). Can post-disaster tourism development improve destination livelihoods? A case study of Aceh, Indonesia. Journal of Destination Marketing & Management, 18, 100510. [CrossRef]
- Lundin, E., & Soulard, J. (2025). Residents’ engagements in post-disaster tourism: Creating composite accounts out of social practices. Annals of Tourism Research, 110, 103894. [CrossRef]
- Lupiano, V., Chidichimo, F., Machado, G., Catelan, P., Molina, L., Calidonna, C. R., Straface, S., Crisci, G. M., & Di Gregorio, S. (2020). From examination of natural events to a proposal for risk mitigation of lahars by a cellular-automata methodology: A case study for Vascún valley, Ecuador. Natural Hazards and Earth System Sciences, 20(1), 1-20. [CrossRef]
- Ma, W., Lin, S., Ci, Y., & Li, R. (2024). Resilience evaluation and improvement of post-disaster multimodal transportation networks. Transportation Research Part A: Policy and Practice, 189, 104243. [CrossRef]
- Maurischa, S. D., Fahmi, F. Z., & Suroso, D. S. A. (2023). Transformative resilience: Transformation, resilience and capacity of coastal communities in facing disasters in two Indonesian villages. International Journal of Disaster Risk Reduction, 88, 103615. [CrossRef]
- Mushtaha, A. W., Alaloul, W. S., Baarimah, A. O., Musarat, M. A., Alzubi, K. M., & Khan, A. M. (2025). A decision-making framework for prioritizing reconstruction projects in post-disaster recovery. Results in Engineering, 25, 103693. [CrossRef]
- Nguyen, V. K., Pyke, J., Gamage, A., De Lacy, T., & Lindsay-Smith, G. (2022). Factors influencing business recovery from compound disasters: Evidence from Australian micro and small tourism businesses. Journal of Hospitality and Tourism Management, 53, 1-9. [CrossRef]
- Oliva, S., & Lazzeretti, L. (2018). Measuring the economic resilience of natural disasters: An analysis of major earthquakes in Japan. City, Culture and Society, 15, 53-59. [CrossRef]
Figure 1.
Multidimensional resilience analysis model.
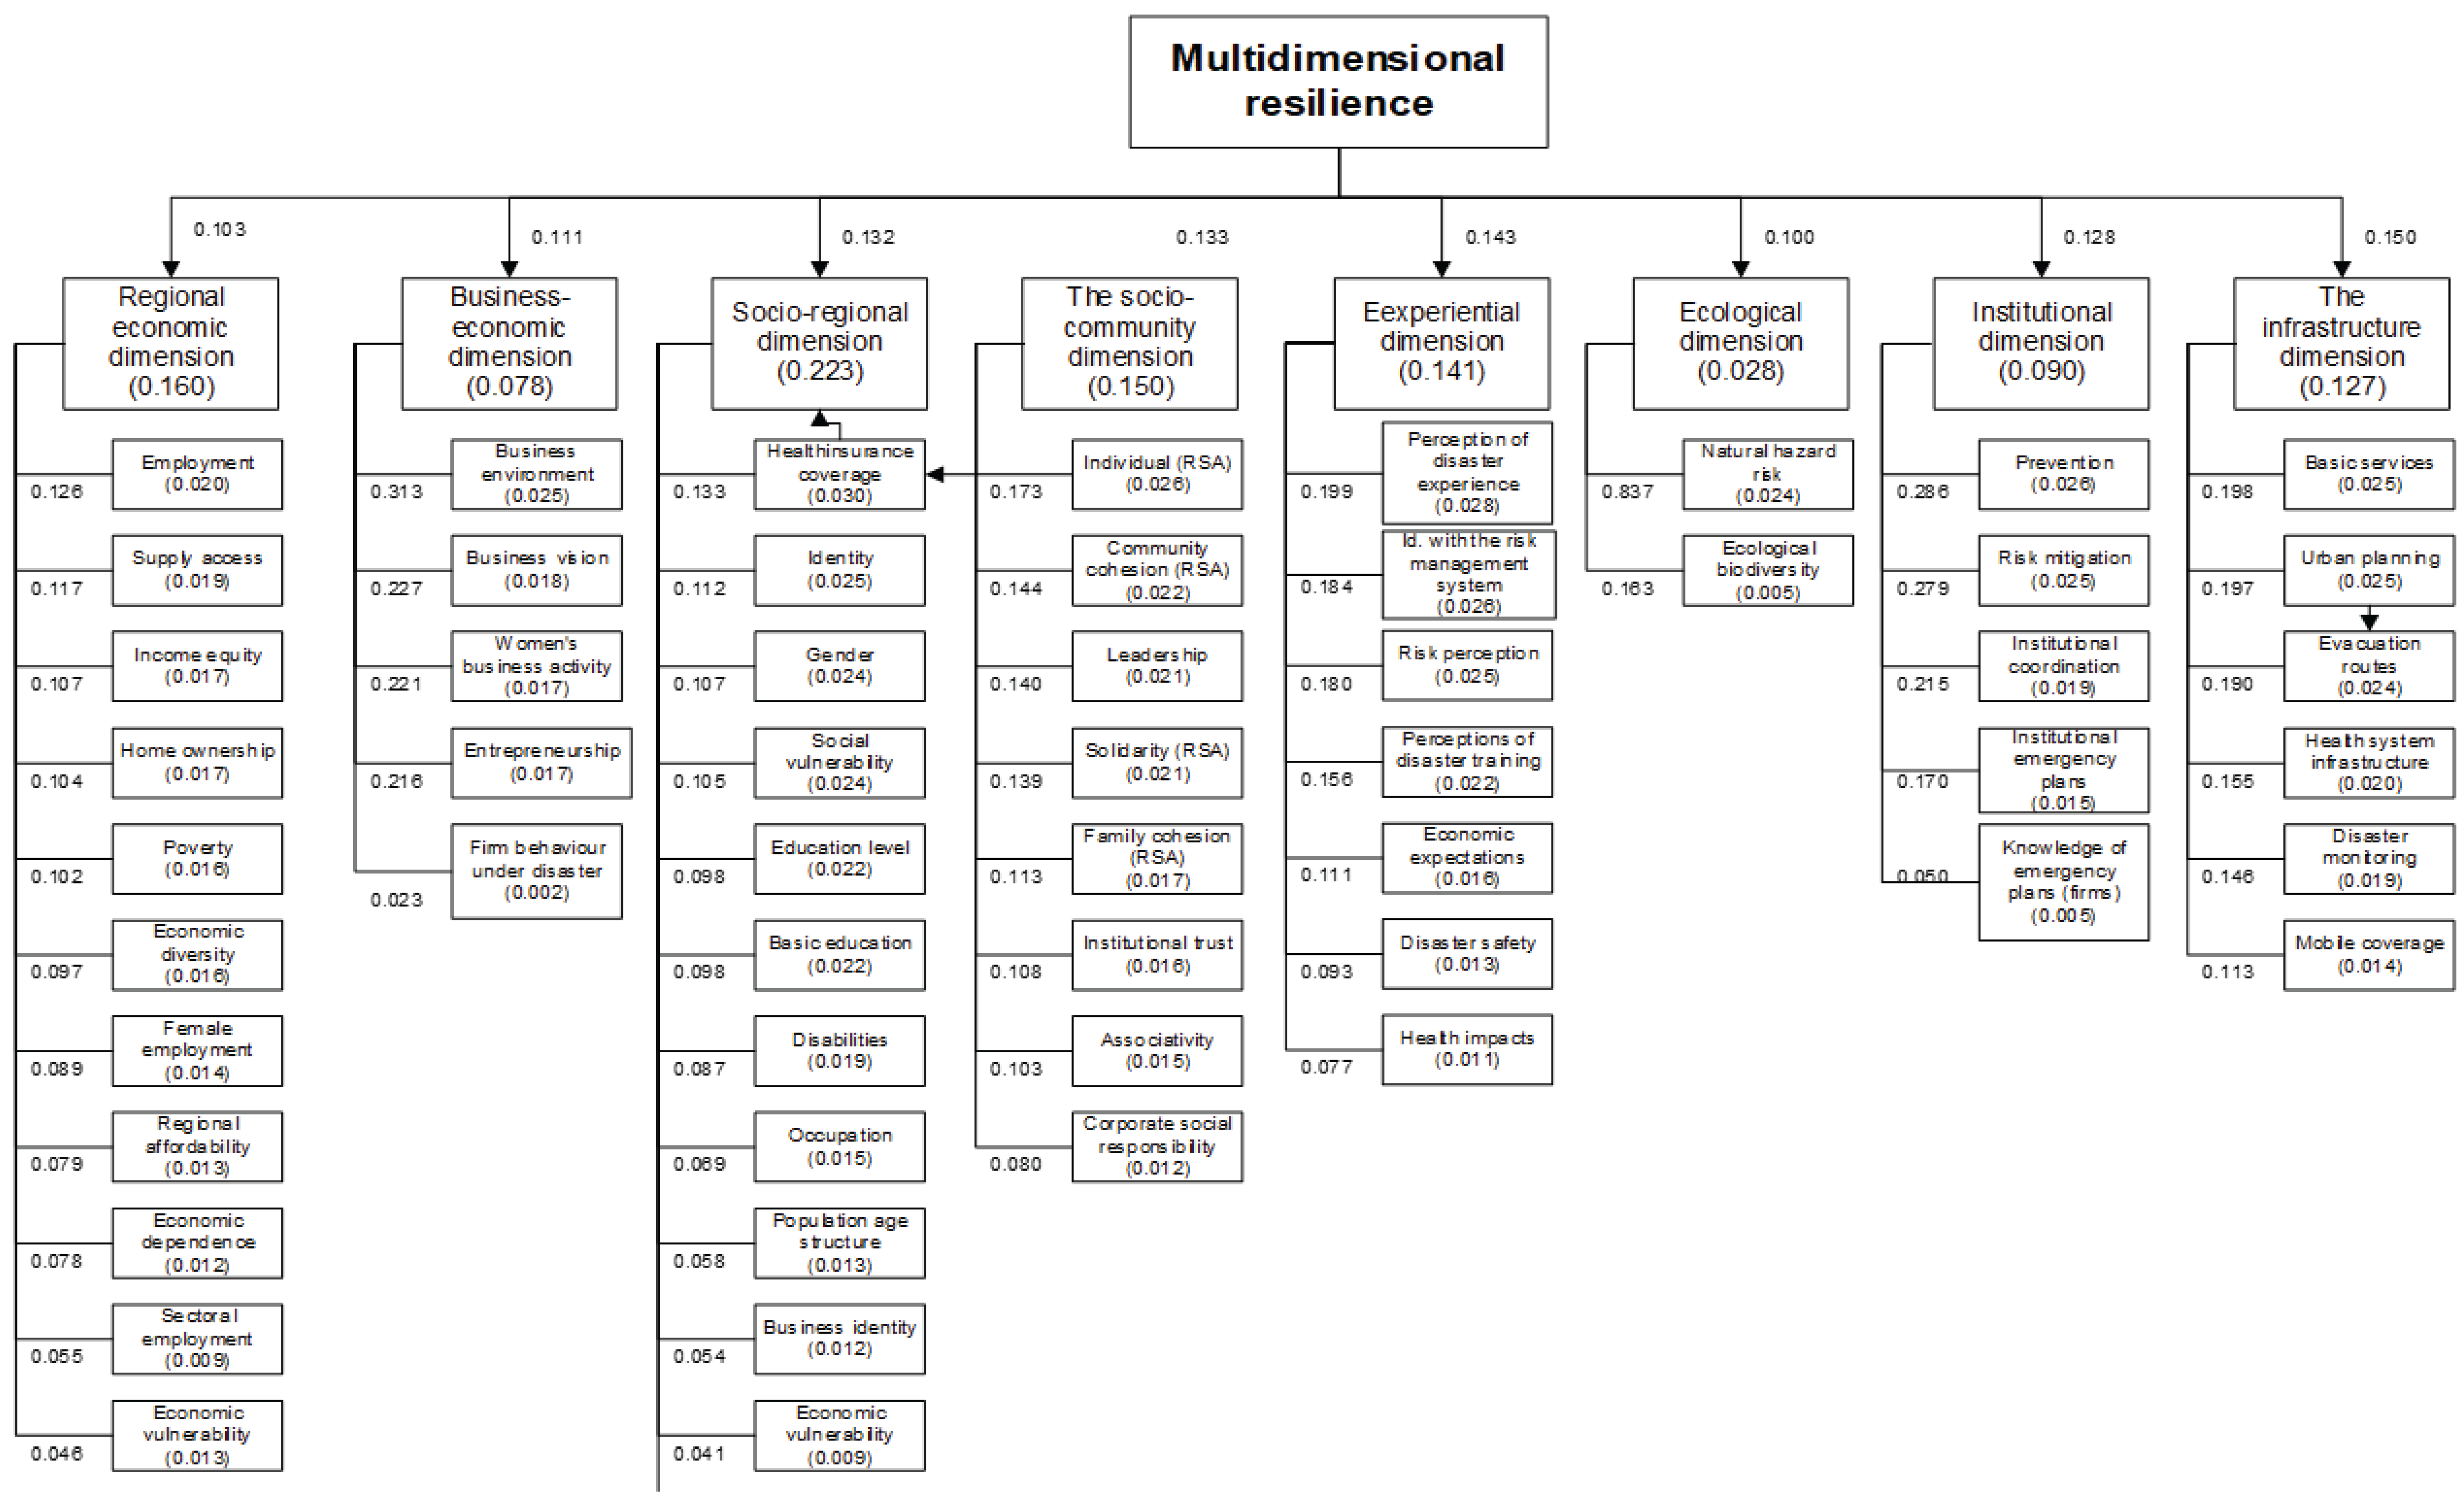
Table 1.
Triangular fuzzy linguistic scale.
| Linguistic scale for importance | Triangular fuzzy scale | Triangular fuzzy reciprocal scale |
| IM | 1/2,1,3/2 | 2/3,1,2 |
| MI | 1,3/2,2 | 1/2,2/3,1 |
| FI | 3/2,2,5/2 | 2/5,1/2,2/3 |
| MFI | 2,5/2,3 | 1/3,2/5,1/2 |
| IE | 5/2,3,7/2 | 2/7,1/3,2/5 |
Table 2.
Data obtained from experts in dimensional analysis (geometric mean).
| Ecological | Economic–Business | Economic–Regional | Experiential | Infrastructure | Institutional | Socio-Community | Socio-Regional | |||||||||||||||||
| Ecological | 0.50 | 1.00 | 1.50 | 0.69 | 0.97 | 1.29 | 0.66 | 0.98 | 1.50 | 0.54 | 0.76 | 1.02 | 0.47 | 0.62 | 0.92 | 0.50 | 0.63 | 0.82 | 0.55 | 0.80 | 1.15 | 0.53 | 0.70 | 0.98 |
| Economic–Business | 0.78 | 1.03 | 1.44 | 0.50 | 1.00 | 1.50 | 0.61 | 0.85 | 1.32 | 0.51 | 0.80 | 1.25 | 0.41 | 0.51 | 0.70 | 0.56 | 0.82 | 1.22 | 0.54 | 0.80 | 1.32 | 0.63 | 0.83 | 1.11 |
| Economic–Regional | 0.67 | 1.02 | 1.52 | 0.76 | 1.18 | 1.64 | 0.50 | 1.00 | 1.50 | 0.42 | 0.58 | 0.80 | 0.44 | 0.56 | 0.78 | 0.63 | 0.82 | 1.08 | 0.59 | 0.76 | 0.98 | 0.56 | 0.75 | 1.00 |
| Experiential | 0.98 | 1.32 | 1.84 | 0.80 | 1.25 | 1.97 | 1.25 | 1.72 | 2.37 | 0.50 | 1.00 | 1.50 | 0.72 | 1.02 | 1.40 | 1.06 | 1.43 | 1.84 | 0.72 | 1.06 | 1.50 | 0.72 | 1.06 | 1.50 |
| Infrastructure | 1.08 | 1.62 | 2.14 | 1.43 | 1.95 | 2.46 | 1.28 | 1.78 | 2.29 | 0.72 | 0.98 | 1.38 | 0.50 | 1.00 | 1.50 | 0.77 | 1.08 | 1.68 | 0.68 | 1.00 | 1.38 | 0.58 | 0.87 | 1.32 |
| Institutional | 1.22 | 1.58 | 1.99 | 0.82 | 1.22 | 1.80 | 0.92 | 1.22 | 1.60 | 0.54 | 0.70 | 0.94 | 0.60 | 0.92 | 1.30 | 0.50 | 1.00 | 1.50 | 0.67 | 0.94 | 1.40 | 0.71 | 1.02 | 1.61 |
| Socio-Community | 0.87 | 1.25 | 1.82 | 0.76 | 1.25 | 1.86 | 1.02 | 1.32 | 1.71 | 0.67 | 0.94 | 1.40 | 0.72 | 1.00 | 1.46 | 0.72 | 1.06 | 1.50 | 0.50 | 1.00 | 1.50 | 0.61 | 1.00 | 1.55 |
| Socio-Regional | 1.02 | 1.43 | 1.90 | 0.90 | 1.20 | 1.58 | 1.00 | 1.33 | 1.78 | 0.67 | 0.94 | 1.40 | 0.76 | 0.98 | 1.72 | 0.62 | 0.98 | 1.41 | 0.64 | 1.00 | 1.64 | 0.50 | 1.00 | 1.50 |
Table 6.
Distribution of adjusted weights.
| Statistics | ||
| N | Valid | 56 |
| Missing | 0 | |
| Mean | 0.017857 | |
| Percentiles | 25th | 0.013250 |
| 50th | 0.017500 | |
| 75th | 0.024000 | |
Disclaimer/Publisher’s Note: The statements, opinions and data contained in all publications are solely those of the individual author(s) and contributor(s) and not of MDPI and/or the editor(s). MDPI and/or the editor(s) disclaim responsibility for any injury to people or property resulting from any ideas, methods, instructions or products referred to in the content. |
© 2026 by the authors. Licensee MDPI, Basel, Switzerland. This article is an open access article distributed under the terms and conditions of the Creative Commons Attribution (CC BY) license (http://creativecommons.org/licenses/by/4.0/).
Copyright: This open access article is published under a Creative Commons CC BY 4.0 license, which permit the free download, distribution, and reuse, provided that the author and preprint are cited in any reuse.


