Submitted:
07 January 2026
Posted:
08 January 2026
You are already at the latest version
Abstract
Malaysia's 2012 amendment to the Uniform Building By-Laws introduced mandatory water efficiency requirements for new construction, yet the extensive inventory of public buildings constructed before this regulatory milestone remains largely uncharacterized in terms of water consumption patterns and efficiency potential. This study develops a comprehensive assessment framework specifically designed for evaluating water supply and demand in four critical public building types, namely government offices, hospitals, police stations, and mosques, constructed before the UBBL 2012 amendment. Through systematic analysis of international water benchmarking literature and synthesis of building-specific consumption patterns, an integrated assessment methodology is proposed combining water auditing protocols, high-resolution metering strategies, cluster-based benchmarking approaches, and building-type-specific performance indicators. Literature synthesis reveals substantial variability in public building water consumption internationally, with hospitals demonstrating consumption ranging from 103 to 458 cubic meters per bed per year, government offices showing documented savings potential of 31 to 82 percent through systematic monitoring programs, and mosques achieving approximately 45.5 percent fresh water savings through greywater reuse from ablution facilities. However, police stations represent a critical research gap with zero documented consumption studies in the available literature. The proposed framework establishes building-type-specific indicators, standardized data collection protocols, and benchmarking clusters to enable systematic assessment and prioritization of retrofitting interventions for Malaysia's pre-2012 public building stock.
Keywords:
water demand assessment
; UBBL 2012
; public buildings
; water benchmarking
; building retrofitting
; Malaysia
; water efficiency
1. Introduction
Water security represents one of the most pressing challenges facing rapidly urbanizing nations in Southeast Asia, where population growth, economic development, and climate variability converge to create unprecedented pressure on freshwater resources. Malaysia exemplifies this paradox of water abundance and scarcity, receiving more than 2,000 millimeters of annual rainfall yet experiencing recurrent water disruptions in major urban centers such as the Klang Valley, Johor Bahru, and Penang. The nation's water stress is not merely a function of absolute supply but reflects spatial and temporal distribution inequalities, governance inefficiencies, and unsustainable consumption patterns that collectively undermine water security despite apparent hydrological abundance. As illustrated in Figure 1, the Water Stress Index for Peninsular Malaysia reveals critical stress levels in highly urbanized states, with projections indicating persistent vulnerability through 2030, particularly in Penang, Perlis, Melaka, and Selangor where withdrawal-to-availability ratios exceed 0.8, signifying extremely high stress conditions.
The built environment emerges as a critical intervention point for water demand management, with public buildings representing a substantial yet poorly characterized component of urban water consumption. In Malaysia, the regulatory landscape for building water efficiency underwent a significant transformation with the 2012 amendment to the Uniform Building By-Laws, which introduced mandatory water efficiency requirements for new construction including provisions for rainwater harvesting systems, water-efficient fixtures, and greywater reuse infrastructure. However, this regulatory milestone created a bifurcated building stock wherein new construction adheres to contemporary efficiency standards while the extensive inventory of pre-2012 public buildings operates under legacy plumbing systems designed without consideration for water conservation. The magnitude of this legacy infrastructure challenge is substantial, encompassing thousands of government offices, hospitals, police stations, and mosques constructed over several decades prior to the implementation of water efficiency mandates.
Despite the clear policy imperative to characterize and improve water efficiency in existing public buildings, systematic assessment frameworks tailored to the Malaysian context remain conspicuously absent from both academic literature and professional practice. International benchmarking studies demonstrate wide variability in public building water consumption, with hospitals showing annual water use ranging from 103 cubic meters per bed per year in German public hospitals to 458 cubic meters per bed per year in Italian facilities, government offices achieving documented savings of 31 to 82 percent through systematic monitoring programs in Brazil, and mosques demonstrating potential fresh water savings of approximately 45.5 percent through greywater reuse from ablution facilities [1,2,3]. However, these international benchmarks cannot be directly transferred to the Malaysian context without accounting for local climate conditions, operational practices, cultural water use patterns, and building design characteristics specific to tropical environments.
The absence of building-type-specific assessment methodologies for pre-2012 Malaysian public buildings creates multiple challenges for water resource planning and retrofitting prioritization. First, without baseline consumption data and standardized performance indicators, facility managers and government agencies lack the quantitative foundation necessary to identify high-consumption outliers, detect leaks or system inefficiencies, and establish realistic conservation targets. Second, the heterogeneity of public building types, each with distinct operational schedules, occupancy patterns, and water use profiles, necessitates differentiated assessment approaches rather than generic methodologies. Third, the economic justification for retrofitting investments requires robust cost-benefit analysis frameworks that account for building-specific water demand characteristics, available conservation technologies, and local water tariff structures.
This study addresses these gaps by developing a comprehensive water supply and demand assessment framework specifically designed for four critical public building types in Malaysia, namely government offices, hospitals, police stations, and mosques constructed before the UBBL 2012 amendment. The framework integrates water auditing protocols, high-resolution metering strategies, cluster-based benchmarking approaches, and building-type-specific performance indicators synthesized from international best practices and adapted to Malaysian conditions. Through systematic literature review and synthesis of water consumption patterns, assessment methodologies, and conservation technologies, this research establishes the technical foundation for evidence-based retrofitting prioritization and water security planning in Malaysia's public building sector.
2. Water Stress Context in Peninsular Malaysia
Understanding the water stress context provides essential justification for demand-side management interventions in the built environment. Peninsular Malaysia faces a complex water security challenge characterized by spatial inequality, temporal variability, and governance constraints that collectively create vulnerability despite apparent hydrological abundance. The quantification of water stress requires robust assessment indices that capture the relationship between water demand and renewable supply while accounting for population pressure and non-linear stress impacts.
2.1. Water Stress Assessment Indices
The Water Stress Index provides a fundamental metric for evaluating pressure on water resources by comparing total water demand against renewable supply. The basic WSI is calculated using Equation (Eq.1):
 Where:
- Wd
- : total water demand (m3/year)
- Ws
- : total renewable water (m3/year)
The resulting dimensionless ratio is interpreted according to established thresholds wherein values below 0.2 indicate low or no stress, values between 0.2 and 0.4 indicate medium stress, values between 0.4 and 0.8 indicate high stress, and values exceeding 0.8 indicate extremely high stress conditions requiring immediate intervention.
To account for population pressure on water resources, the Falkenmark Water Stress Indicator assesses per capita water availability using Equation (Eq.2):
 Where:
- Wd
- : Falkenmark indicator (m3/person/year)
- Ws
- : renewable water supply (m3/year)
- P
- : total population
The interpretation follows established thresholds wherein values exceeding 1,700 cubic meters per person per year indicate no stress, values between 1,000 and 1,700 indicate water stress, values between 500 and 1,000 indicate water scarcity, and values below 500 indicate absolute scarcity conditions.
Modern water stress assessments employ non-linear transformation functions to better reflect the accelerating impacts of stress as withdrawal approaches available supply. The logistic function from the LC-Impact method transforms the basic withdrawal-to-availability ratio into a continuous stress value using Equation (Eq.3):
 Where:
- WTA
- : withdrawal-to-availability ratio
This logistic transformation provides a more nuanced gradient of water stress particularly useful for projecting future scenarios and identifying critical thresholds where small increases in demand or decreases in supply produce disproportionate stress impacts.
2.2. Spatial and Temporal Water Stress Patterns
Application of these indices to Peninsular Malaysia reveals pronounced spatial heterogeneity in water stress levels, with highly urbanized states experiencing critical stress despite national-level water abundance. Figure 1 presents the projected Water Stress Index by state for Peninsular Malaysia across three time periods, namely 2015, 2020, and 2030, derived from hydrological modelling and demand projections. The analysis identifies persistent critical water stress in Penang, Perlis, Melaka, and Selangor where WSI values exceed 0.8, contrasting sharply with the relative abundance in east coast states such as Kelantan, Terengganu, and Pahang where WSI values remain below 0.4 throughout the projection period.
Figure 1 Projected Water Stress Index by state for Peninsular Malaysia showing (a) 2015 baseline conditions, (b) 2020 observed conditions, and (c) 2030 projected conditions. The spatial analysis identifies critical water stress (WSI ≥ 0.8) concentrated in highly urbanized western states including Penang, Perlis, Melaka, Selangor, Kuala Lumpur, and Putrajaya, contrasting with relative water abundance (WSI < 0.4) in eastern states including Kelantan, Terengganu, and Pahang. The persistent stress pattern through 2030 highlights structural vulnerability requiring demand-side management interventions. Data source: N-HyDAA Portal, NAHRIM.
The temporal progression from 2015 to 2030 reveals that water stress in urbanized states is not a transient phenomenon but rather a structural condition that intensifies over time due to population growth, economic development, and climate variability. The 2020 data show WSI values of 0.97 in Kuala Lumpur, Putrajaya, Melaka, and Johor, indicating that withdrawal rates approach or exceed renewable supply in these states. The 2030 projections suggest that without significant demand management interventions, these critical stress conditions will persist and potentially expand to additional states as urbanization continues.
This spatial and temporal analysis provides compelling justification for demand-side management strategies targeting the built environment, particularly public buildings which represent a substantial and controllable component of urban water consumption. The concentration of water stress in urbanized states where public building density is highest creates both urgency and opportunity for systematic assessment and retrofitting interventions.
3. Regulatory Context: UBBL 2012 Amendment
The regulatory framework governing building water efficiency in Malaysia underwent fundamental transformation with the 2012 amendment to the Uniform Building By-Laws, creating a clear demarcation between contemporary construction standards and legacy building stock. Understanding this regulatory context is essential for framing the assessment challenge and identifying the scope of pre-2012 buildings requiring evaluation.
3.1. UBBL 2012 Water Efficiency Provisions
The 2012 amendment introduced mandatory water efficiency requirements for new construction, fundamentally altering the design and specification of building plumbing systems. The key provisions include mandatory installation of rainwater harvesting systems for buildings exceeding specified roof catchment areas, requirements for water-efficient fixtures meeting minimum performance standards, provisions for greywater reuse infrastructure in appropriate building types, and specifications for sub-metering to enable monitoring and management of water consumption by end-use category. These provisions represent a significant advancement in building water efficiency regulation, aligning Malaysian standards with international best practices in water-sensitive urban design.
However, the amendment applies prospectively to new construction and major renovations, creating a bifurcated building stock wherein contemporary buildings incorporate water efficiency features by regulatory mandate while pre-2012 buildings operate under legacy plumbing systems designed without consideration for conservation. The literature indicates that provisions for rainwater harvesting within the Malaysian Uniform Building By-Laws have been judged inadequate to guide local approval, inspection, and enforcement activities, with recommendations for developing targeted interventions and clearer guidance to improve by-law adherence [4]. Studies evaluating mosque sanitary and ablution facilities reference older UBBL standards as part of compliance checks, but do not document the specific technical content of 2012 amendments or their implementation effectiveness [5].
3.2. Pre-2012 Building Stock Characteristics
Public buildings constructed before the UBBL 2012 amendment typically feature plumbing systems designed to meet basic functional requirements without optimization for water efficiency. Common characteristics include standard-flow fixtures with flush volumes of 9 to 13 liters per flush for water closets compared to contemporary dual-flush systems offering 3 to 6 liter options, conventional faucets with flow rates of 12 to 15 liters per minute compared to contemporary aerators limiting flow to 6 liters per minute or less, absence of rainwater harvesting infrastructure despite substantial roof catchment areas, lack of greywater reuse systems even in building types with suitable greywater sources such as ablution facilities in mosques, and limited or absent sub-metering preventing disaggregated monitoring of water consumption by end-use category or building zone.
These legacy system characteristics create substantial water efficiency gaps compared to contemporary standards, representing both a challenge and an opportunity for retrofitting interventions. The magnitude of the pre-2012 public building inventory is substantial, encompassing thousands of government offices, hospitals, police stations, and mosques constructed over several decades. Systematic assessment of this building stock is essential for establishing baseline consumption patterns, identifying high-priority retrofitting candidates, and quantifying the aggregate water savings potential achievable through targeted interventions.
4. Building-Type-Specific Water Consumption Patterns
Effective assessment frameworks must account for the distinct water consumption characteristics of different public building types, each with unique operational schedules, occupancy patterns, end-use distributions, and conservation opportunities. This section synthesizes international literature on water consumption patterns for the four building types examined in this study, establishing the foundation for building-type-specific assessment indicators.
4.1. Hospital Water Consumption
Hospitals represent the most water-intensive public building type, with consumption driven by diverse end-uses including clinical sanitation, laundry services, heating ventilation and air conditioning systems, food service operations, and landscaping. Systematic review of international hospital water consumption reveals substantial variability, with annual water use per bed ranging from 103 cubic meters per bed per year in German public hospitals to 458 cubic meters per bed per year in Italian facilities [1]. This wide range reflects differences in activity level, laundry arrangements, water costs, sustainable practices, and environmental certification status across healthcare systems.
Two consistent metrics emerge from the literature as appropriate for hospital water benchmarking, namely annual water usage per bed expressed in cubic meters per bed per year, and annual water usage per built area expressed in cubic meters per square meter per year [1]. The per-bed indicator normalizes consumption by functional capacity and is particularly useful for comparing facilities with similar service profiles, while the per-area indicator accounts for building size and is appropriate when bed counts are unavailable or when comparing facilities with different service intensities. The literature indicates that higher water tariffs tend to reduce hospital consumption while higher per capita income tends to increase it, suggesting that economic factors significantly influence water use behavior even in institutional settings [1].
Hospital water demand can be estimated using Equation (Eq.4):
 Where:
- Whospital
- : total annual water demand (m3/year)
- Nbed
- : number of operational beds
- Cbed
- : water consumption coefficient (m3/bed/year)
- Afloor
- : Floor Area (m2)
- Carea
- : ~0.8-1.5 m3/m2/year
4.2. Government Office Water Consumption
Government offices demonstrate substantial water savings potential through systematic monitoring and management programs, with documented case studies showing reductions of 31 to 82 percent compared to baseline consumption [2,6]. A five-year water conservation program implemented across seventeen state government headquarters in Salvador, Brazil achieved estimated savings of 270,000 cubic meters of potable water representing 2.7 million US dollars in water and wastewater costs, with monthly savings of 31 percent compared to pre-program practices [2]. The most committed buildings in this program achieved reductions of 55, 72, and 82 percent, demonstrating that exceptional performance is achievable through sustained operational attention [6].
The primary water end-uses in government offices include toilet flushing, hand washing, kitchen and pantry operations, cooling tower makeup water, and landscaping irrigation. Unlike hospitals, government offices typically operate on regular business schedules with predictable occupancy patterns, creating opportunities for demand management through occupancy-responsive controls and fixture optimization. The literature emphasizes that operational actions including daily monitoring, equipment adjustments, leak repairs, and formation of water conservation teams are central to achieving substantial savings [2].
Government office water demand can be estimated using Equation (Eq.5):
 Where:
- Woffice
- : total annual water demand (m3/year)
- Noccupants
- : average daily occupant
- Dworking
- : consumption (l/person/day)
4.3. Mosque Water Consumption
Mosques present unique water consumption characteristics driven primarily by ablution facilities required for ritual purification before prayer. Study of greywater reuse potential in mosque facilities found that implementing greywater reuse from ablution activities can achieve fresh water savings of approximately 45.5 percent, with greywater from ablution directly reusable for irrigation while soap-contaminated streams require treatment for toilet flushing applications [3]. This substantial savings potential reflects the high proportion of mosque water consumption attributable to ablution facilities and the suitability of ablution greywater for non-potable reuse.
The temporal pattern of mosque water consumption differs markedly from other public building types, with demand concentrated around five daily prayer times and peak consumption during Friday congregational prayers. This temporal concentration creates opportunities for targeted conservation measures including high-efficiency ablution fixtures, greywater capture and reuse systems, and rainwater harvesting to supplement ablution water supply. Research on mosque water closet facilities in Malaysia found that many mosques do not fully comply with national standards, with four out of five studied mosques failing to provide facilities for disabled persons and none providing sanitary disposal units in water closets [5].
Mosque water demand can be estimated using Equation (Eq.6):
 Where:
- Wmosque
- : total annual water demand (m3/day)
- Nprayer
- : number of prayer
- i
- : range 1 to 5 (represent 5 daily prayer)
- Vablution
- : volume of water (l/person)
- Ntoilet
- : number of toilet use/day
- Vflush
- : volume of flush (l)
- Fdaily
- : frequency factor
For Malaysian mosques, recommended benchmark values are Vablution ranging from 3 to 5 liters per person for efficient ablution fixtures, and Vflush of 3 to 6 liters per flush for dual-flush water closets compared to 9 to 13 liters per flush for conventional single-flush systems common in pre-2012 buildings.
4.4. Police Station Water Consumption
Police stations represent a critical research gap in the water consumption literature, with zero documented consumption studies identified in the systematic review. This absence of empirical data creates substantial uncertainty for assessment framework development and benchmarking target establishment. Police stations share some operational characteristics with government offices including regular staffing schedules and standard office water end-uses, but also feature unique water demands associated with detention facilities, vehicle washing operations, and 24-hour operational requirements.
In the absence of building-type-specific data, police station water demand can be estimated using a hybrid approach combining office-based per capita consumption for administrative areas with detention facility consumption for custody areas, as shown in Equation (Eq.7):
 Where:
- Wpolice
- : total annual water demand (m3/year)
- Nstaff
- : average of staff
- Dworking
- : number of days per year
- Cstaff
- : consumption of staff (l/person/day)
- Ndetainee
- : average of detainee
- Cdetainee
- : consumption of detainee (l/person/day)
- Wvehicle
- : annual consumption vehicle washing
Recommended benchmark values pending empirical validation are Cstaff of 40 to 60 liters per person per day, Cdetainee of 80 to 120 liters per person per day accounting for 24-hour occupancy, and Wvehicle estimated based on fleet size and washing frequency.
Table 1 summarizes the building-type-specific water consumption benchmarks synthesized from international literature and adapted for Malaysian conditions, providing reference values for assessment framework application.
5. Assessment Framework Methodology
The proposed assessment framework integrates four complementary methodological components, namely water auditing protocols, high-resolution metering strategies, cluster-based benchmarking approaches, and building-type-specific performance indicators. This integrated approach addresses the multifaceted challenge of characterizing water consumption in diverse public building types while providing actionable information for retrofitting prioritization and conservation planning. Figure 2 presents the four-phase assessment methodology showing the sequential and iterative relationships among framework components.
Figure 2 Four-phase assessment methodology framework for pre-UBBL 2012 public buildings. Phase 1 (Water Auditing) establishes baseline consumption through comprehensive facility assessment including fixture inventory, leak detection, and end-use characterization. Phase 2 (High-Resolution Metering) implements sub-metering infrastructure to enable disaggregated monitoring by building zone and end-use category. Phase 3 (Benchmarking Clusters) applies statistical clustering to identify high-efficiency and low-efficiency building groups and detect outliers indicating leaks or metering issues. Phase 4 (Building-Specific Indicators) calculates and tracks building-type-specific performance metrics enabling longitudinal monitoring and cross-facility comparison. The framework operates iteratively with continuous data collection informing ongoing assessment refinement and conservation measure evaluation.
5.1. Phase 1: Water Auditing Protocols
Water auditing provides the foundation for assessment by establishing baseline consumption patterns, identifying major end-uses, detecting leaks and inefficiencies, and characterizing building-specific operational factors. The auditing protocol follows a systematic procedure beginning with data collection including utility billing records for minimum 12 months to capture seasonal variation, building characteristics including floor area, occupancy, and operational schedules, and fixture inventory documenting type, quantity, and specifications of all water-using equipment. The audit proceeds with water balance analysis quantifying supply sources, major end-use categories, and unaccounted-for water potentially indicating leaks or metering errors.
The water balance equation for a public building is expressed in Equation (Eq.8):
 Where:
- Wsupply
- : total water supply (m3/year)
- Wsanitary
- : sanitary fixture consumption
- Wkitchen
- : kitchen & pantry consumption
- Wcooling
- : cooling tower & HVAC
- Wlandscape
- : Landscaping irrigation
- Wspecial
- : building type specific uses
- Wloss
- : unaccounted water
The audit includes physical inspection of all water-using fixtures and equipment, leak detection using acoustic methods or tracer dyes for suspected leaks, flow rate measurements for representative fixtures to verify actual performance against specifications, and occupant interviews to understand operational practices and identify conservation opportunities. The audit culminates in a comprehensive report documenting baseline consumption, end-use distribution, identified inefficiencies, and prioritized conservation recommendations with estimated savings and implementation costs.
5.2. Phase 2: High-Resolution Metering Strategies
High-resolution metering enables disaggregated monitoring of water consumption by building zone, end-use category, or time interval, providing the granular data necessary for performance tracking, anomaly detection, and conservation measure evaluation. The metering strategy involves installing sub-meters at strategic locations to isolate major consumption categories, implementing automated meter reading systems to enable continuous data collection without manual intervention, and establishing data management infrastructure to store, analyze, and visualize consumption data.
The optimal sub-metering configuration varies by building type based on end-use distribution and conservation priorities. For hospitals, recommended sub-metering includes separate meters for clinical areas, laundry facilities, cooling towers, kitchen and food service, and landscaping irrigation. For government offices, recommended sub-metering includes separate meters for each floor or building wing, toilet facilities, kitchen and pantry areas, and cooling towers. For mosques, recommended sub-metering includes separate meters for ablution facilities, toilet facilities, and landscaping irrigation. For police stations, recommended sub-metering includes separate meters for administrative areas, detention facilities, and vehicle washing operations.
The metering resolution should enable detection of consumption anomalies and evaluation of conservation measures. Hourly or daily meter readings are typically sufficient for most applications, with higher resolution required for detailed end-use disaggregation or leak detection. The data management system should provide automated alerts for consumption exceeding established thresholds, visualization tools for temporal pattern analysis, and reporting capabilities for performance tracking and benchmarking.
5.3. Phase 3: Cluster-Based Benchmarking
Cluster-based benchmarking applies statistical methods to group buildings with similar characteristics and identify high-efficiency and low-efficiency performers within each cluster. This approach addresses the challenge that direct comparison of buildings with different sizes, occupancies, and operational characteristics may be misleading. The clustering methodology follows a systematic procedure beginning with indicator calculation for each building using building-type-specific metrics such as per capita consumption for offices, per bed consumption for hospitals, or per prayer attendance consumption for mosques.
The clustering analysis applies k-means clustering or hierarchical clustering to group buildings based on similarity of consumption indicators and building characteristics. The optimal number of clusters is determined using statistical criteria such as the elbow method or silhouette analysis. Within each cluster, buildings are ranked by efficiency with the top quartile designated as high-efficiency benchmarks and the bottom quartile designated as low-efficiency candidates for priority retrofitting. Outliers with consumption significantly exceeding cluster norms are flagged for detailed investigation to identify leaks, metering errors, or unusual operational factors.
The benchmarking efficiency for a building relative to its cluster is calculated using Equation (Eq.9):
 Where:
- Ebenchmark
- : benchmarking efficiency
- Ccluster
- : median consumption indicator
- Cbuilding
- : consumption indicator for the specific building
Values exceeding 100 percent indicate above-average efficiency, while values below 100 percent indicate below-average efficiency with the magnitude indicating the degree of underperformance. Buildings with Ebenchmark below 70 percent are designated as high-priority retrofitting candidates.
5.4. Phase 4: Building-Type-Specific Performance Indicators
Building-type-specific performance indicators provide standardized metrics for longitudinal monitoring and cross-facility comparison, accounting for the unique operational characteristics of each building type. The indicator framework establishes primary indicators for routine monitoring, secondary indicators for detailed analysis, and threshold values for identifying inefficiencies. Table 2 presents the building-type-specific indicator framework with calculation methods and interpretation guidelines.
The indicator framework enables systematic performance tracking over time, identification of seasonal patterns, evaluation of conservation measure effectiveness, and cross-facility benchmarking. Indicators should be calculated monthly and reviewed quarterly to identify trends and anomalies. Significant deviations from established patterns warrant investigation to determine whether changes reflect operational factors, conservation measures, or system problems requiring attention.
6. Water Conservation Technologies and Savings Potential
The assessment framework identifies conservation opportunities that can be addressed through retrofitting interventions. This section examines water conservation technologies applicable to pre-2012 public buildings, quantifies savings potential, and presents economic analysis methods for prioritizing investments. Figure 3 presents comparative water consumption patterns across the four building types, illustrating the relative magnitude of consumption and the distribution of end-uses that inform conservation strategy development.
Figure 3 Comparative water consumption patterns across four public building types showing annual consumption ranges and primary end-use distributions. Hospitals exhibit the highest consumption (150-300 m³/bed/year) with diverse end-uses including clinical sanitation, laundry, cooling, and food service. Government offices show moderate consumption (30-50 L/person/day) dominated by sanitary fixtures and cooling towers. Mosques demonstrate concentrated consumption around ablution facilities (15-25 L/person/prayer) with substantial greywater reuse potential. Police stations show estimated consumption (40-60 L/person/day for staff areas) with additional detention facility and vehicle washing demands. The comparative analysis highlights building-type-specific conservation priorities and the need for differentiated assessment approaches.
6.1. Fixture Replacement and Efficiency Improvements
Fixture replacement represents the most direct conservation intervention, substituting legacy high-flow fixtures with contemporary water-efficient alternatives. The water savings from fixture replacement can be calculated using Equation (Eq.10):
 Where:
- Nfixture
- : annual water savings (m3/year)
- Fexisting
- : flow rate or flush volume of existing fixtures (liter/use)
- Fefficient
- : flow rate or flush volume of existing fixtures (liter/use)
- Uannual
- : annual number of uses per fixture
For water closets, replacing conventional single-flush toilets with flush volumes of 9 to 13 liters per flush with dual-flush systems offering 3 liters for half flush and 6 liters for full flush typically achieves savings of 40 to 60 percent assuming appropriate user behavior with 70 percent of uses employing half flush. For urinals, replacing conventional flush urinals consuming 3 to 5 liters per flush with waterless urinals or high-efficiency flush urinals consuming 0.5 to 1 liter per flush achieves savings of 80 to 100 percent. For faucets, installing aerators limiting flow to 6 liters per minute compared to conventional flow rates of 12 to 15 liters per minute achieves savings of 50 to 60 percent.
6.2. Greywater Reuse Systems
Greywater reuse systems capture lightly contaminated wastewater from hand washing, ablution, or shower facilities and treat it for non-potable applications such as toilet flushing or landscape irrigation. The water savings from greywater reuse can be calculated using Equation (Eq.11):
 Where:
- Sgreywater
- : annual water savings (m3/year)
- Wgreywater
- : annual greywater generation (m3/year)
- Wreuse
- : annual non-potable water demand (m3/year)
- Ŋsystem
- : system efficiency (0.85 to 0.95)
For mosques, greywater reuse from ablution facilities offers substantial savings potential, with studies demonstrating fresh water savings of approximately 45.5 percent [3]. Ablution greywater without soap contamination can be directly reused for landscape irrigation, while soap-contaminated streams require treatment for toilet flushing applications. For hospitals and government offices, greywater from hand washing and shower facilities can be treated and reused for toilet flushing, with savings potential depending on the balance between greywater generation and toilet flushing demand.
6.3. Rainwater Harvesting Systems
Rainwater harvesting systems capture rainfall from roof catchments, store it in tanks, and supply it for non-potable uses such as toilet flushing, landscape irrigation, or cooling tower makeup. The water savings from rainwater harvesting can be calculated using Equation (Eq.12):
 Where:
- Srainwater
- : annual water savings (m3/year)
- Rannual
- : annual rainwater capture (m3/year)
- Wdemand
- : annual non-potable water demand (m3/year)
- Ŋsystem
- : system efficiency (0.75 to 0.85)
The annual rainwater capture potential is calculated using Equation (Eq.13):
 Where:
- Rannual
- : annual rainwater capture (m3/year)
- Aroof
- : roof catchment area (m2)
- Croof
- : runoff coefficient (0.75-0.90)
For Peninsular Malaysia with annual rainfall ranging from 2,000 to 3,000 millimeters, a building with 1,000 square meters of roof catchment can potentially capture 1,500 to 2,250 cubic meters of rainwater annually.
6.4. Economic Analysis and Payback Period
The economic justification for conservation investments requires calculation of payback period, net present value, or benefit-cost ratio accounting for capital costs, operational savings, and system lifetime. The simple payback period provides a straightforward metric for comparing investment alternatives, calculated using Equation (Eq.14):
 Where:
- Tpayback
- : payback period (years)
- Ccapital
- : total capital cost (RM)
- Sannual
- : annual water savings (m3/year)
- Spower
- : water tariff (supply & water water charge) (RM/m3)
For Malaysian public buildings, typical water tariffs range from RM1.50 to RM3.50 per cubic meter depending on location and consumption tier. For fixture replacement projects, typical payback periods range from 2 to 5 years depending on fixture type, replacement cost, and water tariff. For greywater reuse systems, payback periods typically range from 5 to 10 years depending on system complexity, treatment requirements, and the balance between greywater generation and reuse demand. For rainwater harvesting systems, payback periods typically range from 3 to 8 years depending on tank size, roof catchment area, annual rainfall, and water tariff. Projects with payback periods below 5 years are generally considered economically attractive for public sector investment.
Table 3 presents typical capital costs, annual savings, and payback periods for common conservation technologies applicable to Malaysian public buildings, providing reference values for economic analysis and investment prioritization.
7. Implementation Framework and Prioritization
The systematic assessment and retrofitting of pre-2012 public buildings requires a structured implementation framework that prioritizes interventions based on water savings potential, economic viability, and strategic importance. This section presents a phased implementation approach and prioritization methodology for deploying the assessment framework across Malaysia's public building inventory.
7.1. Phased Implementation Approach
The implementation framework follows a four-phase approach beginning with pilot assessment of representative buildings from each building type to validate methodology, refine indicators, and establish baseline benchmarks. The pilot phase should include 5 to 10 buildings per building type selected to represent diverse sizes, ages, and operational characteristics. The pilot assessment provides empirical data to calibrate consumption models, validate indicator thresholds, and identify implementation challenges requiring methodology refinement.
Following successful pilot completion, the framework proceeds to systematic assessment of the broader building inventory, prioritizing high-consumption facilities and buildings in water-stressed regions. The systematic assessment phase employs the validated methodology to characterize consumption patterns, calculate performance indicators, and identify conservation opportunities across the public building stock. This phase generates the comprehensive baseline data necessary for evidence-based retrofitting prioritization and water security planning.
The third phase implements priority retrofitting interventions in buildings identified as high-consumption outliers or low-efficiency performers through the benchmarking analysis. Retrofitting projects should be sequenced based on economic criteria including payback period and benefit-cost ratio, technical feasibility, and strategic importance. High-priority candidates include buildings with benchmarking efficiency below 70 percent, buildings in water-stressed regions with WSI exceeding 0.8, and buildings with simple payback periods below 5 years for proposed conservation measures.
The fourth phase establishes ongoing monitoring and continuous improvement systems to track performance over time, evaluate conservation measure effectiveness, and identify emerging inefficiencies. The monitoring system should include quarterly indicator calculation and review, annual benchmarking analysis to update efficiency rankings, and periodic re-auditing of retrofitted buildings to verify savings persistence and identify additional conservation opportunities.
7.2. Prioritization Methodology
The prioritization of buildings for assessment and retrofitting employs a multi-criteria scoring system that integrates water consumption magnitude, efficiency performance, economic viability, and strategic importance. The prioritization score for a building is calculated using Equation (Eq.15):
 Where:
- Pscore
- : overall prioritization score
- W1-4
- : weighting factors
- Sconsumption
- : normalized scores
- Sefficiency
- : normalized scores
- Seconomic
- : normalized scores
- Sstrategic
- : normalized scores
The consumption magnitude score reflects absolute water consumption with higher scores assigned to buildings with greater consumption, calculated as the building's annual consumption divided by the 90th percentile consumption for its building type, capped at 100. The efficiency performance score reflects benchmarking efficiency with lower efficiency receiving higher priority scores, calculated as 100 minus the benchmarking efficiency percentage. The economic viability score reflects payback period with shorter payback receiving higher scores, calculated as 100 divided by payback period in years, capped at 100. The strategic importance score reflects factors including location in water-stressed regions, visibility as demonstration projects, and alignment with policy priorities, assigned through expert judgment on a 0 to 100 scale.
Recommended weighting factors for Malaysian public building prioritization are W1 equals 0.30 for consumption magnitude, W2 equals 0.30 for efficiency performance, W3 equals 0.25 for economic viability, and W4 equals 0.15 for strategic importance. These weights balance the objectives of maximizing absolute water savings, improving efficiency of underperforming buildings, ensuring economic viability, and addressing strategic priorities. Buildings with prioritization scores exceeding 70 are designated as high-priority candidates for immediate assessment and retrofitting.
7.3. UBBL 2012 Amendment Impact Timeline
The implementation of water efficiency requirements through the UBBL 2012 amendment represents a critical regulatory milestone that fundamentally altered building water management practices in Malaysia. Figure 4 presents a timeline showing the evolution of building water efficiency regulation and the resulting bifurcation of building stock into pre-2012 legacy buildings and post-2012 compliant buildings.
Figure 4 Timeline of UBBL 2012 amendment implementation and impact on Malaysian public building water efficiency. The timeline shows: (1) Pre-2012 period characterized by absence of mandatory water efficiency requirements, resulting in legacy building stock with standard-flow fixtures, no rainwater harvesting, and limited sub-metering; (2) 2012 amendment introducing mandatory water efficiency provisions including rainwater harvesting requirements, water-efficient fixture specifications, and greywater reuse provisions; (3) Post-2012 period showing gradual adoption in new construction while pre-2012 building stock remains largely unmodified; (4) Current assessment imperative to characterize pre-2012 building consumption and prioritize retrofitting interventions. The timeline illustrates the regulatory gap that created the bifurcated building stock requiring systematic assessment and retrofitting to achieve water security objectives.
The timeline illustrates that while the UBBL 2012 amendment established progressive water efficiency standards for new construction, the extensive inventory of pre-2012 public buildings constructed over several decades prior to the amendment remains largely uncharacterized and unmodified. This regulatory gap creates both a challenge and an opportunity, with the challenge being the magnitude of the legacy building stock requiring assessment and retrofitting, and the opportunity being the substantial water savings potential achievable through systematic intervention in this underperforming building inventory.
8. Discussion
The development and application of the proposed assessment framework addresses a critical gap in Malaysian water resource management by providing systematic methodology for characterizing water consumption in pre-2012 public buildings and prioritizing retrofitting interventions. This section discusses the framework's contributions, limitations, and implications for water security planning and policy development.
8.1. Framework Contributions and Innovations
The assessment framework enhances water demand management in Malaysia by offering building-type-specific indicators for various structures, improving evaluation accuracy. It combines methods like water auditing and metering for comprehensive assessment and ongoing monitoring, facilitating continuous improvement. Moreover, it targets pre-2012 buildings, which have significant efficiency gaps, presenting key conservation opportunities. Lastly, the framework includes economic analysis tools for prioritizing interventions based on return on investment, aiding evidence-based decision-making in resource-constrained public sectors.
8.2. Research Gaps and Limitations
Despite the contributions of the framework, it faces limitations, notably the lack of empirical data on police station water consumption, necessitating reliance on estimated benchmarks. This gap highlights the urgent need for empirical studies in Malaysian and similar tropical contexts. Furthermore, the transferability of international benchmarks is limited by differences in local conditions such as climate and cultural water use patterns, necessitating a pilot assessment phase for validation. Additionally, the framework's reliance on aggregated annual or monthly data restricts understanding of temporal consumption patterns, which are essential for identifying peak demands and evaluating demand management strategies. Lastly, behavioral and organizational factors significantly influence water consumption, calling for future research to explore these dimensions to enhance conservation efforts in Malaysian public buildings.
8.3. Policy Implications and Recommendations
The assessment framework significantly influences Malaysian water policy and public building management by enabling the creation of a national water efficiency program that targets pre-2012 buildings, establishes performance benchmarks, and prioritizes retrofitting investments, complemented by the UBBL 2012 amendment. It facilitates evidence-based allocation of public resources by prioritizing interventions based on consumption, efficiency, and economic viability, ensuring effective use of limited funds. The framework also advocates for building-type-specific assessment approaches to tailor water efficiency policies by considering different operational characteristics, which enhances conservation effectiveness. Notable water savings potential from retrofitting pre-2012 buildings has been quantified, with reported savings of up to 82% for government offices and significant potential in mosques through greywater reuse, emphasizing the need for committed implementation and funding to realize these conservation goals.
8.4. Integration with Water Stress Management
The assessment framework aids water stress management in Peninsular Malaysia by emphasizing demand-side interventions that enhance supply-side strategies. It highlights the urgent need for conservation in urbanized areas with high public building density, quantifying savings potential and aligning them with integrated water resource planning. Prioritizing retrofitting in critical water-stressed regions increases the efficacy of conservation investments, addressing both immediate demands and long-term sustainability through ongoing monitoring and performance tracking. This approach is crucial for achieving lasting water security by recognizing the necessity for sustained demand management efforts beyond 2030.
9. Conclusions
This study introduces a comprehensive framework for assessing water supply and demand in Malaysian public buildings constructed before the UBBL 2012 amendment, focusing on government offices, hospitals, police stations, and mosques. It combines water auditing, metering strategies, benchmark approaches, and performance indicators to analyze water consumption patterns and prioritize retrofitting interventions. Findings reveal significant water consumption variations, especially in hospitals and government offices, with identified efficiencies and potential savings. The economic analysis indicates favorable payback periods for conservation technologies like fixture replacements and greywater reuse systems. The framework suggests a phased implementation approach and highlights future research needs, particularly for police stations, to validate benchmarks and enhance conservation strategies across public buildings in Malaysia.
Author Contributions
Conceptualization, Naim Shauqi bin Mohd Noor and Faridahanim binti Ahmad; methodology, Naim Shauqi bin Mohd Noor and Faridahanim binti Ahmad; software, Naim Shauqi bin Mohd Noor; validation, Naim Shauqi bin Mohd Noor, Faridahanim binti Ahmad and Ahmad Farhan bin Hamzah; formal analysis, Naim Shauqi bin Mohd Noor and Ahmad Farhan bin Hamzah; investigation, Naim Shauqi bin Mohd Noor and Ahmad Farhan bin Hamzah; resources, Faridahanim binti Ahmad and Ahmad Farhan bin Hamzah; data curation, Naim Shauqi bin Mohd Noor and Ahmad Farhan bin Hamzah; writing original draft preparation, Naim Shauqi bin Mohd Noor; writing review and editing, Faridahanim binti Ahmad and Ahmad Farhan bin Hamzah; visualization, Naim Shauqi bin Mohd Noor; supervision, Faridahanim binti Ahmad; project administration, Faridahanim binti Ahmad; funding acquisition, N/A (self-funded research). All authors have read and agreed to the published version of the manuscript.
Funding
This research received no external funding.
Data Availability Statement
The datasets presented in this article are not readily available because the data are part of an ongoing study. Requests to access the datasets should be directed to naimshauqi@nahrim.gov.my.
Acknowledgments
The author gratefully acknowledges the support of Universiti Teknologi Malaysia (UTM) and the National Water Research Institute of Malaysia (NAHRIM) for providing professional and institutional support. This research was self-funded.
Conflicts of Interest
The authors declare no conflicts of interest. Naim Shauqi bin Mohd Noor and Faridahanim binti Ahmad are affiliated with Universiti Teknologi Malaysia, and Ahmad Farhan bin Hamzah is affiliated with the National Water Research Institute of Malaysia. These institutional affiliations represent the authors' professional positions and do not constitute a conflict of interest. The research was self-funded, and the supporting institutions had no role in the design of the study; in the collection, analyses, or interpretation of data; in the writing of the manuscript; or in the decision to publish the results.
Abbreviations
The following abbreviations are used in this manuscript:
| ASCE | American Society of Civil Engineers |
| HVAC | Heating, Ventilation, and Air Conditioning |
| IWA | International Water Association |
| NAHRIM | National Water Research Institute of Malaysia |
| UBBL | Uniform Building By-Laws |
| UTM | Universiti Teknologi Malaysia |
| WSI | Water Stress Index |
References
- Batista, A.A.S.; Silva, M.M.; Santos, D.C.; Oliveira, R.B. Systematic review of indicators for the assessment of water consumption rates at hospitals. Water Supply 2020, 20, 1–15. [CrossRef]
- Silva, M.M.; Santos, D.C.; Oliveira, R.B.; Costa, A.M. Rational Consumption of Water in Administrative Public Buildings: The Experience of the Bahia Administrative Center, Brazil. Water 2014, 6, 2552–2574. [CrossRef]
- Sihombing, P.R.; Wijaya, A.; Kusuma, D. Sustainable Water Management: Greywater Reuse and Smart Irrigation at Pusgiwa UI. Int. J. Soc. Health 2025, 4, Article 316.
- Latif, A.Z.A.; Rahman, M.A.; Hassan, N. A Road Map for Intervention Research to Enhance Rainwater Harvesting By-Laws Adherence in Malaysia: A Short Communication. Int. J. Acad. Res. Bus. Soc. Sci. 2023, 13, Article 17435.
- Nazir, N.N.M.; Ahmad, F.; Hamzah, A.F. Developing criteria for evaluations of water closet facilities in malaysian mosques and it's compliance with standards, guidelines and legislation. J. Des. Built Environ. 2018, 18, Article 2.
- Marinho, M.; Silva, J.F.; Costa, R.P. The AGUAPURA Program for water consumption rationalization at the Federal University of Bahia. Figshare 2019. Available online: https://doi.org/10.6084/m9.figshare.9276020 (accessed on 15 December 2024).
- Flores, T.; Silva, A.M.; Costa, J.P. Benchmarking Water Efficiency in Public School Buildings. Sustainability 2022, 14, 3794. [CrossRef]
- Flores, T.; Silva, A.M.; Costa, J.P. Water Benchmarking in Buildings: A Systematic Review on Methods and Benchmarks for Water Conservation. Water 2022, 14, 473. [CrossRef]
- Zhang, Y.; Wang, L.; Chen, X. A method for calculating the water savings at typical hospitals. J. Comput. Methods Sci. Eng. 2023, 23, 677–690.
- Berhanu, B.T.; Smith, J.A.; Johnson, K.L. Leveraging Disparate Parcel-Level Data to Improve Classification and Analysis of Urban Nonresidential Water Demand. J. Water Resour. Plan. Manag. 2020, 146, 04019062. [CrossRef]
- Osman, W.N.; Abdullah, R.; Ismail, Z. An Evaluation of the Water Conservation System: A Case Study in Diamond Building. In Proceedings of the International Conference on Innovation in Architecture, Urbanism and Engineering, Singapore, 2018. [CrossRef]
- Ono, S. Non-price Mechanisms. In SpringerBriefs on Case Studies of Sustainable Development; Springer: Singapore, 2023; pp. 89–112. [CrossRef]
- Landicho, K.; Vital, A.; Reyes, R. Modelling Domestic Water Demand and Management Using Multi-Criteria Decision Making Technique. In Proceedings of the International Conference on Industrial Engineering and Operations Management, Bangkok, Thailand, 2019.
- Ismail, Z.; Baba, R.; Ramli, N. Occupants' satisfaction on building maintenance of government quarters. In Proceedings of the AIP Conference, Melaka, Malaysia, 2017. [CrossRef]
- Woon, K.S.; Rahman, A.A.; Hassan, M.N. Community rainwater harvesting financial payback analyses - case study in Malaysia. IOP Conf. Ser. Mater. Sci. Eng. 2019, 636, 012019.
- Moura, A.C.; Santos, M.L.; Silva, J.F. Avaliação da percepção dos usuários para o uso racional e sustentável da água em prédio público administrativo do município de recife-pe. RGSA 2016, 5, 165–174.
- Praveena, S.M.; Aris, S.Z.; Radojevic, M.F. Water Conservation Initiative in a Public School from Tropical Country: Performance and Sustainability Assessments. Res. Sq. 2021, in press. [CrossRef]
- Lai, C.; Zaini, S.; Haron, N. Cost Implication of Water Efficiency Devices on Building Cost: Case Studies of Malaysia. SSRN Electron. J. 2024, preprint.
- Zaini, S.; Haron, N.; Majid, M. Water efficiency in Malaysian commercial buildings: a green initiative and cost-benefit approach. Int. J. Build. Pathol. Adapt. 2021, accepted. [CrossRef]
- Memon, F.; Ward, S.; Butler, D. Energy and Carbon Implications of Water Saving Micro-Components and Greywater Reuse Systems; IWA Publishing: London, UK, 2014.
- Santos, D.C.; Silva, M.A.; Oliveira, R.B. A Statistical Approach to the Impact of Qualitative Variables on Water Consumption in Schools. RGSA 2023, 18, Article 034.
- Córdova, M.A.; Guevara, J.P.; Hidalgo, L.E. Harnessing Sustainable Water Management through Innovation and Efficiency at ESPOCH. J. Sustain. Perspect. 2023, 3, Article 20566.
- Kurniawan, T.A.; Othman, M.H.D.; Singh, G. Constraints in the recycled wastewater utilization in an office building in jakarta. Jurnal Sumber Daya Air 2024, 20, Article 879.
- İmamoğlu, G.; Köse, Y.; Derici, E. Efficiency of Water Utilization in Health Institutions Based on Provinces. Turk. Bull. Hyg. Exp. Biol. 2017, 74, 63–72. [CrossRef]
- Arens, P. Einsparpotenziale bei Planung und Betrieb von Trinkwasserinstallationen. HLH 2024. Available online: https://doi.org/10.37544/1436-5103-2024-07-08-48 (accessed on 20 December 2024).
- Sharma, A. AI-Based Water Usage Monitoring and Reduction in Hospital Operations. Int. J. Latest Technol. Eng. Manag. Appl. Sci. 2025, 14, Article 124.
- Yu, X. Application and Effect Evaluation of High-Efficiency Water-Saving Equipment in Public Buildings. Gong Cheng Shi Gong Ji Shu 2025, 3, Article 16465.
Figure 1.
Water stress index for 2015 (baseline), 2020 (observed) and 2030 (projected).
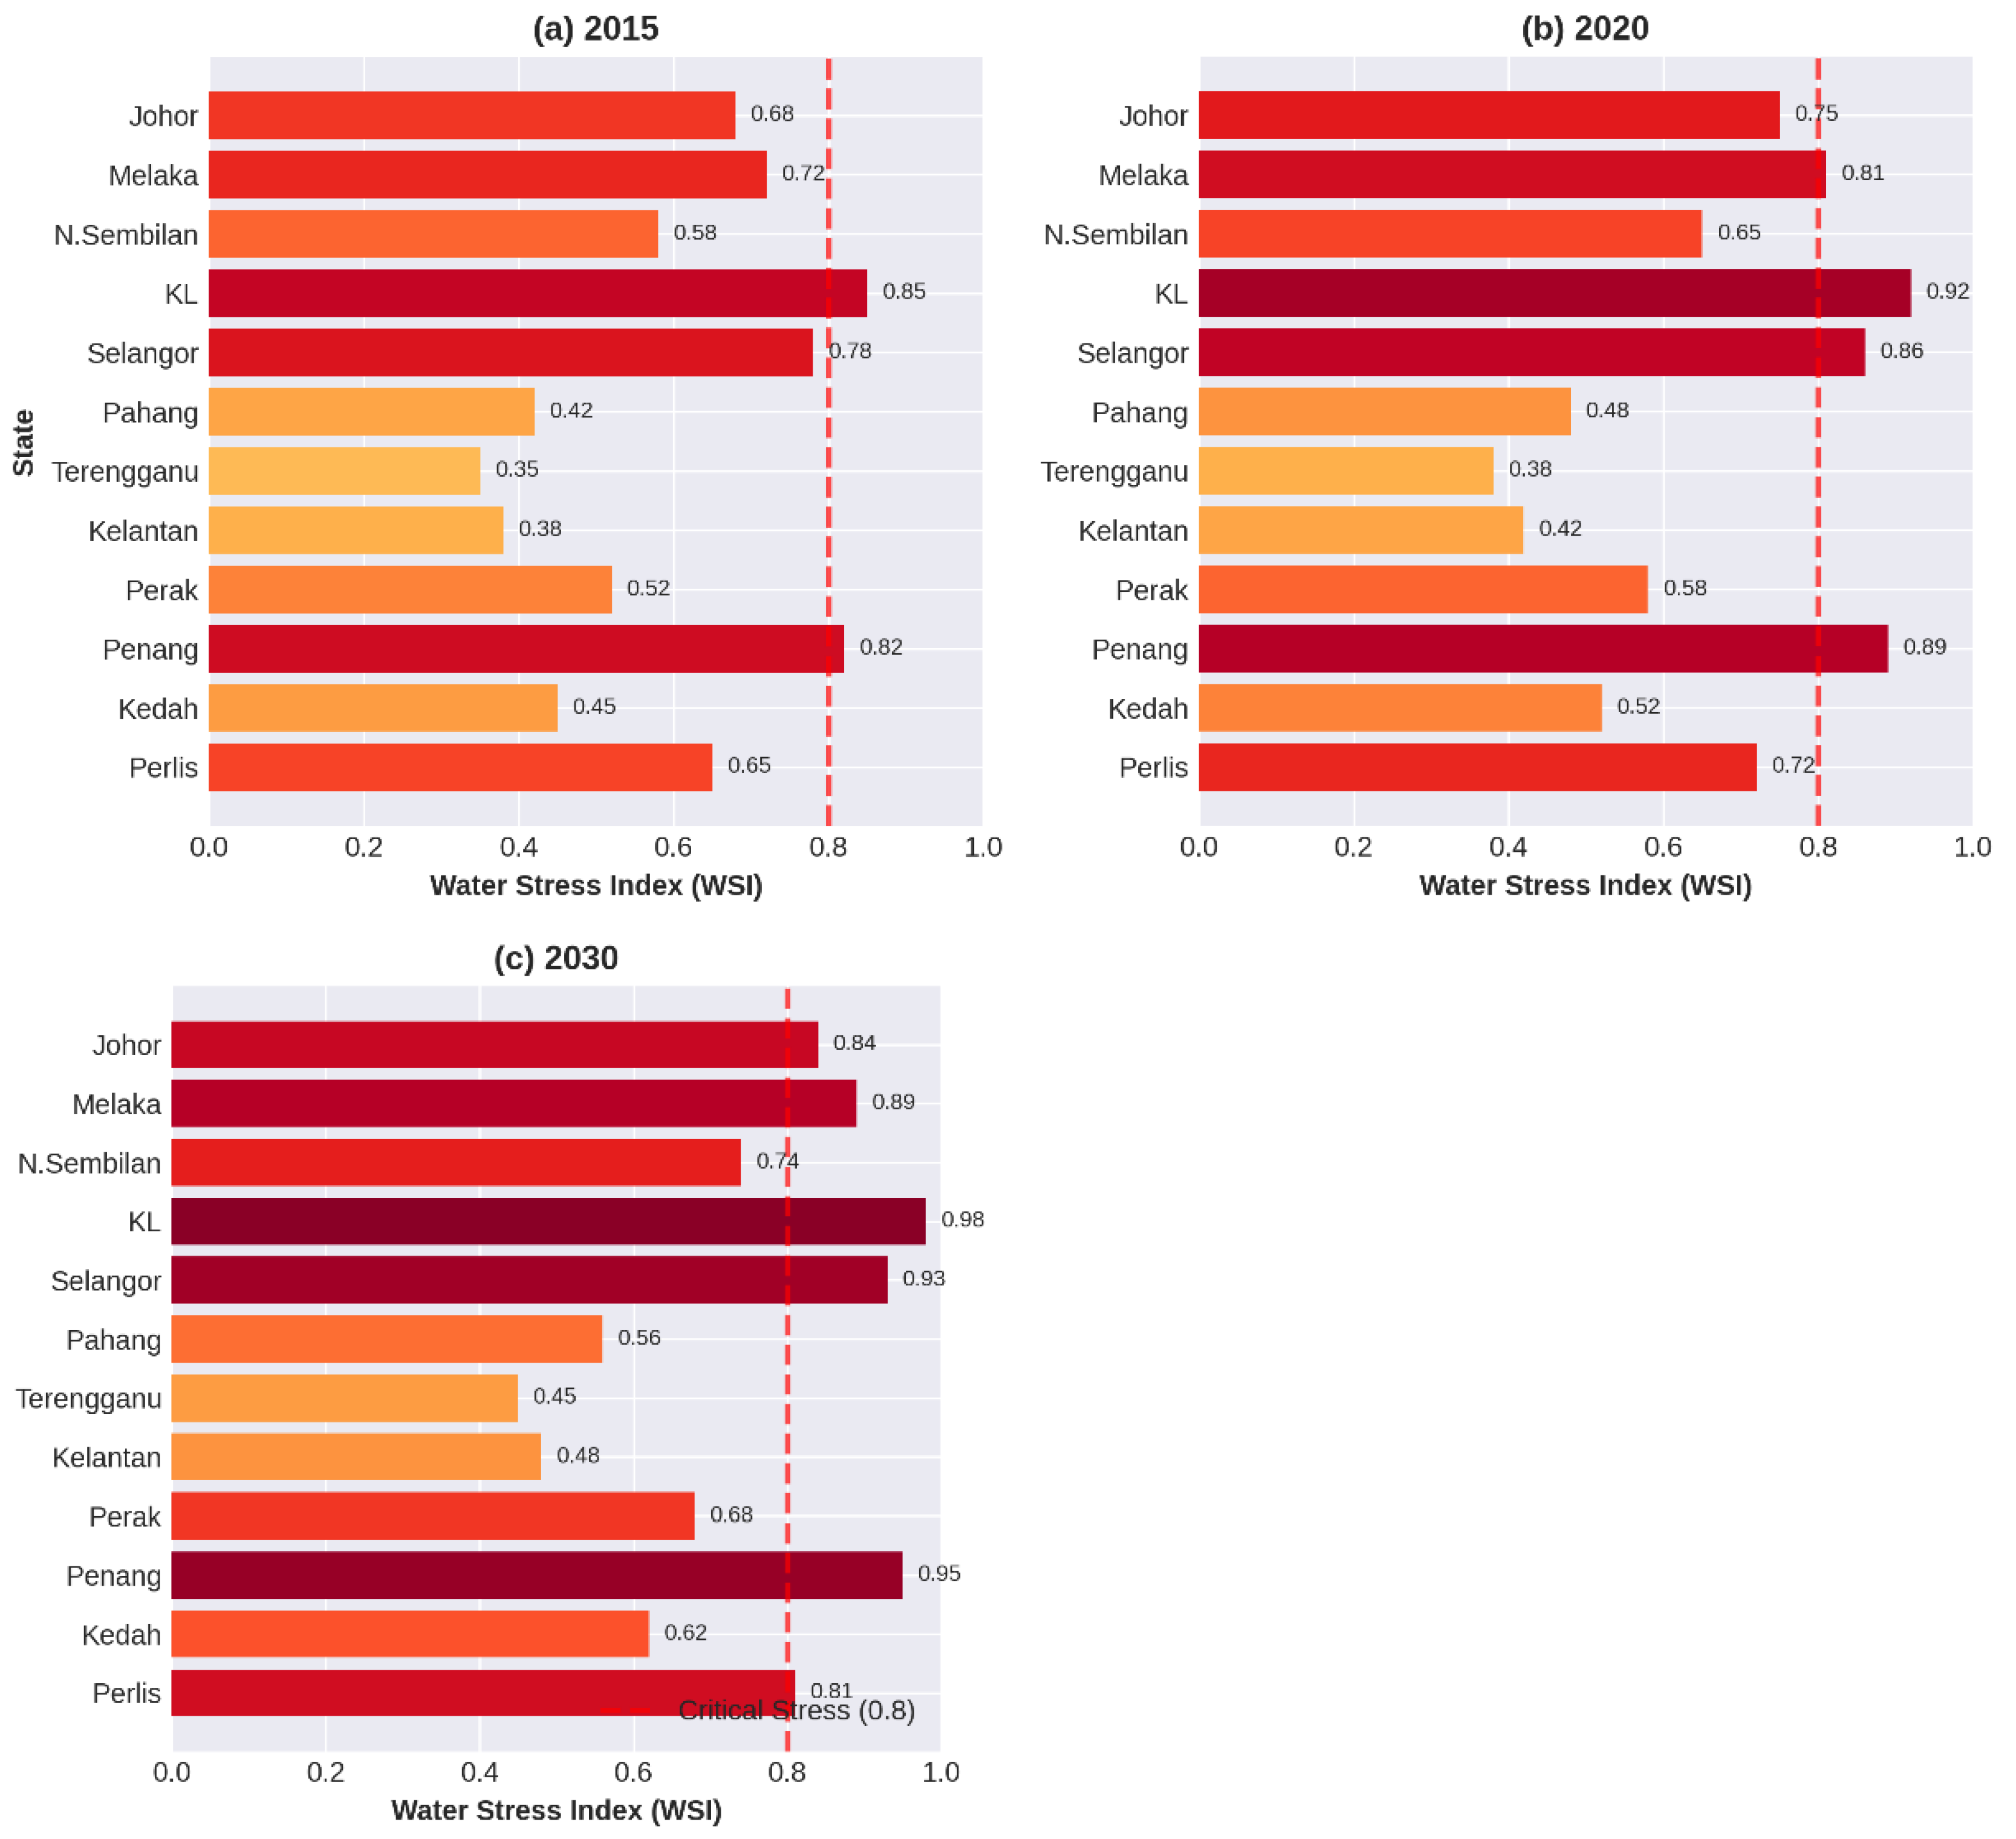
Figure 2.
Four phase assessment methodology framework for Pre-UBBL 2012 public buildings.

Figure 3.
Comparative water consumption pattern across public buildings.
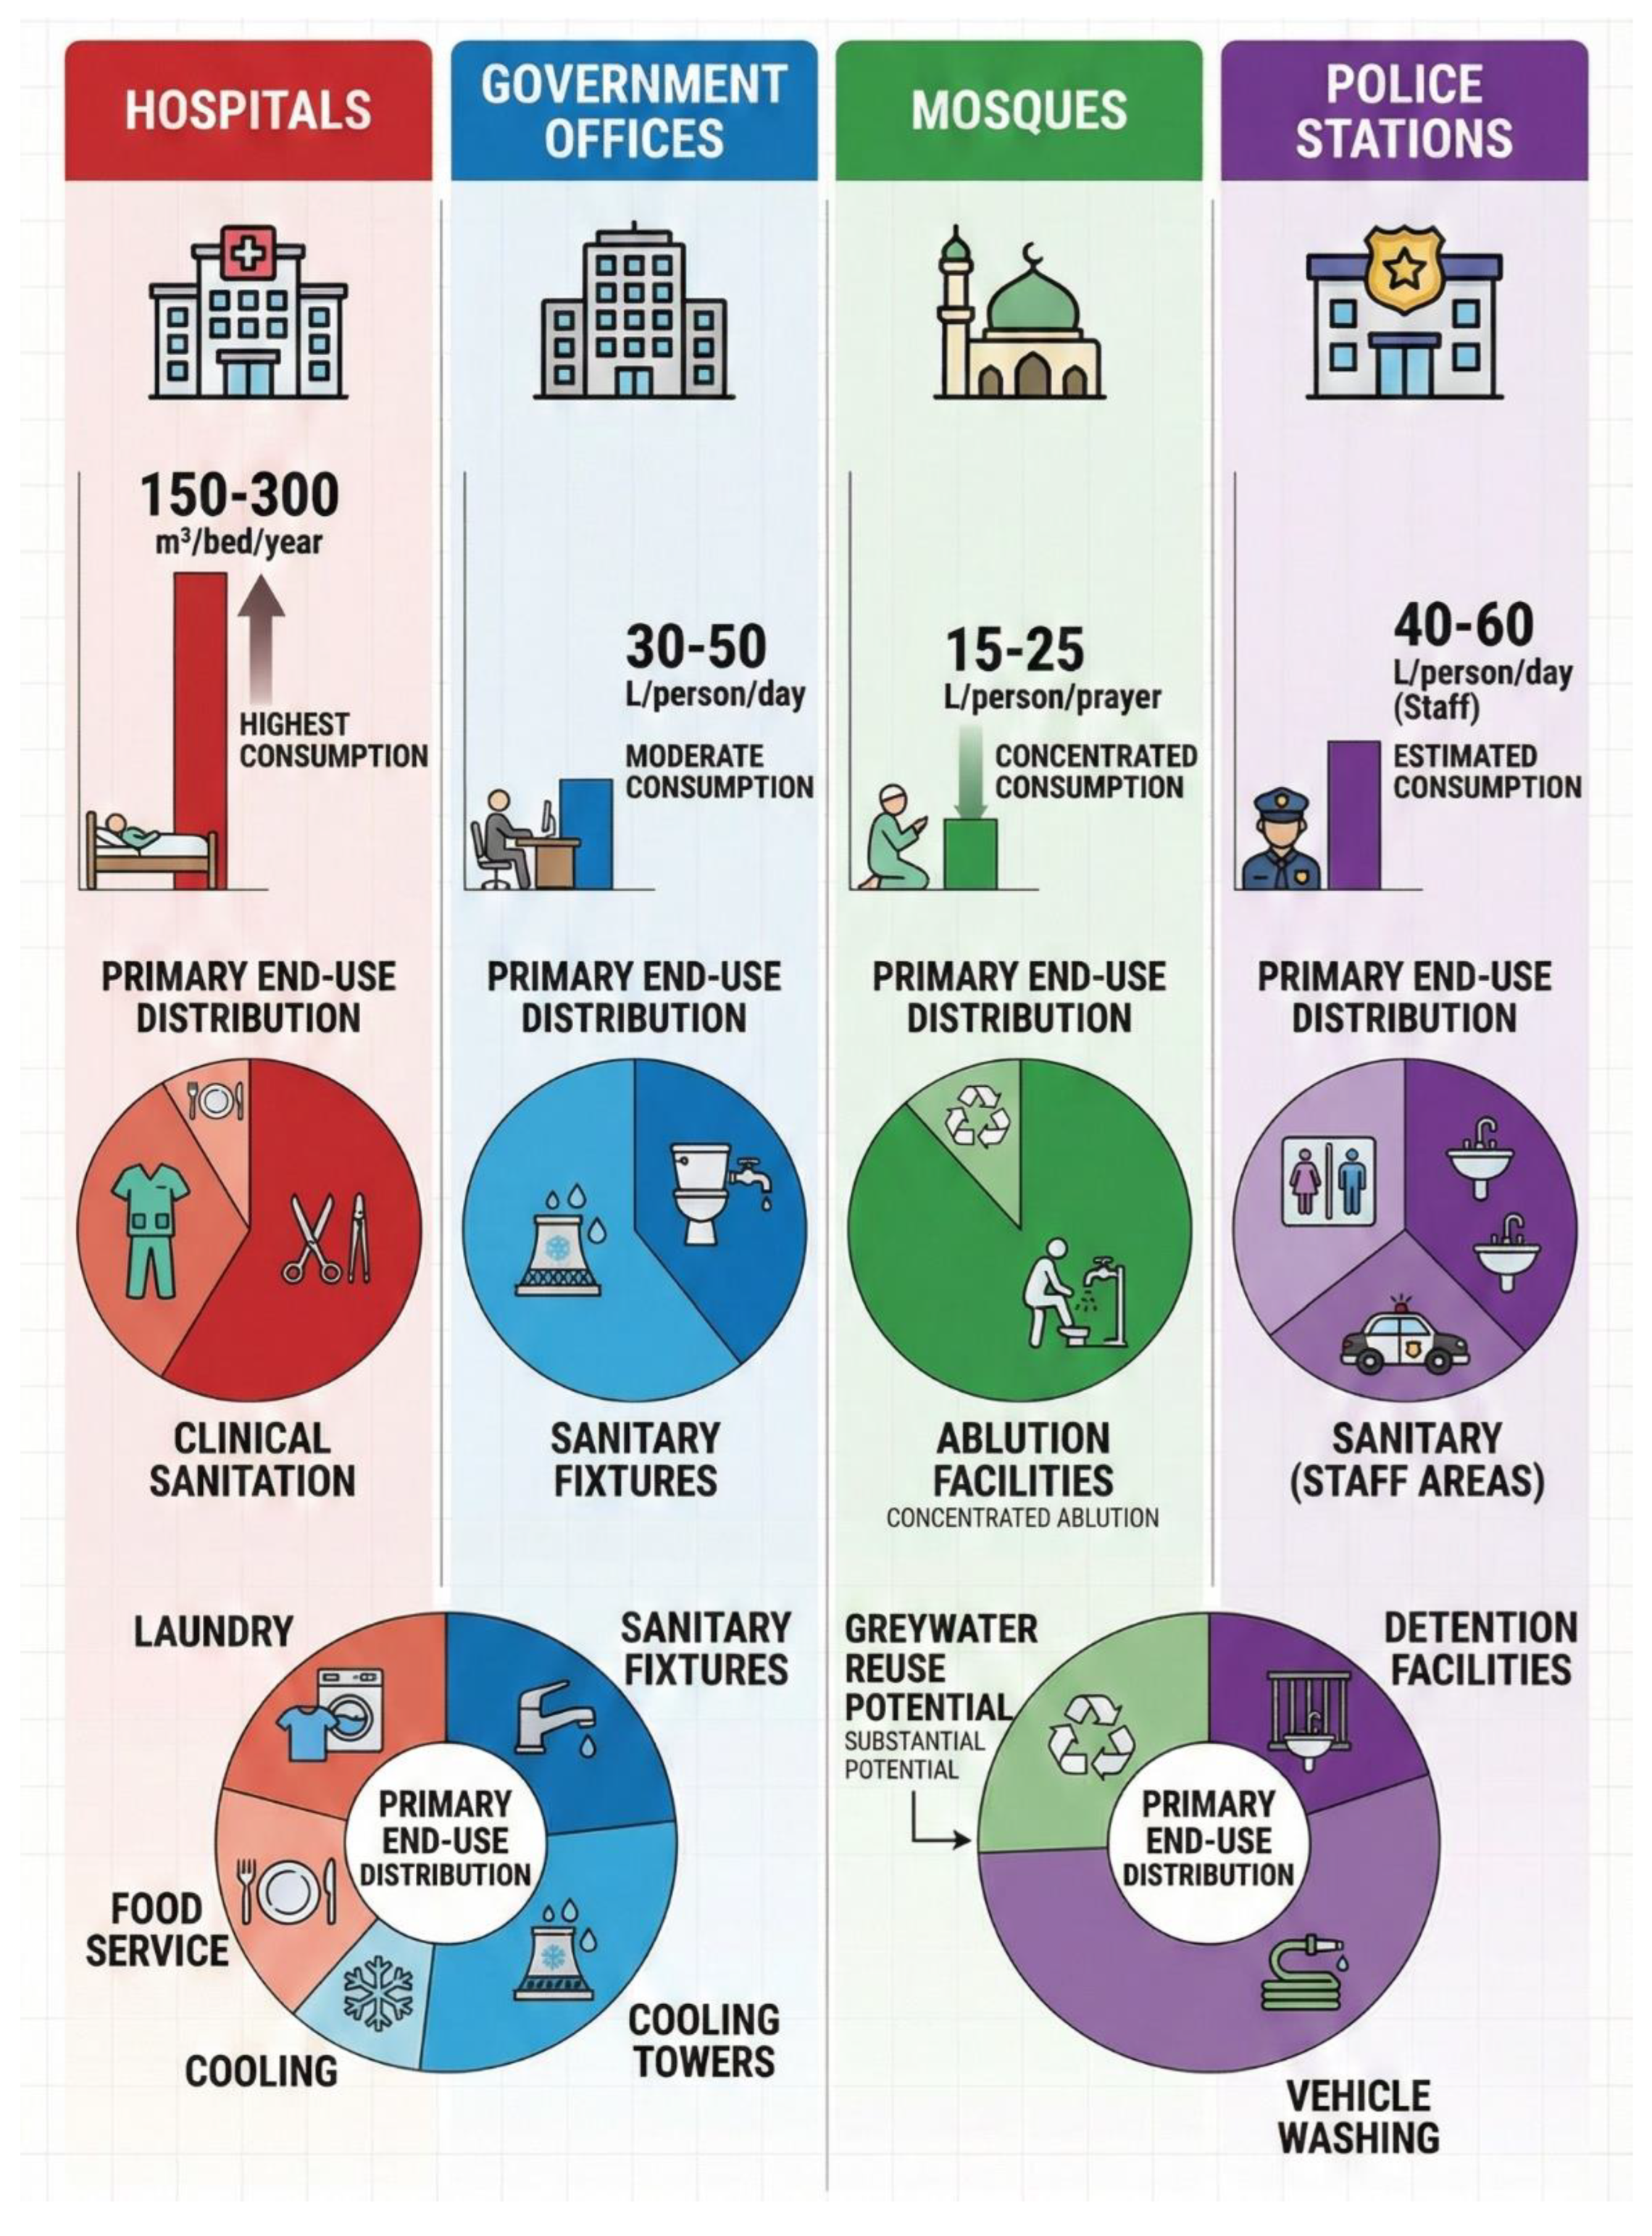
Figure 4.
Implementation and impact of UBBL 2012 amendment.
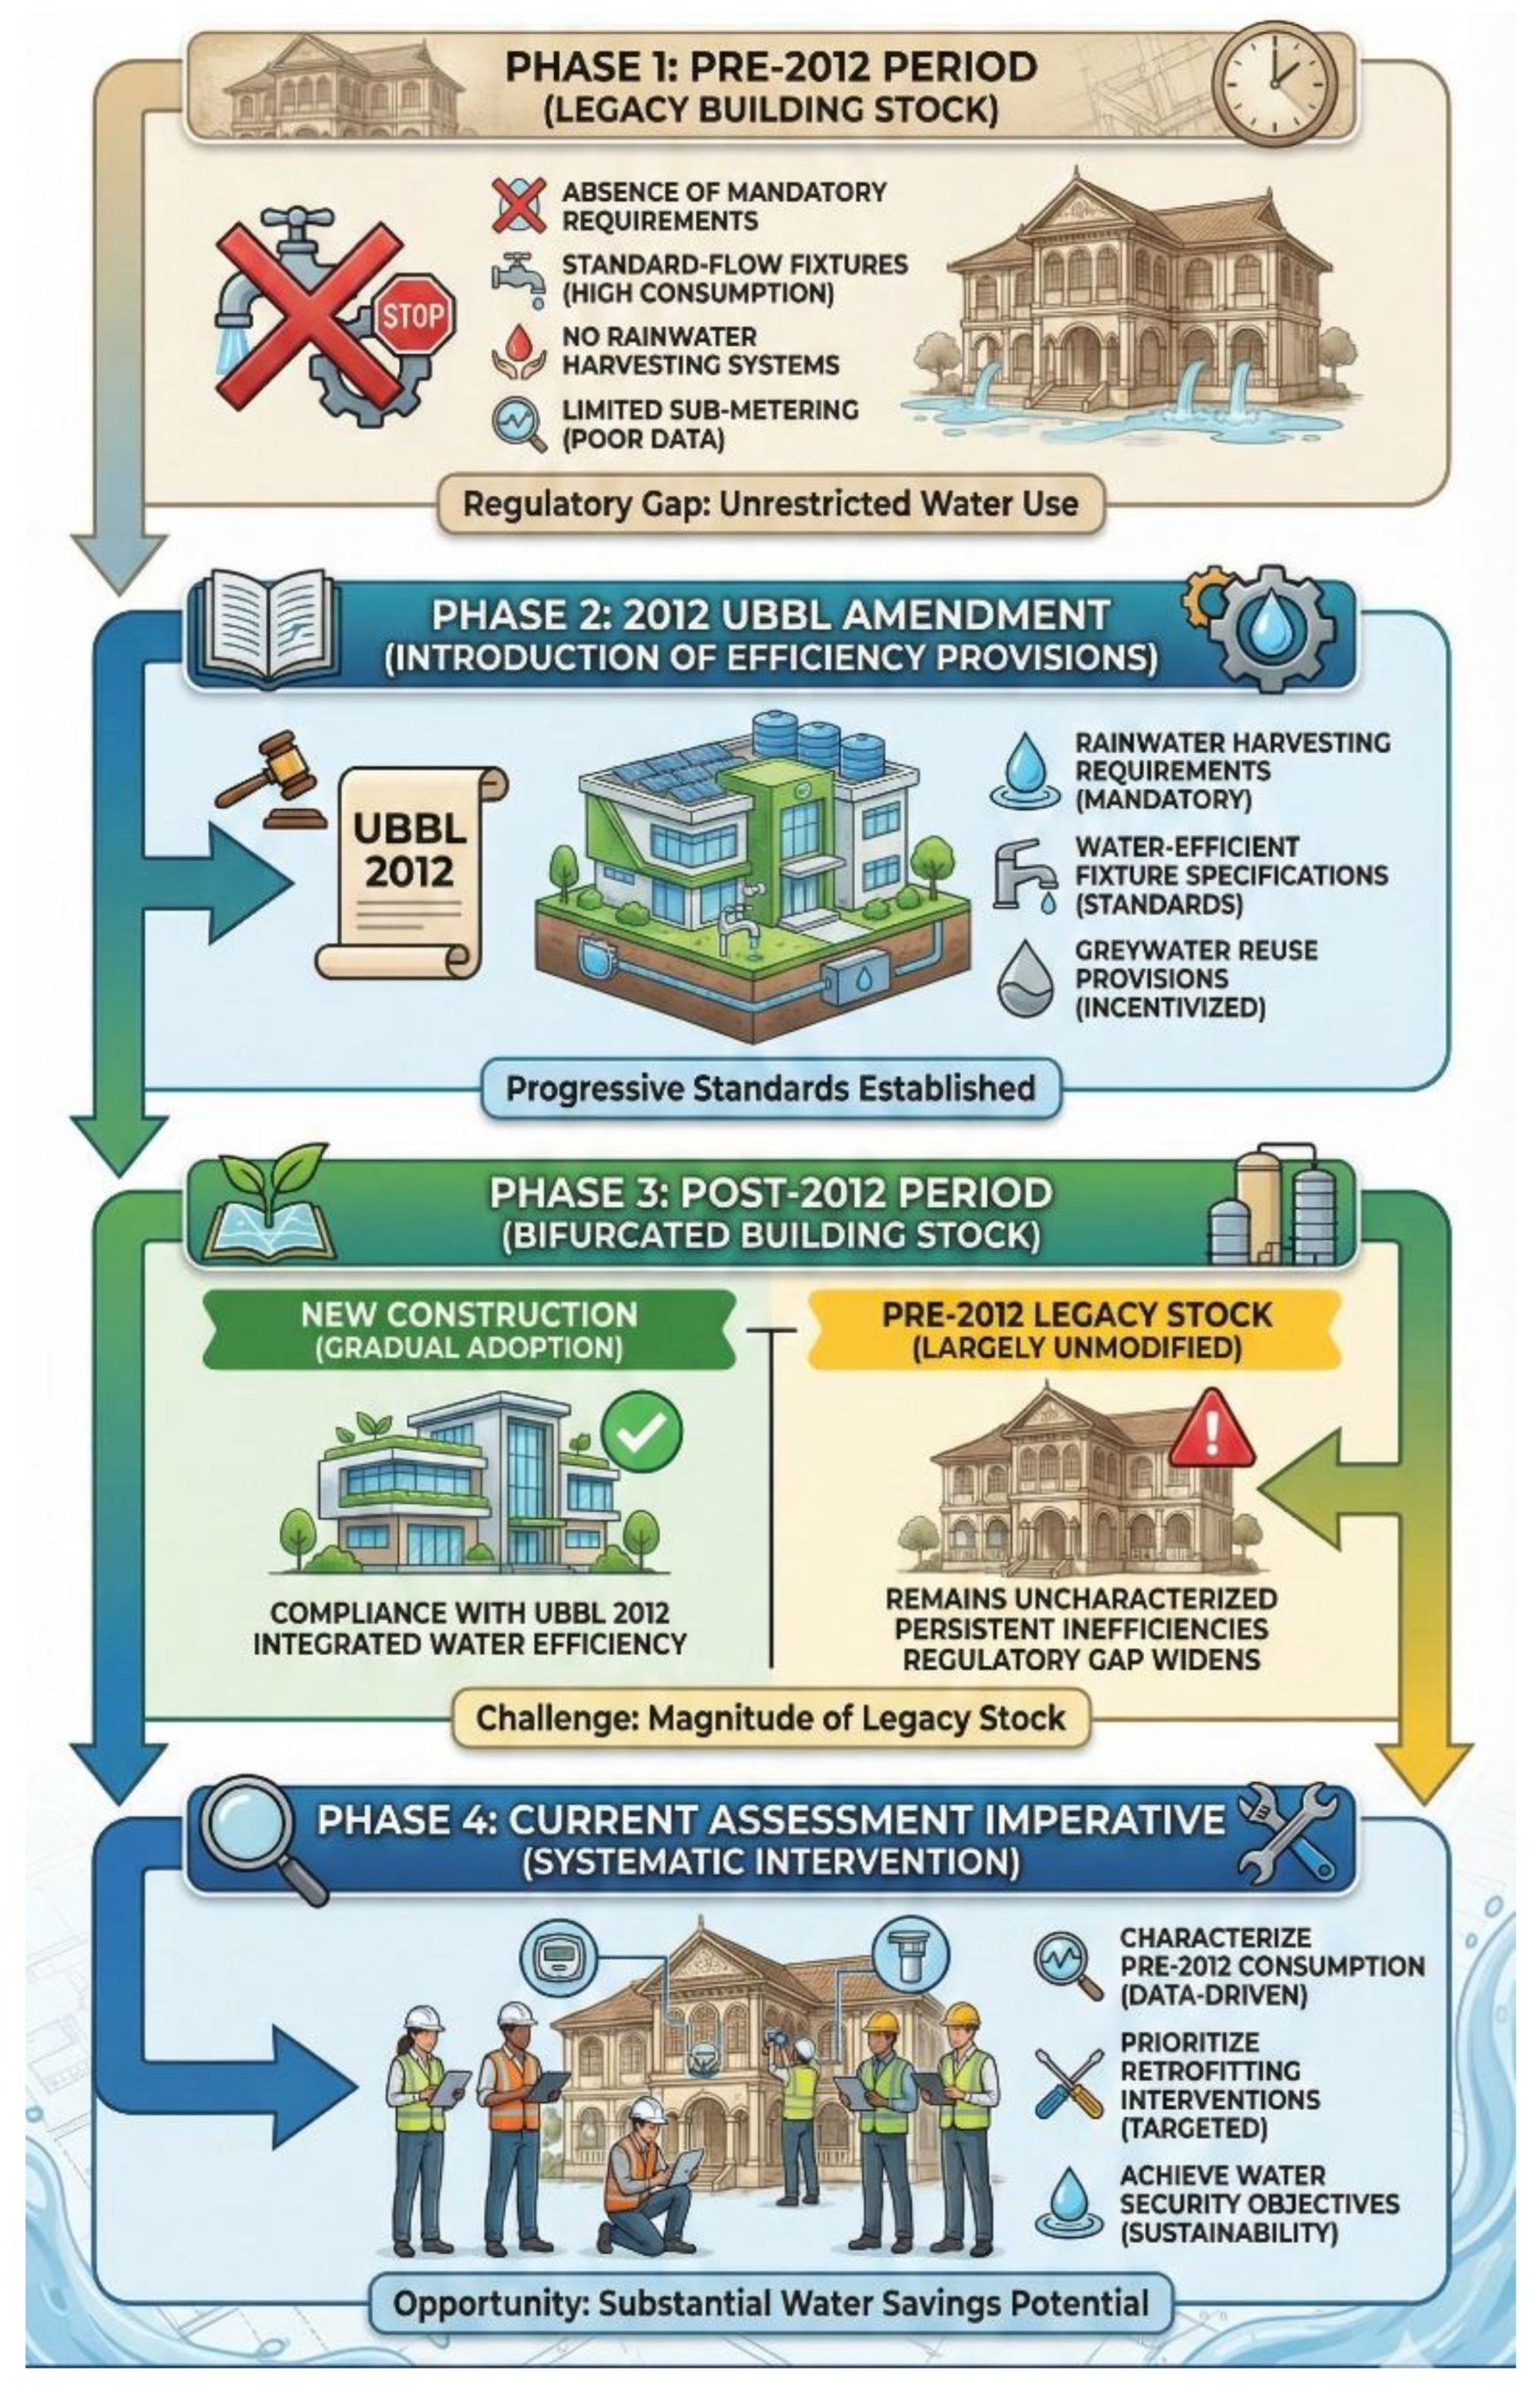

Table 1.
Building-type-specific water consumption benchmarks for Malaysian public buildings.
| Building Type | Primary Indicator | Benchmark Range | Unit | Secondary Indicator | Benchmark Range | Unit |
|---|---|---|---|---|---|---|
| Hospital | Per bed | 150 - 300 | m³/bed/year | Per area | 0.8 - 1.5 | m³/m²/year |
| Government office | Per capita | 30 - 50 | l/person/day | Annual per occupant | 7.5 - 12.5 | m³/person/year |
| Mosque | Per ablution | 3 - 5 | l/person | Per prayer attendance | 15 - 25 | l/person/prayer |
| Police Station | Per capita | 40 - 60 | l/person/day | Detainee per capita | 80 - 120 | l/person/day |
Table 2.
Building-type-specific performance indicators for water consumption assessment.
| Building Type | Primary Indicator | Calculation Method | Interpretation Threshold | Secondary Indicator | Calculation Method |
|---|---|---|---|---|---|
| Hospital | Annual water use per bed | Ibed=Wannual/Nbed | Efficient: < 200 m³/bed/year Typical: 200-300 m³/bed/year Inefficient: > 300 m³/bed/year |
Annual water use per area | larea=Wannual/Afloor |
| Government Office | Daily per capita consumption | Icapita=Wdaily/Noccupant | Efficient: < 40 L/person/day Typical: 40-60 L/person/day Inefficient: > 60 L/person/day |
Monthly consumption per area | larea=Wmonthly/Afloor |
| Mosque | Water per prayer attendance | Iprayer=Wdaily/ sum (Nprayer) |
Efficient: < 15 L/person/prayer Typical: 15-25 L/person/prayer Inefficient: > 25 L/person/prayer |
Ablution water efficiency | Iablution=Wablution/Nablution |
| Police Station | Daily per capita (staff) | Istaff=W(daily,admin)/ Nstaff | Efficient: < 50 L/person/day Typical: 50-70 L/person/day Inefficient: > 70 L/person/day |
Daily per capita (detainee) | Idetainee=Wdaily,detainee/ Ndetainee |
Table 3.
Economic analysis of water conservation technologies for Malaysian public buildings.
| Conservation Technology | Typical Capital Cost | Annual Water Savings | Water Cost Savings (RM/year)* | Payback Period (years) | Applicability |
|---|---|---|---|---|---|
| Dual-flush toilet replacement | RM 800 - 1,200 per fixture | 15 - 25 m³ per fixture | RM 38 - 88 | 2 - 4 | All building types |
| Waterless urinal installation | RM 1,500 - 2,500 per fixture | 30 - 50 m³ per fixture | RM 75 - 175 | 2 - 5 | Offices, mosques, police stations |
| Faucet aerator installation | RM 50 - 150 per fixture | 5 - 10 m³ per fixture | RM 13 - 35 | 0.5 - 2 | All building types |
| Greywater reuse system (mosque) | RM 15,000 - 40,000 | 200 - 500 m³ | RM 500 - 1,750 | 5 - 10 | Mosques with ablution facilities |
*Water cost savings calculated assuming water tariff of RM 2.50 per m³ including supply and wastewater charges. Actual savings vary by location and consumption tier.
Disclaimer/Publisher’s Note: The statements, opinions and data contained in all publications are solely those of the individual author(s) and contributor(s) and not of MDPI and/or the editor(s). MDPI and/or the editor(s) disclaim responsibility for any injury to people or property resulting from any ideas, methods, instructions or products referred to in the content. |
© 2026 by the authors. Licensee MDPI, Basel, Switzerland. This article is an open access article distributed under the terms and conditions of the Creative Commons Attribution (CC BY) license (http://creativecommons.org/licenses/by/4.0/).
Copyright: This open access article is published under a Creative Commons CC BY 4.0 license, which permit the free download, distribution, and reuse, provided that the author and preprint are cited in any reuse.


