Submitted:
07 January 2026
Posted:
08 January 2026
You are already at the latest version
Abstract
Against the background of dramatic climate change, resource constraints and industrial upgrading, optimising the coupling and coordination of the water-energy-food (WEF) system in the northeast region is crucial to ensuring regional security and sustainable development. Existing research lacks long-term continuity and inter-provincial analysis. This article uses data from 2005 to 2023 to evaluate the development of the three northeastern provinces through 24 index frameworks covering safety, coordination and resilience. The methods include entropy weight method, coupling coordination model and constraint model. The result shows: (1) The overall development level fluctuates and has an upward trend, reaching a medium-coordinated level, and there are significant differences between provinces. (2) Coordination initially differentiated, and then gradually converged. From close to the improvement of the disorder to the level of moderate coordination, Liaoning Province declined under the impact of policies. (3) Systemic obstacles are structural and cross-regional, with energy self-sufficiency and water efficiency as key limiting factors. In order to achieve a high level of coordination between water, energy and food systems, it is necessary to formulate tailor-made subsystem governance policies, enhance the technological empowerment of water and energy conservation and efficiency improvement, and promote the development of resilient infrastructure. This integrated approach will systematically resolve resource competition conflicts, thus enhancing the overall resilience and sustainability of regional development.
Keywords:
water-energy-food
; coupling coordination
; obstacle degree model
; Northeast China
1. Introduction
Water, energy and food are the foundation of human well-being and sustainable social and economic development [1]. Rapid population growth and improved living standards continue to drive the demand for these resource. The United Nations estimates that by 2050, the global population will reach 10 billion [2], with food and energy demands expected to rise by 60% and 80% [3], respectively, compared to 2016 levels. Meanwhile, global water demand is projected to increase by 20%–30%, while around 4 billion people already reside in severely water-stressed basins [4]. Against pressures from population growth, climate change, and resource scarcity, the complex interdependencies among water, energy, and food systems have become a central focus in sustainability science. The research on the water-energy-food (WEF) system emphasises understanding the synergy and trade-off through the hub perspective, which provides an overall framework for coordinating resource management and ensuring security [5]. As an important industrial base and grain production area of China, the northeast region bears the dual responsibility of regional revitalisation and maintaining national security priorities, including national Defence, food, ecology, energy and industrial security [6]. At this stage, the northeast region is facing multiple pressures from climate change, resources restrictions and industrial transformation, making it a typical case of research system coordination and resilience. Water, energy and food form a mutually reinforcing system, which is characterised by both relative opposition or absolute interconnection. The concept of WEF association was first proposed at the Bonn Conference in 2011, and has since attracted wide attention among scholars at home and abroad [7]. Research on water, energy and food has developed from the early single resource management to examining the interaction between the three, and then turned to building a systematic analysis framework for the coordination of three resources, identifying synergy and trade-off effects, assessing the impact of climate change and trade, and developing coupling models [8,9]. Lay the theoretical foundation for this field. At present, the WEF correlation assessment methods are diverse. Based on the method of index system and comprehensive evaluation model, scholars Li Liang and Hao Xuechun used the pressure-state-response (PSR) framework and comprehensive matching index to build a multi-level index system, and applied models such as coupling coordination, element expansion and matching distance to quantitatively analyse regional system regulation [10,11,12,13]. Adopt the method of system efficiency and input-output analysis. Researchers Xian C and Sun Chengshuang, based on data envelope analysis (DEA) or super-efficiency undesirable relaxation measure (SEM) and other models, measure efficiency from the perspective of resource utilisation, and identify the loss point of efficiency [14,15,16,17,18]. Analyse the resource flow and supply and demand matching of WEF Scholars Feng Cheng and Qu Song used methods such as material flow analysis, water footprint accounting and virtual water concept to quantitatively analyse the flow of resources, and explained the important nodes in the physical flow of the system [6,19,20,21,22]. There are also studies to explore characterisation and case studies. Cai Xu, Wallington K and others provided policy support for the research and development of the WEF through policy interpretation in different regional contexts [23,24,25,26,27,28,29].
Through the collection of relevant literature, it is found that most of the existing studies focus on static or cross-sectional characteristics, and there are few studies on long-term dynamics, cross-provincial heterogeneity or systematic response under the common pressure of policy-climate-resourceThis article fills these gaps based on the situation of the three northeastern provinces of China from 2005 to 2023.This paper studies the spatial and temporal evolution characteristics and policy defects of the WEF system by building an evaluation framework covering the dimensions of safety, coordination and resilience, applying entropy weight method, coupled coordination modelling and obstacle diagnosis and other analytical methods. The purpose of the research is to explain how resource-based areas can strengthen system coordination and resilience under multiple pressures, and to provide empirical analysis and theoretical basis for such research.
2. Overview of the Study Area and Data Sources
2.1. Overview of the Study Area
Northeast China is located in the northeastern part of China, between 118°53′E to 135°05′E longitude and 38°43′N to 53°33′N latitude, specifically encompassing the complete geographical unit formed by Heilongjiang, Jilin, and Liaoning provinces. The overall terrain of Northeast China is characterized by mountains surrounding three sides and an open plain in the central area, with a total area of approximately 788,000 square kilometers, serving as an important national territorial space and old industrial base in China. The main land use types are forestland and cultivated land, which possess both ecological functions and agricultural production advantages, making it a national resource-rich region and core grain-producing area. This region has a temperate continental monsoon climate, with long and cold winters and warm and rainy summers. Precipitation is mainly concentrated from June to August, and the average annual precipitation decreases from southeast to northwest, ranging from approximately 1000 mm in the Changbai Mountain area to about 400 mm in the western Songnen Plain. The general situation map of the study area is shown in Figure 1.
2.2. Selection of Indicators and Data Sources
The WEF system is a complex interconnected system, and the scientific and standardized development of an evaluation index system represents a critical factor in measuring the coupling coordination degree of the WEF security system. Based on the theoretical framework of WEF system security, the actual development conditions of Northeast China, and previous research [11,19,30,31], this study has constructed a comprehensive evaluation index system consisting of 24 indicators across three criterion layers: Security, Synergy, and Resilience (see Table 1 for details). The distinctive features of this index system lie not only in its three-dimensional criterion layer structure, which differs from previous studies that organized indicators by the three subsystems, but also in how the criterion layers encompass both the internal security status of subsystems (Security) and the efficiency of resource conversion between subsystems (Synergy). Additionally, this system specifically emphasizes the dimension of risk resistance capability that enables the system to respond to external disturbances (Resilience), thereby forming a tripartite analytical framework of “Status-Connection-Capability. In addition, each evaluation standard level includes specific indicators for the water system, energy system, and food system, with the aim of ensuring the comprehensiveness and systematic nature of the assessment. Among them, the water system indicators include A1, A2, A3, B1, B5, C1-1, C2-1, and C3-3; Energy system indicators cover A4, A5, A6, B2, B3, C1-3, C2-2 and C3-2; Food system indicators are A7, A8, A9, B4, B6, C1-2, C2-3, and C3-1.
This article takes Heilongjiang, Jilin, and Liaoning provinces as the reference research base, and the time period is 19 years (2005-2023). Except for the two indicators of the total water storage (C1-2) and the area of water and soil conservation (C3-3) directly taken from the China Statistical Yearbook, the remaining indicators were calculated in detail (see Table 1). The data used to calculate these indicators is primarily sourced from the China Statistical Yearbook, China Water Resources Bulletin, China Energy Statistical Yearbook, and the statistical yearbooks of each province. For certain indicators where updated data is temporarily unavailable, the interpolation method has been applied as a substitute.
3. Research Methodology
3.1. Entropy Weight Method
The entropy weight method is an objective weighting technique based on the degree of dispersion inherent in the data. A greater dispersion for an indicator signifies a larger amount of information it provides, consequently leading to a higher assigned weight in the evaluation [32]. This study applied this method to standardize the relevant indicators and calculate their weights for assessing Water-Energy-Food (WEF) system security.
Step 1: Data Standardization. To eliminate incomparability arising from differences in the dimensions and scales of various evaluation indicators, the original data were standardized to obtain dimensionless values.
For positive indicators:
For negative indicators:
where represents the original value of the -th sample for the -th indicator; and are the maximum and minimum values of the -th indicator across all samples, respectively; and is the standardized value.
Step 2: Determination of Information Entropy .
where is the proportion of the-th sample for the-th indicator, andis the total number of study regions.
Step 3: Determination of Indicator Weights.
whereis the divergence coefficient.
3.2. Comprehensive Security Index
On the basis of the WEF system evaluation index system constructed in this paper and the determined weights, the weighted sum model of safety, coordination and resilience principles is used to calculate the safety index of water, energy, food and WEF systems, so as to evaluate the development level of each component.
Step 1: Calculate the comprehensive development index for each subsystem.
() represents the comprehensive development index of the k-th subsystem,represents the weight of the corresponding index, and represents the number of indicators in the subsystem.
Step 2: Calculate the security index for each subsystem.
Here, () represents the safety index of the ()th subsystem (including water, energy and food systems), and (wj) is the weight of the ()th indicator in the subsystem.
Step 3: Calculate the total system security index.
In this formula, represents the total safety index of the system, and represents the weight of the th subsystem.In order to reflect the synergistic evolutionary relationship within the water-energy-food network, the weights of the three subsystems are set to be equal, i.e., (Wk = 1 / 3).
3.3. Coupling Coordination Degree Model
Coupling refers to the degree of interaction between two or more systems. It can describe the mutual influence among the water, energy, and food subsystems. Based on the coupling theory and previous studies [33,34], the specific calculation formula is as follows:。
Step 1: Calculate the coupling degree.
In this case, the range of coupling degree is [0, 1]. When , it indicates that the systems are independent and tend to the state of disorder; And means that there is a positive resonance state between the systems, and the new ordered structure is developing in a positive direction.
Step 2: Calculate the coupling coordination degree.
In the equations, represents the degree of coupling coordination, andis the comprehensive development evaluation index of the water-energy-food (WEF) system. The coefficients, andreflect the relative importance of each subsystem. This study believes that the three subsystems are equally important, so the setting is.
3.4. Obstacle Degree Model
The degree of disability model is a diagnostic mathematical model based on the deviation of individual indicators from the optimal value. The principle of this model is to effectively identify the key weak links that need to be improved by quantifying the degree to which each indicator deviates from the coordinated development goal of the system. The purpose of the calculation of the model is to provide an accurate entry point for policy intervention and enhance the synergy of the whole system.This method is widely adopted in relevant research [39,40,41,42].
The model follows the logical chain of first calculating the degree of index deviation, then calculating the factor contribution rate, and finally derivating the severity of the obstacle. The specific calculation steps are as follows.
Step 1: Calculate the indicator deviation .
In the formula, represents the standardised value of the j-th indicator of the ith evaluation unit, and the value range is [0, 1]. The higher value indicates that the gap between the current state of the indicator and the ideal state is larger.
Step 2: Calculate the factor contribution (Fj).
In this formula, represents the index weight determined in the process of constructing the indicator system and is directly used as its contribution.
Step 3: Calculate the obstacle degree (Mij).
Here, represents the total number of indicators. The degree of disability ranges from 0% to 100% .The higher the value, the greater the indicator is an obstacle to the realisation of high-level linkage and coordinated development, so it is recognised as a key obstacle.
4. Results and Analysis
4.1. Development Level of the WEF Security System in Northeast China
4.1.1. Analysis of the Comprehensive Development Level
As shown in Table 3, between 2005 and 2023, the overall development level of the WEF system security system on the northeast region showed stage characteristics: initial fluctuations and ups and downs, then tended to be relatively stable, and finally gradually rebounded. The average score in this field fell from 0.463 in 2005 to 0.365 in 2014, and then rebounded to 0.501 in 2023, with a net increase of 8% during this period. From the perspective of time, the development process of the development level in the northeast region can be divided into three stages: Between 2005 and 2014, the volatility showed a downward trend. Affected by industrial restructuring and climate change pressure, the average decreased from 0.463 to 0.365; From 2015 to 2019, it entered the stage of adjustment and recovery. With the promotion of policy support and ecological protection, the value gradually increased from 0.410 to 0.486; After 2020, with the progress of water-saving technology, energy efficiency and grain production system, the improvement has been steadily promoted, and the average has exceeded 0.50.
From the perspective of spatial distribution, there are significant differences between the three in the Northeast China. Heilongjiang Province has always maintained a leading position and performed relatively stably, exceeding 0.62 from 2009 to 2011 and from 2019 to 2020. Although there was a temporary decline in 2023, it then rebounded to 0.588. On the other hand, the volatility of Liaoning Province is the most significant. The lowest value in 2009 was 0.303, and it dropped to 0.230 again in 2014. Since then, although the value improved to 0.432 in 2023, the continued lower than that of the other two provinces indicates that the system is less stable. Jilin Province was at a medium level as a whole, showing a steady upward trend from 2005 to 2023, with a final score of 0.484.
4.1.2. Analysis of Development Levels Across WEF Security Subsystems
The Northeast region as a whole has formed a development model centred on the grain system, with significant fluctuations in the water resources system and prominent pressure on the energy system. The development level of each subsystem shows the uneven characteristics as shown in Figure 2. The grain subsystem has maintained a relatively advanced level of development, as the basis for supporting the development of the regional system, especially after 2021. The water resources subsystem ranks second, but shows significant annual volatility, which has become the main factor in short-term system fluctuations. The energy subsystem is still relatively weak and faces greater pressure in a specific period, which has become an important bottleneck that restricts the overall development level of the region.
From the perspective of inter-provincial differences, the specific development of the three systems in the three provinces in the northeast can be divided into the following situations. The development level of the three subsystems in Heilongjiang Province is shown in Figure 2-B. Relying on the status of commodity grain production base, black soil resources and scientific and technological investment advantages, the province’s score of the food security subsystem has steadily improved from 0.10 in 2005 to 0.906 in 2023, laying a solid foundation for supporting the development of high-level systems. The regional water safety subsystem fluctuates due to the influence of climate and agricultural water use, and its value fluctuates sharply between 0.028 and 0.454, which has become the main factor in the annual change of the comprehensive development level of the province. The energy security subsystem in the region is usually maintained in the high range of 0.517 to 1.0, providing basic support for the system. The development level of the three subsystems in Liaoning Province is shown in Figure 2-C. The water resources safety subsystem is better than the other two provinces in most years, and its peak occurred in 2010, 2016 and 2020 respectively. This result is due to relatively perfect water conservancy facilities and effective industrial water management. However, due to the limited availability of total resources, it has decreased year by year since then. The energy security subsystem is the most vulnerable system, with a sharp drop from 0.372 in 2005 to 0.034 by 2020. Since then, although there has been a slight recovery, the overall level is still at a low level, reflecting the severe challenges faced in the process of energy structure transformation that oppress the sustainable development of traditional industrial areas. The food security subsystem has been at a low level for a long time, indicating that its foundation is relatively fragile. The development level of each subsystem in Jilin Province is shown in Figure 2-D. The two subsystems of water security and food security have shown a coordinated and stable upward trend, from 0.677 and 0.357 in 2005 to 0.590 and 0.565 in 2023, forming a mutually supportive relationship. However, the energy security subsystem has been at a low level for many years, fluctuating between 0.1 and 0.3 in most years, which has become an important bottleneck to fully release the advantages of water and food resources in Jilin Province.
4.2. Coupling Coordination Analysis of the WEF Security System in Northeast China
4.2.1. Analysis of Coupling Coordination Degree
The coupling coordination degree of the WEF system in Northeast China exhibited a fluctuating upward trend, rising from 0.457 in 2005 to a peak around 2010, before declining to a trough of 0.405 in 2014. Subsequently, it recovered gradually to 0.670 by 2023. Although significant divergence was observed among the three provinces around 2014, their coordination degrees had all recovered to above 0.63 by 2023, indicating a converging trend and a complex interactive process among subsystems evolving from dysfunction towards synergy, as detailed in Figure 3.
From the perspective of time, the process of improving the level of WEF coupling and coordination can be summarized into three stages. The first stage of this level of development showed a relatively coordinated trend from 2005 to 2010, and showed the characteristics of early differentiation. Driven by the regional revitalization policy, Heilongjiang Province has maintained a high degree of coordination, and Jilin Province has achieved steady improvement. At the same time, Liaoning Province still maintains a coordinated state under the pressure of energy. Its second stage was characterized by severe dysfunction and in-depth adjustment from 2011 to 2017, of which 2013 to 2014 became a turning point in development. The strict national environmental policy has had an impact on Liaoning Province, and its linkage degree plummeted to 0.068.Heilongjiang Province and Jilin Province are also in trouble due to fluctuations in water resources and agricultural policy adjustments. Its third stage is from 2018 to 2023, which can be summarized as the trend of slow recovery and coordinated reconstruction. With the implementation of policy absorption and the promotion of systematic measures, Heilongjiang Province and Jilin Province have achieved a relatively coordinated rapid recovery, while Liaoning Province has entered a difficult long-term recovery process.
From the perspective of spatial distribution, there are significant differences in the WEF coupling and coordinated development models of these three provinces. The coupling and coordination state of the WEF system in Heilongjiang Province has always maintained a high level of adjustment. According to Figure 3-B, it can be seen that the value of most years in the province exceeds 0.63, up to 0.794, showing strong system stability and toughness. The level of WEF coupling and coordination in Liaoning Province shows the most significant fluctuations. According to Figure 3-C, the province’s adjustment showed a slow upward trend after bottoming out in 2014, reaching 0.631 by 2023, but still lower than the initial level. The level of WEF coupling and coordination in Jilin Province shows a steady upward trend, located between Heilongjiang Province and Liaoning Province. As shown in Figure 3-D, while the food system continues to improve, the water system remains relatively stable, and the degree of synergy has steadily increased from 0.453 to 0.681. The phenomenon of inter-provincial differences in the coupling coordination rate of the WEF system vividly shows the complex interaction between policy impact, resource endowment superiority and regional resilience.
4.2.2. Analysis of Coupling Coordination Degree Levels
Between 2005 and 2023, the overall coupling and coordination level of the WEF system in Northeast China was upgraded from the critical disorder stage (III) to the moderate coordination stage (V), achieving an important transformation from the conflict stage to the coordination stage. As shown in Figure 4, it is not a straight upward process, but a fluctuating upward trend.
Through the analysis of the changes in the level of coupling and coordination over time, the development path of different provinces is revealed. The coupling and coordination level of Heilongjiang Province maintained a high regulatory level for most of the research period, mainly between primary coordination (IV) and good coordination (VI). Since then, it has entered a period of fluctuation adjustment from 2012 to 2017. The main reason is that the region has been affected by policy adjustments such as water resource fluctuations, the restructuring of the agricultural structure, and climate change. The adjustment capacity has continued to decline. By 2017, it is close to the stage of disregulation (III). Its development level from 2018 to 2023 can be summarized as the final recovery and strengthening period. With the improvement of hydrogistic conditions and the adjustment of agricultural structure adaptability, the adjustment level gradually recovers to above the medium adjustment level (V).
The coupling and coordination development level of the WEF system in Liaoning Province has experienced the most violent fluctuations, presenting a complete cycle of high-level linkage, cliff collapse and long-term recovery. In 2014, the energy subsystem of Liaoning Province was severely impacted by strict national environmental policies including the Action Plan for the Prevention and Control of Atmospheric Pollution, resulting in a sharp decline in its WEF coordination level, and finally falling into extreme dysfunction ( I, D=0.068).At the same time, the food subsystem failed to play an effective buffering role. Since 2015, the energy system of Liaoning Province has gradually entered a stage of slow recovery under the impetus of industrial restructuring and policy support. By 2023, the coordination level of its WEF system has generally recovered to the fourth-level adjustment level. It is worth noting that its recovery has slowed down significantly compared with the previous recession.
The level of WEF system coupling and coordination in Jilin Province showed a steady upward trend, from extreme disorder (I) in 2005 to moderate coordination (V) in 2023. Its development process can be summarized into three stages: low-level combination, rapid rise, and stability and strengthening. There are two reasons why the province continues to move forward. One of the reasons is the continuous improvement and stability of its food subsystem, and the water supply system also constitutes the main support of the WEF system. On the other hand, the most important reason is that Jilin Province has gradually improved the energy subsystem through the development of new energy, and jointly promoted the steady improvement of the coordination of the whole system. The very different evolution paths of these three provinces reveal the complex interaction between internal resource structure, policy response and external shocks, and provide a basis for differentiated systematic coordination.
4.3. Research on Obstacle Factors Affecting the Coordinated Development of the WEF Security System in Northeast China
4.3.1. Analysis of Obstacle Factors at the System Level
The main obstacles to the coordinated development of the WEF in the northeast region are the major stage obstacles to the development of the energy subsystem, followed by the importance of the water resources subsystem. As shown in Figure 5, the model also shows significant step-by-step fluctuations and obvious inter-provincial structural differences.
From the perspective of time, the fault structure of each WEF subsystem in the northeast region is characterized by policy impact and climate response, and the research period can be divided into three stages. The first stage of the WEF system in the northeast region is from 2005 to 2012, which can be summarized as the accumulation and fluctuation period, and the barriers in the energy and water resources subsystems are on the rise alternately. Between 2009 and 2011, it was affected by the fluctuation of precipitation and the demand for agricultural water, and the obstacles to the use of water resources were significantly aggravated. The second stage is 2013-2017, which can be summarized as a period that marks a significant policy impact. Under the constraints of strict environmental protection regulations such as the Action Plan for the Prevention and Control of Atmospheric Pollution (referred to as the Ten Measures), the operating obstacles of the energy subsystem are forced to continue to intensify, especially from 2014 to 2016, and eventually evolving into the main bottleneck that hinders the scheduling of the system. The third phase (2018–2023) transitioned into a repair and adjustment period. With the implementation of energy-saving renovations and structural optimization, the energy obstacle degree decreased slightly, and the food subsystem obstacle degree generally declined slowly and steadily. However, the water resources obstacle degree experienced periodic rebounds due to climatic fluctuations and issues related to water-use efficiency.
Regarding interprovincial disparities, the obstacle structures of the three provinces are closely tied to their respective resource endowments, industrial positioning, and policy responses. The degree of water resource barriers in Heilongjiang Province is relatively prominent, which is caused by its large-scale agricultural irrigation and climate sensitivity. The level of energy barriers in the region is generally lower than that of Liaoning Province and Jilin Province, showing an upward trend since 2020, which also shows that the transformation of clean energy is still facing continuous challenges. As a traditional heavy industry base, the barrier rate of the energy subsystem in Liaoning Province has been maintained at a high level for many years, exceeding 40% in most years, and continued to remain above 43% from 2013 to 2020.This highlights the great pressure facing the province in energy transformation. The province‘s water resources barriers are also passively at a high level due to the competition and utilization efficiency of industrial water. The barrier structure of the WEF system in Jilin Province is more balanced. The degree of the energy barrier increased significantly around 2020, reaching 47.75% that year, reflecting the difficulty of coordinating new energy and traditional energy in the process of integration and elimination. On the contrary, the failure rate of the food subsystem is generally on a downward trend, indicating that agricultural stability is gradually improving.
4.3.2. Analysis of Obstacle Factors at the Indicator Level
The main obstacle to the coordinated development of the WEF system in the northeast region is the widespread structural defects in the energy subsystem, which are reflected in the inadequacy of indicators C1-3 (energy self-sufficiency) and A4 (per capita energy output). In addition, indicators such as A2 (per capita water consumption), A7 (per capita arable land area), C1-1 (per capita grain supply) and C2-1 (proportion of water-saving irrigation area) have also had a significant impact on the safety of the WEF system. This is mainly because there is a close intrinsic correlation between the indicators of each subsystem, and energy constraints will hinder the development of water and food systems. Therefore, according to the image display and specific index values in Figure 6, it can be concluded that the model is characterized by the significant existence of structural weaknesses, obvious inter-system effects, and the complexity of interrelated regional characteristics.
From the perspective of time, the changes in important obstacles of the WEF system reflect the three stages of the shifting policy focus. During the period of dominant growth from 2005 to 2012, the obstacles in the northeast region were mainly concentrated on indicators related to resource abundance and basic efficiency. During the period of severe environmental constraints from 2013 to 2017, national policy intervention intensified the resource competition between subsystems in the region, further exacerbating the barriers to relevant indicators such as A2 and C1-3. In the subsequent stage of system recovery and resilience construction, that is, from 2018 to 2023, due to the policy shift to building multi-dimensional resilience, the attention of indicators related to long-term adaptability such as C2-1 and C3-2 in the region was further increased. This development shows that the coping approach has shifted from addressing symptoms to strengthening basic capabilities.
From the perspective of spatial distribution, the characteristics of important obstacles show significant inter-provincial differences. The obstacles of the WEF system in Heilongjiang Province are shown in Figure 6-B. The main problems are reflected in the changing limiting factors in the water, grain and energy systems. The indicators related to the main obstacles include A1, A2, B1, B6, C1-1, C1-3 and C2-1, among which A2 (per capita water consumption) and B6 (unit grain production water consumption) are particularly prominent. Under the influence of the policy, Liaoning Province shows the characteristics of systematic response and correlation breakage. As shown in Figure 6-C, the obstacles are concentrated in indicators such as A4, A7, C1-1 and C1-3. Jilin Province faces challenges in stability and related efficiency in the follow-up development model. According to Figure 6-D, it can be concluded that the main obstacles in the province are concentrated in indicators such as A4, A7, C1-3 and C2-1.
5. Conclusions and Policy Implications
5.1. Conclusions
Based on the three-dimensional evaluation index system covering safety, coordination and resilience, this study use the entropy weighting method to standardize and weight the 19-year long-term panel data in the northeast from 2005 to 2023. The article also systematically analyzes the spatial and temporal change characteristics of the safety of regional water, energy and food systems through comprehensive safety index, coupled coordination model and obstacle model. The overall conclusion of the article can be summarized in the following aspects.
(1) The comprehensive development level of the WEF system in the northeast region shows a fluctuating upward trend, and the whole has entered the stage of moderate adjustment, with a cumulative increase of 8% during the survey. There are still significant differences between the provinces as a whole, and three research regional phenomena with typical characteristics have also been formed.With a solid foundation of food security, Heilongjiang Province has been at the top for many years and maintained a stable trend. Jilin Province shows a steady growth trend. Restricted by energy transformation and grain production, Liaoning Province is still at a low level with great fluctuations. The subsystems of WEF also present an uneven pattern, dominated by food security, but water resources fluctuate significantly, and the energy subsystem is under great pressure.
(2) The change of WEF system coupling coordination shows the model of “gradual convergence from the initial divergence state, and improvement of the overall volatility”. The coordination level of the WEF system has developed from a state close to dysfunction to a moderate degree of coordination. From 2013 to 2014, under the influence of the environmental policy of Liaoning Province, the province’s industrial adjustment capacity declined sharply, and the vulnerability of the traditional industrial system was exposed. Although Heilongjiang Province maintains a high adjustment capacity, it is still affected by the annual fluctuations of water resources. Jilin Province have achieved a continuous improvement in the level of adjustment, becauase of the improvement of the food subsystem.
(3) The obstacles of the energy system have the characteristics of structural prominence, cross-field relevance of the system, and inter-provincial heterogeneity. Energy self-sufficiency and per capita energy productivity are usually common obstacles in the energy system. The issues facing Heilongjiang Province mainly focus on the efficiency of water resources utilization and the contradictions in the relationship between water, grain and energy. After the policy shock, Liaoning showed the characteristics of damage to the energy system and weak food security. Jilin Province is facing the double constraints of energy supply and agricultural water efficiency. The change of these obstacles over time reveals that the shift in policy logic has shifted from a growth-oriented focus to an emphasis on environmental constraints, and then to building systematic resilience.
5.2. Policy Implications
In order to achieve the high synergy of the WEF system, it is necessary to adopt a multi-dimensional strategy, including policy orientation, technological innovation and resilient infrastructure integration. Taking the three provinces in the northeast region as reference cases, this article puts forward policy suggestions with characteristics and reference significance to realize the sustainable development of WEF under the background of technological innovation of the times.
(1) In order to solve systemic shortcomings, the state should adopt a policy-based approach. The construction of a sound policy framework is the primary prerequisite for solving the structural shortcomings of WEF and improving the development level of the whole region.More importantly, the country also needs to implement differentiated policies according to the actual regional situation. Taking Northeast China as example, differentiated policies can be roughly divided into the following three categories.The first type is an area where the contradiction between water resources and food represented by Heilongjiang Province is the main problem. The government can improve the efficiency of agricultural water use by combining water-saving irrigation technology with ecological compensation and agricultural subsidy policies. Second, in regions like Liaoning Province where the primary conflict lies in the severe disruption of the energy system under sustainable and green development, with other systems unable to provide adequate compensation, governments need to promptly design transitional industrial policies to support the green transformation of heavy industry. They should enhance the foundational capacity of the food system through measures such as constructing high-standard farmland and protecting black soil, while implementing financial subsidy policies to drive the development of local clean energy sources like biomass and wind power. Third, in regions like Jilin Province where obstacles to the water-energy-food system are relatively balanced and the primary conflict lies in the coordination of these three elements, governments should strengthen water--water-grain synergies by establishing “integrated water-fertilizer-pesticide technology demonstration zones.” Western new energy bases should be supported with green electricity consumption policies to overcome energy supply bottlenecks. Finally, at the regional level, the state should establish cross-administrative boundary collaborative governance mechanisms. For instance, Northeast China should explore water rights trading and ecological compensation mechanisms based on river basins like the Songhua and Liao Rivers, establish regional green transition funds, and support interprovincial infrastructure projects.
(2) Leverage technology as a driver to promote cross-system coordination. Technological innovation serves as the key driver for overcoming resource utilization bottlenecks and achieving system coupling and synergy, with a focus on advancing technology integration to enhance coupling efficiency. Based on the current research status in Northeast China, nationally implementable measures can be categorized by system as follows: First, in the grain production sector, the state can reduce water and energy consumption by developing and promoting integrated water-saving, energy-saving, and fertilizer-saving agricultural techniques and machinery, such as smart precision irrigation, integrated water-fertilizer-pesticide application equipment, and conservation tillage technologies for cold regions. Second, in the energy-water-resource coupling domain, the state can explore models combining wind and solar power bases with water-saving ecological restoration by promoting the large-scale utilization of unconventional water resources in energy production, such as recycled water cooling technology in coal-fired power and chemical industries.-water-energy coupling, the state can promote the large-scale utilization of non-conventional water resources in energy production, such as recycled water cooling technologies in coal-fired power and chemical industries, and explore models integrating wind and solar power bases with water-saving ecological restoration. Finally, at the system management level, all system bases should accelerate the construction of regional WEF system big data monitoring networks and smart management platforms. These platforms should integrate multi-source data and utilize digital twin and artificial intelligence technologies to achieve resource flow simulation, risk early warning, and coordinated scheduling.
(3) The improvement of the overall resilience of the WEF system is enhanced through infrastructure support. The country’s infrastructure system with modern interconnection and resilience is the physical foundation for promoting resource flow, buffering external shocks, and ensuring the long-term stable operation of the system. In infrastructure construction, priority should be given to multi-functional integration and obstacle reduction. In the field of water resources, infrastructure needs to be based on existing large-scale projects to promote the construction of small and medium-sized reservoirs with water storage and connection functions, connecting rivers and lakes, and the construction of underground reservoirs. Renovate aging irrigation systems and upgrade metering facilities to establish a flexible water network. In the energy sector, the nation must enhance power transmission corridors, backbone grids, and regulatory power sources like pumped-storage hydroelectricity and new energy storage in western regions rich in renewable energy (e.g., Jilin, Heilongjiang). It should also advance upgrades to urban and industrial park heating networks and multi-energy complementary projects. In the food sector, sustained investment is needed in high-standard farmland, storage logistics, emergency reserves, and soil and water conservation projects, including black soil protection initiatives. Finally, the state must concurrently plan and advance cross-regional, link-type infrastructure interconnectivity across these three domains. Examples include the Songliao Canal water resource allocation project in Northeast China and the physical network for regional electricity markets, systematically enhancing the long-term resilience of complex ecosystems.
Author Contributions
Conceptualization, L.Q. and H.W.; methodology, L.Q. and H.W.; data curation, H.W.; writing—original draft preparation, H.W.; writing—review and editing, H.W.; visualization, H.W. All authors have read and agreed to the published version of the manuscript.
Funding
This research was funded by the General Project of the Heilongjiang Provincial Philosophy and Social Sciences Planning Research Program, grant number 2GLB122.
Data Availability Statement
The data sources are specified in Section 2.1 Selection of Indicators and Data Sources, all drawn from the China Statistical Yearbook.
Acknowledgments
During the preparation of this manuscript, the author utilized deepseek and deepl software for language refinement of the article. The author has reviewed and revised the final version and assumes full responsibility for the content herein.
Conflicts of Interest
The authors declare no conflicts of interest.
References
- Chang, Y.; Li, G.; Yao, Y.; Zhang, L.; Yu, C. Quantifying the water-energy-food nexus: Current status and trends. Energies 2016, 9, 65. [Google Scholar] [CrossRef]
- DP, U. World Population Prospects: The 2015 Revision, United Nations, Department of Economic and Social Affairs. Population Division, DVD edn 2015.
- Flammini, A.; Puri, M.; Pluschke, L.; Dubois, O. Walking the nexus talk: assessing the water-energy-food nexus in the context of the sustainable energy for all initiative; 2014.
- Mountford, H. Water: The environmental outlook to 2050. In Proceedings of the Proceeding of the OECD Global Forum on Environment: Making Water Reform Happen, Paris, France, 2011; pp. 25–26. [Google Scholar]
- Sivakumar, B. Water-energy-food nexus: challenges and opportunities. Stochastic Environmental Research and Risk Assessment 2021, 35, 1–2. [Google Scholar] [CrossRef]
- Zhiying, A.; Caizhi, S.; Shuai, H. Supply-demand matching relationship of ecosystem services in Northeast our country: from the perspective of water-energy-food linkage. Acta Ecology 2024, 44, 4170–4186. [Google Scholar] [CrossRef]
- Hoff, H. Understanding the nexus. background paper for the bonn2011 nexus conference: the water, energy and food security nexus. 2011.
- Zongyong, Z.; Junguo, L.; Kai, W.; Zhan, T.; Dandan, Z. Review of Water-Food-Energy Linkage System: Bibliometric and Analysis. Scientific Bulletin 2020, 65, 1569–1581. [Google Scholar]
- Smajgl, A.; Ward, J.; Pluschke, L. The water–food–energy Nexus–Realising a new paradigm. Journal of hydrology 2016, 533, 533–540. [Google Scholar] [CrossRef]
- Wang, Q.; Li, S.; He, G.; Li, R.; Wang, X. Evaluating sustainability of water-energy-food (WEF) nexus using an improved matter-element extension model: A case study of China. Journal of Cleaner Production 2018, 202, 1097–1106. [Google Scholar] [CrossRef]
- Xuechun, H.; Zhiqiang, W.; Li, L.; Yi, W.; Peng, W. Research on Safety Evaluation and Identification of Obstacles to the “Water-Energy-Food” Systemin the Western Region. Chinese Journal of Agricultural Machinery and Chemistry 2023, 44, 250–257. [Google Scholar] [CrossRef]
- Li, L.; Bi, J.; Zhou, Y.; Zhou, Y. Research Progress on Risk Management Based on Food-Energy-Water Relationship. Chinese Population, Resources and Environment 2018, 28, 85–92. [Google Scholar]
- Chunfeng, H.; Cheng, Z.; Haiying, L.; Yaqin, Q. Quantitative Analysis and Risk Analysis of Water-Energy-Food Synergy Security in Northeast China. In Proceedings of the 2022 China Water Conservancy Conference (2022 Annual Conference of China Water Conservancy Society), Beijing, China, 2022; p. 5. [Google Scholar]
- Xian, C.; Yang, S.; Fan, Y.; Wu, H.; Gong, C. Coupling efficiency assessment of food–energy–water (FEW) nexus based on urban resource consumption towards economic development: the case of Shenzhen Megacity, China. Land 2022, 11, 1783. [Google Scholar] [CrossRef]
- Chengshuang, S.; Haohao, S. Research on water-energy-food input-output efficiency based on DEA model. Journal of Beijing University of Civil Engineering and Architecture 2021, 37, 87–95. [Google Scholar] [CrossRef]
- Tone, K. A slacks-based measure of efficiency in data envelopment analysis. European journal of operational research 2001, 130, 498–509. [Google Scholar] [CrossRef]
- Jiangang, G.; Jinlu, L.; Kai, X.; Lina, H. Research on the efficiency of water-energy-food link system in the Yellow River Basin. People’s Yellow River 2024, 46, 67–71. [Google Scholar]
- Zheng, Y.; Liu, C.; Li, L.; Jiang, E.; Feng, G.; Qu, B.; Hao, L.; Li, J.; Li, J. Spatiotemporal Evolution and Driving Mechanisms of Water–Energy–Food Synergistic Efficiency: A Case Study of Irrigation Districts in the Lower Yellow River. Sustainability 2025, 17, 11265. [Google Scholar] [CrossRef]
- Feng, C.; Qu, S.; Jin, Y.; Tang, X.; Liang, S.; Chiu, A.S.; Xu, M. Uncovering urban food-energy-water nexus based on physical input-output analysis: The case of the Detroit Metropolitan Area. Applied Energy 2019, 252, 113422. [Google Scholar] [CrossRef]
- Mannan, M.; Al-Ansari, T.; Mackey, H.R.; Al-Ghamdi, S.G. Quantifying the energy, water and food nexus: A review of the latest developments based on life-cycle assessment. Journal of cleaner production 2018, 193, 300–314. [Google Scholar] [CrossRef]
- Liang, S.; Qu, S.; Zhao, Q.; Zhang, X.; Daigger, G.T.; Newell, J.P.; Miller, S.A.; Johnson, J.X.; Love, N.G.; Zhang, L. Quantifying the urban food–energy–water nexus: the case of the detroit metropolitan area. Environmental science & technology 2018, 53, 779–788. [Google Scholar]
- Shibao, L.; Fan, Z.; Liang, P.; Weisheng, D.; Yangang, X. Water Resources Security in our country’s Five Typical Areas from the Perspective of Energy-Food Relationship. Journal of Soil and Water Conservation 1–13. [CrossRef]
- Cai, X.; Wallington, K.; Shafiee-Jood, M.; Marston, L. Understanding and managing the food-energy-water nexus–opportunities for water resources research. Advances in Water Resources 2018, 111, 259–273. [Google Scholar] [CrossRef]
- Chang, Y.; Li, G.; Yao, Y.; Zhang, L.; Yu, C. Quantifying the water-energy-food nexus: Current status and trends. Energies 2016, 9, 65. [Google Scholar] [CrossRef]
- Arthur, M.; Liu, G.; Hao, Y.; Zhang, L.; Liang, S.; Asamoah, E.F.; Lombardi, G.V. Urban food-energy-water nexus indicators: A review. Resources, Conservation and Recycling 2019, 151, 104481. [Google Scholar] [CrossRef]
- Islam, K.N.; Kenway, S.J.; Renouf, M.A.; Lam, K.L.; Wiedmann, T. A review of the water-related energy consumption of the food system in nexus studies. Journal of Cleaner Production 2021, 279, 123414. [Google Scholar] [CrossRef]
- Hejnowicz, A.; Thorn, J.; Giraudo, M.; Sallach, J.; Hartley, S.; Grugel, J.; Pueppke, S.; Emberson, L. Appraising the water-energy-food nexus from a sustainable development perspective: a maturing paradigm? Earth’s Future 2022, 10, e2021EF002622. [Google Scholar] [CrossRef]
- Pittock, J.; Hussey, K.; McGlennon, S. Australian climate, energy and water policies: conflicts and synergies. Australian Geographer 2013, 44, 3–22. [Google Scholar] [CrossRef]
- Kellner, E.; Martin, D.A. Learning from past coevolutionary processes to envision sustainable futures: Extending an action situations approach to the Water-Energy-Food nexus. Earth system governance 2023, 15, 100168. [Google Scholar] [CrossRef]
- Longzai, Y.; Huixiao, W.; Yating, H.; Wendi, C.; Hongfang, L.; Guanhang, S. Research on the collaborative security and coupling coordination of water-energy-food system in the Inner Mongolia section of the Yellow River Basin. In South-to-North Water Diversion and Water Conservancy Science and Technology; pp. 1–14.
- Longzai, Y.; Huixiao, W.; Yating, H.; Wendi, C.; Hongfang, L.; Guanhang, S. Research on the collaborative security and coupling coordination of water-energy-food system in the Inner Mongolia section of the Yellow River Basin. South-to-North Water Diversion and Water Conservancy Science and Technology 2024, 22, 12–23. [Google Scholar] [CrossRef]
- Caizhi, S.; Yongjie, W.; Wenxin, L. Water poverty evaluation and obstacle factor analysis in Dalian based on entropy-weighted TOPSIS method. Water resources protection 2017, 33, 1–8. [Google Scholar]
- Xu, D.; Yang, F.; Yu, L.; Zhou, Y.; Li, H.; Ma, J.; Huang, J.; Wei, J.; Xu, Y.; Zhang, C. Quantization of the coupling mechanism between eco-environmental quality and urbanization from multisource remote sensing data. Journal of Cleaner Production 2021, 321, 128948. [Google Scholar] [CrossRef]
- Zhang, Q.; Ye, B.; Shen, X.; Zhu, Y.; Su, B.; Yin, Q.; Zhou, S. Coupling coordination evaluation of ecology and economy and development optimization at town-scale. Journal of Cleaner Production 2024, 447, 141581. [Google Scholar] [CrossRef]
- Xinlei, C.; Chenyue, X. Differences and obstacles to the coordinated development of food-ecology-energy security in the Yellow River Basin. In China’s agricultural resources and zoning; pp. 1–16.
- Libing, Z.; Chuanyu, K.; Juliang, J.; Yachao, B.; Qibing, Z.; Xiaofeng, C. Research on the coupling coordination and optimization of water-energy-food system in rice irrigation area under bilateral regulation of supply and demand. Journal of Water Resources 2023, 54, 829–842. [Google Scholar] [CrossRef]
- Yijia, H.; Yong, X.; Yang, Z.; Xiandong, L. Spatio-temporal dynamics and predictive analysis of water-energy-food system coupling and coordinated development in Northwest China. Soil and water conservation 2025, 32, 251–259+269. [Google Scholar] [CrossRef]
- Hongfang, L.; Huixiao, W.; Ruxin, Z.; Yaxue, Y.; Jiahao, G. Water-energy-food symbiosis security risk probability based on Copula function. Transactions of the Chinese Society of Agricultural Engineering (Transactions of the CSAE) 2021, 37, 332–340. [Google Scholar]
- Chengyu, L.; Shiqiang, Z. Coordination degree and influencing factors of water-energy-food coupling in China. Chinese population, resources and environment 2020, 30, 120–128. [Google Scholar]
- Yali, C.; Qiang, Z.; Mingle, A.; Xiumei, L.; Pengyu, R. Analysis of spatio-temporal characteristics of meteorological drought in the Liao River Basin from 1959 to 2019. Water conservancy and hydropower technology (Chinese and English) 2023, 54, 42–52. [Google Scholar] [CrossRef]
- Chunyang, L.; Feng, W.; Qingyuan, Y.; Linlin, C.; Huiming, Z. Urban Land Use Performance Evaluation and Obstacle Factor Diagnosis Based on Improved TOPSIS Method: A Case Study of Chongqing. Resource Science 2011, 33, 535–541. [Google Scholar]
- Liangliang, Y.; Yinying, C. Performance evaluation and diagnosis of obstacle factors of economic compensation policy for cultivated land protection based on farmers’ satisfaction. Journal of Natural Resources 2015, 30, 1092–1103. [Google Scholar]
Figure 1.
General Map of the Study Area.
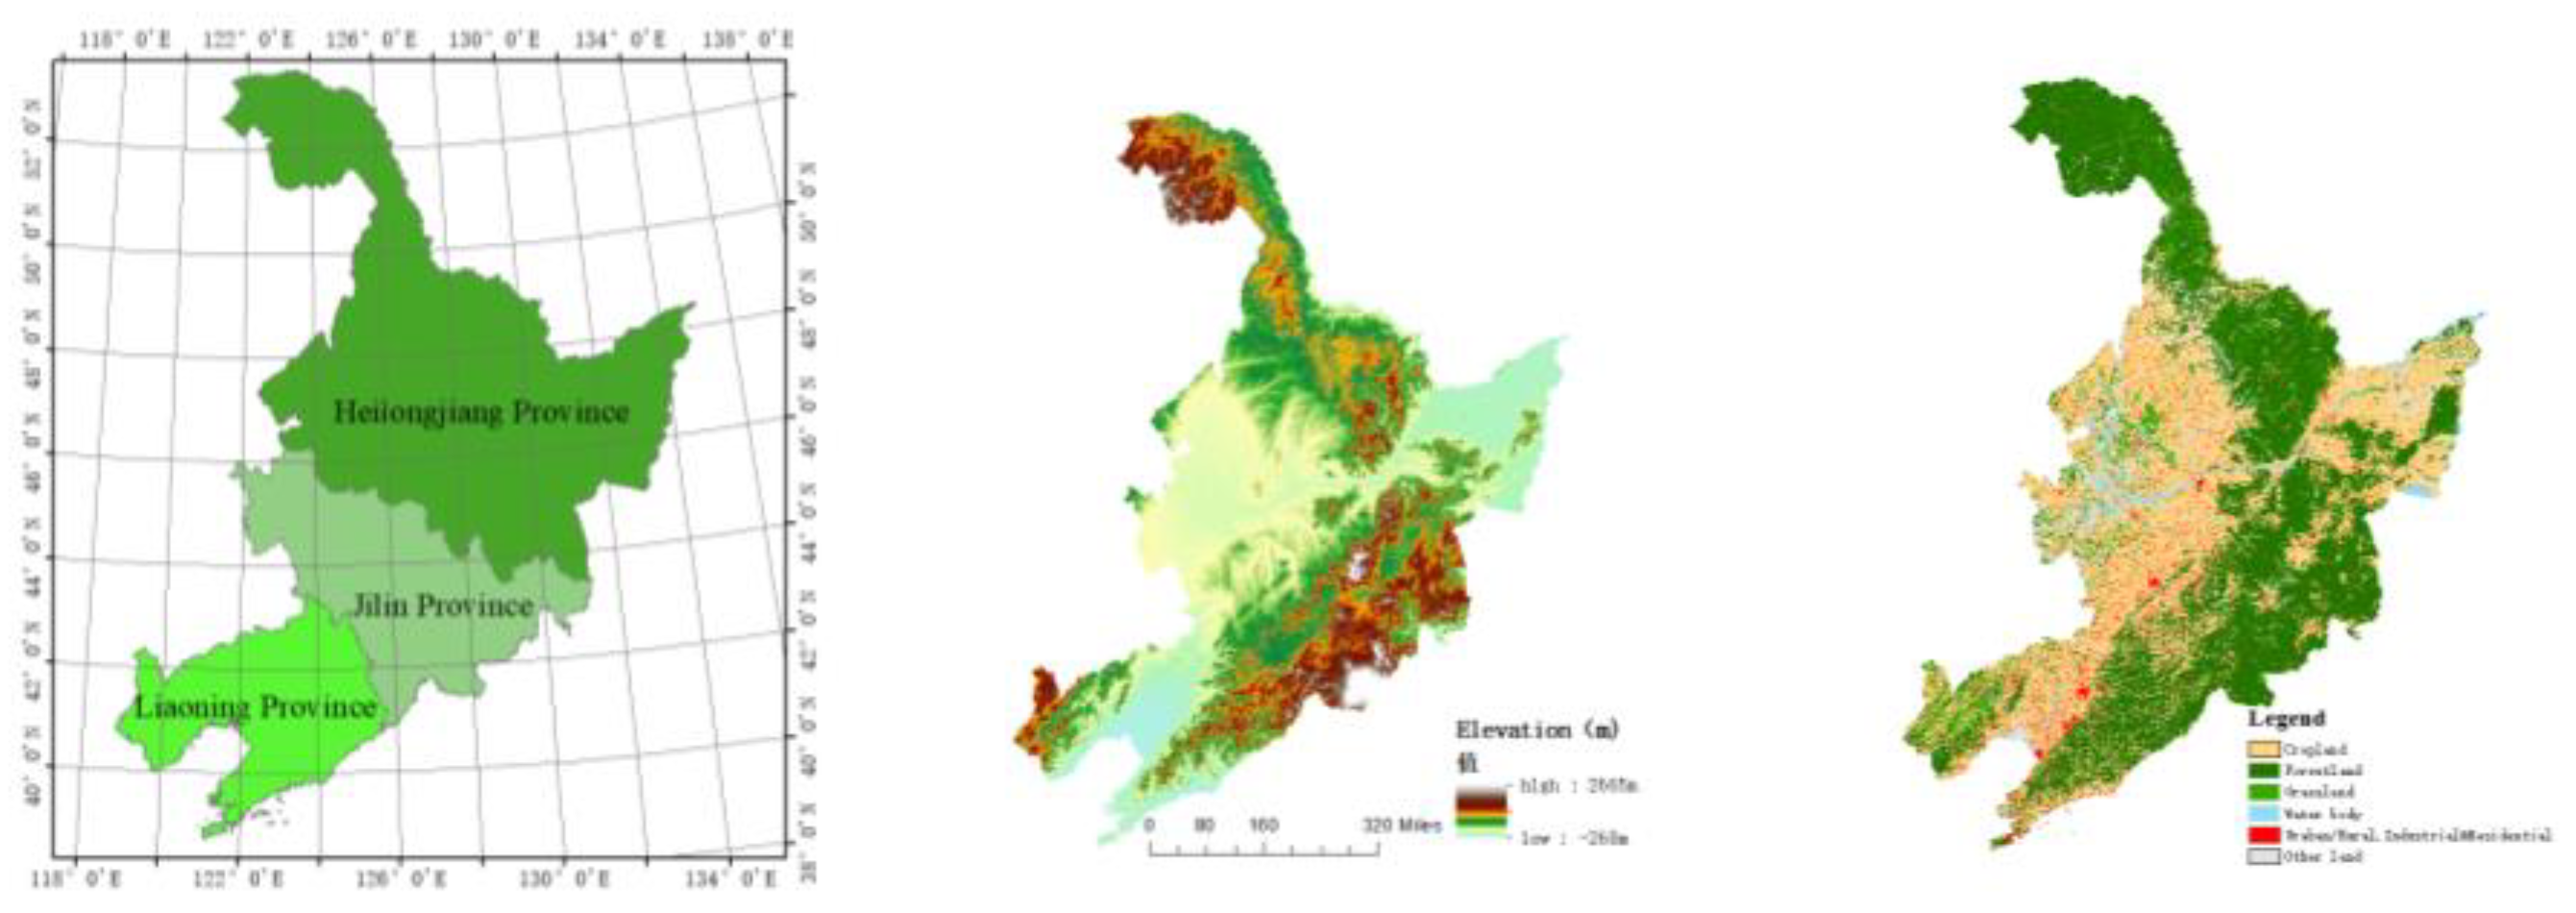
Figure 2.
Trends in Development Levels of Water Systems, Energy Systems, and Food Systems in Northeast China.
Figure 2.
Trends in Development Levels of Water Systems, Energy Systems, and Food Systems in Northeast China.
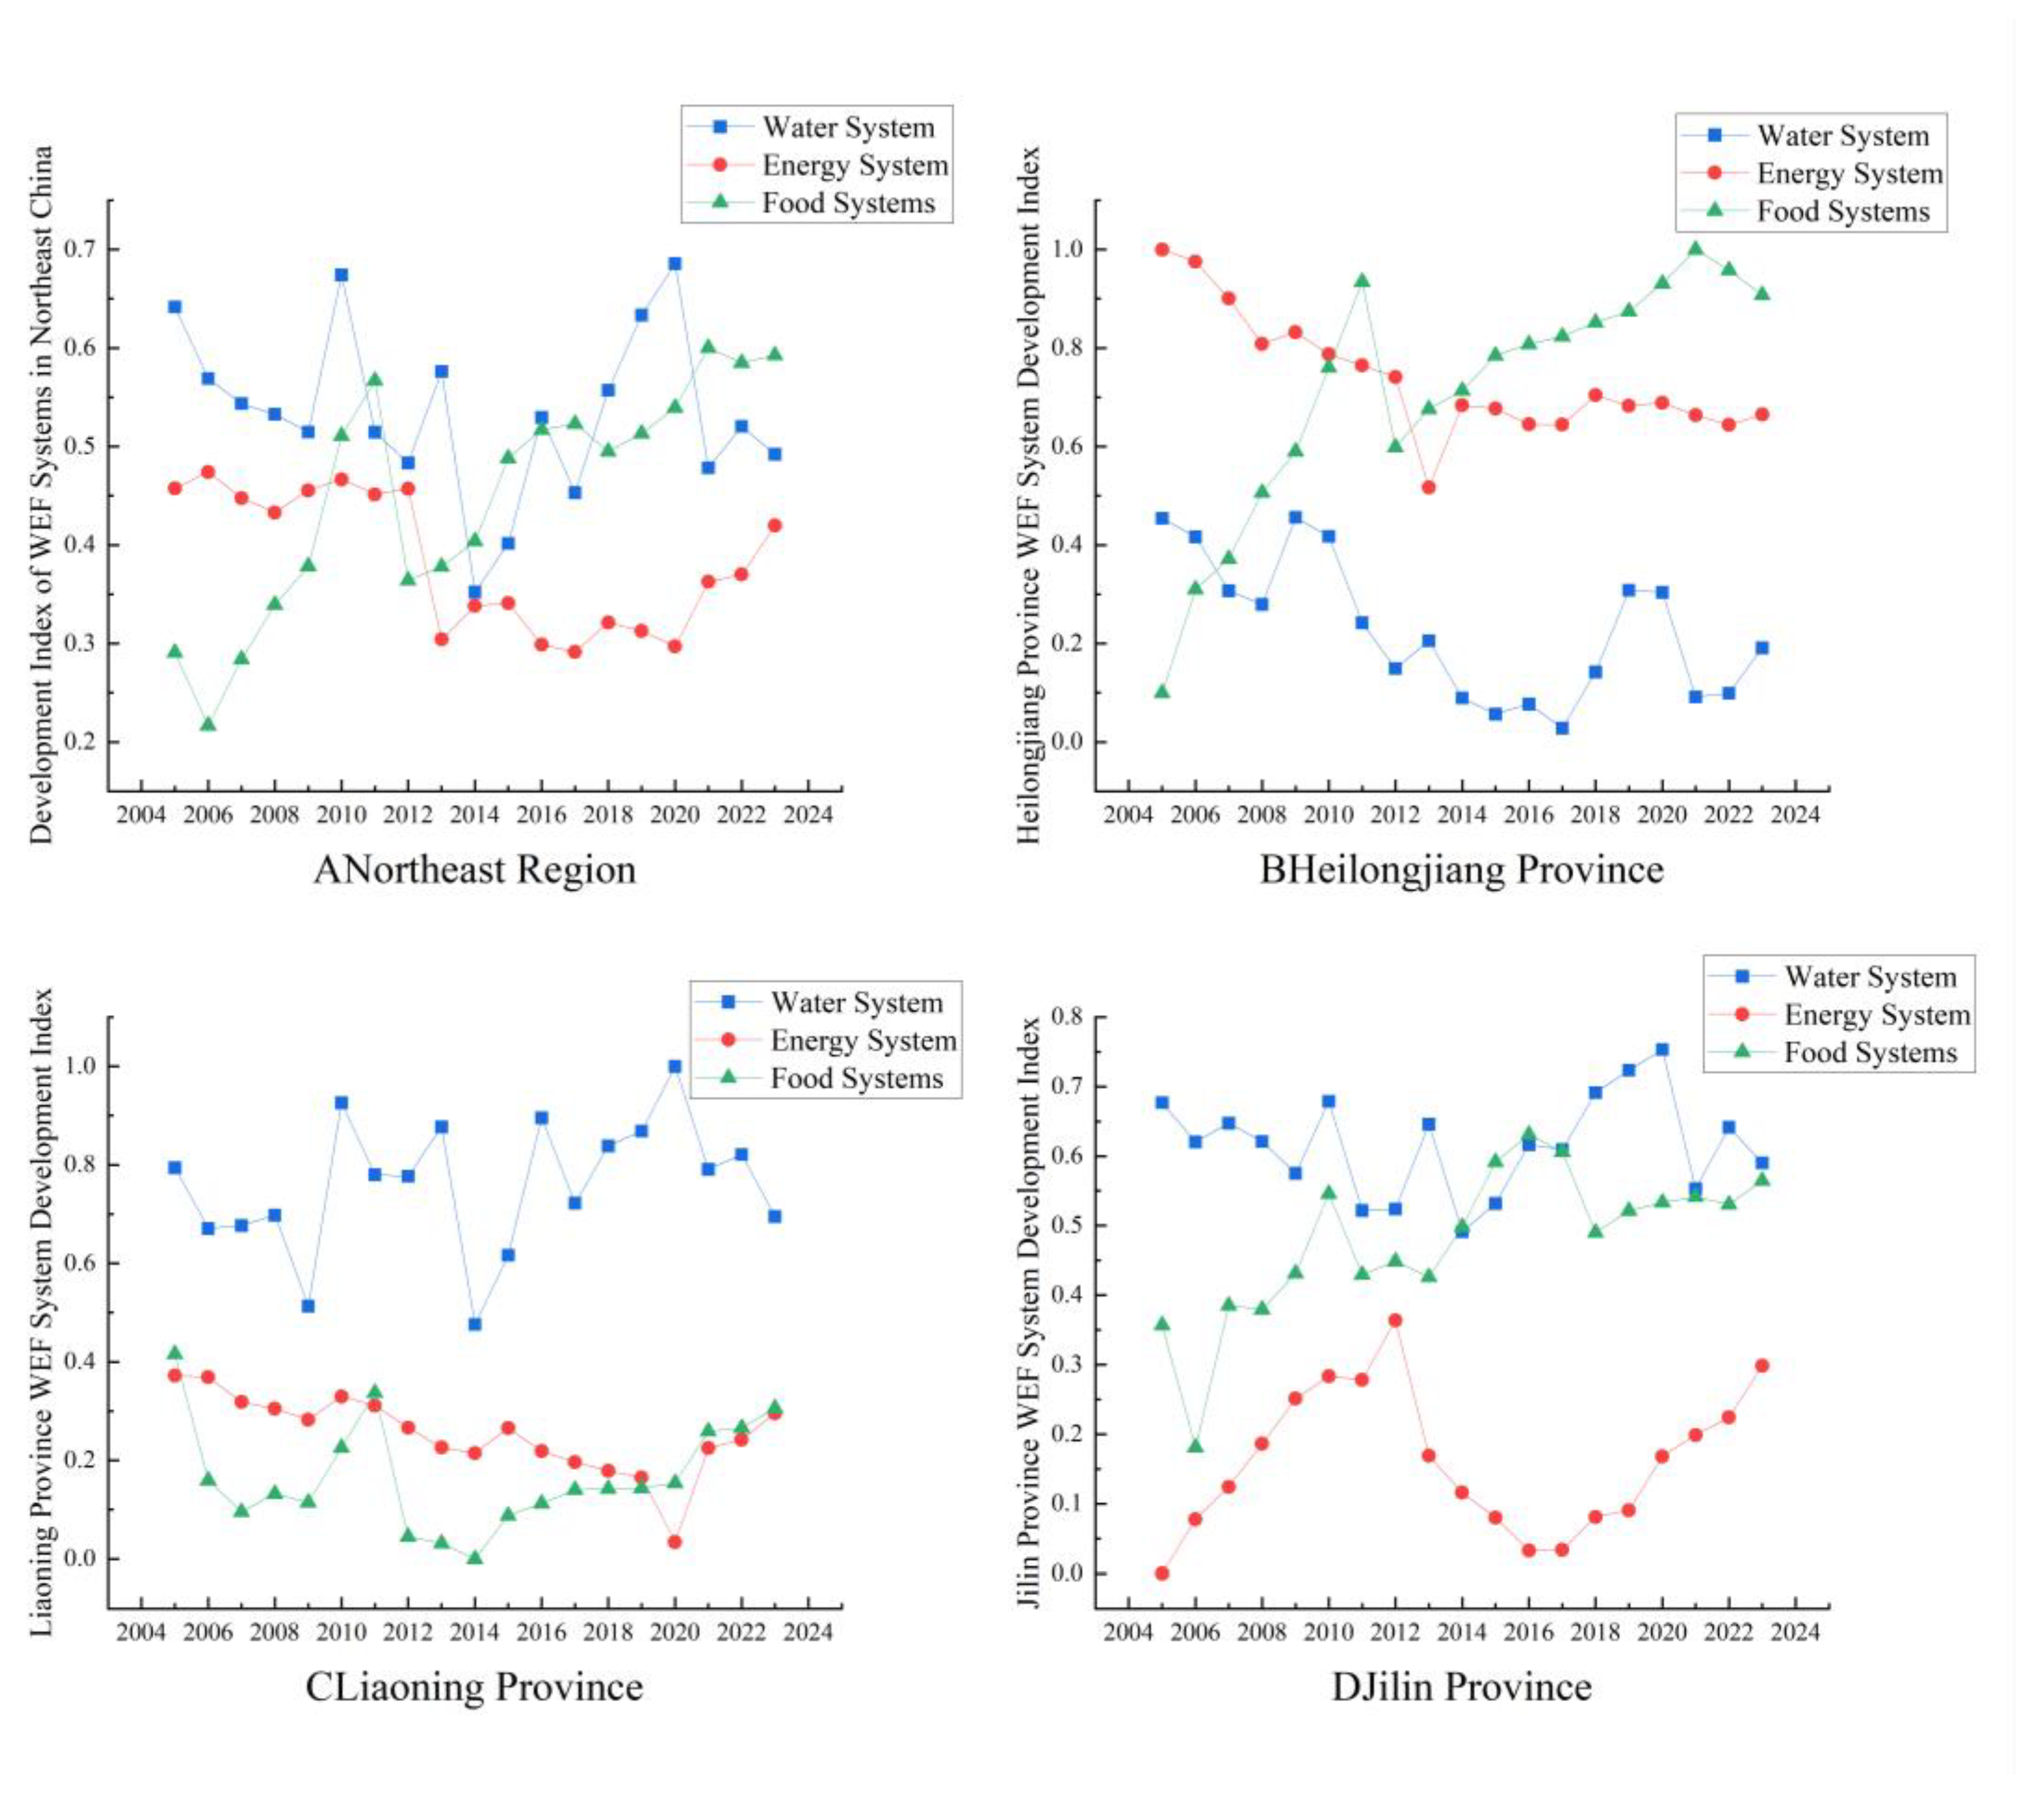
Figure 3.
Trend in Coupling Coordination of WEF Security Systems in Northeast China.
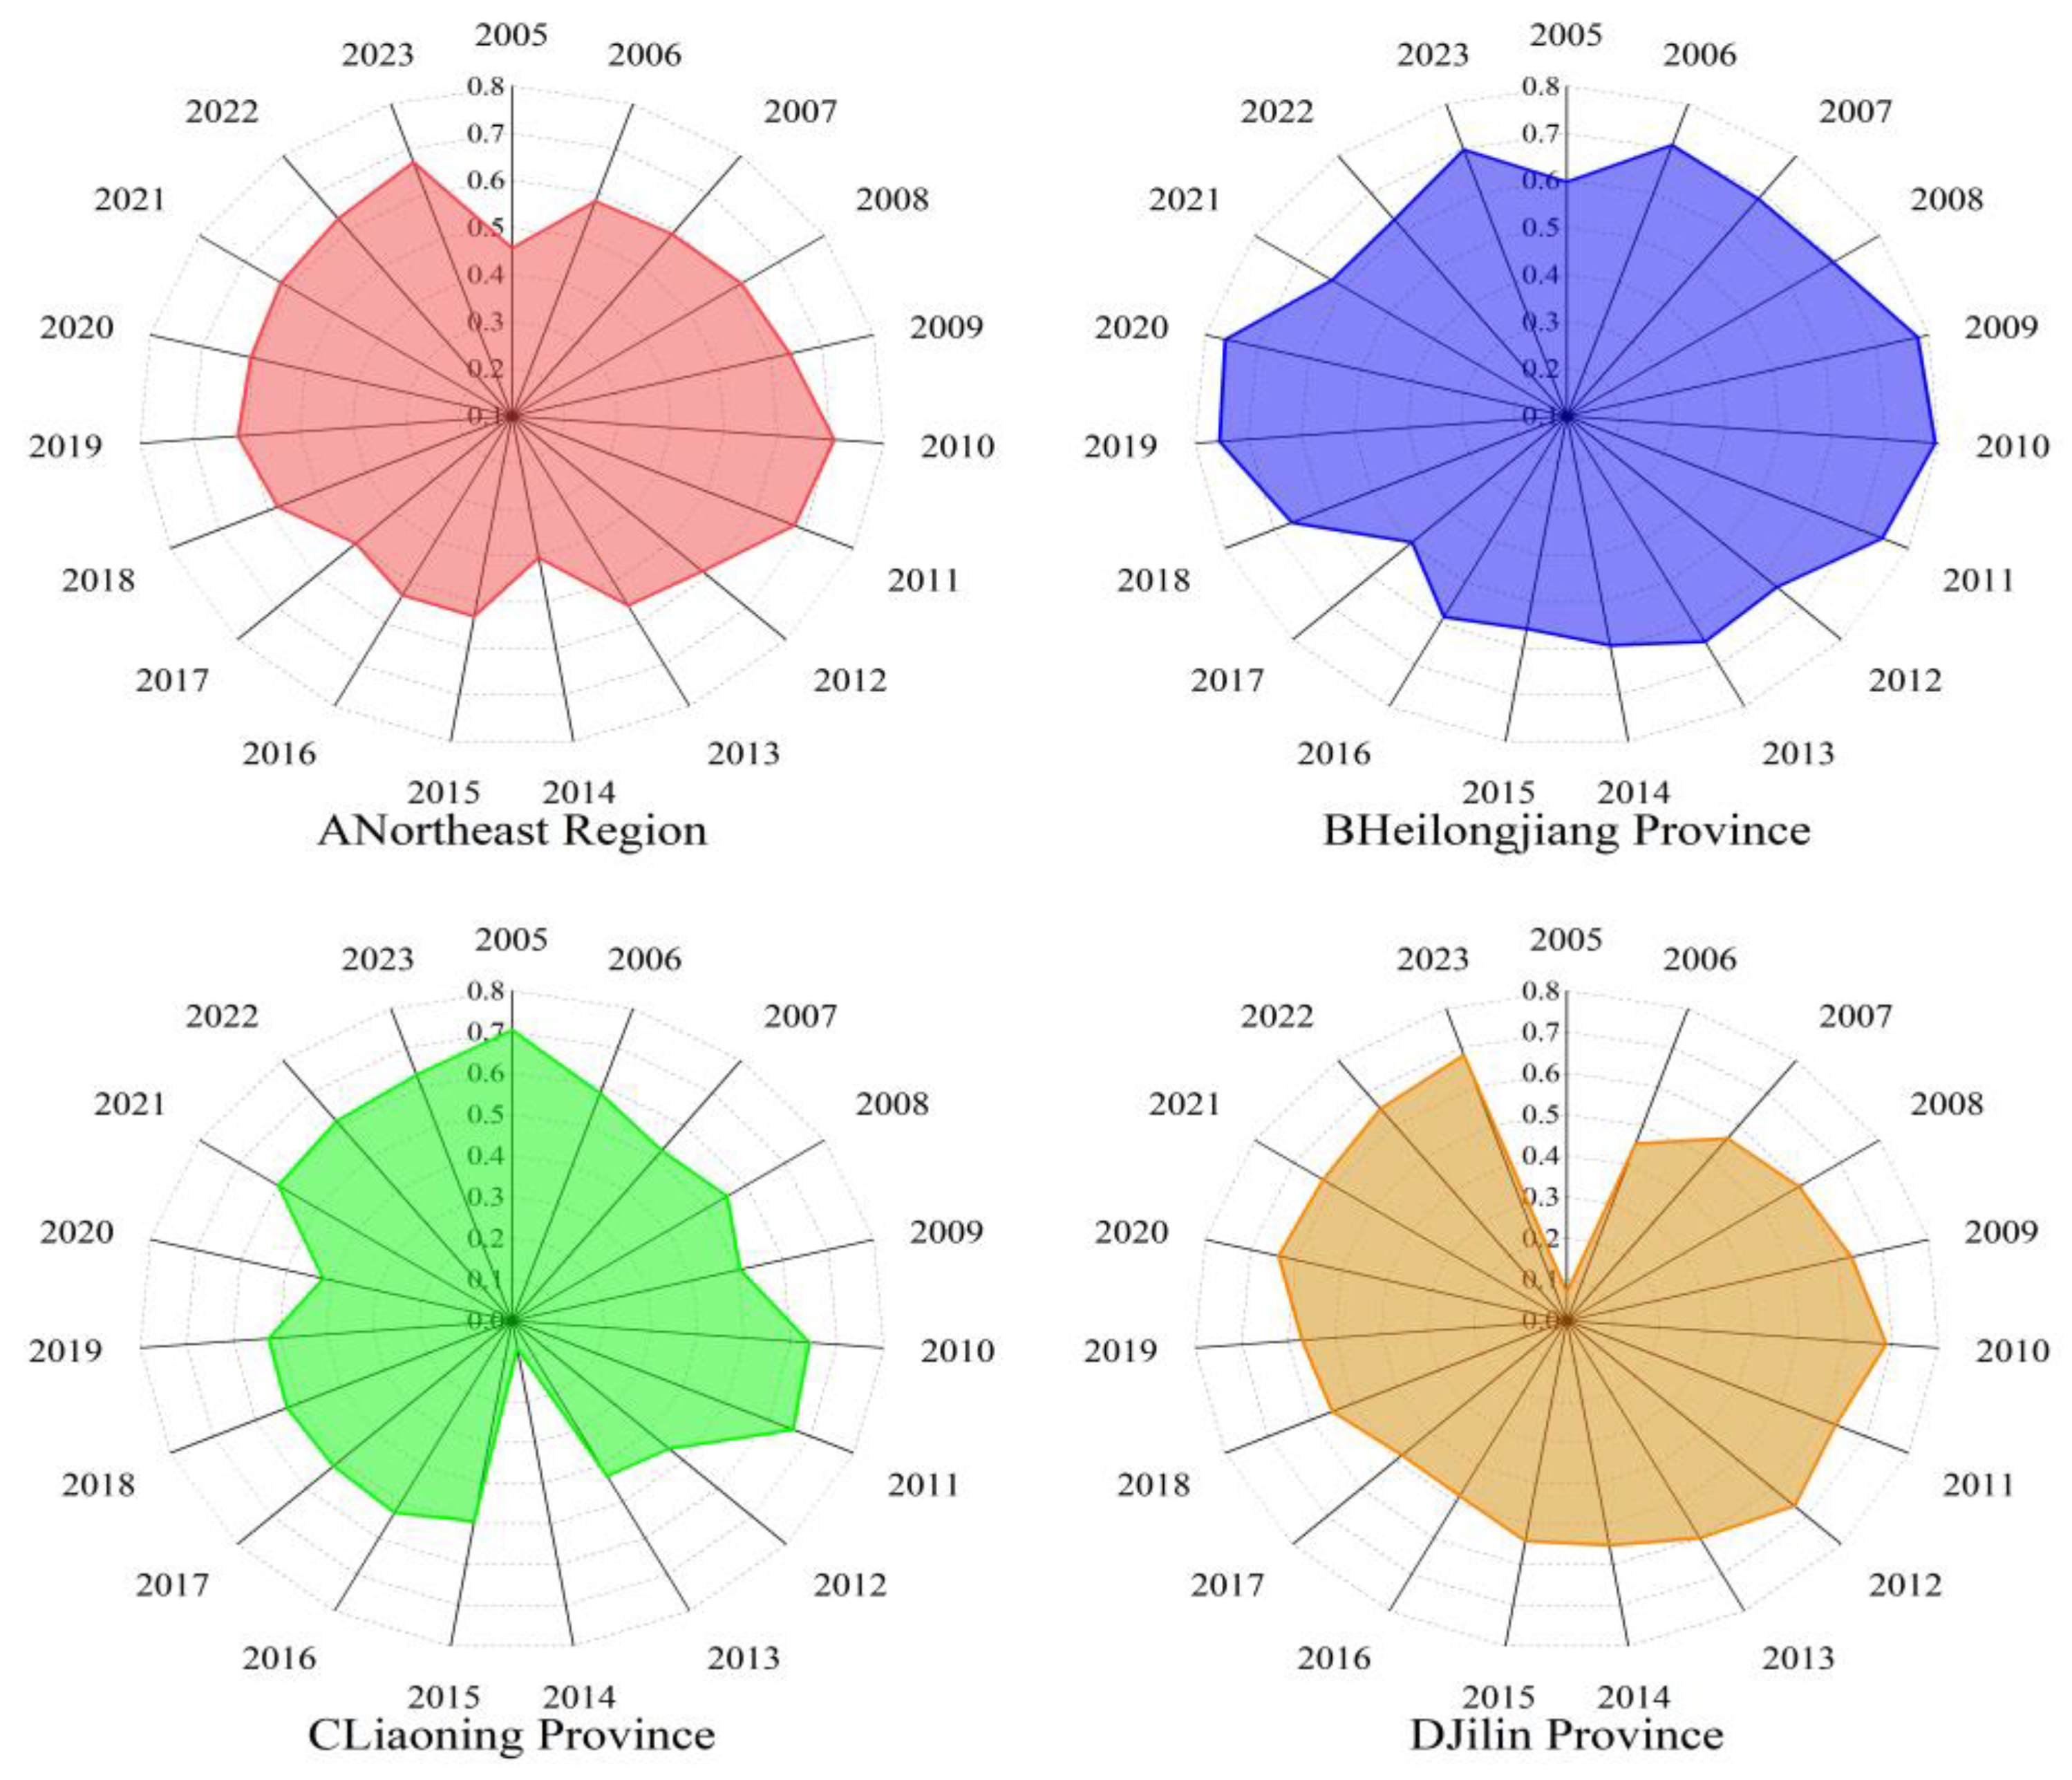
Figure 4.
Trend in WEF Security System Coupling Coordination Levels in Northeast China.
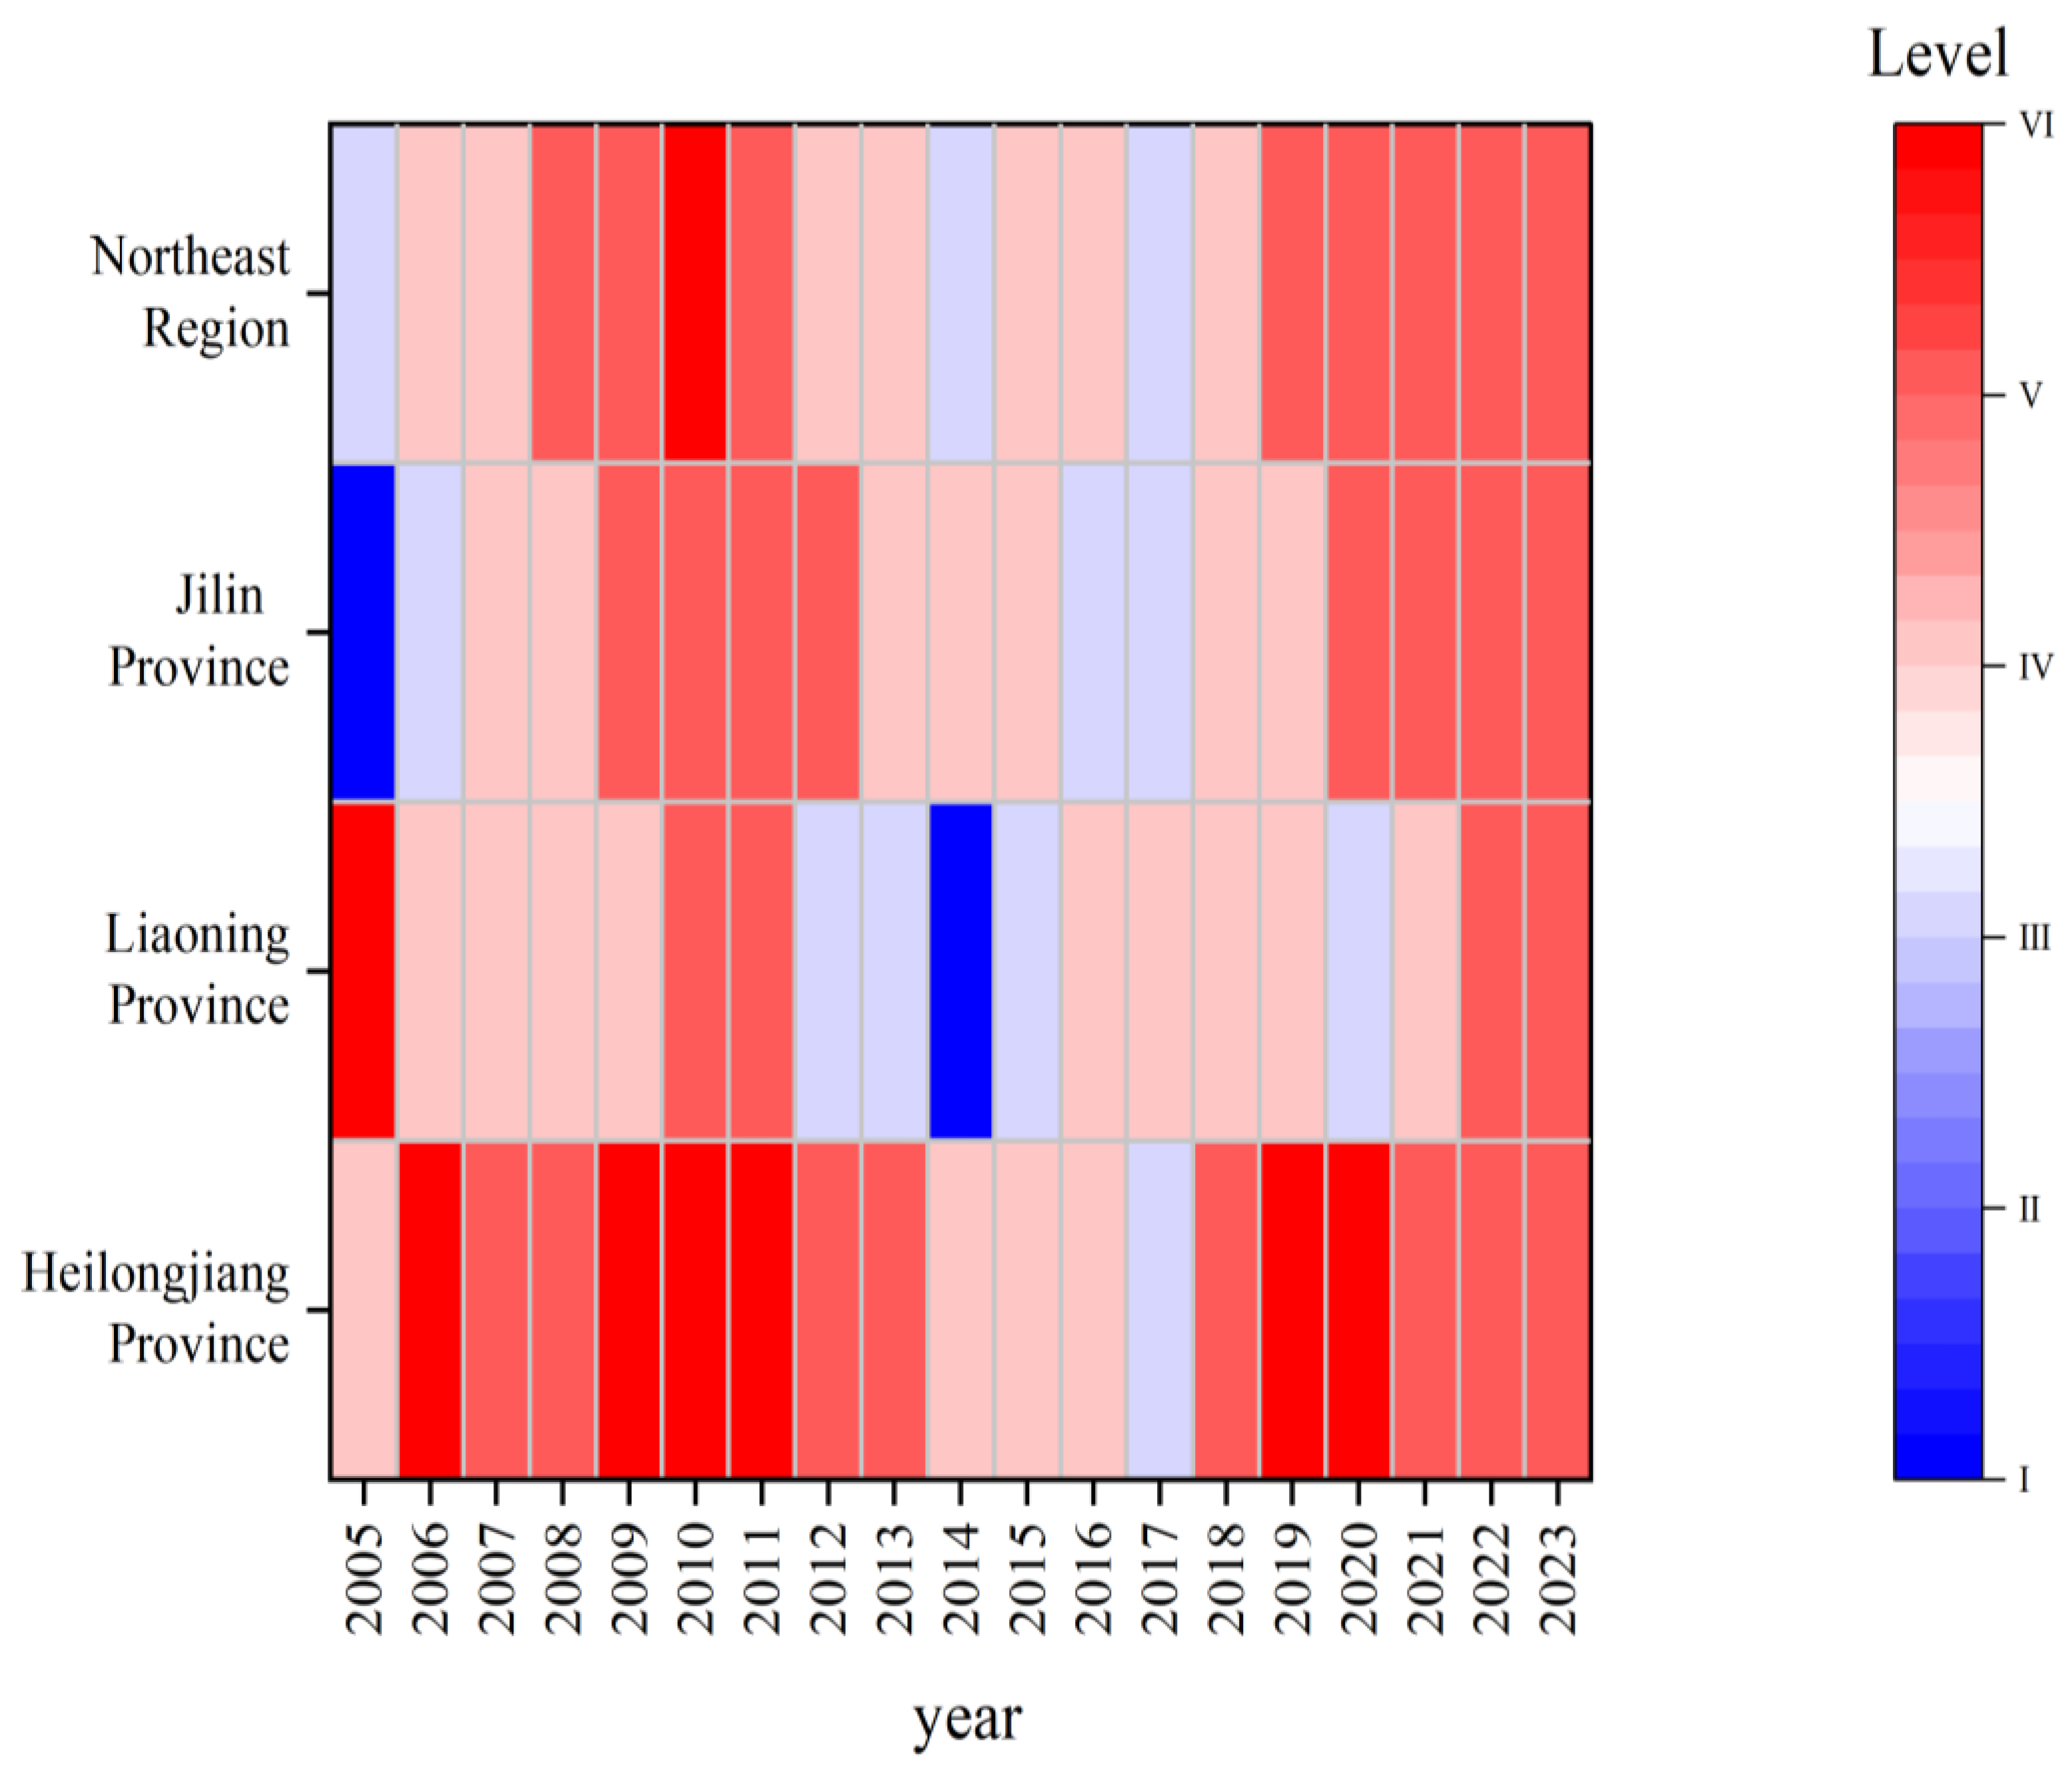
Figure 5.
Barrier Degree Results for Water Systems, Energy Systems, and Food Systems in Northeast China.
Figure 5.
Barrier Degree Results for Water Systems, Energy Systems, and Food Systems in Northeast China.
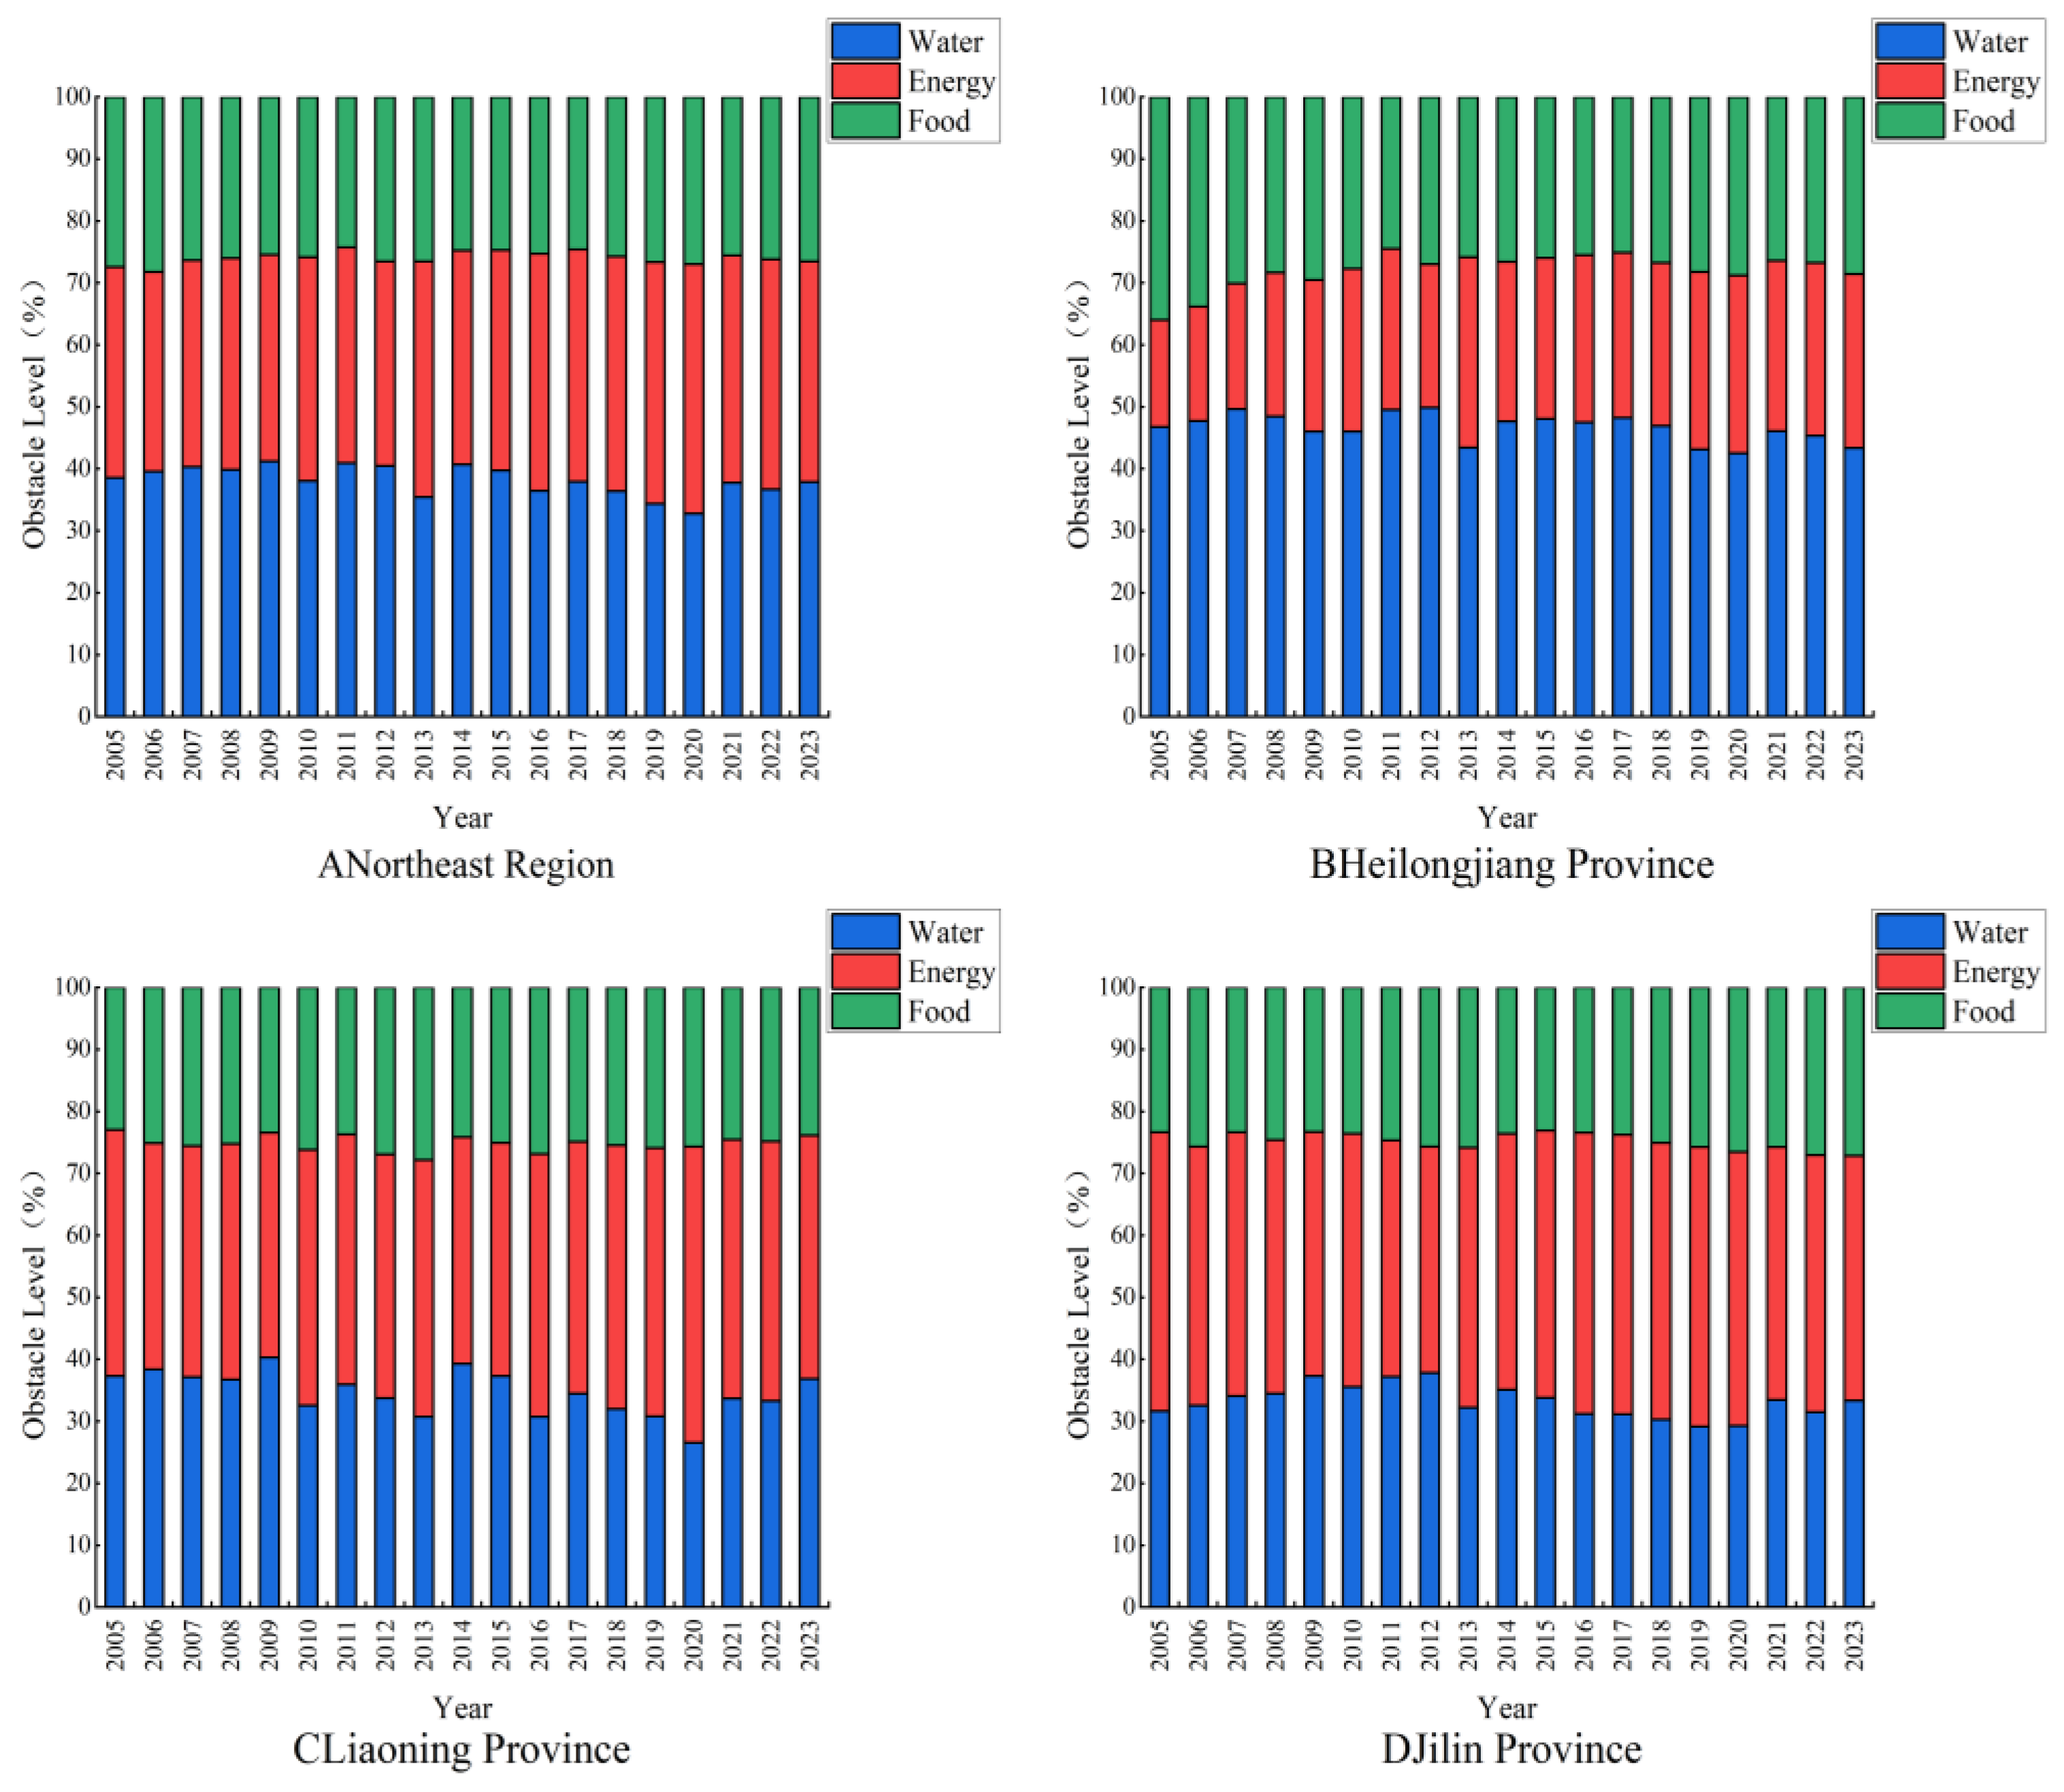
Figure 6.
Barrier Levels for the Collaborative Development of WEF Security Systems in Northeast China.
Figure 6.
Barrier Levels for the Collaborative Development of WEF Security Systems in Northeast China.
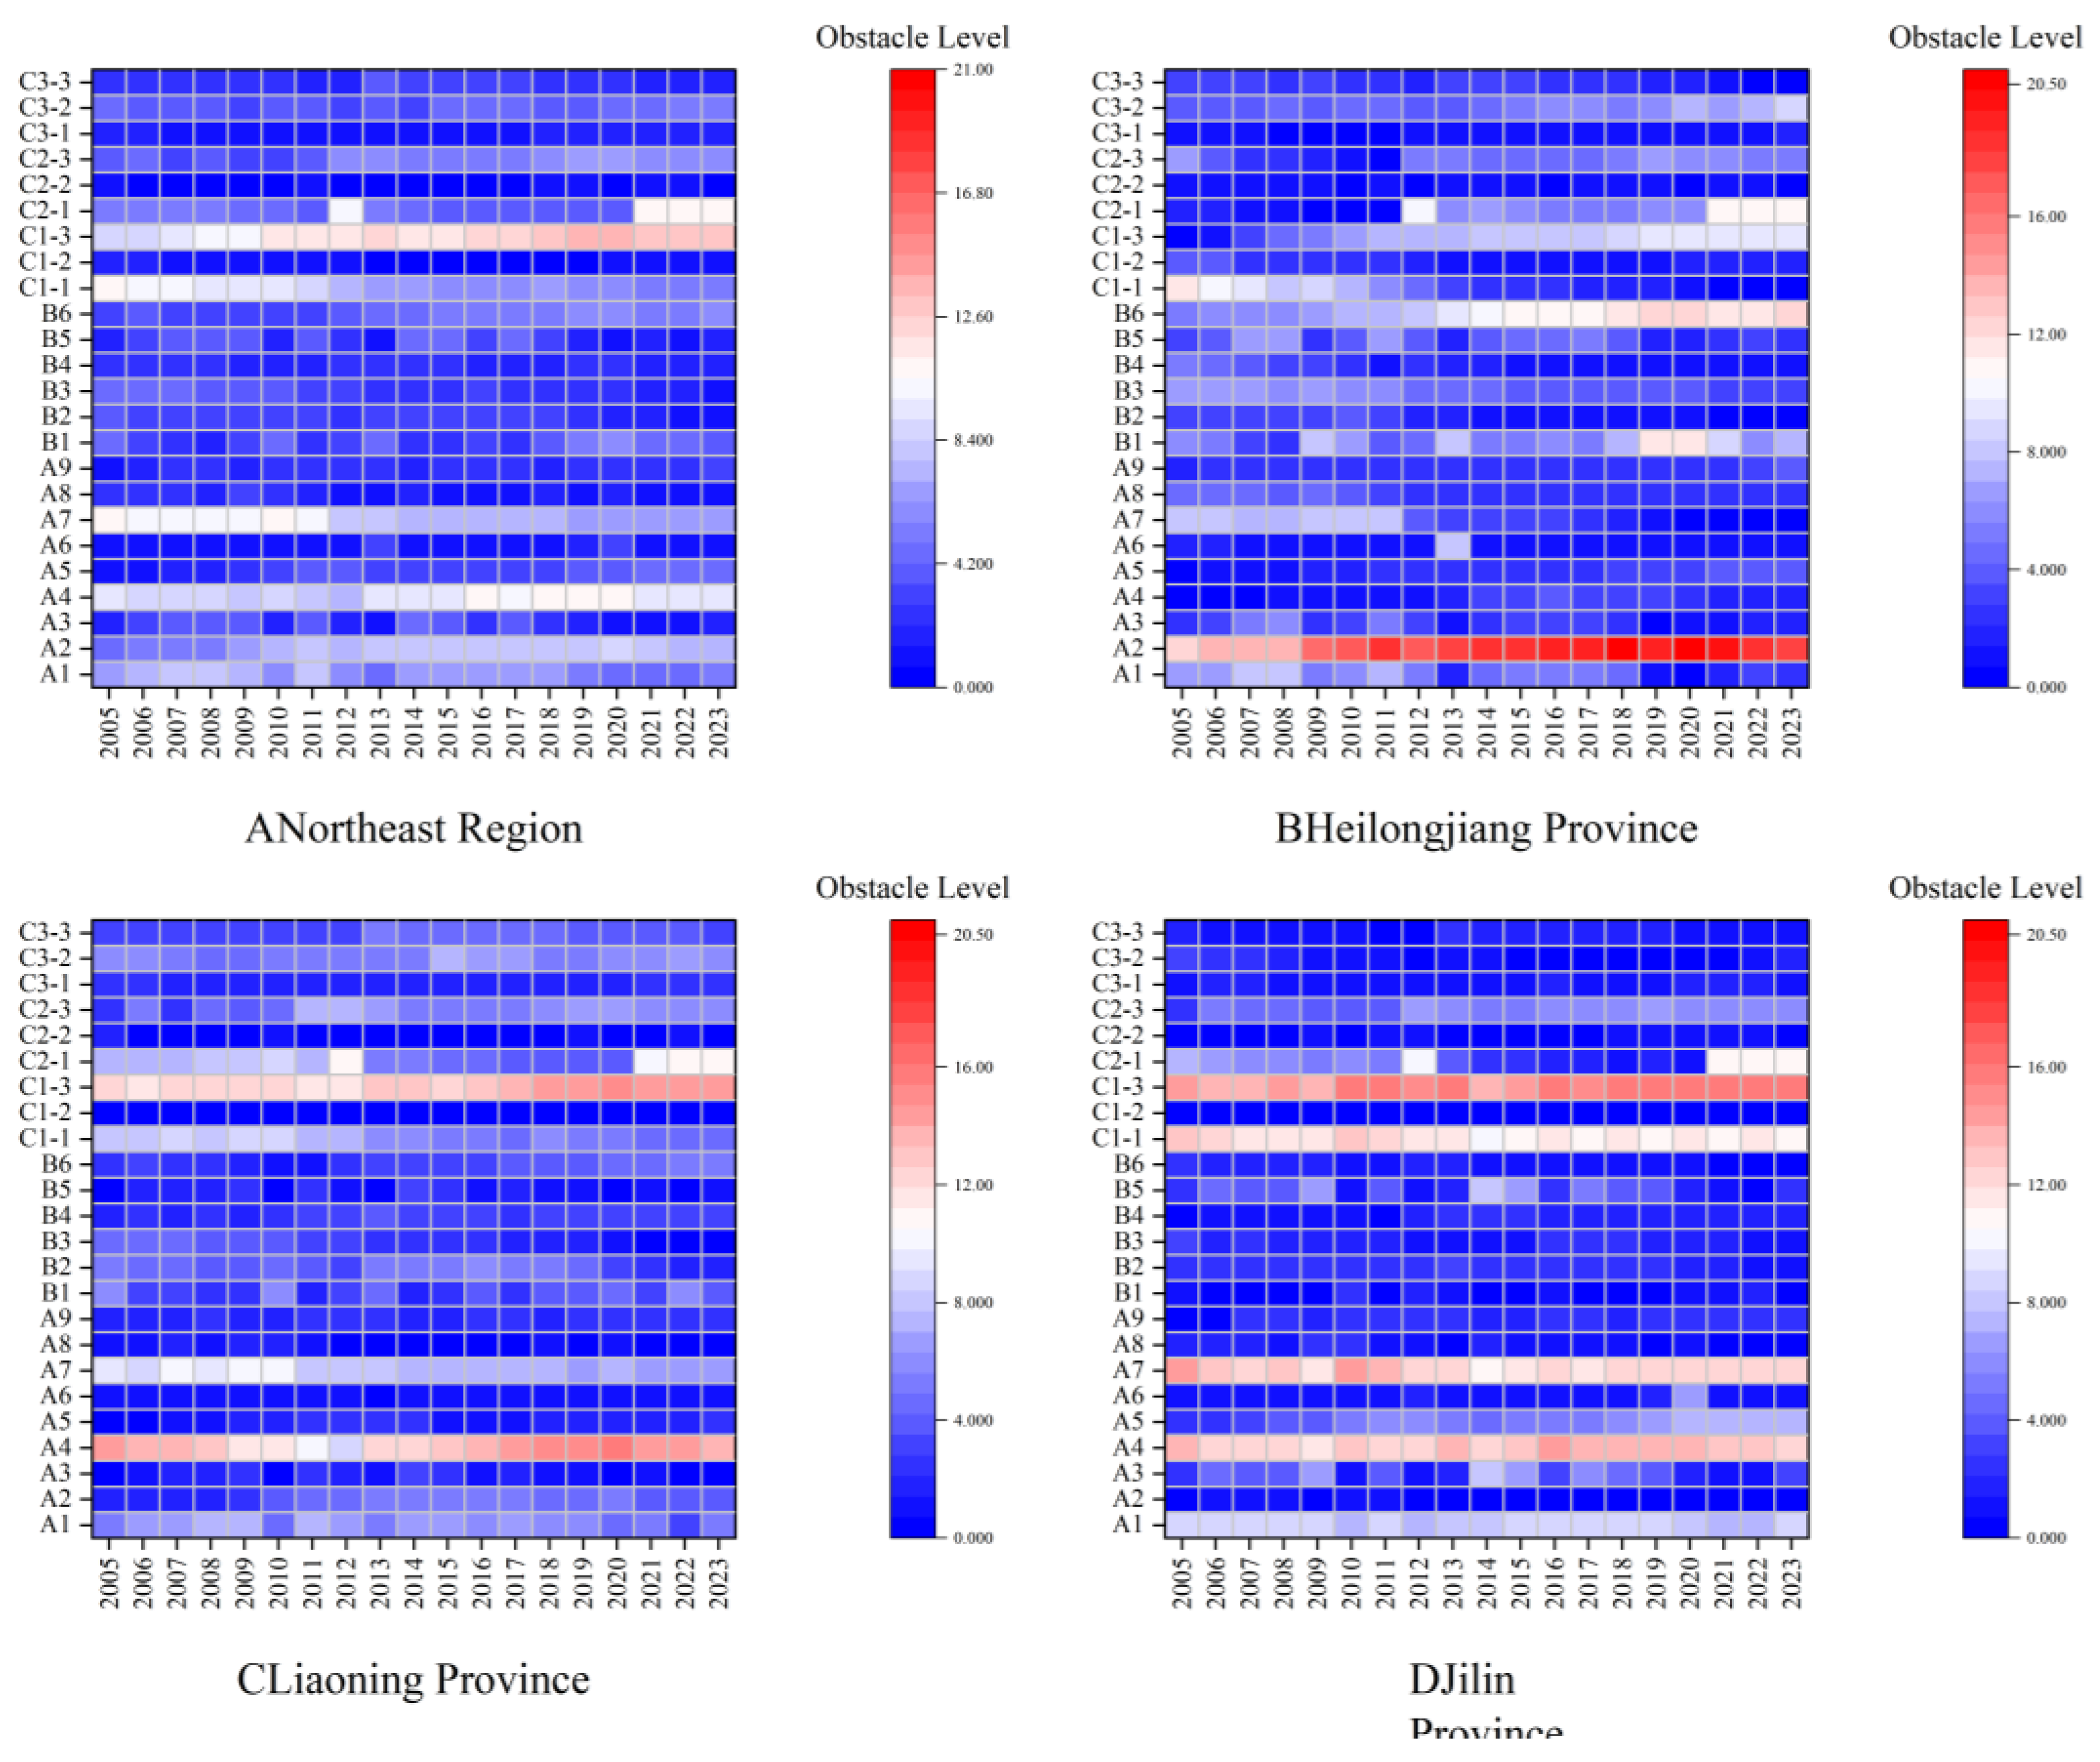

Table 1.
Comprehensive Indicator System for the WEF System in Northeast China.
| Criterion Layer | Primary Indicator Layer | Secondary Indicator Layer | Formula/Unit | Direction | Weight |
|---|---|---|---|---|---|
| Security | Water Resources Subsystem | A1: Per Capita Water Resources | Total water resources / Permanent population (m³/person) | + | 0.046 |
| Water Resources Subsystem | A2: Per Capita Water Use | Total water use / Permanent population (m³/person) | – | 0.095 | |
| Water Resources Subsystem | A3: Water Resource Development & Utilization Rate | Total water use / Total water resources (%) | – | 0.043 | |
| Energy Subsystem | A4: Per Capita Energy Production | Total energy production / Permanent population (tce/person) | + | 0.076 | |
| Energy Subsystem | A5: Per Capita Energy Consumption | Total energy consumption / Permanent population (tce/person) | – | 0.035 | |
| Energy Subsystem | A6: Elasticity Coefficient of Energy Consumption | Growth rate of energy consumption / Growth rate of GDP (%) | – | 0.041 | |
| Food Subsystem | A7: Per Capita Cultivated Land Area | Cultivated land area / Permanent population (m²/person) | + | 0.064 | |
| Food Subsystem | A8: Grain Yield per Unit Area | Total grain output / Sown area of grain crops () | + | 0.020 | |
| Food Subsystem | A9: Grain Output Fluctuation Rate | | (Actual output in year t – Trend output in year t) / Trend output in year t | (%) | – | 0.019 | |
| Coordination | Water-Energy Nexus | B1: Water Consumption per Unit GDP | Total water use / GDP (m³/10⁴ CNY) | – | 0.052 |
| Water-Energy Nexus | B2: Water Consumption per Unit Energy Production | Industrial water use / Total energy production() | – | 0.030 | |
| Energy-Food Nexus | B3: Total Agricultural Machinery Power per Unit Area | Total power of agricultural machinery / Total sown area of crops () | + | 0.029 | |
| Energy-Food Nexus | B4: Proportion of Effective Irrigated Area | Effective irrigated area / Cultivated land area (%) | + | 0.021 | |
| Water-Food Nexus | B5: Proportion of Agricultural Water Use | Agricultural water use / Total water use (%) | – | 0.043 | |
| Water-Food Nexus | B6: Water Consumption per Unit Grain Output | Agricultural water use / Total grain output () | – | 0.055 | |
| Resilience | Coping Capacity | C1-1: Per Capita Grain Availability | Total grain output / Permanent population (kg/person) | + | 0.060 |
| Coping Capacity | C1-2: Total Reservoir Storage Capacity | (10⁸ m³) | + | 0.015 | |
| Coping Capacity | C1-3: Energy Self-Sufficiency Rate | Total energy production / Total energy consumption (%) | + | 0.078 | |
| Recovery Capacity | C2-1: Proportion of Water-Saving Irrigated Area | Water-saving irrigated area / Effective irrigated area (%) | + | 0.052 | |
| Recovery Capacity | C2-2: Growth Rate of Rural Electricity Consumption | (Current year’s consumption – Previous year’s consumption) / Previous year’s consumption (%) | + | 0.010 | |
| Recovery Capacity | C2-3: Multiple Cropping Index | Total sown area of crops / Cultivated land area (%) | + | 0.036 | |
| Adaptive Capacity | C3-1: Comprehensive Agricultural Mechanization Level | Mechanized plowing area / Cultivated land area (%) | + | 0.014 | |
| Adaptive Capacity | C3-2: Proportion of Coal Consumption | Coal consumption / Total energy consumption (%) | – | 0.041 | |
| Adaptive Capacity | C3-3: Area of Soil Erosion Control | (10⁴ hm²) | + | 0.025 |
Note: “+” denotes a positive indicator (higher value is better); “–” denotes a negative indicator (lower value is better). tce = ton of standard coal equivalent.
Table 2.
Classification Criteria for Coupling Coordination Degree Levels.
| Coupling Coordination Degree (D) | Coordination Level | Coupling Degree Stage |
|---|---|---|
| 0.00 ≤ D < 0.20 | Extreme Dysfunction (I) | Low-Level Coupling |
| 0.20 ≤ D < 0.40 | Severe Dysfunction (II) | Low-Level Coupling |
| 0.40 ≤ D < 0.50 | Near Dysfunction (III) | Antagonistic Stage |
| 0.50 ≤ D < 0.60 | Primary Coordination (IV) | Running-in Stage |
| 0.60 ≤ D < 0.70 | Intermediate Coordination (V) | Running-in Stage |
| 0.70 ≤ D < 0.80 | Good Coordination (VI) | Running-in Stage |
| 0.80 ≤ D < 0.90 | High-Quality Coordination (VII) | High-Level Coupling |
| 0.90 ≤ D ≤ 1.00 | Superior Coordination (VIII) | High-Level Coupling |
Table 3.
Comprehensive Development Level of the WEF Security System in Northeast China.
| Province | Heilongjiang | Liaoning | Jilin | Regional Average |
|---|---|---|---|---|
| 2005 | 0.518 | 0.527 | 0.345 | 0.463 |
| 2006 | 0.567 | 0.399 | 0.293 | 0.420 |
| 2007 | 0.526 | 0.363 | 0.386 | 0.425 |
| 2008 | 0.531 | 0.378 | 0.396 | 0.435 |
| 2009 | 0.626 | 0.303 | 0.419 | 0.450 |
| 2010 | 0.655 | 0.494 | 0.503 | 0.550 |
| 2011 | 0.647 | 0.476 | 0.410 | 0.511 |
| 2012 | 0.496 | 0.363 | 0.445 | 0.435 |
| 2013 | 0.466 | 0.378 | 0.414 | 0.419 |
| 2014 | 0.495 | 0.230 | 0.368 | 0.365 |
| 2015 | 0.506 | 0.323 | 0.401 | 0.410 |
| 2016 | 0.510 | 0.409 | 0.427 | 0.448 |
| 2017 | 0.499 | 0.353 | 0.416 | 0.423 |
| 2018 | 0.566 | 0.386 | 0.421 | 0.458 |
| 2019 | 0.622 | 0.392 | 0.445 | 0.486 |
| 2020 | 0.641 | 0.396 | 0.485 | 0.507 |
| 2021 | 0.585 | 0.425 | 0.431 | 0.480 |
| 2022 | 0.567 | 0.443 | 0.466 | 0.492 |
| 2023 | 0.588 | 0.432 | 0.484 | 0.501 |
Disclaimer/Publisher’s Note: The statements, opinions and data contained in all publications are solely those of the individual author(s) and contributor(s) and not of MDPI and/or the editor(s). MDPI and/or the editor(s) disclaim responsibility for any injury to people or property resulting from any ideas, methods, instructions or products referred to in the content. |
© 2026 by the authors. Licensee MDPI, Basel, Switzerland. This article is an open access article distributed under the terms and conditions of the Creative Commons Attribution (CC BY) license (http://creativecommons.org/licenses/by/4.0/).
Copyright: This open access article is published under a Creative Commons CC BY 4.0 license, which permit the free download, distribution, and reuse, provided that the author and preprint are cited in any reuse.


