Submitted:
06 January 2026
Posted:
07 January 2026
You are already at the latest version
Abstract
Modern high-speed train compartments contain intricate internal configurations. In the event of a fire emergency, the propagation velocity of flames through the passenger cabin is determined by multiple factors, including compartment design, ignition source characteristics, and airflow conditions. This study employed numerical simulation approaches to investigate the effects of fire source power, fire source location, and longitudinal ventilation velocity on the rate of flame progression. The simulation outcomes reveal that, under forward ventilation conditions, the magnitude of fire power has a minimal influence on flame propagation speed. However, stronger fire sources lead to earlier initiation of flame spread along the carriage. Central positioning of the ignition source results in bidirectional flame movement toward both ends of the carriage, with faster propagation rates than those of fires originating at the extremities. Longitudinal airflow patterns significantly. When the airflow speed within the tunnel remains below 3 meters per second, the impact of longitudinal ventilation on fire propagation speed in the train is minimal under forward ventilation conditions. Conversely, in reverse-ventilation scenarios, the rate of flame advancement shows a positive correlation with increasing ventilation speed. Nevertheless, once tunnel ventilation velocities exceed 3 m/s, combustion propagation within high-speed rail carriages becomes impossible due to intact windows, which create oxygen-deficient conditions that prevent the development of fire.
Keywords:
high-speed train
; flame propagation rate
; fire source power
; fire source position
; longitudinal ventilation velocity
1. Introduction
The rapid expansion of high-speed rail infrastructure serves as a pivotal driver of modern economic development, facilitating unprecedented connectivity between major urban centers and fostering regional integration [1,2,3]. As these networks proliferate, particularly in nations like China where the high-speed rail grid is extensive, the safety of the rolling stock and the passengers it carries becomes a paramount concern for engineers and regulators alike. The confined nature of train compartments, combined with high passenger density, creates hazardous conditions during fire incidents. Flames and toxic fumes can propagate swiftly through enclosed carriages, potentially leading to severe human casualties and substantial material damage [4]. Consequently, implementing robust fire prevention measures in high-speed train construction becomes imperative for passenger protection.
In fire safety engineering for high-speed trains, the heat release rate is a crucial parameter for both protective design and risk evaluation [5]. Traditional approaches to estimating this parameter [6,7], fail to account for flame propagation dynamics within passenger compartments. These conventional methods tend to overestimate actual thermal output values [8]. There exists a direct correlation between the progression of fire intensity and flame advancement patterns in rail vehicles, making detailed investigation of flame propagation speeds within carriages particularly significant. Such studies would provide fundamental data for developing accurate thermal output prediction models specific to high-speed rail fires [9]. Existing scientific literature indicates that material combustion propagation velocities are primarily influenced by geometric characteristics such as surface configuration [10], dimensional width [11,12], material depth [13,14], and moisture content [15,16]. The spread of flames is influenced by multiple environmental factors, including atmospheric pressure, wind velocity, and oxygen concentration during the combustion process of materials [15,17,18,19,20].
Zhu and colleagues [10] investigated the flame propagation rate on flat and wavy surfaces through experiments and numerical simulations during paperboard combustion. Their results demonstrated that when flames spread on wavy surfaces, the material surface temperature is higher, and the flame propagation rate is greater than that on flat surfaces. Yan et al. [21] explored the effect of width on the flame propagation rate of insulating material surfaces via small-scale combustion experiments and theoretical analysis. Both experimental and theoretical results indicated that, across different ambient pressures, the flame propagation rate decreases with increasing material width. Additionally, moisture content significantly alters material combustion behavior, with studies [16] documenting initial stability in flame height and propagation rate, followed by a gradual decline during combustion. Environmental factors such as atmospheric pressure and oxygen concentration, which vary with altitude, also critically impact material combustion characteristics [22]. Huang et al. [20] studied the flame spread of expanded polystyrene at different altitudes through experiments and numerical simulations. Their finding revealed an inverse relationship between flame propagation speed and altitude. Michael et al. [23] investigated how airflow patterns and material configuration influence flame propagation velocity. Their study demonstrated that the surrounding flow conditions significantly affect both convective and radiative heat transfer at the material’s surface, thereby altering the thermal decomposition characteristics during combustion.
Current studies predominantly examine flame propagation characteristics in homogeneous materials. However, high-speed train compartments present a more intricate scenario, featuring multiple structural elements composed of diverse materials. This complexity results in substantially different flame propagation dynamics compared to single-material scenarios. However, limited research has been conducted on flame spread rates in train carriages. Previous work by Li and colleagues [24,25] involved tunnel-based fire experiments with subway trains of varying dimensions, measuring average flame propagation speeds of 1.5–2.0 m/min. Their research, constrained by experimental limitations, didn’t explore the variables influencing flame spread within compartments. In 2017, Lönnermark et al. [26] performed a full-scale fire test, discovering that the quantity and relative position of combustibles significantly affect flame spread. Research indicates that in tunnel fire scenarios involving high-speed trains, airflow velocity plays a crucial role in determining fire progression patterns within the carriage [4], thereby modifying flame propagation characteristics. In summary, the flame propagation rate inside carriages is mainly affected by fire source properties and ventilation conditions.
This study employs numerical simulations to investigate the flame propagation rate inside carriages, analyzing the effects of fire source power and location, and longitudinal ventilation velocity. Following this introduction, Section 2 describes the numerical method and model for high-speed train fires, defines the flame propagation rate inside the carriage, and analyzes the impact of mesh size on calculation results. Section 3 presents parametric studies on flame spread behavior under varying conditions. The final section summarizes the conclusions.
2. Materials and Methods
The present research employs the Fire Dynamics Simulator (version 6.7.4) [27] to simulate fire scenarios in high-speed trains, with the Large Eddy Simulation (LES) [28] methodology applied to analyze turbulent smoke movement. The reliability of the FDS program for simulating high-speed train fires has been validated in prior research [18,29].
The universal governing equation is expressed as:
The component conservation equation is given by:
where, is the mass formation rate of the ith component in unit volume, kg/(m3·s); Di represents the mass diffusion coefficient for components, m2/s; Yi denotes volume fraction of the ith component.
Additionally, the ideal gas state equation is required, expressed as:
where P represents atmospheric pressure, Rg denotes the specific gas constant, and T stands for absolute temperature.
2.1. Numerical Model
The high-speed train model used in this study is the Chinese standard EMU (CR400AF). Figure 1 illustrates the architectural configuration of the train compartment. The carriage has a length of 24.2 m, a width of 3.4 m, a height of 2.9 m, and a passenger capacity of 85. A total of 20 windows are installed on both sides of the carriage (cl1-cl10, cr1-cr10), and two doors are positioned on each side, with each door measuring 1.1 m in width and 2.2 m in height.
Figure 2 illustrates the numerical model of the high-speed train fire established. The tunnel spans 80 m, with dimensions of 7 m wide and 6 m high. Boundary conditions are specified as follows: the tunnel’s upstream entrance uses a “supply” boundary, the downstream exit uses an “open” boundary, and all remaining surfaces are designated “inert” boundaries. For fire simulation purposes, the HRRPUA method [18] was implemented to model the combustion behavior within the train compartment. Detailed parameters for the HRRPUA data and ignition points for various materials are provided in Reference [4] (Appendix A).
As shown in Figure 3, five fire source positions are studied in this paper, considering the tunnel ventilation direction and smoke spreading direction at the initial stage of fire development. Fire source positions 1 and 5 are located at the corner of the carriage end wall; positions 2 and 4 on the luggage rack surface; and position 3 between two seats. The fire source power ranges from 150 to 1000 kW, with a duration of 480 s[18,29]. Prior to initiating the simulation, the door on the fire source side (as shown in Figure 2) is opened to simulate the train’s state after passenger evacuation[4,18]. Additionally, the window rupture temperature is set to 600 °C to replicate the window rupture process[6,30]. A total of 29 simulation conditions are designed, as detailed in Table 1.
2.2. Definition of Flame Propagation Rate in the Carriage
This section defines the concept of flame propagation rate within the confined space of a high-speed train compartment. For the simulation, the fire source at position 1 ( power: 150 kW ). As shown in Figure 2, the mesh size of “Mesh 1” is set to 0.08 m, and “Mesh 2” to 0.16 [4].
Figure 4 illustrates the progression of flame propagation within a high-speed train compartment. Flames and high-temperature smoke first spread along the ceiling toward both ends of the carriage, igniting materials there. Subsequently, due to the radiant heat from the top, the seats and the floor also caught fire. At 600 s (t0), the first-row seats are ignited, and flames begin to spread along the carriage. By 1040 s (tp), flames have spread to the other side of the carriage. Figure 5 presents data on flame extension distances over time. The propagation process can be divided into two phases: 600-900 s (Phase Ⅰ) and 900-1040 s (Phase Ⅱ). During these phases, flames propagate approximately uniformly along the length of the carriage, and the propagation velocity in the second phase is higher than in the first. This is because, in the initial phase of longitudinal flame propagation, when the carriage temperature is lower, the material’s combustion intensity is also lower. In the later phase, however, the carriage temperature and combustion intensity of the material increase, which accelerates the flame spread rate.
To study how different parameters affect the flame propagation rate, a metric was established by averaging the speed during both phases. This represents the overall flame propagation rate inside the compartment, mathematically expressed as:
where denotes the flame propagation speed, m/min; represents the flame spread distance, m ( is the distance from the first-row seats to the right end of the carriage in Figure 4, =16.2 m); indicates the duration between the start of longitudinal flame propagation and full carriage coverage, min (=tp-t0).
According to Equation (4), the flame spread rate in Figure 5 is calculated to be approximately 2.21 m/min. This methodology also applies to determining the flame spread rate at alternative ignition locations within the railcar, where the rate equals the quotient of the flame spread distance over the spread time.
2.3. Effects of Mesh Size
The precision of computational results depends on the mesh size. To achieve reliable fire simulation outcomes, smaller mesh sizes are employed in the vicinity of the high-speed train compartment. In this investigation, “Mesh 2” uses a grid spacing twice that of “Mesh 1”. Figure 6 illustrates the progression of the flame propagation rate within the train compartment as the grid spacing of “Mesh 1” decreases from 0.12 m to 0.06 m. Analysis of Figure 6 reveals minimal variation in flame propagation rate when the mesh size is adjusted from 0.08 m to 0.06 m. Consequently, “Mesh 1” uses a mesh size of 0.08 m, yielding a total of 2.95 million grid elements. All subsequent simulations are performed using this mesh size.
2.4. Validation of the Numerical Model
The heat release rate during high-speed rail carriage fires is determined by the progression of combustion. The accuracy of the computational fire model can be validated by comparing simulation results with experimental data. Consequently, we have carried out combustion experiments on components of high-speed trains. The component incorporated two-row seating arrangements, sections of ceiling, end walls, sidewalls, floor material, and a luggage rack. Figure 7(a) displays the FDS model constructed from the physical configuration of these components, with the ignition point located on the seating surface. The fire power is maintained at 15 kW for 3 min. Figure 7(b) compares heat release rates from the numerical simulation and experimental measurements, demonstrating strong agreement. This congruence confirms the reliability of the adopted simulation approach for modeling fire scenarios in high-speed rail environments.
3. Results and Discussion
Multiple parameters, including the fire source power, fire source position, and longitudinal ventilation velocity, influence the flame propagation rate within high-speed rail compartments. Computational modeling was conducted to comprehensively examine the underlying principles of these contributing elements.
3.1. Fire Source Power Effects
To investigate how fire source power affects flame propagation rate in high-speed train compartments, taking fire source position 1 as an example for analysis. Figure 8 presents data on flame propagation rate and duration across varying fire intensities. As illustrated in Figure 8(a), the comparative analysis reveals that for fire source powers of 150 kW, 500 kW, and 1000 kW, the maximum variation in the flame propagation rate is approximately 3.2%. This indicates that, under forward airflow conditions, the intensity of the fire source has minimal influence on the rate of flame spread within the train carriage.
As illustrated in Figure 8(b), the intensity of the fire source significantly impacts the initiation time of flame spread along the train carriage (t0). With a 150 kW fire source, flame spread commences after 600 s, whereas this duration reduces to merely 200 s when the fire source power escalates to 1000 kW. This demonstrates an inverse relationship between fire source power and the time to initiate flame propagation. Figure 9 presents data regarding window breakage times across varying fire source intensities, revealing that higher power levels correspond to earlier window rupture times. The enhanced combustion intensity during the fire’s initial phase, driven by increased fire source power, results in greater accumulation of high-temperature smoke near the compartment ceiling. This phenomenon accelerates the heating rate of the lower air layer, thereby advancing the timing of window rupture. Following window breakage, tunnel air infiltrates the compartment through the fractured window, providing the necessary ventilation. The combustion process necessitates a continuous supply of oxygen to sustain flame propagation.
As shown in Figure 9, during flame propagation, the time difference in rupture time between windows No. 2 and No. 10 under different fire source powers is nearly constant. This observation further demonstrates that the magnitude of the fire source exerts minimal influence on the speed of flame advancement within the high-speed train carriage.
3.2. Fire Source Position Effects
This section examines how the location of the fire source (as shown in Figure 3) affects flame propagation rate within a high-speed train carriage. Figure 10 presents comparative data on flame propagation rate and propagation time across various ignition locations. Minimal variation in flame propagation rate was observed between positions 1 and 2. The progression of fire propagation from these two positions is visually documented in Figure 4 and Figure 11. The primary distinction in fire development is the timing of ignition for the left-side front-row seating. The seat at position 2 ignites 145 s later than that at position 1. This is because the fire source at position 1 is located at the corner of the carriage end wall, allowing direct contact between flames and the first-row seat. In contrast, the fire source at position 2 first ignites the ceiling material above it, and the seats are subsequently ignited by thermal radiation from the ceiling.
When a fire broke out at position 3 (between two seats), the flames did not spread. Indicating that a 150 kW fire source is insufficient to cause fire spread inside the carriage. Existing scholarly investigations[4] corroborate this observation, revealing that limited thermal output results in diminished flame elevation, preventing ceiling materials directly above the ignition point from reaching their ignition temperature and thereby inhibiting flame transmission across adjacent seating arrangements. Figure 12 shows the flame propagation process at position 3 with fire source powers of 150 kW, 500 kW, and 1000 kW. As observed in Figure 12(a) and Figure 12(b), no flame spread occurs at 150 kW and 500 kW. Figure 12c shows that at 1000 kW, flames spread inside the carriage, with a different propagation process compared to when the fire source is located at the carriage ends (positions 1 and 2). In the early stage of fire development, the ceiling above the fire source is ignited, and high-temperature smoke spreads to both ends of the carriage, igniting end materials. Flames then spread from both ends toward the center (starting at 465 s) and fully cover the carriage by 795 s. The average flame propagation rate during this process is 2.95 m/min, higher than that when the fire source is at the carriage ends (positions 1 and 2).
As illustrated in Figure 10 the flame propagation velocity reaches 3.47 m/s when the ignition point is at position 4, exceeding the propagation rates at alternative fire origin positions. The progression of flame expansion at position 4 is depicted in Figure 13 and shows characteristics similar to those at position 3 (with a fire intensity of 1000 kW). Comparing the flame propagation process at position 4 with that at position 2 (Figure 11), it is found that flames start propagationing later when the fire source is at position 4. This is because in the early stage of fire development at the middle position, windows remain unruptured, and oxygen at the carriage ends is sufficient. High-temperature smoke above the fire source spreads to the ends, igniting end materials. Subsequently, as smoke settles inside the carriage, windows rupture, and fresh tunnel air enters to supplement oxygen, prompting flames to spread from both ends toward the center. In contrast, the fire source at position 2 (above the end luggage rack) is closer to the door, resulting in higher oxygen content, stronger material combustion intensity, and earlier window rupture.
3.3. Longitudinal Ventilation Velocity Effects
In the event of a train compartment fire, the interaction between the relative direction of smoke propagation and the longitudinal air currents significantly impacts fire propagation dynamics. This segment examines how varying tunnel ventilation speeds affect combustion rates at positions 1 and 5 (as shown in Figure 3). When the fire source is located at position 1, the smoke propagation direction in the initial stage of fire in the carriage is the same as the longitudinal ventilation direction, which is called forward ventilation. When the fire source is at position 5, the initial smoke spreading direction is opposite to the longitudinal ventilation direction (referred to as reverse ventilation).
3.3.1. Forward Ventilation
In the event of a high-speed train catching fire within a tunnel, the longitudinal ventilation serves two primary functions. (1) accelerating smoke spread in the early stage of fire development and supplementing oxygen for material combustion to enhance combustion intensity; (2) removing high-temperature smoke from the carriage, reducing the temperature of the combustion surface, and inhibiting flame spread. Figure 14 illustrates how varying longitudinal ventilation velocities (1-3 m/s) affect flame propagation rate and time at position 1. At these longitudinal ventilation velocities, the flame propagation rate under different fire source powers is 2.14–2.46 m/min, with a maximum relative deviation of approximately 13%. Consequently, tunnel ventilation below 3 m/s demonstrates minimal impact on fire advancement within a high-speed train carriage.
Figure 14(b) shows the time when flames begin to spread longitudinally and fully cover the carriage under different longitudinal ventilation velocities and fire source powers. As the longitudinal ventilation velocity increases, the start time of flame spread first decreases and then increases, while the time to full carriage coverage increases. This is because when the velocity increases from 1 m/s to 2 m/s, the initial smoke propagation rate increases, reducing the time to flame propagation. When the velocity reaches 3 m/s, high-temperature smoke is rapidly removed by the longitudinal airflow, reducing the smoke layer thickness and advancing the onset of flame propagation. In the later stage of flame propagation, the longitudinal airflow cools the combustion surface, inhibiting flame propagation.
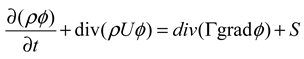
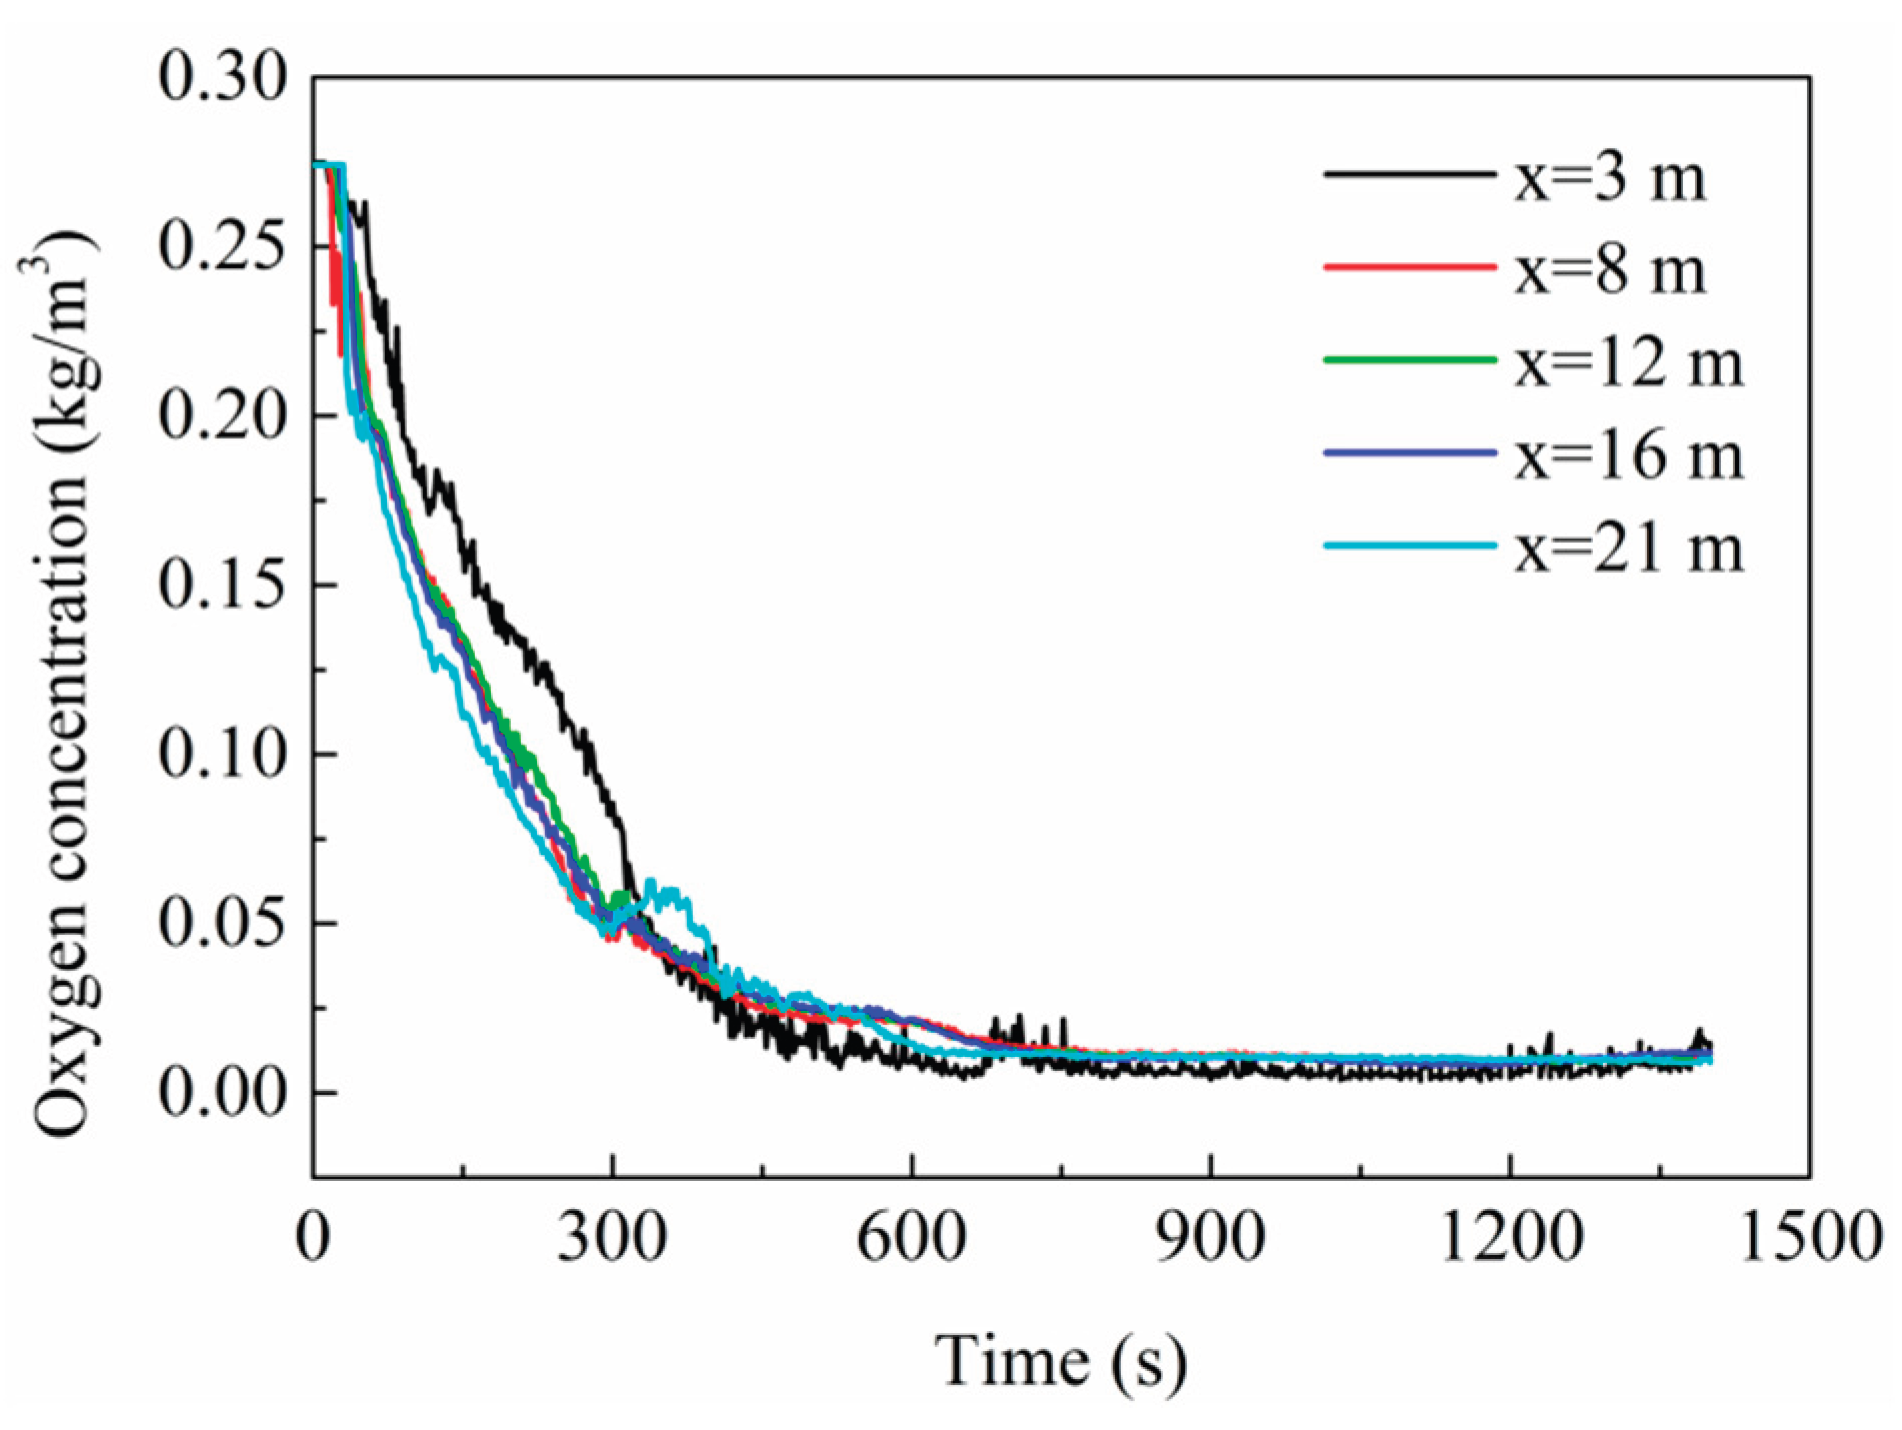
The data presented in Figure 14(a) reveal that at a longitudinal ventilation velocity of 4 m/s, the flame propagation rate drops to zero. Under these conditions, with a fire source power of 500 kW and a ventilation velocity of 4 m/s, window surface temperatures are shown in Figure 16. Only the window closest to the ignition point (cr1) experienced failure, while all other window surfaces remained below the critical failure threshold of 600 °C. The intact windows prevent sufficient oxygen from entering the compartment to sustain material combustion, effectively halting flame propagation. This has been confirmed in the oxygen concentration monitoring data at a height of 1.7 m as shown in Figure 17. Consequently, when longitudinal ventilation velocities exceed 4 m/s, the cooling capacity of the airflow on burning surfaces in high-speed train compartments becomes greater than the heat generated by combustion. The limited oxygen supply prevents the flames from propagating within the carriage.
Figure 15.
Flame propagation process in the high-speed train carriage when the longitudinal ventilation velocity is 4 m/s (at fire source position 1, and the fire source power is 500 kW).
Figure 15.
Flame propagation process in the high-speed train carriage when the longitudinal ventilation velocity is 4 m/s (at fire source position 1, and the fire source power is 500 kW).
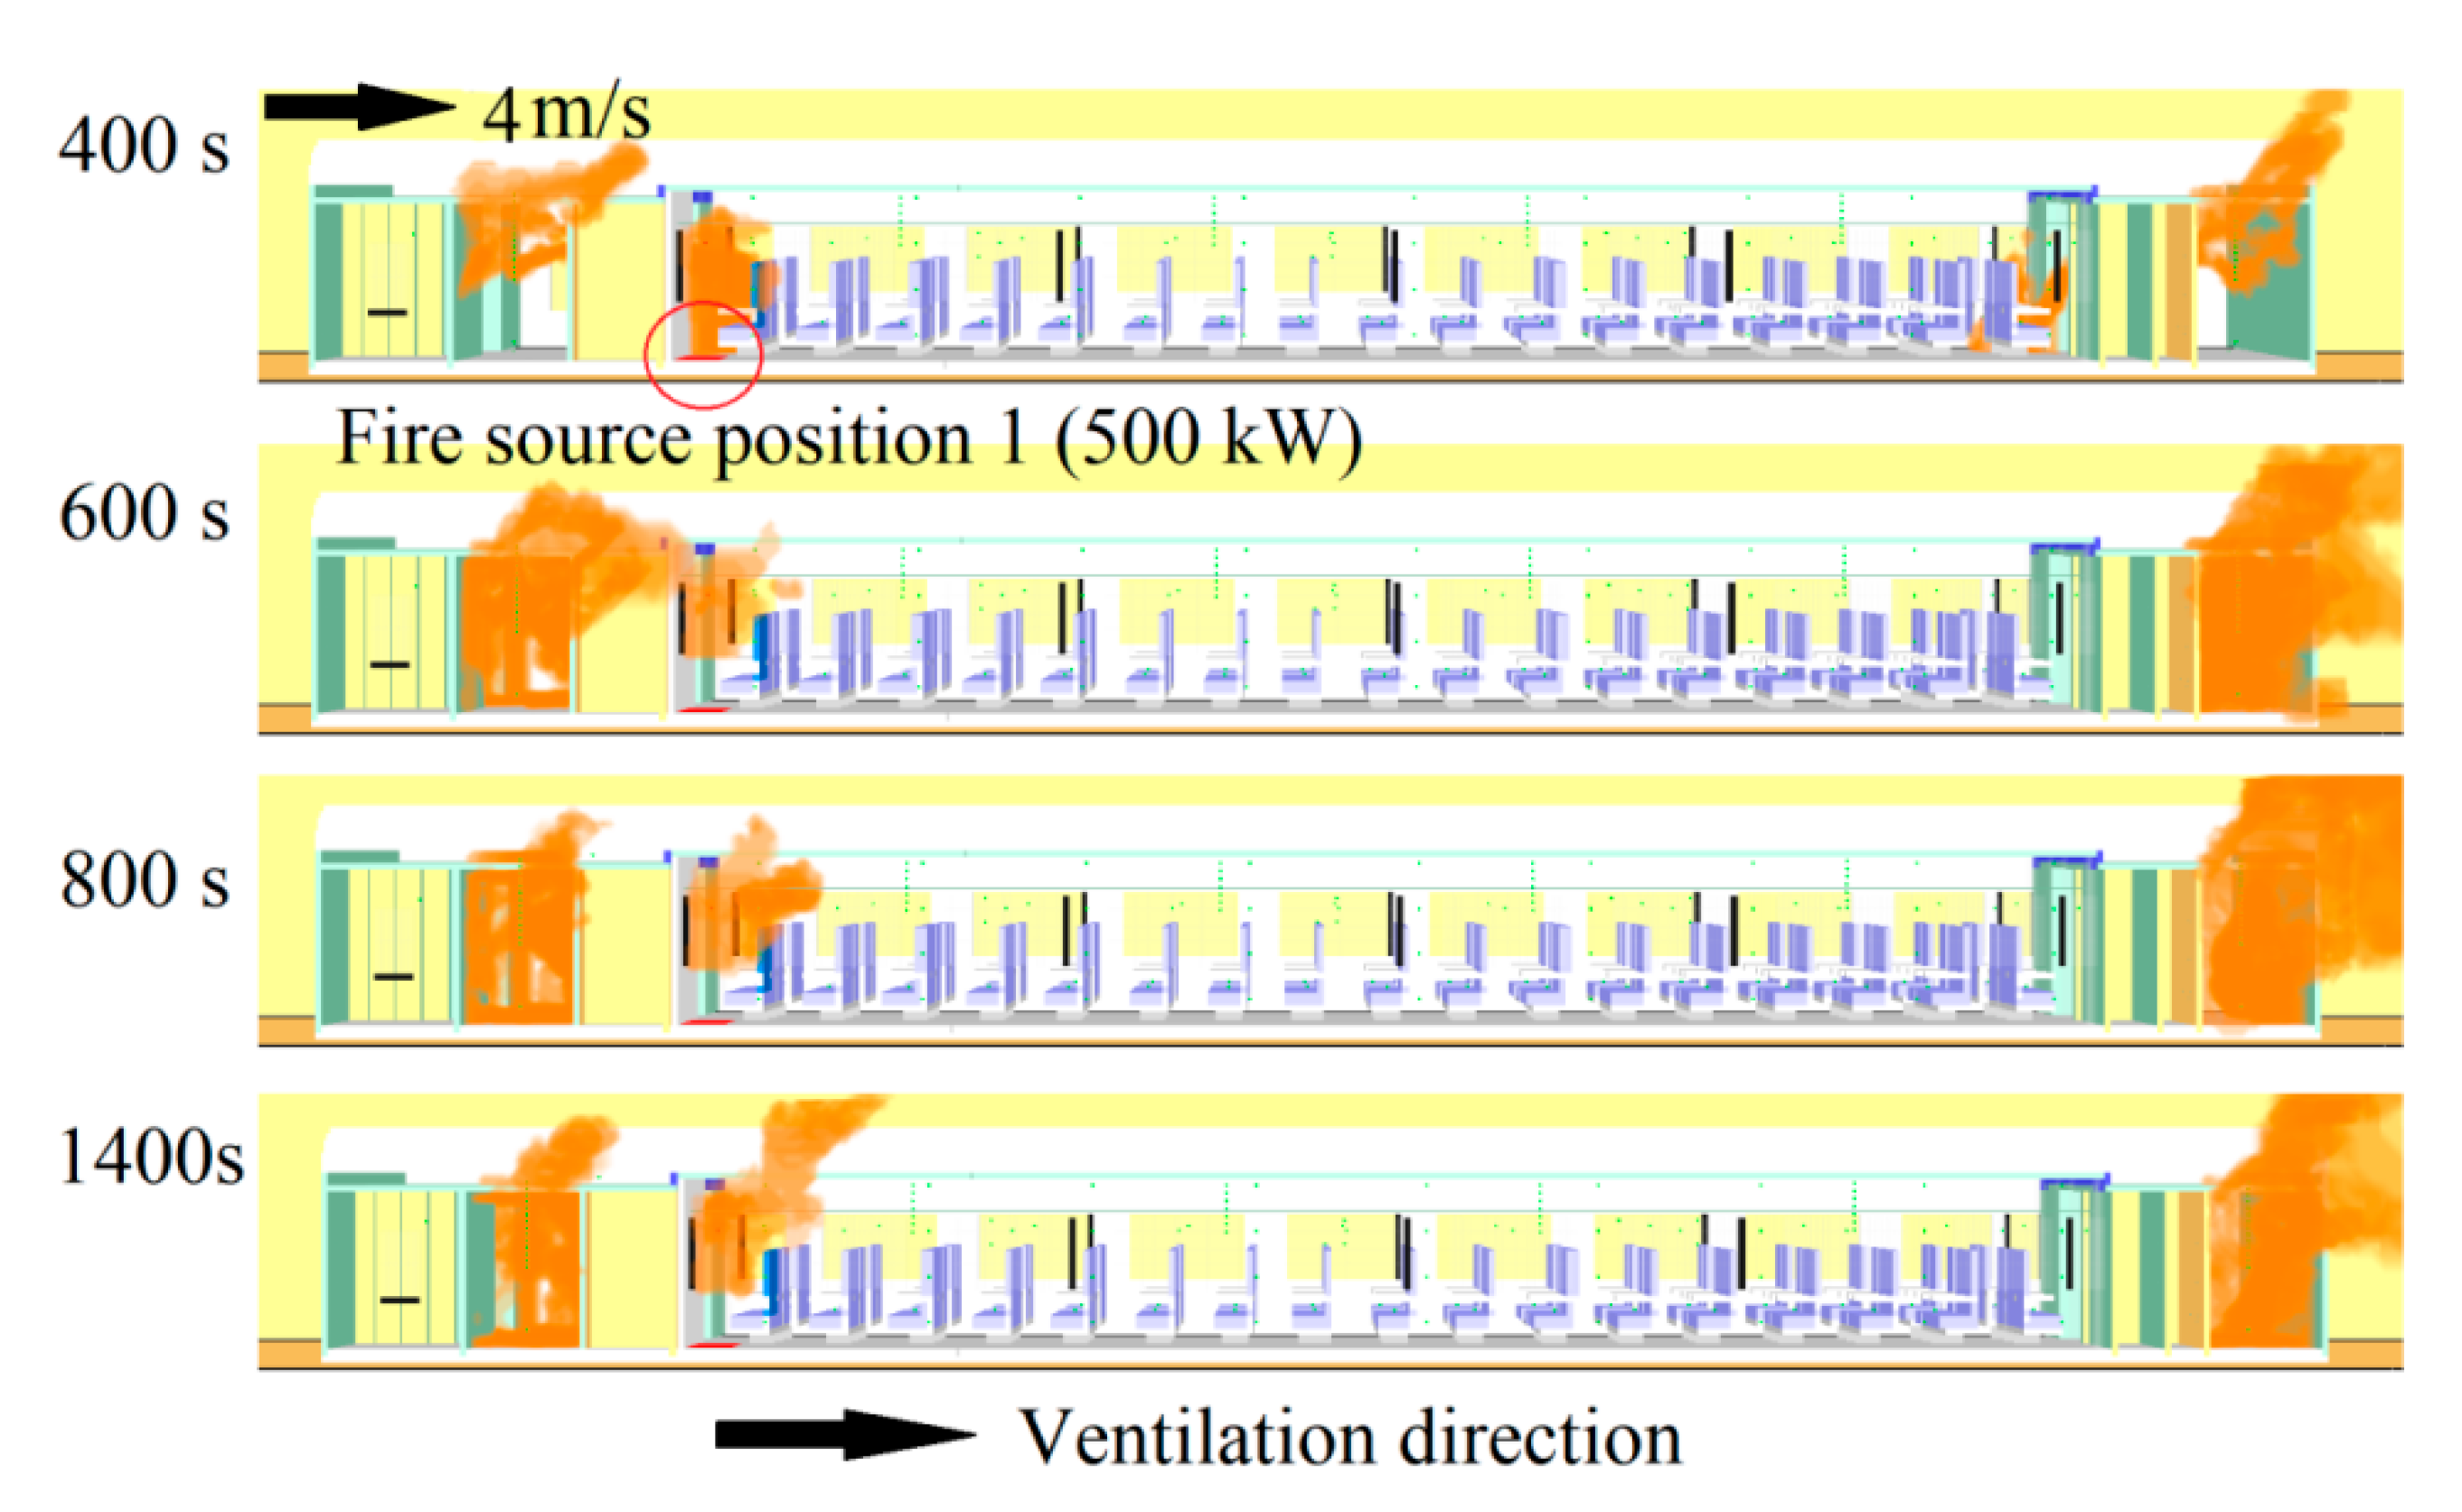
Figure 16.
Temperature of window surface when the longitudinal ventilation velocity is 4 m/s (at fire source position 1, and the fire source power is 500 kW).
Figure 16.
Temperature of window surface when the longitudinal ventilation velocity is 4 m/s (at fire source position 1, and the fire source power is 500 kW).
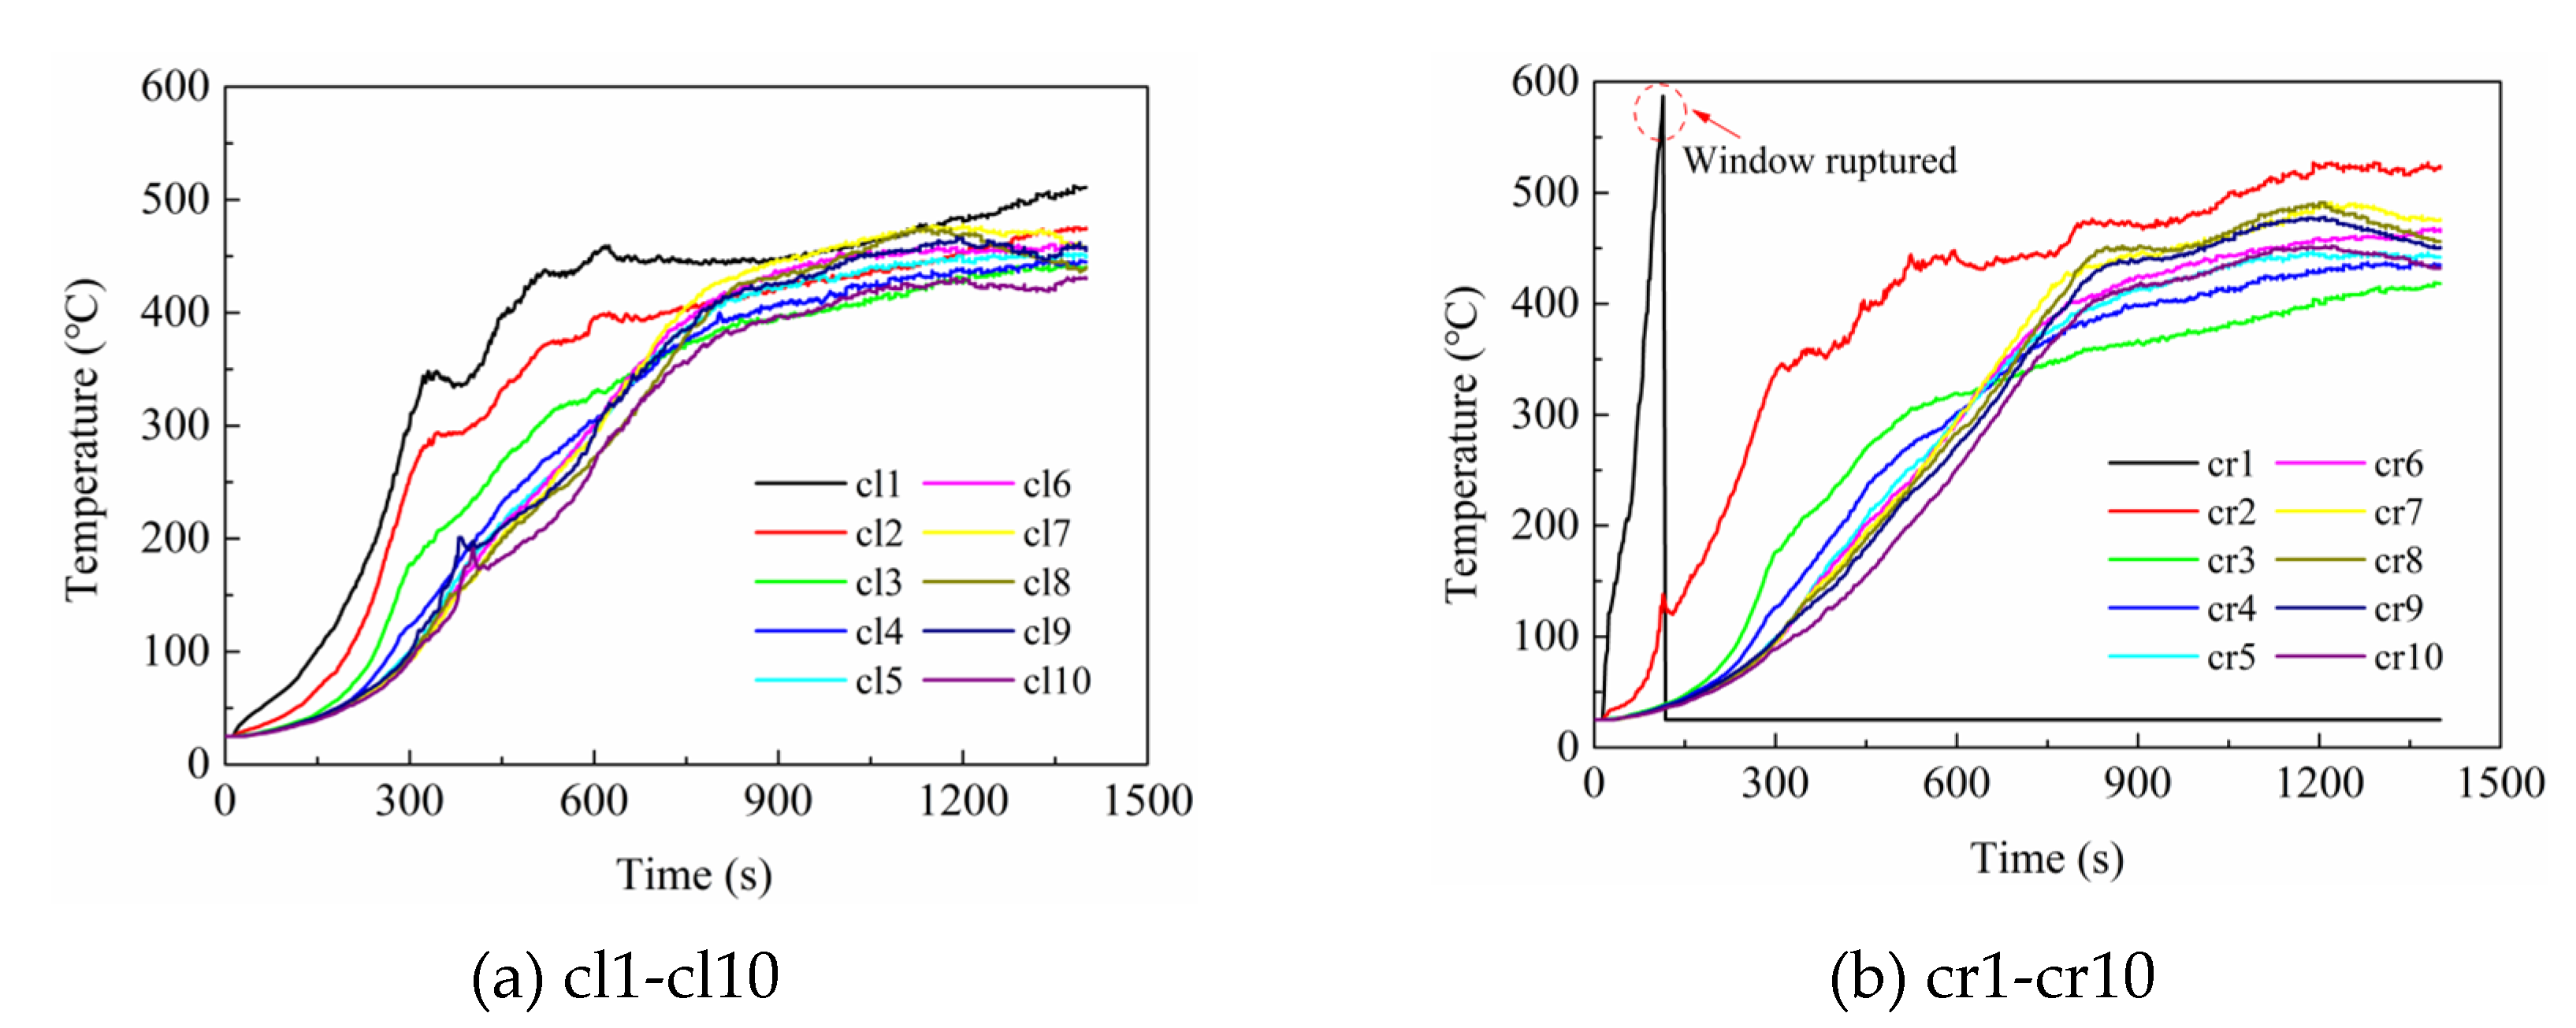
Figure 17.
Oxygen concentration at different measuring points in the high-speed train carriage when the longitudinal ventilation velocity is 4 m/s (at fire source position 1, and the fire source power is 500 kW).
Figure 17.
Oxygen concentration at different measuring points in the high-speed train carriage when the longitudinal ventilation velocity is 4 m/s (at fire source position 1, and the fire source power is 500 kW).
3.3.2. Reverse Ventilation
Figure 18 illustrates the flame propagation rate and propagation time under different longitudinal ventilation velocities when the fire source is at position 5. At velocities ranging from 1 to 3 m/s, the fire’s propagation rate shows a positive correlation with increasing ventilation velocity. When the velocity reaches 4 m/s, the flame propagation rate is 0, consistent with forward ventilation. As the velocity increases from 1 m/s to 3 m/s, the start time of flame propagation increases, while the time to full carriage coverage decreases.
Figure 19 depicts the flame propagation process under different ventilation velocities when the fire source is at position 5 (power: 1000 kW). When the fire train stops for evacuation, longitudinal airflow enters the carriage, forming an internal airflow consistent with the tunnel ventilation direction. As tunnel ventilation velocity increases, the internal airflow velocity rises, reducing the rate of high-temperature smoke propagation and delaying the ignition of the left carriage. However, when combustion occurs at both ends of the carriage, increased ventilation velocity provides additional oxygen for material combustion, increasing combustion intensity and accelerating flame propagate to the right side of the carriage.
4. Conclusions
In this study, a numerical model of a high-speed train carriage fire was established to analyze the factors influencing flame propagation speed within the carriage. The main research results are summarized as follows:
- (1)
- Under forward-ventilation conditions, the fire source power has a negligible impact on the flame propagation rate in carriages. When the fire source at the corner of the carriage end wall (position 1) and the tunnel longitudinal ventilation velocity is 2 m/s, the maximum flame propagation rate under different fire source powers is 2.21 m/min, with a maximum relative deviation of 3.2%. However, as the fire source power increases, the time required for flames to start spreading longitudinally decreases.
- (2)
- The fire source position influences both the propagation process and the rate of flame propagation within the carriage. When the fire source is at the carriage ends (positions 1 and 2), flames spread from one end to the other. When the fire source is in the middle of the carriage, flames spread from both ends toward the center at a higher rate than from end-located fire sources.
- (3)
- Under forward ventilation, when the longitudinal ventilation velocity does not exceed 3 m/s, the ventilation velocity has little effect on the flame propagation rate; while under reverse ventilation, when the ventilation velocity does not exceed 3 m/s, the flame propagation rate increases with the increase of longitudinal ventilation velocity. However, when the ventilation velocity exceeds 3 m/s, the fire cannot propagate because the window is not ruptured, and the oxygen supply in the carriage is insufficient.
This research analyzes the factors influencing flame propagation rate within carriage compartments by simulating a typical high-speed train fire scenario. The investigation focuses on how different parameters affect the rate of flame spread, including the fire source power, fire source position, and ventilation conditions. These findings lay the foundation for the fire performance design of high-speed trains and the calculation of the fire heat release rates.
Author Contributions
Jing Wang developed the research framework, conducted numerical calculations, and drafted the manuscript. Haiquan Bi conducted result interpretation and revised the manuscript accordingly. Yuanlong Zhou prepared the figures and conducted data analysis, Zhicheng Mu contributed to the development of the research manuscript revisions. Bo Lei contributed to the research framework and manuscript preparation. All authors reviewed the results and approved the final version of the manuscript.
Funding
This research was funded by the National Natural Science Foundation of China (No. 52408133).
Data Availability Statement
The data that support this study are available in the article.
Conflicts of Interest
The authors declare no conflicts of interest to report regarding the present study.
References
- Dai, Z.; Li, T.; Zhang, W.; Zhang, J. Research progress of aerodynamic multi-objective optimization on High-Speed Train nose shape. CMES 2023, 137, 1461–1489. [Google Scholar] [CrossRef]
- Li, Y.; Sun, B.; Li, T.; Zhang, W. Effect of streamline length on aerodynamic performance of 600 km/h maglev trains. CMES. 2025, 144, 1957–1970. [Google Scholar] [CrossRef]
- Xu, Z.; Bai, Q.; Shao, Y.; Hu, A.; Dong, Z. A review on passenger emergency evacuation from multimodal transportation hubs. JTTE(Engl. Ed.) 2022, 9, 591–607. [Google Scholar] [CrossRef]
- Zhou, Y.; Wang, H.; Bi, H.; Liu, X.; Gou, Q. Heat release rate of high-speed train fire in railway tunnels. Tunn. Undergr. Space Technol. 2020, 105, 103563. [Google Scholar] [CrossRef]
- Babrauskas, V.; Peacock, R.D. Heat release rate: the single most important variable in fire hazard. Fire Saf. J. 1992, 18, 255–272. [Google Scholar] [CrossRef]
- Li, Y.; Ingason, H. A new methodology of design fires for train carriages based on exponential curve method. Fire Technol. 2016, 52, 1449–1464. [Google Scholar] [CrossRef]
- Duggan, G.J. Usage of ISO 5660 Data in UK Railway Standards and Fire Safety Cases. Fire Hazards, Testing, Materials and Products; Rapra Technology Limited: Shawbury, UK, 1997. [Google Scholar]
- Zhou, Y. Study on the heat release rate of the high-speed train fire. Doctoral thesis, Southwest Jiaotong University, Chengdu, China, 2021. [Google Scholar]
- Zhou, Y.; Bi, H.; Lei, B.; Wang, H. Method for determining railway tunnel ventilation system based on fire heat release rate of train. China Patent No. ZL202110567784.6, 2021. [Google Scholar]
- Zhu, X.; Jiang, Y.; Wang, Z.; Xiong, C.; Xia, Y.; Xu, W. The numerical and experimental analysis of upward flame spread over the flat surface and the wavy surface. J. Haz. Mat. 2019, 368, 644–652. [Google Scholar] [CrossRef]
- Gu, S.; Bu, X.; Gao, Y. Experimental investigations of width effects and flame splitting phenomenon in upward flame spread over advertising canvas. Case Stu. Therm. Eng. 2019, 15, 100524. [Google Scholar] [CrossRef]
- Tsai, K.C. Width effect on upward flame spread. Fire Saf. J. 2009, 44, 962–967. [Google Scholar] [CrossRef]
- Ma, Y.; Hu, L.; Huang, Y.; Zhu, N.; Osamu, F. Effect of sample thickness on concurrent steady spread behavior of floor- and ceiling flames. Combust. Flame 2021, 233, 111600. [Google Scholar] [CrossRef]
- Zhou, B.; Wang, K.; Xu, M.; Yang, W.; Zhu, F.; Sun, B.; et al. Influence of air-gap and thickness on the upward flame spread over discrete wood chips. Therm. Sci. Eng. Prog. 2021, 26, 101106. [Google Scholar] [CrossRef]
- Chu, T.; Zhu, G.; Gao, Y.; Wang, P.; Chai, G.; Wang, Z. Combined effects of width and moisture content on upward flame spread over cotton fabrics. Case Stu. Therm. Eng. 2019, 15, 100514. [Google Scholar] [CrossRef]
- Chu, T.; Zhu, G.; Chai, G.; Gao, Y. Study on upward flame spread of cotton fabrics with different moisture regain. Case Stu. Therm. Eng. 2020, 21, 100683. [Google Scholar] [CrossRef]
- Avinash, G.; Kumar, A.; Raghavan, V. Experimental analysis of diffusion flame spread along thin parallel solid fuel surfaces in a natural convective environment. Combust. Flame 2016, 165, 321–333. [Google Scholar] [CrossRef]
- Maria, T.; Carlos, F.P.; David, L.U.; Gary, A.R. On simulating the effect of gravity on concurrent flame spread over thin paper through variations in ambient pressure. Combust. Flame 2021, 232, 111538. [Google Scholar] [CrossRef]
- Lauren, G.; Carlos, F.P.; James, L.U.; Van, P.C.; Yusuke, K.; Osamu, F. Effect of reduced ambient pressures and opposed airflows on the flame spread and dripping of LDPE insulated copper wires. Fire Saf. J. 2021, 120, 103171. [Google Scholar] [CrossRef]
- Huang, X.; Chen, G.; Zhou, Z.; Hu, J.; Wang, C.; Chen, D. Experimental and numerical study of upward flame spread and heat transfer over expanded polystyrene at different altitudes. Case Stu. Therm. Eng. 2021, 28, 101623. [Google Scholar] [CrossRef]
- Yan, W.; Shen, Y.; An, W.; Jiang, L.; Zhou, Y.; Sun, J. Experimental study on the width and pressure effect on the horizontal flame spread of insulation material. Int. J. Therm. Sci. 2017, 114, 114–122. [Google Scholar] [CrossRef]
- Zhou, Y.; Bu, R.; Yi, L.; Sun, J. Heat transfer mechanism of concurrent flame spread over rigid polyurethane foam: Effect of ambient pressure and inclined angle. Int. J. Therm. Sci. 2020, 155, 106403. [Google Scholar] [CrossRef]
- Michael, J.G.; Colin, H.M.; Tang, W.; Ajay, V.S. The effect of flow and geometry on concurrent flame spread. Fire Saf. J. 2017, 91, 68–78. [Google Scholar] [CrossRef]
- Li, Y.; Ingason, H.; Lönnermark, A. Correlations between different scales of metro carriage fire tests. SP Report, SP Technical Research Institute of Sweden, Borås. 2013.
- Li, Y.; Ingason, H.; Lönnermark, A. Fire development in different scales of train carriages. Fire Saf. Sci. 2014, 11, 302–315. [Google Scholar] [CrossRef]
- Lönnermark, A.; Ingason, H.; Li, Y.; Kumm, M. Fire development in a 1/3 train carriage mock-up. Fire Saf. J. 2017, 91, 432–440. [Google Scholar] [CrossRef]
- Deng, T.; Norris, S.; Sharma, R.N. Numerical investigation on the stability of tunnel smoke stratification under the effect of water spray and longitudinal ventilation. Tunn. Undergr. Space Technol. 2021, 112, 103901. [Google Scholar] [CrossRef]
- Hwang, C.C.; Edwards, J.C. The critical ventilation velocity in tunnel fires-a computer simulation. Fire Saf. J. 2005, 40, 213–244. [Google Scholar] [CrossRef]
- Bi, H.; Zhou, Y.; Wang, H.; Gou, Q. Characteristics of fire in high-speed train carriages. J. Fire Sci. 2020, 38, 75–95. [Google Scholar] [CrossRef]
- White, N. Fire growth on passenger rail interiors. International Conference Fire Safety-Sea Road Rail, 2005. [Google Scholar]
Figure 1.
Schematics of the high-speed train structure.
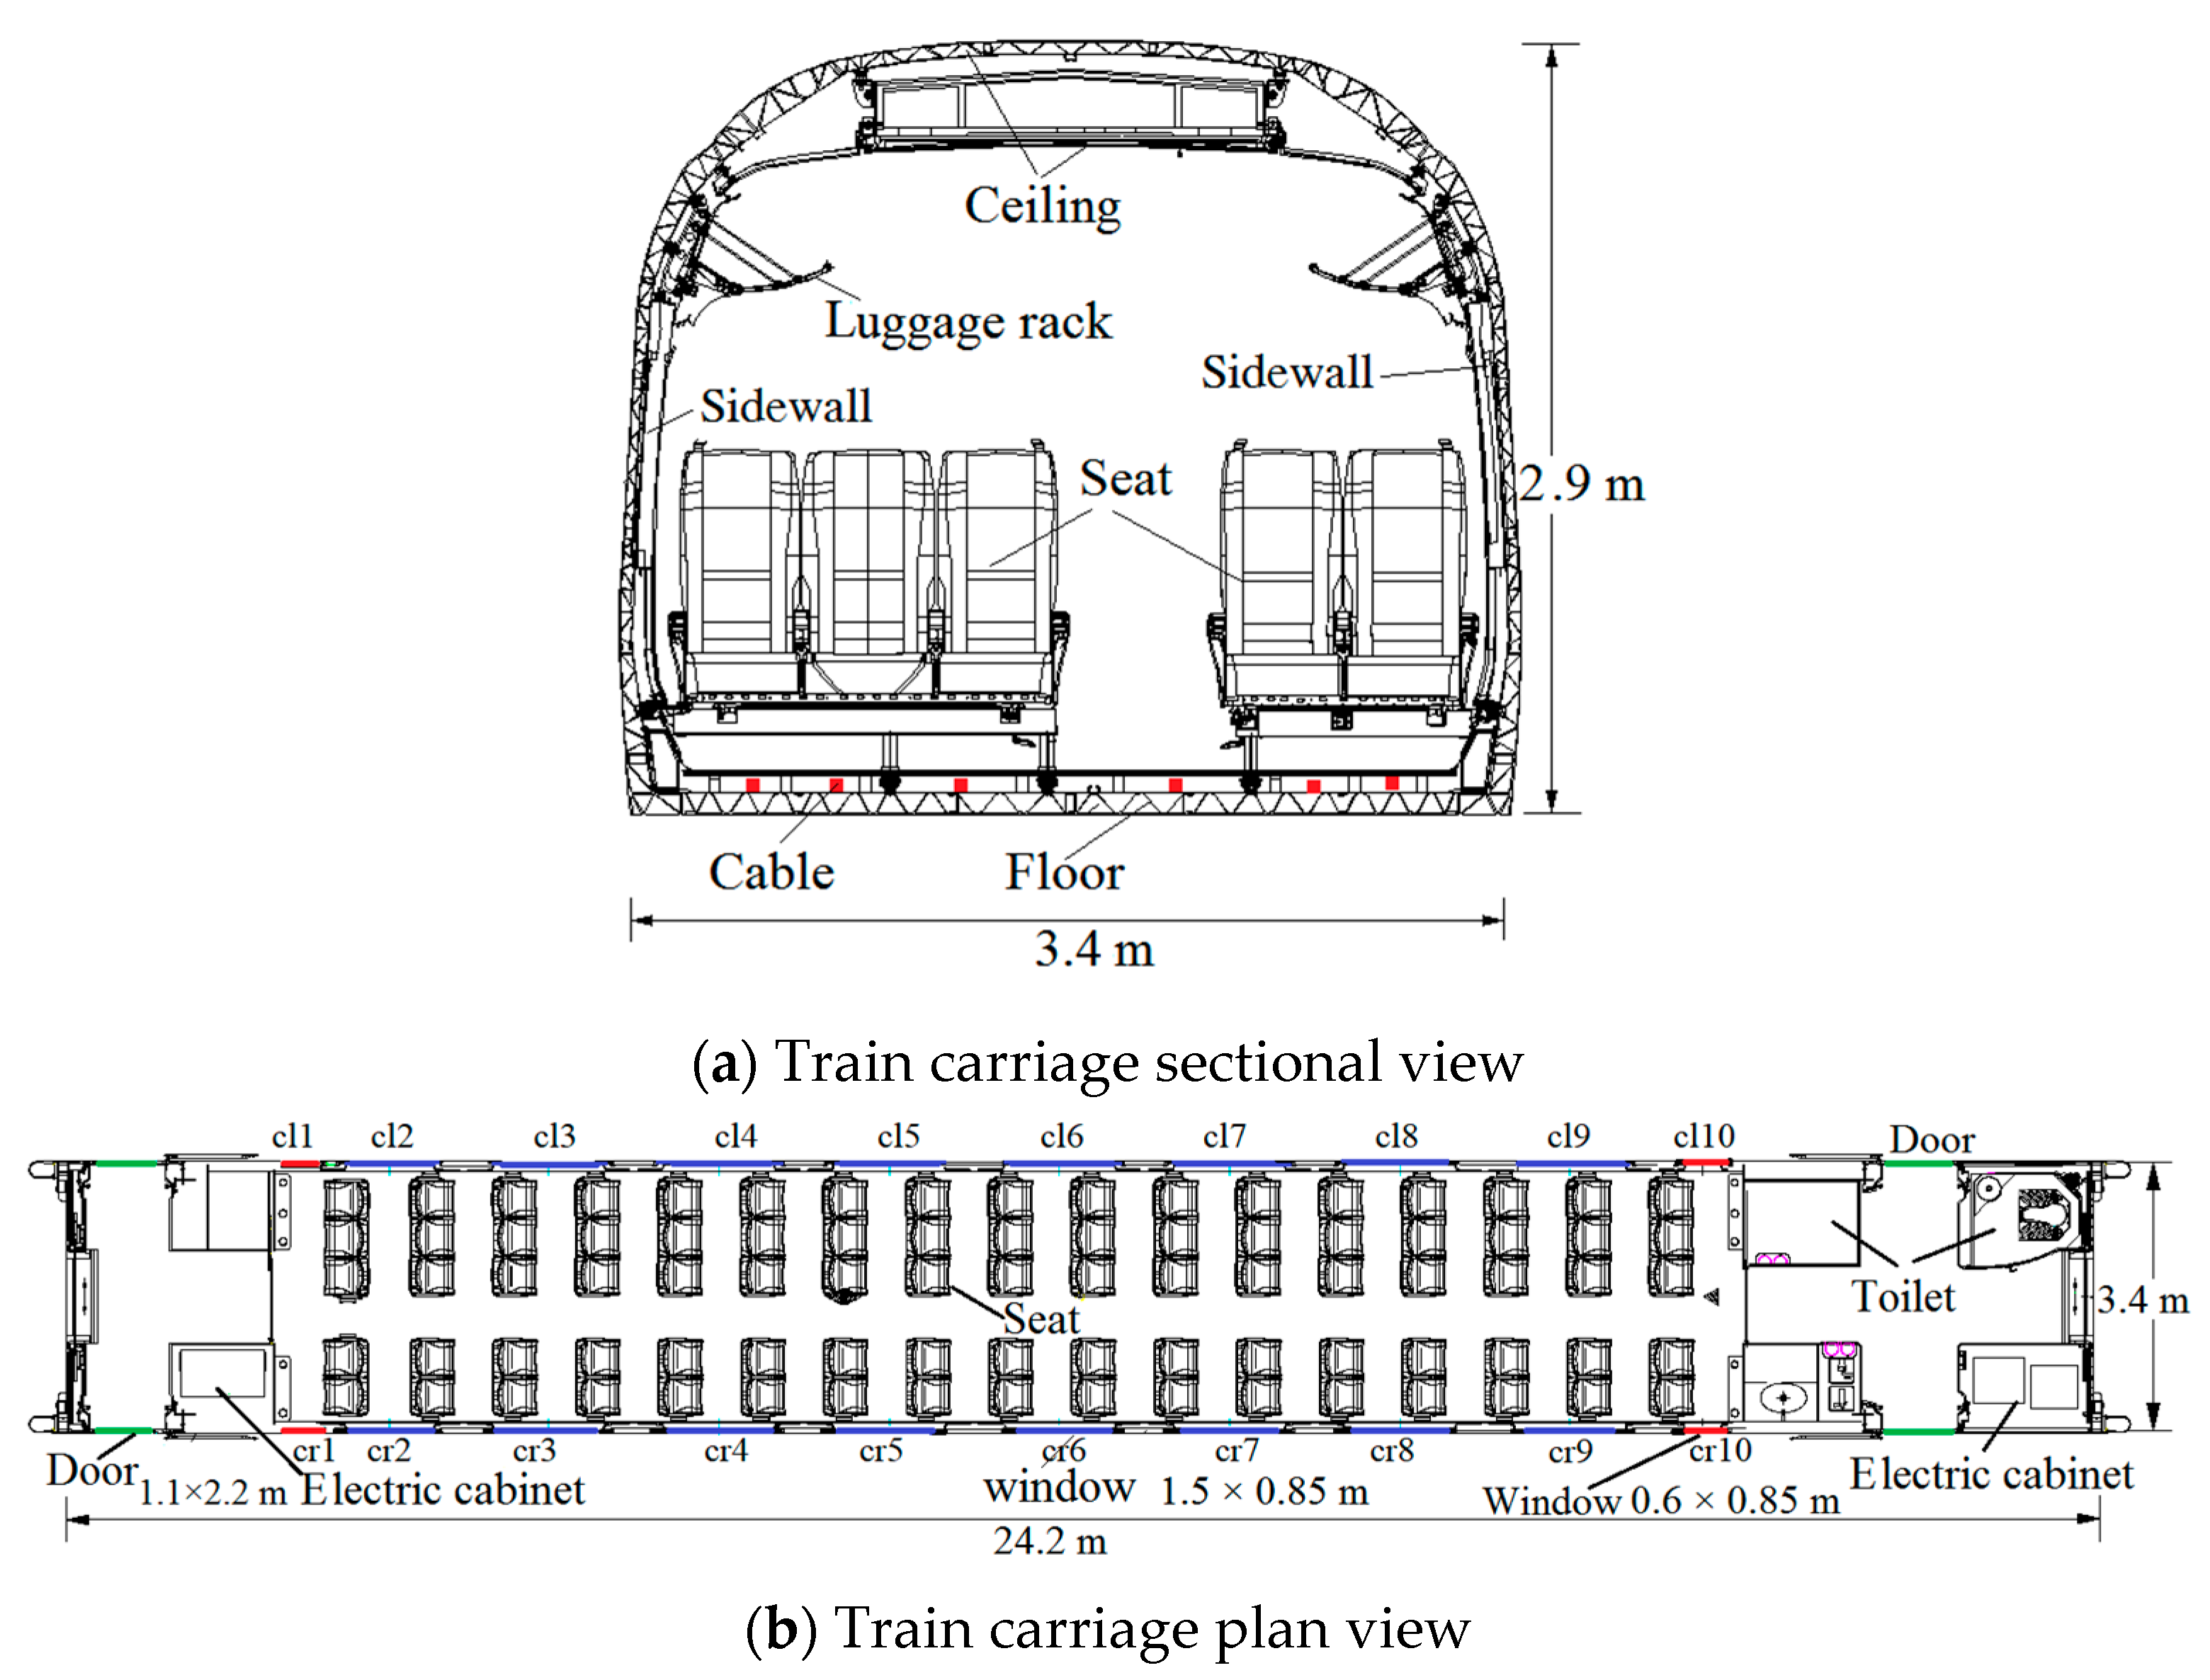
Figure 2.
Numerical model of the high-speed train carriage fire.
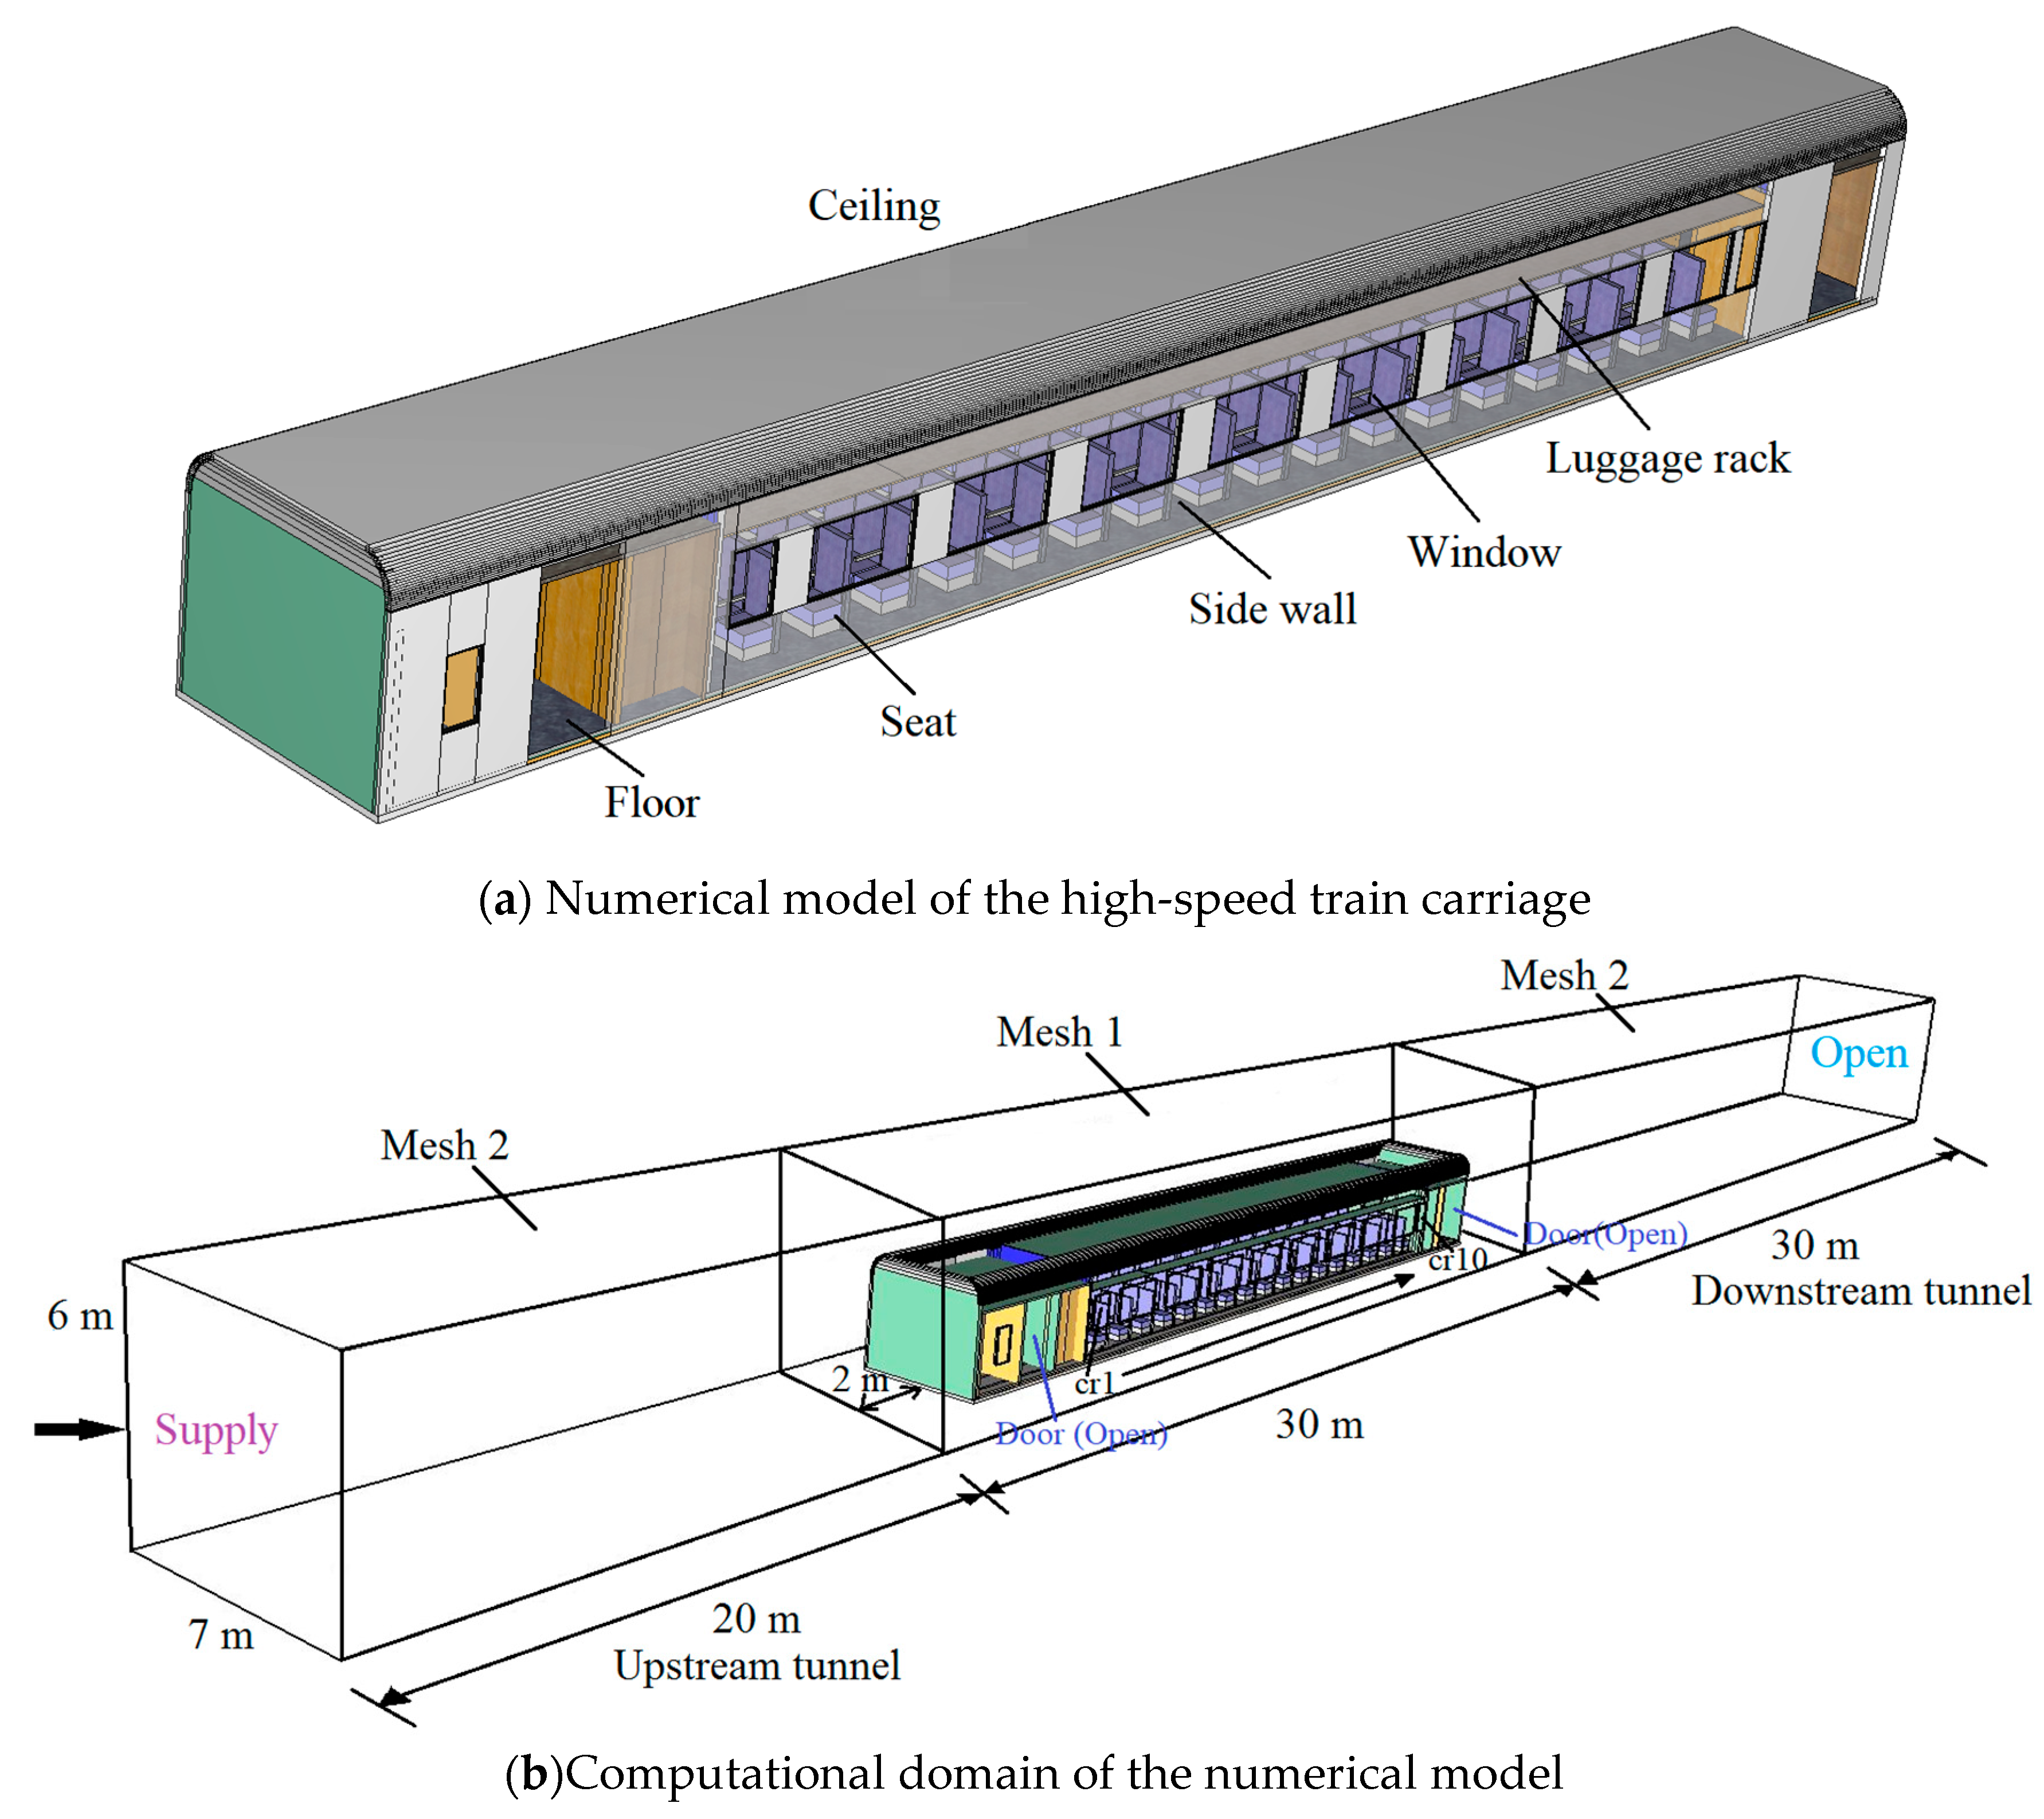
Figure 3.
Schematic diagram of fire source position.
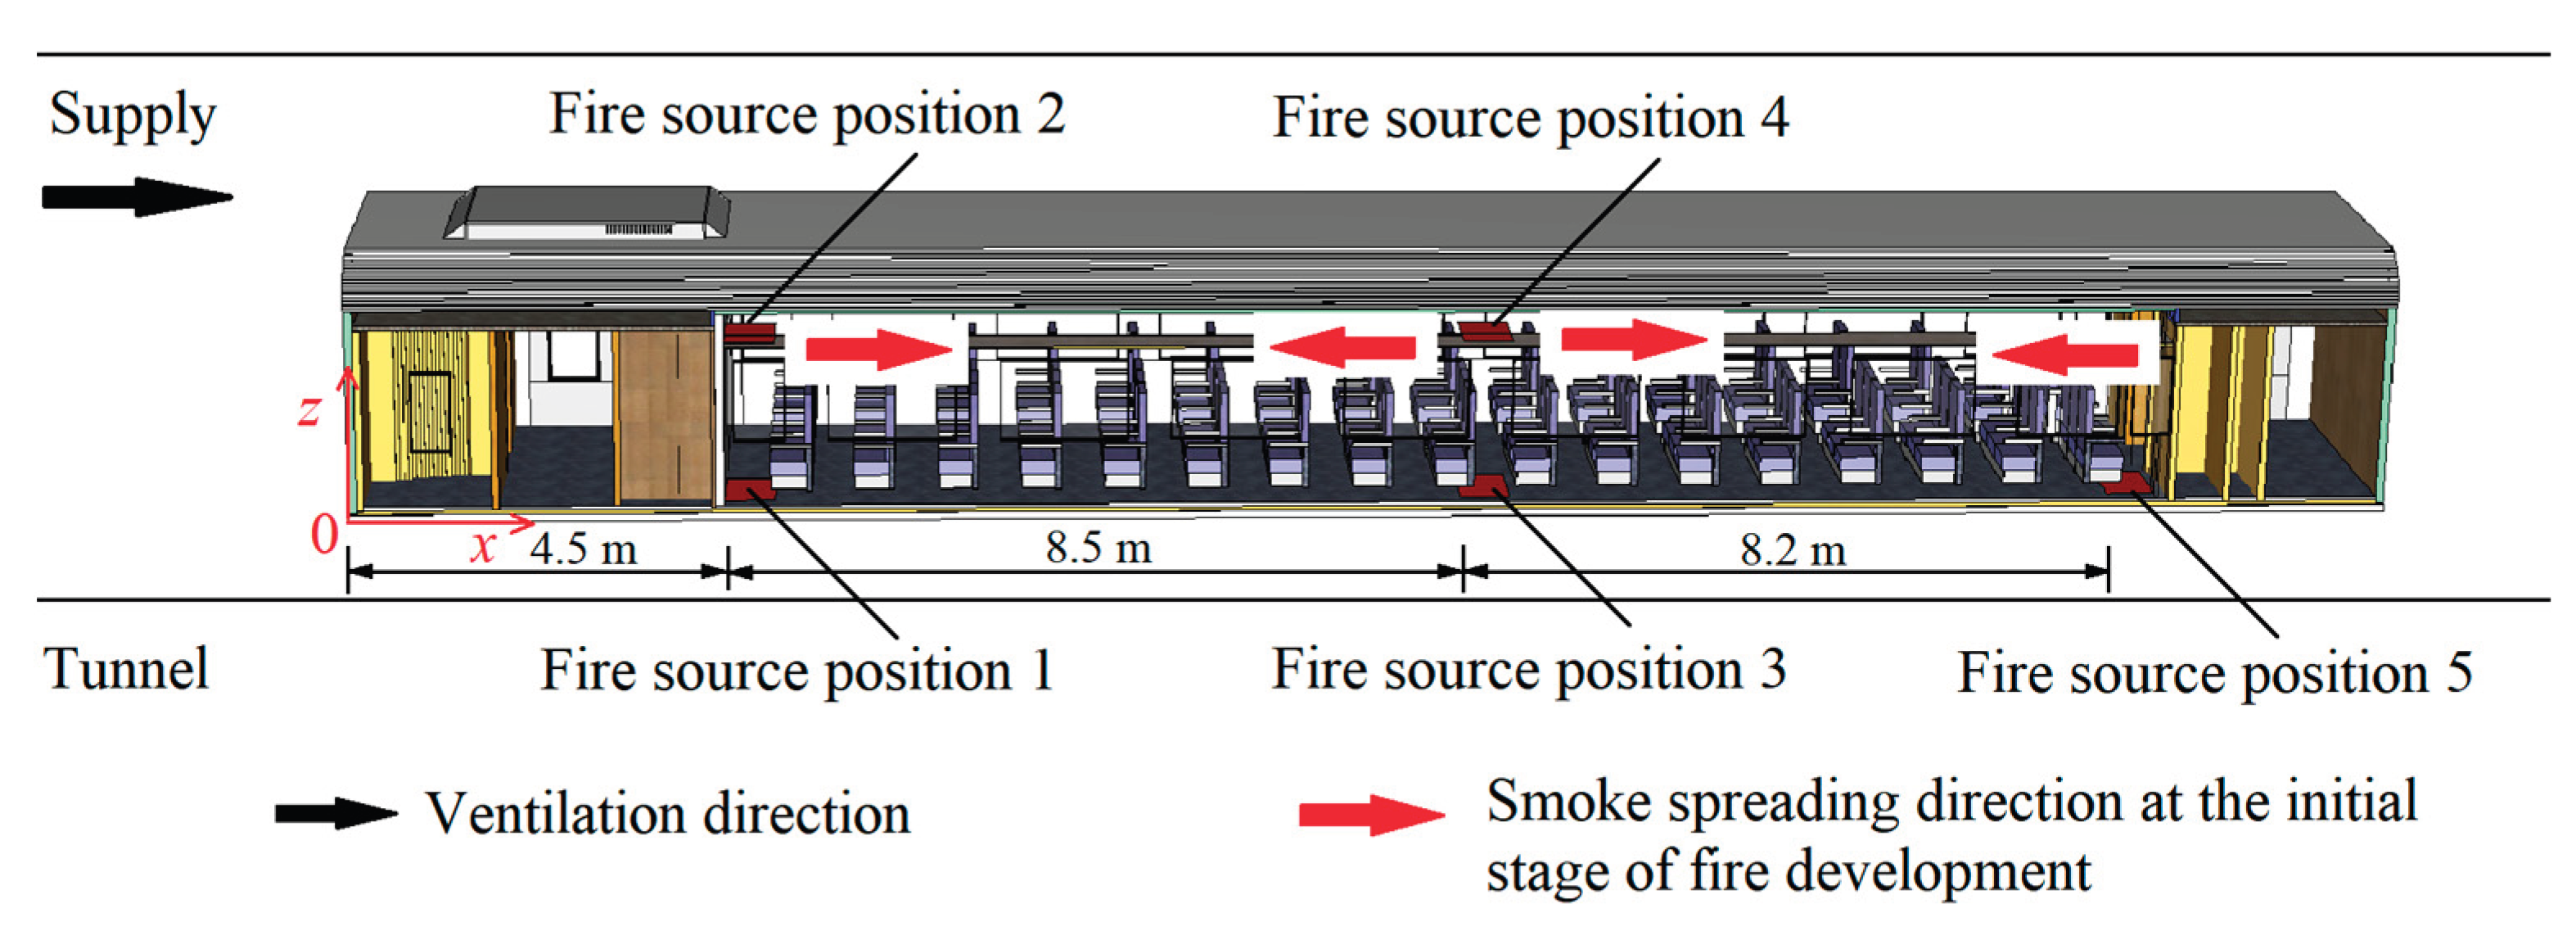
Figure 4.
Flame spread process in the high-speed train carriage at fire source position 1.
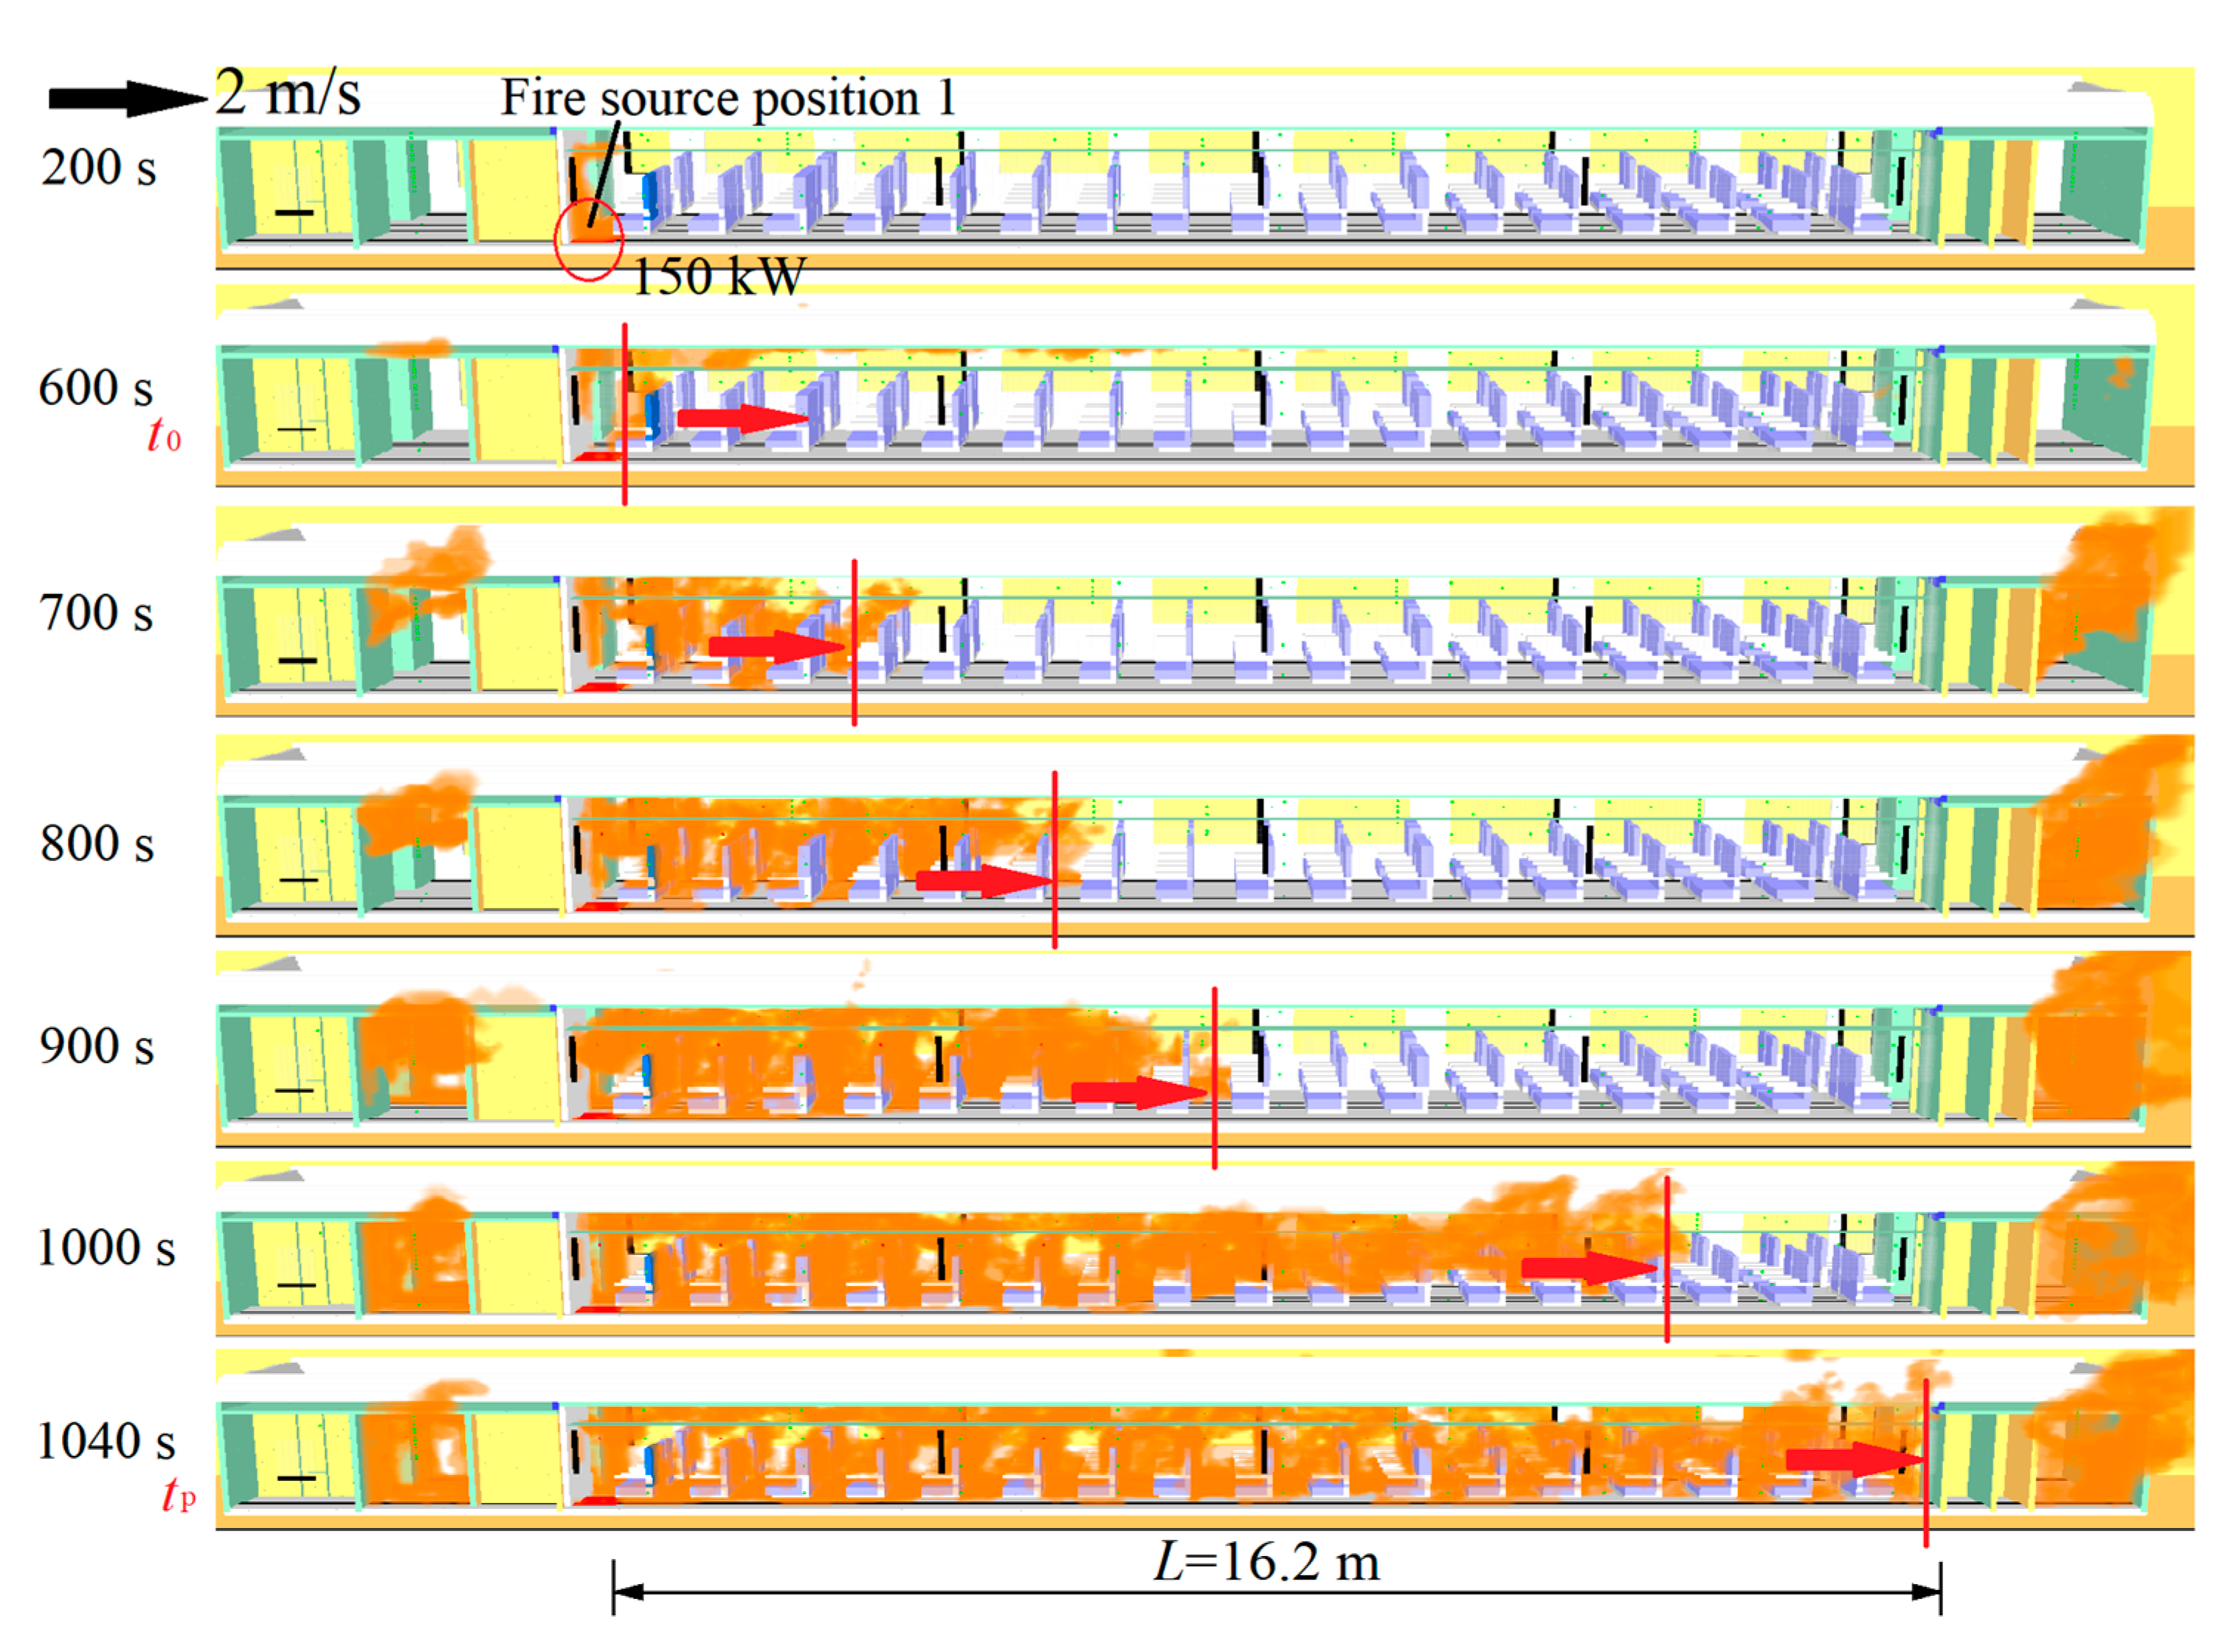
Figure 5.
Flame propagation rate in the carriage at fire source position 1 (the longitudinal velocity is 2 m/s, the fire source power is 150 kW).
Figure 5.
Flame propagation rate in the carriage at fire source position 1 (the longitudinal velocity is 2 m/s, the fire source power is 150 kW).
Figure 6.
Flame propagation rate with different mesh sizes.
Figure 7.
FDS model and heat release rate comparison results.
Figure 8.
Flame propagation rate and propagation time under different fire source powers at fire source position 1 (the longitudinal ventilation velocity in the tunnel is 2 m/s).
Figure 8.
Flame propagation rate and propagation time under different fire source powers at fire source position 1 (the longitudinal ventilation velocity in the tunnel is 2 m/s).
Figure 9.
Window rupture time of the high-speed train at fire source position 1 (the longitudinal ventilation velocity in the tunnel is 2 m/s).
Figure 9.
Window rupture time of the high-speed train at fire source position 1 (the longitudinal ventilation velocity in the tunnel is 2 m/s).
Figure 10.
Flame propagation rate under different fire source positions (the longitudinal velocity is 2 m/s, and the fire source power is 150 kW).
Figure 10.
Flame propagation rate under different fire source positions (the longitudinal velocity is 2 m/s, and the fire source power is 150 kW).
Figure 11.
Flame propagation process in the high-speed train carriage at fire source position 2.
Figure 12.
Flame propagation process in the high-speed train carriage at fire source position 3.
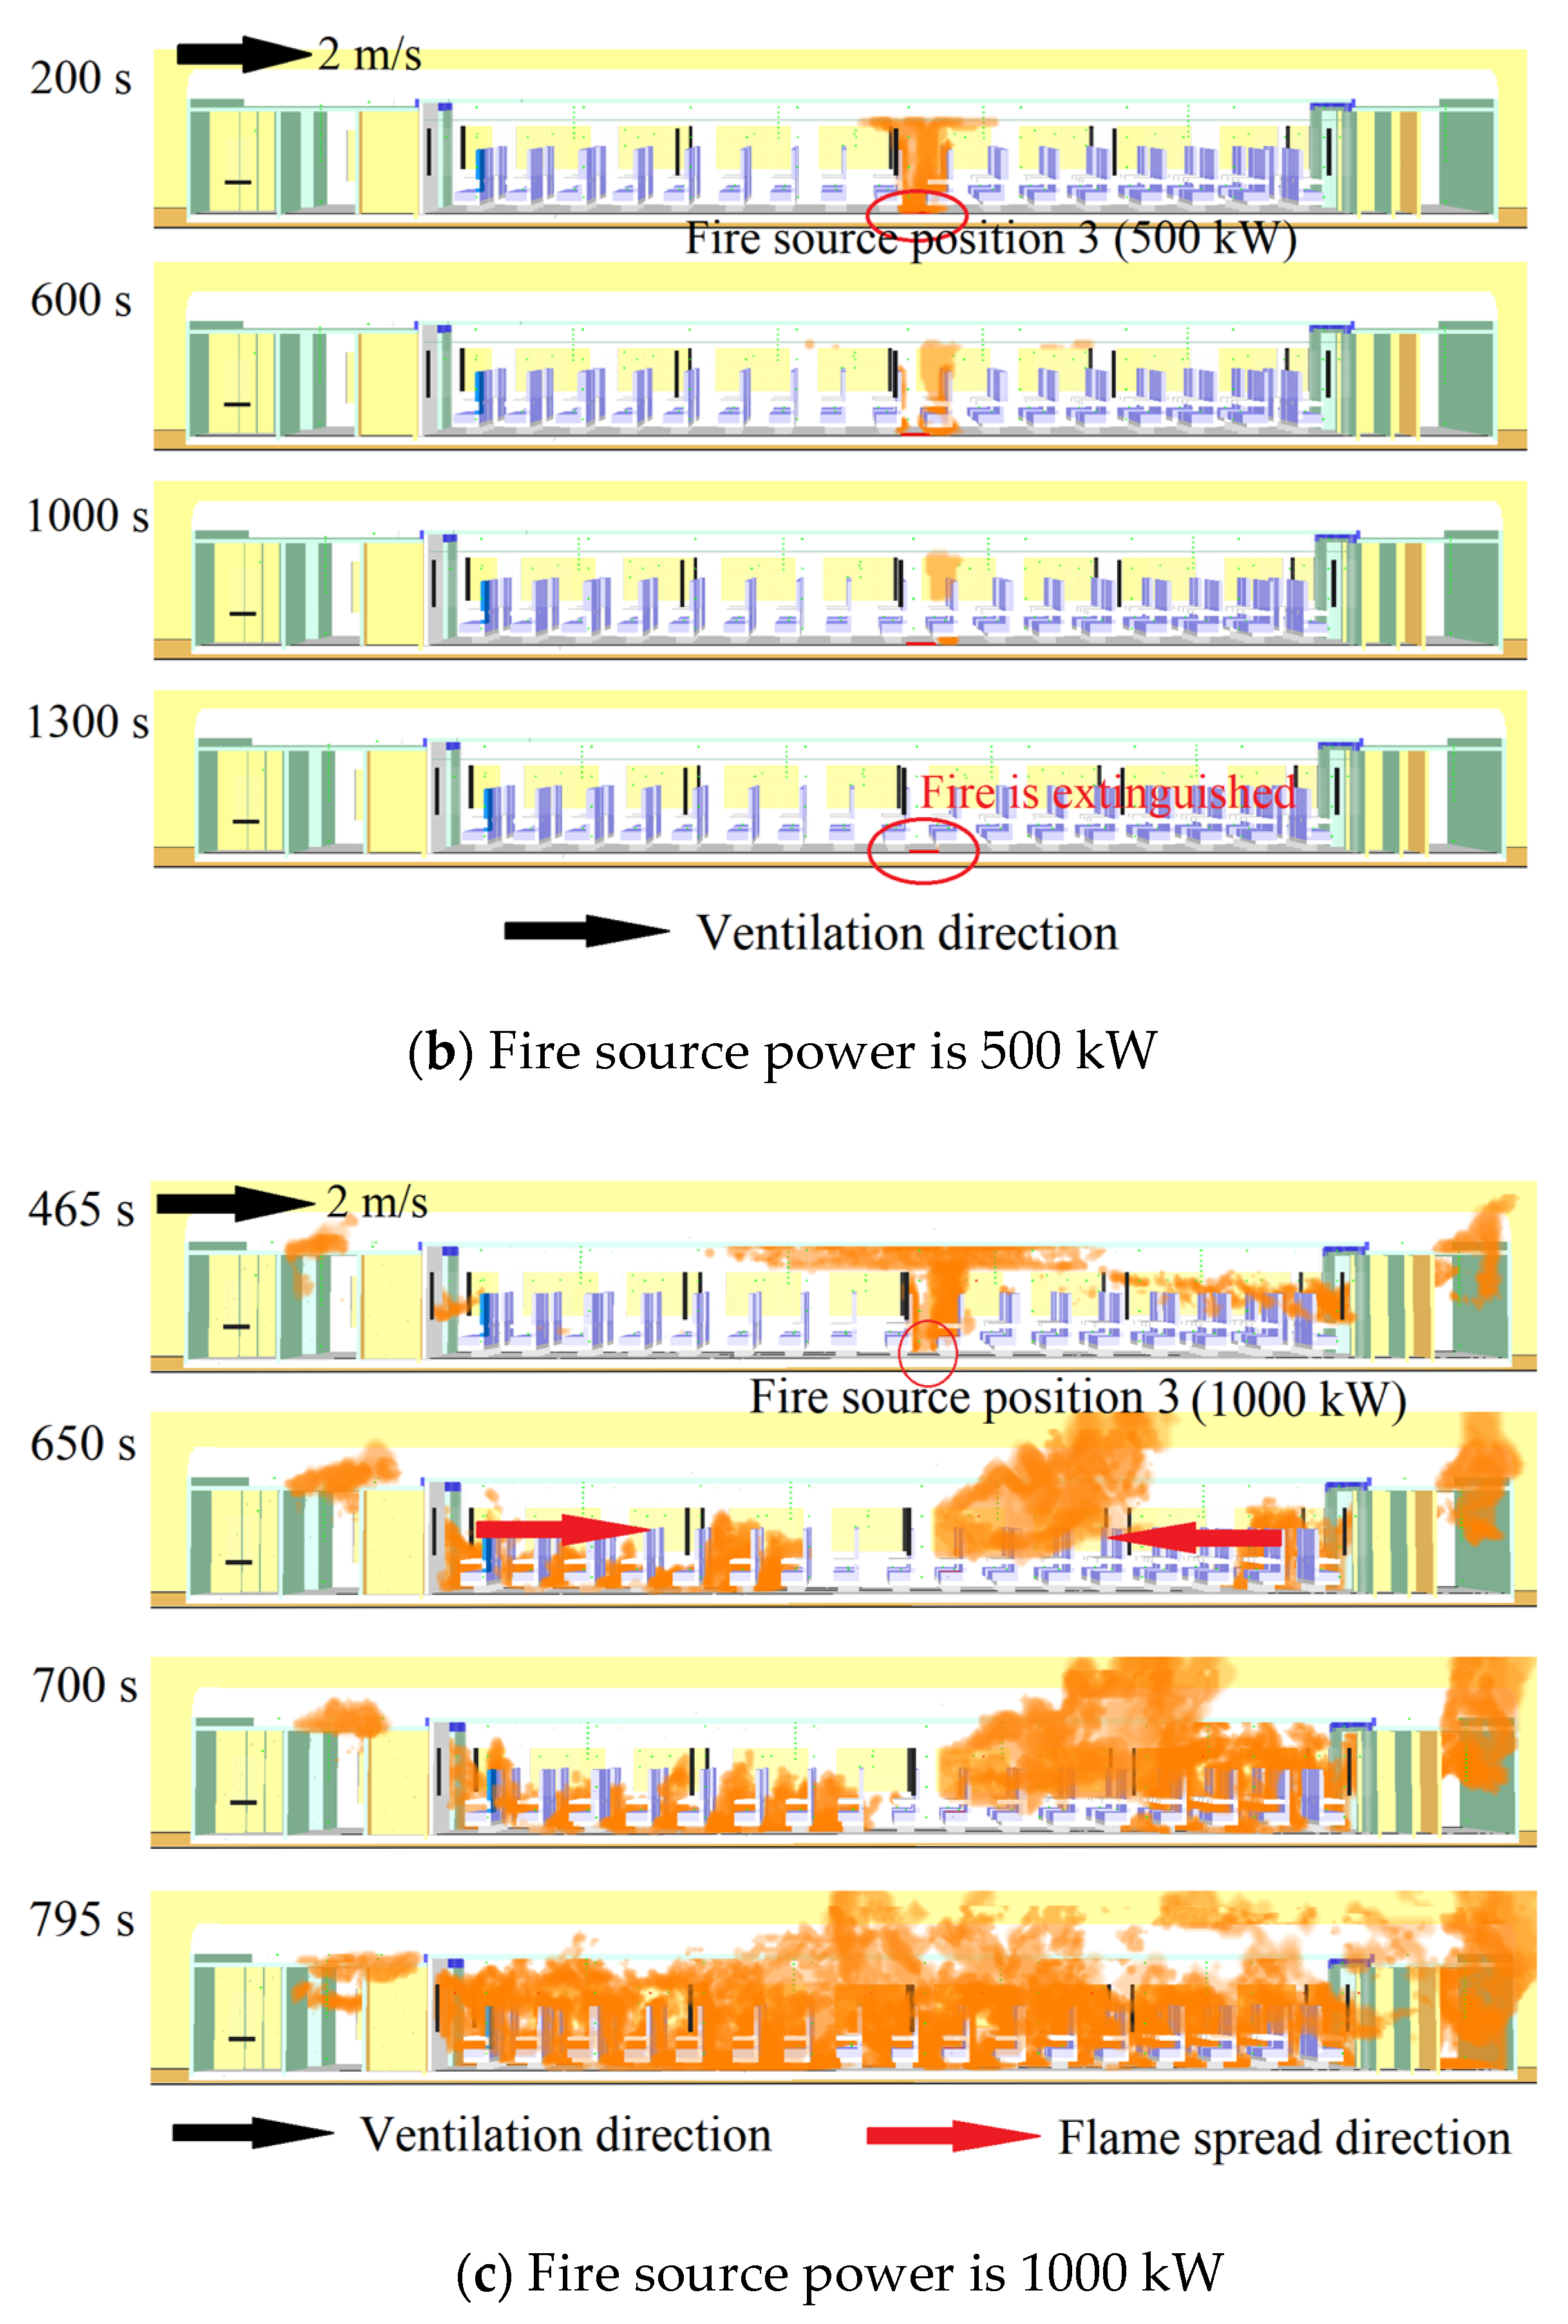
Figure 13.
Flame propagation process in the high-speed train carriage at fire source position 4.
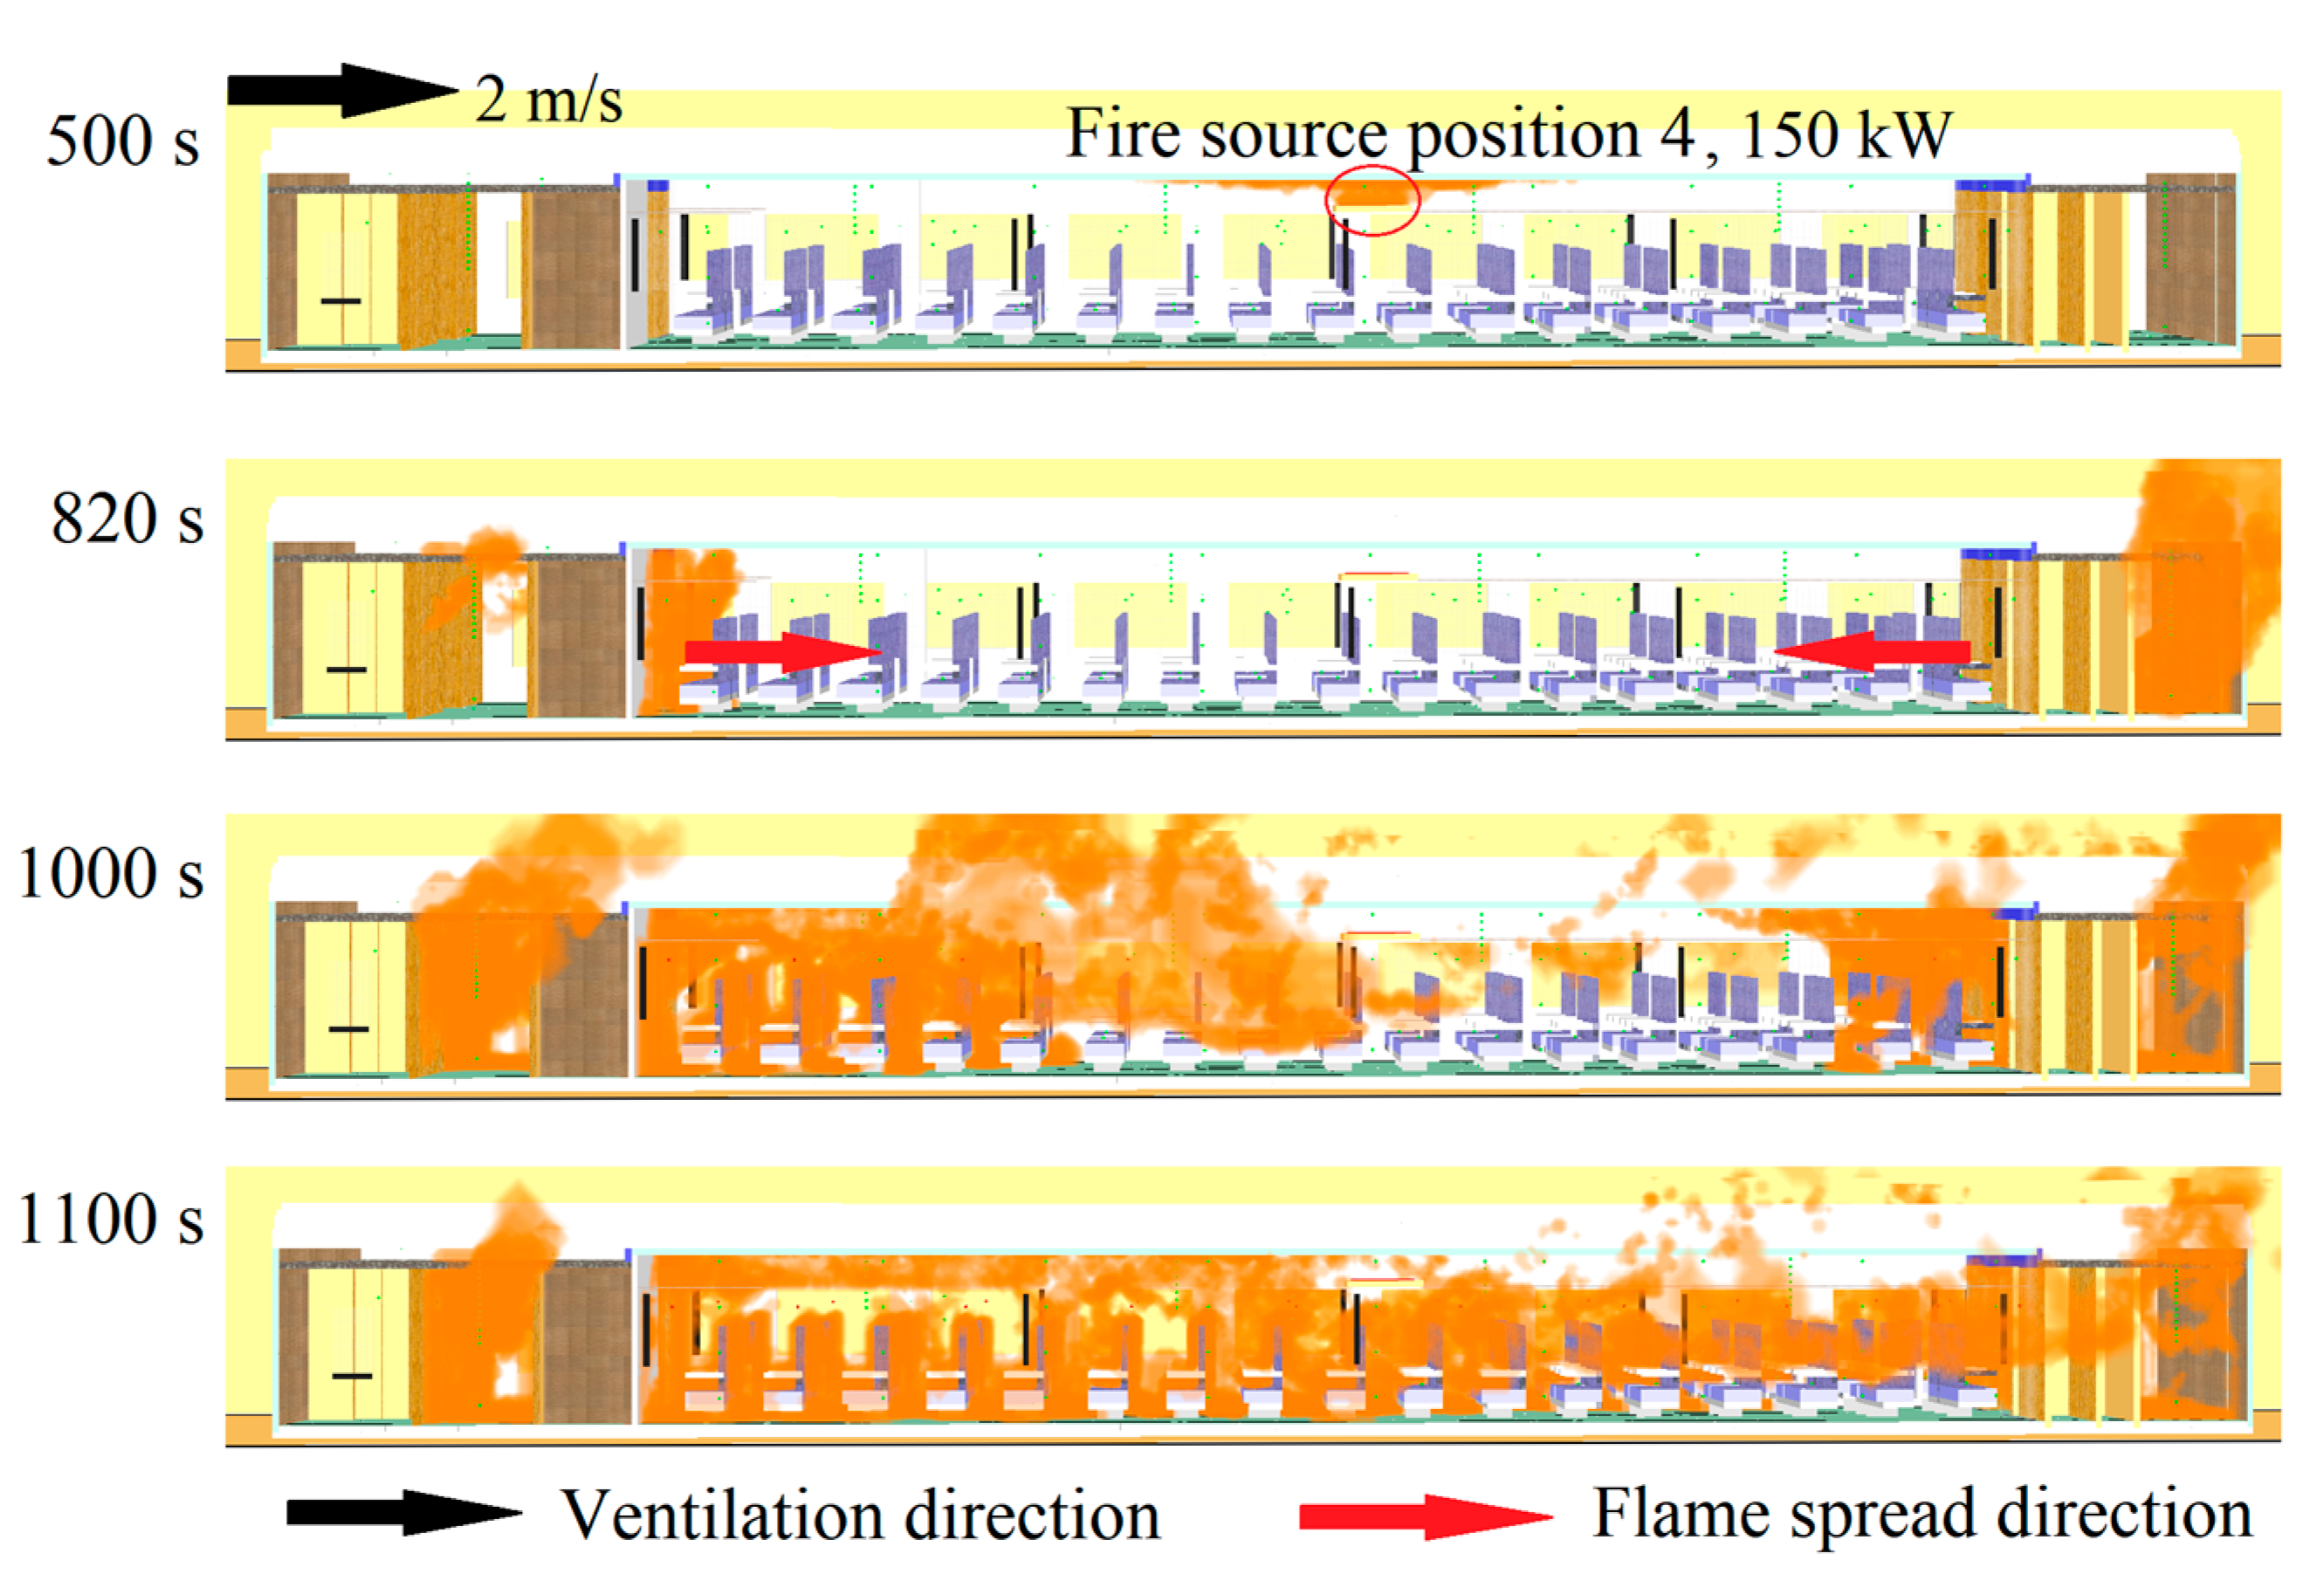
Figure 14.
propagation rate and time of the flame under different ventilation velocities at fire source position 1.
Figure 14.
propagation rate and time of the flame under different ventilation velocities at fire source position 1.
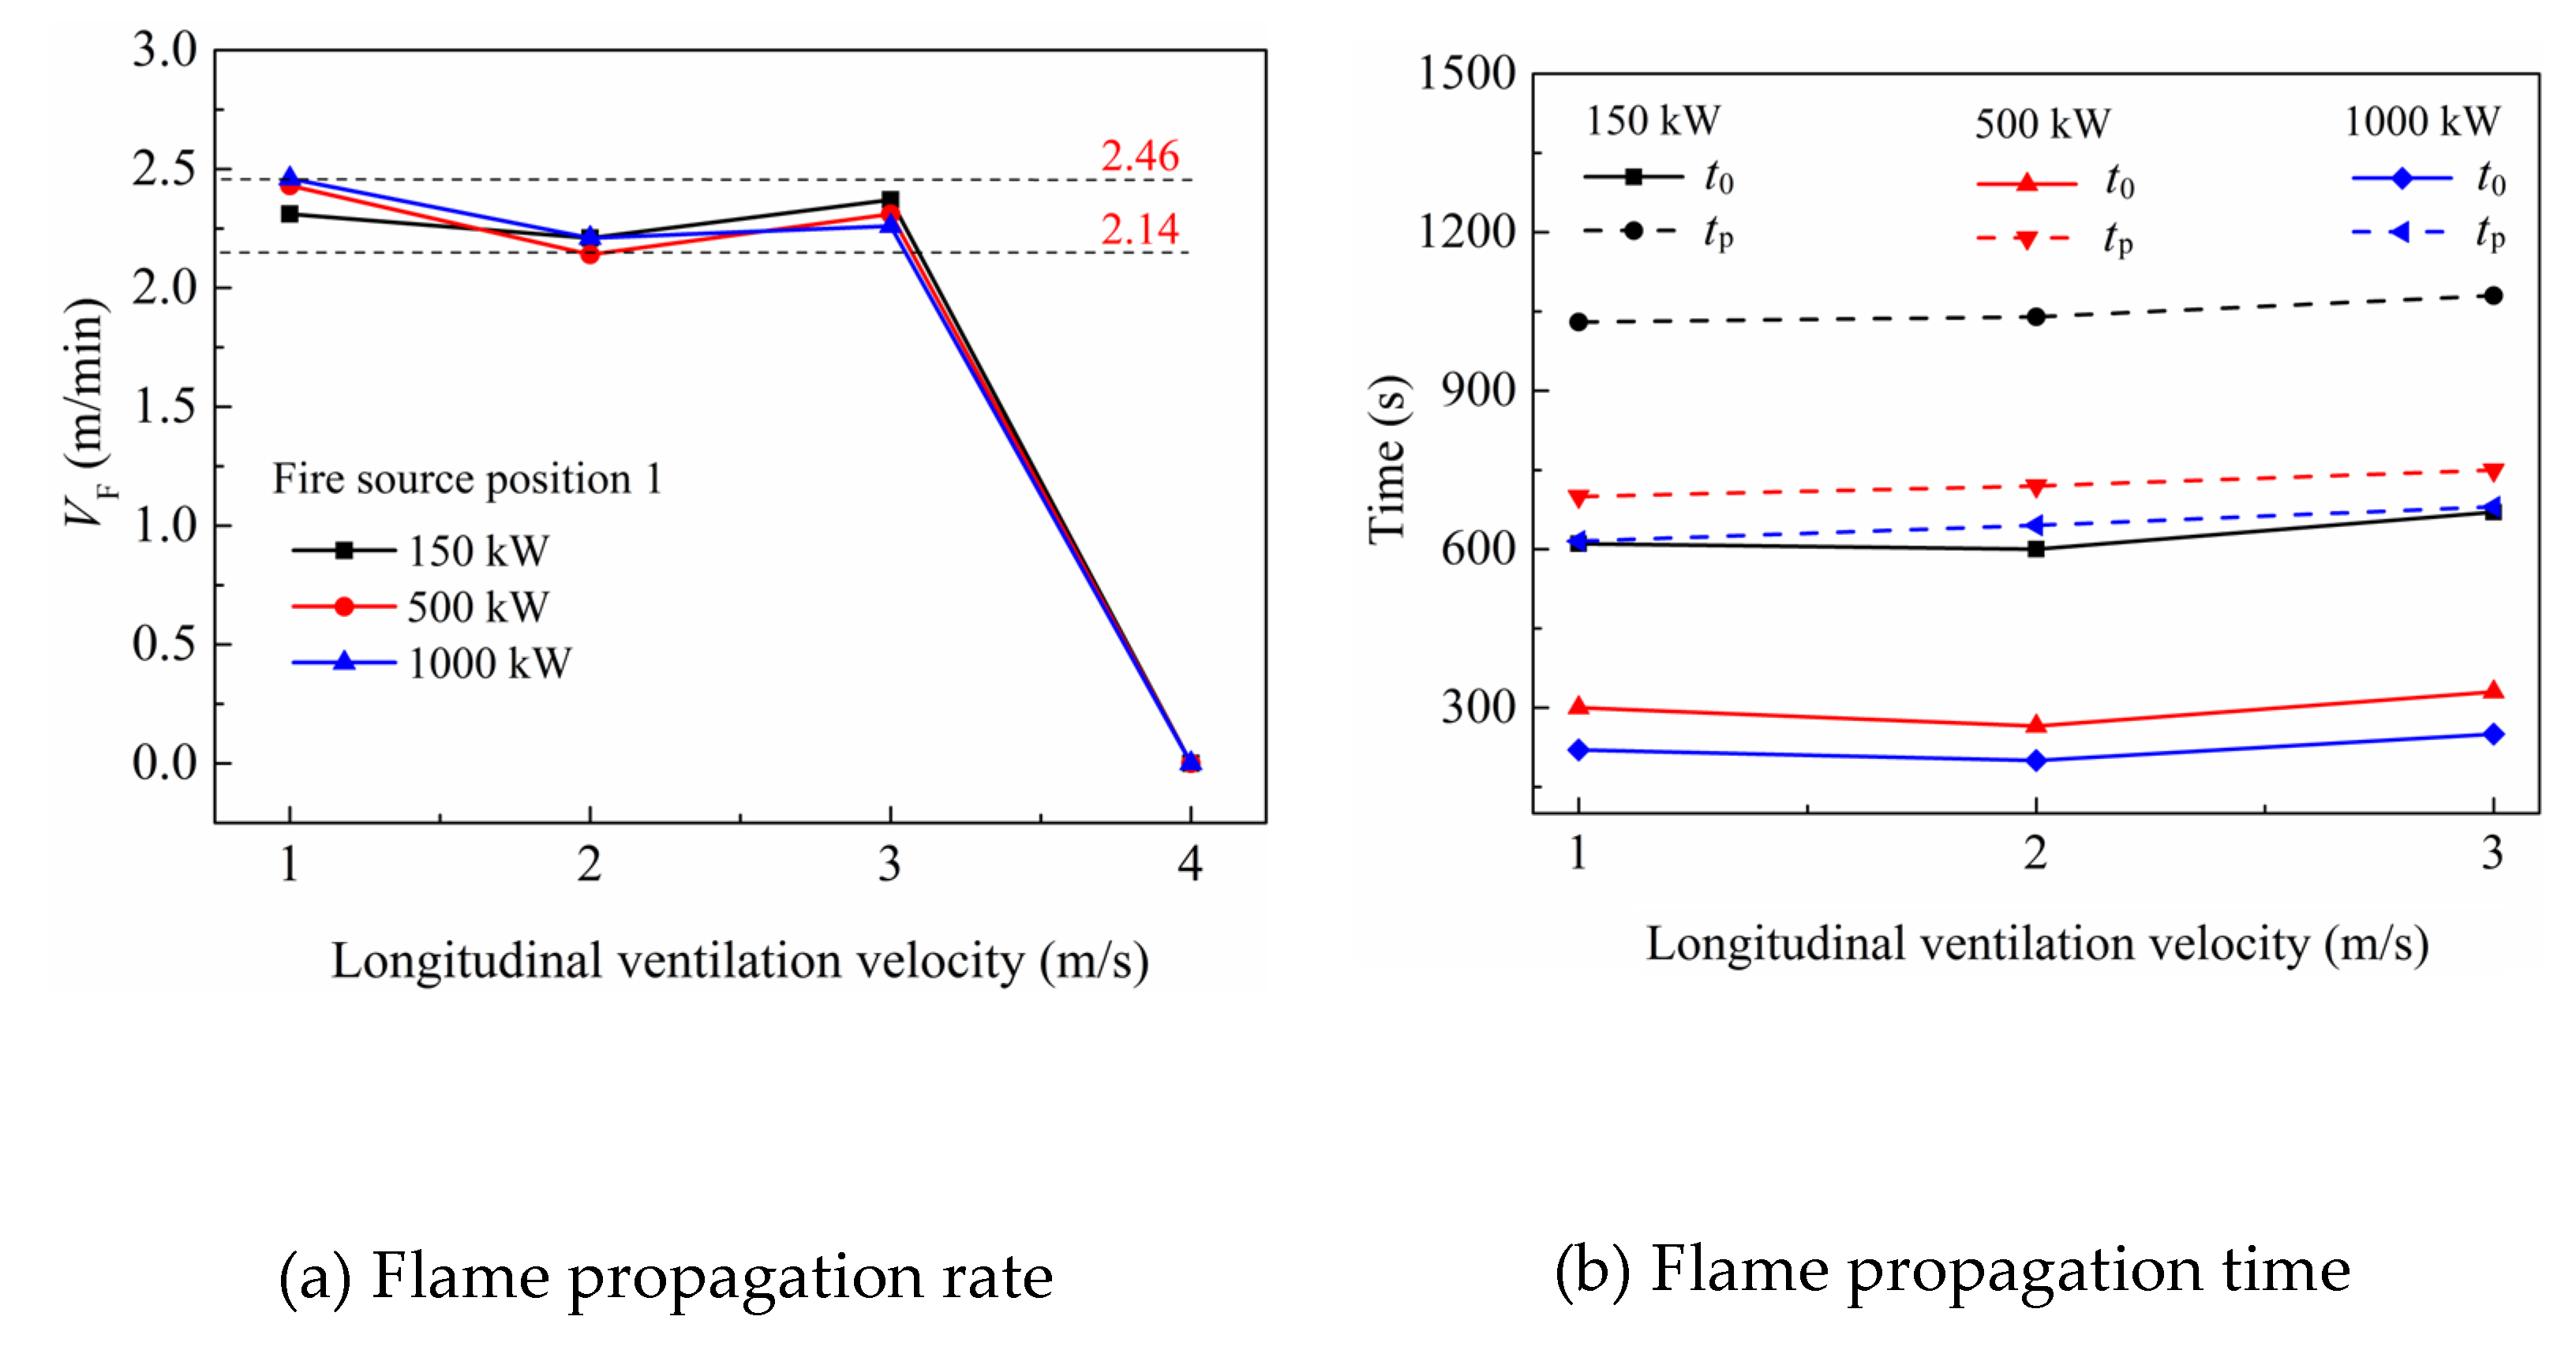
Figure 18.
propagation rate and time of the flame under different ventilation velocities at fire source position 5.
Figure 18.
propagation rate and time of the flame under different ventilation velocities at fire source position 5.
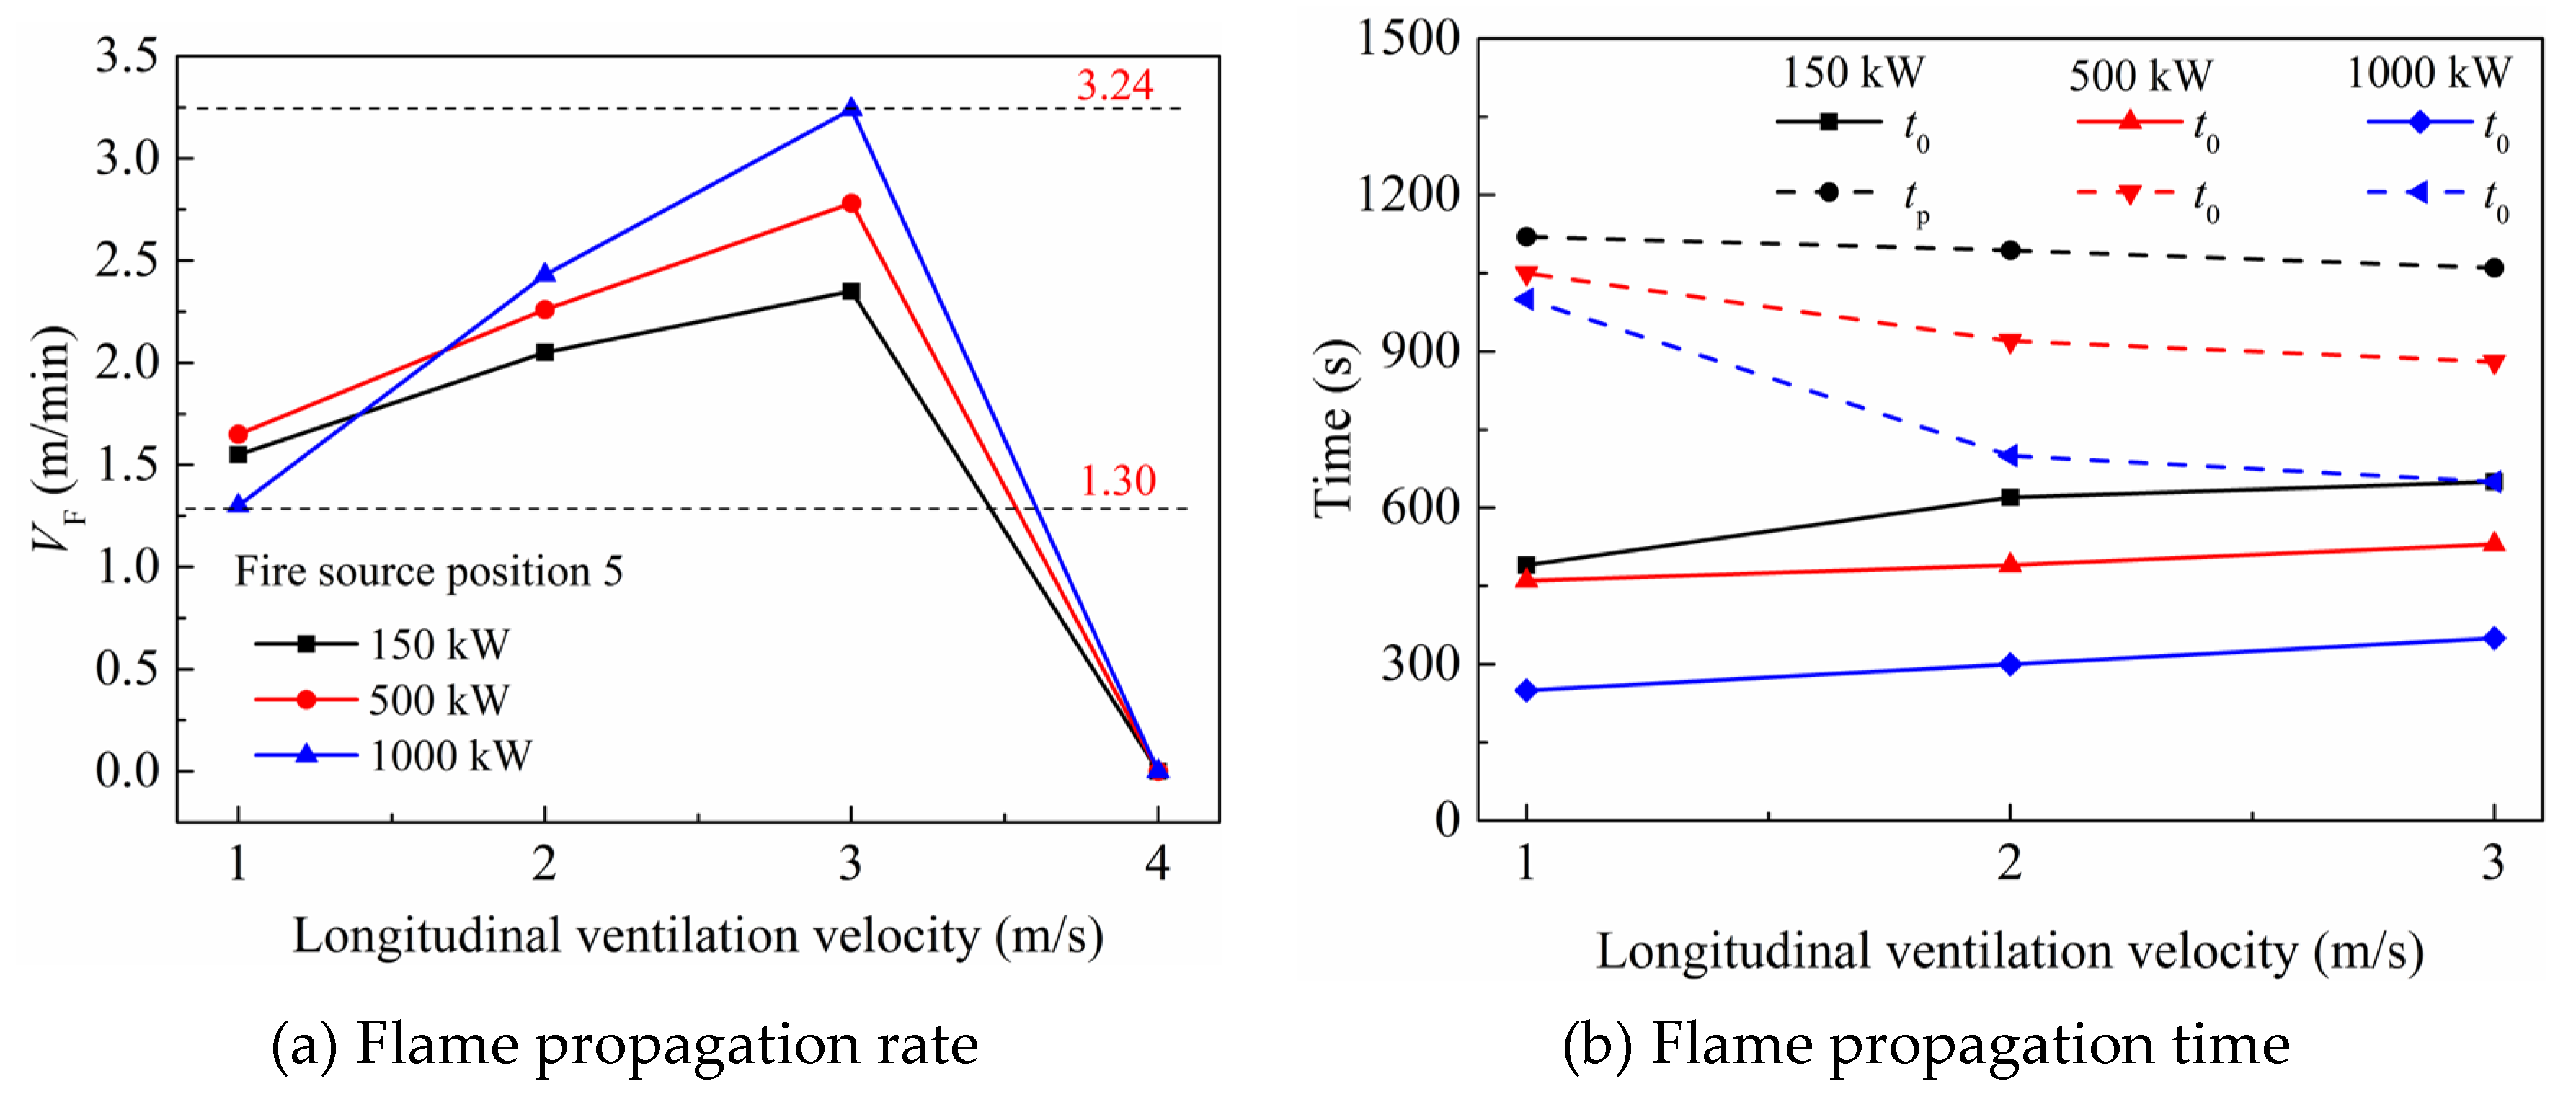
Figure 19.
Flame propagation process in the high-speed train carriage at fire source position 5 (fire source power is 1000 kW).
Figure 19.
Flame propagation process in the high-speed train carriage at fire source position 5 (fire source power is 1000 kW).
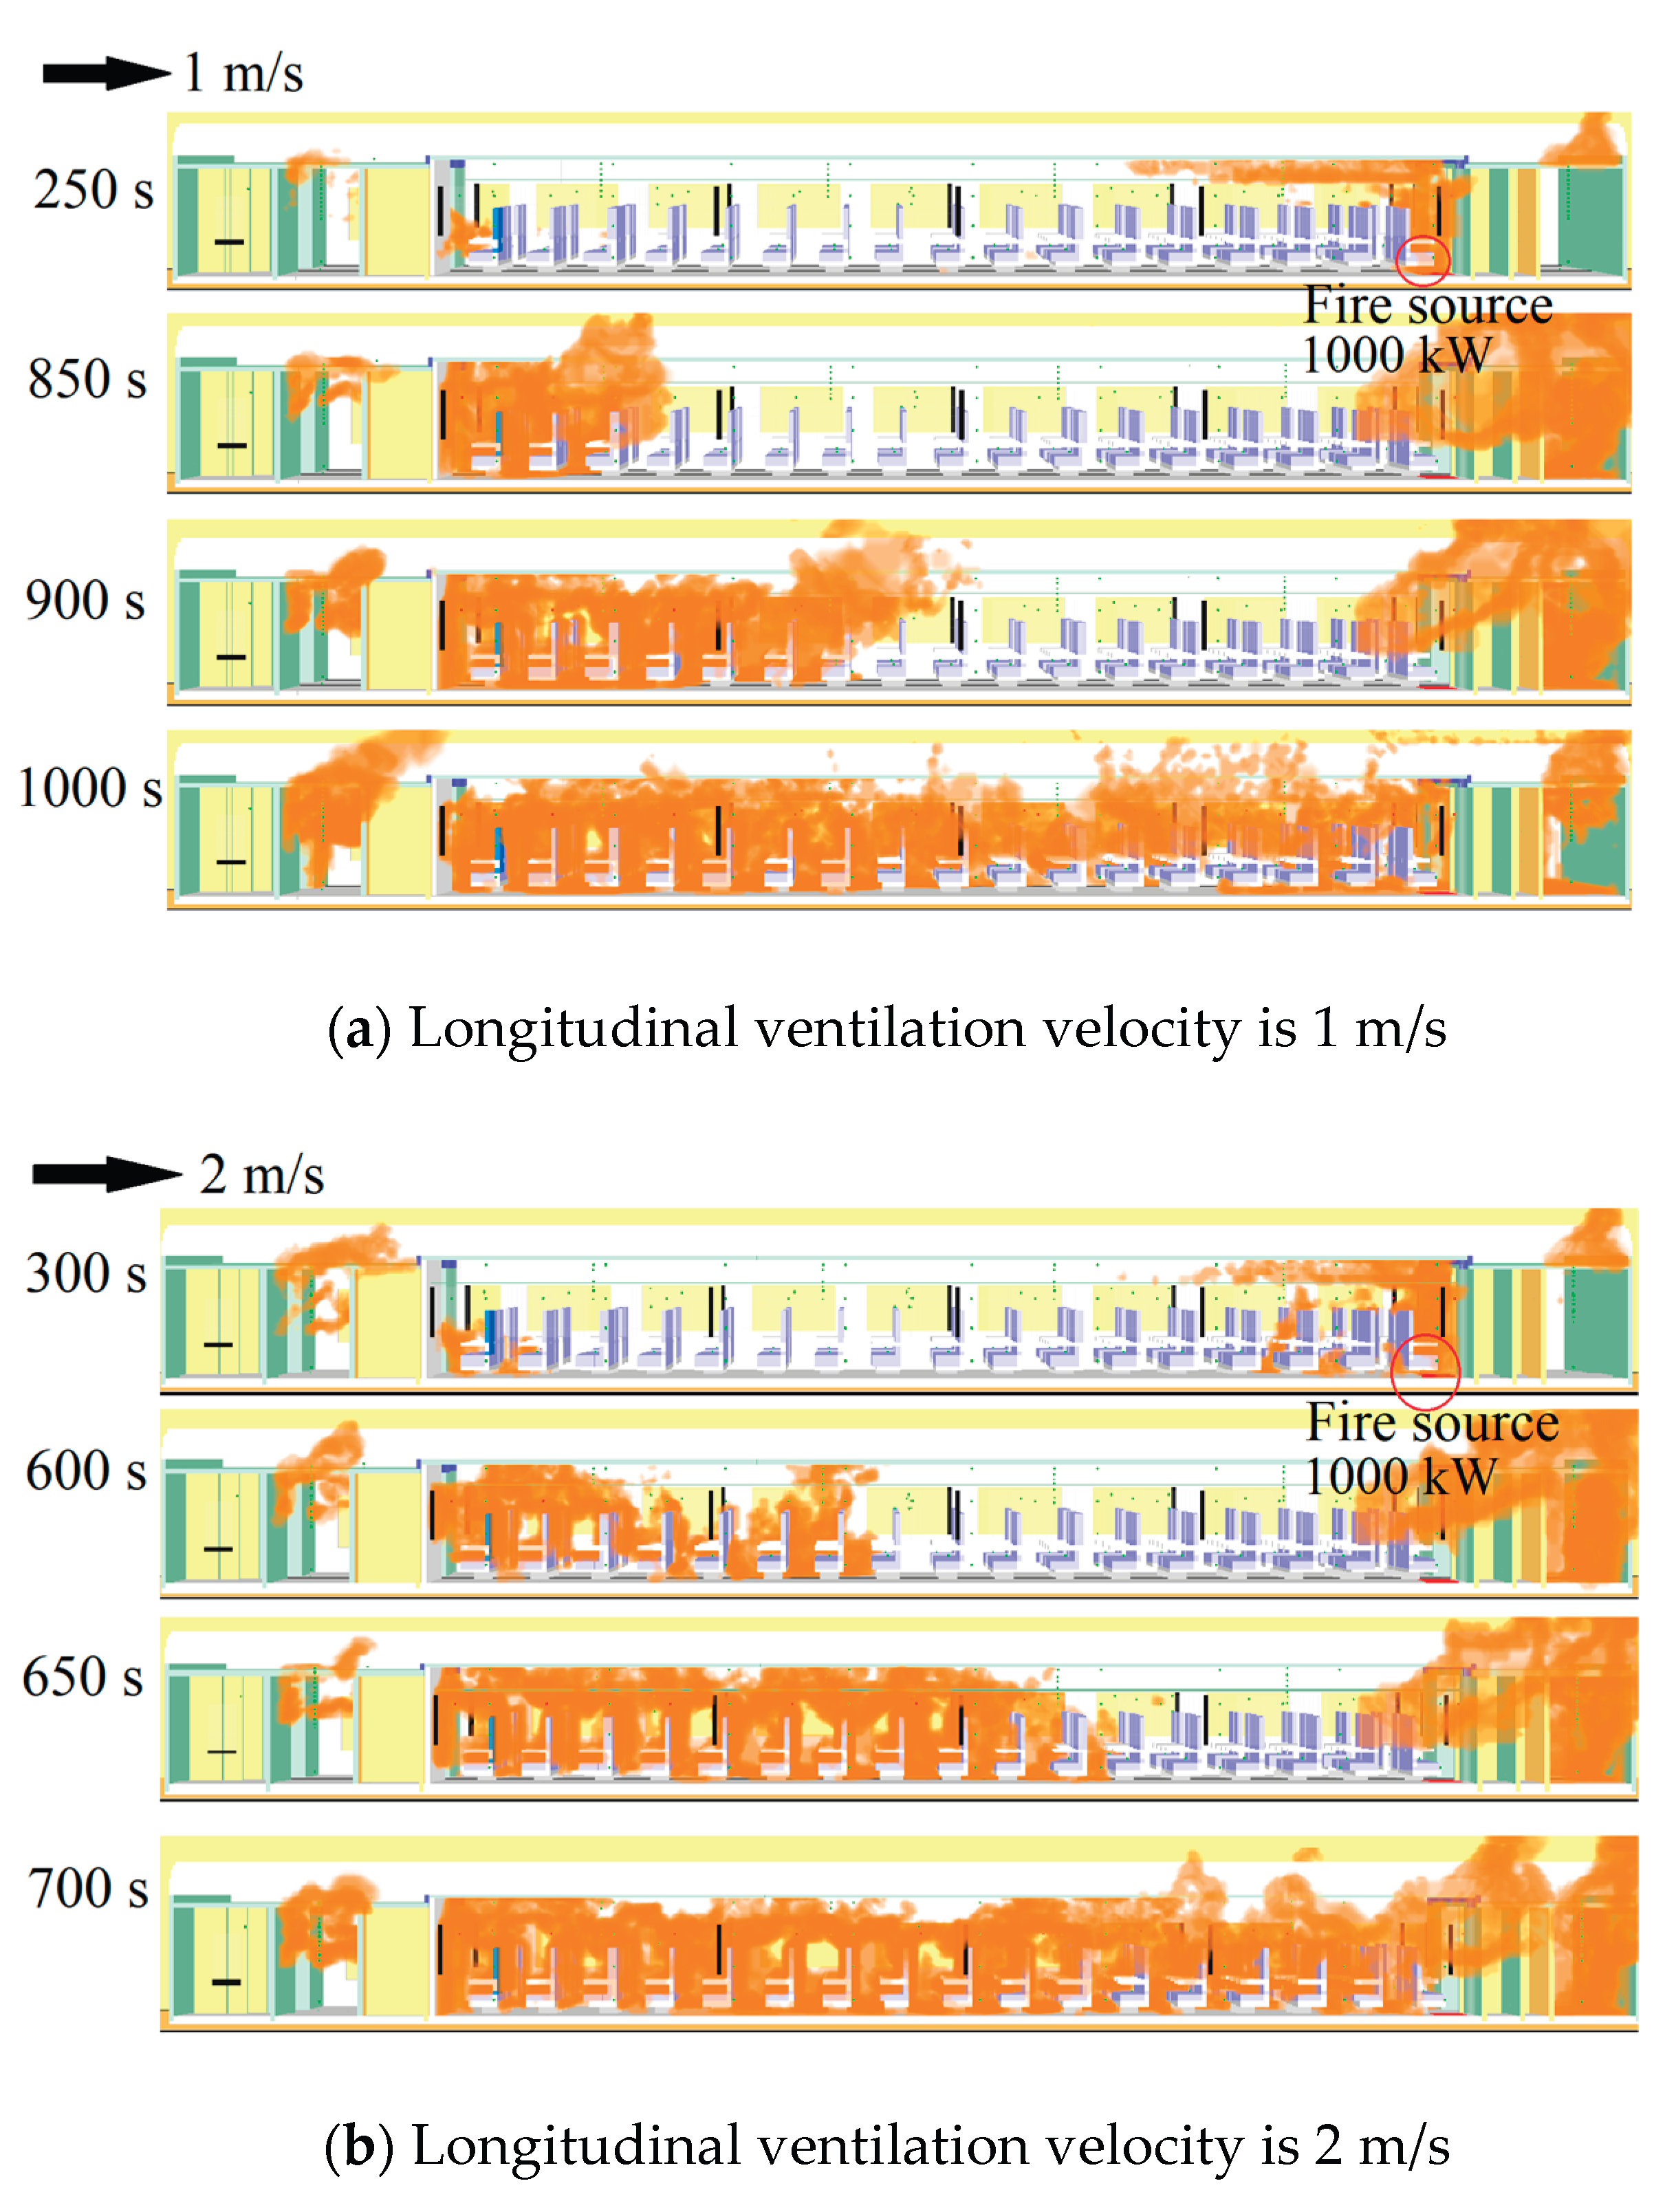
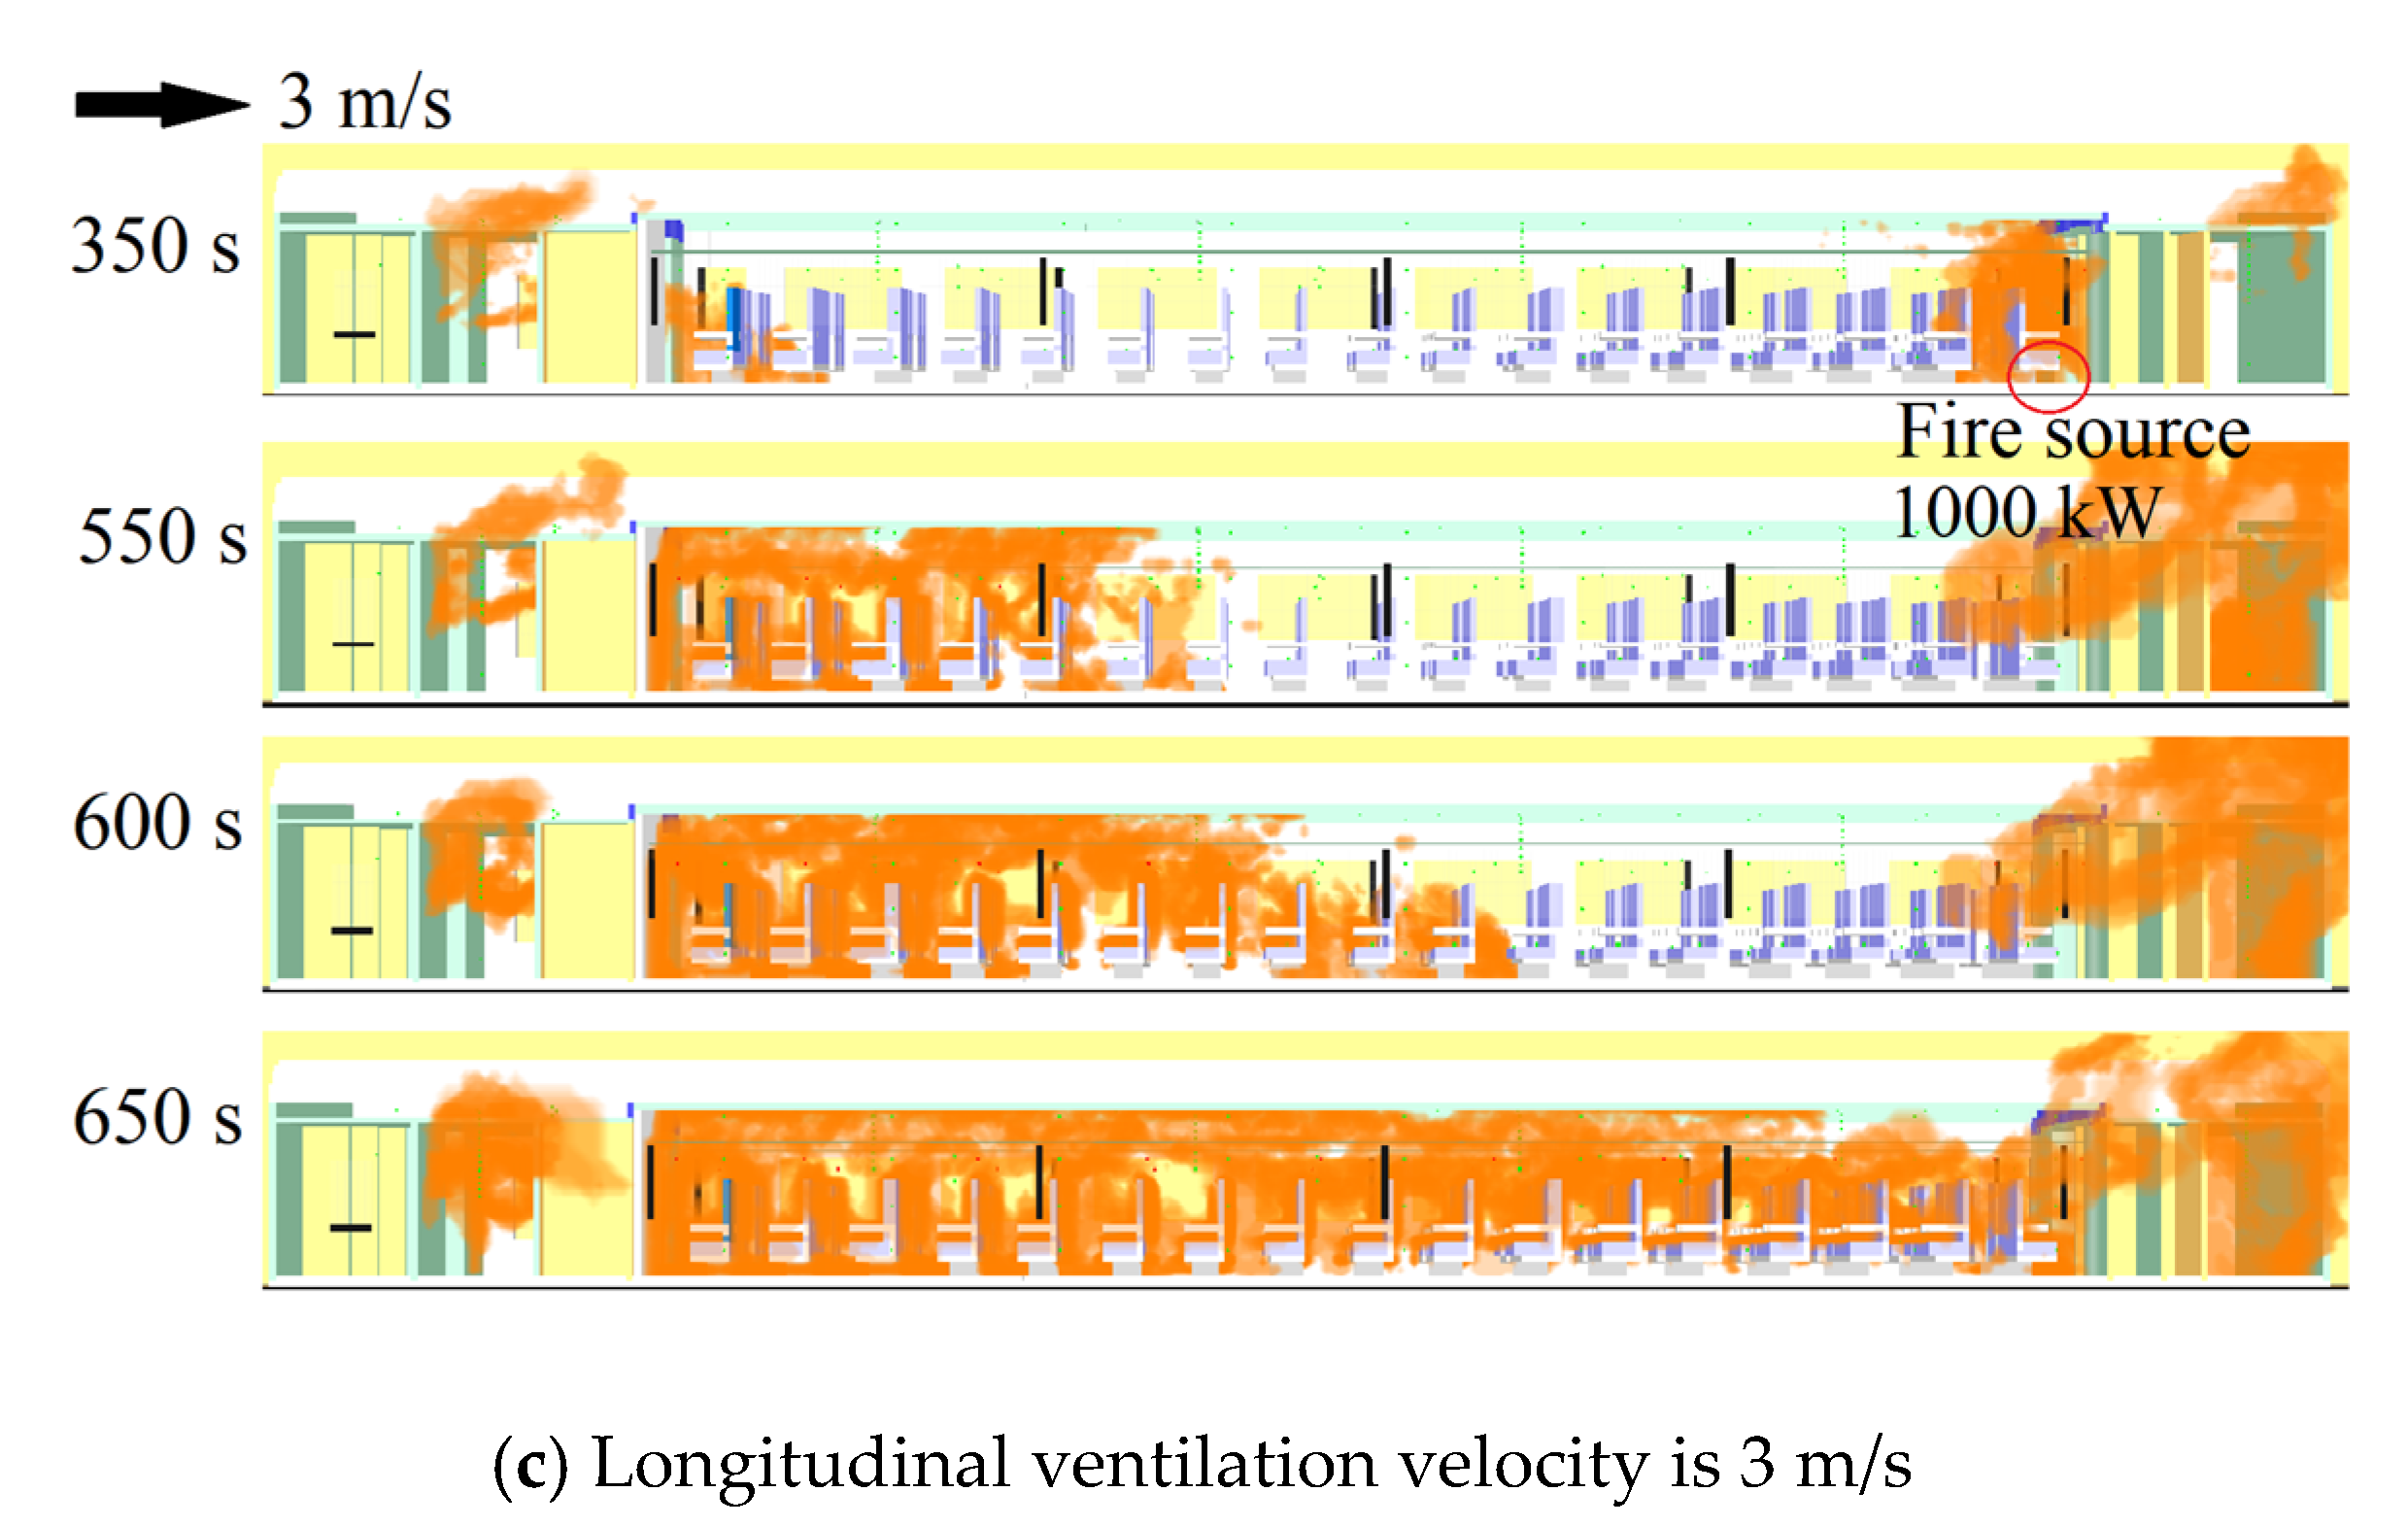

Table 1.
Summary of simulated conditions.
| Simulation No. | Fire source power (kW) | Fire source position | Longitudinal velocity (m/s) | |
|---|---|---|---|---|
| Forward | Reverse | |||
| 1-12 | 150, 500, 1000 | 1 | 1, 2, 3, 4 | - |
| 13-15 | 150 | 2, 3, 4 | 2 | - |
| 16-17 | 500, 1000 | 3 | 2 | - |
| 18-29 | 150, 500, 1000 | 5 | - | 1, 2, 3, 4 |
Disclaimer/Publisher’s Note: The statements, opinions and data contained in all publications are solely those of the individual author(s) and contributor(s) and not of MDPI and/or the editor(s). MDPI and/or the editor(s) disclaim responsibility for any injury to people or property resulting from any ideas, methods, instructions or products referred to in the content. |
© 2026 by the authors. Licensee MDPI, Basel, Switzerland. This article is an open access article distributed under the terms and conditions of the Creative Commons Attribution (CC BY) license.
Copyright: This open access article is published under a Creative Commons CC BY 4.0 license, which permit the free download, distribution, and reuse, provided that the author and preprint are cited in any reuse.


