1. Introduction
The share of compression ignition engines in the automotive industry continues to grow, despite the implementation of increasingly stringent exhaust emission regulations [
1]. This trend can be attributed to the continuously improved performance of compression ignition engines and their relatively flat torque curve compared to spark ignition engines [
2]. Periodically, new emission standards are introduced, reducing the permissible concentration of toxic substances in engine exhaust gases. The constant pursuit of improved efficiency, increased engine power, and compliance with strict emission standards has led to significant complexity in engine design [
3].
Among all engine components, the fuel injection system has the most significant impact on both the emissions of toxic exhaust components and engine performance. Over the years, this system has undergone substantial advancements, particularly with the development of Common Rail fuel injection systems [
4,
5].
Automotive manufacturers aiming to launch new vehicles—and consequently new engine designs—must first develop prototypes. To create prototypes that meet designers' expectations as closely as possible, computer modeling of individual components and entire vehicles is increasingly utilized. This approach allows for preliminary testing of a design during its development stage. After necessary adjustments, a physical prototype is created and subjected to further testing [
6]. The use of computer modeling minimizes the need to produce numerous prototype variants, thereby reducing costs and development time. Engineers can simulate the designed system on a computer, where algorithms calculate the system's response to specified inputs under simplified conditions [
7]. However, any developed model must be experimentally validated, a process that is often challenging. Insufficient model validation can result in serious consequences, such as failing to meet homologation requirements.
For example, mathematical modeling during the design process can be used to estimate the volume of fuel injected by an electronically controlled injector (electromagnetic or piezoelectric) at a given input pressure and actuator pulse duration. If the injector injects either too little or too much fuel, engineers can modify the model and re-test it. Once the results are satisfactory and align with expectations, a physical injector is manufactured based on the model [
8]. The actual injector is then subjected to further experimental testing, as mathematical descriptions of physical phenomena often involve simplifications [
9].
The degree of accuracy in replicating an injector's operation using a mathematical model significantly affects production costs. A more accurate mathematical model ensures that simulation results closely align with experimental results for the physical injector. This reduces the number of prototypes needed to develop a design that meets engineering requirements [
10].
The modeling of Common Rail fuel injection system components can be performed at varying levels of complexity. J. A. Soriano et al. [
11] proposed a dimensionless model of injection rate. This model was developed based on experimental data from tests on fuel injection in a Common Rail system equipped with two electromagnetic injectors. The model enables the determination of injection rate using only parameters such as injection pressure, injector control signal, total mass of fuel injected per stroke, geometry and number of injector orifices, and certain fuel properties. The proposed model is beneficial for determining the injection rate in injectors with unknown internal dimensions. Comparative results between experimental and modeled injections demonstrated a high correlation, validating the model's effectiveness.
Mathematical modeling is utilized in nearly every field of engineering. For example, Wang H. et al. [
12] developed a mathematical model encompassing all components of the high-pressure circuit of a Common Rail system, including the high-pressure pump, fuel rail, and injectors. This model was simulated using Matlab/Simulink and subsequently validated with the Amesim software. The authors also designed an iPI controller based on an Extended State Observer (ESO), characterized by a simple structure, high performance, and ease of parameter tuning. This controller was later compared to a conventional PID (Proportional-Integral-Derivative) controller and an ADRC (Active Disturbance Rejection Control) controller. The results demonstrated that the iPI controller outperformed the others in terms of overshoot and tracking accuracy. However, its application range was somewhat limited and not explicitly defined.
A significant number of studies in this field focus only on simulating specific injector components. For instance, B. Huber and H. Ulbrich [
13] concentrated exclusively on the operation of the electromagnetic valve in a Common Rail injector. They developed a simulation model of the valve, incorporating its magnetic and mechanical parts. The model was validated through dynamic displacement measurements of the solenoid armature. A comparison of simulation and experimental results showed excellent agreement under specific operating conditions. Further research on the simulation model led the authors to conclude that transient states occurring shortly after the energization or de-energization of the solenoid coil could impact fuel metering stability.
In another study, C. Jiangwei et al. [
14] designed a Common Rail injector model using Amesim, which was part of a more complex model of a four-cylinder compression ignition engine. The injector model allowed the researchers to analyze the impact of various injector design parameters, such as fuel injection rate. Subsequently, an engine model was built to simulate engine performance, and the two models were integrated using Simulink. This integrated model provided a theoretical foundation for injector design. However, the model was based on several simplifying assumptions that may not fully capture the complexity of real-world injector processes. Furthermore, no experimental validation of the model was conducted, making it difficult to assess its accuracy and reliability.
Following the development of the engine model, the researchers conducted a subsequent study [
15] to analyze the impact of different structural parameters of the injector on engine performance. Parameters such as the lift height of the control valve, the preload of the needle valve spring, the needle valve stroke, and the clearance between the electromagnetic valve armature and the solenoid coil were investigated. The authors demonstrated that variations in these parameters lead to inconsistencies in fuel metering, highlighting the need for stricter quality control standards during the production phase. However, the experimental validation of the model was limited, restricting the scope of its application.
One-dimensional modeling enables conducting complex studies on the impact of various fuel properties on the injection process in a Common Rail system. R. Payri et al. [
16] undertook such research by modeling a second-generation injector in the Amesim software. The researchers conducted simulations of the injection process for two fuels: diesel fuel and biodiesel (100% rapeseed methyl ester, RME). The study was carried out under various multi-phase injection strategies to examine the impact of biodiesel on injector performance and stability. Experimental mass flow rate characterization tests were subsequently conducted and used for model validation. The results confirmed the model's reliability, as the differences between the model's predictions and the experimental results were minimal. Further simulations revealed significant differences in the dynamic response of injectors powered by biodiesel versus diesel fuel. Based on these findings, the researchers proposed hardware modifications to the injectors to compensate for the identified differences.
In certain cases, numerical studies are indispensable, as demonstrated by K. Jaeheun et al. [
17]. They investigated the influence of fuel viscosity and density on injection rate. This influence could only be studied through simulation, as it is practically impossible to vary viscosity or density independently—changing one property inevitably affects the other. The developed model was validated using experimental data on injection rate. The results conclusively showed that fuel viscosity has a greater impact on injection rate than density, which is particularly significant in cold-start conditions.
M. Carreres et al. [
18] employed one-dimensional modeling to analyze the impact of fuel temperature on the performance of an electromagnetic injector. The model was validated using experimental data on injector performance under various load conditions, including variations in pressure, coil actuation time, and fuel temperature. Simulation results provided insights into injector dynamics under low-temperature conditions and allowed for an assessment of how viscous friction forces affect the motion of the needle valve. The study found, for example, that low fuel temperatures lead to slower injector opening due to increased viscosity.
S. Vass and M. Zoldy presented a model of a first-generation Common Rail injector in their publication [
19]. The model was validated based on fuel delivery measurements and needle lift height measurements. Laboratory fuel delivery tests were conducted under three injector load conditions. The model was developed using GT-Suite software. The validation demonstrated the accuracy of the model, providing a foundation for further research on injector optimization.
When considering simulation models of Common Rail injectors, it is essential to account for the inherent variability of modern injectors, despite the use of advanced manufacturing technologies. Simulation models developed by researchers can never be entirely accurate, as it is impossible to produce perfect injectors—there will always be slight differences between individual units. Due to the large number of injector components influencing its performance, such as the nozzle, hydraulic valve, and electromagnetic coil, achieving perfect consistency during production is unfeasible. Variations in geometric, mass, or electrical parameters of these components can impact the amount of fuel injected, ultimately leading to reduced engine efficiency, increased noise emissions, and heightened smoke generation [
20].
A review of the literature highlights the diverse applications of computer modeling within fuel injection systems. The examples presented demonstrate the versatility of simulation models, which enable researchers to independently modify specific parameters of a system, something that is often impractical in reality (e.g., altering the density of a fluid without affecting its viscosity). The literature analysis reveals that many studies either focus on modeling specific parts of the injector or on larger systems, such as the entire high-pressure circuit of a Common Rail system or a complete compression ignition engine, including its fuel injection system. Researchers also investigate the influence of operating conditions, such as fuel temperature or fuel properties, on the injection process. However, relatively few studies focus on the injector itself and its performance under varying load conditions, as well as on comprehensive, multi-scope validation of developed models.
This study, motivated by the identified research gap, focuses on evaluating the performance of a simulation model of a Common Rail injector under varying pressure and injector opening times, along with its laboratory validation. This work serves as a foundation for more complex future research on the performance characteristics of electromagnetic injectors, taking into account the physicochemical properties of fuels used in internal combustion engines. These future studies will include both simulation-based investigations and experimental testing on physical systems.
2. Aim and Methodology of the Study
The objective of this research was to develop a simulation model of an electromagnetic injector for the Common Rail system and to validate the model experimentally using data obtained from test bench experiments.
The process of surveying and compiling the results was divided into the following stages.
Experimental research:
- a)
measurement of injection and flow-back volumes – the volumes of injected fuel and flow-back fuel were measured for a specified number of injection events,
- b)
determination of unit injection volume – the unit injection volume was calculated based on the measured total volume of fuel injected by each injector during a given test.
Simulation Research:
- a)
injector model development – the injector model was developed using the Amesim software,
- b)
injector disassembly for parameter identification – the injector was disassembled to identify the geometric and mass properties of its individual components,
- c)
measurement of geometric and mass properties – detailed measurements of the geometric and mass parameters of the injector components were performed,
- d)
simulation studies – simulation experiments were conducted to replicate the injector’s performance under various operating conditions.
Evaluation of Results:
- a)
development of comparative characteristics – comparative characteristics of the simulation and experimental results were generated,
- b)
comparison of simulation and experimental results – the outcomes of the simulation studies were compared with the experimental data to assess the accuracy and reliability of the developed model.
The operating conditions of the fuel injection system, corresponding to the characteristic operating points of the internal combustion engine from which the injector was sourced, are presented in
Table 1. To obtain a complete characterization of the injector's performance under all conditions, tests were conducted for 52 different operating states. For injector actuation times of 500 µs, 1000 µs, 1500 µs, and 2000 µs, tests were performed at fuel rail pressures ranging from 20 MPa to 140 MPa, in increments of 10 MPa.
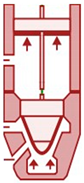
During both simulation and experimental studies, the injected fuel volume and flow-back volume were analyzed and evaluated. Both parameters are critical for the proper functioning of the fuel injection system and the engine as a whole.
Flow-back volume reflects the efficiency of the injector. Excessive flow-back volume may indicate excessive wear of the injector's moving components, which can lead to a reduction in the injected fuel volume due to a pressure drop in the rail. On the other hand, the injector is lubricated and cooled by the flowing fuel; therefore, insufficient flow-back volume could result in overheating and operational instability.
The injection volume is a crucial parameter as it directly affects the amount of energy released in the engine's combustion chamber and subsequently transferred to the crankshaft. The injection volume must be precisely controlled—neither too large nor too small. Excessive injection volume can lead to incomplete combustion, reduced engine power, and increased smoke emissions. Insufficient injection volume can result in decreased engine power, which is also undesirable.
These findings underscore the importance of accurately assessing both injection and flow-back volumes, as they are vital for ensuring optimal injector performance and maintaining the overall efficiency and reliability of the engine.
3. Experimental Research
Due to the adopted procedure, after conducting verification tests and ensuring that the tested injectors were operating correctly, test bench experiments were performed. To accurately determine the injector's performance characteristics under the specified conditions, the number of injection events was adjusted so that the measurement cylinders were filled with fuel to at least ¾ of their capacity.
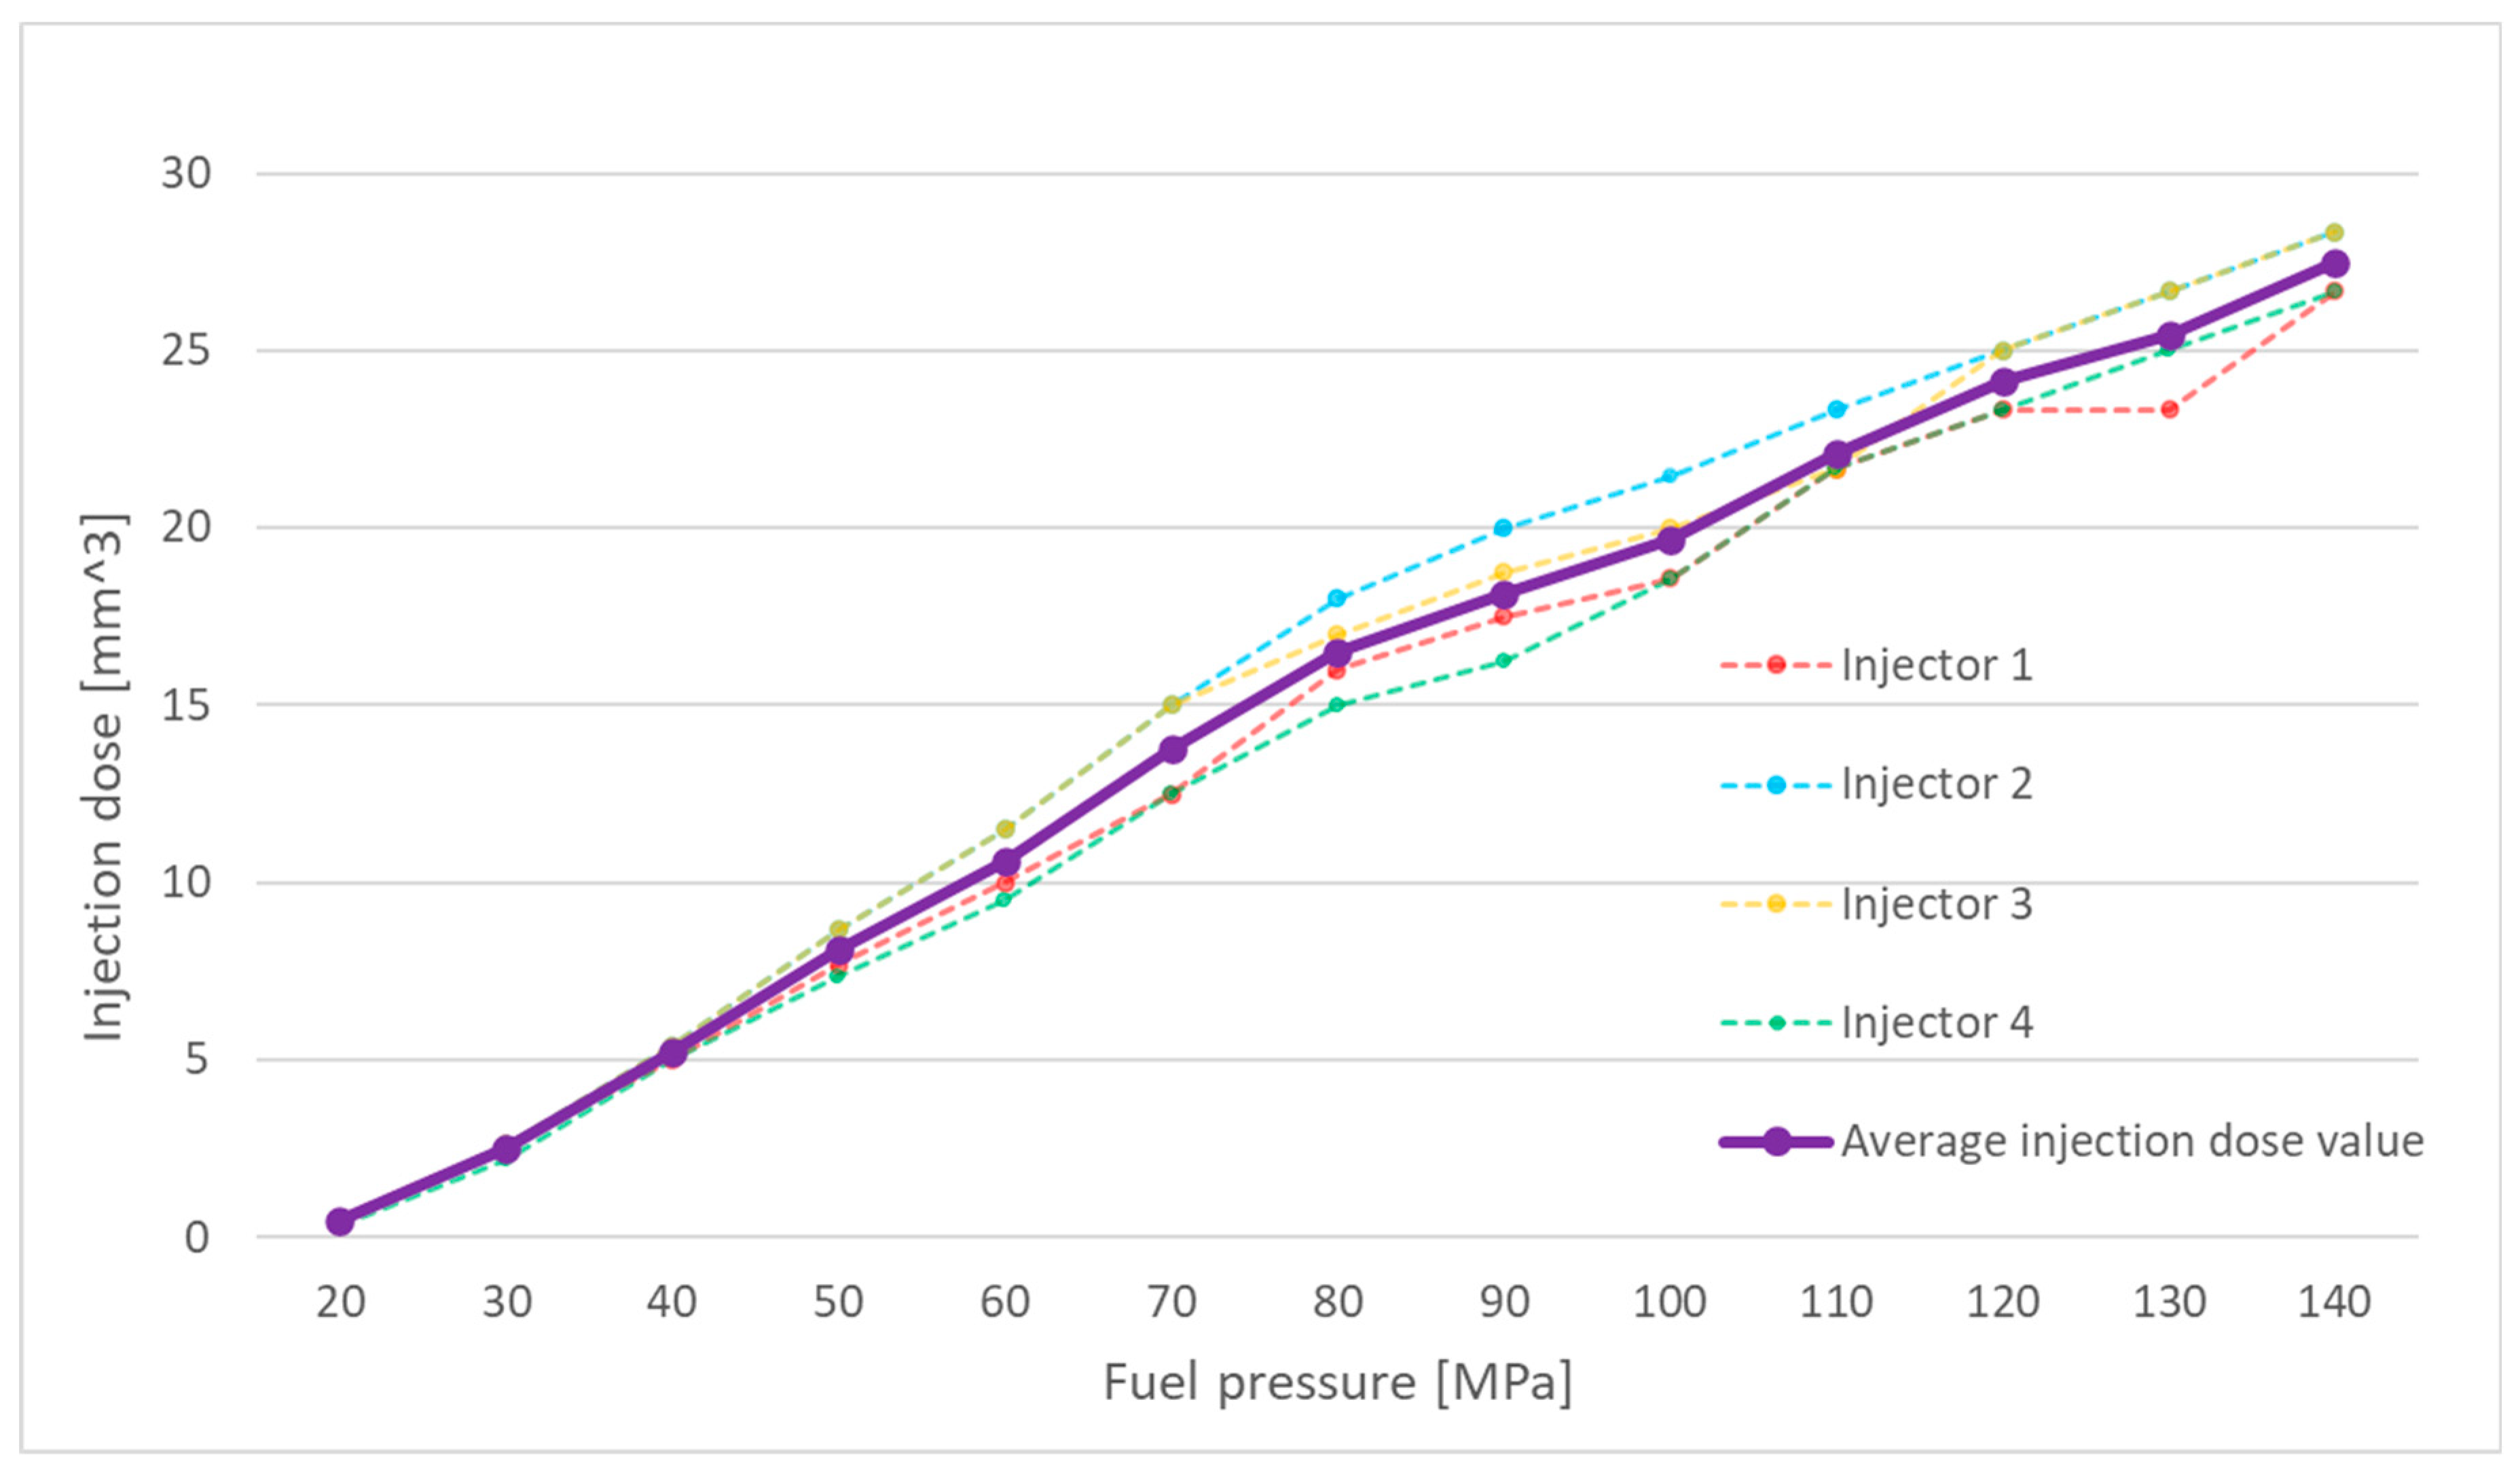
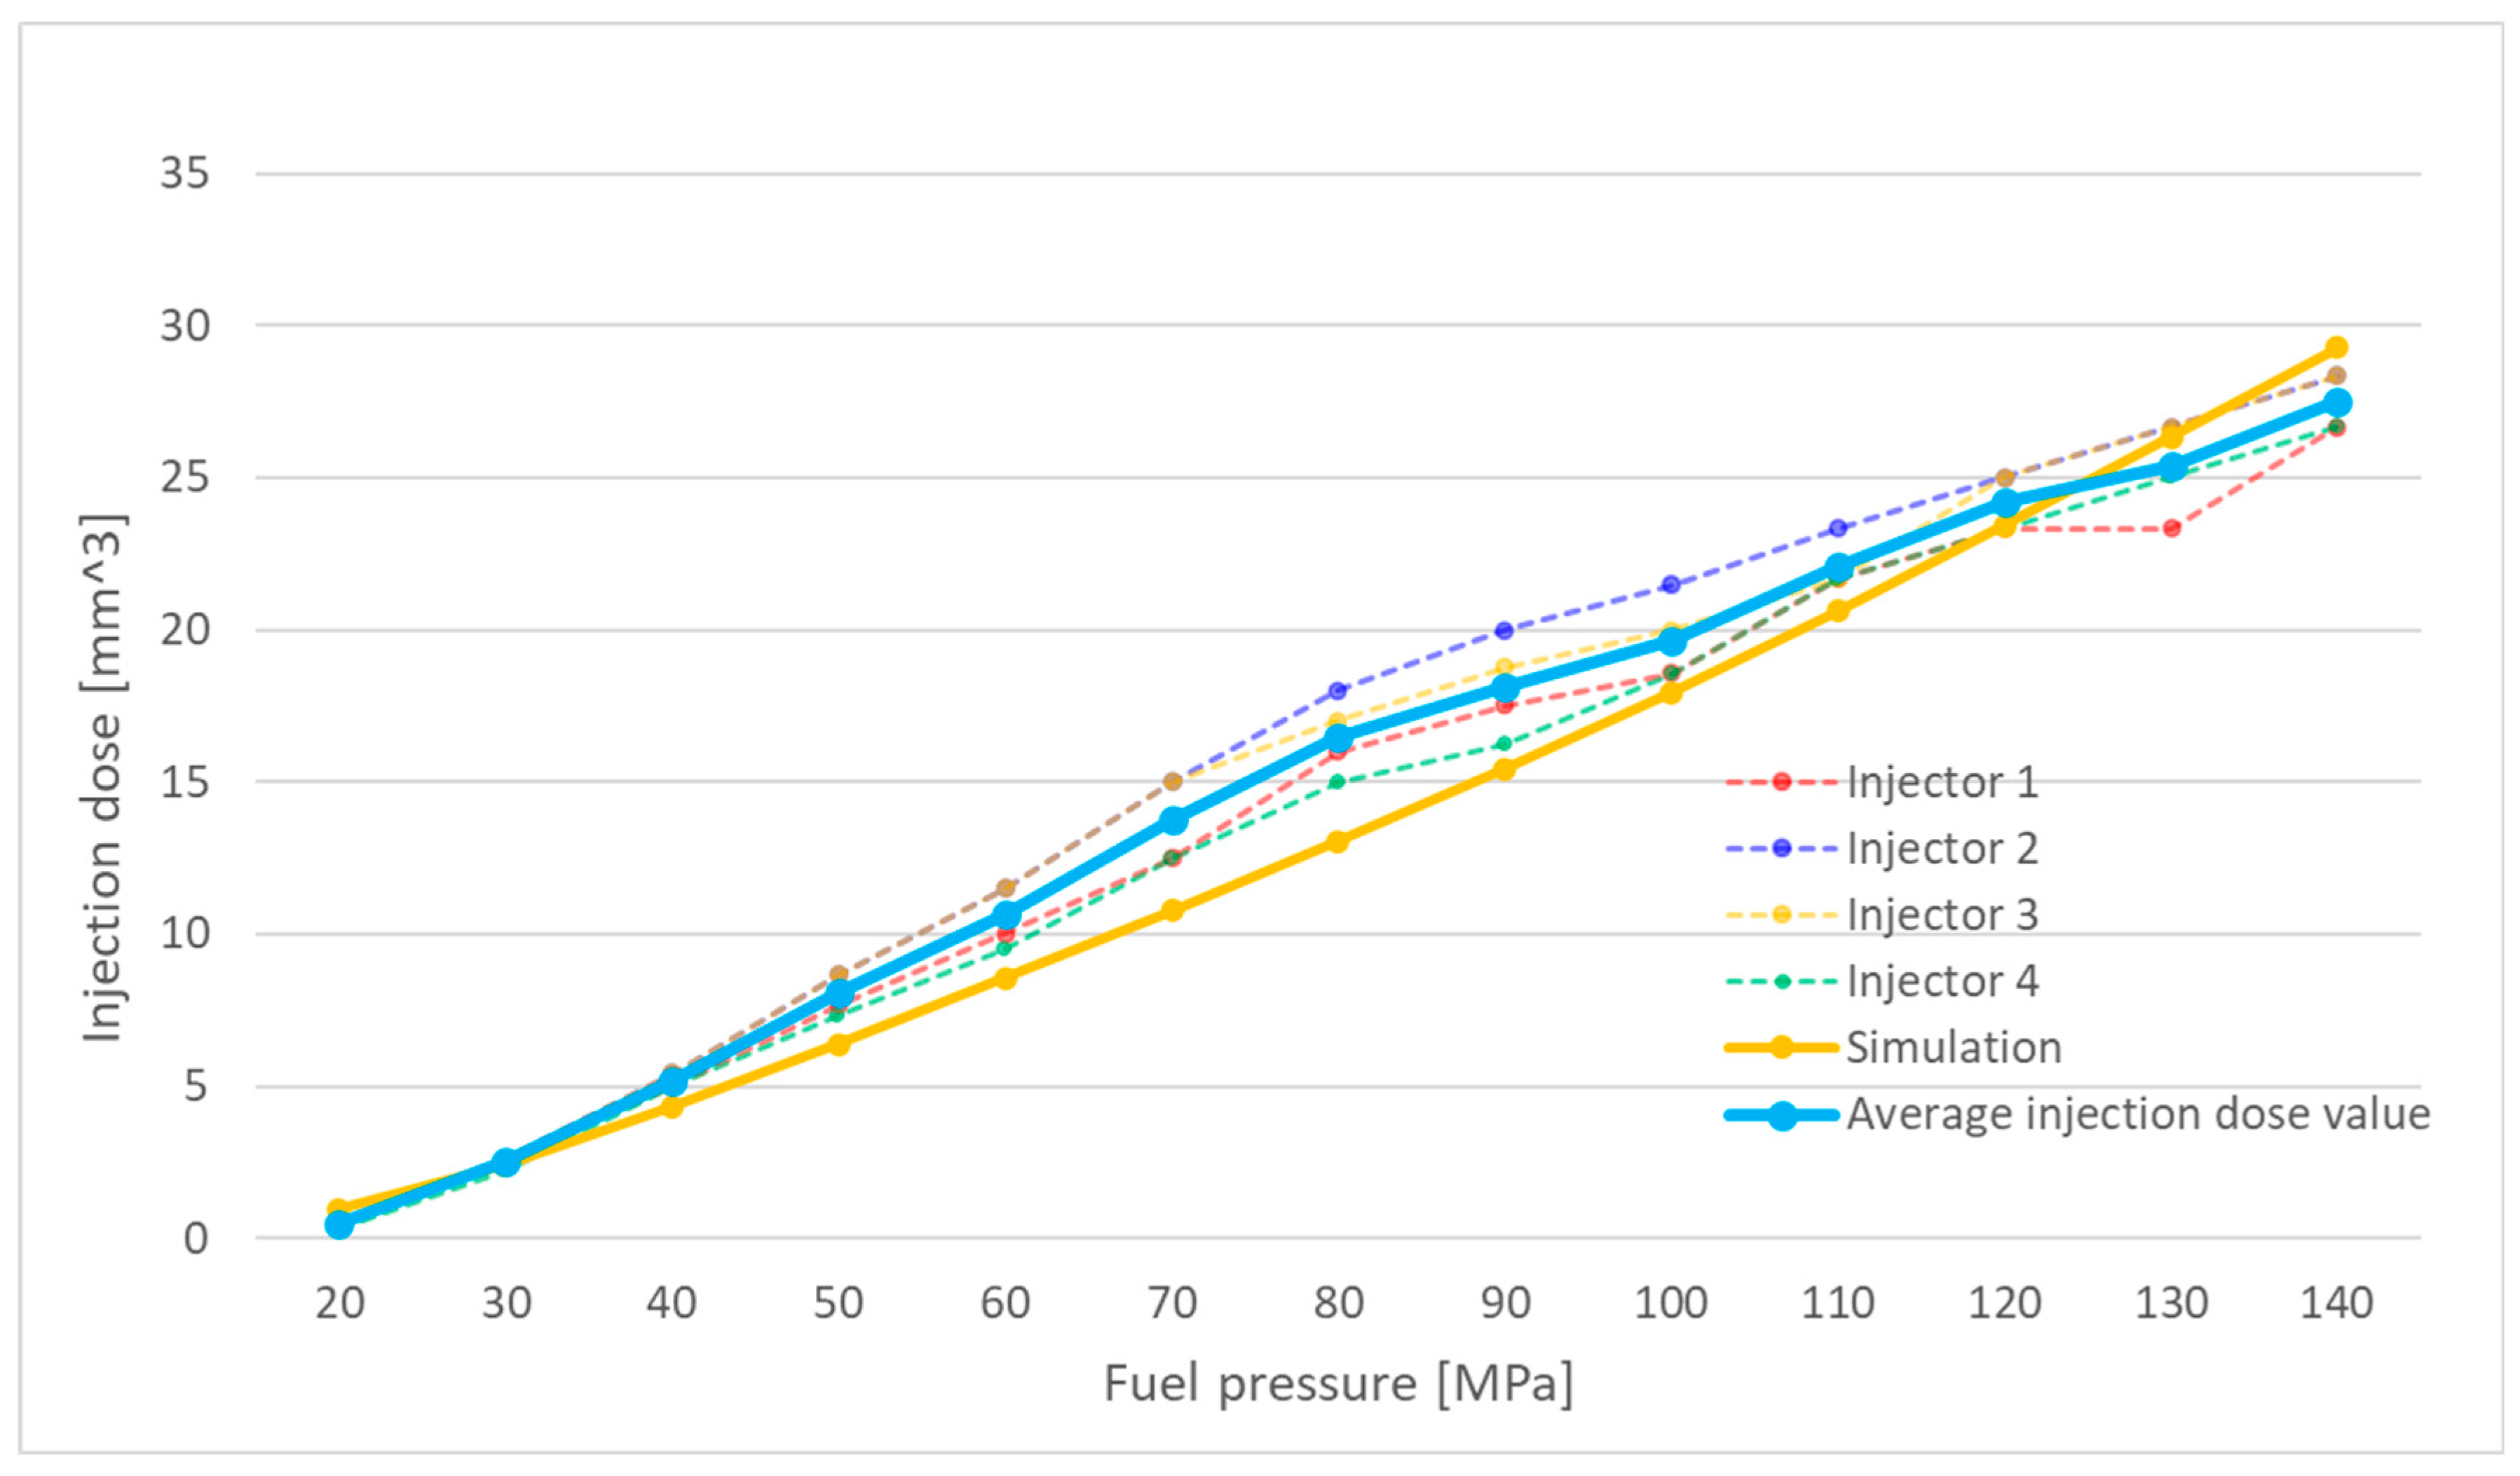
Additionally, to facilitate a comparison between the experimental and simulation results, the obtained measurements were averaged, and a graph of the mean injected fuel volume under the given operating conditions was plotted. An example of such a graph for an injector actuation time of 500 µs is presented in
Figure 1.
At low injection pressures, all injectors delivered nearly identical fuel volumes during operation. However, at pressures exceeding 50 MPa, the injected fuel volume began to vary between injectors. These discrepancies at higher pressures may result from different degrees of wear in the injector components.
The efficiency of the injection process is influenced, among other factors, by the phenomenon of cavitation. As previously mentioned, variations in fuel dosing can stem from varying levels of injector wear. One of the injector components susceptible to wear is the nozzle. Over time, the nozzle orifices may experience slight enlargement due to cavitation-induced wear. Conversely, improper combustion processes may lead to the accumulation of deposits from combustion by-products on the orifices.
In both scenarios, the nozzle orifice diameter changes, altering the cross-sectional area of the orifice. Since this phenomenon occurs at different rates for each injector, the cross-sectional areas of the nozzles' orifices change unevenly. This leads to flow restrictions during injection at higher pressures. This phenomenon can be described by Equation 1:
where:
– fuel mass flow rate,
– fuel density,
Q – volumetric fuel flow,
– flow rate (dependent on nozzle geometry and phenomena such as cavitation),
− cross-sectional area of the nozzle,
– the pressure difference between the inlet and outlet of the nozzle.
At low values, i.e., during fuel injection at low pressure, the mass flow rate increases linearly with increasing injection pressure. This explains the linear injection characteristic observed for each injector at low pressures. The fuel flow coefficient remains constant during low-pressure injection since the fuel flow through the nozzle orifices is still laminar.
Once a certain pressure is exceeded, the flow transitions from laminar to turbulent however, cavitation does not yet occur at this stage. When the injection pressure increases further, causing
to reach a critical value, the pressure within the nozzle drops below the fuel vapor pressure. This leads to the formation of cavitation bubbles within the nozzle's throat, followed by their implosion. The implosion reduces the effective flow area, resulting in a slower increase in the mass flow rate with rising pressure, and in some cases, flow saturation [
19,
21].
Additionally, production variability among injectors can contribute to this phenomenon. In practice, this issue is minimized through IMA (Injector Mengen Abgleich) codes. However, each injector in this study was assigned a unique IMA code. The controller used in the test bench could not account for these codes, as they were not stored in its memory. Consequently, all injectors were powered with identical input signals, leading to varied responses from each injector to the supplied signal.
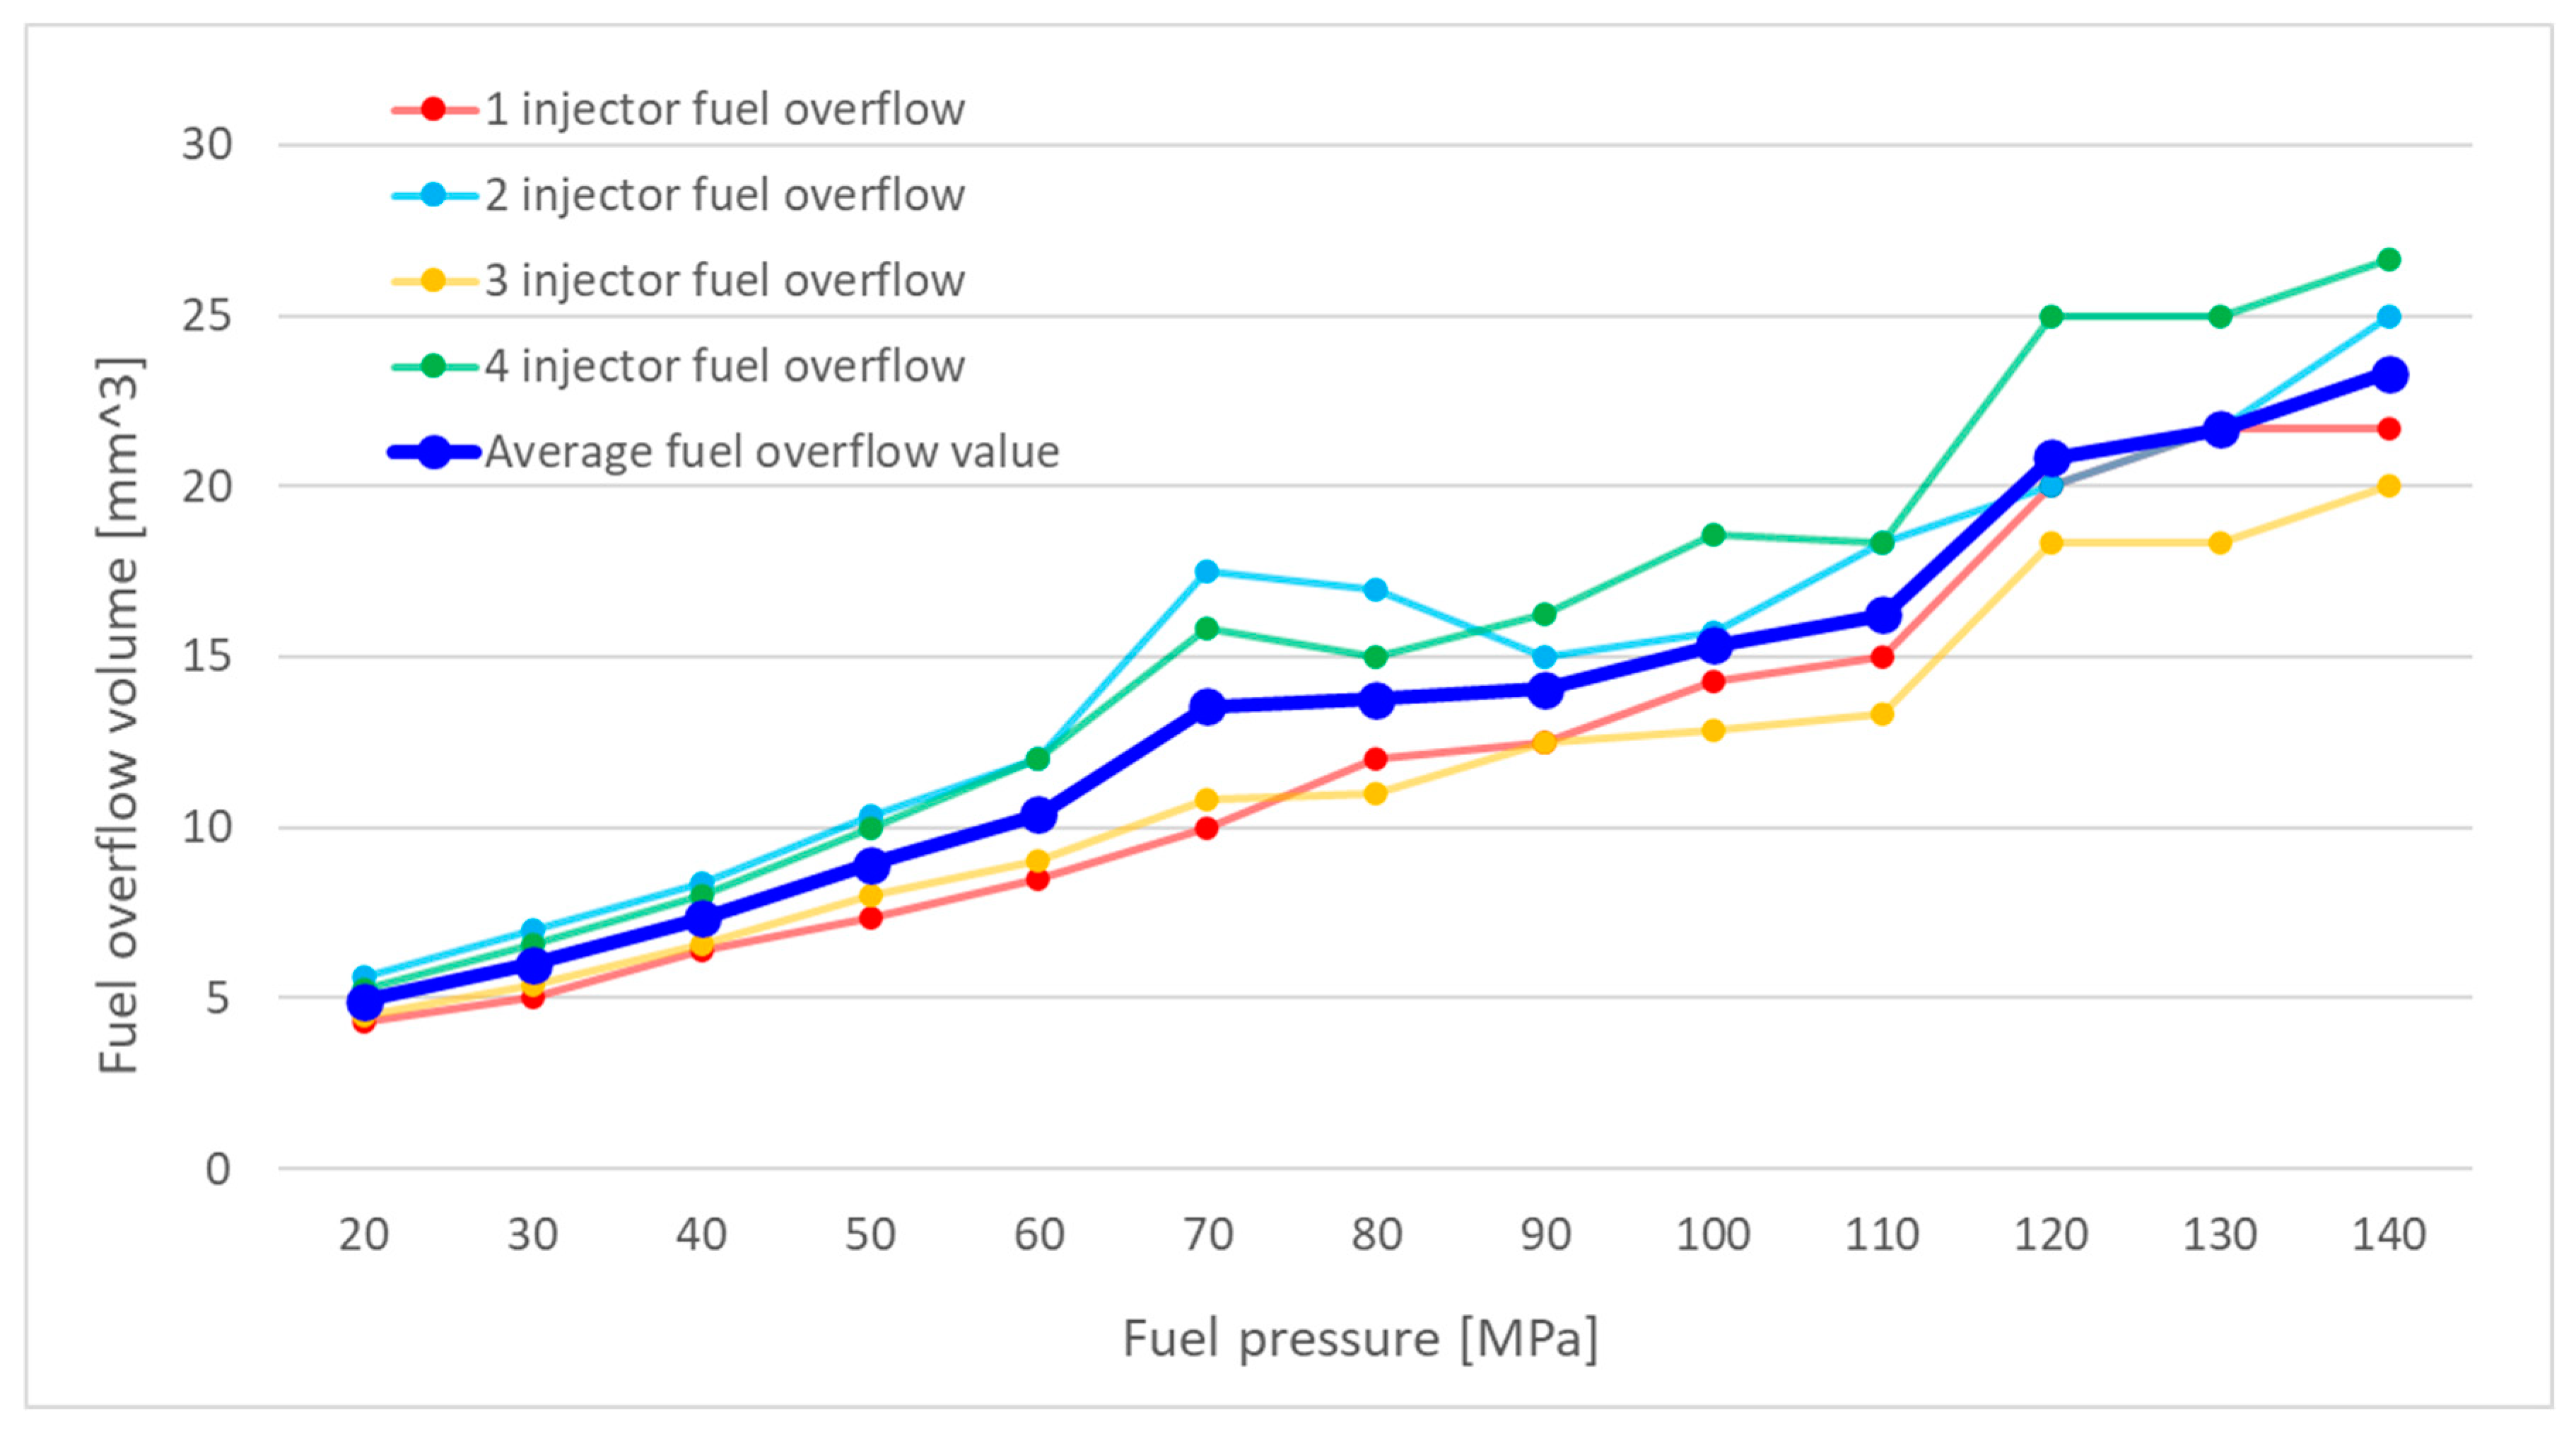
After completing the specified number of injection events, the volume of flow-back fuel was measured in the calibration cylinders. The flow-back volumes for each series of measurements were collected and used to create graphs showing flow-back volume as a function of pressure for four injector opening times. One such graph, corresponding to an injector opening time of 500 µs, is presented in
Figure 2.
The flow-back volumes for each injector showed significant variation. The greatest discrepancies were observed at pressures exceeding 60 MPa. This variability can be attributed to production inconsistencies and differing levels of wear among the injectors. Abrasive wear of the moving components within the injector may lead to increased leakage of fuel through the control valve and between the needle and the nozzle body during operation.
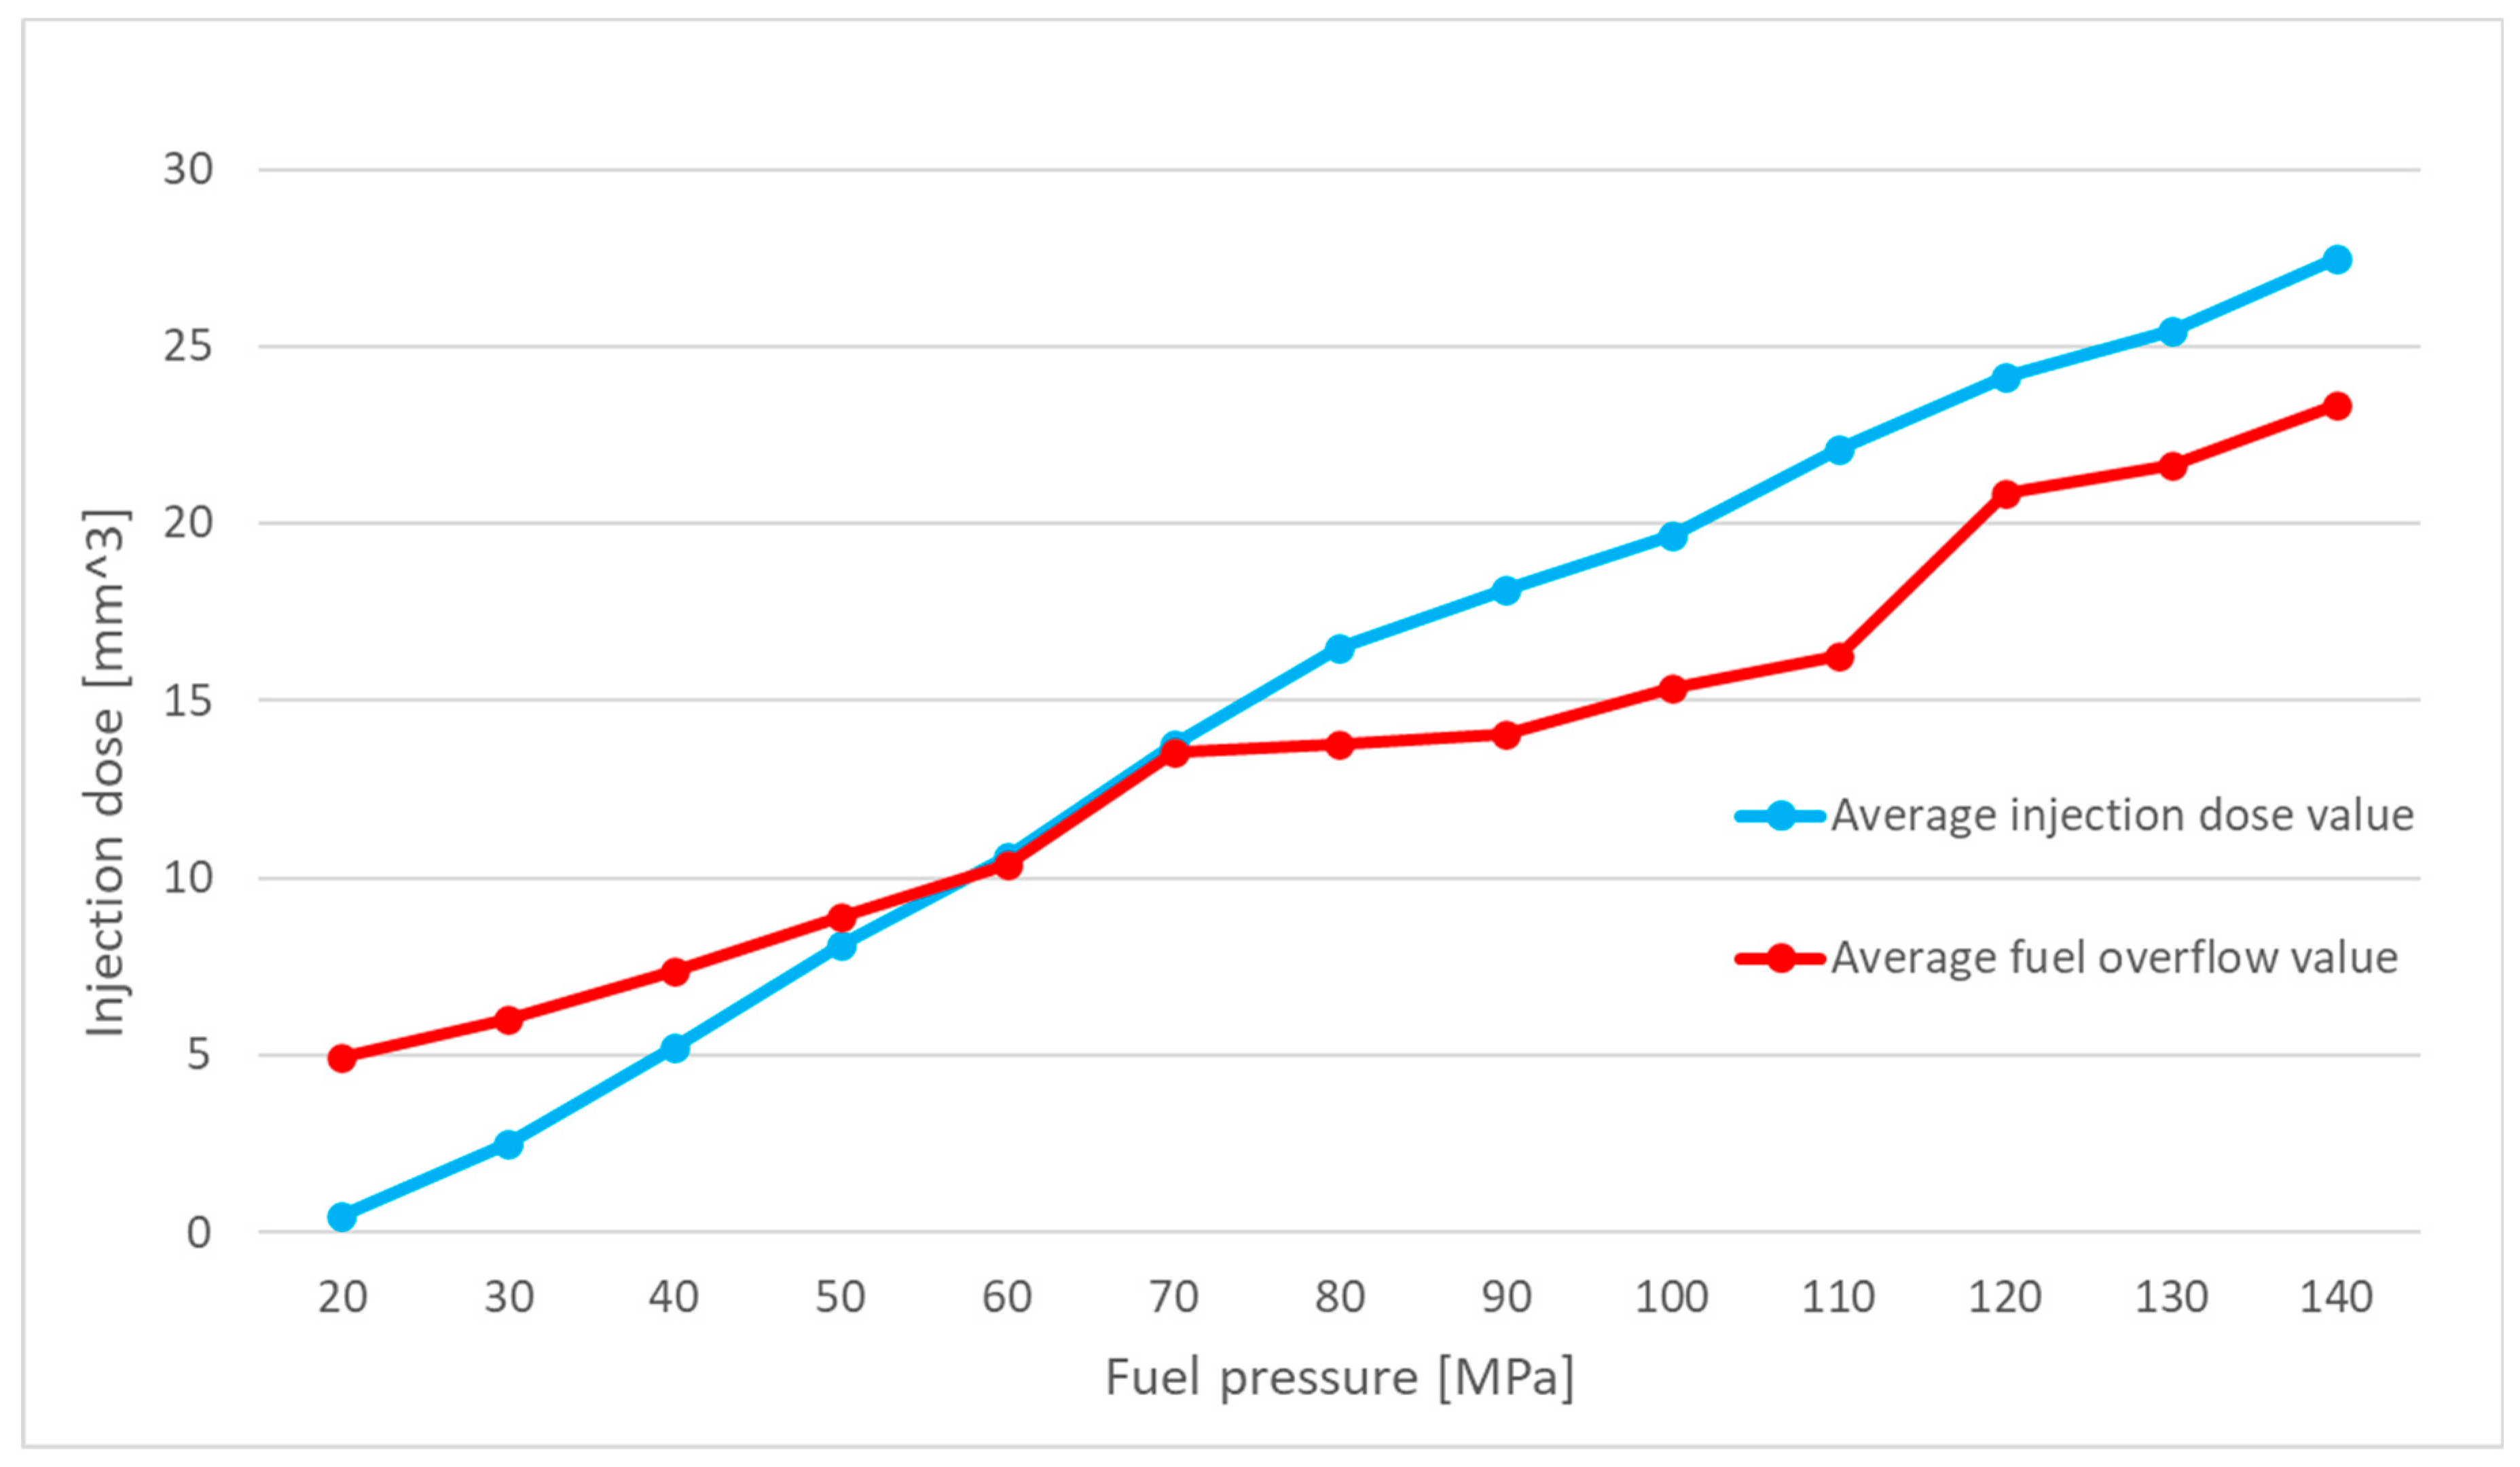
To compare the results of experimental tests with those of simulation studies, the measurement data collected so far were averaged. A graph was then generated to represent the mean injected fuel volume under the specified operating conditions of the injector. This graph, corresponding to an injector opening time of 500 µs, is presented in
Figure 3.
4. Simulation Model of the Injector
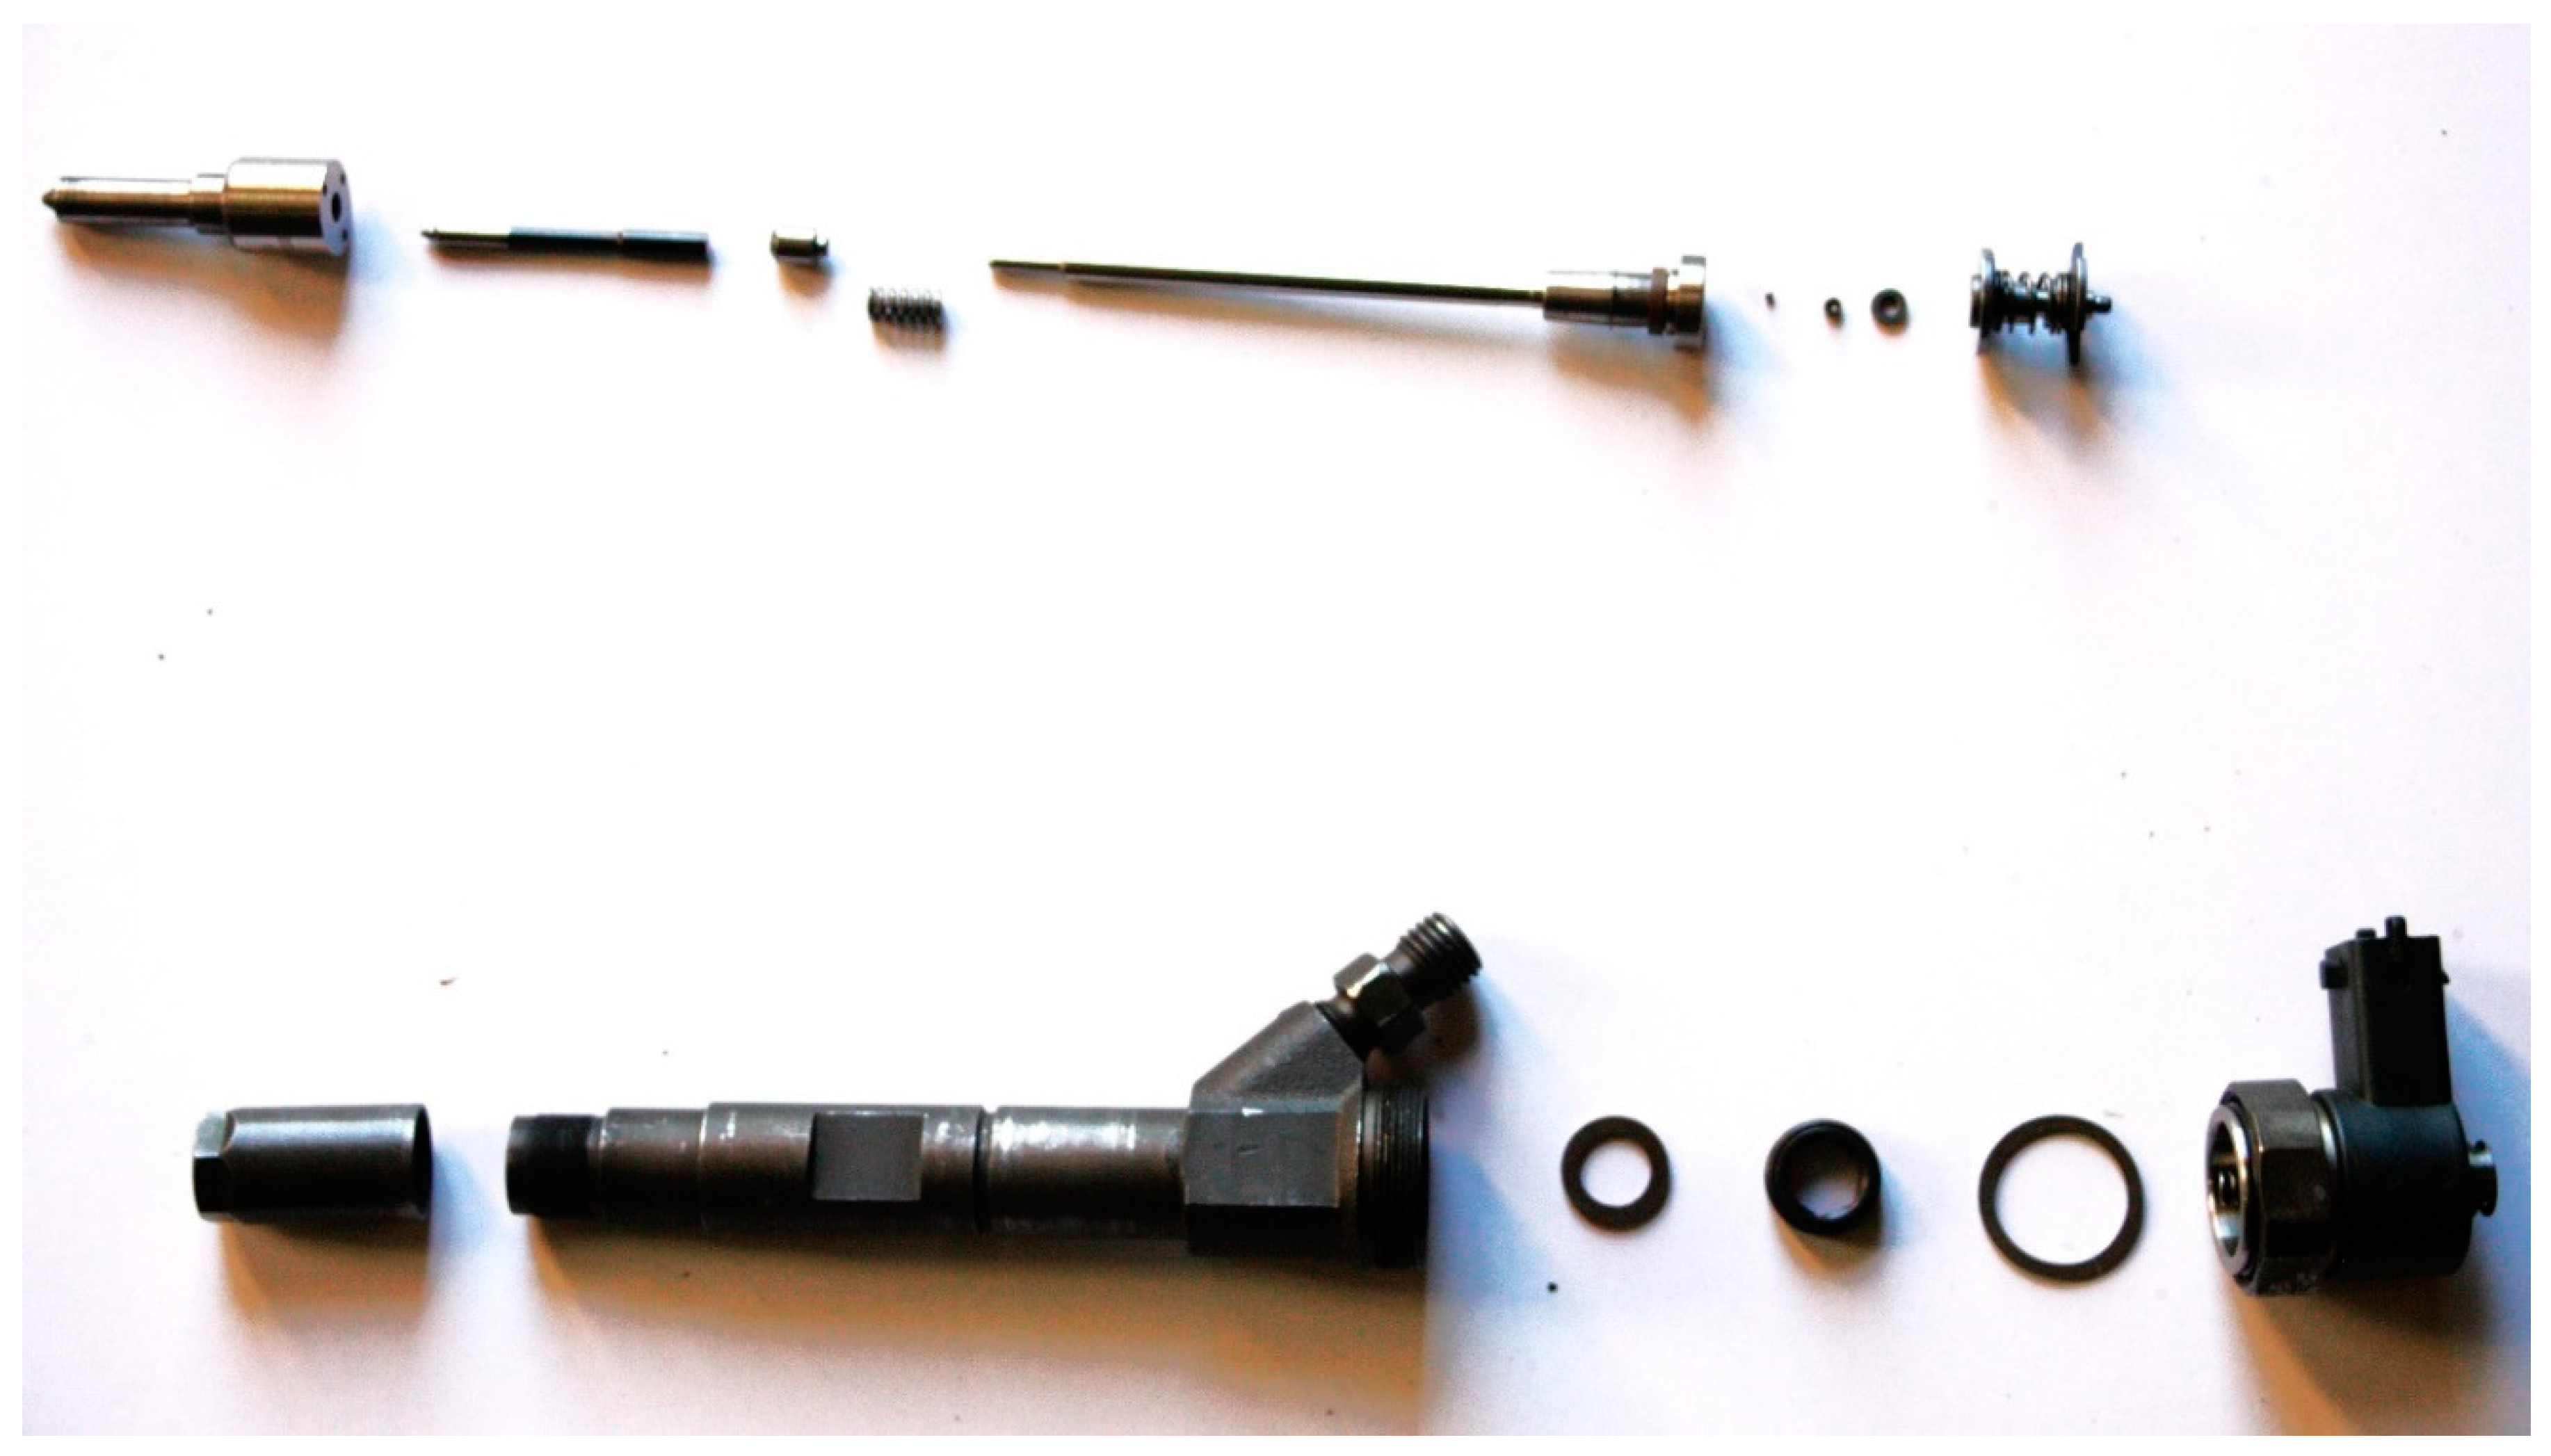
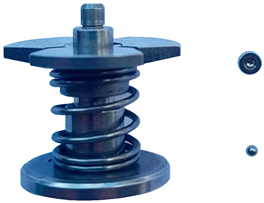
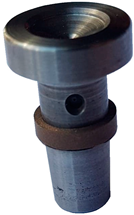
The simulation studies required the creation of a model of the electromagnetic injector in the Amesim software, using the same parameters as the injector tested on the bench. To achieve this, one of the tested injectors was disassembled into its individual components. For further studies, the key components of the injector that influence its operation were identified to accurately replicate the real injector in the Amesim model.
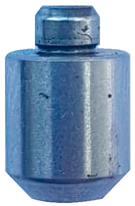
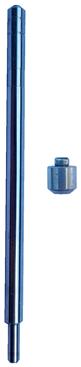
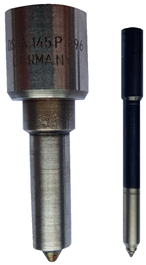
The disassembled injector components are illustrated in
Figure 4.
The individual components of the disassembled injector were subjected to mass and geometric dimension measurements. These steps were essential for the development of the injector model being studied.
Figure 5 illustrates the mass measurement of one of the components – the nozzle needle.
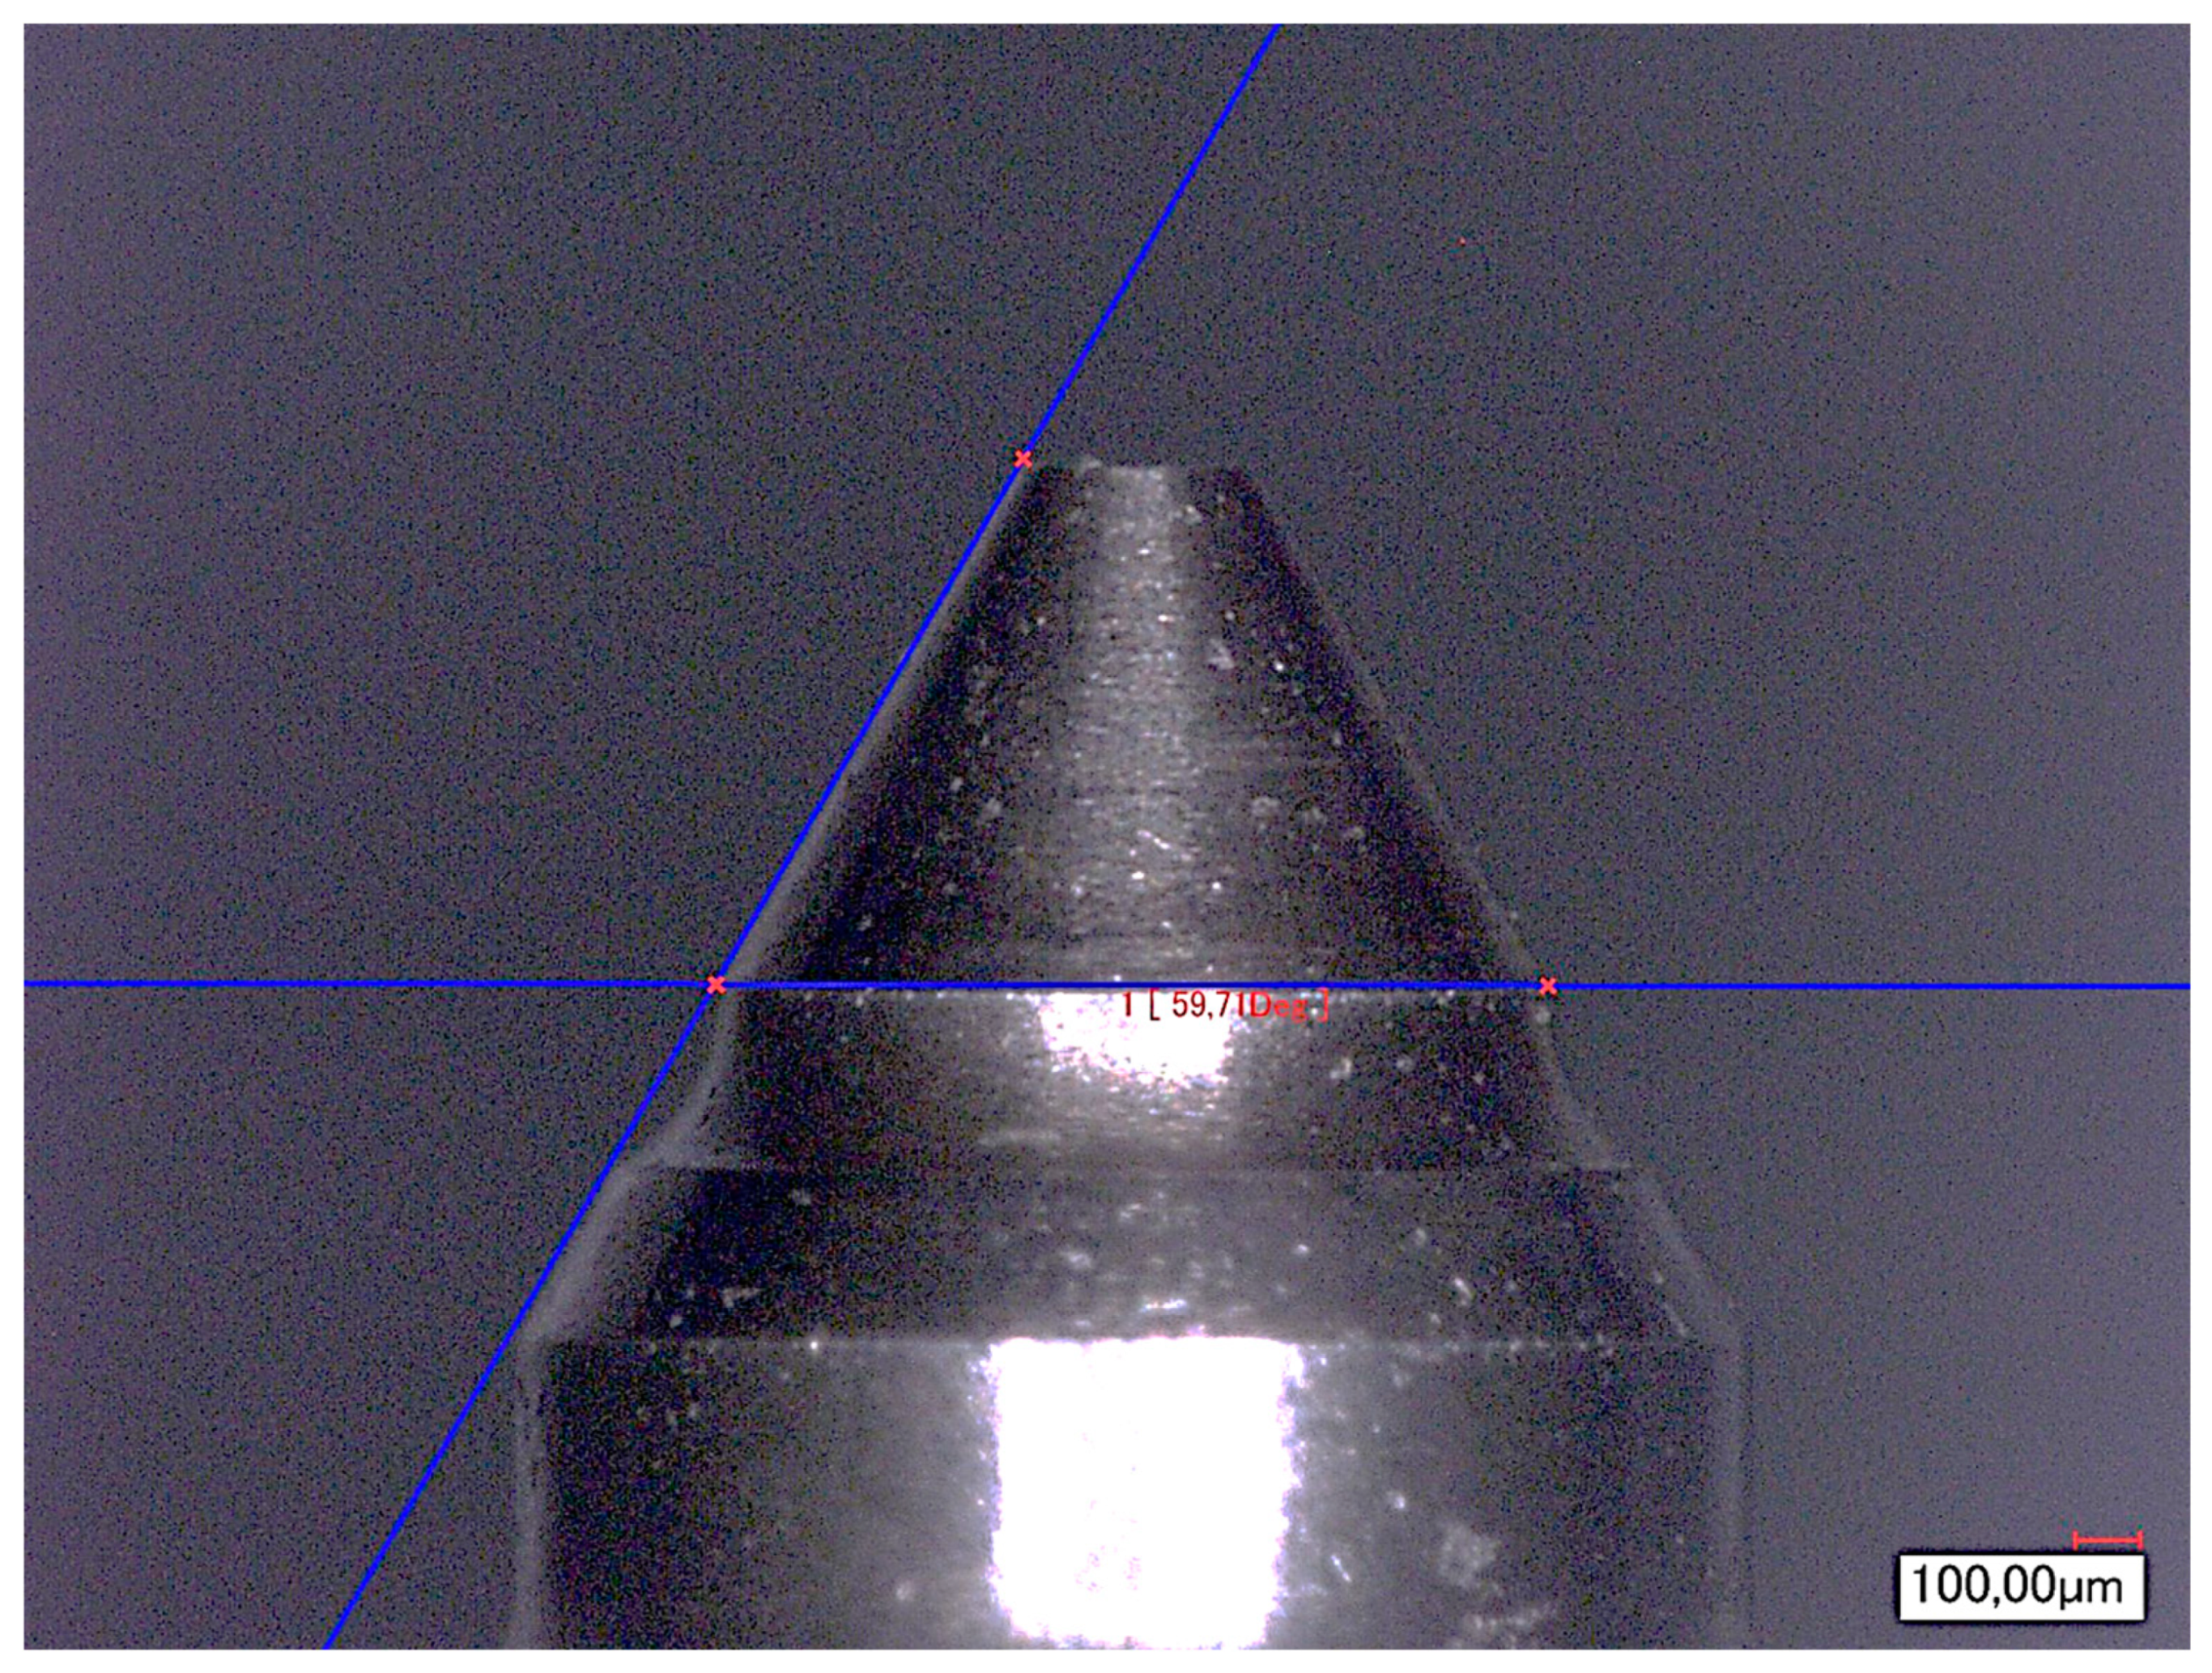
After completing the mass measurements of selected components, the next step involved measuring the geometric dimensions of key parts.
Figure 6 shows the measurement of the cone angle of the nozzle needle. Given that the nozzle contained six orifices, the diameter of each orifice was measured individually. The average diameter was then calculated and input into the simulation software. The measurements were performed using a KEYENCE VHX-6000 microscope.
Table 2 summarizes the characteristics of the individual components of the injector along with their counterparts from the Amesim software element library. For the purpose of the study, only those parameters that directly influence the injector's performance were measured. Mass measurements were conducted for the moving components due to the effect of inertia forces, which impact the speed of movement of the injector's parts. Additionally, geometric dimensions were measured for components through which fuel flows, enabling the software to calculate parameters such as flow rates through individual channels. Geometric measurements were also performed on components where fuel pressure acts on their surfaces. This was necessary to allow the software to calculate forces resulting from the pressure exerted on these surfaces.
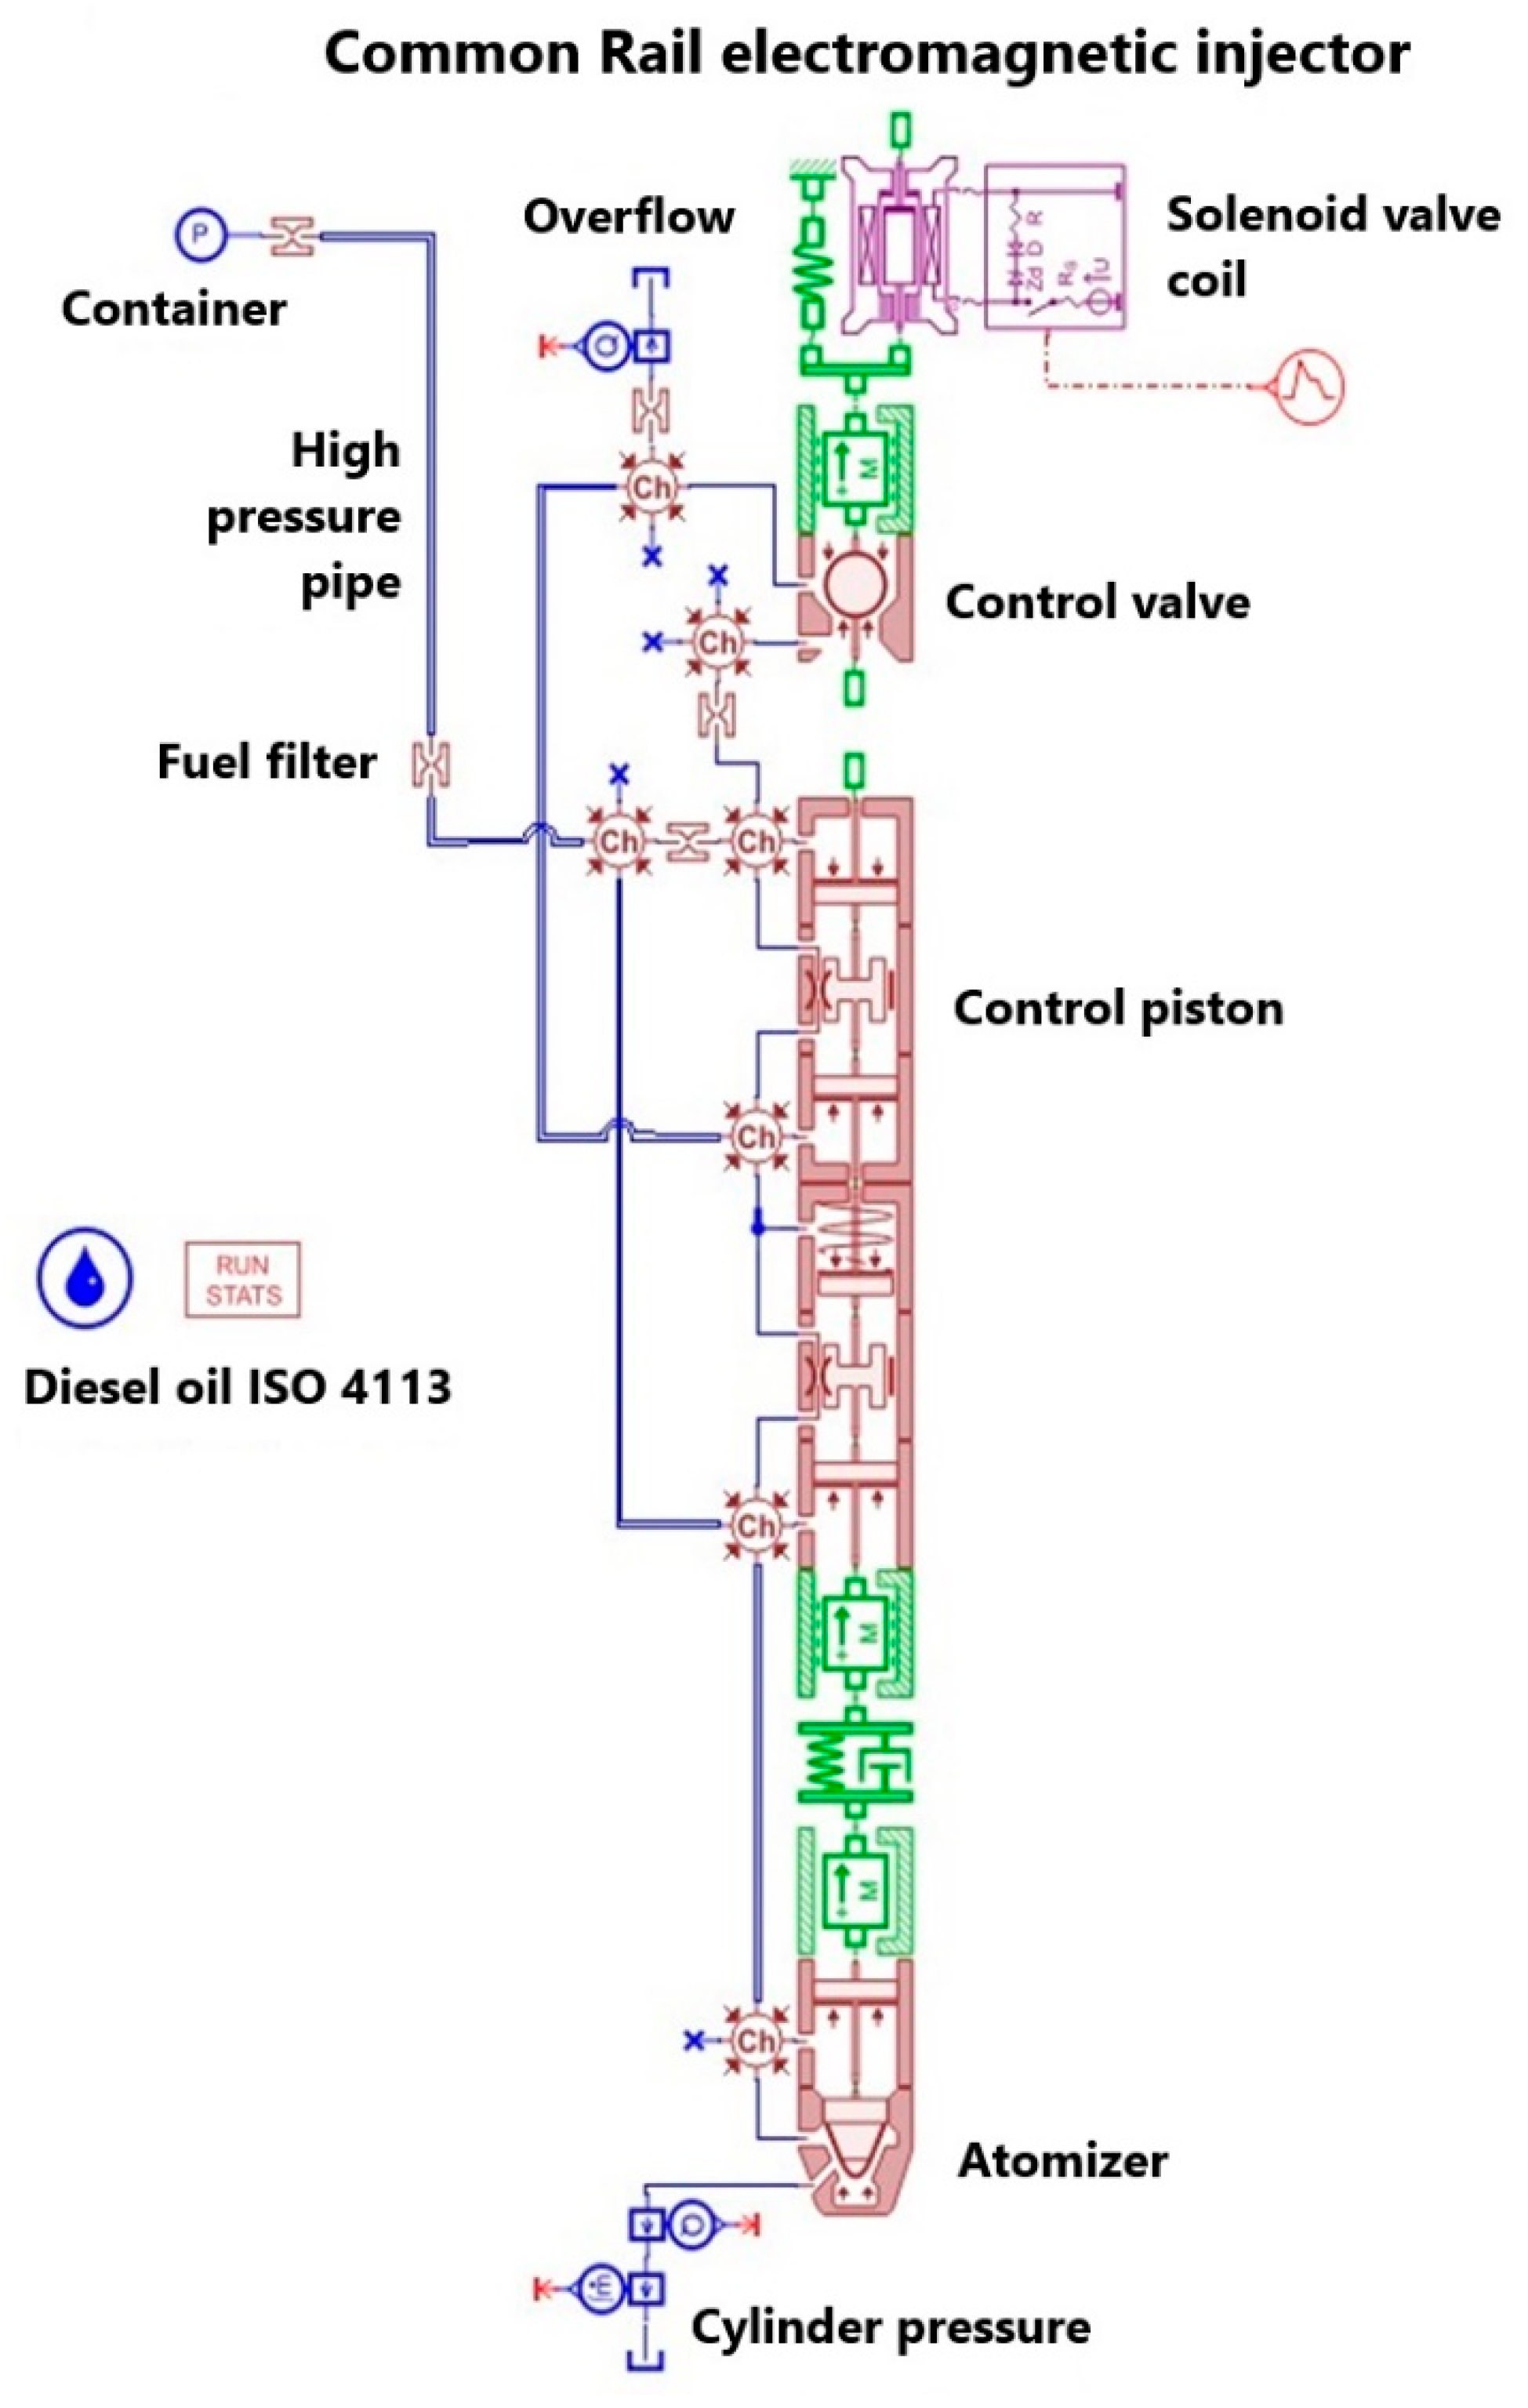
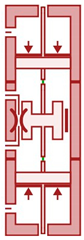
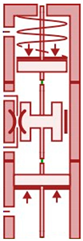
The model of the injector in question is shown in
Figure 7.
Subsequently, the determined characteristic parameters were entered into the software to construct the injector model. The next step involved inputting the operating parameters for each measurement series, in accordance with the established research plan. This included specifying the actuation times for the electromagnetic valve coil: 500 µs, 1000 µs, 1500 µs, and 2000 µs. The measurement series primarily differed in the injector opening times.
Figure 7.
Model of the electromagnetic injector in the Amesim program.
Figure 7.
Model of the electromagnetic injector in the Amesim program.
In each series, 13 fuel injection events were simulated at varying pressures, enabling the representation of different injector operating states. With four measurement series, this approach allowed for the simulation of 52 operating states (four injector opening times, each tested under 13 different injection pressures). The first injection in each series was performed at a fuel pressure of 20 MPa. For each subsequent injection, the pressure was increased by 10 MPa, with the final injection carried out at 140 MPa. This setup provided a comprehensive dataset for evaluating injector performance under a wide range of operating conditions.
In the experimental bench tests of the injector, a non-flammable water based fluid Kalibrol was used. Kalibrol is a specialized calibration fluid designed for fuel injection system testing, commonly used in test benches. Its stable viscosity ensures repeatable test results on the test bench. Being water-based, Kalibrol is non-flammable, unlike diesel fuel [
24]. In the simulation studies, a calibration fluid based on mineral oil, compliant with ISO 4113 standards, was used as the working fluid. These two fluids have similar properties [
25]. However, differences in the results between the simulation and bench tests may arise due to the slight differences in their physical characteristics. The choice of using Kalibrol in the experimental studies was primarily driven by safety considerations. For this reason, the researchers opted not to conduct tests with mineral oil-based fluids. In future studies, the test bench setup will be adapted to meet ISO standards to ensure a consistent basis for comparison between simulation and experimental results.
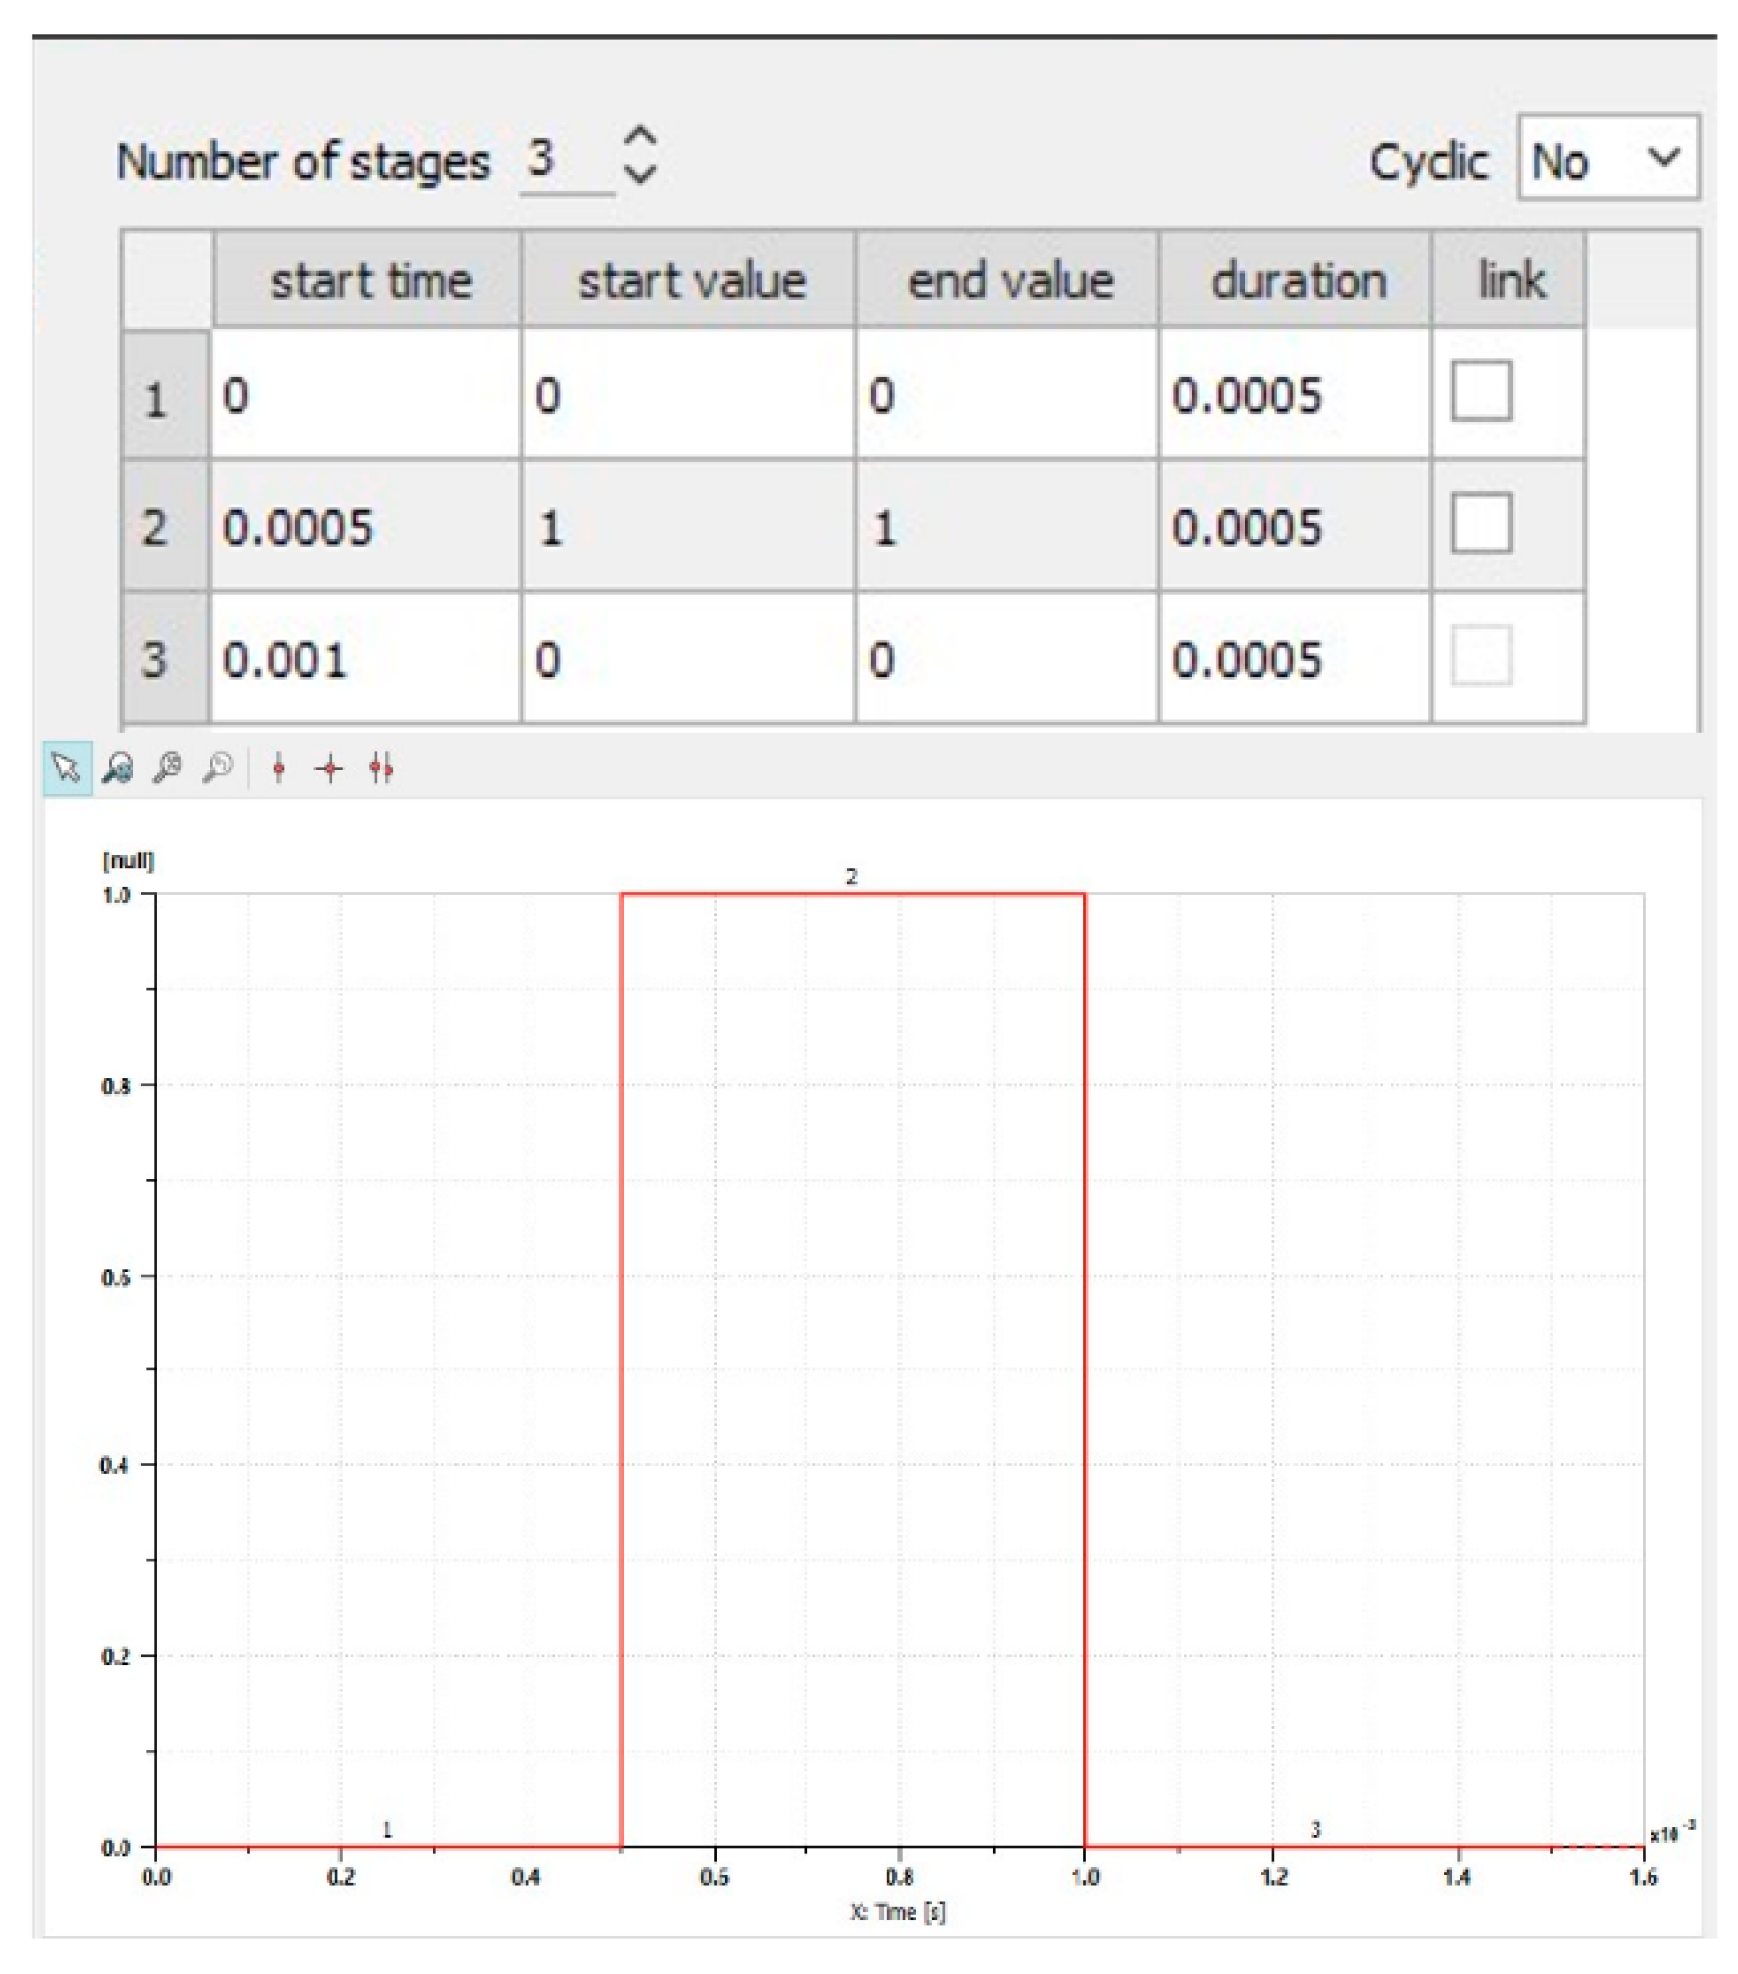
The Amesim software allows for the flexible shaping of the input signal to the electromagnetic valve coil. For the simulations, a rectangular waveform was chosen as the shape of the input signal. The interface window in Amesim used for modeling the input signal to the electromagnetic valve coil is shown in
Figure 8.
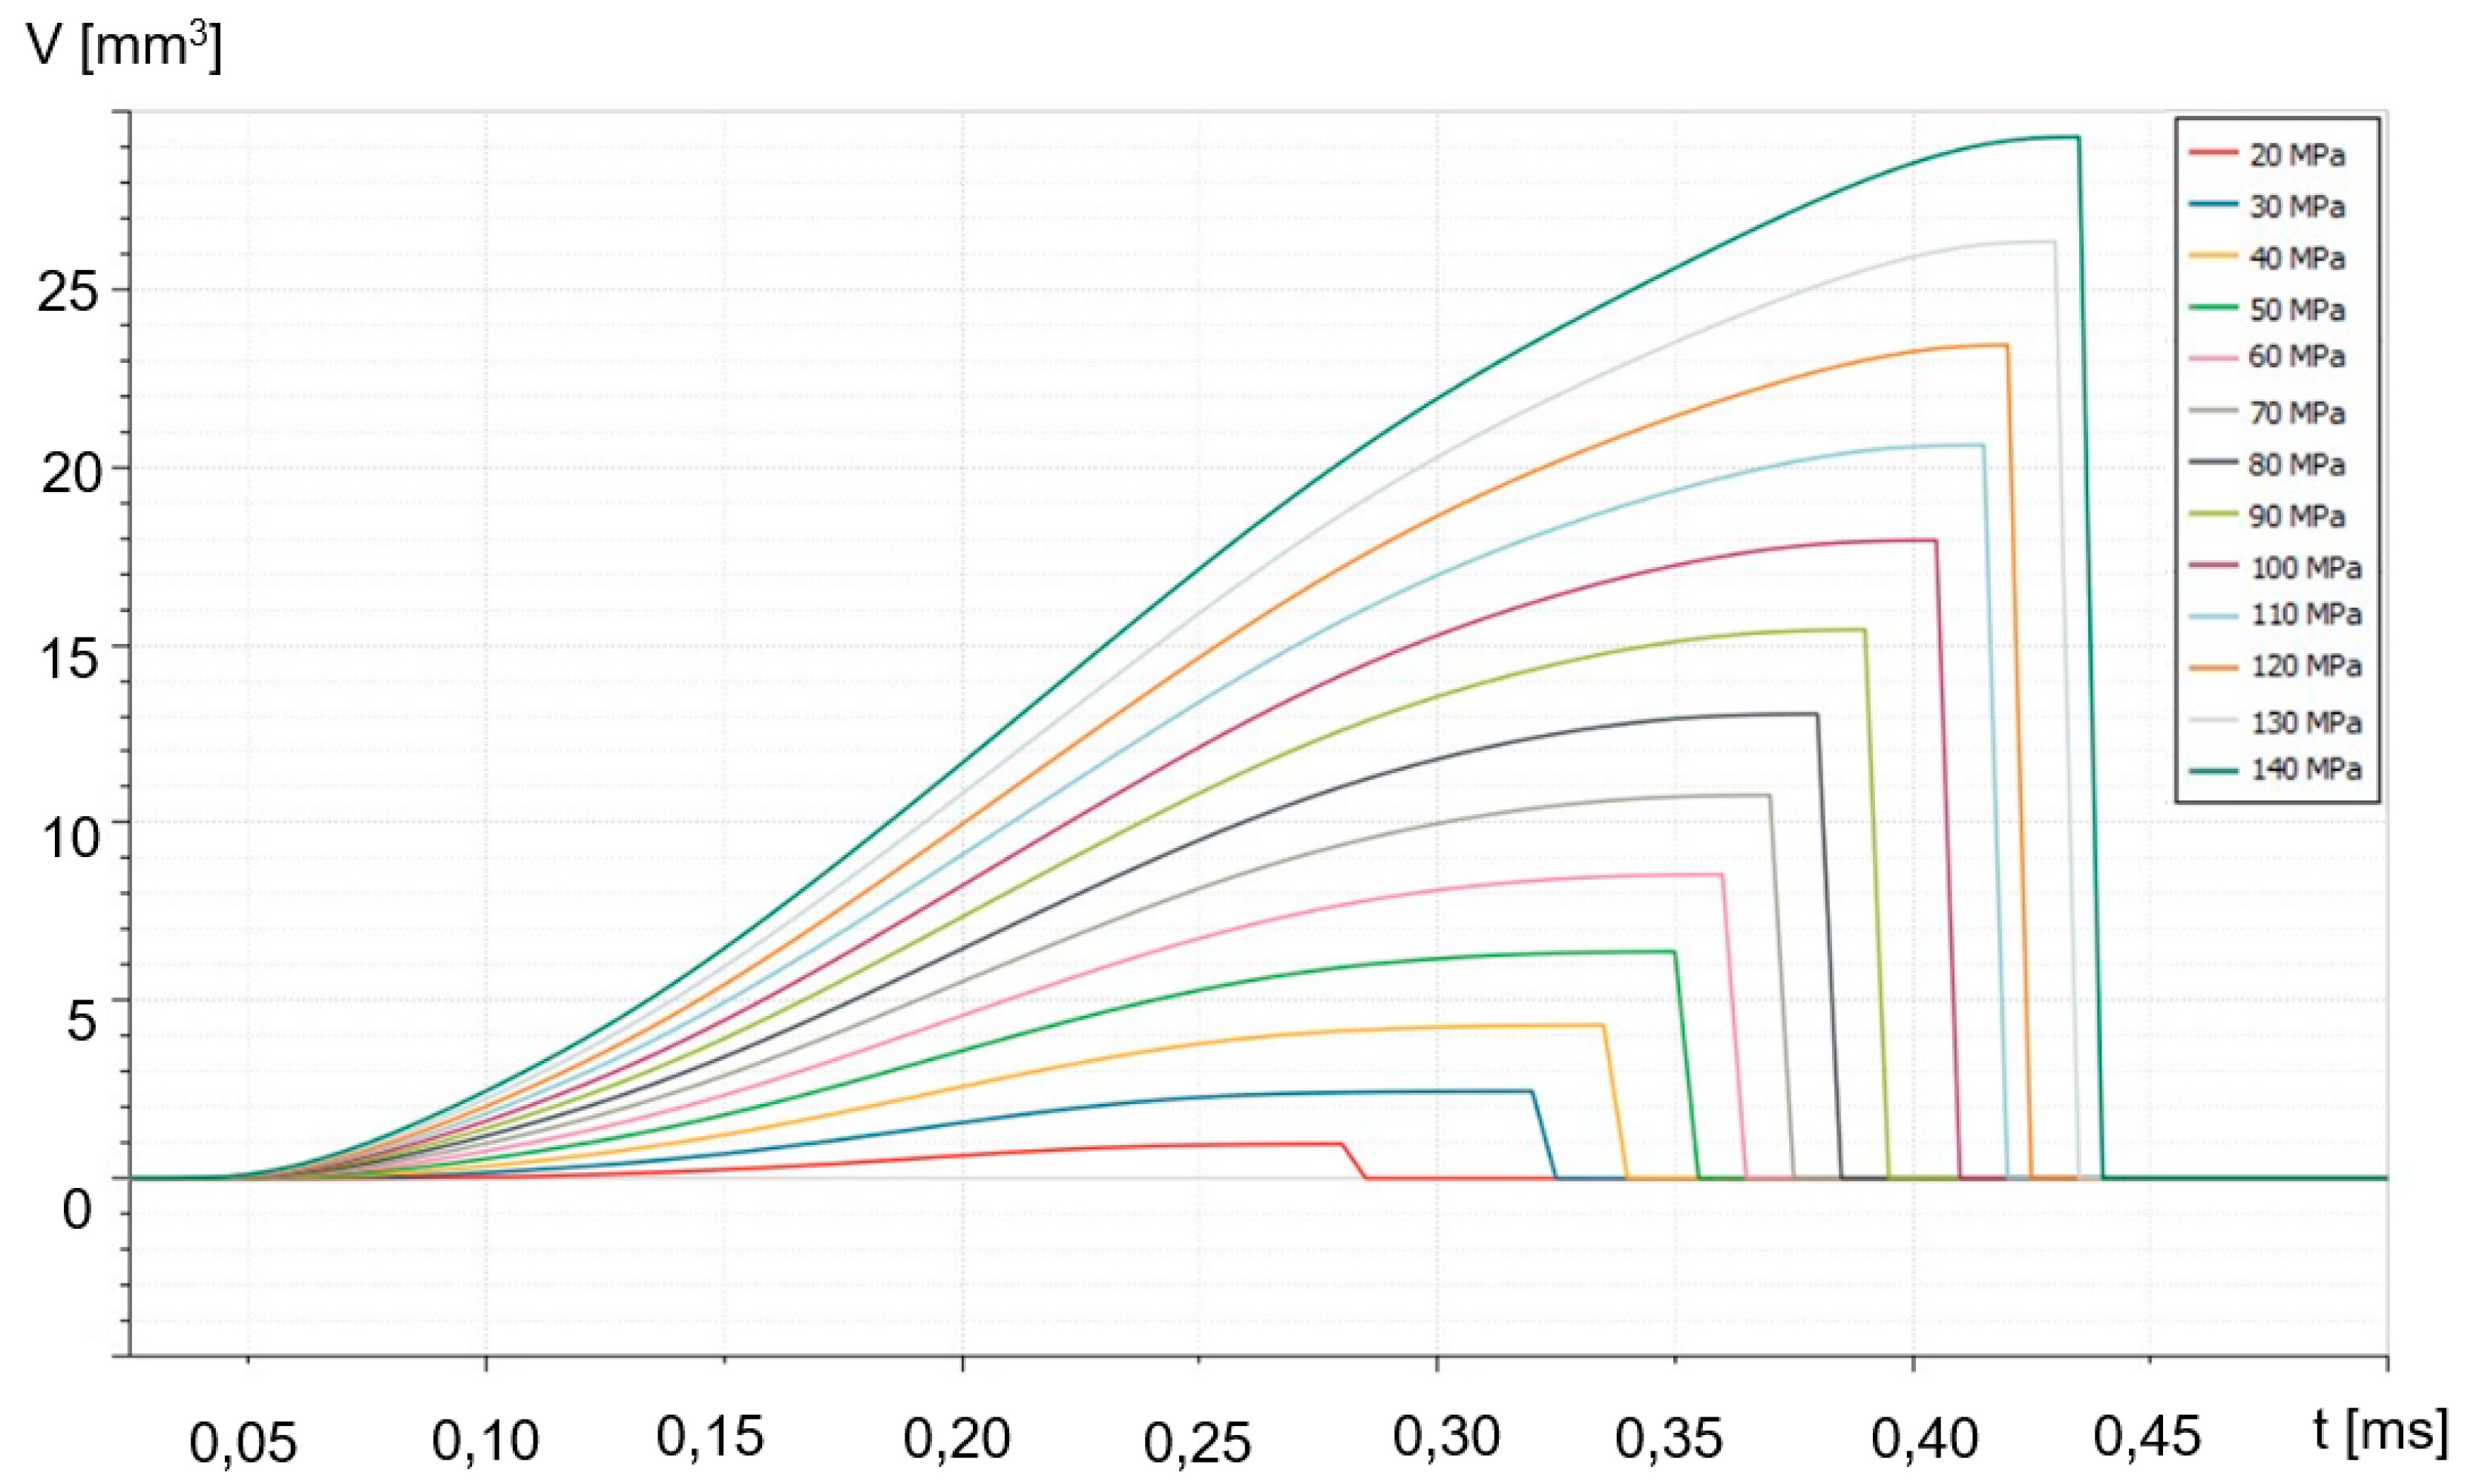
The study was conducted in series, where for a given injector actuation time, the program simulated thirteen different injector operating states. The pressure was varied from 20 MPa to 140 MPa, in increments of 10 MPa. After simulating the specified number of injections, the fuel volume "injected" during each injection at different pressures was determined from the fuel injection graphs. One such graph is presented in
Figure 9.
This process was repeated for the subsequent injector actuation times. Based on this, a graph of the injected fuel volume as a function of pressure was created for all actuation times. Additionally, a graph of flow-back volume for each measurement series was generated based on the simulation results.
The creation of fuel injection characteristics as a function of pressure for both experimental and simulation results allowed for a comparison of these characteristics at this stage. This comparison is presented in
Figure 10. A similar comparison of characteristics was made for the flow-back volume values.
5. Analysis of the Study Results
The analysis of the research results involved comparing the simulation and experimental test outcomes to validate the developed model of the electromagnetic injector. Conducting this analysis required the identification of key parameters to be evaluated. During the assessment of the results, the following parameters were considered:
- a)
fuel pressure in the Common Rail system,
- b)
injector opening time, defined as the duration of power supplied to the injector’s electromagnetic valve,
- c)
injected fuel volume,
- d)
flow-back volume.
Next, correlation plots were created to show the relationships between the injection and flow-back volumes obtained through simulation studies and experimental tests. After visualizing the data, statistical analysis was performed. This analysis involved examining the relationships between the injection and flow-back volume values obtained from simulations and those derived from experimental tests. For this purpose, the Pearson correlation coefficient was used, which is expressed by Equation (2):
where:
r – correlation coefficient,
– value of variable x in the sample,
– average of the values of variable x,
– value of variable y in the sample,
– the average of the values of variable y.
5.1. Injector Opening Time: 500 µs
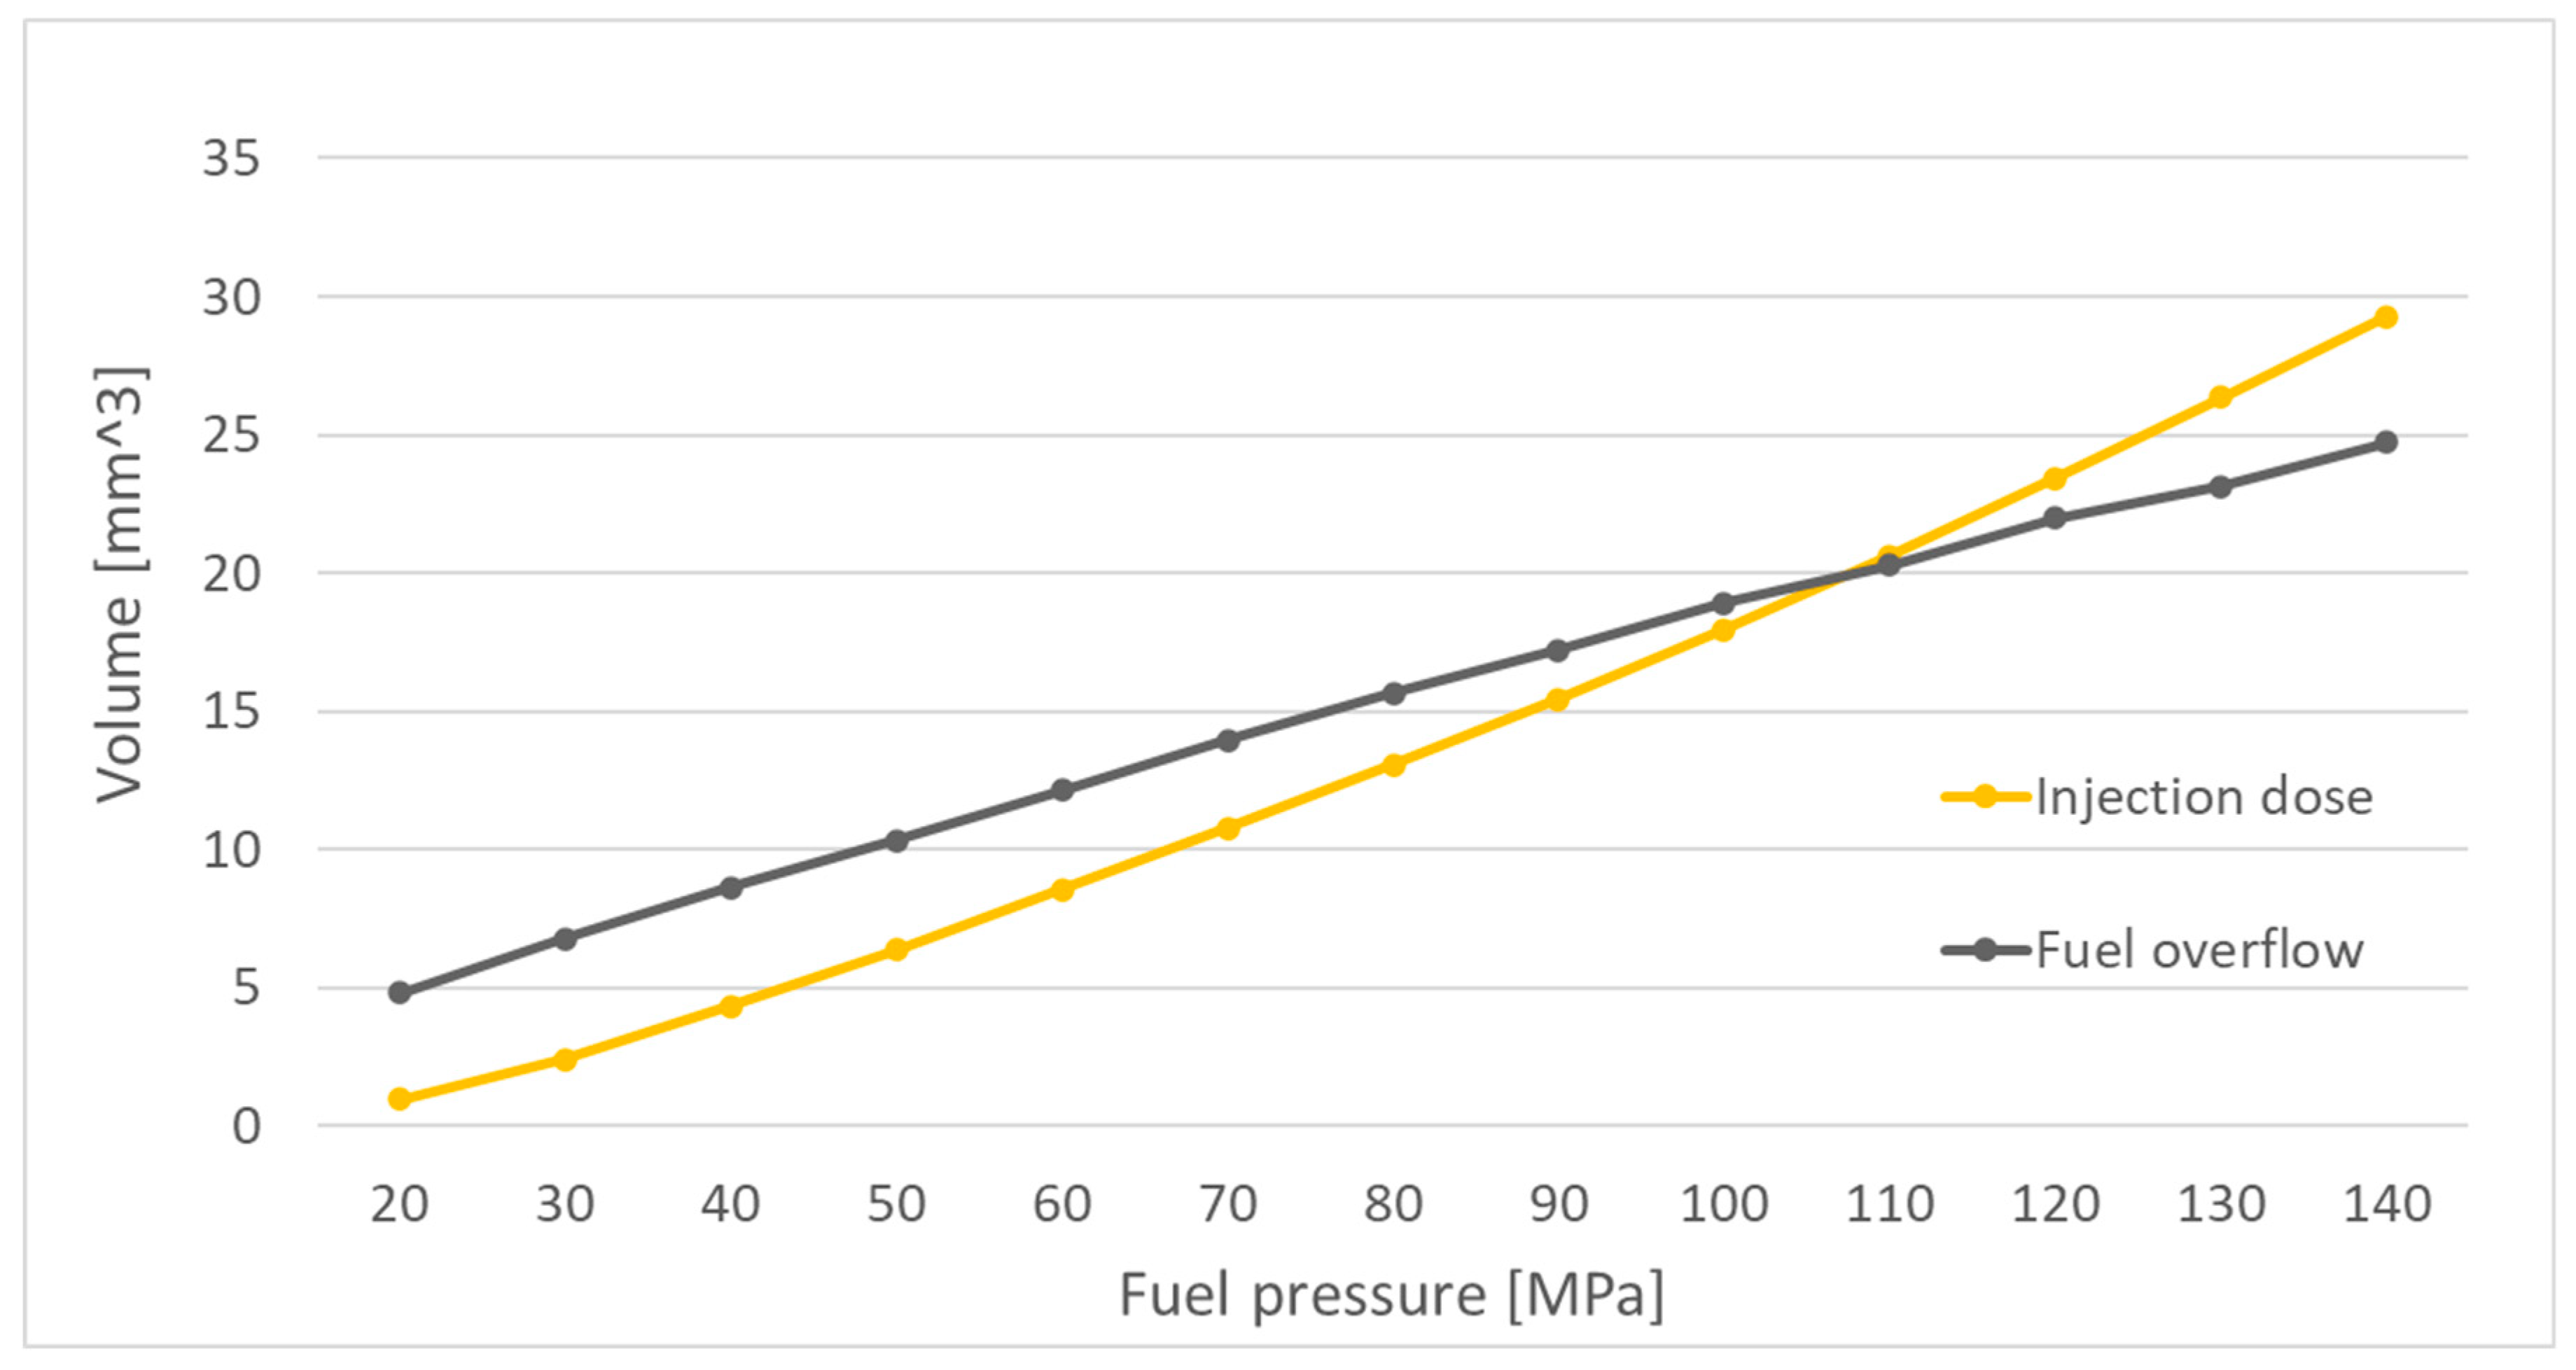
Based on the simulation data, graphs of injection volume and flow-back volume as functions of pressure were created.
Figure 11 presents the trends of changes in injection volume and flow-back volume as functions of pressure, obtained from simulations for an injector opening time of 500 µs.
The injection characteristic shown in
Figure 11 closely resembles a linear function. This shape is a result of the simplifications applied during the simulation process in the Amesim software. These simplifications assume that the injector is an ideal component, without deviations in the manufacturing of its parts. During the simulation, the software generated identical control signals without accounting for variability among injectors, such as differences stemming from IMA (Injector Mengen Abgleich) codes. Consequently, the assumption was that every injector is perfect and identical.
In the experimental bench tests with real injectors, the IMA codes were not considered by the test bench controller, and the injectors used for testing were used components. The flow-back characteristic as a function of fuel injection pressure also exhibits a nearly linear shape. Differences between the characteristics obtained from the simulation and the bench tests result from the simplifications assumed by the simulation software. It does not take into account the inherent variability in the production of injectors.
From the software's perspective, each injector is identical, meaning that under the same control signal, the simulated injector will always respond in the same way. It will open and close at the same speed, maintain the same injection pressure, and consequently inject the same amount of fuel every time. In reality, however, each manufactured injector has unique characteristics, and to reduce the impact of production variability on the injection process, IMA codes are used. The laboratory test bench used in this study did not account for IMA codes in its controller. Collectively, these factors contributed to the observed differences in the shapes of the characteristics obtained from the simulations and the experimental tests.
5.2. Injector Opening Time: 1000 µs
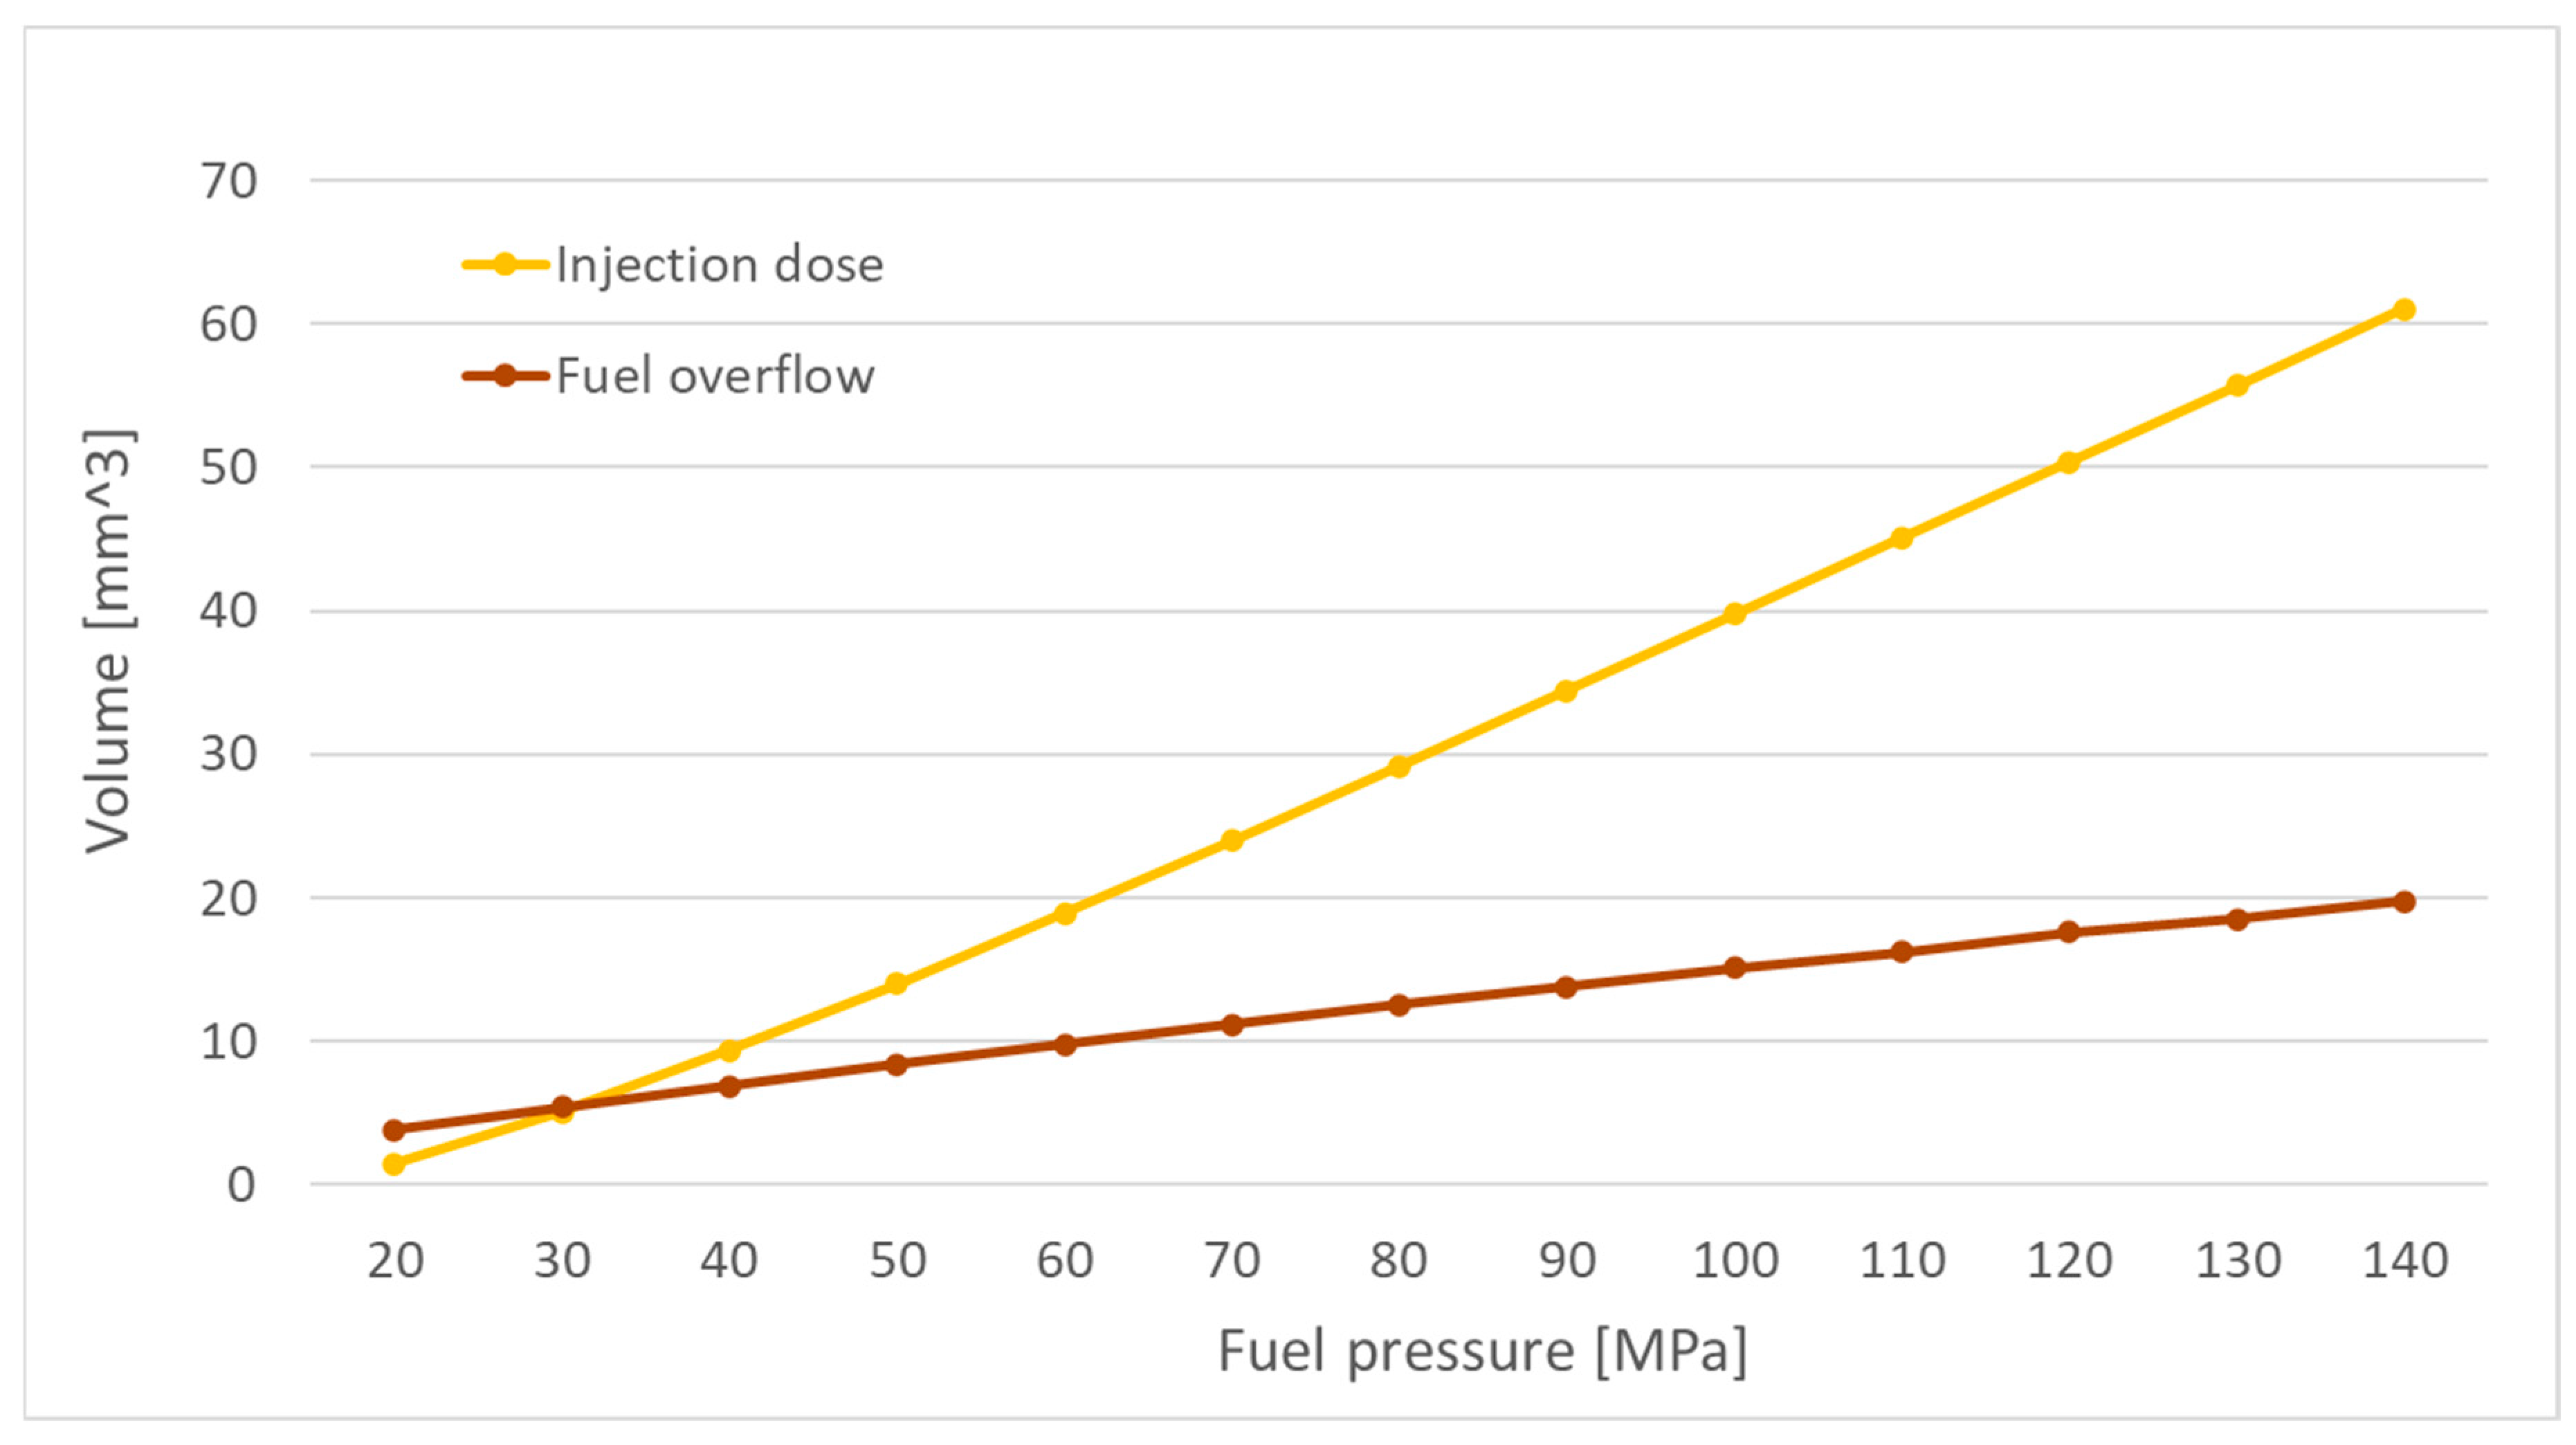
Based on the simulation data, graphs of the injection volume and flow-back volume as functions of pressure were created.
Figure 12 shows the trends of injection volume and flow-back volume as functions of pressure, obtained from simulations for an injector opening time of 1000 µs.
In the graph showing the injected fuel volume, at the lower range of injection pressures, smaller injection volumes are observed compared to the corresponding pressures in the rest of the graph. This may be due to the simulation program calculating that the lower pressure acting on the nozzle needle surface results in slower needle movement and, consequently, slower injector opening.
As a result, the longer opening phase of the injector constitutes a larger portion of the total actuation time, leading to a reduced volume of fuel being sprayed by the injector. A similar trend was observed in the other measurement series, i.e., for injector opening times of 1500 µs and 2000 µs.
6. Validation Results of Simulation and Experimental Studies
Figure 13 compares the results of simulation and experimental tests. The highest correlation between the simulation and experimental injection characteristics is observed for an injector opening time of 500 µs. As the injector opening time increases, the correlation decreases. This could be attributed to potential inaccuracies in the simulation model, which does not account for thermal effects influencing the results or wave phenomena occurring in fuel lines, as might have been present during laboratory tests.
The increasing discrepancies between the injection characteristics as the injector opening time lengthens may also be due to the impact of fuel temperature, which could have risen during the experimental tests. Longer injector opening times result in fuel flowing through the injector's channels for an extended period. The friction between the flowing fuel and the injector components could contribute to a temperature rise. Consequently, the effect of friction on fuel temperature may be greater for longer injector opening times.
Figure 13.
Graphs of the average value of the injected fuel volume as a function of the fuel injection pressure for simulation and bench tests.
Figure 13.
Graphs of the average value of the injected fuel volume as a function of the fuel injection pressure for simulation and bench tests.
A difference in fuel temperature between tests conducted at different injector opening times could have been sufficient to affect the fuel’s viscosity and density. Any change in these parameters, especially in a precise device like an injector, could have noticeably influenced the injection characteristics. This may explain the reduced correlation between the simulation and experimental results for longer injector opening times.
There are noticeable differences in the shape of the curves themselves, as the simulation-based injection characteristics resemble a linear function, while the real-world injection characteristics are closer in shape to a logarithmic function. This means that in the experimental results, there are larger changes in injection volume in the initial part of the graph, whereas for each subsequent value of the function’s argument (in this case, pressure), the increments in injection volume become progressively smaller. This shape can be attributed to increased flow resistance, as higher injection pressures lead to a greater pressure difference between the nozzle channels and the combustion chamber. This pressure difference results in increased flow velocity, which generates higher hydrodynamic resistance within the injector’s channels, thereby limiting the flow rate. Additionally, high-pressure, high-velocity liquid flows can lead to cavitation. Cavitation may reduce the effective flow area of the injector nozzle orifices, which in turn restricts the flow rate.
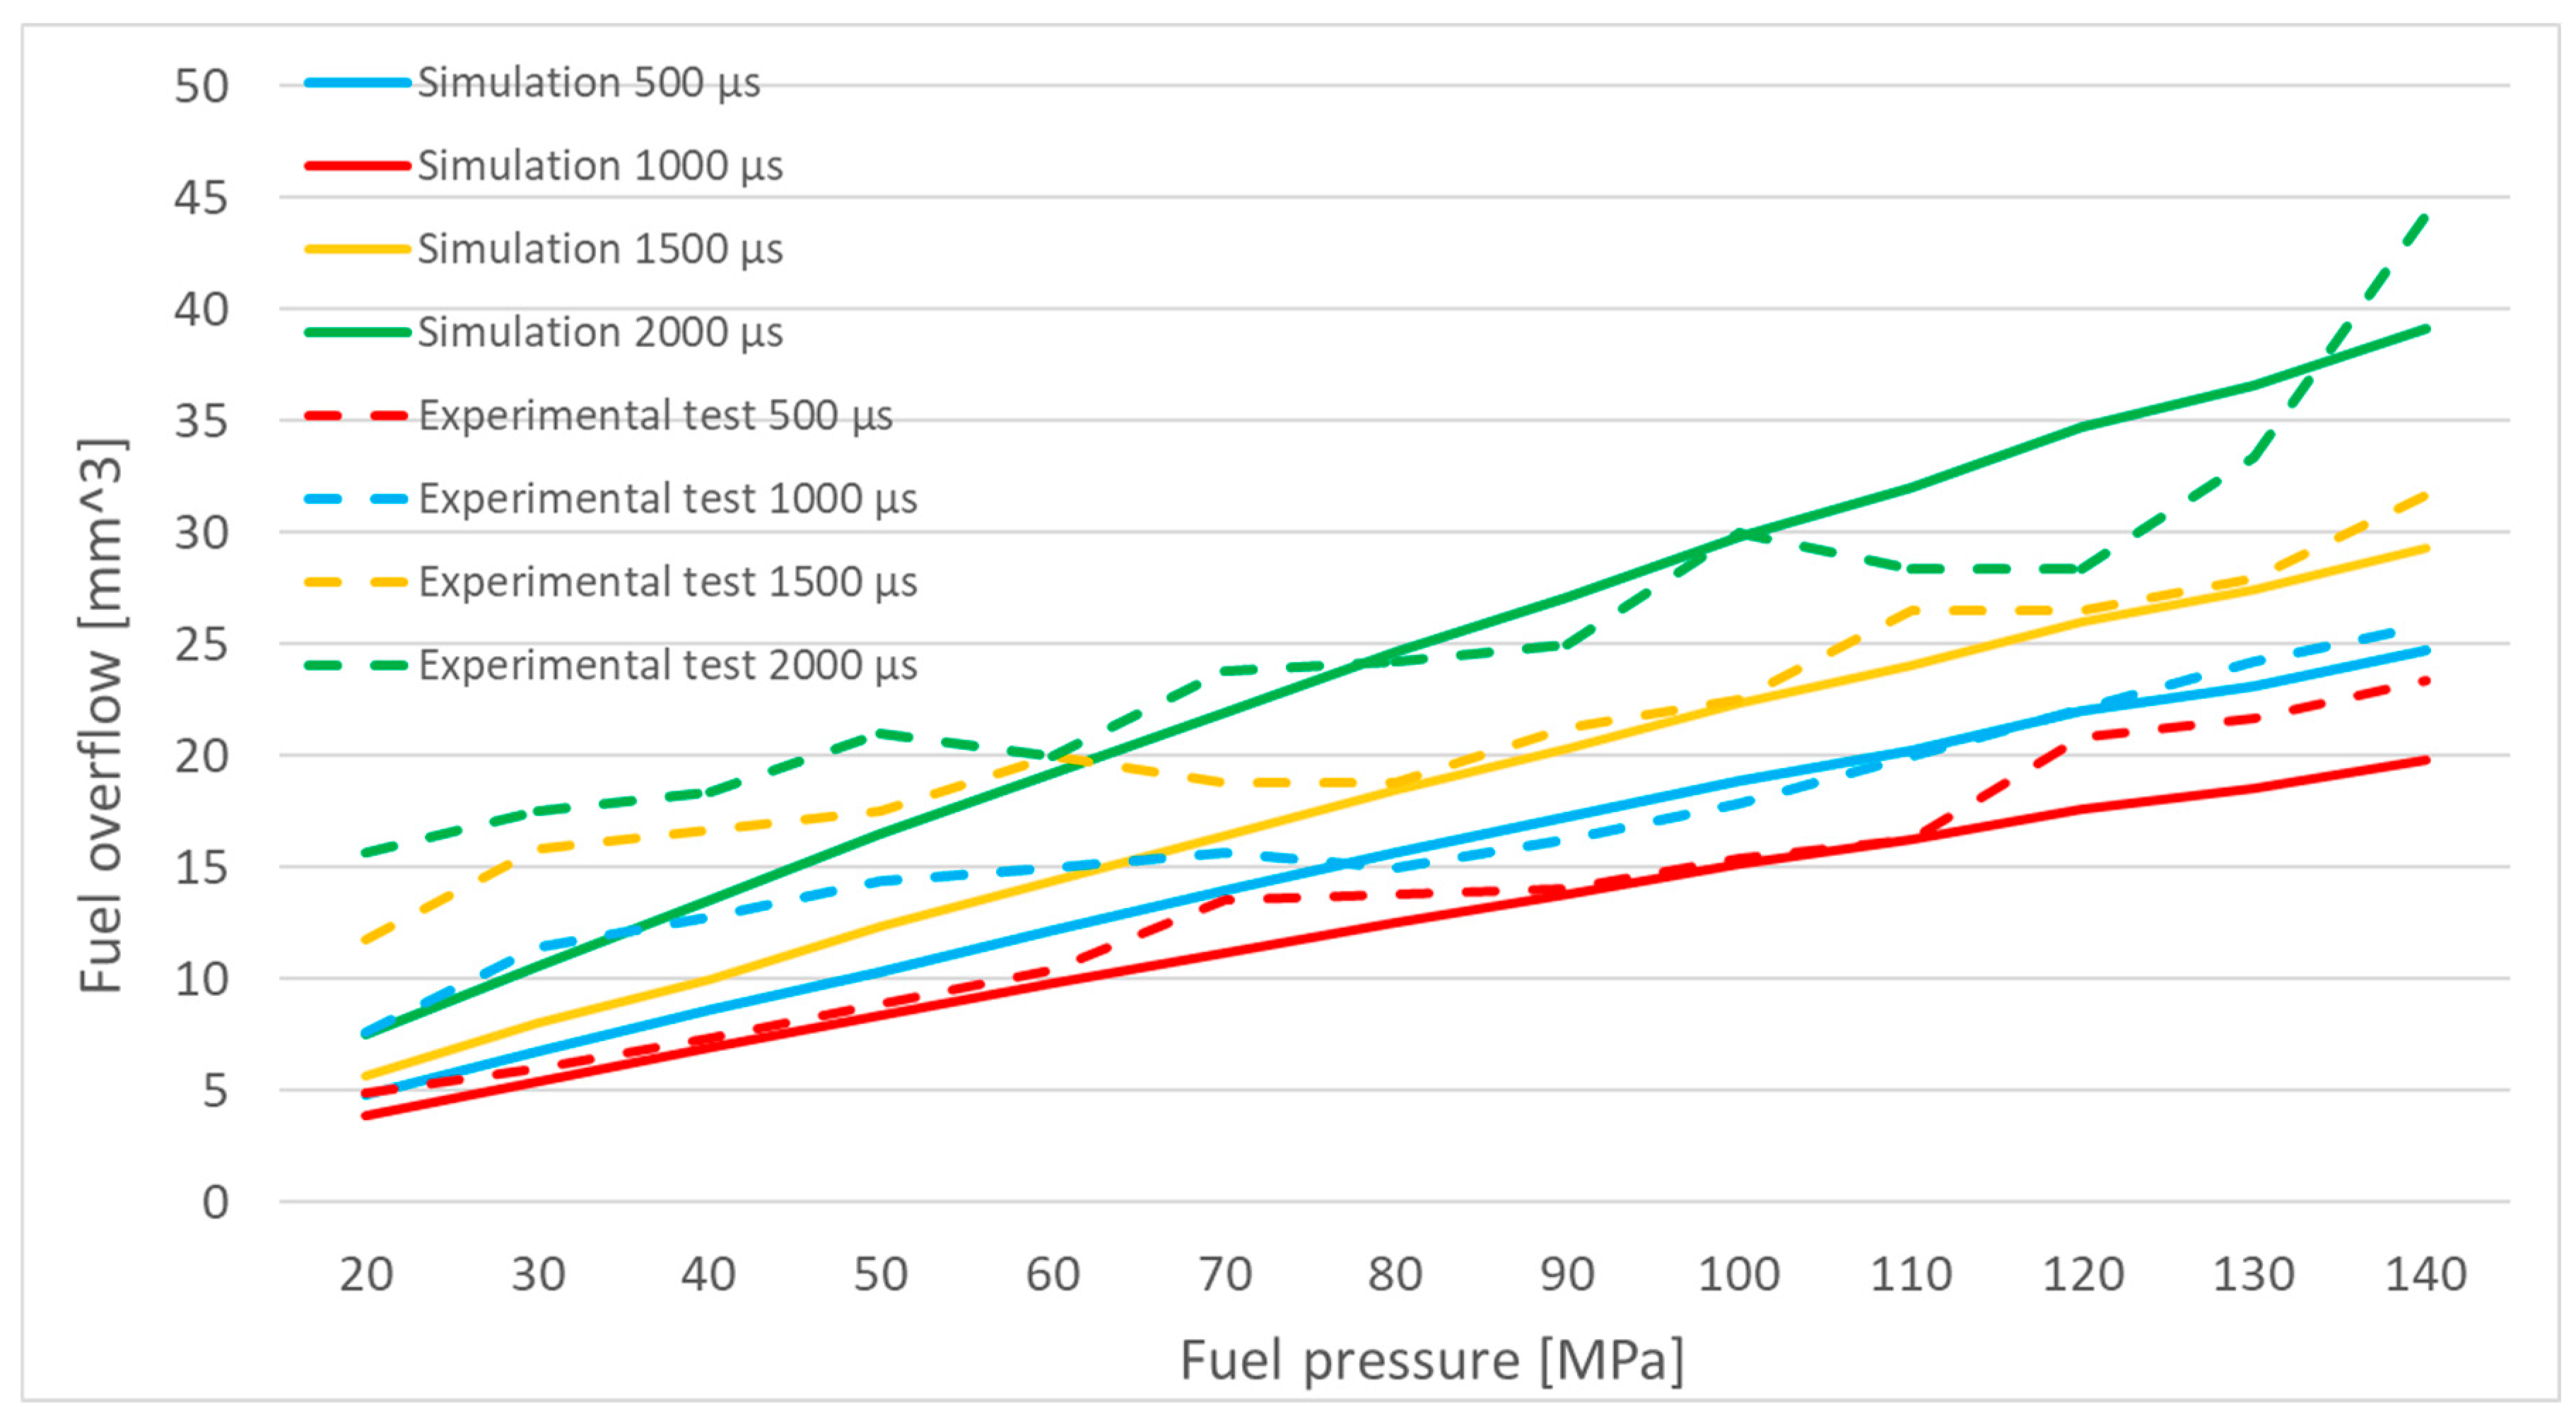
Figure 14 presents a graphical comparison of the mean flow-back volume as a function of injection pressure. A higher correlation between simulation and experimental results is noticeable here. While the correlation coefficient for an injector opening time of 500 µs is comparable for injection volume and flow-back volume, for injector opening times of 1000 µs and 1500 µs, the correlation coefficient for flow-back volume is higher. Specifically, the coefficient is 0.96 for flow-back volume, compared to 0.93 and 0.95 for injection volume, respectively. This increased correlation for flow-back volume may result from fewer influencing factors. Flow-back volume is largely determined by the fit between interacting components and the wear of tribological interfaces, which are less variable compared to the more complex dynamics affecting injection volume.
6.1. Comparative Analysis of Overflow Volume Characteristics Based on Simulation and Experimental Studies
For the experimental tests, the curve corresponding to an injector opening time of 500 µs is the closest to the trend predicted by the simulation. This applies to both the injection volume graphs and the flow-back volume graphs.
For the remaining curves, differences in the shapes of the characteristics resulting from simulations and experimental tests are noticeable.
Table 3 presents the correlation coefficients for the various measurement series, highlighting the degree of similarity between the results of simulations and experimental tests.
7. Conclusion
The Common Rail system, while being the most advanced fuel injection system developed to date, is still not perfect and requires further refinement. This is evidenced by the varying injection volumes delivered by different injectors at the same fuel pressure. Such discrepancies directly impact the emission of toxic exhaust components and the overall efficiency of engines.
Considering the precision and complexity of modern injectors, it is economically justified to replace the development and testing of physical prototypes with computer simulations. The Amesim software enables quick and straightforward analysis of the impact of various geometric parameters on the injection process and the volume of injected fuel. This approach helps avoid the high costs associated with building an excessive number of prototypes, which can instead be modeled at a significantly lower cost.
The research objective was achieved. The simulation-based injection characteristics were reproduced with a high level of accuracy. The correlation coefficients between the simulation and laboratory results for both injection volume and flow-back volume exceeded 90% for each injector opening time.
The simulation-based injection characteristics are generally consistent with the real-world results. For each injector opening time, some deviations are observed in the characteristics. At a short injector opening time (500 µs), the simulation results for injection volume align most closely with the experimental results, achieving a correlation coefficient of 0.99. This indicates that at shorter injector opening times, the simplifications assumed in the model are less significant and do not have a substantial impact on the injected fuel volume at a given fuel pressure.
For longer injector opening times, the simulation-based characteristics differ more significantly from those obtained through experimental tests. This discrepancy may result from the adopted simplifications, whose impact becomes more pronounced as the injector opening time increases. Additionally, these simplifications may reduce the model's ability to account for pressure variability inside the injector during injection and the significance of the hydraulic phenomena occurring within it.
The discrepancies between the simulation and experimental results are attributed to an insufficient number of measurements of the tested injector. Factors that may have influenced the accuracy of the model include assumptions made during the study, such as adopting the parameters of the electromagnetic coil without prior measurement of its electrical properties. This was due to the level of study advancement and the availability of specialized measuring equipment. To minimize these discrepancies, it is necessary to conduct more advanced research, expand the scope of the studies, and align the tests with global standards.
The varying degrees of wear in the injectors used influenced the results of the laboratory tests, as the fuel flow characteristics through the nozzle varied for each injector, affecting their injection efficiency. The differing levels of injector wear also resulted in variations in the flow-back volumes of each injector.
The discrepancies between the characteristics of individual injectors also stem from the fact that each injector was assigned a different IMA code. The controller used in the test bench was unable to account for the flow characteristics of each injector in its memory. As a result, all injectors were powered with the same voltage and current signal, which highlighted the differences in manufacturing precision between the injectors.
During the experimental tests, temperature variations may have occurred as a result of thermodynamic phenomena inside the injector. These changes could have contributed to the discrepancies between the simulation-based injection characteristics and those obtained from the experimental tests.
The developed injector model is sufficiently accurate to be used for analyzing the impact of design parameters on injector performance. However, to enable precise prediction of injection characteristics, the model needs to be calibrated and modified. This involves measuring each individual component of the injector and determining all coefficients that regulate the injector's operation, including the determination of flow coefficients within the injector.
References
- Kluczyk M., Grządziela A., Vibration diagnostics of common rail injectors, Journal of Marine Engineering and Technology, 16 (4), p.177-184, 2017. [CrossRef]
- Zbarcea O., Scarpete D., Alternative fuels for diesel engines and their impact on engine emissions. A literature review, Conference: IV International Scientific Conference "Engineering. Technologies. Education. Security", 2016.
- Varella R. A., Duarte G., Baptista P., Sousa L., Villafuerte P. M., Comparison of Data Analysis Methods for European Real Driving Emissions Regulation, SAE Technical Papers, 2017. [CrossRef]
- Grządziela A., Zaleska-Fornal A., Kluczyk M., Diagnostic Model of Fuel Installation of Marine Diesel Engine, Transactions on Maritime Science-toms 6 (2) , p.93-108, 2017. [CrossRef]
- Karczewski M., Szczęch L., Influence of the F-34 unified battlefield fuel with bio components on usable parameters of the engine, Maintenance and Reliability, 18 (3), p. 358–366, 2016. [CrossRef]
- Xu R., Ma F., Li L., Yang W., Zhang Y., Research on fuel injection characteristics of common rail system based on high pressure pipeline integration and matching, Energy Science & Engineering, Vol. 12, Issue 4, p. 1446-1461, 2024. [CrossRef]
- Kalchenko V., Kolohoida A., Pasov G., Sira N., Klimienko V., Computer modeling and software research of car and engine parts, Automobile Transport, Vol. 52, p. 14-24, 2023. [CrossRef]
- Szabłowski S, Mechatronic designing in the environment Simcenter Amesim 1D, Dydaktyka Informatyki, Vol. 15, p. 133-140, 2020. [CrossRef]
- Le C., Xiaobing M., Zhexuan M., Investigation on the Nonlinear Control System of High-Pressure Common Rail (HPCR) System in a Diesel Engine, Journal of Physics Conference Series, Vol. 976, 2018. [CrossRef]
- Claudio D., Coppo M., Accurate Modelling of an Injector for Common Rail Systems, Book: Fuel Injection, 2010, ISBN: 978-953-307-116-9. [CrossRef]
- Solarino J. A., Mata C., Armas O., Avila C., A zero-dimensional model to simulate injection rate from first generation common rail diesel injectors under thermodynamic diagnosis, Energy, Vol. 158, p. 845-858, 2018. [CrossRef]
- Wang H. P., Zheng D., Tian Y., High pressure common rail injection system modeling and control, ISA Transactions, Vol. 63, p. 265-273, 2016. [CrossRef]
- Huber B., Ulbrich H., Modeling and Experimental Validation of the Solenoid Valve of a Common Rail Diesel Injector, SAE Technical Papers Vol. 1, 2014. [CrossRef]
- Ryongsik O., Jiangwei C., Choluk R., Hong L., MyongSu S., Yongchol K., SunGol R., Dynamic Modelling of Common Rail Diesel Engines Combined with Amesim and Simulink, International Journal of Scientific Research in Science and Technology, Vol. 10, Issue 2, 2023. [CrossRef]
- Ryongsik O., Yonguk R., Jiangwei C., Choluk R., Hong L., MyongSu S., Yongchol K., SunGol R., Cholsong H., Kwangbok K., Dynamic Analysis of Common Rail Injection System for Diesel Engine based on Amesim/Simulink Co-Simulation, International Journal of Scientific Research in Science and Technology, Vol. 10, Issue 3, 2023. [CrossRef]
- Payri R., Salvador F. J., Marti-Aldaravi P., Martinez-Lopez J., Using one-dimensional modeling to analyse the influence of the use of biodiesels on the dynamic behavior of solenoid-operated injectors in common rail systems: Detailed injection system model, Energy Conversion and Management, Vol. 54, p. 90-99, 2012. [CrossRef]
- Jaeheun K., Jinwoo L., Kihyun K., Numerical study on the effects of fuel viscosity and density on the injection rate performance of a solenoid diesel injector based on Amesim, Fuel, Vol. 256, 115912, 2019. [CrossRef]
- Payri R., Salvador F. J., Carreres M., De La Morena J., Fuel temperature influence on the performance of a last generation common-rail diesel ballistic injector. Part II: 1D model development, validation and analysis, Energy Conversion and Management, Vol. 114, p. 376-391, 2016. [CrossRef]
- Vass S., Zoldy M., Detailed Model of a Common Rail Injector, Acta Universitatis Sapientiae - Electrical and Mechanical Engineering, Vol. 11, p. 22−33, 2019. [CrossRef]
- Konieczny L., Adamczyk B., Adamczyk G., CR injector diagnostics and regeneration, Scientific Journals. Transport / Silesian University of Technology, Vol. 86, p. 65-73, 2015, YADDA: bwmeta1.element.baztech-2f2690e6-4970-4b4c-b08f-dc599e53ee5e.
- Bambhania M. P., Patel N., Hydrodynamic Cavitation in the Fuel Injector Nozzle and its Effect on Spray Characteristics: A Review, Journal of Heat and Mass Transfer Research, Vol 10, p. 1-20, 2023. [CrossRef]
- Ran K., Seungjin K., Mamoru I., Review of jet impingement in high-energy piping systems, Nuclear Engineering and Design, Vol. 357, 110411, 2020. [CrossRef]
- Mongiovi M. S., Jou D., Sciacca M., Non-equilibrium thermodynamics, heat transport and thermal waves in laminar and turbulent superfluid helium, Physics Reports, Vol. 726, p. 1-71, 2018. [CrossRef]
- Pielecha I., Wisłocki K., Czajka J., Maslennikov D., Fuel spray parameter analysis for different common-rail injectors, Conference FISITA 2010 World Automotive Congress, Budapest, 2010.
- Lowe A. R., Jasiok B., Melentev V. V., Ryshkova O. S., Korotkovskii V. I., Radchenko A. K., Postnikov E. B., Spinnler M., Ashurova U., Safarov J., Hassel E., Chorążewski M., High-temperature and high-pressure thermophysical property measurements and thermodynamic modelling of an international oil standard: RAVENOL diesel rail injector calibration fluid, Fuel Processing Technology, Vol. 199, 106220, 2020. [CrossRef]
|
Disclaimer/Publisher’s Note: The statements, opinions and data contained in all publications are solely those of the individual author(s) and contributor(s) and not of MDPI and/or the editor(s). MDPI and/or the editor(s) disclaim responsibility for any injury to people or property resulting from any ideas, methods, instructions or products referred to in the content. |
© 2025 by the authors. Licensee MDPI, Basel, Switzerland. This article is an open access article distributed under the terms and conditions of the Creative Commons Attribution (CC BY) license (http://creativecommons.org/licenses/by/4.0/).