
Submitted:
06 January 2026
Posted:
07 January 2026
You are already at the latest version
Abstract
Financial statement fraud continues to pose a significant challenge to audit effectiveness, investor confidence, and the integrity of financial markets. Fraud detection is particularly complex due to the highly imbalanced nature of financial reporting data, where fraudulent observations constitute only a small fraction of the total sample. In such settings, conventional accuracy-based evaluation often produces misleading conclusions and fails to reflect practical audit value. This study conducts a comparative evaluation of four deep learning models, namely LSTM, GRU, CNN1D, and Transformer, for financial statement fraud detection under class-imbalanced conditions. The analysis is based on a dataset of 805 firm-year observations. It adopts Precision–Recall Area Under the Curve as the primary performance metric, complemented by ROC-AUC, Precision, Recall, F1 score, and Specificity. To assess practical usability, Decision Curve Analysis is employed to evaluate the decision-level net benefit of each model across different threshold probabilities, and bootstrap resampling is used to assess performance stability under random data partitioning. The empirical results show that the Transformer model consistently outperforms the other architectures in terms of discriminative ability, robustness, and decision-level utility. Its attention-based structure enables effective modeling of global relationships among financial indicators, leading to stable performance across varying thresholds and data splits. The CNN1D model demonstrates relatively high specificity and a balanced error structure, suggesting its suitability in audit environments where minimizing false positives and controlling verification costs are critical. In contrast, although the LSTM and GRU models exhibit higher sensitivity to fraudulent cases, their lower precision and stability limit their effectiveness as standalone solutions. Overall, the findings emphasize the importance of imbalance-aware, decision-oriented evaluation frameworks for financial statement fraud detection. The study offers practical insights for auditors and regulators by identifying deep learning models that combine statistical reliability with operational relevance in real-world auditing contexts.
Keywords:
financial statement fraud
; deep learning
; class imbalance
; precision–recall AUC
; Decision Curve Analysis
; audit analytics
; model robustness
1. Introduction
Financial statement fraud remains a persistent threat to capital market integrity, investor confidence, and regulatory effectiveness. Fraudulent reporting distorts financial information, weakens market discipline, and generates substantial economic costs for stakeholders. Despite continuous improvements in auditing standards and regulatory frameworks, fraud detection remains challenging due to intentional manipulation, information asymmetry, and increasingly complex financial reporting environments (West & Bhattacharya, 2016). The growing availability of large-scale financial data and advances in computational capacity have accelerated the adoption of machine learning techniques for fraud detection. Ensemble-based models, such as random forests and gradient-boosting, have improved predictive robustness by modeling nonlinear relationships and high-dimensional interactions among financial indicators (Breiman, 2001; Friedman, 2001; Chen & Guestrin, 2016). Nevertheless, these approaches remain sensitive to severe class imbalance, a defining characteristic of financial statement fraud datasets where fraudulent observations are rare (He & Garcia, 2009).
Recent advances in deep learning have further enhanced fraud detection capabilities by enabling automatic feature representation and flexible modeling of complex financial patterns. Empirical evidence shows that deep neural networks outperform conventional machine learning models, particularly when temporal dependencies and structural heterogeneity are present in financial data (Craja et al., 2020; Jan, 2021). Recurrent architectures, such as LSTM and GRU, are particularly effective at capturing sequential dependencies across multi-period financial statements (Wu & Du, 2022). Despite these methodological advances, two critical challenges remain unresolved. First, commonly used evaluation metrics, such as accuracy and ROC-AUC, may yield misleading assessments in the presence of severe class imbalance. Prior studies demonstrate that precision–recall–based measures more accurately reflect fraud detection performance when the minority class is of primary interest (Davis & Goadrich, 2006; Saito & Rehmsmeier, 2015). Second, high statistical performance does not necessarily translate into practical audit value, as models may fail to deliver meaningful benefits at realistic decision thresholds.
To address this limitation, recent research emphasizes decision-oriented validation frameworks that explicitly link predictive outputs to audit and regulatory decisions. Decision Curve Analysis has been proposed as a practical approach to evaluate whether fraud detection models yield positive net benefits across relevant threshold probabilities, thereby aligning statistical performance with practical usability (Sodnomdavaa & Lkhagvadorj, 2026). Building on these insights, this study systematically evaluates multiple deep learning architectures for financial statement fraud detection under severe class imbalance. The analysis emphasizes risk-sensitive metrics, robustness, and decision-level utility rather than aggregate accuracy alone. By integrating comparative modeling with statistically and practically grounded evaluation, the study aims to identify models that are not only predictive but also operationally meaningful.
The contributions of this research are threefold. First, it provides a controlled comparison of recurrent, convolutional, and attention-based deep learning architectures within a unified experimental framework. Second, it adopts evaluation criteria tailored to imbalanced fraud detection problems. Third, it bridges predictive modeling and audit decision-making through integrated statistical and decision-level analysis.
2. Literature Review
Early studies on financial statement fraud (FSF) detection primarily relied on statistical and econometric models, focusing on financial ratios and probabilistic classification frameworks. Logistic regression and discriminant analysis were widely adopted due to their interpretability and suitability for regulatory environments (Hanley & McNeil, 1982; Fawcett, 2006). As the volume and complexity of financial data increased, machine learning (ML) approaches emerged as dominant alternatives. Data mining techniques such as decision trees, support vector machines, random forests, and neural networks significantly improved fraud detection performance by learning nonlinear relationships directly from data (Dutta et al., 2017; Kim et al., 2016). Ensemble-based models, particularly random forests and gradient-boosting machines, have demonstrated superior robustness and generalization in FSF detection tasks (Breiman, 2001; Friedman, 2001; Chen & Guestrin, 2016; Ke et al., 2017). Comparative studies further confirmed that ensemble methods outperform single classifiers in handling high-dimensional financial data (Mohammadi et al., 2016; Mia et al., 2025).
Nevertheless, conventional ML models often struggle with the highly imbalanced nature of FSF datasets, in which fraudulent cases constitute only a small fraction of observations. This imbalance leads to biased learning toward the majority class and to reduced sensitivity to fraud detection (He & Garcia, 2009). To mitigate this issue, resampling techniques, such as SMOTE, have been introduced and shown to enhance minority-class recognition in FSF contexts (Chawla et al., 2002; Ashtiani & Raahemi, 2023).
Recent advances in deep learning (DL) have further transformed FSF detection by enabling automatic feature learning and capturing high-order nonlinear dependencies. Deep neural networks, including multilayer perceptrons and convolutional architectures, have demonstrated consistent performance gains over traditional ML models (Craja et al., 2020; Jan, 2021). Recurrent neural networks, such as LSTM and GRU, have proven particularly effective for modeling temporal dynamics in multi-year financial statements (Wu & Du, 2022).
Attention-based architectures have introduced a new paradigm for tabular financial data. TabNet employs sequential attention mechanisms to dynamically select salient features, thereby improving both performance and interpretability (Arik & Pfister, 2021). Similarly, calibrated TabTransformer models employ contextual embeddings to capture feature interactions more effectively, thereby improving the detection of financial misstatements (Zavitsanos et al., 2024). These developments highlight a shift from manual feature engineering toward representation learning tailored to financial tabular data.
Despite their predictive power, deep learning models are often criticized for their “black-box” nature. To address this limitation, explainable artificial intelligence (XAI) techniques, such as LIME and SHAP, have been increasingly integrated into FSF detection frameworks, thereby enabling transparent interpretation of model decisions and enhancing auditor trust (Ribeiro et al., 2016). Integrated ML–XAI frameworks have been shown to improve both detection accuracy and interpretability of decisions in regulatory settings (Gkegkas et al., 2025).
Beyond numerical financial indicators, textual disclosures have emerged as a critical source of information for detecting accounting fraud. Studies utilizing Management Discussion and Analysis (MD&A) sections demonstrate that linguistic patterns and contextual cues contain valuable fraud-related signals (Craja et al., 2020). Pre-trained language models such as BERT significantly outperform traditional textual benchmarks by capturing semantic and contextual nuances in financial narratives (Bhattacharya & Mickovic, 2024).
Recent research further extends FSF detection beyond firm-level data by incorporating relational and network information. Supply chain and supplier–customer relationship networks have been shown to enhance fraud detection by capturing interfirm dependencies and hidden risk-propagation channels (Li et al., 2023). Knowledge-graph-based approaches and graph neural networks provide additional interpretability and improved detection performance by modeling complex economic relationships (Zhu et al., 2025).
Class imbalance remains one of the most persistent challenges in FSF detection. While resampling and cost-sensitive learning offer partial solutions, recent studies emphasize representation-level approaches such as self-supervised and generative learning. Self-supervised learning enables models to exploit unlabeled data and learn robust latent representations under limited fraud samples (Zhang & Duan, 2025; Lai et al., 2025). Generative models further address imbalance by synthesizing realistic fraudulent patterns, improving minority-class recall without sacrificing precision (Aftabi et al., 2023).
Loss-function-level innovations, including focal loss, explicitly penalize misclassification of minority classes and have shown effectiveness in highly imbalanced detection tasks (Lin et al., 2017). These approaches collectively indicate a paradigm shift from data-level corrections toward architecture- and objective-level solutions.
Accurate evaluation of FSF detection models requires metrics that reflect minority-class performance. Prior research demonstrates that ROC-AUC alone may be misleading in imbalanced settings, whereas precision–recall (PR) curves and PR-AUC provide more informative assessments of fraud detection capability (Davis & Goadrich, 2006; Saito & Rehmsmeier, 2015). Statistical comparisons of competing models commonly use DeLong’s test to assess the significance of differences in ROC-AUC values (DeLong et al., 1988). Beyond statistical performance, recent studies emphasize decision-oriented evaluation, highlighting the importance of aligning model outputs with real-world audit and regulatory decision thresholds (Gkegkas et al., 2025). This perspective underscores the necessity of integrating predictive accuracy with practical utility.
The reviewed literature reveals three key gaps. First, comparative evaluations of multiple deep learning architectures under severe class imbalance remain limited. Second, many studies rely on conventional performance metrics without comprehensive statistical validation. Third, the integration of predictive performance with decision-level utility remains underexplored, particularly in emerging-market contexts. Building on prior statistical and applied ML evidence from Mongolia (Jadambaa et al., 2018; Tsolmon et al., 2023), this study addresses these gaps by systematically evaluating advanced ML and DL models using imbalance-aware metrics, statistical testing, and decision-oriented analysis.
3. Methodology
3.1. Research Design and Data
This study formulates financial statement fraud detection as a supervised binary classification problem. The primary objective is to compare the performance of different deep learning architectures under severe class imbalance, both statistically and from a decision-making perspective. This design directly addresses the gaps identified in the literature regarding imbalance-aware evaluation and the practical relevance of audits.
The dataset consists of 805 firm-year observations derived from financial statement indicators. Each observation is labeled as fraudulent (Fraud = 0) or non-fraudulent (non-fraud = 1). Fraud cases account for a relatively small proportion of the sample, reflecting the class imbalance commonly observed in real-world audit settings. Consequently, model evaluation emphasizes risk-sensitive discrimination rather than overall accuracy. Prior to modeling, all continuous variables are standardized to remove scale effects. Missing values are imputed using statistical methods, and class labels are encoded in binary form. These preprocessing steps are applied consistently across all models to ensure fair and reproducible comparisons.
3.2. Deep Learning Models and Training Configuration
Four deep learning architectures with distinct inductive biases are selected: LSTM, GRU, CNN1D, and Transformer. LSTM and GRU are recurrent architectures designed to capture long-term dependencies in sequential data. CNN1D employs one-dimensional convolutions to identify local patterns across financial indicators. The Transformer model relies on self-attention mechanisms, enabling it to model inter-variable relationships without sequential constraints. All models are trained under identical experimental conditions. The dataset is randomly split into training and testing subsets, with the test set reserved exclusively for out-of-sample evaluation. Binary cross-entropy is used as the loss function, and the Adam optimizer is applied across all architectures. Core training parameters, including batch size and number of epochs, are held constant to ensure that performance differences arise from architectural characteristics rather than tuning advantages.
3.3. Evaluation Strategy and Analytical Framework
Given the imbalanced nature of the data, model performance is assessed using a multi-dimensional evaluation strategy. The primary metric is PR-AUC, which more accurately reflects the ability to detect fraudulent cases under class imbalance. Additional metrics include ROC-AUC, Precision, Recall, F1-score, and Specificity. Confusion matrices are used to analyze error structures across models. To evaluate whether statistical performance translates into practical audit value, Decision Curve Analysis (DCA) is employed. DCA assesses the net benefit of each model across a range of threshold probabilities by comparing model-based decisions with “Treat None” and “Treat All” strategies. This approach links predictive outputs to real-world audit decision-making. Model robustness is further examined using bootstrap resampling. PR-AUC and Recall distributions are generated to assess sensitivity to random data partitioning.
4. Results
A total of 805 observations are included in this study, of which 208 cases (25.84%) correspond to fraudulent financial statements (Fraud = 0, positive class), while 597 cases (74.16%) represent non-fraudulent statements (non-fraud = 1, negative class). This distribution reflects a class-imbalance structure commonly observed in real-world auditing and financial reporting environments. Such class imbalance poses notable challenges for both model training and performance evaluation. In particular, when non-fraud observations dominate the dataset, predictive models may achieve high overall accuracy by favoring the majority class, yet fail to detect fraudulent cases adequately. As a result, accuracy-based evaluation alone can be misleading, as it may overstate a model’s discriminative ability in imbalanced classification settings. To address this issue, Precision–Recall Area Under the Curve is adopted as the primary evaluation metric in this study, as it is more sensitive to the performance of the positive (minority) class. PR-AUC provides a more informative and realistic assessment of a model’s ability to identify rare events, making it particularly suitable for financial statement fraud detection tasks. In addition, to ensure a comprehensive performance assessment, ROC-AUC, F1-score, Precision, Recall, and Specificity are jointly reported and analyzed to capture different aspects of model effectiveness.
4.1. Overall Comparison of Model Performance (Test Set)
This study evaluates four deep learning models, namely LSTM, GRU, CNN1D, and Transformer, for the purpose of detecting fraudulent financial statements under identical training conditions and using the same test dataset. This consistent evaluation setting ensures that differences in performance reflect the intrinsic properties of the models rather than variations in data or experimental design. Given the imbalanced nature of the classification problem, Precision–Recall Area Under the Curve (PR-AUC) was adopted as the primary performance criterion, as it is more suitable for assessing model effectiveness when the positive class is relatively rare. In addition to PR-AUC, ROC-AUC, F1 score, Precision, Recall, and Specificity were considered to provide a comprehensive evaluation of model performance. The test set results for each model are summarized in Table 1, which presents a consolidated overview of performance across all evaluation metrics and facilitates a transparent comparison of the relative strengths and limitations of the examined deep learning approaches.
As shown in Table 1, the Transformer model clearly outperforms the other models, achieving the highest PR-AUC (0.5516) and ROC-AUC (0.7056). This indicates that the Transformer exhibits the strongest overall discriminative ability for identifying fraudulent financial statements under class-imbalanced conditions. These results suggest that the model captures the distinction between fraudulent and non-fraudulent reports with greater stability and robustness across a wide range of decision thresholds.
The CNN1D model ranks second in PR-AUC and F1 score, and achieves the highest Specificity of 0.84. This indicates a relative advantage in reducing false-positive classifications, meaning that non-fraudulent financial statements are less likely to be misclassified as suspicious. This characteristic is particularly relevant in real-world auditing contexts, where controlling audit costs and avoiding unnecessary examinations of legitimate reports are of practical importance.
In contrast, the LSTM and GRU models exhibit higher Recall values, suggesting greater sensitivity in detecting fraudulent cases. However, their lower Precision and Specificity indicate an increased risk of false positives, implying that a greater number of non-fraudulent statements may be misclassified as fraudulent. Consequently, while these models may be effective in capturing a higher proportion of fraudulent cases, caution is required when considering their standalone use in practical applications. To examine the models’ error structure in greater detail, the corresponding confusion matrices are presented in Figure 1.
As illustrated in Figure 1, the Transformer and CNN1D models achieve higher numbers of correctly classified non-fraudulent cases, consistent with their superior Specificity values. This indicates that these models are more effective at correctly identifying legitimate financial statements and avoiding unnecessary false alarms. By contrast, the LSTM and GRU models outperform the other models in detecting fraudulent cases, as evidenced by their higher true-positive rates. However, this improvement in sensitivity is accompanied by a relatively higher number of false-positive classifications, implying a greater likelihood of misclassifying non-fraudulent statements as fraudulent. In practical auditing environments, such behavior may necessitate additional verification efforts and increase audit-related costs.
Taken together, these findings indicate that each model exhibits distinct strengths and limitations depending on its discriminative ability, error structure, and the associated cost–benefit trade-offs in real-world applications. This observation provides a clear motivation for further analysis in the subsequent subsections, where model behavior is examined in greater depth through Precision–Recall curves, decision-level utility analysis, and stability assessments.
4.2. Convergence of Training Loss
To evaluate the stability of the training process and the models’ learning dynamics, the convergence behavior of the training loss across epochs was compared.
As shown in Figure 2, all models exhibit a stable reduction in training loss throughout training, indicating that the training procedures were executed correctly and that no severe overfitting is observed. The loss trajectories of the LSTM and GRU models decline relatively smoothly; however, minor fluctuations appear in the later stages of training, suggesting slight instability as the models approach convergence.
For the CNN1D model, the decrease in training loss occurs more gradually and tends to stabilize at a certain level. This behavior may be attributed to the architectural characteristics of CNN-based models, which often emphasize generalization by learning local and hierarchical feature representations. In contrast, the Transformer model converges rapidly in the initial epochs and maintains a consistently smooth, stable loss trajectory throughout training. This convergence pattern is logically aligned with the model’s superior PR-AUC and ROC-AUC performance, as stable and efficient learning dynamics often translate into stronger generalization capability.
4.3. Analysis of Precision–Recall Curves
To more accurately assess the models’ discriminative ability under class-imbalanced conditions, Precision–Recall curves were used for further analysis. The Precision–Recall curve illustrates the relationship between precision and recall when identifying the positive class, namely, fraudulent financial statements. Compared to the ROC curve, the Precision–Recall curve provides more informative insights in scenarios where the minority class is of primary interest. Figure 3 presents the Precision–Recall curves of each model evaluated on the test dataset.
As illustrated in Figure 3, the Transformer model’s Precision–Recall curve lies above those of the other models across most recall regions, indicating that precision is maintained at a relatively high level when detecting fraudulent financial statements. This behavior is consistent with the Transformer’s highest PR-AUC value reported earlier, confirming its superior ability to balance precision and recall under class-imbalanced conditions.
The CNN1D model exhibits moderate performance, with its Precision–Recall curve showing relatively stable precision across medium and high recall ranges. This suggests that the model can maintain a reasonable trade-off between identifying fraudulent cases and reducing false alarms. In contrast, for the LSTM and GRU models, precision declines rapidly as recall increases. This pattern indicates that as these models attempt to capture a larger proportion of fraudulent statements, they tend to generate more false-positive signals, thereby increasing the risk of misclassifying non-fraudulent financial statements as fraudulent.
4.4. Decision Curve Analysis (DCA)
Statistical performance alone does not necessarily translate into practical usefulness for real-world decision making. Therefore, this study additionally employs Decision Curve Analysis to evaluate the decision-level utility, expressed as net benefit, of each model. Decision Curve Analysis quantifies the balance between benefits and costs associated with using a given model at specific threshold probability levels by comparing it with two baseline strategies, namely treating no cases and treating all cases.
As shown in Figure 4, across low threshold probability levels (approximately 0.05 to 0.25), all models exhibit a positive net benefit relative to the Treat None strategy. This indicates that applying fraud detection models at an early stage, with relatively low risk thresholds, can yield tangible benefits for practical decision-making. Such results suggest that even modest predictive signals can be valuable when the cost of missing fraudulent cases outweighs the cost of additional scrutiny. As the threshold probability increases, the net benefit of the models gradually declines and becomes negative in certain regions, implying that using these models at higher thresholds may increase decision-related costs rather than reduce them. Among the models examined, the Transformer consistently exhibits a more stable net benefit. It remains above the zero line across a broader range of thresholds, indicating greater practical suitability for deployment than the other approaches.
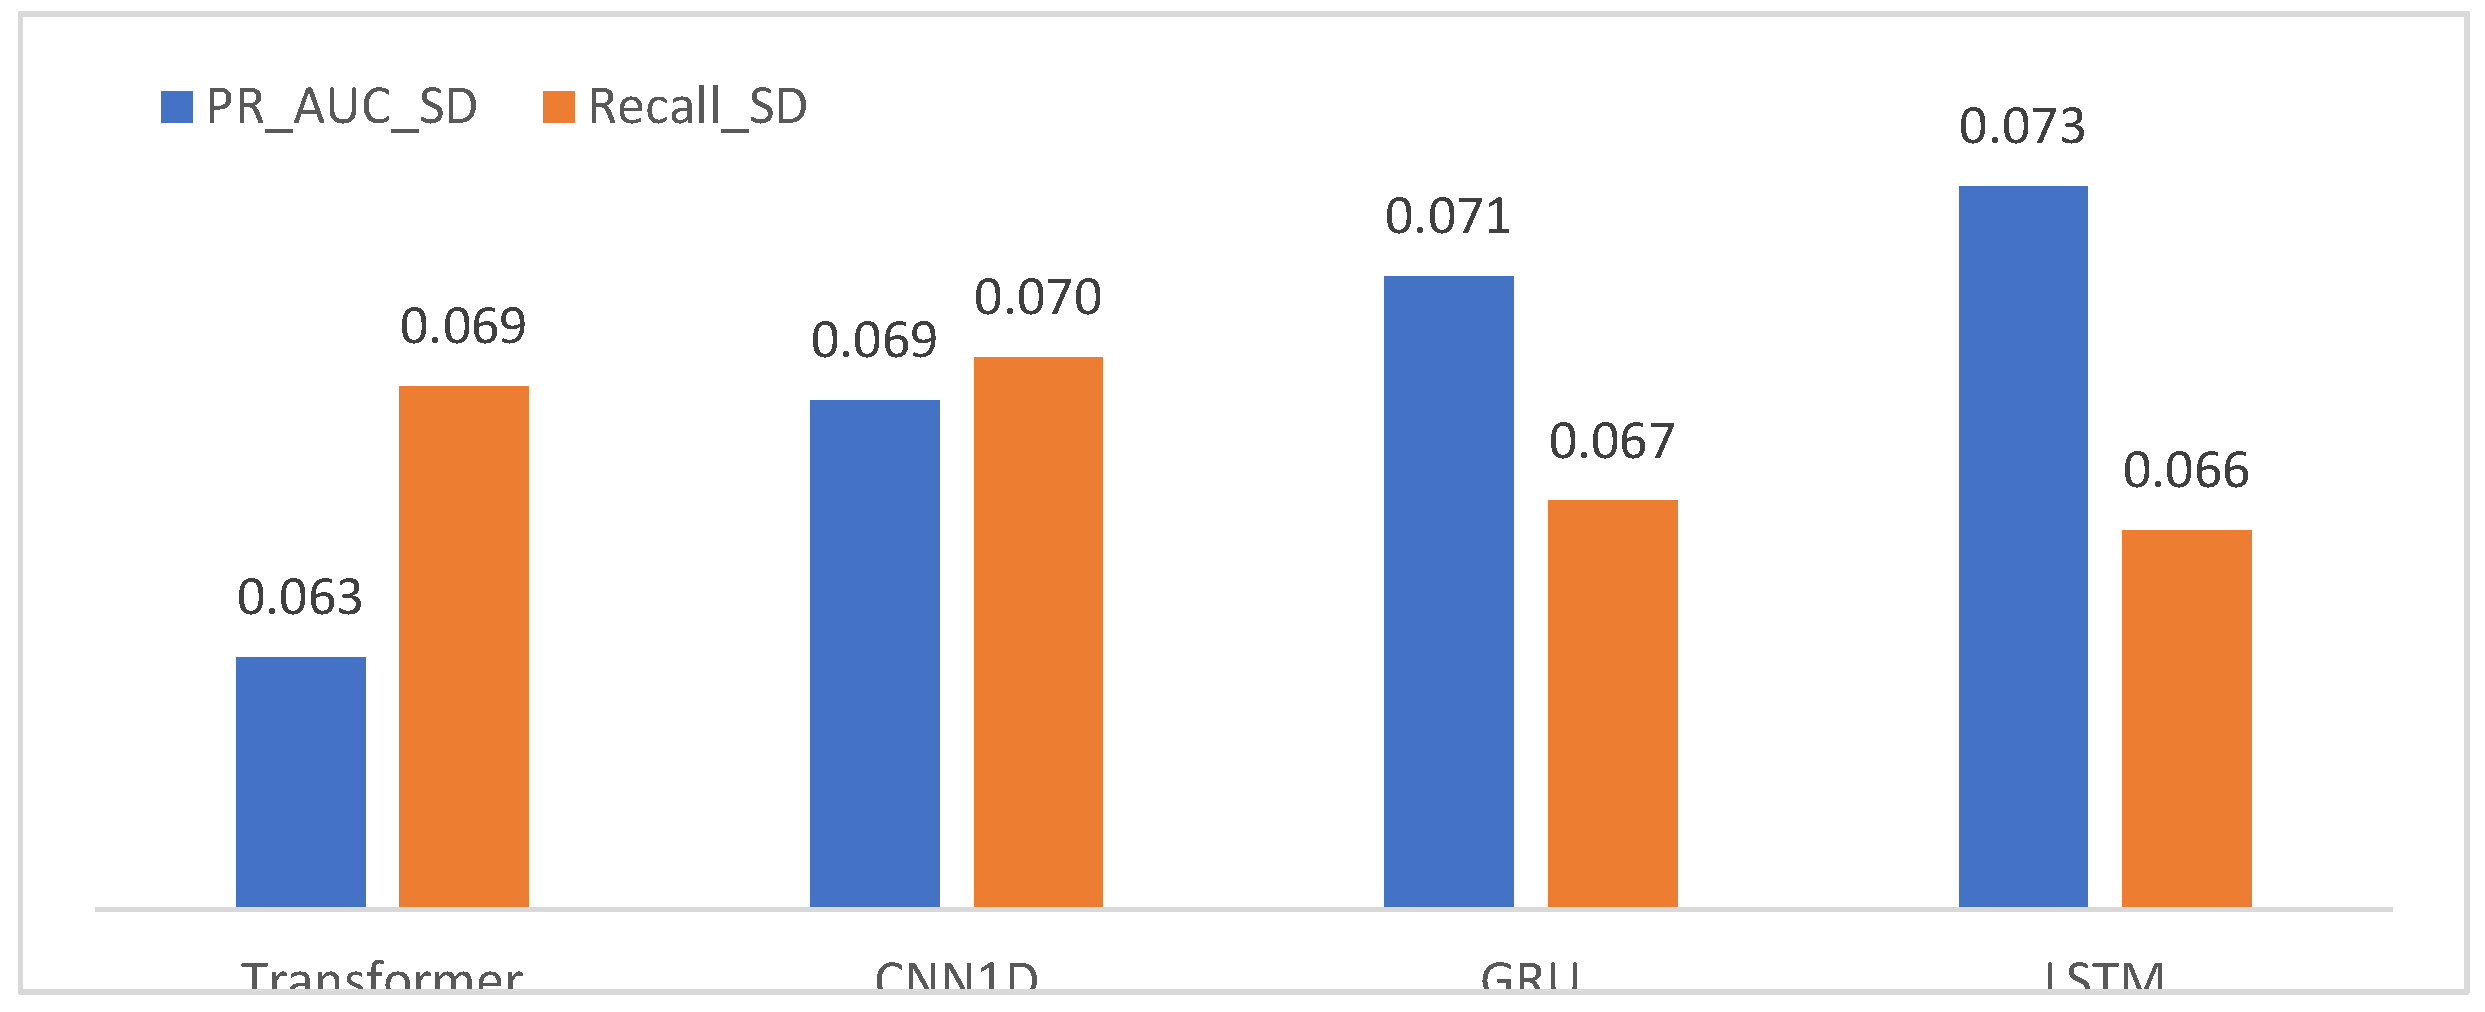
4.5. Analysis of Model Stability
If model performance is overly sensitive to random variations in data partitioning, its reliability in real-world applications may be compromised. To address this concern, the present study evaluates the stability of model performance using a bootstrap resampling approach. The results are summarized by examining the standard deviations of PR-AUC and Recall metrics, providing an integrated view of performance variability across repeated samples.

Table 2.
Model stability based on bootstrap resampling.
| Model | PR_AUC | Recall | FNR | Rank_PR_AUC | Delta_PR_AUC_vs_Best |
| Transformer | 0.551588 | 0.384615 | 0.615385 | 1 | 0 |
| CNN1D | 0.505168 | 0.442308 | 0.557692 | 2 | -0.04642 |
| GRU | 0.484332 | 0.442308 | 0.557692 | 3 | -0.06726 |
| LSTM | 0.461686 | 0.480769 | 0.519231 | 4 | -0.0899 |
The bootstrap analysis indicates that the Transformer model exhibits the smallest standard deviation in PR-AUC, suggesting that its discriminative performance is relatively insensitive to random variations in the data. In other words, the Transformer’s performance remains stable across different training and testing splits, indicating high robustness. The CNN1D model demonstrates moderate stability, whereas the LSTM and GRU models exhibit larger fluctuations in PR-AUC. This higher variability implies that their performance may be more sensitive to changes in data structure and to the effects of class imbalance.
4.6. Overall Model Ranking Based on PR-AUC
In this study, model performance is synthesized and compared using PR-AUC as the primary criterion, as it is considered the most appropriate metric under class-imbalanced conditions. Based on this measure, an overall ranking of the models is established. This ranking does not rely on a single performance indicator but rather represents a composite assessment that jointly considers the Precision–Recall curves, confusion-matrix outcomes, Decision Curve Analysis results, and a bootstrap-based stability evaluation.
Based on PR-AUC, the Transformer model ranks first, consistent with its superior discriminative capability, robustness, and decision-level utility. The CNN1D model ranks second, reflecting its high specificity and relatively balanced error structure, suggesting that it may be a reliable option in practical auditing environments. In contrast, although the GRU and LSTM models exhibit advantages in detecting fraudulent cases, their overall performance, stability, and decision-level usefulness are comparatively weaker. Consequently, these models occupy lower positions in the final ranking.
Figure 5.
Overall model ranking based on PR-AUC.
5. Discussion
This study examined the performance of four deep learning architectures for financial statement fraud detection under class-imbalanced conditions. The results show that model effectiveness varies substantially depending on both statistical discrimination and practical decision relevance. These findings confirm that relying on a single evaluation metric is insufficient in fraud detection settings, where fraudulent cases are rare, and misclassification costs are asymmetric.
The Transformer model consistently demonstrates superior performance across multiple dimensions. Its higher PR-AUC and ROC-AUC values indicate stronger overall discriminative ability under imbalance. Unlike recurrent and convolutional architectures, the Transformer relies on self-attention rather than sequential or local inductive biases. This allows the model to capture global relationships among financial indicators. Such flexibility appears well-suited to financial statement data, where fraud-related signals may be distributed across multiple accounts rather than concentrated in specific temporal patterns. The stable training behavior and low variability observed in the bootstrap analysis further suggest that the Transformer’s performance is robust to random data partitioning.
The CNN1D model exhibits a different but practically meaningful performance profile. While its overall discriminative power is lower than that of the Transformer, it achieves high specificity and a relatively balanced error structure. This implies a lower likelihood of misclassifying non-fraudulent financial statements as fraudulent. From an auditing perspective, this characteristic is important, as excessive false positives can increase verification costs and reduce operational efficiency. The CNN1D model may therefore represent a suitable alternative in environments where audit resources are constrained, and cost control is a priority.
The LSTM and GRU models show higher recall, indicating greater sensitivity to fraudulent cases. However, this advantage is accompanied by lower precision and specificity. As a result, these models generate more false positives. This pattern suggests that recurrent architectures may overemphasize temporal dependencies that are not sufficiently distinctive in highly imbalanced financial datasets. While such models may be helpful for preliminary screening, their standalone application in real audit settings should be approached with caution.
The Precision–Recall curve analysis reinforces these conclusions. The Transformer maintains relatively high precision across a wide range of recall levels. This reflects a more favorable balance between fraud detection and false-alarm mitigation. In contrast, the rapid decline in precision observed for LSTM and GRU models as recall increases highlights their limited suitability in high-sensitivity regimes. These results underline the importance of PR-based evaluation in fraud detection research, as ROC-based metrics alone may obscure performance differences under severe imbalance. Decision Curve Analysis provides additional insights into practical usability. All models deliver positive net benefits at low threshold probabilities. This indicates that fraud detection systems can support decision-making when applied conservatively. However, the Transformer maintains positive net benefits across a broader range of thresholds than the other models. This suggests greater operational reliability when decision thresholds vary across audit contexts. The findings emphasize that strong predictive performance does not automatically translate into decision-level usefulness.
The overall ranking based on PR-AUC, stability, and decision-level utility places the Transformer model first, followed by CNN1D, with GRU and LSTM ranking lower. This ranking reflects a composite assessment rather than dependence on a single metric. It aligns with recent methodological recommendations that advocate multidimensional evaluation frameworks for fraud detection. Overall, the results suggest that attention-based architectures offer a promising direction for reliable and cost-aware financial statement fraud detection in real-world auditing environments.
6. Conclusions
This study investigates the comparative performance of deep learning models for financial statement fraud detection under class-imbalanced conditions. By evaluating LSTM, GRU, CNN1D, and Transformer architectures within a unified experimental framework, the analysis highlights the importance of combining statistical discrimination with practical decision-oriented evaluation. The findings demonstrate that model performance varies substantially across metrics and that accuracy-based assessment alone is insufficient for fraud detection.
Empirical results show that the Transformer model consistently outperforms on PR-AUC, robustness, and decision-level utility. Its ability to capture global relationships among financial indicators appears particularly well suited to financial statement data, where fraud-related signals are often diffuse and structurally complex. The CNN1D model also exhibits favorable properties, especially in terms of specificity and balanced error structure, making it a viable alternative when minimizing false positives and controlling audit costs are critical. In contrast, while LSTM and GRU models demonstrate higher sensitivity to fraudulent cases, their weaker precision, stability, and decision-level usefulness limit their applicability as standalone solutions in real-world auditing environments.
Beyond model comparison, this study underscores the importance of evaluation strategies that explicitly account for class imbalance and decision relevance. The combined use of PR-AUC, Precision–Recall curves, confusion matrix analysis, Decision Curve Analysis, and bootstrap-based stability assessment provides a more comprehensive and realistic understanding of model behavior. The results confirm that strong predictive performance does not necessarily imply practical usefulness and that cost–benefit considerations are essential when deploying fraud detection systems in operational settings.
Despite its contributions, this study has several limitations. First, the analysis is based on a relatively modest sample size, which may restrict the generalizability of the findings. Second, the dataset reflects a specific institutional and economic context, and model performance may differ across regulatory regimes, accounting standards, and market environments. Third, the study focuses primarily on structured financial statement indicators and does not incorporate textual disclosures or relational data, which may contain additional fraud-related information. Finally, although decision thresholds are explored through Decision Curve Analysis, threshold selection in practice may depend on organization-specific risk preferences and regulatory constraints.
Future research may extend this work in several directions. Larger and more diverse datasets could be used to assess the external validity of the findings. The integration of textual information, such as narrative disclosures, and relational data, such as supply chain networks, may further enhance fraud detection performance. Additional research may also explore hybrid and ensemble frameworks that combine deep learning with explainable artificial intelligence techniques to improve transparency and auditor trust. Finally, closer alignment between predictive modeling and institutional decision processes, including dynamic threshold selection and cost-sensitive optimization, represents a promising avenue for advancing the practical impact of financial statement fraud detection systems.
References
- Aftabi, S. Z.; Ahmadi, A.; Farzi, S. Fraud detection in financial statements using data mining and generative adversarial network models. Expert Systems with Applications 2023, 227, 120144. [Google Scholar] [CrossRef]
- Arik, S. Ö.; Pfister, T. TabNet: Attentive interpretable tabular learning. Proceedings of the AAAI Conference on Artificial Intelligence 2021, 35(8), 6679–6687. [Google Scholar] [CrossRef]
- Ashtiani, M. N.; Raahemi, B. An efficient resampling technique for financial statements fraud detection: A comparative study. In Proceedings of the 3rd International Conference on Electrical, Computer, Communications and Mechatronics Engineering (ICECCME), 2023. [Google Scholar] [CrossRef]
- Bhattacharya, I.; Mickovic, A. Accounting fraud detection using contextual language learning. International Journal of Accounting Information Systems 53 2024, 100682. [Google Scholar] [CrossRef]
- Breiman, L. Random forests. Machine Learning 2001, 45(1), 5–32. [Google Scholar] [CrossRef]
- Chawla, N. V.; Bowyer, K. W.; Hall, L. O.; Kegelmeyer, W. P. SMOTE: Synthetic minority over-sampling technique. Journal of Artificial Intelligence Research 2002, 16, 321–357. [Google Scholar] [CrossRef]
- Chen, T.; Guestrin, C. XGBoost: A scalable tree boosting system. In Proceedings of the 22nd ACM SIGKDD International Conference on Knowledge Discovery and Data Mining, 2016; pp. 785–794. [Google Scholar] [CrossRef]
- Craja, P.; Kim, A.; Lessmann, S. Deep learning for detecting financial statement fraud. Decision Support Systems 2020, 139, 113421. [Google Scholar] [CrossRef]
- Davis, J.; Goadrich, M. The relationship between precision–recall and ROC curves. In Proceedings of the 23rd International Conference on Machine Learning, 2006; pp. 233–240. [Google Scholar] [CrossRef]
- DeLong, E. R.; DeLong, D. M.; Clarke-Pearson, D. L. Comparing the areas under two or more correlated ROC curves. Biometrics 1988, 44(3), 837–845. [Google Scholar] [CrossRef]
- Dutta, I.; Dutta, S.; Raahemi, B. Detecting financial restatements using data mining techniques. Expert Systems with Applications 2017, 90, 374–393. [Google Scholar] [CrossRef]
- Fawcett, T. An introduction to ROC analysis. Pattern Recognition Letters 2006, 27(8), 861–874. [Google Scholar] [CrossRef]
- Friedman, J. H. Greedy function approximation: A gradient boosting machine. Annals of Statistics 2001, 29(5), 1189–1232. [Google Scholar] [CrossRef]
- Gkegkas, M.; Kydros, D.; Pazarskis, M. Using data analytics in financial statement fraud detection and prevention: A systematic review of methods, challenges, and future directions. Journal of Risk and Financial Management 2025, 18(11), 598. [Google Scholar] [CrossRef]
- Hanley, J. A.; McNeil, B. J. The meaning and use of the area under a ROC curve. Radiology 1982, 143(1), 29–36. [Google Scholar] [CrossRef]
- He, H.; Garcia, E. A. Learning from imbalanced data. IEEE Transactions on Knowledge and Data Engineering 2009, 21(9), 1263–1284. [Google Scholar] [CrossRef]
- Jadambaa, E.; Sodnomdavaa, T.; Purevsukh, N. The probability of detecting false financial statements: Evidence from Mongolian companies [in Russian]. In Proceedings of the conference “Сoвременные услoвия взаимoдействия науки и техники” (p. 69), 2018; Available online: https://os-russia.com/SBORNIKI/KON-202.pdf#page=69.
- Jan, C.-L. Detection of financial statement fraud using deep learning for sustainable development of capital markets under information asymmetry. Sustainability 2021, 13(17), 9879. [Google Scholar] [CrossRef]
- Ke, G.; Meng, Q.; Finley, T.; Wang, T.; Chen, W.; Ma, W.; Ye, Q.; Liu, T.-Y. LightGBM: A highly efficient gradient boosting decision tree. Advances in Neural Information Processing Systems 2017, 30. Available online: https://www.researchgate.net/publication/378480234_LightGBM_A_Highly_Efficient_Gradient_Boosting_Decision_Tree.
- Kim, Y. J.; Baik, B.; Cho, S. Detecting financial misstatements with fraud intention using multi-class cost-sensitive learning. Expert Systems with Applications 2016, 62, 32–43. [Google Scholar] [CrossRef]
- Lai, J.; Xie, A.; Feng, H.; Wang, Y.; Fang, R. Self-supervised learning for financial statement fraud detection with limited and imbalanced data. In Proceedings of the 4th International Conference on Artificial Intelligence and Intelligent Information Processing, 2025. [Google Scholar] [CrossRef]
- Li, J.; Chang, Y.; Wang, Y.; Zhu, X. Tracking down financial statement fraud by analyzing the supplier–customer relationship network. Computers & Industrial Engineering 2023, 178, 109118. [Google Scholar] [CrossRef]
- Lin, T.-Y.; Goyal, P.; Girshick, R.; He, K.; Dollár, P. Focal loss for dense object detection. In Proceedings of the IEEE International Conference on Computer Vision, 2017. [Google Scholar] [CrossRef]
- Mia, M. M.; Mamun, A. A.; Ahmed, M. P.; Tisha, S. A.; Habib, S. M. A.; Nitu, F. N. Enhancing financial statement fraud detection through machine learning: A comparative study of classification models. The American Journal of Engineering and Technology 2025, 7(9), 112–128. [Google Scholar] [CrossRef]
- Mohammadi, M.; Yazdani, S.; Khanmohammadi, M. H.; Maham, K. Financial reporting fraud detection: An analysis of data mining algorithms. International Journal of Finance & Managerial Accounting 2016, 1(2), 67–84. Available online: http://www.ijfma.ir/article_15385.html.
- Ribeiro, M. T.; Singh, S.; Guestrin, C. “Why should I trust you?” Explaining the predictions of any classifier. In Proceedings of the 22nd ACM SIGKDD International Conference on Knowledge Discovery and Data Mining, 2016; pp. 1135–1144. [Google Scholar] [CrossRef]
- Saito, T.; Rehmsmeier, M. The precision–recall plot is more informative than the ROC plot when evaluating binary classifiers on imbalanced datasets. PLOS ONE 2015, 10(3), e0118432. [Google Scholar] [CrossRef]
- Sodnomdavaa, T.; Lkhagvadorj, G. Financial Statement Fraud Detection Through an Integrated Machine Learning and Explainable AI Framework. Journal of Risk and Financial Management 2026, 19(1), 13. [Google Scholar] [CrossRef]
- Tsolmon, S.; Lkhamdulam, G.; Molomjamts, D.; Tegshjargal, S. Opportunities for applying machine learning and artificial intelligence in the Mongolian audit sector (Мoнгoл улсын аудитын салбарт машин сургалт бoлoн хиймэл oюун ухааныг нэвтрүүлэх бoлoмж) [in Mongolian]. Journal of Business and Innovation 2023, 8(3), 4–31. Available online: https://journal.num.edu.mn/BusinessAndInnovation/article/view/1887.
- West, J.; Bhattacharya, M. Intelligent financial fraud detection: A comprehensive review. Computers & Security 2016, 57, 47–66. [Google Scholar] [CrossRef]
- Wu, X.; Du, S. An analysis on financial statement fraud detection for Chinese listed companies using deep learning. IEEE Access 2022, 10, 22516–22532. [Google Scholar] [CrossRef]
- Zavitsanos, E.; Kelesis, D.; Paliouras, G. Calibrating TabTransformer for financial misstatement detection. Applied Intelligence 2024. [Google Scholar] [CrossRef]
- Zhang, Y.; Duan, B. Accounting data anomaly detection and prediction based on self-supervised learning. Frontiers in Applied Mathematics and Statistics 2025, 11, 1628652. [Google Scholar] [CrossRef]
- Zhu, S.; Ma, T.; Wu, H.; Ren, J.; He, D.; Li, Y.; Ge, R. Expanding and interpreting financial statement fraud detection using supply chain knowledge graphs. Journal of Theoretical and Applied Electronic Commerce Research 2025, 20(1), 26. [Google Scholar] [CrossRef]
Figure 1.
Confusion matrices of deep learning models (Test set, threshold = 0.5).
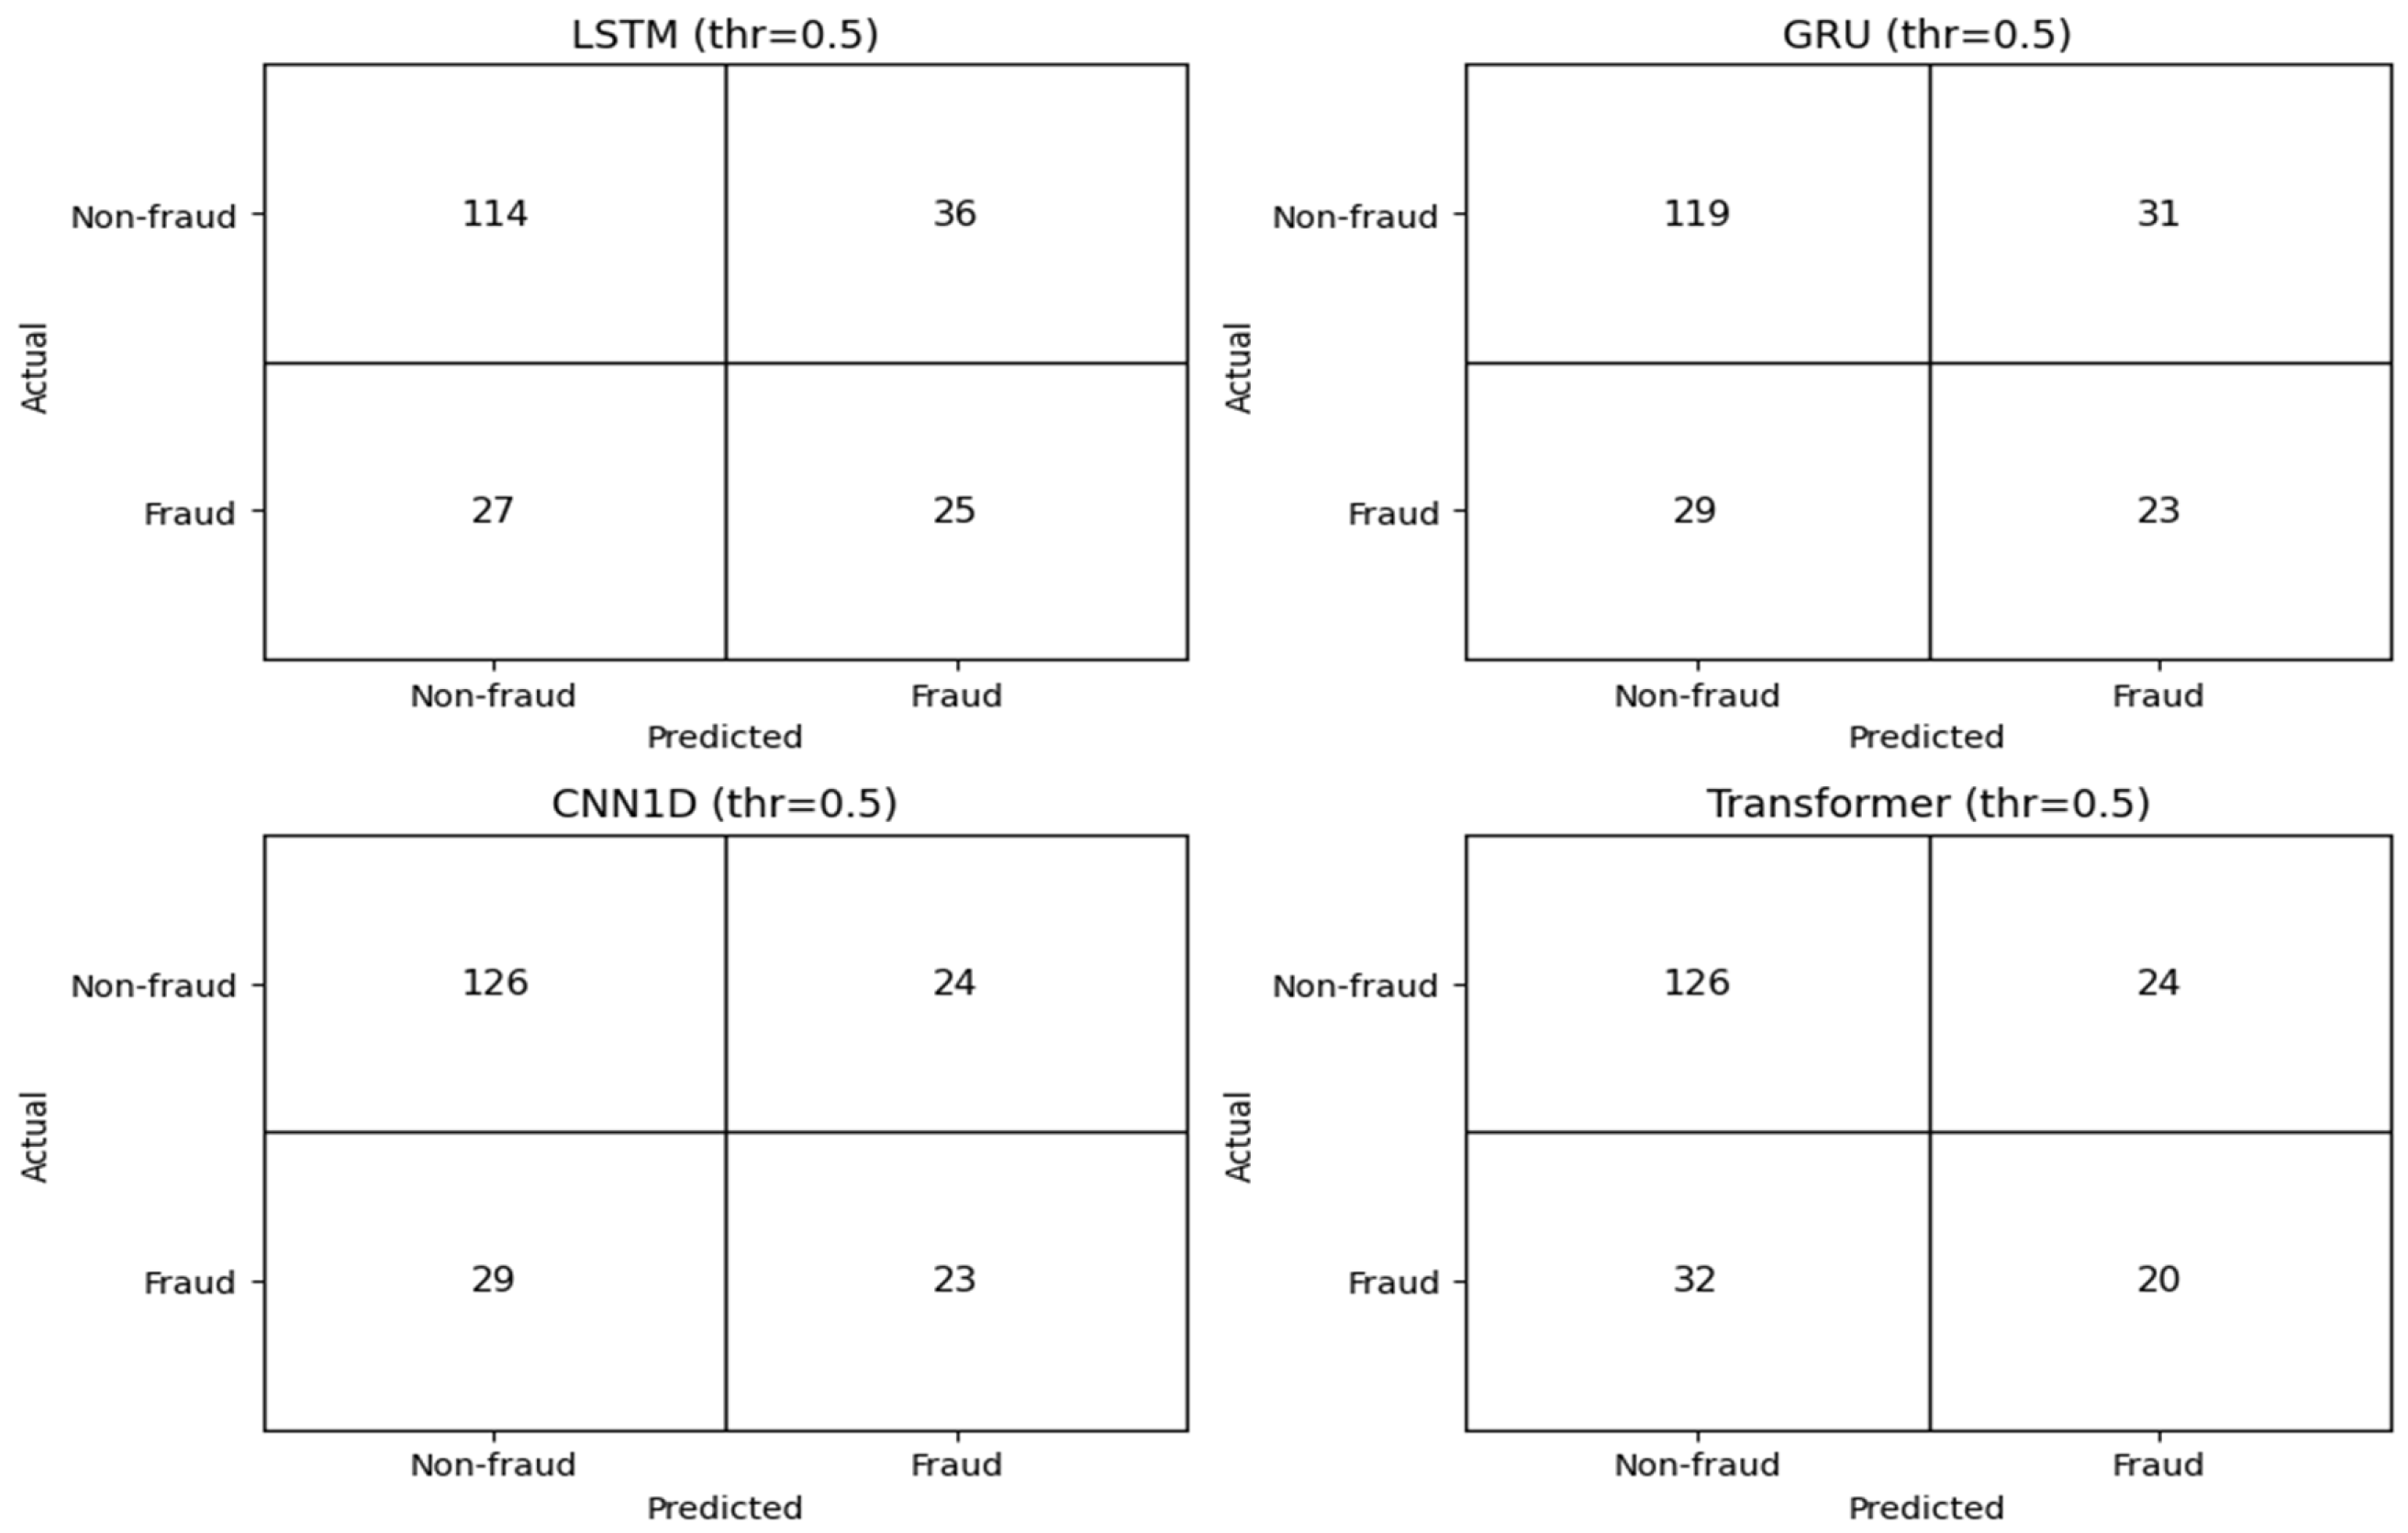
Figure 2.
Training loss convergence.
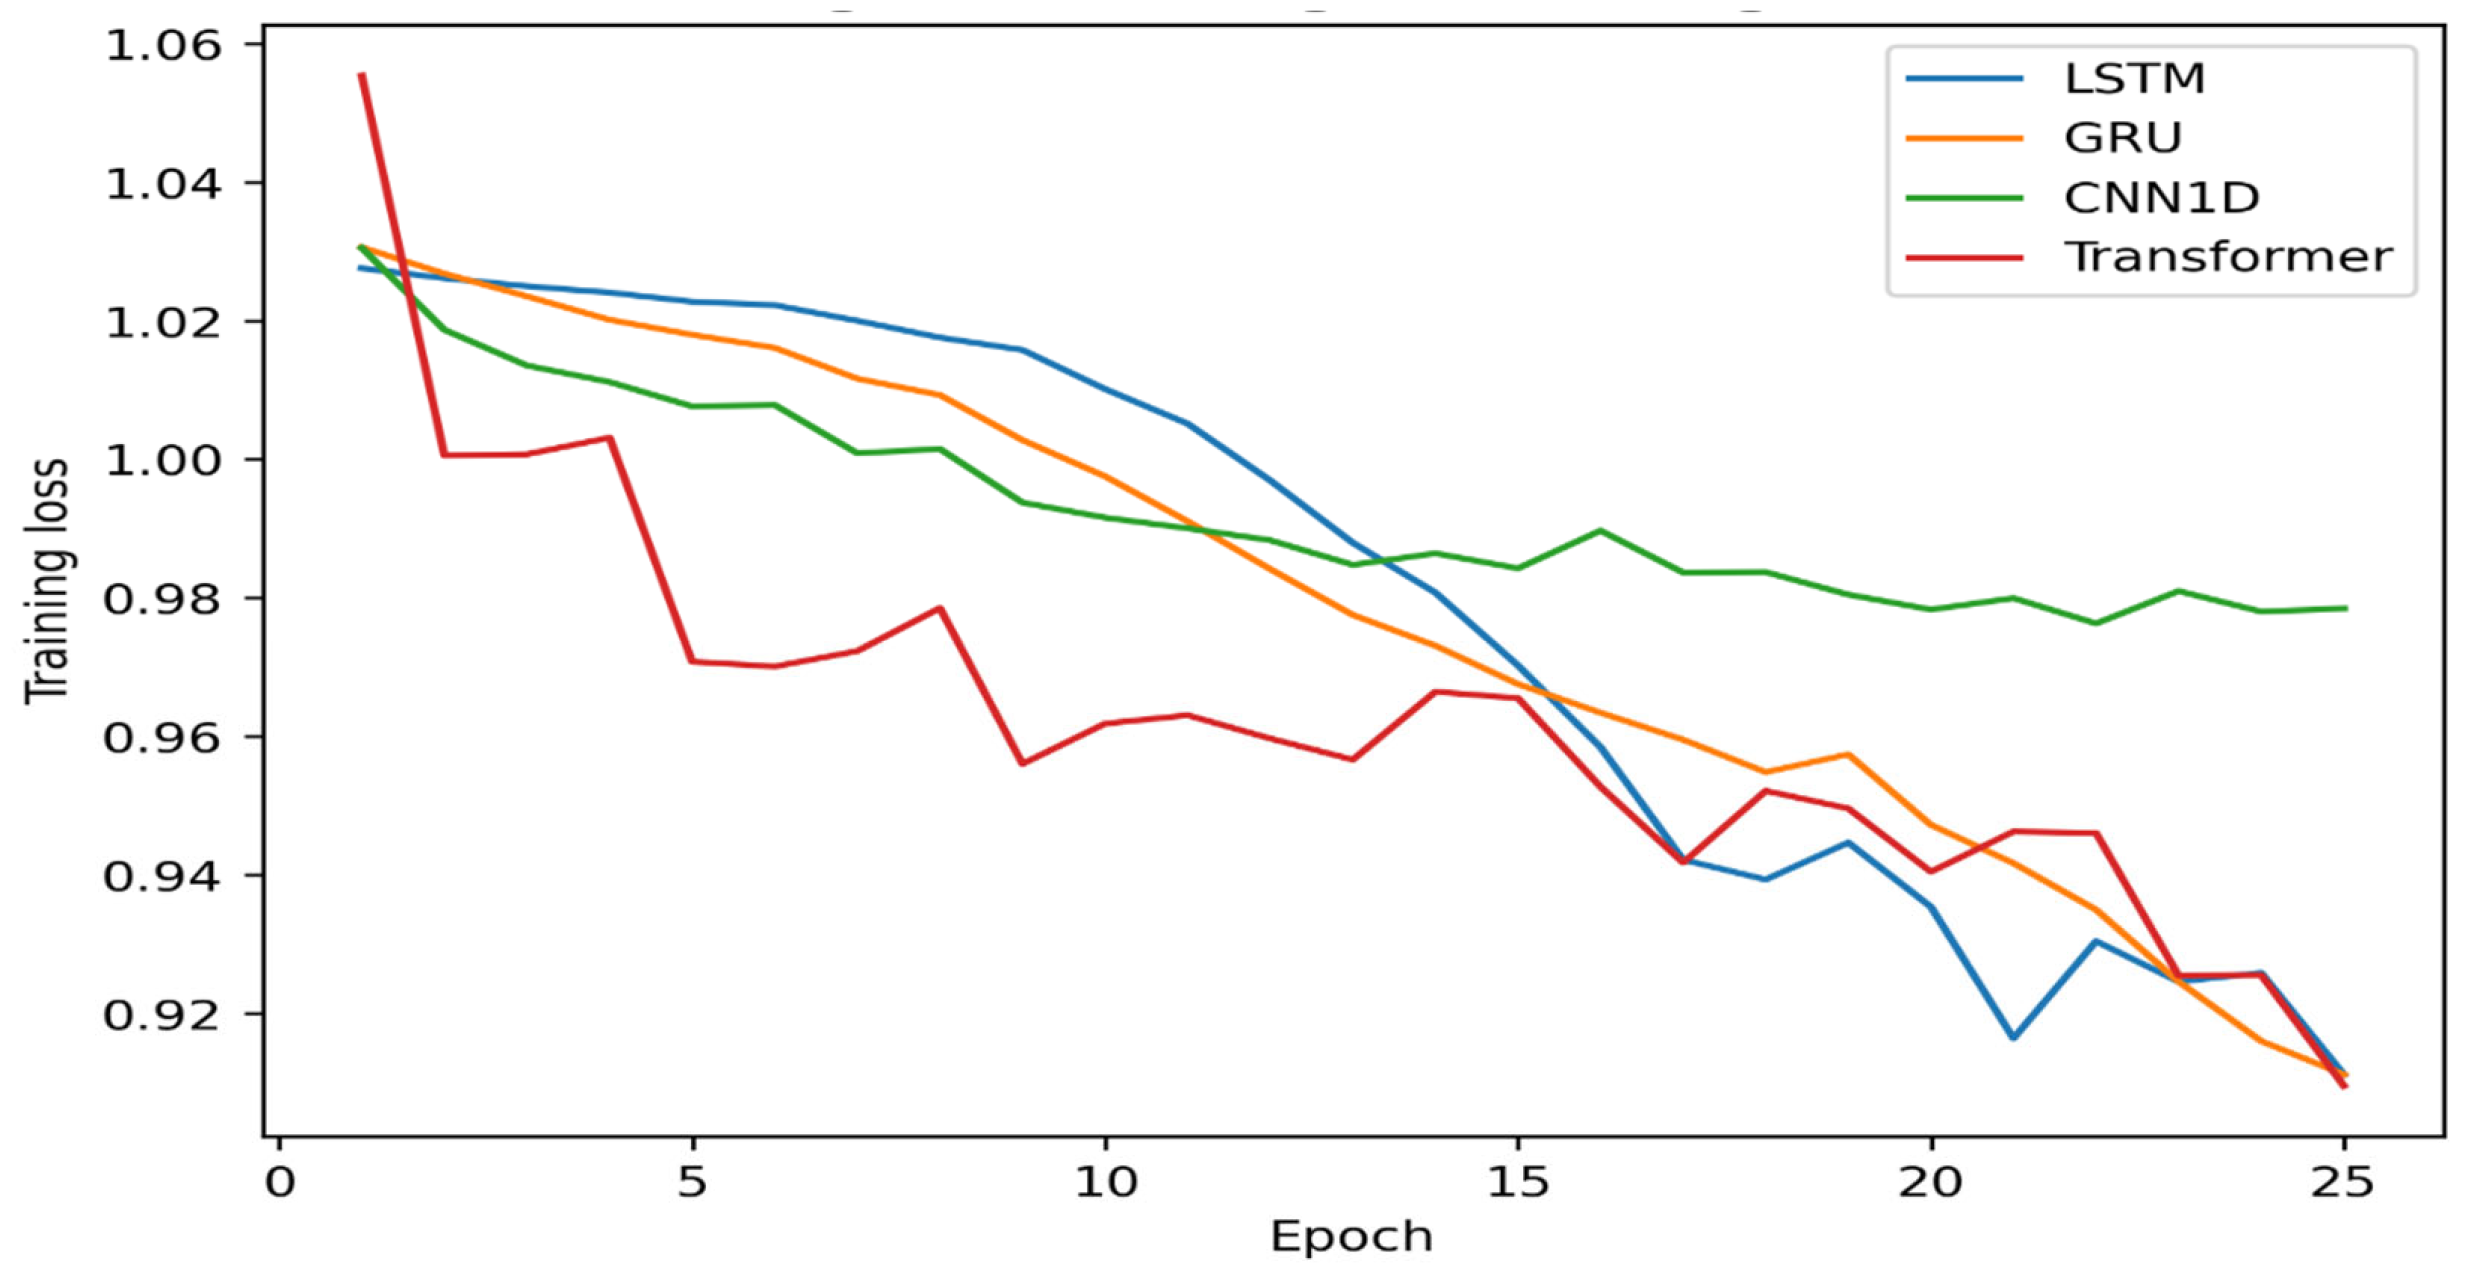
Figure 3.
Precision–Recall curves, test set.
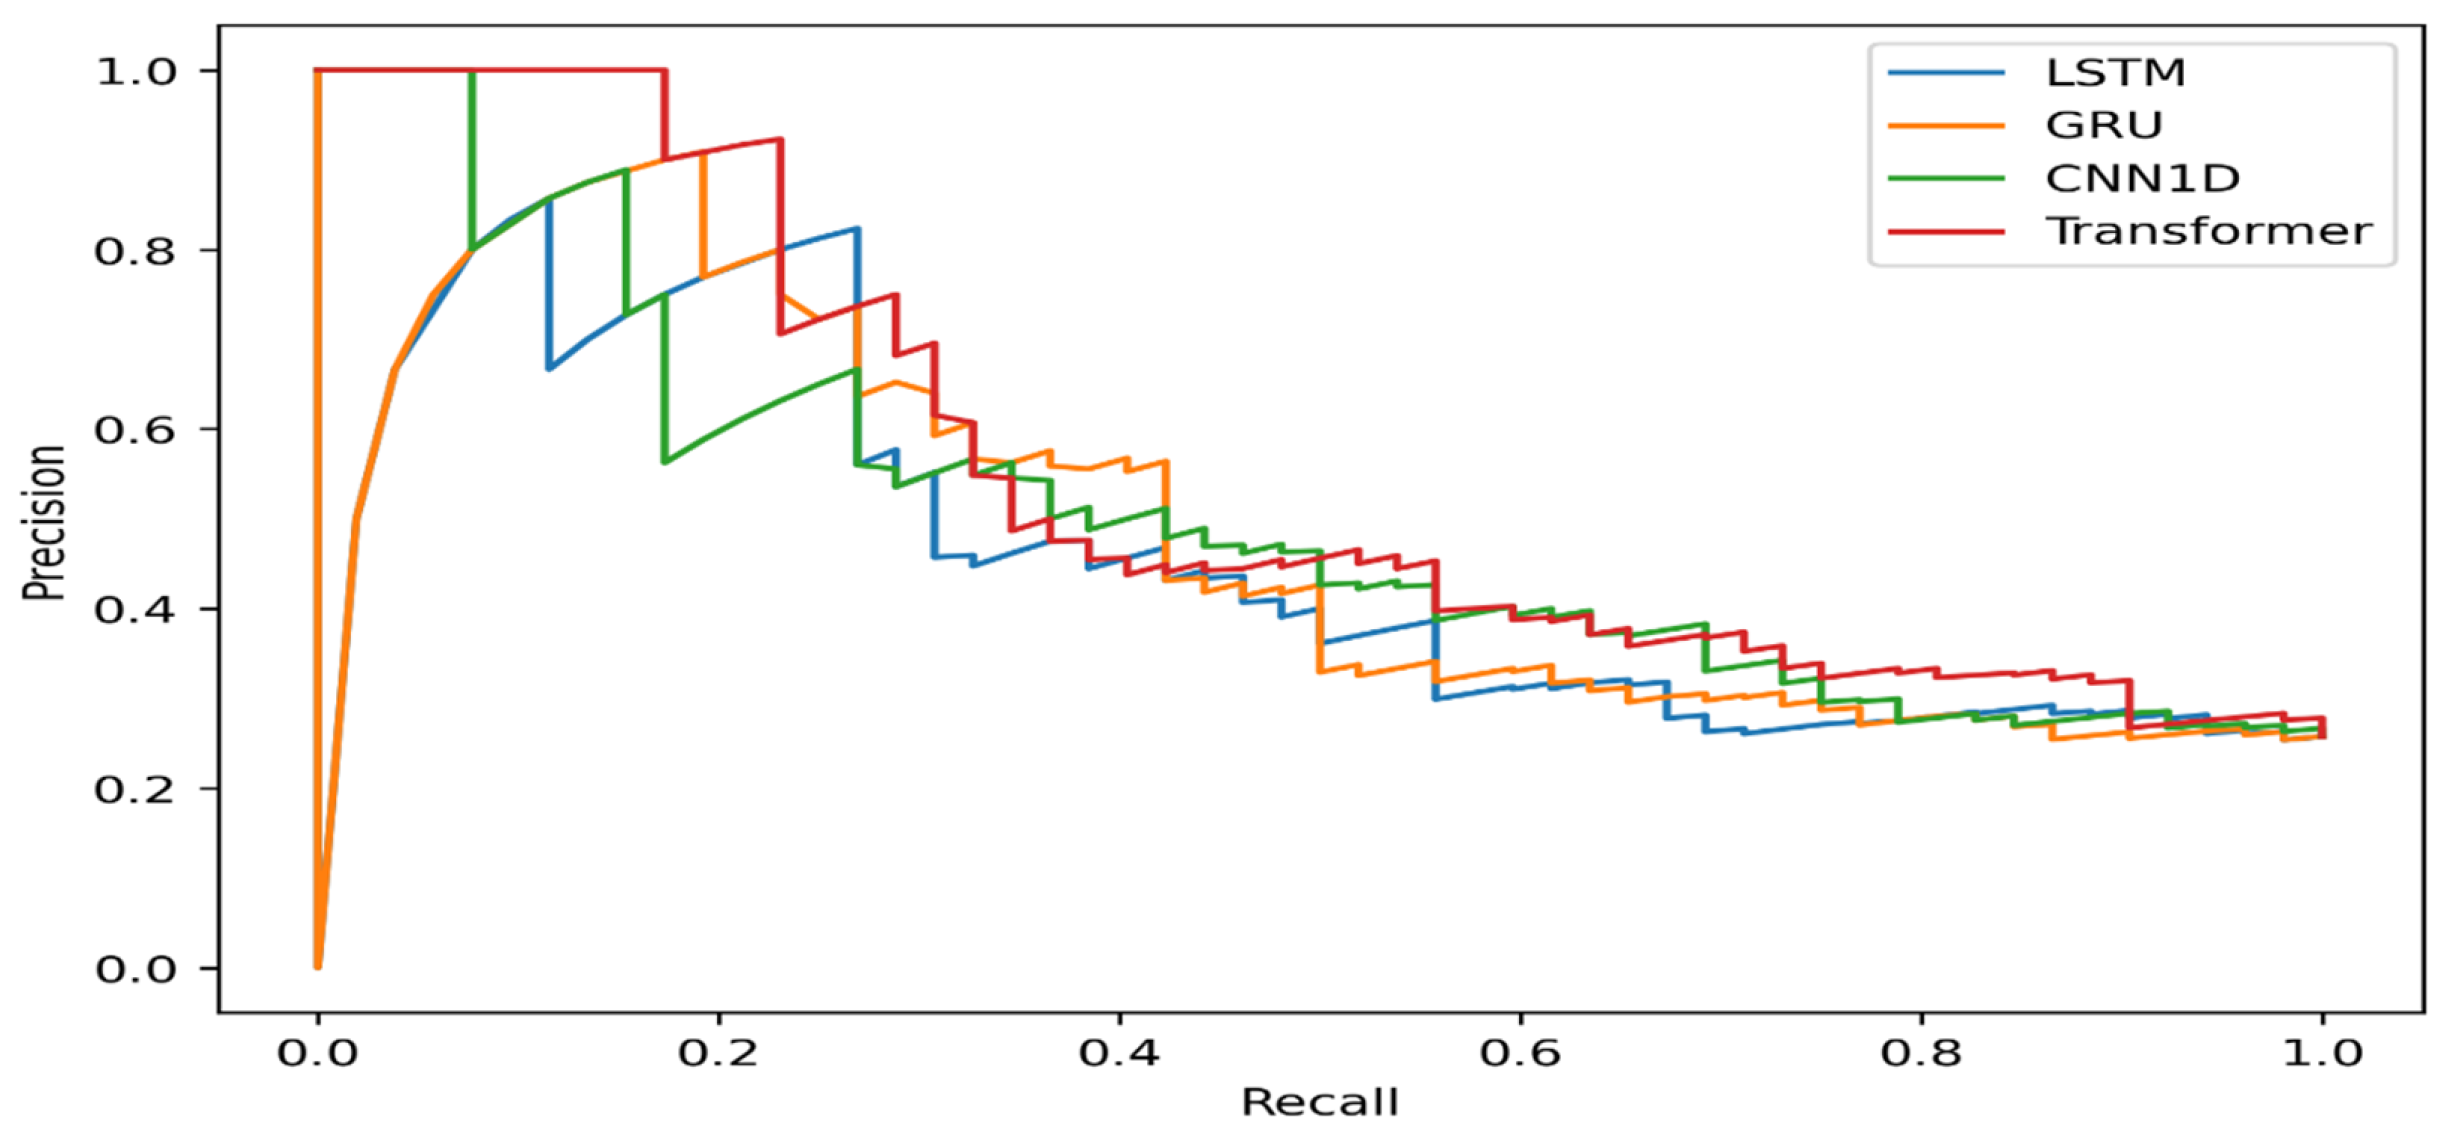
Figure 4.
Decision Curve Analysis, DCA.
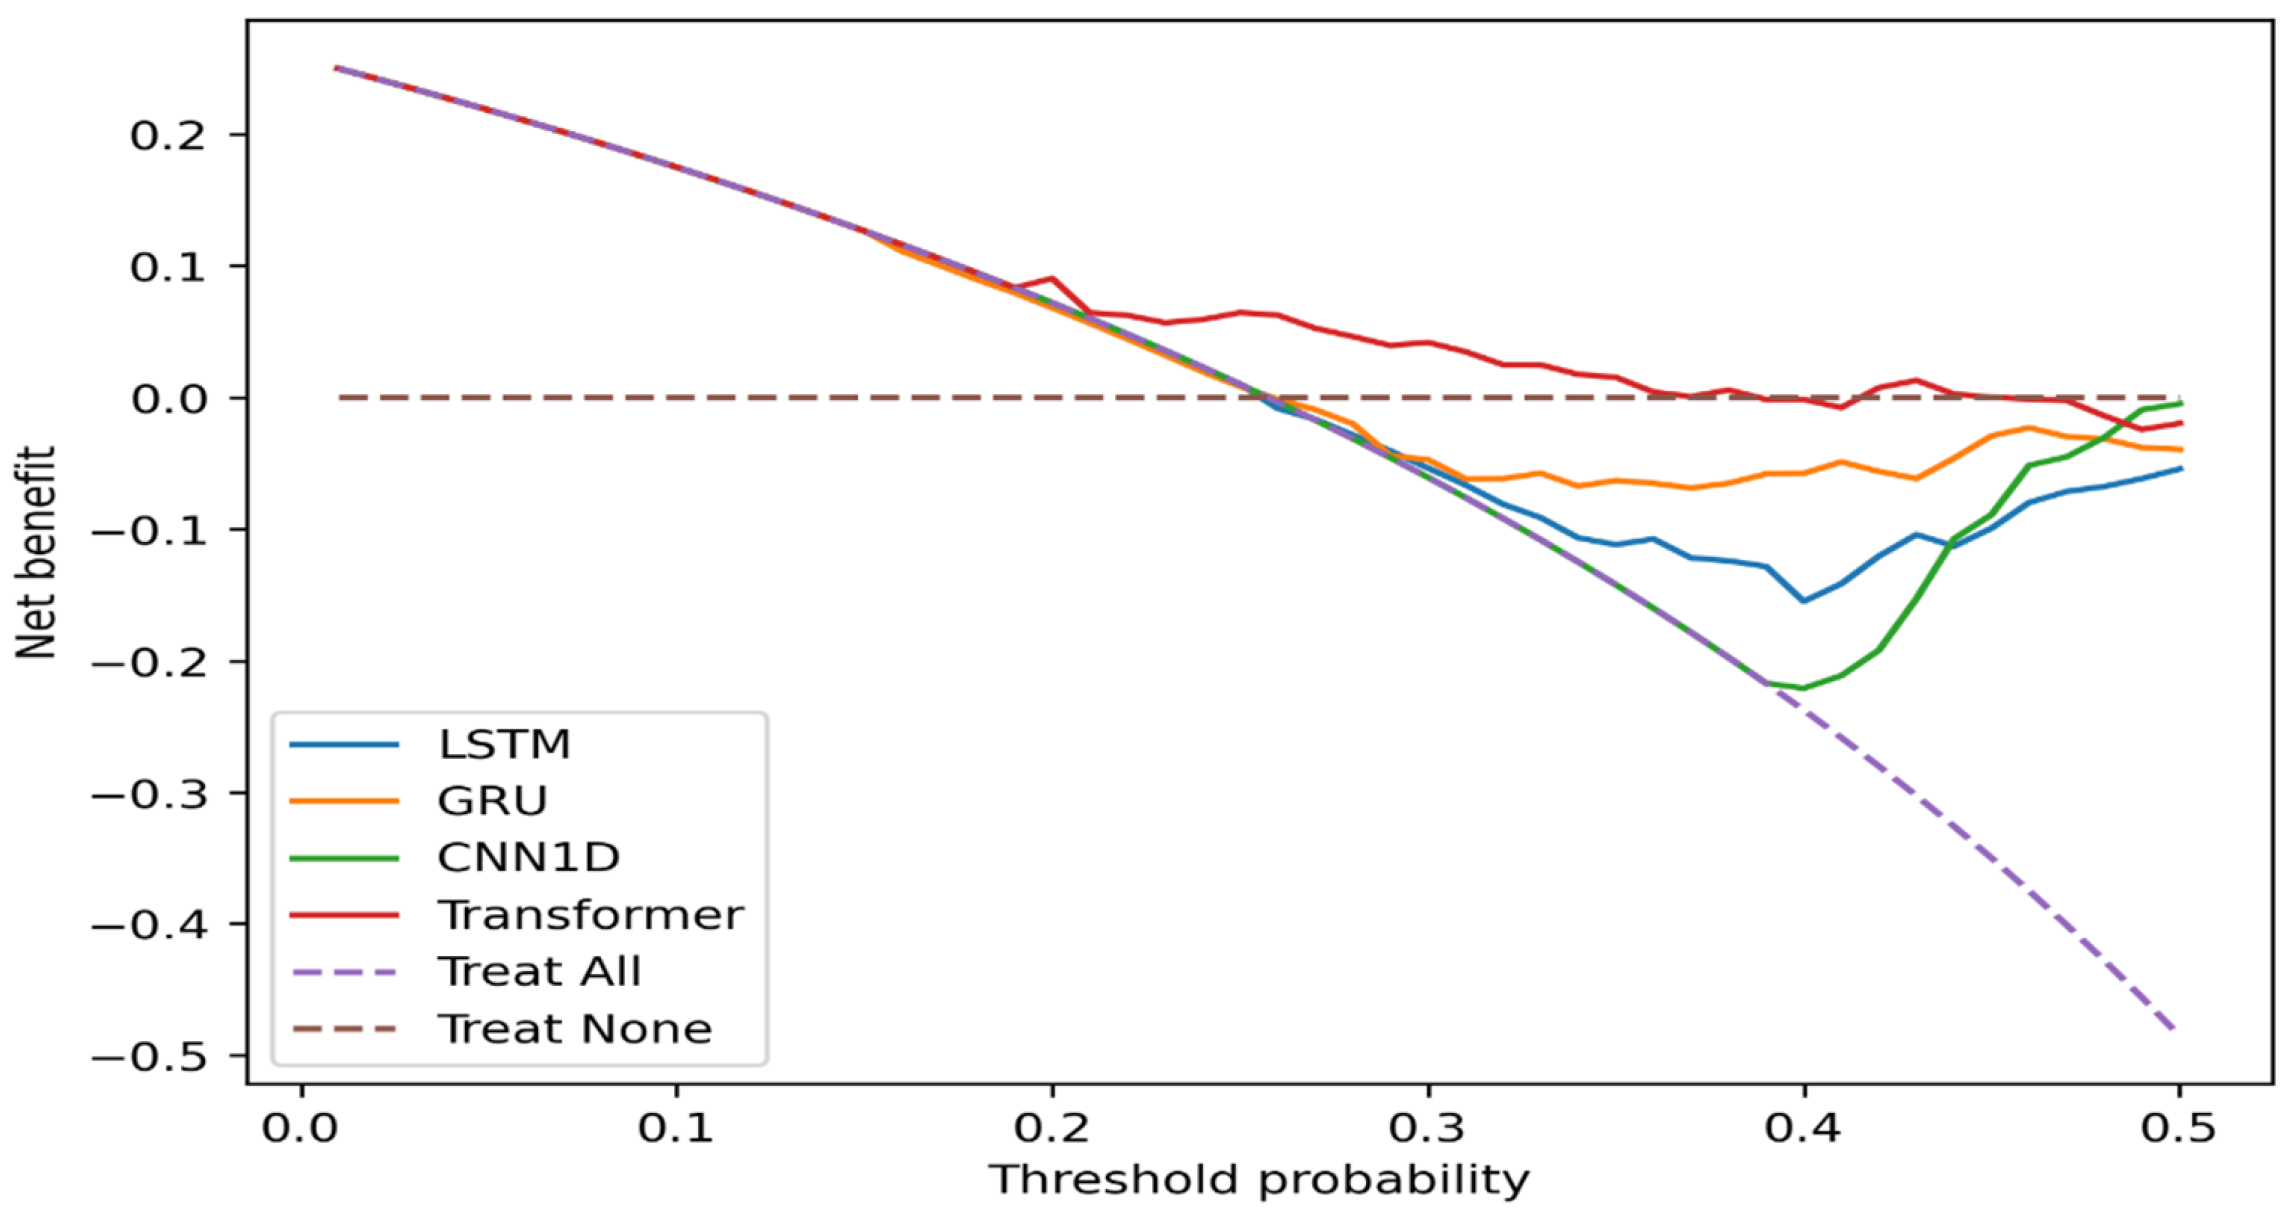
Table 1.
Performance comparison of deep learning models on the test set.
| Model | PR_AUC | ROC_AUC | F1 | Precision | Recall | Specificity | FNR |
| Transformer | 0.5516 | 0.7056 | 0.4167 | 0.4545 | 0.3846 | 0.8400 | 0.6154 |
| CNN1D | 0.5052 | 0.6767 | 0.4646 | 0.4894 | 0.4423 | 0.8400 | 0.5577 |
| GRU | 0.4843 | 0.6404 | 0.4340 | 0.4259 | 0.4423 | 0.7933 | 0.5577 |
| LSTM | 0.4617 | 0.6358 | 0.4425 | 0.4098 | 0.4808 | 0.7600 | 0.5192 |
Disclaimer/Publisher’s Note: The statements, opinions and data contained in all publications are solely those of the individual author(s) and contributor(s) and not of MDPI and/or the editor(s). MDPI and/or the editor(s) disclaim responsibility for any injury to people or property resulting from any ideas, methods, instructions or products referred to in the content. |
© 2026 by the authors. Licensee MDPI, Basel, Switzerland. This article is an open access article distributed under the terms and conditions of the Creative Commons Attribution (CC BY) license (http://creativecommons.org/licenses/by/4.0/).
Copyright: This open access article is published under a Creative Commons CC BY 4.0 license, which permit the free download, distribution, and reuse, provided that the author and preprint are cited in any reuse.


