
Submitted:
06 January 2026
Posted:
08 January 2026
You are already at the latest version
Abstract
Mutations in leucine-rich repeat kinase 2 (LRRK2) are among the most common genetic causes of Parkinson’s disease (PD), yet substantial heterogeneity exists among pathogenic variants. How mutations in distinct functional domains of LRRK2 differentially perturb cellular homeostasis remains incompletely understood. Here, we compared two pathogenic LRRK2 mutations—G2019S in the kinase domain and I1371V in the GTPase domain—across multiple cellular models, including SH-SY5Y and U87 cells, and healthy human iPSC-derived floor plate cells. We demonstrate that the I1371V mutation induces markedly more severe cellular dysfunction than G2019S. I1371V-expressing cells exhibited elevated LRRK2 autophosphorylation at S1292 and robust hyperphosphorylation of Rab8A and Rab10, indicating enhanced downstream signaling. These alterations impaired sterol trafficking, leading to selective depletion of plasma membrane cholesterol without changes in total cellular cholesterol. Consequently, I1371V cells displayed increased membrane fluidity, disrupted microdomain organization, altered membrane topology, reduced Caveolin-1 expression, and impaired dopamine transporter surface expression and dopamine uptake. Lipidomic profiling further revealed broad disruption of lipid homeostasis, including reductions in cholesteryl esters, sterols, sphingolipids, and glycerophospholipids, whereas G2019S cells showed comparatively modest changes. Pharmacological intervention revealed mutation-specific responses, with the non-selective LRRK2 modulator GW5074 outperforming the kinase-selective inhibitor MLi-2 in restoring Rab8A phosphorylation, membrane integrity, and dopaminergic function. Collectively, these findings identify membrane lipid dysregulation as a central cell-biological mechanism in LRRK2-associated PD and underscore the importance of variant-specific therapeutic strategies.
Keywords:
LRRK2
; GTPase domain mutation
; membrane lipid homeostasis
; Parkinson’s disease
; Rab8A / Rab10 phosphorylation
; cholesterol trafficking
; dopamine transporter dysfunction
; variant-specific therapeutics
1. Introduction
An increasing number of clinical reports on Parkinson’s disease (PD) associated with LRRK2 highlight the heterogeneity of clinical parameters across mutant variants, including disease severity [1,2,3], progression [4,5,6], age of onset [7], brain pathology [8,9,10], drug-response [11,12], autophosphorylation, and substrate phosphorylation [13,14]. Among the LRRK2 variants, the G2019S mutation is the most prevalent and most extensively studied, exhibiting a typical PD-syndrome with relatively mild non-motor symptoms and slower disease progression, along with low rates of REM Sleep Behavior Disorder (RBD) [15,16]. In contrast, patients with LRRK2 GTPase mutations, particularly the I1371V variant, experience severe motor symptoms along with cognitive impairment. Importantly, individuals with the I1371V mutation also demonstrate a significantly lower response to levodopa and deep brain stimulation (DBS) therapy compared to those with the G2019S mutation [11,12]. Furthermore, these mutant variants also differ in terms of age of onset, with patients with the I1371V mutation tending to have an earlier presentation of symptoms [7,12].
The I1371V variant of LRRK2, initially identified by Paisán-Ruíz and colleagues in 2005 within an East Indian family, has since been reported in East Asian PD patients, as well as in two individuals from an Italian family and two other French families [1,17]. In contrast, the G2019S variant is more prevalent among Caucasian and Ashkenazi Jewish populations, with prevalence in the Indian population below 0.1% [18]. Additionally, other mutations in the GTPase domain of LRRK2, such as R1441C/G/H (with R1441G being prevalent in the Basque population), further highlight the complex genetic landscape of LRRK2-associated PD [19,20].
PD-causing LRRK2 mutations result in gain-of-function effects by activating kinase activity. Mutations in the kinase domain (such as G2019S) directly elevate kinase activity, while Roc domain mutations sustain LRRK2 in a GTP-bound kinase-active state by impeding GTP hydrolysis, thus prolonging kinase activity [21,22]. Studies have also highlighted differences in phosphorylation patterns including autophosphorylation and substrate phosphorylation between kinase and GTPase domain mutations, demonstrated in knock-in mice models and human samples [13]. Differences in α-synuclein phosphorylation patterns have been observed in rodent models expressing different LRRK2 variants (G2019S and R1441C), affirming distinct phosphorylation profiles among LRRK2 variants. There are yet no published studies on substrate and auto-phosphorylation in the I1371V variant. Cooper et al. (2013) described differences in impact of LRRK2 variants (G2019S and R1441C) on mitochondrial function and drug response in vitro, underscoring the diverse effects of LRRK2 mutations on cellular processes [23].
Heterogeneity in LRRK2 function extends beyond mutant variants to variability across different cell-types [24], emphasizing the importance of selecting appropriate cell types for cause-and-effect studies. For instance, Liou et al. (2008) observed no differential effects between wild-type (WT) LRRK2 and mutants in HEK293T cells, while overexpression of mutant LRRK2 led to a 20% reduction in cell viability compared to WT LRRK2 in SH-SY5Y cells [25]. In addition, there are stark differences in membrane composition between humans and rodents, including variations in phospholipid percentage and levels of lipid metabolites [26]. Moreover, the stability of the LRRK2 protein and its degree of binding to substrates and effector proteins differ between rodents and humans, further complicating the study of PD pathology in these models [27].
Our previous research has demonstrated the PD pathology in dopaminergic neurons [28] and astrocyte dysfunction [22], both differentiated from LRRK2 I1371V mutation-carrying PD patient iPSCs, which were in coherence with other clinical findings [29]. The toxic gain-of-function of this variant in astrocytes was also replicated in U87 cells transfected with I1371V LRRK2 [22].
In addition to Rab10, LRRK2 phosphorylates Rab8A, which is crucial for LDL cholesterol delivery to the plasma membrane [30,31], potentially contributing to the reduced plasma cholesterol observed in human LRRK2 R1441G mutation carriers [32]. Rab8A, along with its interaction partners, also regulates endosomal egress. During lysosomal stress, LRRK2 is recruited to damaged lysosomes, where it is potentially involved in membrane repair and traffic reactions [33,34,35]. Recent studies using purified LRRK2 have also demonstrated its membrane-remodeling properties [36], though the impact of LRRK2 mutants on membrane cholesterol and fluidity remains poorly understood. Reyes et al. (2013) reported variant-specific differences in membrane protein (D2 and DAT) expression [37], suggesting potential modification of vesicle docking and membrane composition. Considering the crucial role of membrane cholesterol in the dynamics and cell surface expression of receptors and transporters involved in dopamine sensing and uptake, it is essential that the membrane dynamics of these mutants, particularly their Rab8A phosphorylation, is investigated further. Here, we aimed to assess and compare the impact of G2019S and I1371V mutant variants on membrane cholesterol content, fluidity, and lipid raft expression, along with substrate and auto-phosphorylation, as well as the corresponding cell-surface expression of receptors and transporters. Gain-of-function studies were conducted in SH-SY5Y, U87, and Floor Plate Cells (FPCs) derived from healthy control iPSCs to investigate these parameters.
2. Materials and Methods
2.1. Ethics Approval
The study received approval from the Institutional Committee of Stem Cell Research (IC-SCR) at the National Institute of Mental Health and Neuro Sciences (NIMHANS), under approval number SEC/01/005/B.P. Informed consent was obtained in accordance with IC-SCR guidelines. The study was also cleared by Institutional Ethics Committee under IEC approval number NIMHANS/IEC/2022.
2.2. Generation of Floor Plate Cells (FPCs) from Induced Pluripotent Stem Cells (iPSCs)
Floor plate cells (FPCs) were derived from iPSCs following previously established protocols [29,38,39]. Briefly, healthy control iPSCs (NIMHAi006-A) were cultured on mouse embryonic fibroblast feeder layers treated with mitomycin C (Sigma M4287-5X2MG). The iPSCs were maintained in a medium consisting of DMEM/F-12, 20% Knockout Serum Replacement (Gibco 10828028), 1% penicillin-streptomycin (Gibco 15070063), 1% Glutamax (Gibco 35050061), 1% non-essential amino acids (Gibco 11140050), 0.1 mM 2-mercaptoethanol (Gibco 31350010), and 20 ng/mL FGF-2 (Immunotools 11343627). Once the iPSCs formed compact colonies with clear edges, they were manually picked and transferred using an EVOS M5000 microscope. The cells were then seeded onto Geltrex™-coated 6-well plates at a density of 2.5–3.0 x 10^5 cells per well and cultured in StemFlex medium (Gibco A3349401). After the cells adhered, they were switched to Neural Induction Medium, which included Neurobasal medium (Gibco 10888022) with Neural Induction Supplement (Gibco A1647701), 1% penicillin-streptomycin, and 1% Glutamax, with medium changes every other day. On the seventh day of neural induction, the resulting neural progenitors (NPs) were passaged enzymatically using StemPro™ Accutase™ (Gibco A1110501) and replated at a density of 0.5–1.5 x 10^5 cells/cm^2. The medium was then changed to Neural Expansion Medium (NEM), which consisted of a 1:1 mix of Neurobasal Medium and Advanced DMEM/F-12 (Gibco 12634010), supplemented with 1X Neural Induction Supplement, 1% penicillin-streptomycin, and 1% Glutamax. The neural progenitors were cultured in NEM with 25 ng/mL FGF8 (Immunotools 11344836) for an additional 7 days to promote midbrain patterning and generate FPCs.
2.3. Cell Culture & Transfection and LRRK2 Inhibitor Treatments
The SH-SY5Y and U87 cell lines were cultured in Dulbecco’s modified Eagle’s medium/F12 (DMEM/F12) enriched with 10% fetal bovine serum (FBS) (Himedia), 1X Glutamax, and 100 μg/mL penicillin/streptomycin, and incubated at 37 °C in a 5% CO2.
The SH-SY5Y and U87 transfection was performed as earlier [22,39] wherein cells were cultured and maintained in DMEM/F12 supplemented with 10% fetal bovine serum (FBS), 1% penicillin-streptomycin, and Glutamax (all from Invitrogen). Cells were transfected using the jetPRIME DNA transfection reagent (Polyplus-transfection_ SA) with the pDEST51-LRRK2-WT (Catalog No.: #25080), pDEST51-LRRK2-G2019S (Catalog No.: #29401), pDEST51-LRRK2-I1371V plasmid (Addgene plasmid #29399) and an empty vector (EV) for a duration of 18 h. After transfection, cells were selected against 2mg/mL blasticidin (Invitrogen) for 48 h. The transfection efficiency was assessed by examining the expression of V5-tagged LRRK2 protein using fluorescence-activated cell sorting (FACS) along with the expression for LRRK2 (Supplementary Figure 1A-F). Transfected cells successfully showed higher LRRK2 expression along with >80% immunopositive population for V5 tag in comparison to the empty vector (EV) (Supplementary Figure 1B & E; P > 0.05 for SH-SY5Y cells and P > 0.001 for U87 cells). WT-transfected cells were used as controls for the G2019S and I1371V mutant groups to ensure comparable LRRK2 expression across conditions, thereby minimizing effects arising from WT overexpression and enabling accurate assessment of mutant-specific phenotypes.
During the seventh day of the FPCs stage, the FPCs were transfected with jetPRIME_ DNA transfection reagent (Polyplus-transfection_ SA) using the pDEST51-LRRK2-WT (Catalog No.: #25080), pDEST51-LRRK2-G2019S (Catalog No.: #29401), pDEST51-LRRK2-I1371V plasmid (Addgene plasmid #29399) and an EV for a duration of 4 h. Following transfection, the cells were cultured in NEM, supplemented with a basal medium comprising a 1:1 ratio of neurobasal medium and advanced DMEM/F12 (Gibco 12634010), along with 1· neural induction supplement, 25 ng/mL FGF8, and 1% Glutamax. Cultures were maintained at 37oC in a 5% CO2 atmosphere. To ensure stable expression of the V5-tagged EV and LRRK2-WT, LRRK2-G2019S and LRRK2-I1371V, the cells underwent selection against 1.5 mg/mL blasticidin (Invitrogen) for 2 h after transfection. Subsequently, the adherent cells were maintained in NEM. The transfection efficiency of LRRK2-I1371V tagged with V5 in the cells was assessed using FACS and immunofluorescence techniques (Supplementary Figure 2).
Treatments: LRRK2-I1371V transfected SH-SY5Y and U87 cells were treated with 10 µM of MLi-2 (Catalog No.: 19305) and GW5074 (Catalog No.: 10010368), final concentration made in complete culture media, for 24 hours at 37 °C in 5% CO2 [40].
2.4. Semiquantitative RT-PCR
Reverse transcriptase PCR was performed on the transfected cell groups to analyze LRRK2 gene expression. Total RNA was extracted using TRIzol-LS Reagent (Catalog No.: 15596018), and 1 μg of RNA was reverse transcribed into complementary DNA (cDNA) with TaKaRa PrimeScriptTM RT Reagent kit (Catalog No.: RR037A). TaKaRa EmeraldAmp PCR Master Mix (Catalog No.: RR310A) was used to amplify LRRK2 gene using the following primers: for LRRK2—Forward: 5’-ATGAGATATGCACTCTTCTG-3’, Reverse: 5’-GCATGGATCCCAATGC-3’; and for the housekeeping gene 18S—Forward: 5’-CGGCTACCACATCCAAGGAA-3’, Reverse: 5’-GCTGGAATTACCGCGGCT-3’.
2.5. Immunophenotyping
Transfected cells were harvested and suspended in Phosphate saline buffer (PBS), then centrifuged at 300 g for 5 minutes. The cell pellets were fixed overnight at 4 °C in 2% Paraformaldehyde (Sigma P6148). For intracellular staining, cells were permeabilized with 0.1% Triton-X100 (Himedia RM845) for 20 minutes; this step was omitted when staining for cell surface (DAT) and lipid raft (Caveolin1) markers. The cells were subsequently blocked with 3% BSA (HIMEDIA MB083) for 45 minutes. After blocking, cells were incubated overnight at 4 °C with primary antibody diluted 1:100. The primary antibodies against LRRK2, LRRK2 (phosphorylated at S935), LRRK2 (phosphorylated at S1292), V5 tag, Rab8A, Rab10, Rab8A (phosphorylated at T72), Rab10 (phosphorylated at T73), Caveolin 1 and DAT were used, followed by secondary antibodies (Alexa Fluor®405, Alexa Fluor®488 or Alexa Fluor® 647) against respective primary antibodies, staining (dilution: 1:200) at room temperature for 90 minutes. The stained cells were resuspended in 500 µL of sheath fluid (BD Biosciences, 342003) and analyzed on a BD FACSVerse flow cytometer (BD Biosciences), recording 10,000 events per sample and cells stained only with secondary antibody was used for gating. Data were analyzed using FACS Suite software (BD Biosciences) to generate scatter plots.
2.6. Immunocytochemistry
SH-SY5Y cells were grown on 12 mm coverslips and, once confluent, were fixed with 4% paraformaldehyde (PFA) (Sigma P6148) and permeabilized using 0.1% Triton X-100 (Himedia RM845) for 15 minutes; this step was omitted when staining for cell surface (DAT) and lipid raft (Caveolin1) markers. Afterward, cells were blocked for 45 minutes with 3% BSA (HIMEDIA MB083) in PBS. Primary antibody staining was performed at a 1:100 dilution and incubated overnight at 4 °C. The primary antibodies against LRRK2, LRRK2 (phosphorylated at S935), LRRK2 (phosphorylated at S1292), V5 tag, Rab8A, Rab10, Rab8A (phosphorylated at T72), Rab10 (phosphorylated at T73), Caveolin 1 and DAT were used, followed by secondary antibodies (Alexa Fluor®405, Alexa Fluor®488 or Alexa Fluor® 647) against respective primary antibodies, staining (dilution: 1:200) at room temperature for 90 minutes. Nuclei were counterstained with DAPI (4’,6-diamidino-2-phenylindole dihydrochloride; Sigma) for 2 minutes at a 1:400 dilution. Coverslips were mounted onto glass slides using DABCO, and imaging was carried out with an Axio Observer.Z1/7 and ZEISS LSM 980 confocal microscope equipped with a Plan Apochromat 40X/1.3 Oil DIC (UV) VIS-IR M27 objective. Images were acquired using ZEISS ZEN 3.7 software (RRID: SCR_013672) with fluorescence contrast, detector gain set to 650V, and pinhole sizes of 1 AU/35 μm for Track 1 (AF488) and AU/29 μm for Track 2 (DAPI). The excitation/emission wavelengths used were 488/517 nm for AF488 and 405/495 nm for DAPI. Images were captured at a resolution of 2791×2791 pixels with 8-bit depth and an effective numerical aperture (NA) of 1.3, and analyzed using ImageJ v1.52f (RRID:SCR_003070). Immunocytochemical controls were performed using only secondary antibodies, with nuclei counterstained with DAPI, to verify the absence of non-specific secondary antibody binding (Supplementary Figure 7).
2.7. Immunoblotting
Protein lysates were prepared from cell cultures, and 40 µg of total protein was loaded per lane, consistent with previously published protocols [22]. Proteins were separated using SDS–PAGE and transferred onto PVDF membranes using a semidry transfer system along with PageRuler Prestained NIR Protein ladder (Thermo Scientific #26635). Membranes were blocked with 5% BSA and incubated with primary antibodies (1:1000 dilution) against p-Rab8A, Rab8A, p-Rab10, Rab10, p-LRRK2 (S1292), LRRK2, and β-actin. Secondary detection was performed using AzureSpectra 800 anti-mouse, for β-actin, and 700 anti-rabbit antibodies (Azure Biosystems), for p-Rab8A, Rab8A, p-Rab10, Rab10, phospho-LRRK2 (S1292) and LRRK2, at 1:10000 dilution. Membranes were washed with TBST (0.1% Tween-20) between each step. Fluorescent signals were visualized using the Azure Biosystems Sapphire FL Imaging System. Densitometric quantification was performed for phospho-Rab8A/total Rab8A, phospho-Rab10/total Rab10, and phospho-LRRK2 (S1292)/total LRRK2, each normalized to β-actin, and expressed as relative density. Data analysis was carried out using ImageJ v1.52f (RRID:SCR_003070). Full immunoblot images are provided in Supplementary Figures 8 & 9.
2.8. Measurement of Membrane Fluidity
6 x 10⁵ cells were harvested in Tris-KCl buffer (pH 7.4), and 10 µM of TMA-DPH (Catalog No.: T204) was added to the cells, followed by incubation for 10 minutes at room temperature. The cells were then transferred to a Thermo-Nunc Flat Black 96-well plate, and fluorescence polarization was measured using the Spark® Multimode Reader (Tecan) at an excitation/emission wavelength of 340/430 nm. The anisotropy readings were analysed using the following formula [41]:
Anisotropy (r) = (Ivv - Gf × Ivh)/(Ivv + 2 × Gf × Ivh)
Where, Gf = Ivv/Ivh
Ivv = emitted parallel light intensity
Ivh = emitted perpendicular light intensity
Quantification of total cellular cholesterol
5 x 10⁶ cells were harvested in a complete lysis buffer (RIPA) and incubated on ice for 90 minutes. To the cells, 300 µL of RIPA lysis buffer (containing 150 mM NaCl, 50 mM Tris pH 8, 2 mM DTT, 1 mM EDTA, and 1% Triton X, along with SDS, DNase, a protease inhibitor cocktail, and PMSF) was added. The organic fraction containing cellular cholesterol was extracted using Folch’s Lipid extraction method [42]. Briefly, 800 µL of chloroform and 400 µL of methanol was added to the isolated cell lysate and the mixture was then centrifuged at 13500 g for 15 minutes at 4 °C. The lower organic phase, which contained cholesterol, was collected and analyzed using a Cholesterol ELISA with the Total Cholesterol (TC) Colorimetric Assay Kit (Elabscience E-BC-K109-S) to quantify total cellular cholesterol. Optical Density (OD) of the colored compound benzoquinone imine phenazone was measured using a spectrophotometer (Tecan Spark multimode microplate reader) at 510 nm. The calculated cholesterol concentration in the sample was normalized to the cell number.
2.9. Quantification of Membrane Cholesterol
Quantification of membrane cholesterol was done as per our pervious study [39]. Briefly, 10 x 106 cells were harvested in 1 mL of homogenization buffer (containing 250 mM sucrose, 1 mM EDTA, and 10 mM Tris-HCl, pH 7.2) and homogenized using a Cole-Parmer homogenizer. The cells were then sonicated at 30% amplitude with 3-10 second pulses, allowing for 5-second intervals between pulses, and subsequently centrifuged at 700 g for 10 minutes at 4 °C. The supernatant, which contained the soluble cytosolic fraction, was collected and subjected to ultracentrifugation at 100,000 g for 1 hour at 4 °C. The resulting pellets, which contained the cellular membrane fraction, were dissolved in complete lysis RIPA buffer and the organic fraction containing cellular cholesterol was extracted using Folch’s Lipid extraction method [42]. Cholesterol quantification was performed from the isolated organic phase using a Total Cholesterol (TC) Colorimetric Assay Kit (Elabscience E-BC-K109-S) as described in the above section. The calculated cholesterol concentration in the sample was normalized to the cell number.
2.10. Quantification of Cellular Dopamine Uptake
WT, G2019S and I1371V transfected SH-SY5Y cells were plated onto 24 well plate and upon confluency treated with 50 µM Dopamine (Catalog #H8502G, Sigma-Aldrich), for 2 hours at 37 °C. Extracellular dopamine was then removed and the cell lysate was collected which was then used to measure cellular dopamine content using Dopamine ELISA kit (Catalog #K12-1302, KINESISDx) according to the manufacturer’s instructions. Obtained colorimetric values were then plotted in a cubic spline curve of standard values and the unknown concentrations were calculated.
2.11. Atomic Force Microscopy
WT, G2019S and I1371V transfected SH-SY5Y cells were plated onto 22 mm coverslips and upon confluency fixed with 4% PFA. After fixation cells were air dried overnight. The Atomic Force Microscopy (AFM) images were taken in non-contact scanning mode with the scanning size 5.00 x 5.00 µm (X×Y) in NX20 (PARK Systems), using SCOUT_70_RAI probe. To find the nature of observed microdomains, WT-transfected SH-SY5Y cells were treated with 5 mM methyl-beta-cyclodextrin (MꞵCD) for 15 minutes at 37 °C for cholesterol depletion and cells were then subjected to atomic force microscopy.
2.12. Membrane Lipid Extraction
10 X 106 cells were harvested in 1 mL of homogenization buffer (containing 250 mM sucrose, 1 mM EDTA, and 10 mM Tris-HCl, pH 7.2) and homogenized using a Cole-Parmer homogenizer. The cells were then sonicated at 30% amplitude with 3-10 second pulses, allowing for 5-second intervals between pulses, and subsequently centrifuged at 700 g for 10 minutes at 4 °C. The supernatant, which contained the soluble cytosolic fraction, was collected and subjected to ultracentrifugation at 100,000 g for 1 hour at 4 °C. The resulting pellets, which contained the cellular membrane fraction, were dissolved in complete lysis RIPA buffer and the organic fraction containing cellular cholesterol was extracted using Folch’s Lipid extraction method [42]. 10 µL of SPLASH™ LIPIDOMIX™ Mass Spec Standard (Catalog No.: 330707) was added to each sample before lipid extraction.
2.13. LC-MS/MS Protocol
Isolated organic phase was sent for lipidomics study at Centre for Cellular and Molecular Platforms (C-CAMP), GKVK Post, Bengaluru. Chromatography was performed using Dionex Ultimate3000 UHPLC LC setup, injection volume: 5µL. Column used was C 18 Waters Aquity BEH 2.1*100, 1.7 μm, where Mobile phase A and B was 60: 40 ACN: Water in 10mM Ammonium Formate (0.1% FA) and 80: 20 IPA: ACN in 10mM Ammonium Formate (0.1% FA), respectively. Flow rate was 0.15 ml/min and Run time 25 minutes. Column Oven and Auto-sampler Temperature was set at 45℃ and 10℃, respectively. The gradient was run as follows: 0-1mins: 0%B, 1-5mins: 0-40%B, 5-7.5mins: 40-64%B, 7.5-12mins: 64%B, 12-12.5mins: 64-82.5%B, 12.5-19mins: 82.5-85%B, 19-20mins: 85-95%B , 20- 20.1mins: 95-0%B, 20.1- 24.9mins: 0%B. Lipid extracts were analyzed using a Thermo Fisher Q Exactive mass spectrometer operated in both positive and negative ion acquisition modes with the survey scan over the mass range 200–1,200 at resolution of 70 K and cycle time of about 1s. Data was analyzed in ‘mzmine’ Software. Lipid peak areas (n = 3) were normalized to their respective internal standards, and intergroup comparisons were performed to assess statistical significance. Aligned data (including lipid identity, retention time, peak area, p-values, etc.) were exported to Excel. Lipids with statistically significant differences (p < 0.05) were selected for heatmap visualization.
2.14. Statistical Analysis
Data are reported as mean ± standard deviation (SD). One way analysis of variance (ANOVA) was used for statistical comparisons, followed by Bonferroni post-hoc analysis, using R software (R Foundation; R Project for Statistical Computing, RRID:SCR_001905). A P value less than 0.05 was considered significant. Graphs were prepared using GraphPad Prism 6 (GraphPad Software; GraphPad Prism, RRID:SCR_002798) or Sigma Plot 12.5. Statistical significance was denoted by &: EV vs WT/GS/IV; ^: WT vs GS/IV/IV MLi-2/ IV GW5074; #: GS vs IV; *: IV vs IV MLi-2/IV GW5074; $: IV MLi-2 vs IV GW5074 and @: WT vs WT-MβCD. Single symbol: P < 0.05; double symbol: P < 0.01; triple symbol: P < 0.001. For all experiments, a sample size of n=3 technical replicates and n=5 biological replicates (from five independent sets of transfected cells) was used, except for the lipidomic study, which had n=3 biological replicates. Data from lipidomic study are represented as Heatmaps showing relative intensity of lipid peak areas, showing significant P values upon comparison between groups, WT: WT-LRRK2 transfected SH-SY5Y, GS: G2019S-LRRK2 transfected SH-SY5Y and IV: I1371V-LRRK2 transfected SH-SY5Y, with Internal Standard-Based Normalization.
3. Results
3.1. Differential Effect of LRRK2 Genetic Variants, G2019S and I1371V, on Membrane Cholesterol and Membrane Fluidity
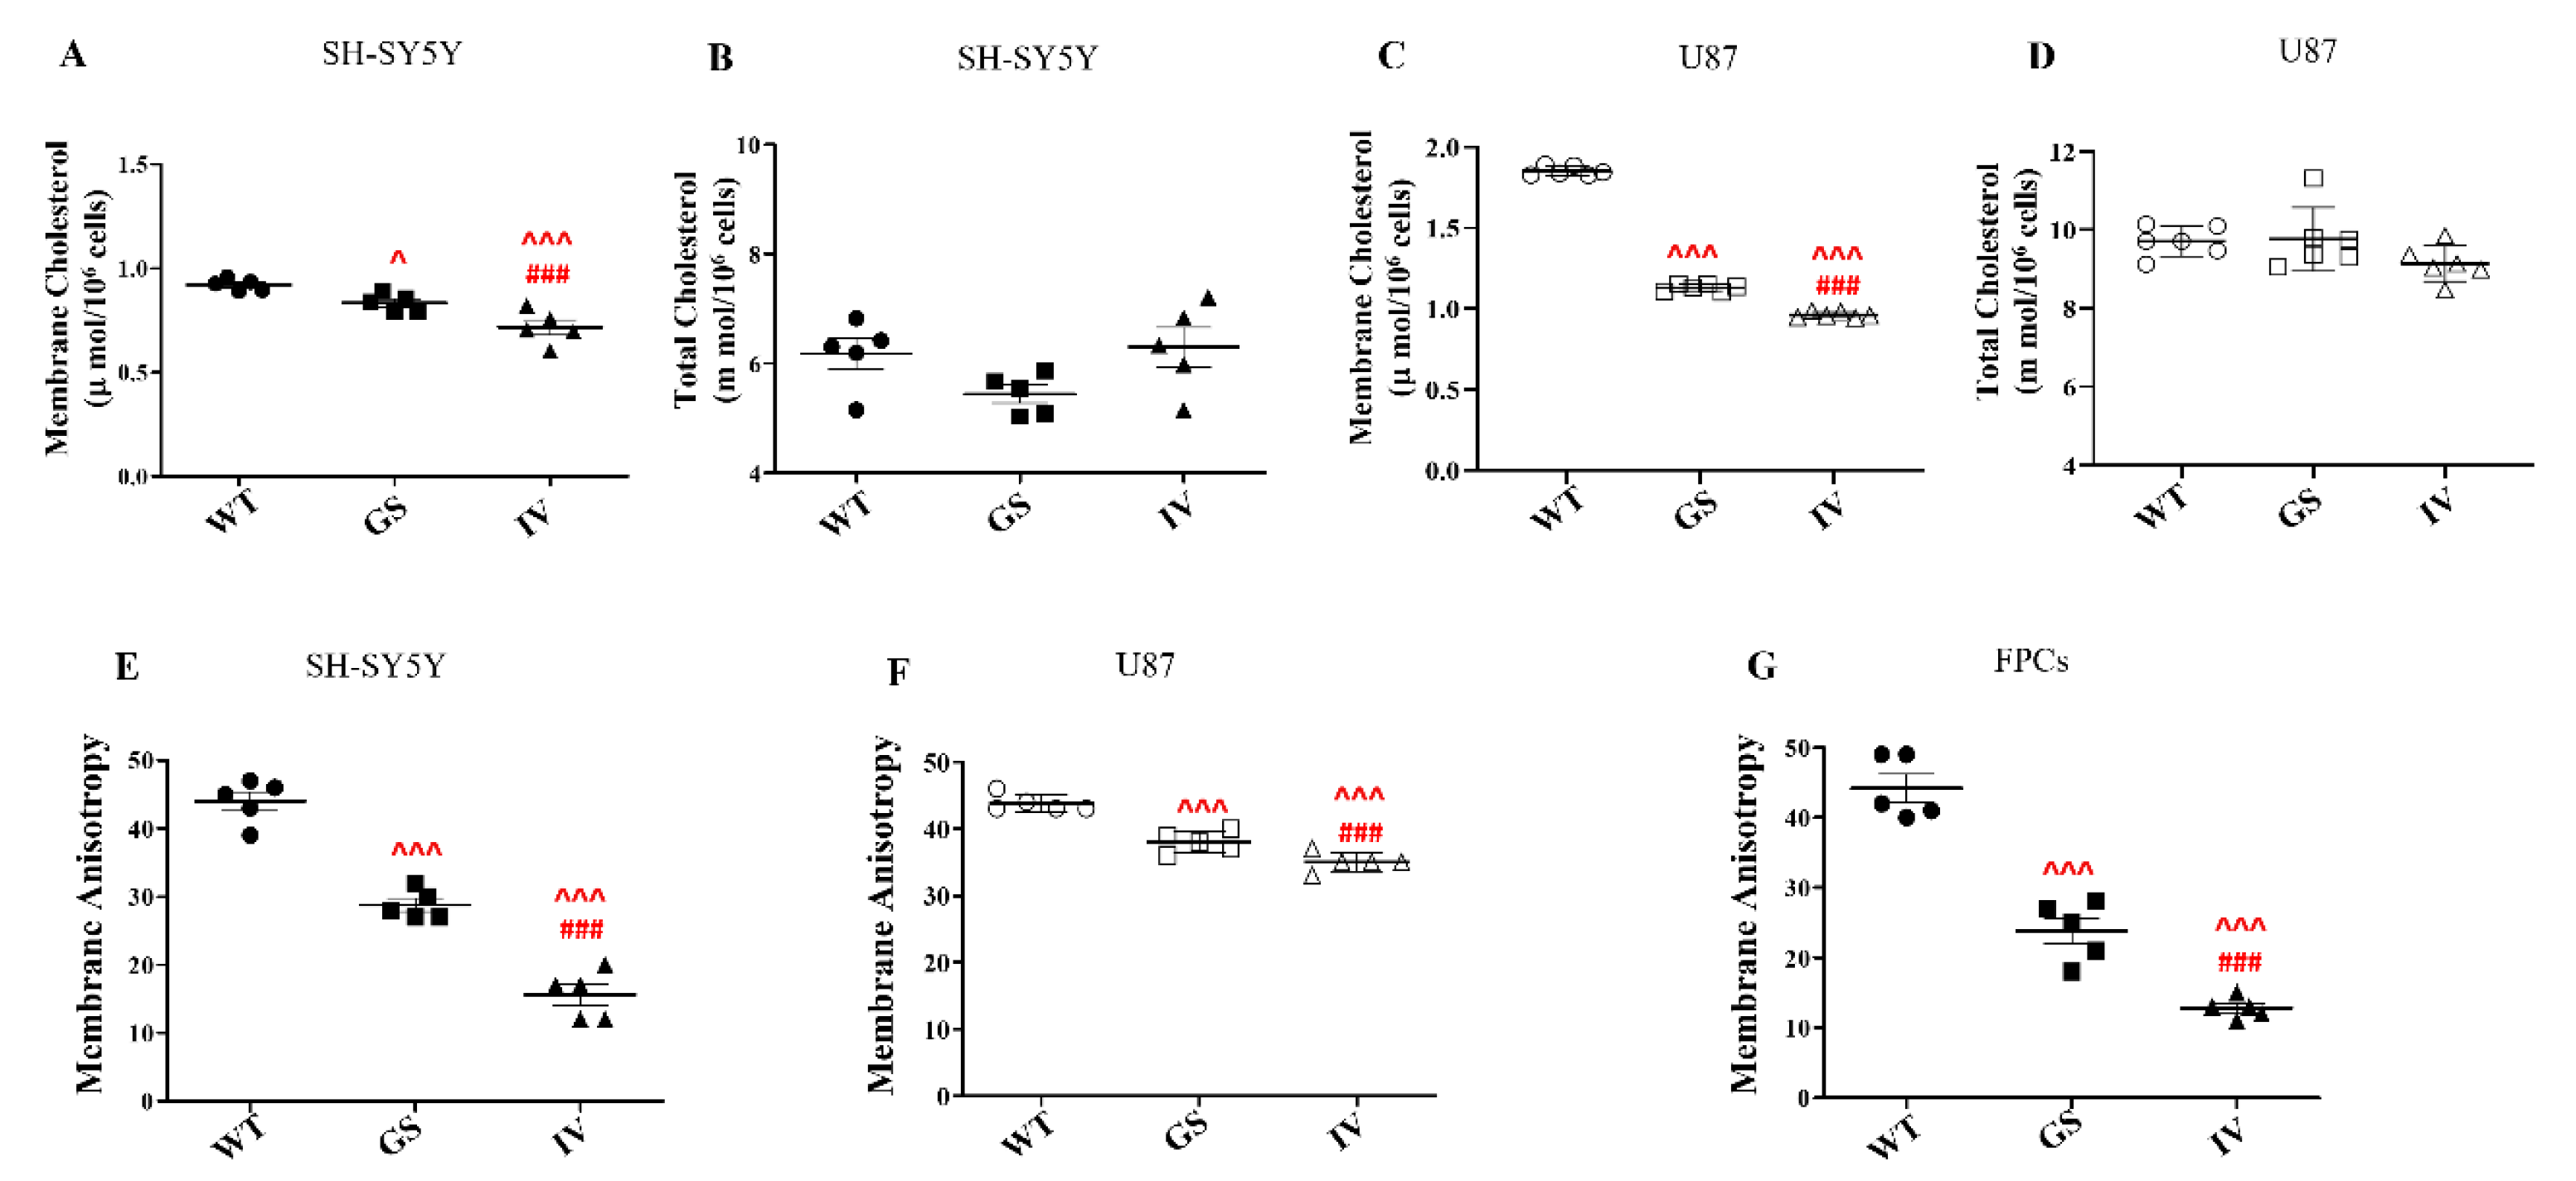
Rab8A, one of the substrates for LRRK2, is recognized for its role in sterol trafficking to the membrane [30,31]. We measured total cholesterol and membrane cholesterol levels in WT, LRRK2 G2019S, and LRRK2 I1371V transfected SH-SY5Y and U87 cells. The total cholesterol content in SH-SY5Y and U87 cells did not differ significantly among WT, LRRK2 G2019S, and LRRK2 I1371V variants (Figure 1B&D; P>0.05). However, membrane cholesterol content was notably lower in LRRK2 I1371V compared to LRRK2 WT (P<0.001) and LRRK2 G2019S (P<0.001) transfected cells (Figure 1A&C). Additionally, LRRK2 G2019S showed lower membrane cholesterol compared to WT in both SH-SY5Y and U87 cells (Figure 1A&C, P<0.05 in SH-SY5Y and P<0.001 in U87).
Membrane cholesterol plays a crucial role in influencing membrane fluidity [43,44], which we assessed using membrane anisotropy measured using TMA-DPH labelling and polarization spectroscopy in live-cells. Membrane anisotropy was significantly lower in SH-SY5Y, U87 and FPCs transfected with LRRK2 G2019S and LRRK2 I1371V variants compared to WT LRRK2 transfected cells (Figure 1E-G; P<0.001). Notably, cells expressing the LRRK2 I1371V variant exhibited the lowest membrane anisotropy, indicating the highest membrane fluidity among the genetic variants tested. This observation suggests that while cholesterol synthesis remained consistent across variants, differences in membrane cholesterol content significantly influenced membrane fluidity.
Figure 1.
Differential effect of LRRK2 genetic variants, G2019S and I1371V, on membrane cholesterol and membrane fluidity. (A, C) Quantification of membrane cholesterol content in WT, LRRK2-G2019S (GS), and LRRK2-I1371V (IV) transfected SH-SY5Y (A) and U87 (C) cells, measured by cholesterol ELISA of isolated membrane fractions (N=5). (B, D) Quantification of total cellular cholesterol content in WT, GS, and IV transfected SH-SY5Y (B) and U87 (D) cells (N=5). (E–G) Membrane anisotropy measurements in WT, GS, and IV transfected SH-SY5Y (E), U87 (F), and floor plate cells (FPCs) (G), determined by fluorescence polarization spectroscopy using TMA-DPH fluoroprobe (N=5). Data is represented as mean ± SD. ^: ANOVA comparison WT vs IV/GS, #: GS vs IV. Single symbol: P < 0.05; double symbol: P < 0.01; triple symbol: P < 0.001.
3.2. Differential Effect of LRRK2 Genetic Variants, G2019S and I1371V, on Cell-Surface Expression of Caveolin 1
Cholesterol, being a key component of lipid rafts [45], was evaluated through the lipid raft marker Caveolin1 in LRRK2 WT, G2019S, and I1371V transfected SH-SY5Y cells, U87 cells, and FPCs. Immunocytochemical analysis revealed substantially lower fluorescence intensity of Caveolin1 cell-surface expression in LRRK2 I1371V transfected cells compared to WT and G2019S variants (Figure 2A-C). FACS analysis showed a significantly lower percentage of Caveolin 1 immunopositive cells in SH-SY5Y cells, U87 cells, and FPCs transfected with LRRK2 I1371V compared to those transfected with LRRK2 WT and LRRK2 G2019S (Figure 2D-F; P<0.001).
Figure 2.
Differential effect of LRRK2 genetic variants, G2019S and I1371V, on cell-surface expression of Caveolin 1. (A–C) Representative confocal images showing cell surface expression of Caveolin-1 in WT, LRRK2-G2019S (GS), and LRRK2-I1371V (IV) transfected SH-SY5Y (A), U87 (B), and floor plate cells (FPCs) (C), detected by immunocytochemistry. (D–F) Flow cytometry analysis of cell surface Caveolin-1 expression in WT, GS, and IV transfected SH-SY5Y (D), U87 (E), and FPCs (F). Representative FACS histograms (left) and quantification of immunopositive cells (right) are shown. Orange line (P1) indicates the gated population; gray/black shaded peak represents the isotype control (N=5). Data is represented as mean ± SD. ^: ANOVA comparison WT vs IV/GS, #: GS vs IV. Single symbol: P < 0.05; double symbol: P < 0.01; triple symbol: P < 0.001.
3.3. Differential Effect of LRRK2 Genetic Variants, G2019S and I1371V, on Plasma Membrane Topology
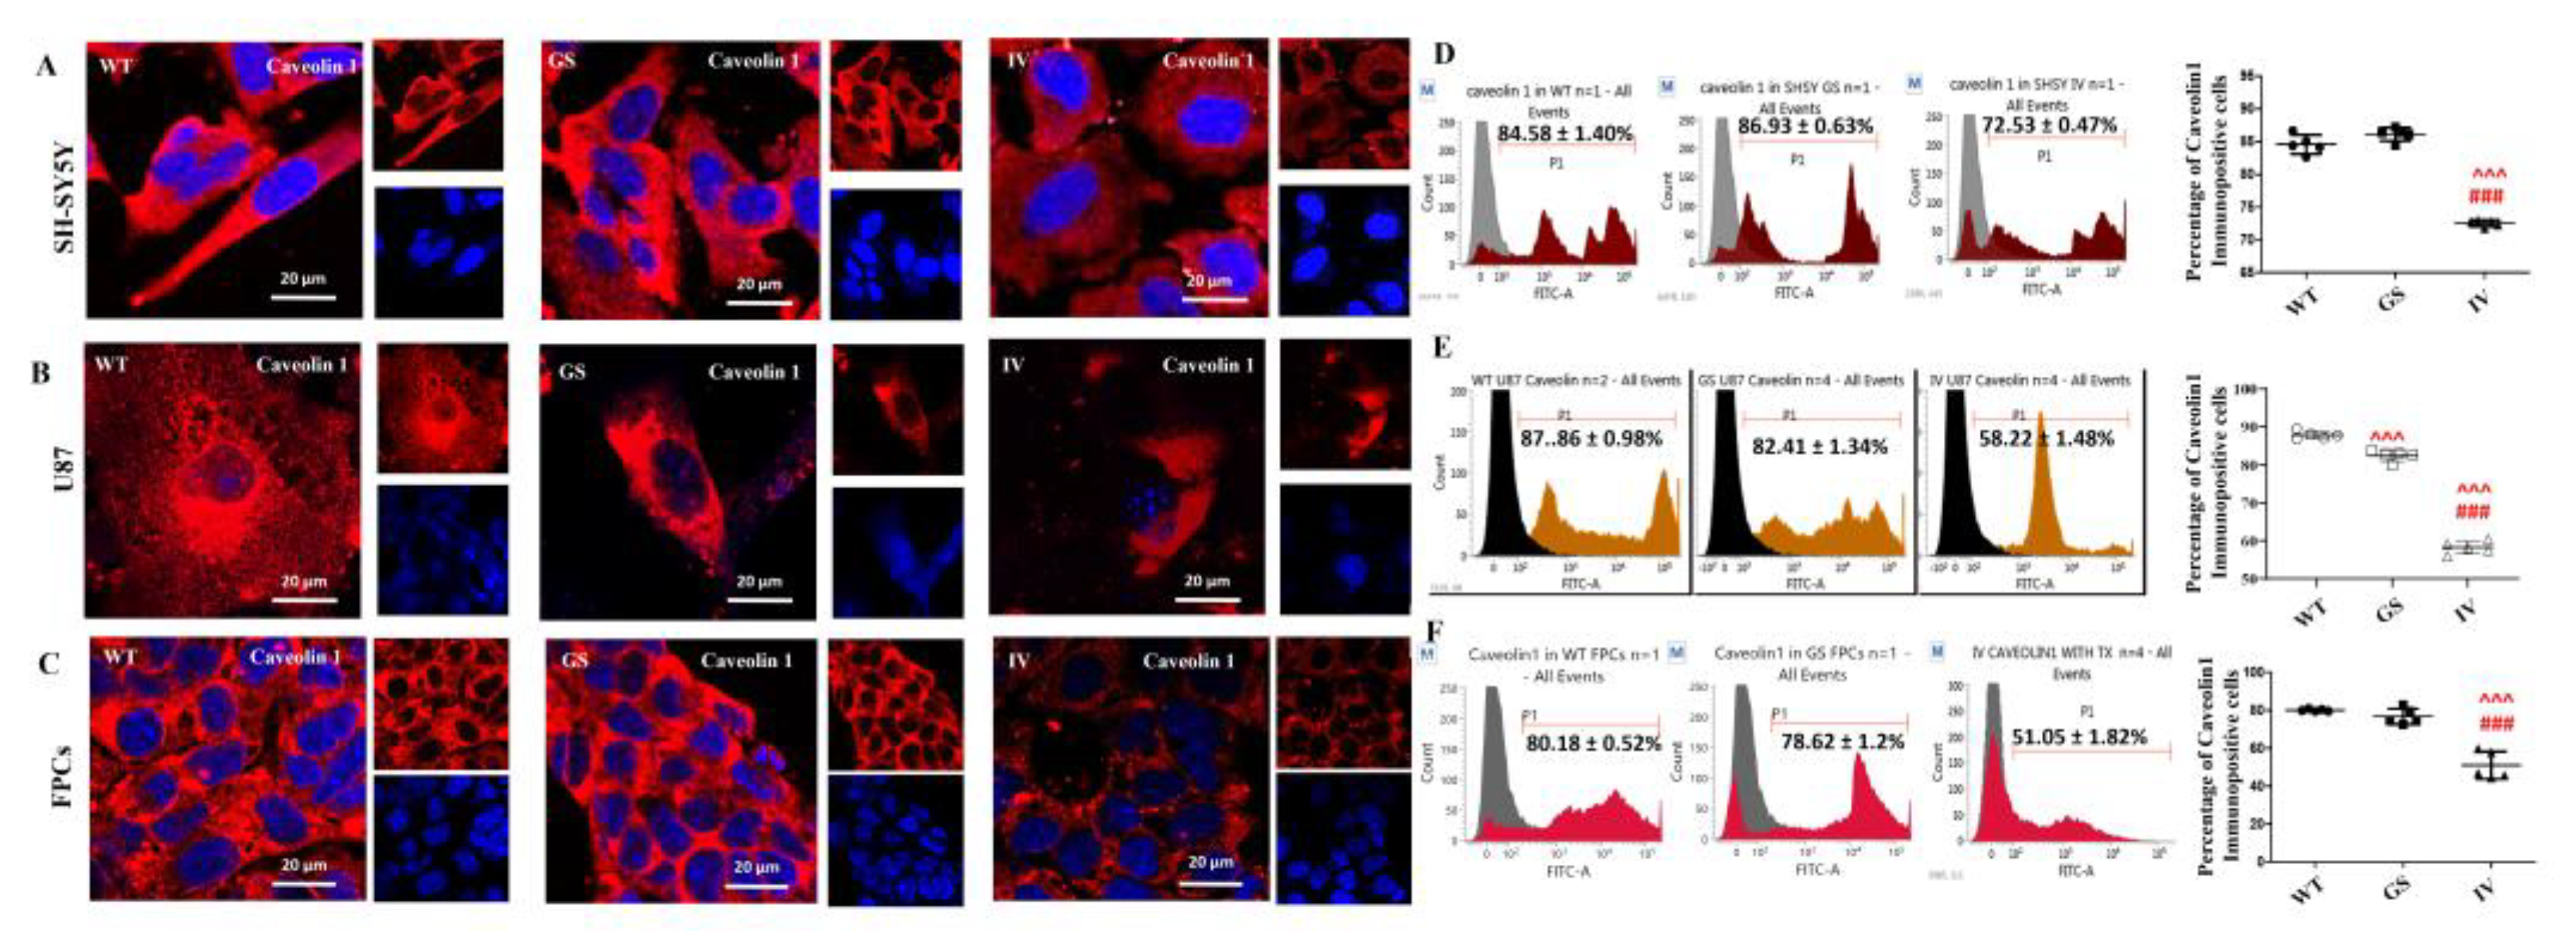
The plasma membrane topology of LRRK2 WT, G2019S, and I1371V transfected SH-SY5Y cells was studied using non-contact mode Atomic Force Microscopy (AFM) [46,47,48]. The AFM images revealed distinct microdomains in cells transfected with LRRK2 WT and G2019S, whereas well-defined microdomains were absent in cells transfected with LRRK2 I1371V (Figure 3A, D & G respectively). The color bar on the left edge of the 2D AFM image provides a height scale for the membrane, with color intensity corresponding to surface elevation or depth. Figures on the right side of the 2D images show high-resolution 3D images detailing the ultrastructure of the plasma membrane topology (Figure 3B, E & H). Cells transfected with LRRK2 I1371V exhibited a less ruffled plasma membrane compared to WT and G2019S (Figure 3C, F & I). The height of the microdomains, denoted by Δz (nm), was measured using Gwyddion software and was significantly lower in I1371V cellular membranes compared to WT and G2019S (Figure 3J; P<0.01 for WT vs IV and P<0.05 for GS vs IV).
To investigate the effect of cholesterol on the microdomains, WT-transfected SH-SY5Y cells were treated with methyl-beta-cyclodextrin (MβCD) for cholesterol depletion. AFM images of these treated cells showed a visible decrease in the number (Figure 3K), membrane ruffles (Figure 3L, M) and height (Figure 3N; P<0.01) of microdomains. The membrane topology of these cholesterol-depleted cells closely resembled that of I1371V transfected cells, suggesting that cholesterol depletion affects microdomain formation. This indicates that the LRRK2 I1371V genetic variant impacts the formation of microdomains or lipid rafts in the membrane.
Figure 3.
Differential effect of LRRK2 genetic variants, G2019S and I1371V, on plasma membrane topology. (A, D, G, K) Two-dimensional (2-D) atomic force microscopy (AFM) images of WT, LRRK2-G2019S (GS), LRRK2-I1371V (IV), and MβCD-treated WT transfected SH-SY5Y cells, respectively. The colour bar indicates membrane height, with colour intensity corresponding to surface elevation or depth. (B, E, H, L) Three-dimensional (3-D) AFM reconstructions of WT, GS, IV, and MβCD-treated WT transfected SH-SY5Y cells, respectively. (C, F, I, M) Representative images highlighting membrane ruffling patterns from the corresponding 2-D AFM images, analyzed using Gwyddion software. (J, N) Quantification of microdomain height (Δz) measured from 2-D and 3-D AFM images of IV (J) and MβCD-treated WT (N) cells, analyzed using Gwyddion software (N=5). Data is represented as mean ± SD. ^: ANOVA comparison WT vs IV/GS, #: GS vs IV, @: WT vs WT-MβCD. Single symbol: P < 0.05; double symbol: P < 0.01; triple symbol: P < 0.001.
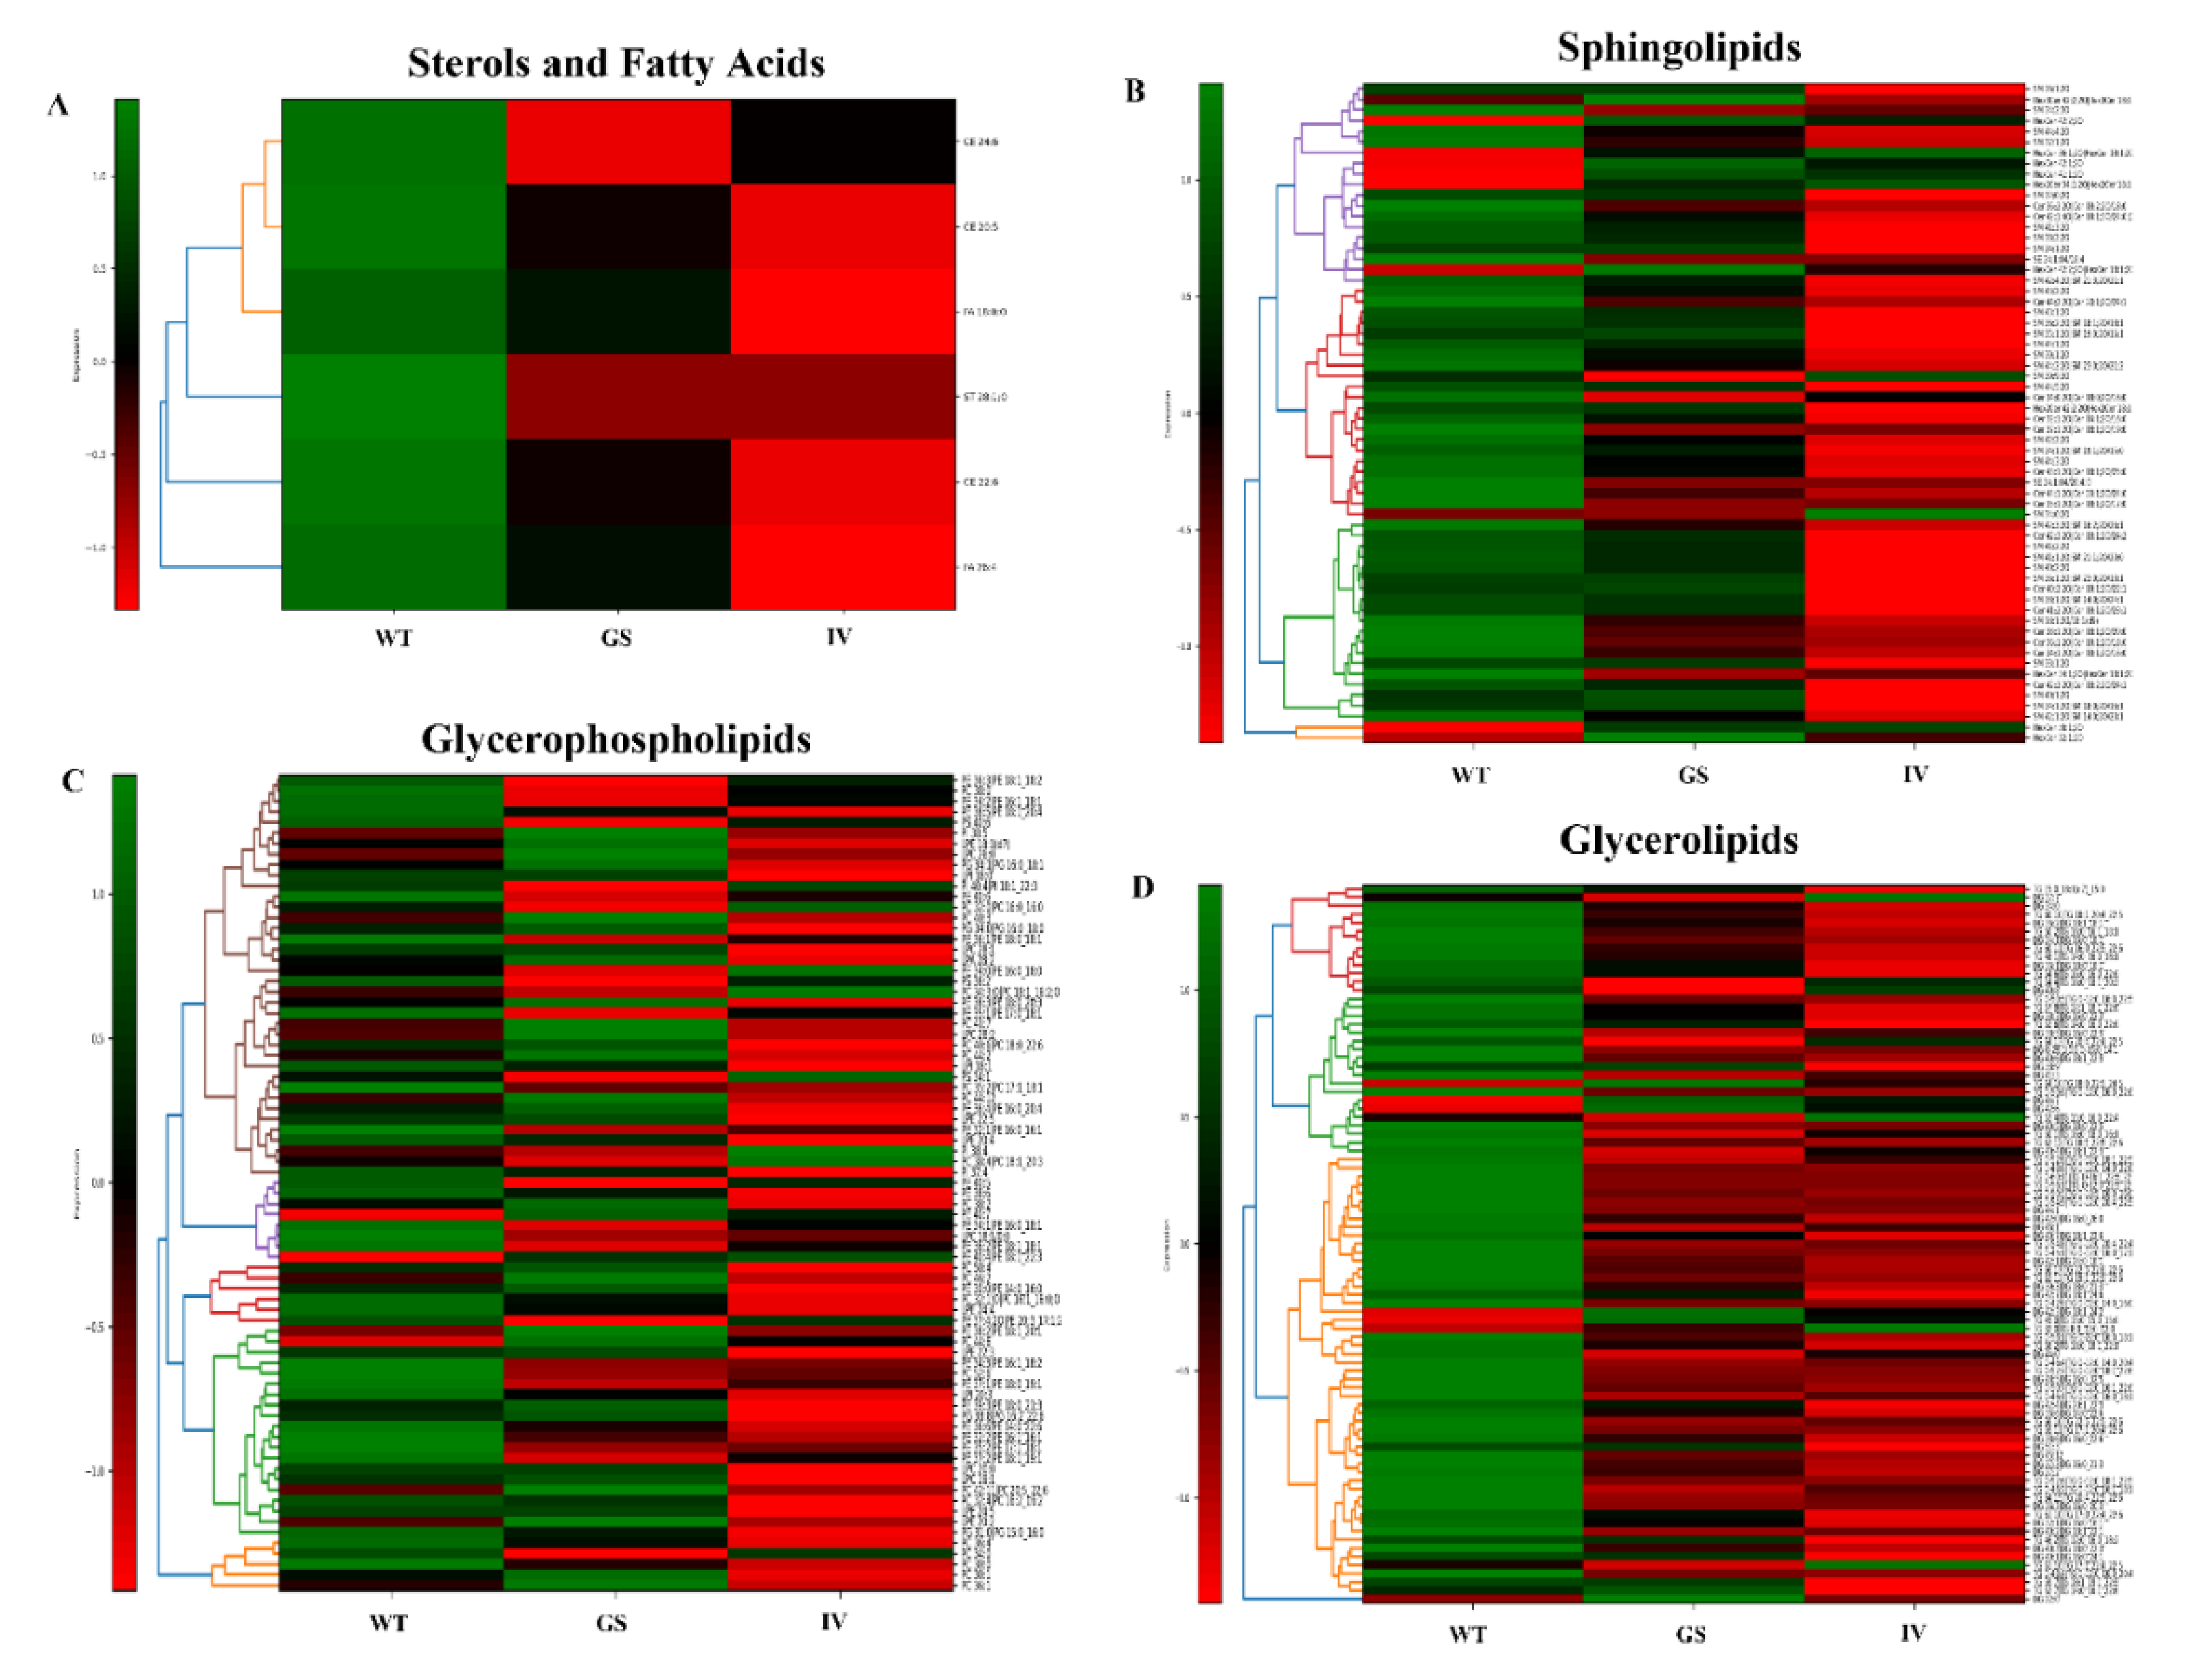
3.4. Altered Membrane Lipid Composition in LRRK2 Mutant Transfected SH-SY5Y Cells
To investigate the differential impact of LRRK2 mutant variants on membrane composition, a lipidomics analysis was performed on isolated membrane fractions from transfected SH-SY5Y cells. Both LRRK2-G2019S and I1371V transfected cells showed a significant reduction in lipid peak areas corresponding to cholesteryl esters (CE), sterols (ST), and fatty acids (FA), with the most pronounced decrease observed in I1371V cells (Figure 4A). Among sphingolipids, including ceramides (Cer), sphingomyelin (SM), steryl esters (SE), and hexosyl ceramides (HexCer, Hex2Cer, and Hex3Cer), a marked decline was evident particularly in LRRK2-I1371V transfected cells (Figure 4B). Interestingly, HexCer species, critical for lipid raft structure, were significantly elevated in LRRK2-G2019S transfected cells compared to WT and I1371V. Additionally, LRRK2-I1371V transfected cells showed a notable decrease in glycerophospholipids—phosphatidylcholine (PC), phosphatidylethanolamine (PE), phosphatidylglycerol (PG), phosphatidylinositol (PI), phosphatidylserine (PS), lysophospholipids [Lysophosphatidylcholine (LPC), Lysophosphatidylethanolamine (LPE) Lysophosphatidylinositol (LIP)] (Figure 4C) —as well as glycerolipids such as triglycerides (TG) and diacylglycerol (DAG) (Figure 4D). Overall, the I1371V mutation resulted in the most severe disruption of membrane lipid composition, suggesting a distinct and potentially more deleterious effect on membrane integrity and function compared to the G2019S and WT.
Figure 4.
Altered membrane lipid composition in LRRK2 mutant transfected SH-SY5Y Cells. A, B, C and D: Representative Heatmaps showing fold change in the lipid peak areas obtained from LC-MS for Sterols and Fatty Acids, Sphingolipids, Glycerophospholipids and Glycerolipids, respectively. Abbreviations: Abbreviations: Ceremide, Cer; Cholesterol Esters, CE; Diglycerides, DG; Dihexosylceramide, Hex2Cer; Fatty acids, FA; Hexosylceramide, HexCer; LipoproteinA LPA; Lysophosphatidylcholine, LPC; Lysophosphatidylethanolamine, LPE; Lysophosphatidylinositol, LPI; Phosphatidylcholine, PC; Phosphatidylethanolamine, PE; Phosphatidylglycerol, PG; Phosphatidylinositol, PI; Phosphatidylserine, PS; Sphingomyelin, SM; Sterol, ST; Triglycerides, TG; Trihexosylceramide, Hex3cer. Sample size N=3.
3.5. Differential Effect of LRRK2 Genetic Variants, G2019S and I1371V, on cell-Surface Expression of DAT and Dopamine Uptake
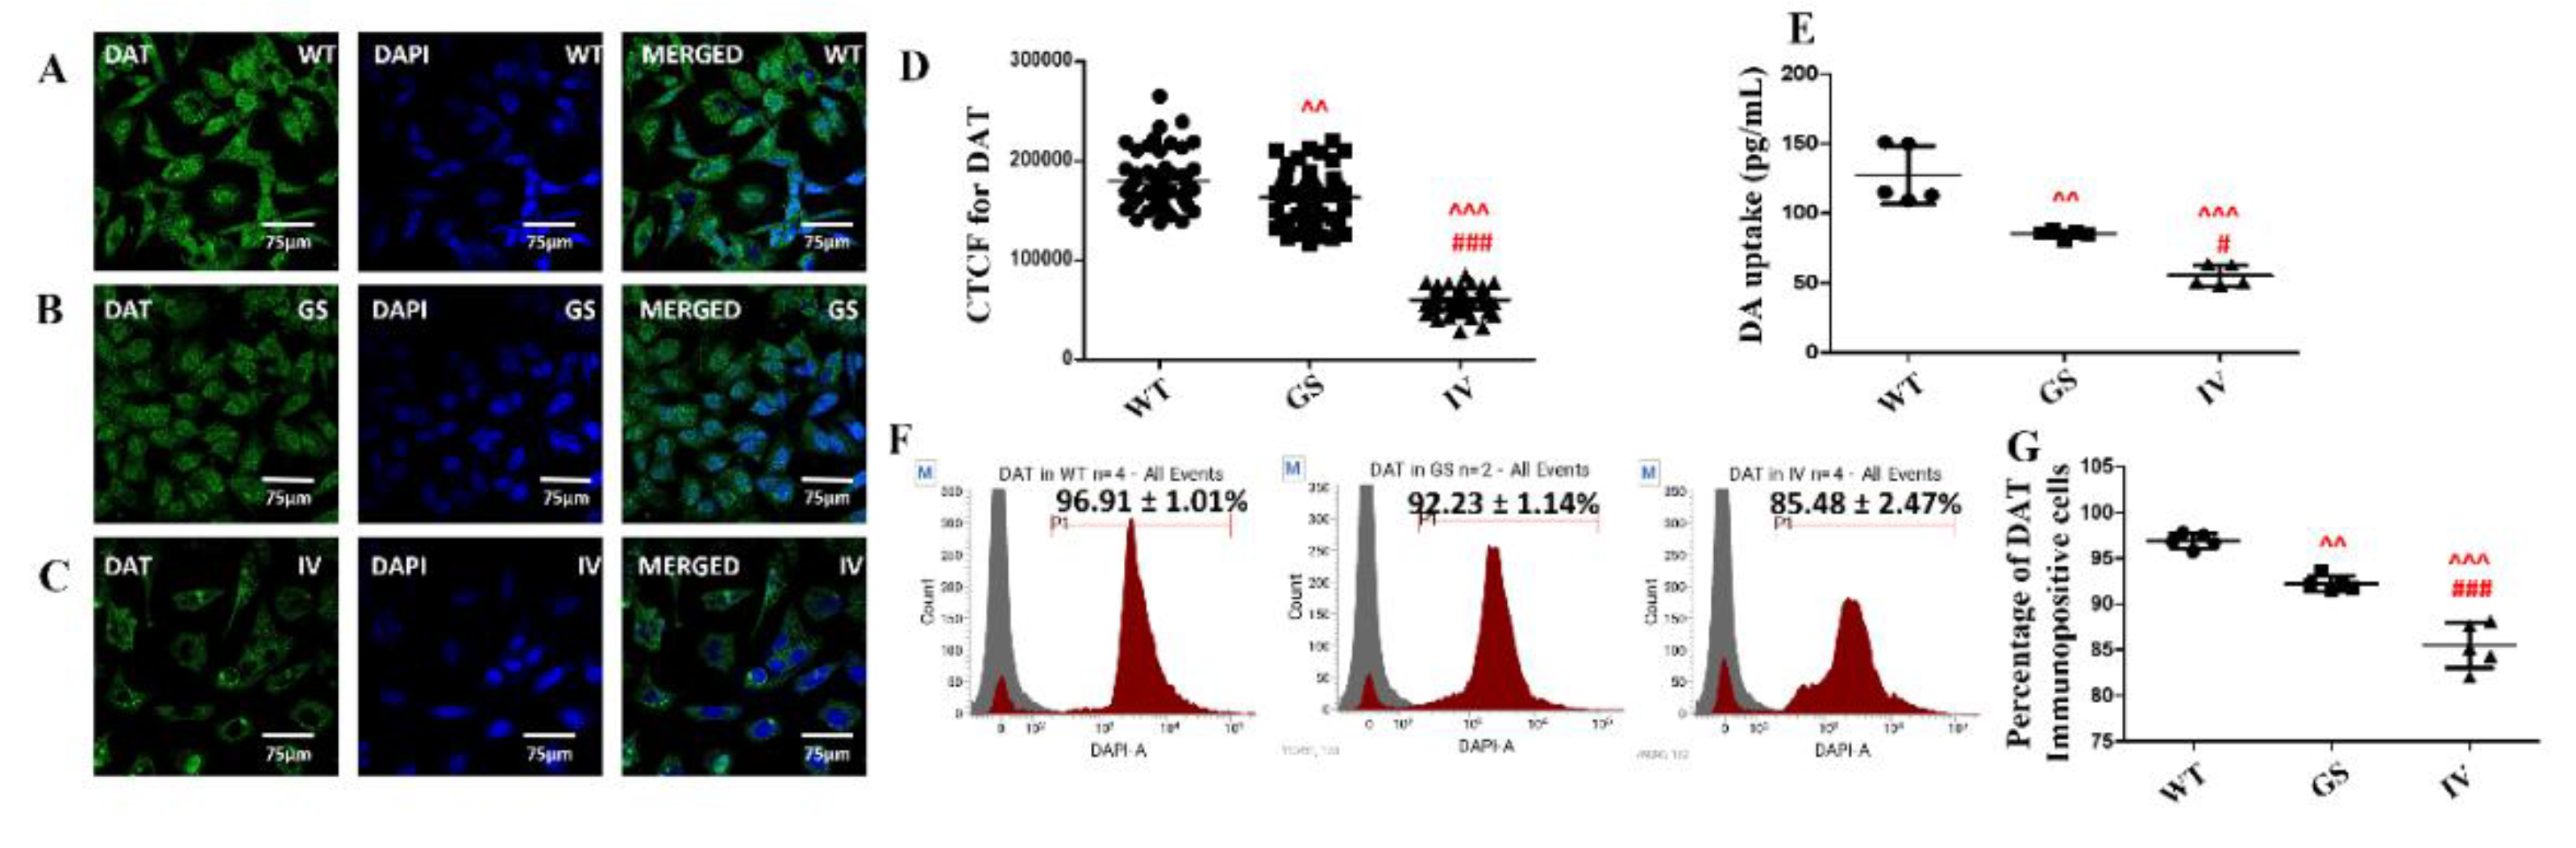
Changes in membrane composition and fluidity can influence the cell-surface expression of membrane transport proteins [49,50]. As the dopamine transporter (DAT) is crucially important for dopamine uptake, we assessed its expression. Immunocytochemistry analysis revealed significantly lower fluorescence intensity of DAT in LRRK2 I1371V transfected SH-SY5Y cells compared to LRRK2 WT and LRRK2 G2019S transfected cells (Figure 5A-D; P <0.001). FACS analysis confirmed a significantly lower population of DAT-immunopositive cells in LRRK2 I1371V transfected SH-SY5Y cells compared to WT and G2019S (Figure 5F; P<0.001). Dopamine uptake was also significantly reduced in LRRK2 I1371V transfected SH-SY5Y cells compared to LRRK2 WT (P<0.001) and LRRK2 G2019S (P<0.05) transfected cells (Figure 5E). Additionally, LRRK2 G2019S transfected cells exhibited lower DAT cell-surface expression (Figure 5D-G; P<0.01) and dopamine uptake (Figure 5E; P<0.01) compared to LRRK2 WT transfected cells. These findings suggest that the LRRK2 I1371V genetic variant has a more pronounced effect on dopamine uptake from the extracellular milieu due to reduced DAT expression.
Figure 5.
Differential effect of LRRK2 genetic variants, G2019S and I1371V, on cell-surface expression of DAT and dopamine uptake. (A–C) Representative confocal images showing cell surface expression of dopamine transporter (DAT) in WT (A), LRRK2-G2019S (GS) (B), and LRRK2-I1371V (IV) (C) transfected SH-SY5Y cells, detected by immunocytochemistry. (D) Quantification of DAT cell surface expression by corrected total cell fluorescence (CTCF) measured from 50 regions of interest (ROIs) per condition (N=5). (E) Dopamine uptake in transfected SH-SY5Y cells following treatment with 50 µM dopamine for [time], measured by ELISA of cellular lysates (N=5). (F, G) Flow cytometry analysis of cell surface DAT expression in non-permeabilized transfected SH-SY5Y cells. Representative FACS histograms (F) and quantification of immunopositive cells (G) are shown. Orange line (P1) indicates the gated population; gray/black shaded peak represents the isotype control (N=5). Data is represented as mean ± SD. ^: ANOVA comparison WT vs IV/GS, #: GS vs IV. Single symbol: P < 0.05; double symbol: P < 0.01; triple symbol: P < 0.001.
3.6. Differential Effects of G2019S and I1371V Variants on LRRK2 Substrate Phosphorylation
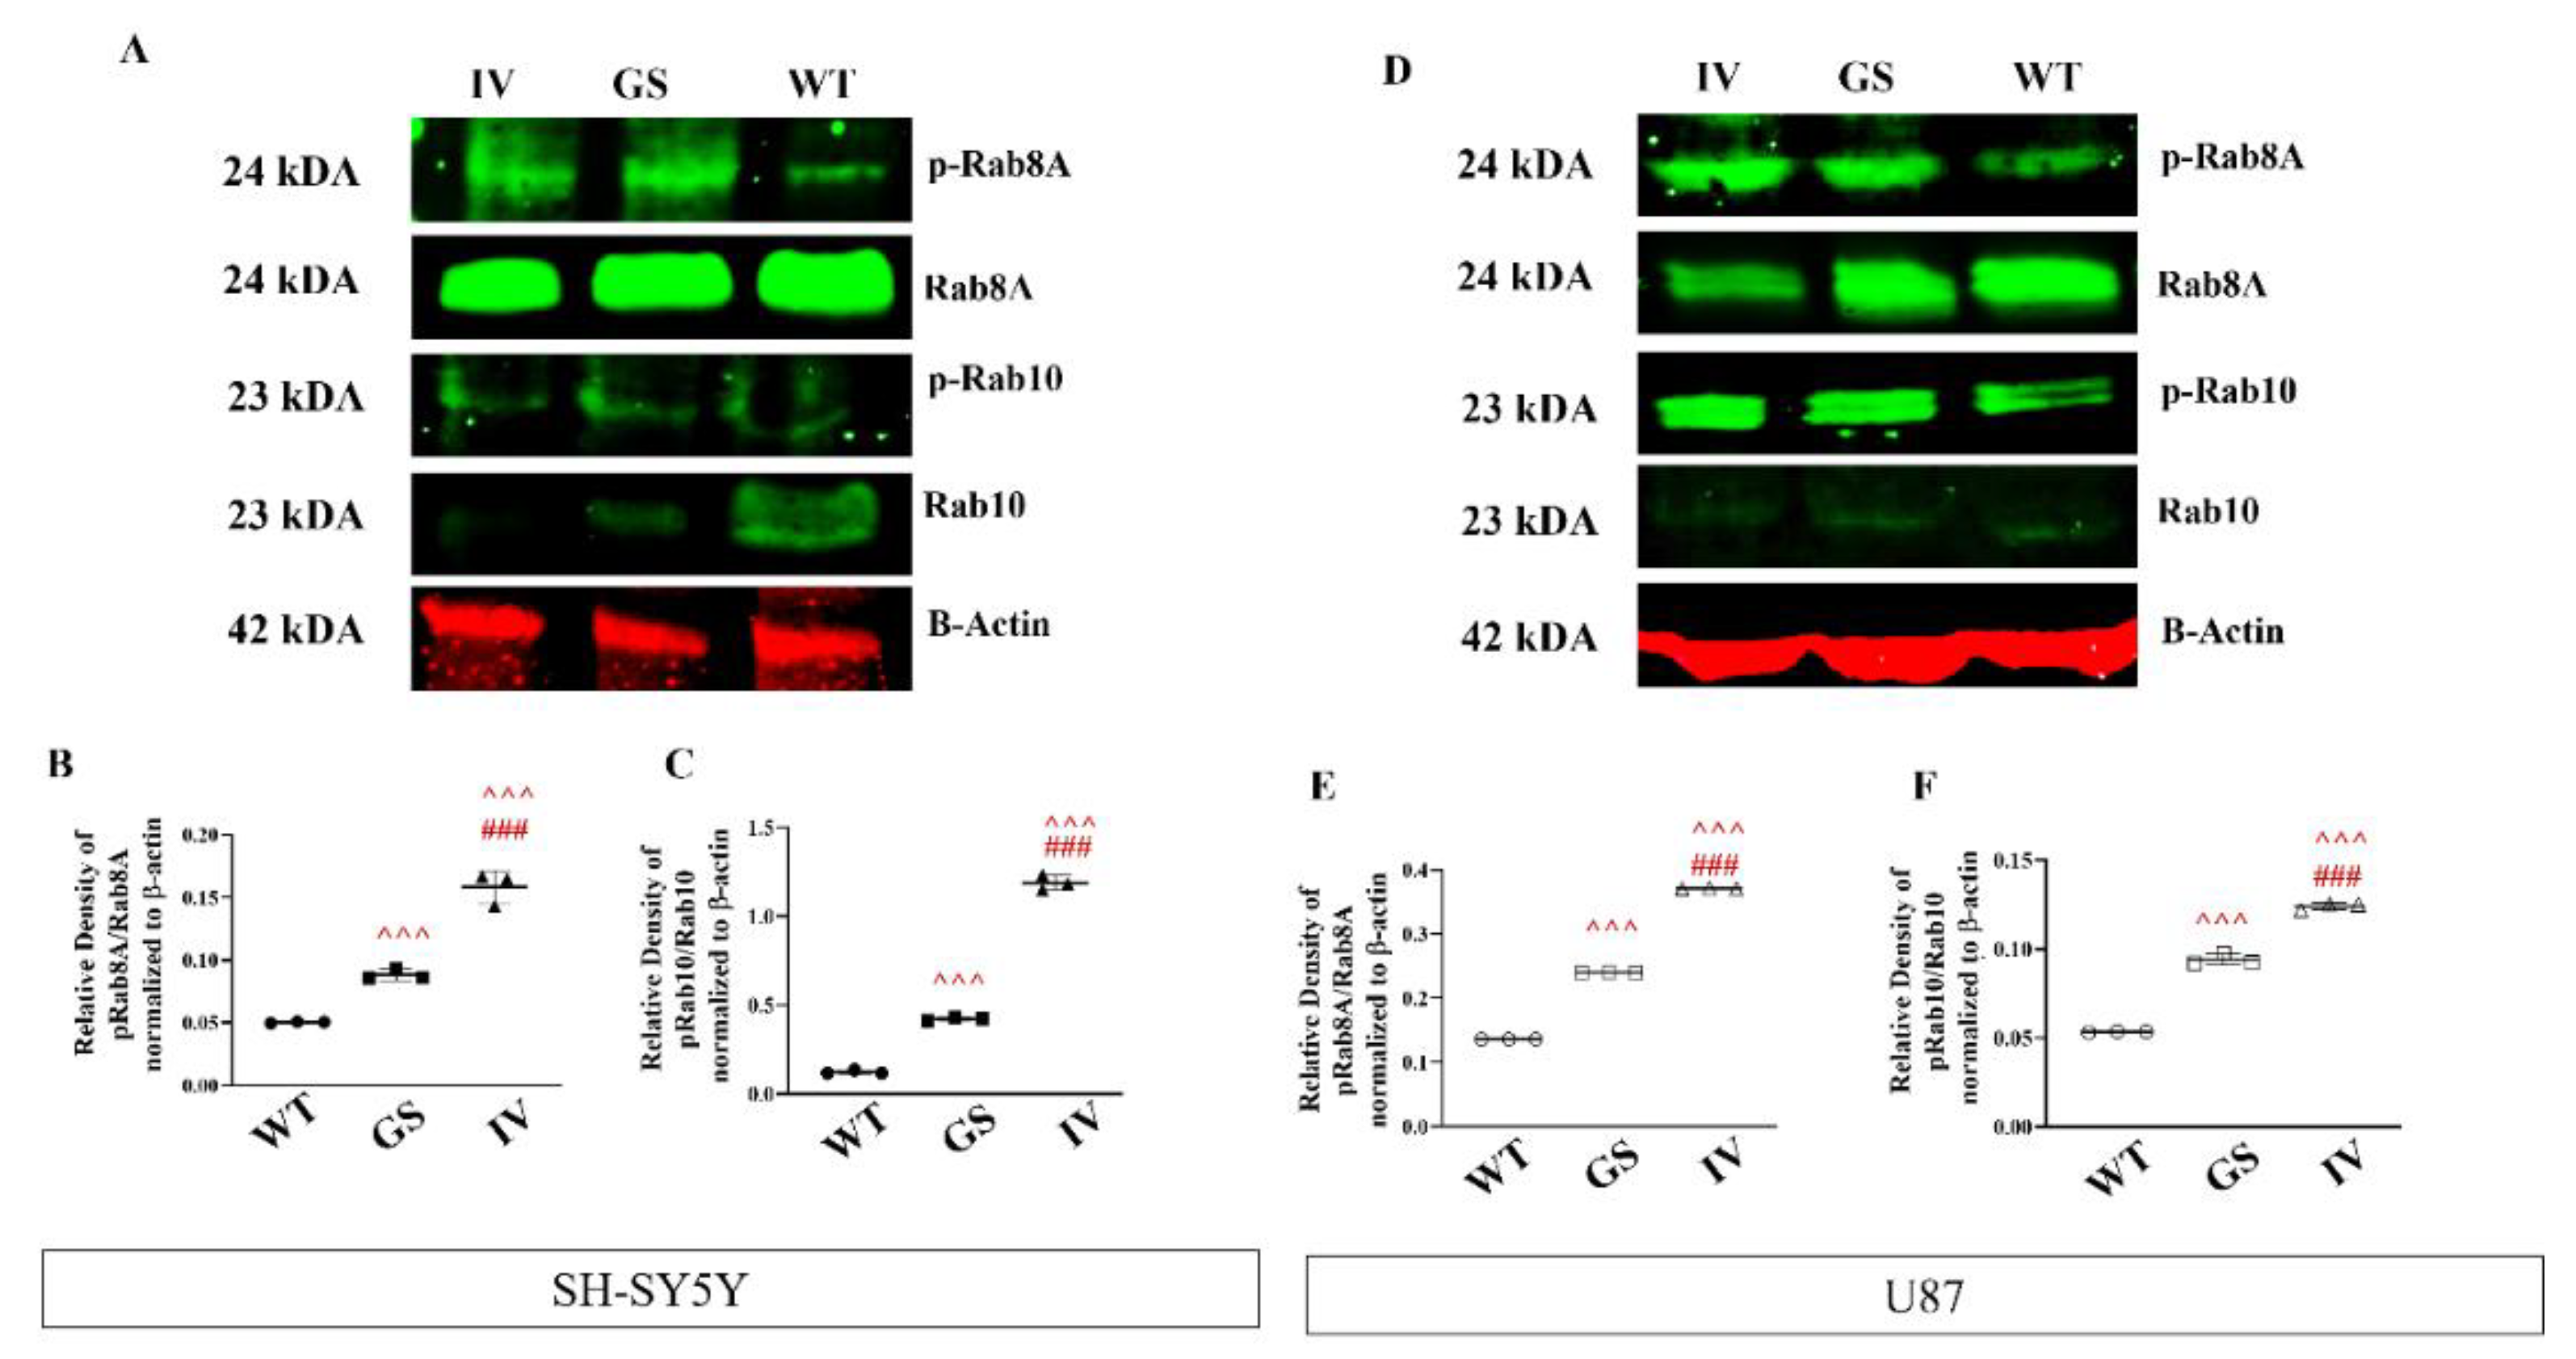
Mutations in the kinase domain increase kinase activity, while mutations in the GTPase domain prolong kinase activity, leading to increased auto-phosphorylation and substrate phosphorylation [21,22]. Immunocytochemistry revealed significantly higher expression of phosphorylated Rab8A (pRab8A) and Rab10 (pRab10) in SH-SY5Y cells, U87 cells, and HC FPCs transfected with LRRK2 I1371V compared to the WT and the G2019S variant (Figure 6A & B; P<0.001). FACS analysis of the pRab8A/Rab8A and pRab10/Rab10 ratios consistently showed the highest levels in cells transfected with LRRK2 I1371V across SH-SY5Y, U87, and FPCs (Figure 6C-H; P<0.001). Representative histograms illustrating the percentage of immunopositive cells for pRab8A, Rab8A, pRab10, and Rab10 in WT, LRRK2-G2019S, and LRRK2-I1371V transfected cells are provided in Supplementary Figures 3 and 4 & 5A-D. SH-SY5Y, U87, and FPCs transfected with LRRK2 G2019S exhibited a significantly higher pRab8A/Rab8A ratio (Figure 6C, E & G; P<0.01 for SH-SY5Y, P<0.001 for U87, and FPCs) and pRab10/Rab10 ratio compared to their respective WT-transfected cells (Figure 6D, F & H; P<0.001). Further, immunoblotting analysis confirmed the significantly higher expression of pRab8A/Rab8A and pRab10/Rab10 in LRRK2 I1371V transfected SH-SY5Y and U87 cells in comparison to WT and LRRK2 G2019S (Figure 7A-F; P<0.001). Here too, the LRRK2 G2019S transfected cells showed significantly higher pRab8A/Rab8A and pRab10/Rab10 than their respective WT transfected cells (Figure 7A-F; P<0.001). Therefore, substrate phosphorylation of Rab proteins (Rab8A and Rab10) consistently showed the highest levels in cells expressing LRRK2 I1371V, indicating a distinct pattern of substrate phosphorylation influenced by LRRK2 mutations. Expression of auto-phosphorylated LRRK2 at the S1292 residue was also assessed in LRRK2 WT, G2019S, and I1371V transfected SH-SY5Y and U87 cells using immunoblotting. Densitometric analysis revealed that phospho-LRRK2 (S1292) levels were significantly higher in G2019S and I1371V-LRRK2 transfected cells compared to WT (Supplementary Figure 1G-J, P < 0.001). Notably, phospho-LRRK2 (S1292) levels were significantly elevated in LRRK2 I1371V transfected SH-SY5Y and U87 cells relative to LRRK2 G2019S, indicating a gain-of-function effect of the I1371V mutation on LRRK2 activity.
Figure 6.
Differential effects of G2019S and I1371V variants on LRRK2 substrate phosphorylation. (A, B) Representative confocal images (left) and quantification by corrected total cell fluorescence (CTCF) (right) of pRab8A (A) and pRab10 (B) expression in WT, LRRK2-G2019S (GS), and LRRK2-I1371V (IV) transfected SH-SY5Y, U87, and floor plate cells (FPCs), detected by immunocytochemistry. CTCF values were measured from 50 regions of interest (ROIs) per condition (N=5). (C–H) Quantification of phosphorylated-to-total protein ratios by flow cytometry. Phosphorylated-Rab8A to Rab8A ratios in SH-SY5Y (C), U87 (E), and FPCs (G). Phosphorylated-Rab10 to Rab10 ratios in SH-SY5Y (D), U87 (F), and FPCs (H). N=5 for all conditions. Data is represented as mean ± SD. ^: ANOVA comparison WT vs IV/GS, #: GS vs IV. Single symbol: P < 0.05; double symbol: P < 0.01; triple symbol: P < 0.001.
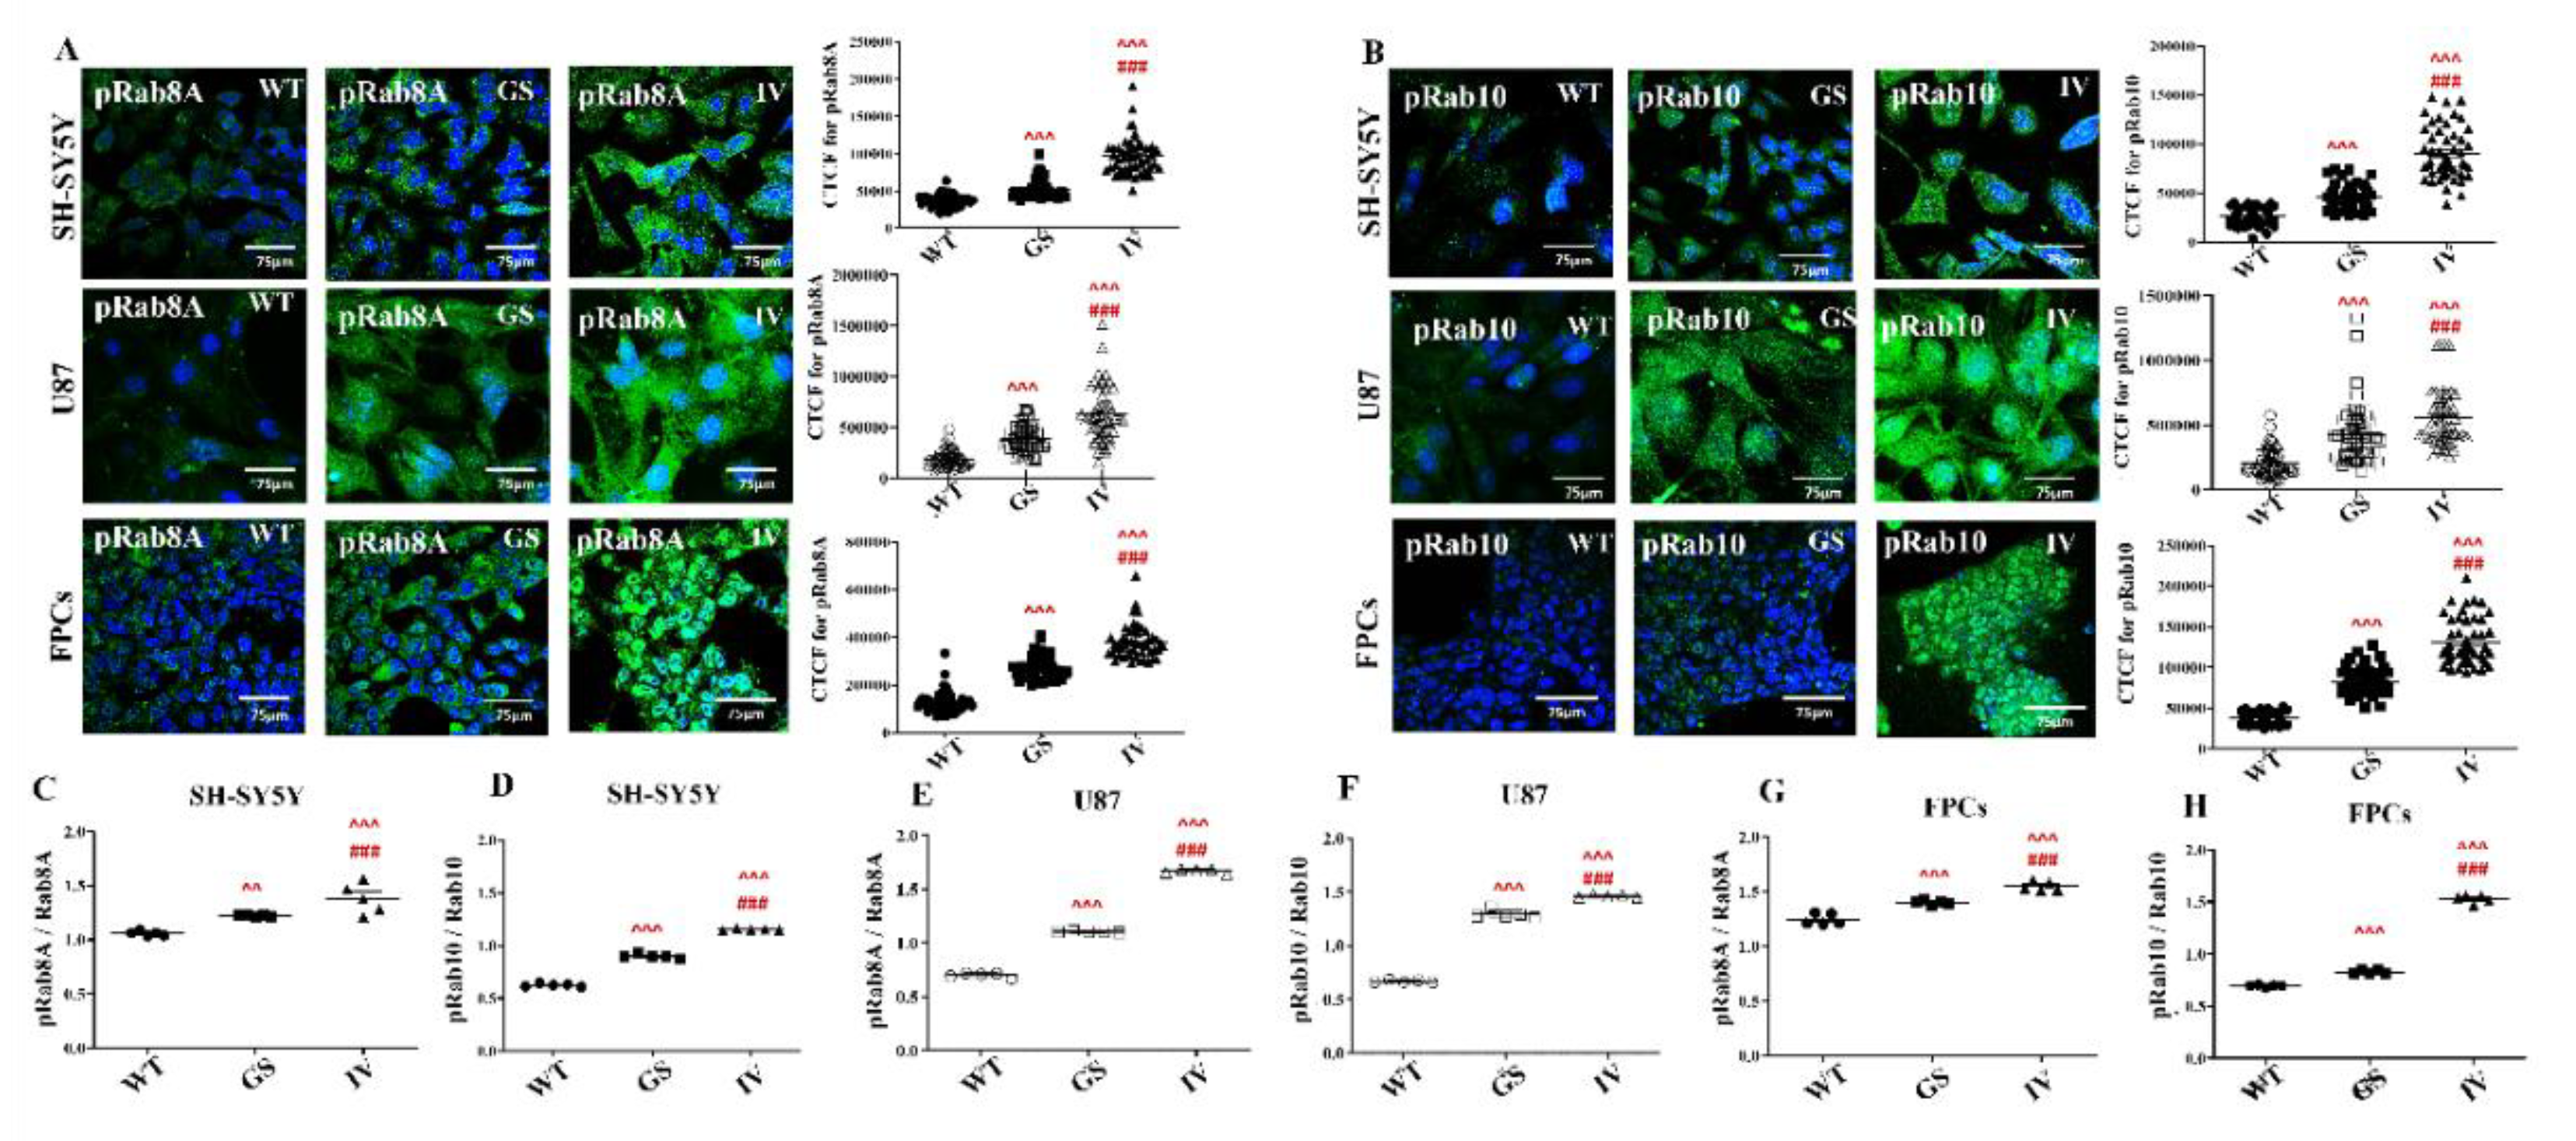
Figure 7.
Differential effects of G2019S and I1371V variants on LRRK2 substrate phosphorylation. (A, D) Representative immunoblots showing expression of phospho-Rab8A, Rab8A, phospho-Rab10, Rab10, and β-actin in WT, LRRK2-I1371V (IV), and LRRK2-G2019S (GS) transfected SH-SY5Y (A) and U87 (D) cells. (B, E) Quantification of phospho-Rab8A to Rab8A ratios, normalized to β-actin, in SH-SY5Y (B) and U87 (E) cells transfected with WT, IV, or GS LRRK2 (N=5). (C, F) Quantification of phospho-Rab10 to Rab10 ratios, normalized to β-actin, in SH-SY5Y (C) and U87 (F) cells transfected with WT, IV, or GS LRRK2 (N=5). Data is represented as mean ± SD. ^: ANOVA comparison WT vs IV/GS, #: GS vs IV. Single symbol: P < 0.05; double symbol: P < 0.01; triple symbol: P < 0.001.
3.7. Differential Response of LRRK2 I1371V Transfected Cells to LRRK2 Inhibitors on Rab8A and Rab10 Phosphorylation
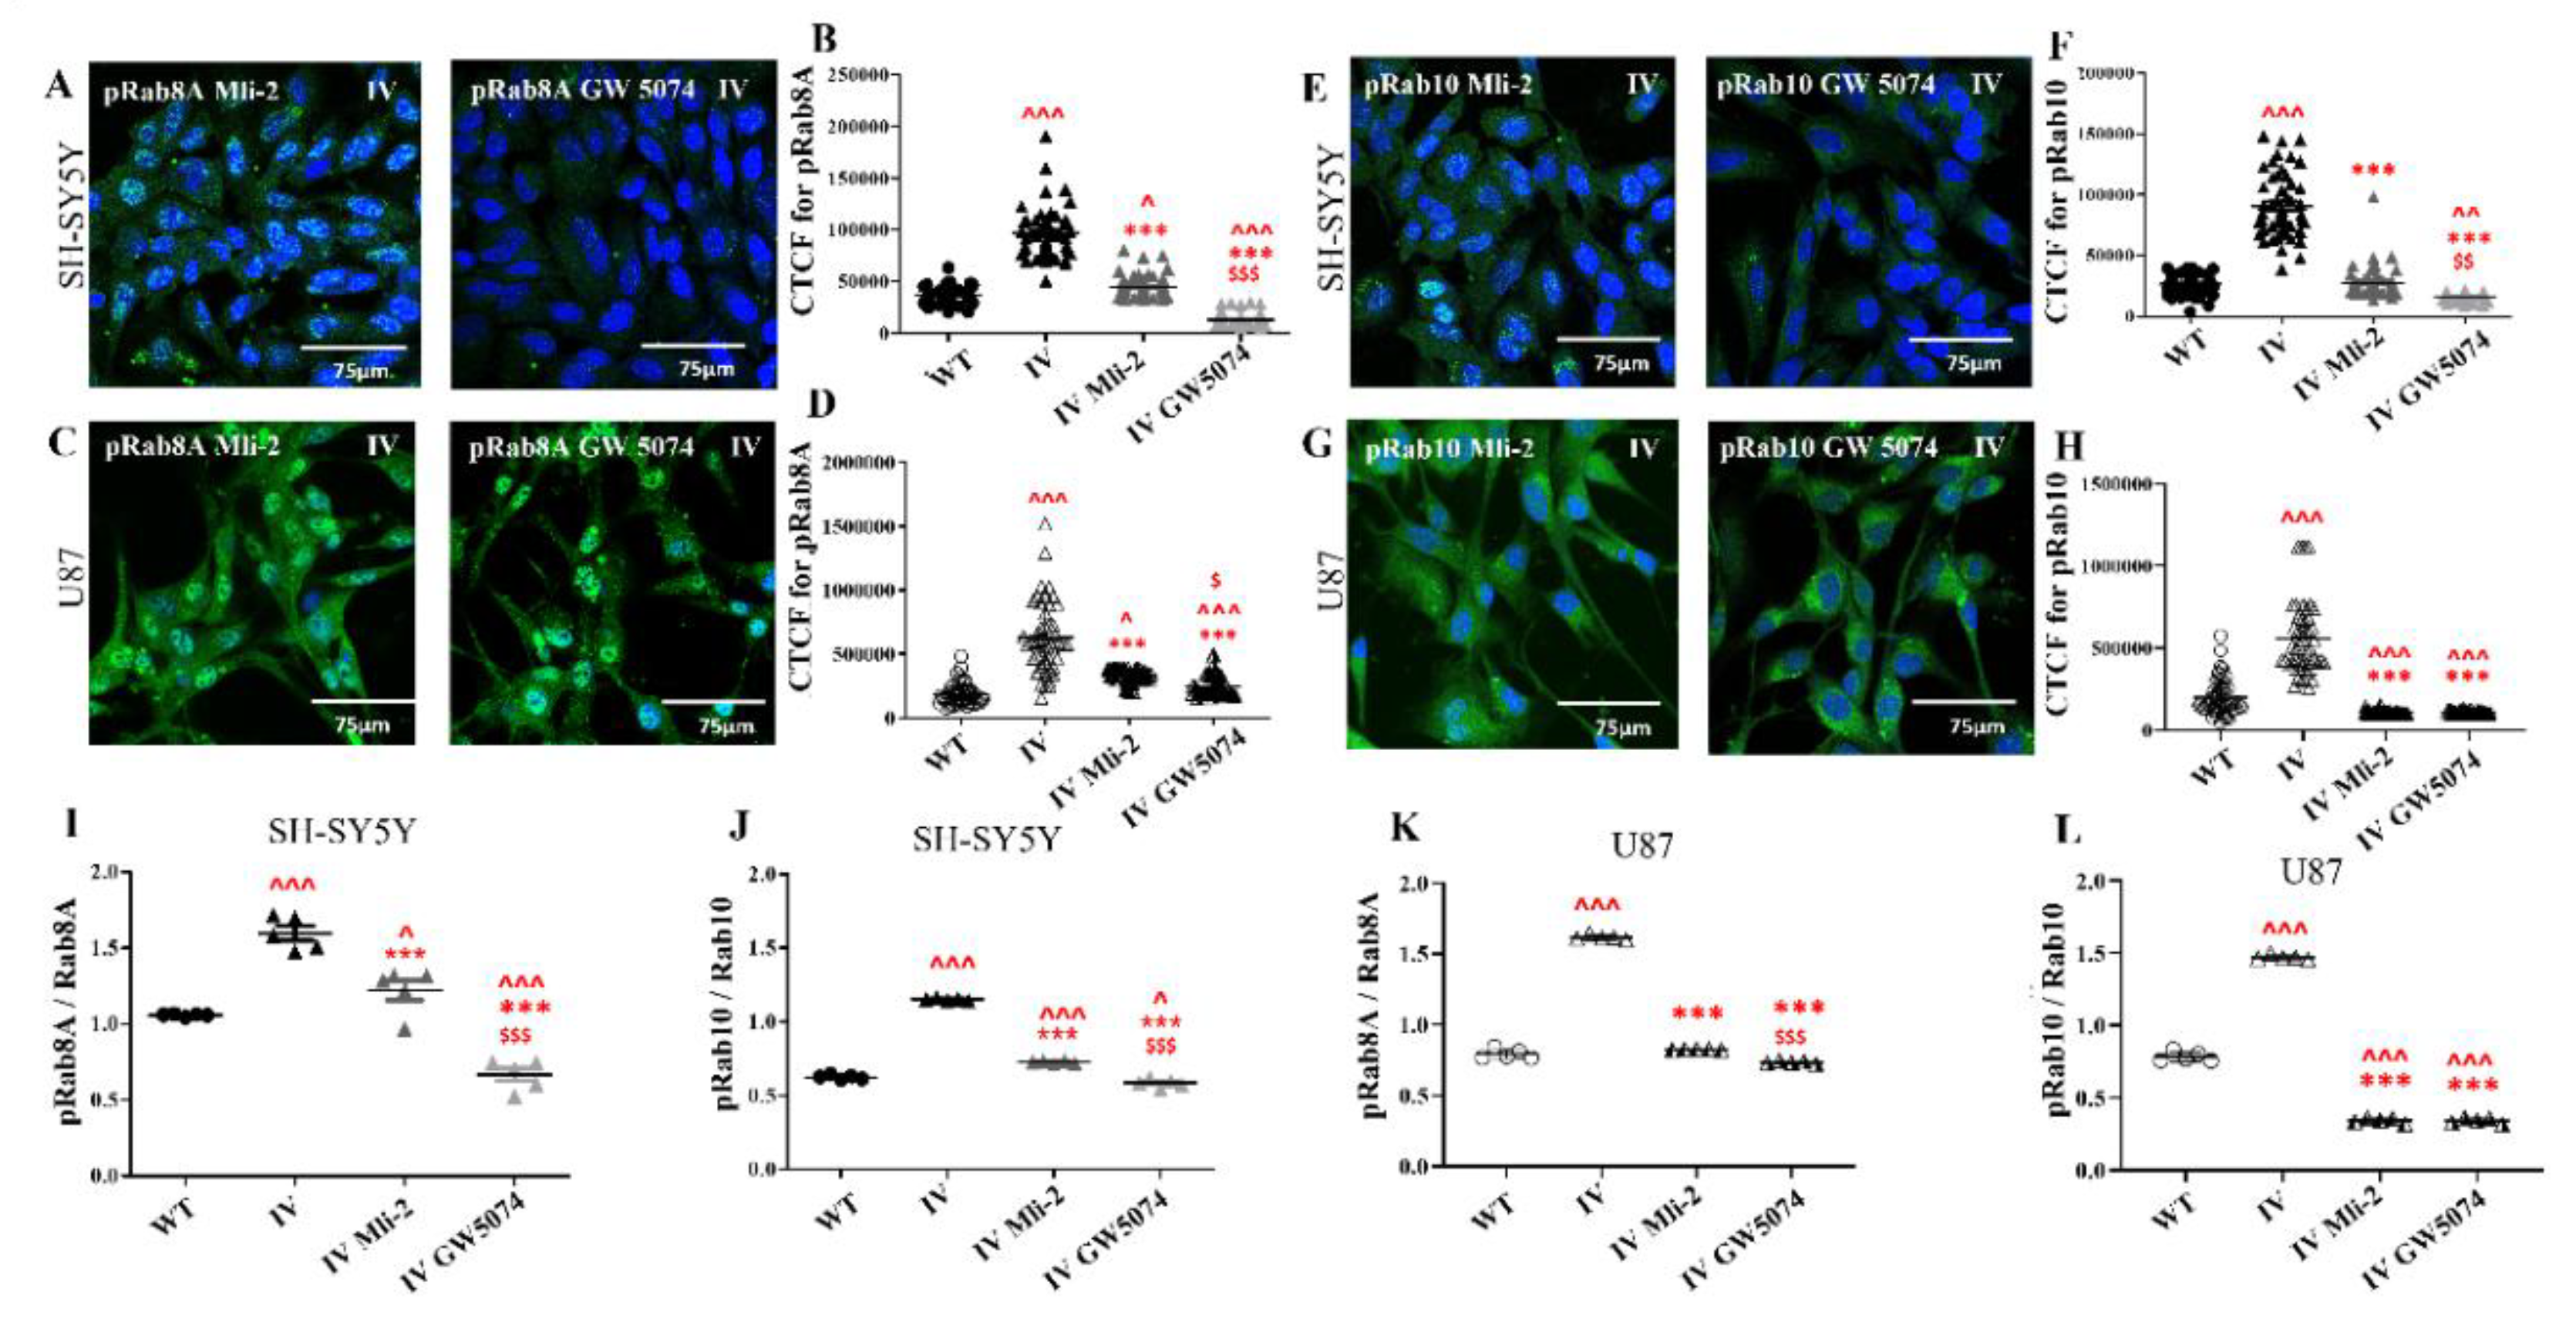
Response to LRRK2 inhibitors for LRRK2 I1371V-transfected SH-SY5Y and U87 cells resulted in reduced phosphorylation of Rab8A (pRab8A) and Rab10 (pRab10), as measured by immunocytochemistry (ICC) (Figure 8A-H) and flow cytometry (Figure 8I-L). CTCF analysis revealed a significant decrease in pRab8A fluorescence following MLi-2 treatment in both SH-SY5Y and U87 cells compared to untreated LRRK2 I1371V-transfected cells (Figure 8B & D; P value < 0.001). Upon GW5074 addition, the reduction in pRab8A fluorescence intensity was even more pronounced in SH-SY5Y (P<0.001) and U87 cells (P<0.05) compared to their respective MLi-2-treated counterparts.
In SH-SY5Y cells, CTCF analysis of pRab10 showed a similar pattern. GW5074-treated cells exhibited lower pRab10 fluorescence intensity than both untreated LRRK2 I1371V-transfected cells (Figure 8F; P<0.001) and MLi-2-inhibited cells (P<0.01). Similarly, U87 cells treated with inhibitors showed a significant decrease in pRab10 fluorescence intensity compared to untreated LRRK2 I1371V-transfected cells (Figure 8H; P<0.001). Flow cytometry further confirmed these results. FACS analysis of LRRK2 I1371V-transfected SH-SY5Y cells demonstrated a significant decrease in both pRab8A/Rab8A and pRab10/Rab10 immunopositive population ratios following treatment with MLi-2 (P<0.001) and GW5074 (Figure 8I & J; P<0.001) compared to untreated controls. Notably, GW5074-treated cells showed a significantly greater decrease than the MLi-2-treated group (P<0.001). LRRK2 I1371V-transfected U87 cells showed similar results, with significant decreases in both pRab8A/Rab8A and pRab10/Rab10 immunopositive population ratios following MLi-2 and GW5074 treatment compared to untreated controls (Figure 8K & L; P<0.001). However, while the pRab8A/Rab8A ratio decrease was greater with GW5074 than MLi-2 (Figure 8K; P<0.001), the pRab10/Rab10 ratio was comparable between the two inhibitor treatments (Figure 8L). These findings demonstrate that GW5074 exhibits superior efficacy compared to MLi-2 in reducing phosphorylation of both Rab8A and Rab10 in LRRK2 I1371V-transfected cells, making it a more potent inhibitor for this particular mutation. The drug treated LRRK2 I1371V transfected cells were compared against LRRK2 I1371V transfected drug-untreated cells and LRRK2 WT transfected cells. Confocal images showing immunocytochemistry for pRab8A and pRab10 in LRRK2-WT and untreated LRRK2-I1371V transfected SH-SY5Y and U87 cells are shown in Figure 6A & B, respectively. Representative histograms illustrating the percentage of immunopositive cells for pRab8A, Rab8A, pRab10, and Rab10 in MLi-2 and GW5074 treated LRRK2-I1371V transfected SH-SY5Y and U87 cells are provided in Supplementary Figures 3 & 4E-H.
Figure 8.
Differential response of LRRK2 I1371V transfected cells to LRRK2 inhibitors on Rab8A and Rab10 phosphorylation. (A, C) Representative confocal images showing pRab8A expression in LRRK2-I1371V transfected SH-SY5Y (A) and U87 (C) cells treated with LRRK2 inhibitors MLi-2 and GW5074. (B, D) Quantification of pRab8A levels by corrected total cell fluorescence (CTCF) measured from 50 regions of interest (ROIs) per condition (N=5) in SH-SY5Y (B) and U87 (D) cells, compared to untreated wild-type (WT) and LRRK2-I1371V (IV) transfected controls. Confocal images for controls are shown in Figure 6A. (E, G) Representative confocal images showing pRab10 expression in LRRK2-I1371V transfected SH-SY5Y (E) and U87 (G) cells treated with LRRK2 inhibitors MLi-2 and GW5074. (F, H) Quantification of pRab10 levels by CTCF measured from 50 ROIs per condition (N=5) in SH-SY5Y (F) and U87 (H) cells, compared to untreated WT and IV transfected controls. Confocal images for controls are shown in Figure 6B. (I–L) Quantification of phosphorylated-to-total protein ratios for Rab8A (I, K) and Rab10 (J, L) in LRRK2 inhibitor-treated LRRK2-I1371V transfected SH-SY5Y (I, J) and U87 (K, L) cells, compared to untreated WT and IV transfected controls (N=5). Data is represented as mean ± SD. ^: ANOVA comparison WT vs IV/IV Mli-2/IV GW5074, *: ANOVA comparison IV vs IV Mli-2/IV GW5074, $: ANOVA comparison IV Mli-2 vs IV GW5074. Single symbol: P < 0.05; double symbol: P < 0.01; triple symbol: P < 0.001.
3.8. Differential Response of LRRK2 I1371V Transfected Cells to LRRK2 Inhibitors on Membrane Fluidity, Expression of Caveolin1 and Membrane Topology
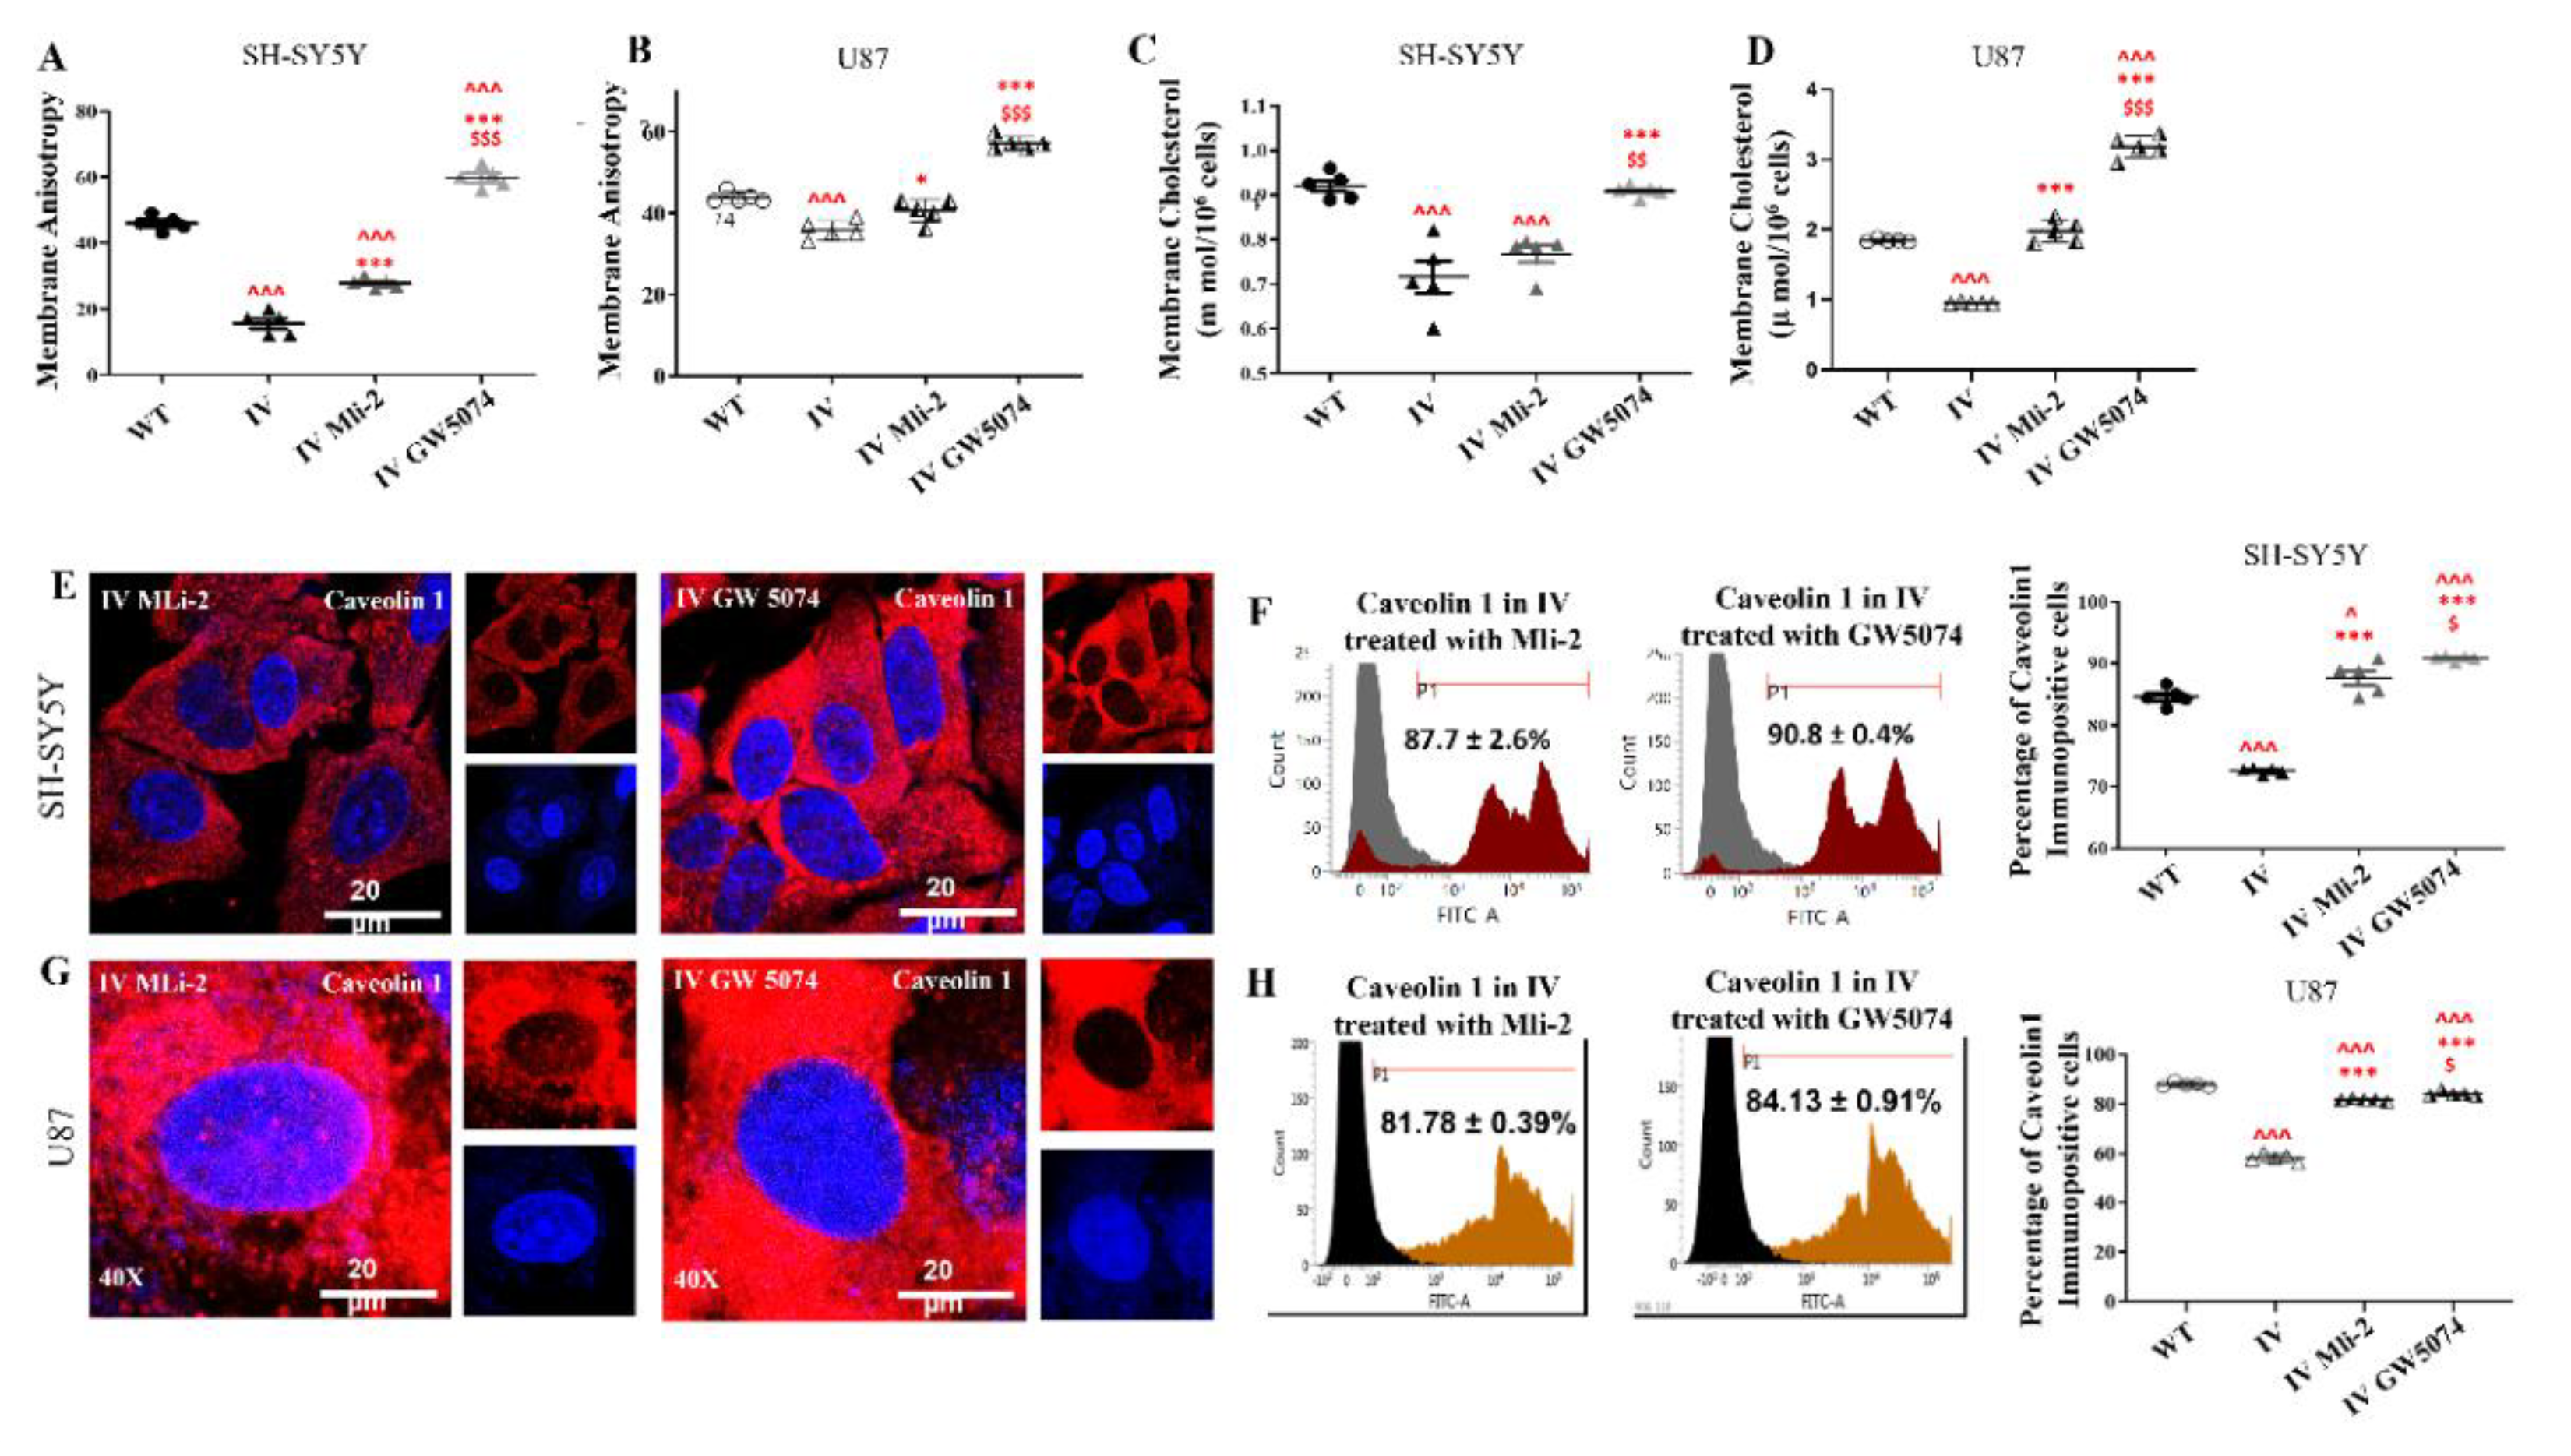
Treatment with both the LRRK2 inhibitors MLi-2 and GW5074 led to a substantial increase in membrane anisotropy for LRRK2-I1371V transfected SH-SY5Y and U87 cells (Figure 9A & B). GW5074 treatment induced a significantly greater increase in membrane anisotropy than MLi-2 treatment (P<0.001) across both cell types. Thus, we conclude that GW5074 was much more efficient in restoring the lost membrane rigidity as compared to MLi-2.
GW5074 treatment significantly increased membrane cholesterol content in both SH-SY5Y (Figure 9C; P<0.001) and U87 (Figure 9D; P<0.001) cells compared to untreated LRRK2-I1371V transfected cells. Furthermore, GW5074-treated cells exhibited markedly higher membrane cholesterol levels than MLi-2-treated cells in both cell types (SH-SY5Y: P<0.01; U87: P<0.001). MLi-2 treatment also elevated membrane cholesterol content in U87 cells relative to untreated LRRK2-I1371V transfected controls (P<0.001).
Both GW5074 and MLi-2 treatments significantly increased surface expression of the lipid raft marker Caveolin-1 in LRRK2-I1371V transfected SH-SY5Y and U87 cells compared to untreated LRRK2-I1371V transfected cells (Figure 9E-H; P<0.001). Specifically, MLi-2 treatment increased Caveolin-1 expression in SH-SY5Y cells (P<0.05) and U87 cells (P<0.001), while GW5074 treatment produced even greater increases in both cell types (P<0.001). Again, GW5074-treated cells exhibited significantly higher Caveolin-1 expression than MLi-2-treated cells (P<0.05). The drug treated LRRK2 I1371V transfected cells were compared against LRRK2 I1371V transfected drug-untreated cells and LRRK2 WT transfected cells. The confocal images showing immunocytochemistry for Caveolin1 in LRRK2-WT and untreated LRRK2-I1371V transfected SH-SY5Y and U87 cells are shown in Figure 2A & B, respectively.
Figure 9.
Differential response of LRRK2 I1371V transfected cells to LRRK2 inhibitors on membrane fluidity and expression of Caveolin1. (A, B) Quantification of membrane anisotropy in LRRK2-I1371V (IV) transfected SH-SY5Y (A) and U87 (B) cells treated with LRRK2 inhibitors MLi-2 or GW5074, compared to untreated WT and IV transfected controls (N=5). (C, D) Quantification of membrane cholesterol content in IV transfected SH-SY5Y (C) and U87 (D) cells treated with LRRK2 inhibitors MLi-2 or GW5074, compared to untreated WT and IV transfected controls (N=5). (E, G) Representative confocal images showing cell surface expression of Caveolin-1 in IV transfected SH-SY5Y (E) and U87 (G) cells treated with LRRK2 inhibitors MLi-2 or GW5074. (F, H) Flow cytometry analysis of cell surface Caveolin-1 expression in inhibitor-treated IV transfected SH-SY5Y (F) and U87 (H) cells. Representative FACS histograms (left) and quantification of immunopositive cells (right) are shown. Orange line (P1) indicates the gated population; gray/black shaded peak represents the isotype control (N=5). Data for untreated WT and IV transfected controls are shown in Figure 1B, D–F and Figure 2A–C. Data is represented as mean ± SD. ^: ANOVA comparison WT vs IV/IV Mli-2/IV GW5074, *: ANOVA comparison IV vs IV Mli-2/IV GW 5074, $: ANOVA comparison IV Mli-2 vs IV GW 5074. Single symbol: P < 0.05; double symbol: P < 0.01; triple symbol: P < 0.001.
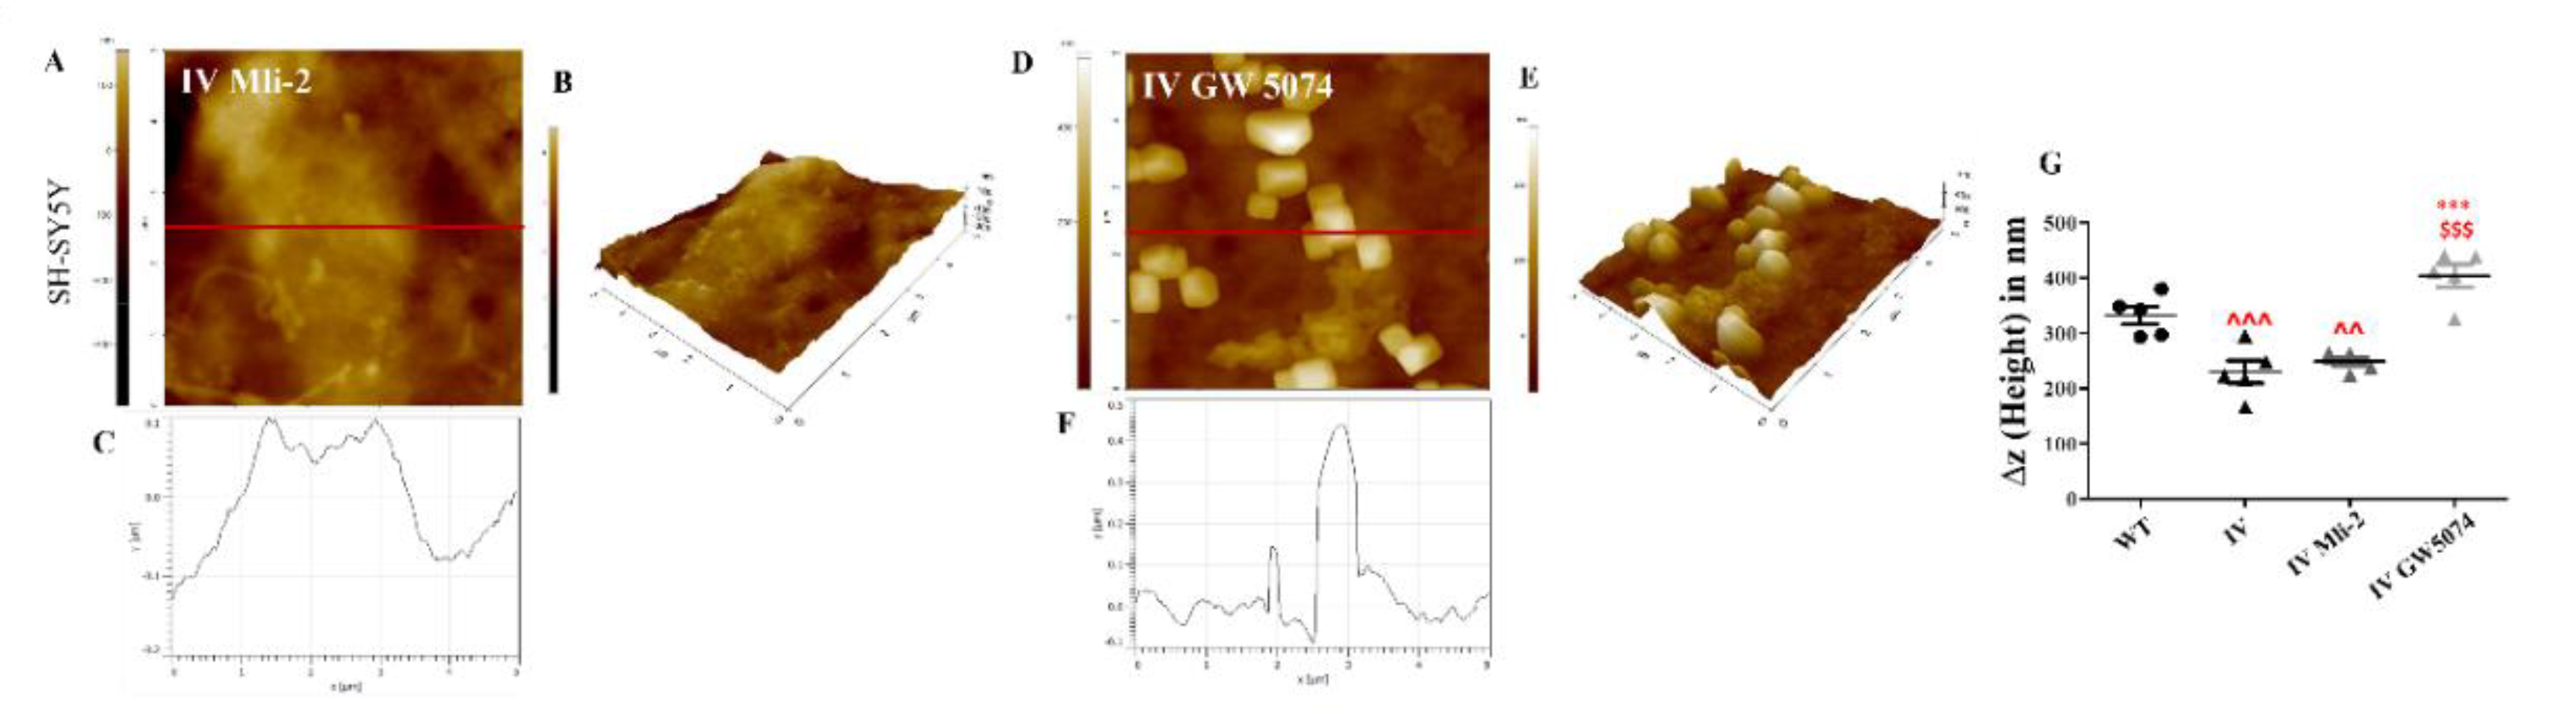
Unlike in MLi-2 treated LRRK2-I1371V SH-SY5Y cells, AFM images showed higher number of microdomains in GW5074-treated LRRK2-I1371V transfected cells (Figure 10). These microdomains resembled those observed in wild-type and G2019S-LRRK2 transfected cells. GW5074 treatment successfully restored the microdomain presence that was lost in the I1371V mutation (Figure 3G-I), whereas MLi-2 treatment failed to achieve this restoration. Furthermore, GW5074 treatment restored the characteristic ruffled membrane morphology in LRRK2-I1371V transfected SH-SY5Y cells, as demonstrated in the 3D representations (Figure 10A-F) and corresponding graphs (Figure 10C & F). This treatment also restored microdomain height to normal levels (Figure 10G, P<0.001), an effect not observed with MLi-2 treatment.
Figure 10.
Differential response of LRRK2 mutant variant transfected cells to LRRK2 inhibitors on membrane topology. (A, D) Two-dimensional (2-D) atomic force microscopy (AFM) images of LRRK2-I1371V (IV) transfected SH-SY5Y cells treated with LRRK2 inhibitors MLi-2 (A) or GW5074 (D). The colour bar indicates membrane height, with color intensity corresponding to surface elevation or depth. (B, E) Three-dimensional (3-D) AFM reconstructions of IV transfected SH-SY5Y cells treated with MLi-2 (B) or GW5074 (E). (C, F) Representative images highlighting membrane ruffling patterns from the corresponding 2-D AFM images of cells treated with MLi-2 (C) or GW5074 (F), analyzed using Gwyddion software. (G) Quantification of microdomain height (Δz) measured from 2-D and 3-D AFM images of inhibitor-treated IV transfected cells, analyzed using Gwyddion software (N=5). AFM data for untreated WT and IV transfected controls are shown in Figure 3A–C and G–I. Data is represented as mean ± SD. ^: ANOVA comparison WT vs IV/IV Mli-2/IV GW 5074, *: ANOVA comparison IV vs IV Mli-2/IV GW 5074, $: ANOVA comparison IV Mli-2 vs IV GW 5074. Single symbol: P < 0.05; double symbol: P < 0.01; triple symbol: P < 0.001.
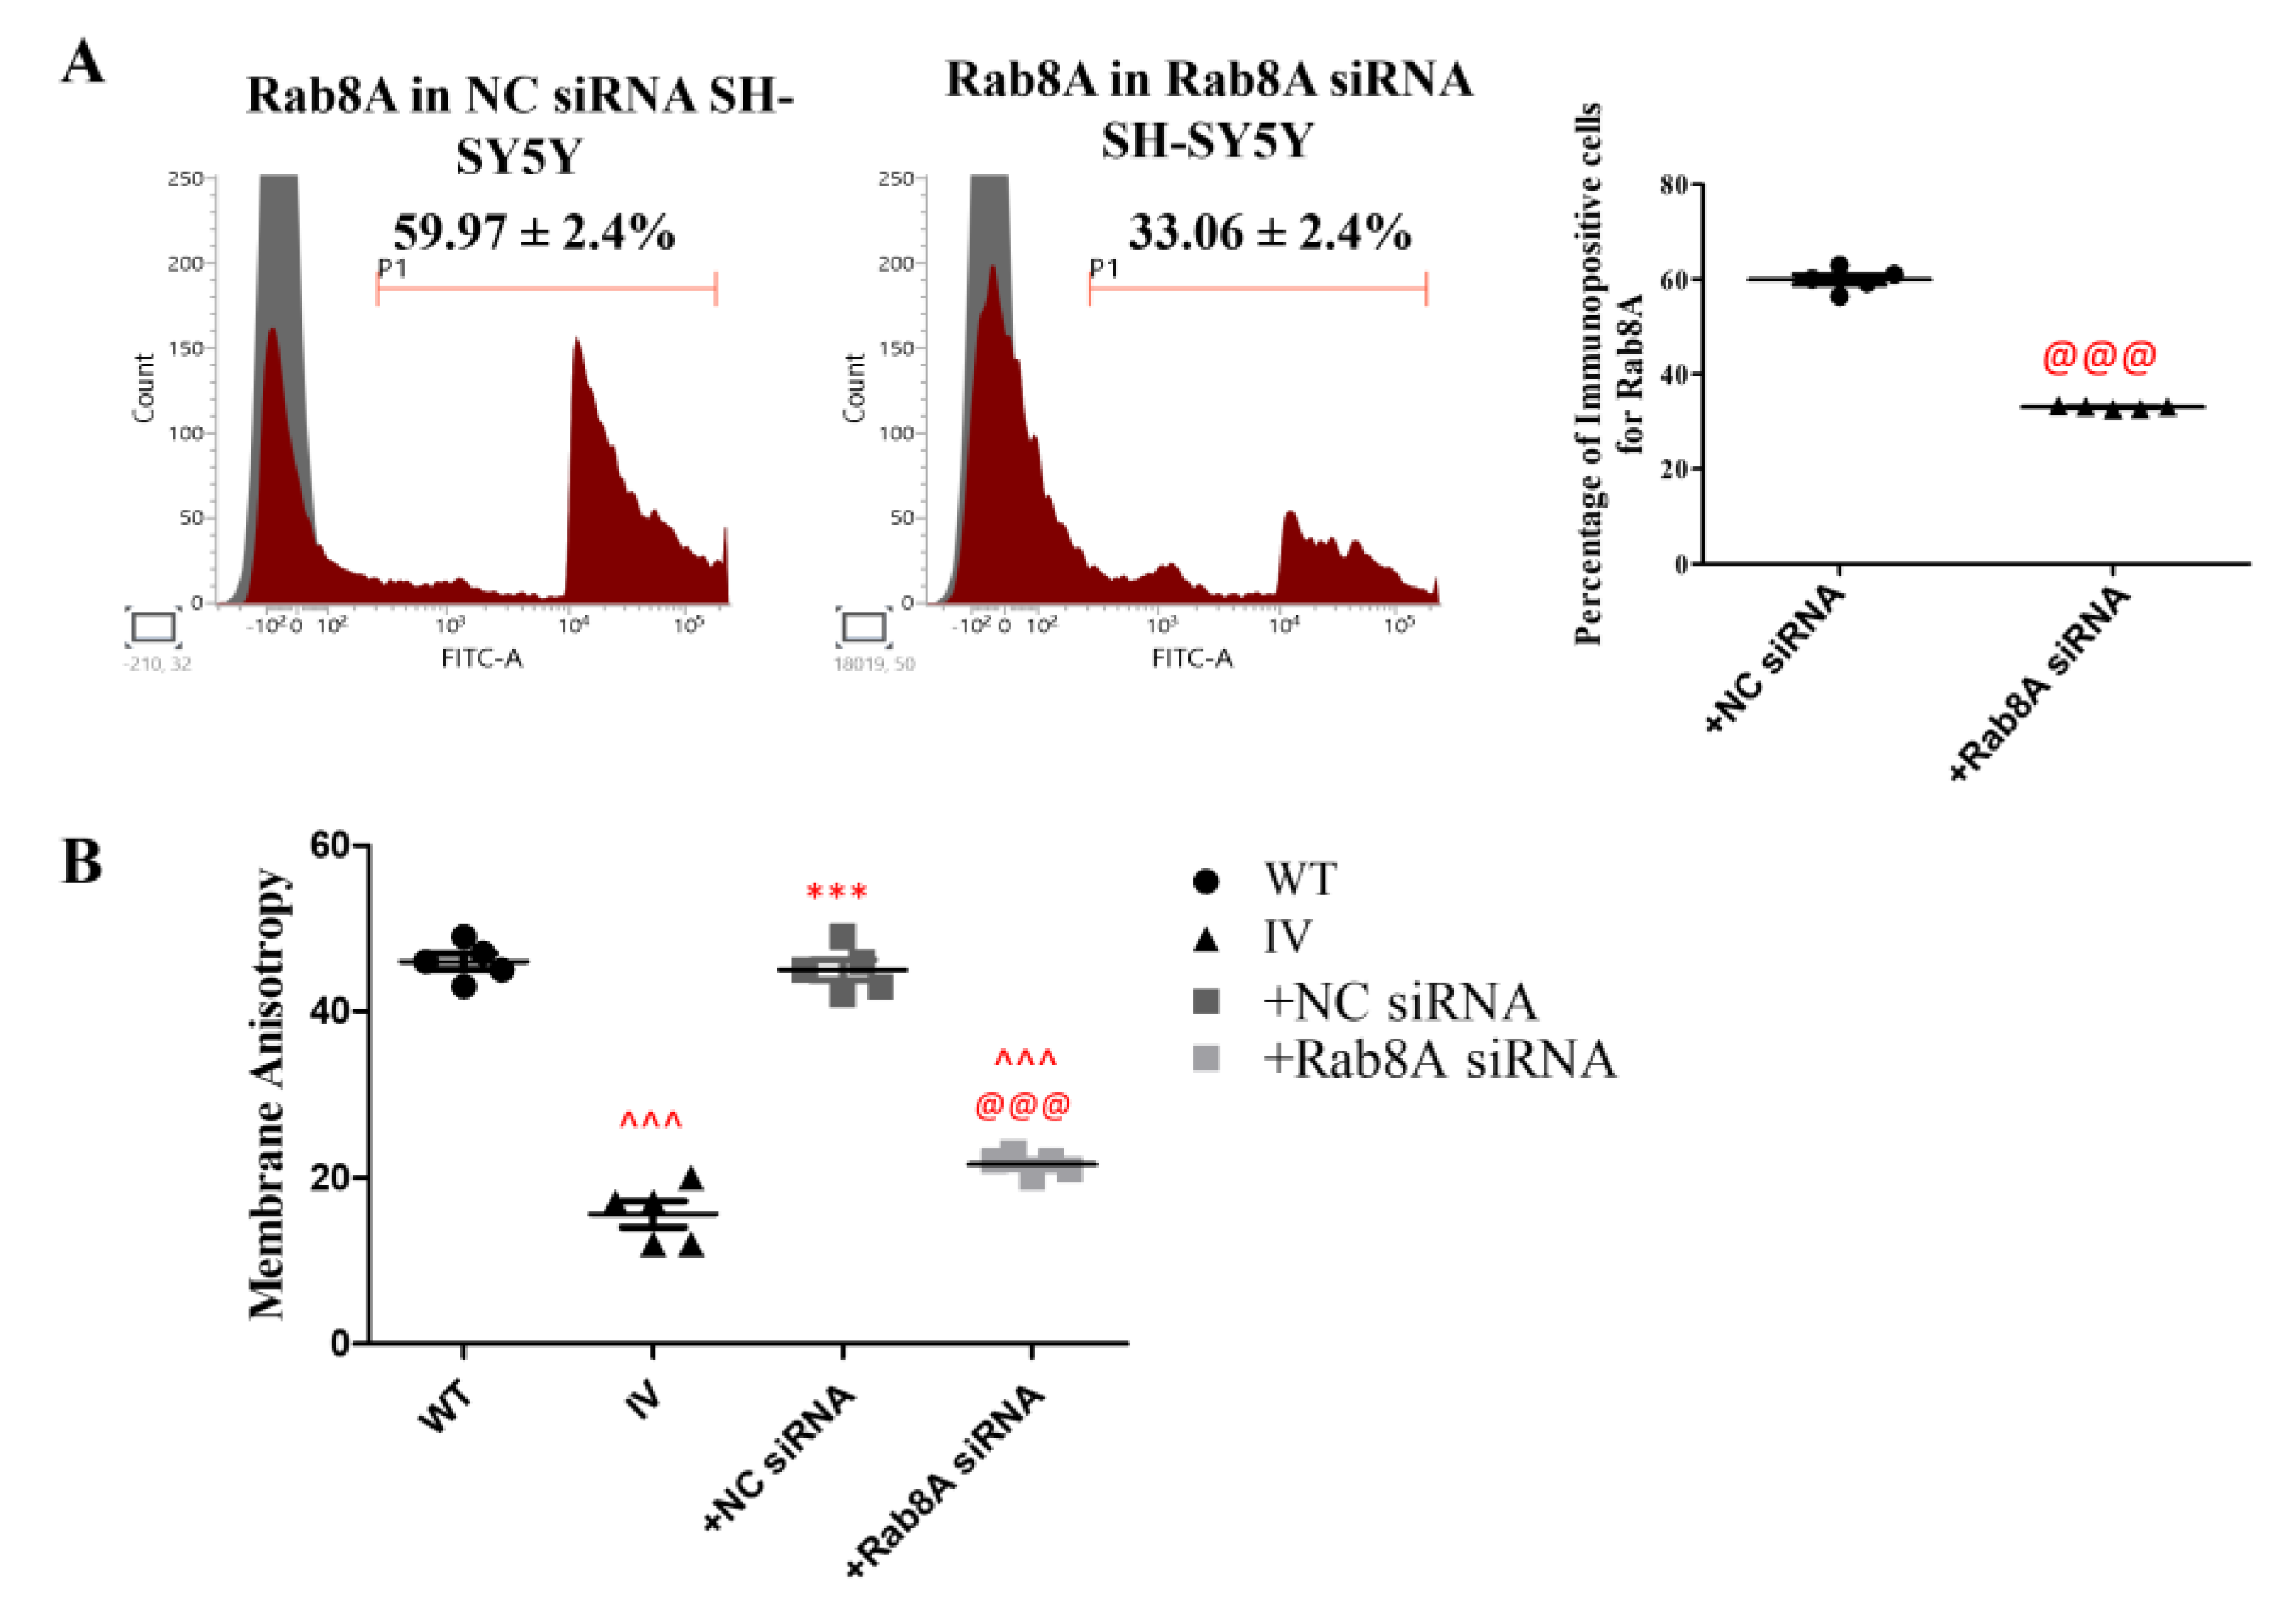
3.9. Rab8A Silencing Alters Membrane Fluidity in SH-SY5Y Cells
Upon Rab8A gene silencing using siRNA in SH-SY5Y cells (parental control), Immunophenotyping showed a significant decrease in percentage of immunopositive cells for Rab8A in SH-SY5Y cells (Figure 11A, P < 0.001), as compared to the SH-SY5Y cells (parental control) transfected with negative control (NC) siRNA. Notably, membrane anisotropy was significantly decreased in Rab8A-silenced SH-SY5Y cells relative to both NC siRNA-treated cells and WT-LRRK2-transfected cells (Figure 11B; P<0.001), indicating increased membrane fluidity. This increased membrane fluidity closely mirrored the phenotype observed in LRRK2-I1371V–transfected SH-SY5Y cells, supporting a key role for Rab8A in regulating membrane fluidity, likely through cholesterol trafficking, and underscoring the inhibitory impact of I1371V-mediated Rab8A hyperphosphorylation.
Figure 11.
Rab8A silencing alters membrane fluidity in SH-SY5Y cells. (A) Representative flow cytometry histograms and quantification of Rab8A-immunopositive SH-SY5Y cells following transfection with Rab8A siRNA or negative control (NC) siRNA. (B) Membrane anisotropy measurements in SH-SY5Y cells transfected with Rab8A siRNA or NC siRNA, shown in comparison with values obtained from LRRK2-WT- and LRRK2-I1371V-transfected cells. The orange line (P1) denotes the gated positive population, and the grey shaded peak represents the corresponding isotype control. Sample size N=5. Data is represented as mean ± SD. ^: ANOVA comparison WT vs IV/+NC siRNA/+Rab8A siRNA, *: IV vs +NC siRNA/+Rab8A siRNA, @: +NC siRNA vs +Rab8A siRNA. Single symbol: P < 0.05; double symbol: P < 0.01; triple symbol: P < 0.001.
4. Discussion
This study reveals that two pathogenic LRRK2 mutations—G2019S (GS) in the kinase domain and I1371V (IV) in the GTPase domain—produce strikingly different cellular phenotypes, with I1371V causing more severe disruption of membrane dynamics, lipid homeostasis, and dopaminergic function. Using multiple cell models including SH-SY5Y neuroblastoma cells, U87 glioblastoma cells, and healthy iPSC-derived floor plate cells (FPCs), we demonstrate that these mutations lead to divergent pathogenic mechanisms, highlighting the complexity of LRRK2-associated disease.
A broad range of studies have demonstrated that even a single conservative substitution between isoleucine and valine can significantly alter protein behavior - including reduced NO synthesis in iNOS [51,52,53], altered inhibitor sensitivity in prostaglandin G/H synthase [54], relaxed ligand dependence in erbB [55,66], disrupted orexin-receptor signaling [57,58] and enzyme properties of human glutathione S-transferase GSTP1-1 [59], modified ligand selectivity in PYL receptors [60,61], impaired coagulation in Factor IX–related hemophilia B [62], pathogenic shifts in prion protein processing [63,64,65] in Creutzfeldt–Jakob disease, attenuated viral virulence in Newcastle disease virus [66], and conformational changes in E. coli ACP [67,68]. Collectively, these findings highlight that an Ile↔Val substitution, despite being chemically conservative, can profoundly influence enzyme kinetics, receptor function, protein stability, pathogenicity, and disease phenotypes across biological systems - a phenomenon replicated for the LRRK2 protein as well.
In our study, the GTPase domain variant I1371V showed robust S1292 phosphorylation in SH-SY5Y and U87 cells, with a higher pS1292/LRRK2 ratio compared to G2019S, suggesting elevated kinase activation. This S1292 autophosphorylation pattern following GTPase domain gain-of-function aligns with earlier studies [39,69,70,71]. Substrate phosphorylation patterns revealed pronounced mutation-specific effects as well. Phosphorylation of Rab8A and Rab10 was consistently highest in I1371V-expressing cells across all tested cell types, indicating that GTPase domain mutations exert more pronounced downstream effects on LRRK2 substrate targeting. The substrate phosphorylation finding carries particular significance given the established roles of Rab8A and Rab10 in vesicular trafficking and membrane dynamics. LRRK2 mediates lipid storage via Rab8A phosphorylation at the T72 residue [72], which is also required for LDL cholesterol delivery to the plasma membrane [30,31]. Recent work has further demonstrated that Rab10 plays a crucial role in membrane reservoir formation [73]. Phosphorylation of Rab8A and Rab10 at T72 and T73 residues, respectively, prevents binding of their subsequent GEFs and GAPs [74], resulting in functional arrest. These findings suggest that I1371V may exert stronger effects on vesicular trafficking and membrane remodeling via hyperactivation of Rab GTPases, potentially contributing to altered endolysosomal and recycling pathways.
In line with Rab8A’s well-documented role in sterol trafficking, we observed that I1371V-expressing cells exhibited significantly lower membrane cholesterol compared to G2019S and wild-type controls, while total cholesterol levels remained unchanged. This pattern suggests that hyperphosphorylation of Rab8A by mutant LRRK2 impairs its function in cholesterol transport to the plasma membrane, resulting in cholesterol depletion and subsequent membrane destabilization.
The functional consequences of cholesterol depletion manifested as increased membrane fluidity, evidenced by reduced anisotropy measurements. This finding aligns with established biophysical principles where cholesterol acts as a membrane rigidity-promoting agent [43,44]. As membrane cholesterol is essential for maintaining lipid raft integrity [45], its depletion leads to disruption of critical cellular signaling domains [75,76]. The greater membrane fluidity observed with I1371V points to a more substantial compromise in membrane structure and function, which may have clinical relevance given that higher blood cholesterol levels in elderly individuals are associated with reduced risk of cognitive decline [77]. This connection is particularly noteworthy as patients carrying GTPase domain mutations in LRRK2 often exhibit severe cognitive impairment, with some cases reporting cognitive symptoms even before motor dysfunction [12].
Comprehensive lipidomics analysis corroborated the membrane cholesterol observations and revealed the broader scope of lipid alterations. LRRK2-I1371V transfected cells showed significant reductions in cholesteryl esters (CE) and sterols (ST), with less pronounced declines in G2019S-expressing cells. Furthermore, essential lipid raft structural components—including sphingolipids, glycerophospholipids, and glycerolipids—were markedly depleted in LRRK2-I1371V cells. These findings align with those of Galper et al. (2022), who reported altered sphingolipid and glycerolipid levels in cerebrospinal fluid from PD patients carrying LRRK2 GTPase-domain mutations, supporting disrupted lipid metabolism as a key pathogenic mechanism in PD [32].
In contrast, G2019S cells showed selective elevation of hexosyl ceramides, indicating a potential compensatory response that may partially maintain lipid raft structural integrity. These results demonstrate that I1371V exerts a significantly greater disruptive effect on lipid biosynthesis and distribution, which may be central to its pathogenic mechanism.
The biochemical changes in lipid composition translated into observable structural alterations in membrane architecture. Caveolin-1 expression, a marker for lipid raft domains [78], was significantly lower in I1371V-expressing cells across all examined cell types. AFM imaging confirmed a characteristically flattened membrane topology in I1371V-expressing cells with absent microdomains—a phenotype very similar to that observed following experimental cholesterol depletion. In contrast, G2019S-expressing cells showed minimal differences in membrane topology compared to wild-type controls.
The concurrent reduction of Caveolin-1 expression and disrupted microdomain architecture suggest that the I1371V mutation fundamentally impairs plasma membrane organization through cholesterol-dependent mechanisms. These structural disruptions carry significant functional implications, as lipid rafts serve as essential platforms for receptor clustering [79,80,81], signal transduction cascades [78], and protein trafficking networks [82]. The lipid alterations further implicate I1371V in compromising membrane architecture and raft-associated signaling.
The structural membrane changes resulted in clear functional consequences for dopaminergic signaling. Both DAT surface expression and dopamine uptake were significantly impaired in I1371V cells, with G2019S showing similar but less severe effects compared to wild-type controls. The reduced cell surface expression of DAT could result from hyperphosphorylation of Rab10, which is required for membrane docking of proteins [83].
These findings have important clinical implications as studies suggest a strong connection between cognitive decline in PD and reduced DAT and dopamine uptake [84]. Additionally, lower DAT levels have been associated with increased risk of Impulse Control Disorder (ICD) in these patients [85]. The D2 receptor functions as a postsynaptic receptor involved in dopamine signal transmission, while DAT controls the spatial and temporal dynamics of dopamine neurotransmission by driving reuptake of extracellular transmitters into presynaptic neurons [86]. Our findings suggest a mechanistic link between loss of membrane integrity through disrupted raft domains and impaired transporter trafficking.
Given that membrane structure factors such as lipid composition and fluidity can influence drug response, and as I1371V showed more substantial effects on membrane topology, composition and fluidity, we next evaluated the effects of LRRK2 inhibitors MLi-2 and GW5074 on I1371V-expressing cells.
MLi-2 is a potent and selective inhibitor of LRRK2 kinase activity [87], while GW5074 is a relatively non-selective inhibitor that effectively attenuates both LRRK2 autophosphorylation and substrate phosphorylation [40]. Importantly, GW5074 has been shown to mitigate LRRK2-induced neuronal loss across multiple model systems, including C. elegans, Drosophila, murine models, and cellular assays [88]. We specifically selected GW5074 for treating I1371V-expressing cells based on earlier evidence demonstrating its superior efficacy over other LRRK2 GTPase-domain mutations such as R1441C [23]. While the exact mechanism underlying this preferential effectiveness remains unclear, the recent lack of success of LRRK2 kinase inhibitors in clinical trials highlights the significant heterogeneity among the different variants of LRRK2 mutations. We therefore tested the response of both these inhibitors on LRRK2 I1371V expressing cells.
LRRK2-I1371V transfected cells showed significant differential responses to these inhibitors, with GW5074 being markedly more effective than MLi-2 in reducing especially Rab8A hyperphosphorylation in both SH-SY5Y and U87 cells transfected with LRRK2-I1371V. GW5074 treatment also resulted in significant restoration of plasma membrane rigidity in LRRK2-I1371V transfected cells, showing effects superior to MLi-2 treatment. The observation that Rab8A knockdown in parental SH-SY5Y cells recapitulated the increased membrane fluidity phenotype provides additional evidence that Rab8A is essential for maintaining proper membrane lipid organization, presumably through its role in cholesterol trafficking. Collectively, these findings suggests that pathogenic LRRK2 I1371V mutation disrupts membrane homeostasis by hyperphosphorylating Rab8A, functionally inactivating its capacity to regulate cholesterol distribution and membrane fluidity. Additionally, plasma membrane cholesterol content improved more effectively with GW5074 treatment, corroborated by increased Caveolin-1 expression and improved membrane topology as analyzed by immunophenotyping and AFM imaging. AFM 2D images revealed increased microdomain numbers following GW5074 treatment, with cellular membranes exhibiting significantly increased ruffling in 3D representations—effects not observed with MLi-2 treatment. In LRRK2-I1371V transfected SH-SY5Y Rab10 hyperphosphorylation was also decreased with GW5074.
These results suggest that the pathogenic mechanism of I1371V depends more on GTPase dysfunction than kinase hyperactivation, highlighting the need to broaden LRRK2 modulation strategies. The ability of GW5074 to restore microdomains and Caveolin-1 expression suggests that membrane defects associated with LRRK2 mutations may be potentially reversible, supporting the therapeutic potential of comprehensive LRRK2 inhibition.
Our findings support a mechanistic model (graphical abstract) where the LRRK2-I1371V GTPase-domain mutation leads to enhanced autophosphorylation at S1292 and hyperphosphorylation of Rab substrates, particularly Rab8A. This hyperphosphorylation impairs sterol trafficking, leading to membrane cholesterol depletion, increased membrane fluidity, and lipid raft disruption. The resulting membrane alterations compromise the function of membrane-associated proteins like DAT, potentially contributing to cellular dysfunction and neurodegeneration.
The more severe disease phenotype associated with I1371V compared to G2019S suggests that mutations affecting GTPase activity may have broader cellular consequences than those primarily affecting kinase activity. This distinction has important implications for understanding disease progression and developing targeted therapies for familial PD patients carrying different LRRK2 mutations.
While our study provides comprehensive characterization of membrane alterations associated with two LRRK2 mutations, several limitations must be acknowledged. LRRK2 is also expressed in immune cells, and future studies should validate whether the differential effects between G2019S and I1371V variants are recapitulated in those cell types. Given differences in LRRK2 stability, activity, and membrane composition between rodents and humans, it would be valuable to study the differential effects of these inhibitors using patient iPSC-derived midbrain organoids and assembloids, targeting both inflammatory signatures and dopaminergic neuronal survival and function. Additionally, the molecular mechanisms linking Rab protein hyperphosphorylation to specific membrane lipid changes require further investigation. Understanding these pathways could reveal additional therapeutic targets and inform the development of combination therapies addressing both kinase activity and membrane integrity.
5. Conclusions
Our findings elucidate distinct molecular and functional consequences of the LRRK2 G2019S and I1371V mutations. While both variants enhance LRRK2 kinase activity, as evidenced by increased autophosphorylation, the I1371V mutation results in markedly elevated phosphorylation of downstream substrates Rab8A and Rab10 across all examined cell types. Crucially, the study establishes membrane dysfunction as a central pathological mechanism in LRRK2-associated PD, with the I1371V mutation demonstrating more severe effects than G2019S. The I1371V variant exerts broader and more severe effects on membrane lipid composition, topology, membrane fluidity and dopamine transporter function. Significantly, we also demonstrate that these membrane abnormalities are reversible through pharmacological inhibition of LRRK2. The non-selective GTPase/kinase modulator GW5074 was particularly effective in rescuing the I1371V-induced deficits, outperforming the direct kinase inhibitor MLi-2, suggesting that GTPase domain variants may respond better to broader LRRK2 modulators than to kinase-selective inhibitors. These insights deepen our understanding of the diverse mechanisms driving LRRK2-associated neurodegeneration and pathobiology, and underscore the importance of developing mutation-specific therapeutic approaches for PD treatment.
Supplementary Materials
The following supporting information can be downloaded at the website of this paper posted on Preprints.org.
Author Contributions
Conceptualization: I.D; methodology: K.S, R.B, C.K, A.S, R.V and I.D; formal analysis and investigation: K.S, R.B, C.K, A.S, R.V and I.D; writing - original draft preparation: K.S and I.D; writing-review and editing: K.S, I.D, R.B; R.Y, P.K.P, V.H and N.K; funding acquisition: I.D, R.Y, and P.K.P, V.H and N.K; resources: I.D, R.Y, P.K.P, V.H and N.K; supervision: I.D. All authors read and approved the final manuscript.
Funding
This work is supported by a grant obtained from Department of Biotechnology (DBT), Government of India, New Delhi; contract grant No. BT/PR45527/MED/122/322/2022. Lipidomics was funded by Parkinson’s Disease & Movement Disorder Research Fund (PDMDRF), NIMHANS. K.S & R.V is supported by CSIR Ph.D. fellowship. R.B and A.N are supported by UGC NET-JRF Ph.D. fellowship. C.K is supported by YSS–ICMR-DHR.
Institutional Review Board Statement
“Ethical review and approval were waived for this study since this study does not involve any humans or animals and the approval number of the exemption certificate from Institutional Ethics Committee (IEC) is NIMHANS/IEC/2022”.
Data Availability Statement
All data generated or analyzed during this study are included in this published article [and its supplementary information files].
Acknowledgments
We acknowledge Dr. Manjunath, Department of Neurovirology, NIMHANS for access to Advanced Flow Cytometer facility. Atomic Force Microscopy (AFM) was performed using the AFM facility at the Micro Nano Characterization Facility (MNCF), Centre for Nano Science and Engineering (CeNSE), Indian Institute of Science, Bengaluru, funded by the Ministry of Electronics and Information Technology (MeitY), Govt. of India. We acknowledge Centre for Cellular and Molecular Platforms (C-CAMP), Dept of Biotechnology, Ministry of Science and Technology, Govt. of India, for the Lipidomics. We acknowledge Prof. Jyothi Prasanna, MIRM, for her valuable scientific inputs and Prof. Ramesh Bhonde for his critical comments.
Conflicts of Interest
Declare conflicts of interest or state “The authors declare no conflicts of interest.” Authors must identify and declare any personal circumstances or interest that may be perceived as inappropriately influencing the representation or interpretation of reported research results. Any role of the funders in the design of the study; in the collection, analyses or interpretation of data; in the writing of the manuscript; or in the decision to publish the results must be declared in this section. If there is no role, please state “The funders had no role in the design of the study; in the collection, analyses, or interpretation of data; in the writing of the manuscript; or in the decision to publish the results”.
References
- Paisán-Ruíz, C., Lang, A.E., Kawarai, T., Sato, C., Salehi-Rad, S., Fisman, G.K., Al-Khairallah, T., St George-Hyslop, P., Singleton, A., Rogaeva, E. (2005). LRRK2 gene in Parkinson disease: Mutation analysis and case-control association study. Neurology 65, 696–700. [CrossRef]
- Trinh, J., Zeldenrust, F.M.J., Huang, J., Kasten, M., Schaake, S., Petkovic, S., Madoev, H., Grünewald, A., Almuammar, S., König, I.R., et al. (2018). Genotype-phenotype relations for the Parkinson’s disease genes SNCA, LRRK2, VPS35: MDSGene systematic review. Movement Disorders 33, 1857–1870. [CrossRef]
- Shu, L., Zhang, Y., Sun, Q., Pan, H., and Tang, B. (2019). A comprehensive analysis of population differences in LRRK2 variant distribution in Parkinson’s disease. Frontiers in Aging Neuroscience 11, 13. [CrossRef]
- Oosterveld, L.P., Allen, J.C. Jr, Ng, E.Y.L., Seah, S.-H., Tay, K.-Y., Au, W.-L., Tan, E.-K., and Tan, L.C.S. (2015). Greater motor progression in patients with Parkinson disease who carry LRRK2 risk variants. Neurology 85, 1039–1042. [CrossRef]
- Marras, C., Alcalay, R.N., Caspell-Garcia, C., Coffey, C., Chan, P., Duda, J.E., Facheris, M.F., Fernández-Santiago, R., Ruíz-Martínez, J., and Mestre, T., et al. (2016). Motor and nonmotor heterogeneity of LRRK2-related and idiopathic Parkinson’s disease. Movement Disorders 31, 1192–1202. [CrossRef]
- Saunders-Pullman, R., Mirelman, A., Alcalay, R.N., Wang, C., Ortega, R.A., Raymond, D., Mejia-Santana, H., Orbe-Reilly, M., Johannes, B.A., and Thaler, A., et al. (2018). Progression in the LRRK2-associated Parkinson disease population. JAMA Neurology 75, 312–319. [CrossRef]
- An, X.K., Peng, R., Li, T., Burgunder, J.M., Wu, Y., Chen, W.J., Zhang, J.H., Wang, Y.C., Xu, Y.M., and Gou, Y.R., et al. (2008). LRRK2 Gly2385Arg variant is a risk factor of Parkinson’s disease among Han Chinese from mainland China. European Journal of Neurology 15, 301–305. [CrossRef]
- Zimprich, A., Biskup, S., Leitner, P., Lichtner, P., Farrer, M., Lincoln, S., Kachergus, J., Hulihan, M., Uitti, R.J., and Calne, D.B., et al. (2004). Mutations in LRRK2 cause autosomal-dominant parkinsonism with pleomorphic pathology. Neuron 44, 601–607. [CrossRef]
- Schneider, S.A., and Alcalay, R.N. (2017). Neuropathology of genetic synucleinopathies with parkinsonism: Review of the literature. Movement Disorders 32, 1504–1523. [CrossRef]
- Henderson, M.X., Sengupta, M., Trojanowski, J.Q., and Lee, V.M.Y. (2019). Alzheimer’s disease tau is a prominent pathology in LRRK2 Parkinson’s disease. Acta Neuropathologica Communications 7, 183. [CrossRef]
- Fernández-Pajarín, G., Sesar, Á., Jiménez-Martín, I., Ares, B., and Castro, A. (2023). Progression and treatment of a series of patients with advanced LRRK2-associated Parkinson’s disease. Neurología (English Edition) 38, 350–356. [CrossRef]
- Ito, G., and Utsunomiya-Tate, N. (2023). Overview of the impact of pathogenic LRRK2 mutations in Parkinson’s disease. Biomolecules 13, 845. [CrossRef]
- Iannotta, L., Biosa, A., Kluss, J.H., Tombesi, G., Kaganovich, A., Cogo, S., Plotegher, N., Civiero, L., Lobbestael, E., Baekelandt, V., et al. (2020). Divergent effects of G2019S and R1441C LRRK2 mutations on LRRK2 and Rab10 phosphorylations in mouse tissues. Cells 9, 2344. [CrossRef]
- Kalogeropulou, A.F., Purlyte, E., Tonelli, F., Lange, S.M., Wightman, M., Prescott, A.R., Padmanabhan, S., Sammler, E., and Alessi, D.R. (2022). Impact of 100 LRRK2 variants linked to Parkinson’s disease on kinase activity and microtubule binding. Biochem. J. 479, 1759–1783. [CrossRef]
- Cheon, S.M., Chan, L., Chan, D.K., and Kim, J.W. (2012). Genetics of Parkinson’s disease: a clinical perspective. J. Mov. Disord. 5, 33–41. [CrossRef]
- Huang, J., Cheng, Y., Li, C., and Shang, H. (2022). Genetic heterogeneity on sleep disorders in Parkinson’s disease: a systematic review and meta-analysis. Transl. Neurodegener. 11, 21. [CrossRef]
- Di Fonzo, A., Rohé, C.F., Ferreira, J., Chien, H.F., Vacca, L., Stocchi, F., Guedes, L., Fabrizio, E., Manfredi, M., Vanacore, N., et al. (2005). A frequent LRRK2 gene mutation associated with autosomal dominant Parkinson’s disease. Lancet 365, 412–415. [CrossRef]
- Vijayan, B., Gopala, S., and Kishore, A. (2011). LRRK2 G2019S mutation does not contribute to Parkinson’s disease in South India. Neurol. India 59, 157–160. [CrossRef]
- Wszolek, Z.K., Pfeiffer, B., Fulgham, J.R., Parisi, J.E., Thompson, B.M., Uitti, R.J., Calne, D.B., and Pfeiffer, R.F. (1995). Western Nebraska family (family D) with autosomal dominant parkinsonism. Neurology 45, 502–505. [CrossRef]
- Wszolek, Z.K., Pfeiffer, R.F., Tsuboi, Y., Uitti, R.J., McComb, R.D., Stoessl, A.J., Strongosky, A.J., Zimprich, A., Müller-Myhsok, B., Farrer, M.J., et al. (2004). Autosomal dominant parkinsonism associated with variable synuclein and tau pathology. Neurology 62, 1619–1622. [CrossRef]
- Liao, J., Wu, C.X., Burlak, C., Zhang, S., Sahm, H., Wang, M., Zhang, Z.Y., Vogel, K.W., Federici, M., Riddle, S.M., et al. (2014). Parkinson disease–associated mutation R1441H in LRRK2 prolongs the active state of its GTPase domain. Proc. Natl. Acad. Sci. U.S.A. 111, 4055–4060. [CrossRef]
- Banerjee, R., Raj, A., Potdar, C., Pal, P.K., Yadav, R., Kamble, N., Holla, V., and Datta, I. (2023). Astrocytes differentiated from LRRK2-I1371V Parkinson’s disease–induced pluripotent stem cells exhibit cell-intrinsic dysfunction in glutamate uptake and metabolism, ATP generation, and Nrf2-mediated glutathione machinery. Cells 12, 1592. [CrossRef]
- Cooper, O., Seo, H., Andrabi, S., Guardia-Laguarta, C., Graziotto, J., Sundberg, M., McLean, J.R., Carrillo-Reid, L., Xie, Z., Osborn, T., et al. (2012). Pharmacological rescue of mitochondrial deficits in iPSC-derived neural cells from patients with familial Parkinson’s disease. Sci. Transl. Med. 4, 141ra90. [CrossRef]
- Vissers, M.F.J.M., Troyer, M.D., Thijssen, E., Pereira, D.R., Heuberger, J.A.A.C., Groeneveld, G.J., and Huntwork-Rodriguez, S. (2023). A leucine-rich repeat kinase 2 (LRRK2) pathway biomarker characterization study in Parkinson’s disease with and without LRRK2 mutations and healthy controls. Clin. Transl. Sci. 16, 1408–1420. [CrossRef]
- Liou, A.K., Leak, R.K., Li, L., and Zigmond, M.J. (2008). Wild-type LRRK2 but not its mutant attenuates stress-induced cell death via ERK pathway. Neurobiol. Dis. 32, 116–124. [CrossRef]
- Ishikawa, M., Saito, K., Urata, M., Kumagai, Y., Maekawa, K., and Saito, Y. (2015). Comparison of circulating lipid profiles between fasting humans and three animal species used in preclinical studies: mice, rats and rabbits. Lipids Health Dis. 14, 104. [CrossRef]
- Langston, R.G., Beilina, A., Reed, X., Kaganovich, A., Singleton, A.B., Blauwendraat, C., Gibbs, J.R., and Cookson, M.R. (2022). Association of a common genetic variant with Parkinson’s disease is mediated by microglia. Sci. Transl. Med. 14, eabp8869. [CrossRef]
- Jagtap, S., Potdar, C., Yadav, R., Pal, P.K., and Datta, I. (2022). Dopaminergic neurons differentiated from LRRK2 I1371V-induced pluripotent stem cells display a lower yield, α-synuclein pathology, and functional impairment. ACS Chem. Neurosci. 13, 2632–2645. [CrossRef]
- Sadhukhan, T., Vishal, M., Das, G., Sharma, A., Mukhopadhyay, A., Das, S.K., Ray, K., and Ray, J. (2012). Evaluation of the role of LRRK2 gene in Parkinson’s disease in an East Indian cohort. Dis. Markers 32, 355–362. [CrossRef]
- Kanerva, K., Uronen, R.L., Blom, T., Li, S., Bittman, R., Lappalainen, P., Peränen, J., Raposo, G., and Ikonen, E. (2013). LDL cholesterol recycles to the plasma membrane via a Rab8a-Myosin5b-actin-dependent membrane transport route. Dev. Cell 27, 249–262. [CrossRef]
- Pfisterer, S.G., Peränen, J., and Ikonen, E. (2016). LDL-cholesterol transport to the endoplasmic reticulum: current concepts. Curr. Opin. Lipidol. 27, 282–287. [CrossRef]
- Galper, J., Kim, W.S., and Dzamko, N. (2022). LRRK2 and lipid pathways: implications for Parkinson’s disease. Biomolecules 12, 1597. [CrossRef]
- Eguchi, T., Kuwahara, T., Sakurai, M., Komori, T., Fujimoto, T., Ito, G., Yoshimura, S.I., Harada, A., Fukuda, M., Koike, M., et al. (2018). LRRK2 and its substrate Rab GTPases are sequentially targeted onto stressed lysosomes and maintain their homeostasis. Proc. Natl. Acad. Sci. U.S.A. 115, E9115–E9124. [CrossRef]
- Bonet-Ponce, L., Beilina, A., Williamson, C.D., Lindberg, E., Kluss, J.H., Saez-Atienzar, S., Landeck, N., Kumaran, R., Mamais, A., Bleck, C.K.E., et al. (2020). LRRK2 mediates tubulation and vesicle sorting from lysosomes. Sci. Adv. 6, eabb2454. [CrossRef]
- Kluss, J.H., Bonet-Ponce, L., Lewis, P.A., and Cookson, M.R. (2022). Directing LRRK2 to membranes of the endolysosomal pathway triggers RAB phosphorylation and JIP4 recruitment. Neurobiol. Dis. 170, 105769. [CrossRef]
- Wang, X., Espadas, J., Wu, Y., Cai, S., Ge, J., Shao, L., Roux, A., and De Camilli, P. (2023). Membrane remodeling properties of the Parkinson’s disease protein LRRK2. Proc. Natl. Acad. Sci. U.S.A. 120, e2309698120. [CrossRef]
- Reyes, S., Cottam, V., Kirik, D., Double, K.L., and Halliday, G.M. (2013). Variability in neuronal expression of dopamine receptors and transporters in the substantia nigra. Mov. Disord. 28, 1351–1359. [CrossRef]
- Jagtap, S., Sowmithra, —., Yadav, R., Pal, P.K., and Datta, I. (2022). Generation of induced pluripotent stem cells (NIMHi004-A, NIMHi005-A and NIMHi006-A) from healthy individuals of Indian ethnicity with no mutation for Parkinson’s disease related genes. Stem Cell Res. 60, 102716. [CrossRef]
- Potdar, C., Jagtap, S., Singh, K., Yadav, R., Pal, P.K., and Datta, I. (2024). Impaired Sonic Hedgehog responsiveness of induced pluripotent stem cell-derived floor plate cells carrying the LRRK2-I1371V mutation contributes to the ontogenic origin of lower dopaminergic neuron yield. Stem Cells Dev. 33, 306–320. [CrossRef]
- Moujalled, D., James, J.L., Parker, S.J., Lidgerwood, G.E., Duncan, C., Meyerowitz, J., Nonaka, T., Hasegawa, M., Kanninen, K.M., Grubman, A., et al. (2013). Kinase inhibitor screening identifies cyclin-dependent kinases and glycogen synthase kinase 3 as potential modulators of TDP-43 cytosolic accumulation during cell stress. PLoS One 8, e67433. [CrossRef]
- Keksel, N., Bussmann, H., Unger, M., Drewe, J., Boonen, G., Häberlein, H., and Franken, S. (2019). St John’s wort extract influences membrane fluidity and composition of phosphatidylcholine and phosphatidylethanolamine in rat C6 glioblastoma cells. Phytomedicine 54, 66–76. [CrossRef]
- Folch, J., Lees, M., and Sloane Stanley, G.H. (1957). A simple method for the isolation and purification of total lipides from animal tissues. J. Biol. Chem. 226, 497–509. [CrossRef]
- Chakraborty, S., Doktorova, M., Molugu, T.R., Heberle, F.A., Scott, H.L., Dzikovski, B., Nagao, M., Stingaciu, L.R., Standaert, R.F., Barrera, F.N., et al. (2020). How cholesterol stiffens unsaturated lipid membranes. Proc. Natl. Acad. Sci. U. S. A. 117, 21896–21905. [CrossRef]
- Doole, F.T., Kumarage, T., Ashkar, R., and Brown, M.F. (2022). Cholesterol stiffening of lipid membranes. J. Membr. Biol. 255, 385–405. [CrossRef]
- Crane, J.M., and Tamm, L.K. (2004). Role of cholesterol in the formation and nature of lipid rafts in planar and spherical model membranes. Biophys. J. 86, 2965–2979. [CrossRef]
- Yuan, C., Furlong, J., Burgos, P., and Johnston, L.J. (2002). The size of lipid rafts: an atomic force microscopy study of ganglioside GM1 domains in sphingomyelin/DOPC/cholesterol membranes. Biophys. J. 82, 2526–2535. [CrossRef]
- Orsini, F., Cremona, A., Arosio, P., Corsetto, P.A., Montorfano, G., Lascialfari, A., and Rizzo, A.M. (2012). Atomic force microscopy imaging of lipid rafts of human breast cancer cells. Biochim. Biophys. Acta 1818, 2943–2949. [CrossRef]
- Sbarigia, C., Tacconi, S., Mura, F., Rossi, M., Dinarelli, S., and Dini, L. (2022). High-resolution atomic force microscopy as a tool for topographical mapping of surface budding. Front. Cell Dev. Biol. 10, 975919. [CrossRef]
- Iwagaki, H., Marutaka, M., Nezu, M., Suguri, T., Tanaka, N., and Orita, K. (1994). Cell membrane fluidity in K562 cells and its relation to receptor expression. Res. Commun. Mol. Pathol. Pharmacol. 85, 141–149.
- Kozubski, W., Swiderek, M., Kloszewska, I., Gwozdzinski, K., and Watala, C. (2002). Blood platelet membrane fluidity and the exposition of membrane protein receptors in Alzheimer disease patients—preliminary study. Alzheimer Dis. Assoc. Disord. 16, 52–54. [CrossRef]
- Wang J, Stuehr DJ, Rousseau DL. A conserved Val to Ile switch near the heme pocket of animal and bacterial nitric-oxide synthases helps determine their distinct catalytic profiles. J Biol Chem. 2004; 279:19018–19025. [CrossRef]
- Beaumont, E., Lambry, J.C., Wang, Z.Q., Stuehr, D.J., Martin, J.L., and Slama-Schwok, A. (2007). Distal Val346Ile mutation in inducible NO synthase promotes substrate-dependent NO confinement. Biochemistry 46, 13533–13540. [CrossRef]
- Weisslocker-Schaetzel, M., Lembrouk, M., Santolini, J., and Dorlet, P. (2017). Revisiting the Val/Ile mutation in mammalian and bacterial nitric oxide synthases: A spectroscopic and kinetic study. Biochemistry 56, 748–756. [CrossRef]
- Wong, E., Bayly, C., Waterman, H.L., Riendeau, D., and Mancini, J.A. (1997). Conversion of prostaglandin G/H synthase-1 into an enzyme sensitive to PGHS-2-selective inhibitors by a double His513→Arg and Ile523→Val mutation. J. Biol. Chem. 272, 9280–9286. [CrossRef]
- Shu, H.K., Chang, C.M., Ravi, L., Ling, L., Castellano, C.M., Walter, E., Pelley, R.J., and Kung, H.J. (1994). Modulation of erbB kinase activity and oncogenic potential by single point mutations in the glycine loop of the catalytic domain. Mol. Cell. Biol. 14, 6868–6878. [CrossRef]
- Guy PM, Platko JV, Cantley LC, Cerione RA, Carraway KL. Insect cell-expressed p185c-erbB with a valine-to-isoleucine substitution shows relaxed ligand dependence and enhanced transforming potential. Proc Natl Acad Sci U S A. 1994; 91:8132–8136. [CrossRef]
- Ikeda M, Iwata N, Kitajima T, et al. Association of a HCRTR1 isoleucine-to-valine mutation with polydipsic-hyponatremic schizophrenia. Neuropsychopharmacology. 2010; 35:1275–1284. [CrossRef]
- Karhu, L., Magarkar, A., Bunker, A., and Xhaard, H. (2019). Determinants of orexin receptor binding and activation: A molecular dynamics study. J. Phys. Chem. B 123, 2609–2622. [CrossRef]
- Zimniak, P., Nanduri, B., Pikuła, S., Bandorowicz-Pikuła, J., Singhal, S.S., Srivastava, S.K., Awasthi, S., and Awasthi, Y.C. (1994). Naturally occurring human glutathione S-transferase GSTP1-1 isoforms with isoleucine and valine in position 104 differ in enzymic properties. Eur. J. Biochem. 224, 893–899. [CrossRef]
- Yuan, X., Yin, P., Hao, Q., Yan, C., Wang, J., and Yan, N. (2010). Single amino acid alteration between valine and isoleucine determines the distinct pyrabactin selectivity by PYL1 and PYL2. J. Biol. Chem. 285, 28953–28958. [CrossRef]
- Miyazono K, Miyakawa T, Sawano Y, Kubota K, Miyauchi Y, Tanokura M. Structural basis of abscisic acid signalling. Nature. 2009; 462:609–614. [CrossRef]
- Simhadri, V.L., Hamasaki-Katagiri, N., Lin, B.C., Hunt, R., Jha, S., Tseng, S.C., Wu, A., Bentley, A.A., Zichel, R., and Lu, Q., et al. (2017). Single synonymous mutation in factor IX alters protein properties and underlies haemophilia B. J. Med. Genet. 54, 338–345. [CrossRef]
- Mouillet-Richard, S., Teil, C., Lenne, M., Hugon, S., Taleb, O., and Laplanche, J.L. (1999). Mutation at codon 210 (V210I) of the prion protein gene in a North African patient with Creutzfeldt-Jakob disease. J. Neurol. Sci. 168, 141–144. [CrossRef]
- Capellari, S., Parchi, P., Russo, C.M., Sanford, J., Sy, M.S., Gambetti, P., and Petersen, R.B. (2000). Effect of the E200K mutation on prion protein metabolism: Comparative study of a cell model and human brain. Am. J. Pathol. 157, 613–622. [CrossRef]
- Mastrianni, J.A., Capellari, S., Telling, G.C., Han, D., Bosque, P., Prusiner, S.B., and DeArmond, S.J. (2001). Inherited prion disease caused by the V210I mutation: transmission to transgenic mice. Neurology 57, 2198–2205. [CrossRef]
- Samal, S., Kumar, S., Khattar, S.K., and Samal, S.K. (2011). A single amino acid change, Q114R, in the cleavage-site sequence of Newcastle disease virus fusion protein attenuates viral replication and pathogenicity. J. Gen. Virol. 92, 2333–2338. [CrossRef]
- Keating, D.H., and Cronan, J.E. Jr. (1996). An isoleucine to valine substitution in Escherichia coli acyl carrier protein results in a functional protein of decreased molecular radius at elevated pH. J. Biol. Chem. 271, 15905–15910. [CrossRef]
- Holak TA, Kearsley SK, Kim Y, Prestegard JH. An isoleucine-to-valine substitution in E. coli acyl carrier protein alters conformation and functional radius. Biochemistry. 1988; 27:6135–6142. [CrossRef]
- Kluss, J.H., Conti, M.M., Kaganovich, A., Beilina, A., Melrose, H.L., Cookson, M.R., and Mamais, A. (2018). Detection of endogenous S1292 LRRK2 autophosphorylation in mouse tissue as a readout for kinase activity. NPJ Parkinsons Dis. 4, 13. [CrossRef]
- Marchand, A., Drouyer, M., Sarchione, A., Chartier-Harlin, M.C., and Taymans, J.M. (2020). LRRK2 phosphorylation, more than an epiphenomenon. Front. Neurosci. 14, 527. [CrossRef]
- Trilling, C.R., Weng, J.H., Sharma, P.K., Nolte, V., Wu, J., Ma, W., Boassa, D., Taylor, S.S., and Herberg, F.W. (2024). RedOx regulation of LRRK2 kinase activity by active site cysteines. NPJ Parkinsons Dis. 10, 75. [CrossRef]
- Yu, M., Arshad, M., Wang, W., Zhao, D., Xu, L., and Zhou, L. (2018). LRRK2-mediated Rab8a phosphorylation promotes lipid storage. Lipids Health Dis. 17, 34. [CrossRef]
- Zhu, H., Sydor, A.M., Yan, B.R., Li, R., Boniecki, M.T., Lyons, C., Cygler, M., Muise, A.M., Maxson, M.E., Grinstein, S., et al. (2025). Salmonella exploits LRRK2-dependent plasma membrane dynamics to invade host cells. Nat. Commun. 16, 2329. [CrossRef]
- Pfeffer, S.R. (2018). LRRK2 and Rab GTPases. Biochem. Soc. Trans. 46, 1707–1712. [CrossRef]
- Vona, R., Iessi, E., and Matarrese, P. (2021). Role of cholesterol and lipid rafts in cancer signaling: A promising therapeutic opportunity? Front. Cell Dev. Biol. 9, 622908. [CrossRef]
- Kabouridis, P.S., Janzen, J., Magee, A.L., and Ley, S.C. (2000). Cholesterol depletion disrupts lipid rafts and modulates the activity of multiple signaling pathways in T lymphocytes. Eur. J. Immunol. 30, 954–963. [CrossRef]
- Silverman, J.M., and Schmeidler, J. (2018). Outcome age-based prediction of successful cognitive aging by total cholesterol. Alzheimers Dement. 14, 952–960. [CrossRef]
- de Laurentiis, A., Donovan, L., and Arcaro, A. (2007). Lipid rafts and caveolae in signaling by growth factor receptors. Open Biochem. J. 1, 12–32. [CrossRef]
- Vereb, G., Matkó, J., Vámosi, G., Ibrahim, S.M., Magyar, E., Varga, S., Szöllosi, J., Jenei, A., Gáspár, R. Jr., Waldmann, T.A., et al. (2000). Cholesterol-dependent clustering of IL-2Rα and its colocalization with HLA and CD48 on T lymphoma cells suggest their functional association with lipid rafts. Proc. Natl. Acad. Sci. U.S.A. 97, 6013–6018. [CrossRef]
- Stetzkowski-Marden, F., Recouvreur, M., Camus, G., Cartaud, A., Marchand, S., and Cartaud, J. (2006). Rafts are required for acetylcholine receptor clustering. J. Mol. Neurosci. 30, 37–38. [CrossRef]
- Zhu, D., Xiong, W.-C., and Mei, L. (2006). Lipid rafts serve as a signaling platform for nicotinic acetylcholine receptor clustering. J. Neurosci. 26, 4841–4851. [CrossRef]
- Slimane, T.A., Trugnan, G., Van IJzendoorn, S.C., and Hoekstra, D. (2003). Raft-mediated trafficking of apical resident proteins occurs in both direct and transcytotic pathways in polarized hepatic cells: role of distinct lipid microdomains. Mol. Biol. Cell 14, 611–624. [CrossRef]
- Zou, W., Yadav, S., DeVault, L., Nung Jan, Y., and Sherwood, D.R. (2015). RAB-10-dependent membrane transport is required for dendrite arborization. PLoS Genet. 11, e1005484. [CrossRef]
- Chung, S.J., Yoo, H.S., Oh, J.S., Kim, J.S., Ye, B.S., Sohn, Y.H., and Lee, P.H. (2018). Effect of striatal dopamine depletion on cognition in de novo Parkinson’s disease. Parkinsonism Relat. Disord. 51, 43–48. [CrossRef]
- Morrow, C.B., Hinkle, J.T., Seemiller, J., Mills, K.A., and Pontone, G.M. (2024). The association of antidepressant use and impulse control disorder in Parkinson’s disease. Am. J. Geriatr. Psychiatry 32, 710–720. [CrossRef]
- Vaughan, R.A., and Foster, J.D. (2013). Mechanisms of dopamine transporter regulation in normal and disease states. Trends Pharmacol. Sci. 34, 489–496. [CrossRef]
- Fell, M.J., Mirescu, C., Basu, K., Cheewatrakoolpong, B., DeMong, D.E., Ellis, J.M., Hyde, L.A., Lin, Y., Markgraf, C.G., Mei, H., et al. (2015). MLi-2, a potent, selective, and centrally active compound for exploring the therapeutic potential and safety of LRRK2 kinase inhibition. J. Pharmacol. Exp. Ther. 355, 397–409. [CrossRef]
- Liu, Z., Hamamichi, S., Lee, B.D., Yang, D., Ray, A., Caldwell, G.A., Caldwell, K.A., Dawson, T.M., Smith, W.W., and Dawson, V.L. (2011). Inhibitors of LRRK2 kinase attenuate neurodegeneration and Parkinson-like phenotypes in Caenorhabditis elegans and Drosophila Parkinson’s disease models. Hum. Mol. Genet. 20, 3933–3942. [CrossRef]
Disclaimer/Publisher’s Note: The statements, opinions and data contained in all publications are solely those of the individual author(s) and contributor(s) and not of MDPI and/or the editor(s). MDPI and/or the editor(s) disclaim responsibility for any injury to people or property resulting from any ideas, methods, instructions or products referred to in the content. |
© 2026 by the authors. Licensee MDPI, Basel, Switzerland. This article is an open access article distributed under the terms and conditions of the Creative Commons Attribution (CC BY) license (http://creativecommons.org/licenses/by/4.0/).
Copyright: This open access article is published under a Creative Commons CC BY 4.0 license, which permit the free download, distribution, and reuse, provided that the author and preprint are cited in any reuse.


