
Submitted:
06 January 2026
Posted:
07 January 2026
You are already at the latest version
Abstract
Wheat production in Zimbabwe is strongly influenced by environmental variability, making it difficult for breeders to identify genotypes that are both high yielding and stable across locations. This study evaluated the yield performance and stability of pre-release bread wheat genotypes across contrasting environments in Zimbabwe. A total of 25 genotypes in 2020 and 24 genotypes in 2021 were tested using a randomized complete block design (RCBD) with three replications at three sites Gwebi Variety Testing Centre (GVTC), Harare Research Station (DR&SS), and Panmure, forming six test environments across two winter seasons. Grain yield and key agronomic traits were recorded and analyzed using combined analysis of variance, correlation analysis, and genotype plus genotype-by-environment (GGE) biplot methods. The combined analysis of variance revealed highly significant (p < 0.001) effects of location on all traits in both years, confirming strong environmental influence on wheat performance. Genotypic differences were also significant for most traits in each season. In 2020, genotype × location interaction for grain yield and grain weight was not significant, indicating relatively stable genotype ranking across environments. In contrast, significant genotype × location interaction in 2021 demonstrated strong crossover effects, with genotypes responding differently across sites. When the 15 genotypes common to both years were analyzed together, genotype × location interaction for grain yield was again not significant, indicating that this subset of genotypes expressed greater yield stability across environments. GGE biplot analysis revealed clear differences in genotype adaptation and stability. The mean versus stability view identified G10 and G4 as high yielding with moderate stability, while G5 and G8 were closest to the ideal genotype, combining high yield and wide adaptation. The which-won-where pattern separated the test environments into two main mega-environments, with G3 and G10 performing best in GVTC- and Harare-based environments, while G4, G5, and G8 were superior at Panmure-related environments. Environment E3 (Harare 2020) was identified as the most representative and closest to an ideal test environment, while E1, E2, E5, and E6 were more discriminating and useful for detecting genotype differences. The findings of this study demonstrated that both yield level and stability must be considered when selecting wheat genotypes for Zimbabwe. Genotypes G5 and G8 showed the best combination of high grain yield and stability and are therefore recommended for broad adaptation. Genotypes such as G3 showed high yield but strong environmental sensitivity and are better suited for specific environments. These findings provide valuable guidance for wheat breeding and variety recommendation in Zimbabwe’s diverse production environments.
Keywords:
genotype x environment interaction
; yielding superiority
; stability
; wheat
; Zimbabwe
1. Introduction
Wheat (Triticum aestivum L.) is a self-pollinating cereal crop of immense global socio-economic and nutritional importance. Worldwide, it ranks second only to maize in total production, serving as a vital staple food, a cornerstone of national food security, and a key source of sustenance [1]. In Zimbabwe, wheat is widely utilized in the preparation of bread, pasta, noodles, cakes, biscuits, and desserts, largely due to its high protein content, which supports the dietary needs of more than half of the country’s population [2]. Agriculture contributes nearly 20% to Zimbabwe’s Gross Domestic Product (GDP), with wheat accounting for about 5% of this share, while also employing approximately 70% of the population [1,3].
The growing population of Zimbabwe at warp speed has led to a steadily increasing demand for wheat to meet domestic consumption needs. However, the country’s production falls short of this demand, supplementing the substantial deficit through imports valued at approximately US$109 million per year [4,5]. This figure is projected to rise due to trade disruptions stemming from the Russia–Ukraine war of attrition, as Ukraine is one of Zimbabwe’s major wheat suppliers. The mean grain yield of wheat under dry land production in Zimbabwe is 4.55 t/ha, which is markedly lower than the potential yield of 10 t/ha achievable under irrigated conditions [6,7]. The persistently low national production could be attributed to multiple factors, including paucity of improved wheat varieties, farmers’ heavy reliance on landraces or low-yielding cultivars, exposure to biotic and abiotic stresses, high production costs, utilization of outdated technologies by farmers, and limited technical expertise [8]. Given wheat’s central role in Zimbabwe’s agricultural value chain, its declining output poses severe economic challenges. Therefore, sustainable research and breeding interventions are imperative to enhance yield gains and secure wheat production under future biotic and abiotic stress scenarios.
Over the past decade, concerted breeding efforts globally have been directed towards developing high yielding varieties of wheat to mitigate the existing poor yielding cultivars and its associated severe ramifications. Hitherto, there have been wheat improvement programs in other parts of the world including Pacific region, Oceania, Asia, and among other major producers resulting in the release of improved varieties with high yielding, biotic stress tolerance alongside other farmers preferred traits [9,10,11,12,13,14,15,16]. Conversely, in sub Saharan Africa (SSA), particularly Zimbabwe, there are dearth of breeding effort of wheat due to a confluence of factors. Many agricultural research institutions in Zimbabwe lack the technical expertise, infrastructure, and funding to conduct advanced plant breeding programs for a crop like wheat coupled with limited access to diverse germplasm collections of wheat in Zimbabwe. Despite the paucity of documented studies on wheat breeding, the little carried out mainly focused on areas encompassing constraints to wheat production, agro-morphological evaluation, drought screening, climate change issues, and disease screening, among others [2,3,5,7,8,17,18].
Multi-environment trials (METs) are a critical component of plant breeding programs, serving to identify genotypes with either broad adaptability or specific adaptation to particular environments. They are typically conducted prior to the release of cultivars for commercial production [19]. Like other crops, wheat demonstrates variable performance across environments due to genotype × environment (G×E) interactions. G×E interaction refers to the differential performance or yield fluctuations of genotypes when evaluated in multiple environments [20,21]. Such interactions are of paramount importance to breeding strategies, as they guide decisions on whether to develop genotypes suited for wide adaptation or those targeted to specific environments [22]. For instance, a genotype that excels in one environment may perform poorly in another. By understanding these patterns, breeders can improve productivity by releasing only high-performing genotypes and aligning them with the most suitable production environments. Cultivars that combine high yield potential with stability across diverse environments are consistently favored by both breeders and farmers. Therefore, evaluating advanced genotypes for both yield performance and stability across multiple environments is an essential step before their release for large-scale cultivation.
This current study was set up to evaluate a set of advanced bread-wheat genotypes for their yielding superiority and stability in the different agro-ecological zones of Zimbabwe. Previous genotype by environment interaction studies have underscored the importance of understanding the environment and the genetic factors and their interaction in determining genotype performance and the impact that they can have on plant breeding. The findings of this study will serve as a valuable blueprint for breeders in selecting and assigning high-performing, stable genotypes to the various wheat-growing regions of the country. Therefore, this study seeks to (i) assess the stability of grain yield and grain quality of newly developed, promising Crop Breeding Institute of Zimbabwe (CBI) wheat lines across the selected agro-ecological locations and seasons, and (ii) identify wheat lines that are suitable for niche environments of Zimbabwe. This research posits that there is a difference in grain yield stability and performance among the newly developed, pre-release CBI of Zimbabwe wheat lines. Furthermore, the yielding ability of the new genotypes is higher than that of the existing (check) varieties across and within specific environments. The findings generated will contribute meaningfully to national efforts toward achieving wheat self-sufficiency in Zimbabwe, ultimately supporting the goal of reducing dependence on wheat imports.
2. Materials and Methods
2.1. Plant Materials and Experimental Sites
Thirty-four promising wheat experimental lines developed by the Department of Research and Specialist Services’ Crop Breeding Institute (CBI), together with four commercial check varieties, were evaluated for performance across three locations with contrasting environmental conditions during the 2020 and 2021 winter wheat growing seasons. This generated a total of six environments. The test sites included the Gwebi Variety Testing Centre (GVTC), Harare Research Station (DR&SS), and Panmure, each characterized by distinct climatic conditions (Table 1). In the first season, twenty-five genotypes were tested, while twenty-four were assessed in the second season. The check varieties comprised local cultivars developed by both the CBI and the Seed Company of Zimbabwe (Seed Co). Details of the test genotypes evaluated in the two seasons are presented in Table 2 and Table 3, respectively. For stability analysis, only the lines common to both seasons were considered (Table 4).
2.2. Experimental Design
A Randomized Complete Block Design (RCBD) was employed for this study with three replications across two growing seasons. At each of the three trial locations, 25 genotypes in season 2020 and 24 genotypes in season 2021, wheat varieties were evaluated. Each plot measured 10 m² and consisted of 10 rows (4 m long, 0.25 m apart). Seeds were sown manually using the hand drilling method. Fertilizer application followed site-specific recommendations, with basal dressing applied at 300–500 kg/ha and top dressing with 350–500 kg/ha of ammonium nitrate (AN), and other cultural practices for wheat were carried out. Planting was carried out according to the recommended wheat sowing calendar for each geographical location, between May 5 and May 25 in both 2020 and 2021.
2.3. Data Collection
Data were collected in the field and recorded on standardized data collection sheets for each trait evaluated. The following traits were measured:
Plant Height
The plant height was measured from the soil level (ground) to the tips of the terminal spikelet of the ears/spikes of upright plants of each plot at harvest (excluding awns). At the end of the trial, the mean height for each genotype per location was determined.
Days to 50% Flowering (Anthesis Date)
Days to flowering were recorded as the number of days from planting to 50% anthesis, defined as the stage when 50% of the culms had fully emerged from the flag leaf sheath [23].
Yield
Grain weight per net plot was determined from plots measuring 10 rows × 4 m × 0.25 m during the 2020 and 2021 winter wheat advanced variety trials. Grain yield was harvested from the six inner rows, while the two outer border rows were discarded to minimize edge effects [24]. Grain yield per hectare was estimated by converting the net plot yield (g/plot) to kg/ha using the following formula:
Here, 87.5% was used to standardize the grain moisture content to a 12.5% moisture basis [24]
Grain Moisture Content
A moisture meter was used for measuring moisture content (to the nearest 0.1%) leveraging the protocol of [25].
Days to Physiological Maturity
Physiological maturity was determined as the period from the initial irrigation to the date when 50% of the peduncles (ear neck) in the net plot are ripe (turned yellow).
Quality Parameters
Post-harvest wheat quality assessments were conducted at the Blue Ribbon Foods Laboratory in Harare. This component of the study focused on test weight (grain density), a critical parameter influencing the baking, milling, and market quality of harvested grain, in accordance with the Grain Marketing Board of Zimbabwe Wheat Intake Standards and specifications prescribed by major milling companies (National Foods, Blue Ribbon Foods, and Victoria Foods). Data from both the 2020 and 2021 seasons were recorded in tables, and results were analyzed and presented using scatter plots, similar to the approach adopted for the morphological traits.
Test Density and Plump Grain
This test was conducted to determine the soundness of the grain, as millers commonly use test weight as an indicator of probable flour yield. Test weight assessment was also carried out at Blue Ribbon Foods Laboratories using the Perten Inframatic Analyzer (Perten Instruments, Inc., IL, USA), which employs imaging technologies to rapidly evaluate multiple wheat quality parameters within a few seconds. Among the key traits measured was grain protein content. Test weight, expressed as the mass of wheat per unit volume (g/hl), was determined from a clean 1 kg grain sample. Genotypes producing grain with test weight values exceeding 750 g/hl were considered to have high test density [26].
2.4. Data Analysis
Statistical analyses were carried out using GENSTAT Version 21 [27]. Data for each parameter of interest were collected and analyzed on a per-location and per-season basis. Subsequently, the datasets were combined to evaluate the interactive effects of genotype × environment. Analysis of variance (ANOVA) was performed to partition the contributions of genotypes, environments, and their interactions to the performance of the trial lines. For exploratory multivariate analysis, Genotype and Genotype × Environment (GGE) biplots were employed to assess yield stability and superiority among the genotypes [28]. Statistical significance was declared at α = 0.05.
The Randomised Complete Block Design linear model for the analysis was:
where, Yijk = observed value of genotype i in block k of environment j, µ = grand mean, Gi = the effect of genotype i, Ej = environment effect, GEij = the interaction effect of genotype i with environment j, Bk(j) = block k effect in location j, eijk = error effect associated with genotype i in block k in environment j.
Yijk = µ + Gi +Ej + GEij +Bk(j) + eijk
Stability Analysis
To evaluate the yield stability of the 15 genotypes tested in 2020 and 2021, each combination of location and year was treated as a separate environment. Thus, Environment 1 (E1) corresponds to GVTC in 2020, Environment 2 (E2) to GVTC in 2021, Environment 3 (E3) to Harare in 2020, Environment 4 (E4) to Harare in 2021, Environment 5 (E5) to Panmure in 2020, and Environment 6 (E6) to Panmure in 2021. The yield performance and stability of the 15 genotypes across these environments were evaluated using genotype plus genotype-by-environment (GGE) biplot analysis, following the method proposed by [28]. The GGE biplot model used for the stability analysis is expressed as:
GGE model:
Yij - µi - βj = ∑𝜆𝑡𝑘=1 k αik γjk + εij
where: Yij is the ith genotype in environment j, µ is grand mean, j b is the main effect of environment j, k is number of principal components (PC); λk is singular value of the k th PC; and αik and γjk are the scores of i th genotype and j th environment, respectively for PCk; εij is the residual associated with genotype i in environment j.
3. Results
3.1. Mean Performance and Combined Analysis of Variance During the 2020 Winter Season
The combined analysis of variance for the 2020 winter season unfurled strong effects of genotype and location on all evaluated traits, with more limited and trait-specific genotype × location interactions. Based on the combined analysis of variance for the 2020 winter season, genotype had a significant effect on all measured traits (with p < 0.001 for anthesis date, days to maturity, plant height, grain moisture content test density, and p < 0.05 for grain weight per plot, and grain yield. Similarly, location showed a highly significant influence on all traits (p < 0.001), whereas genotype × location interaction was only significant for days to maturity (p < 0.001), plant height (p < 0.001), grain moisture content (p < 0.01), and test density (p < 0.001).

Table 5.
Mean squares for the anthesis date, plant height, days to maturity, moisture, grain weigh, test density and total grain yield of the bread wheat genotypes evaluated during the 2020 winter season.
Table 5.
Mean squares for the anthesis date, plant height, days to maturity, moisture, grain weigh, test density and total grain yield of the bread wheat genotypes evaluated during the 2020 winter season.
| SOV | DF | ANTH | DMA | PLH | MOIST | GW | YIELD | TD |
|---|---|---|---|---|---|---|---|---|
| Gen | 24 | 36.01*** | 23.77*** | 306.73*** | 0.23*** | 0.657* | 2.981* | 1001.24*** |
| Loc | 2 | 16952.16*** | 7823.77*** | 5684.59*** | 104.13*** | 60.397*** | 298.495*** | 62995.37*** |
| Gen*Loc | 48 | 5.37NS | 12.69*** | 52.23** | 0.2*** | 0.434NS | 1.956NS | 629.37*** |
| Residuals | 150 | 4.39 | 2.91 | 31.05 | 0.04 | 0.407 | 1.843 | 279.91 |
SOV: Source of Variation, D.F: degrees of freedom, ANTH: anthesis date, PLH: Plant height, DMA: Days to maturity, MOIT: grain moisture content, GW: grain weight per plot; TD: Test density (g/hl), Significance levels: *, **, *** significant at 0.05, 0,01 and <0.01 probability levels, and ns: non-significant at α=0.05 accordingly.
The mean performance for yield and other agronomic traits in 2020 is presented in Table 6. Across the combined analysis of the three environments during the 2020 winter season, the evaluated genotypes showed clear variability in their agronomic traits. Anthesis date (ANTH) ranged from 78.56 days (G6) to 88.33 days (G15), with earlier flowering observed in genotypes such as G5 (79.00 days) and G6 (78.56 days), while G14 (84.11 days) and G15 (88.33 days) were among the latest to reach anthesis. Days to maturity (DMA) varied from 131.00 days (G6) to 136.67 days (G7), with earlier maturity recorded in G6 (131.00 days) and G20 (131.33 days), and later maturity in G7 (136.67 days), G15 (136.56 days) and G4 (136.11 days). Plant height (PLH) also differed considerably among genotypes. The tallest plants were observed in G16 (101.56 cm) and G15 (101.89 cm), while shorter plants were recorded for G4 (81.67 cm), G25 (82.00 cm) and G10 (82.89 cm). Grain moisture content (MOIST) had relatively tight variation, ranging from 10.39% (G3) to 11.03% (G9), and indicating consistent moisture levels across genotypes. Grain weight per plot (GW) showed noticeable variability, with the highest values recorded for G12 (3.34 kg), G7 (3.19 kg) and G19 (3.10 kg), whereas lower grain weights were observed for G20 (2.14 kg) and G25 (2.21 kg). Grain yield (GYD) similarly varied, with the top-performing genotypes being G12 (7.09 t/ha), G7 (6.79 t/ha), G19 (6.60 t/ha) and G3 (6.55 t/ha). Conversely, G20 (4.56 t/ha) and G25 (4.71 t/ha) were among the lower-yielding entries. Test density (TD) ranged widely between genotypes, from 357.11 g/hl (G4) to 394.76 g/hl (G1), with higher-quality grain density observed in G1 (394.67 g/hl), G11 (394.61 g/hl) and G22 (392.56 g/hl), while lower values appeared in G4 (357.11 g/hl) and G23 (359.11 g/hl)
3.2. Correlation Between Traits in 2020
Pearson’s correlation analysis revealed strong and highly significant relationships among phenology, agronomic, yield, and grain quality traits (Figure 1). Grain yield was perfectly associated with grain weight per plot (GW; r = 1.00, p < 0.001) and showed positive correlations with plant height (PLH; r = 0.50, p < 0.001), anthesis date (ANTH; r = 0.62, p < 0.001), and days to maturity (DMA; r = 0.71, p < 0.001). Anthesis and maturity were tightly linked (r = 0.93, p < 0.001). Plant height was positively correlated with ANTH (r = 0.66) and DMA (r = 0.60) (p < 0.001). In contrast, grain moisture content (MOIST) was negatively correlated with GW (r = −0.67), YIELD (r = −0.68), ANTH (r = −0.56), and DMA (r = −0.71) (p < 0.001). Test density (TD) showed weak negative correlations with PLH (r = −0.20), ANTH (r = −0.29), and DMA (r = −0.14), and weak positive associations with GW (r = 0.19) and YIELD (r = 0.20).
3.3. Mean Performance and Combined Analysis of Variance During the 2021 Winter Season
The combined analysis of variance revealed substantial genetic, environmental, and genotype × location interaction effects on most of the evaluated traits during the 2021 winter season. Based on the combined analysis of variance for the 2021 winter season, there were significant differences among genotype for all traits measured except for grain moisture content, while the effect of location was highly significant across all measured parameters. Similarly, the genotype × location interaction showed significant effects for all traits measured except for days to maturity and plant height
Table 7.
Mean squares for the anthesis date, plant height, days to maturity, moisture, grain weight, test density and total grain yield of the bread wheat genotypes evaluated during the 2021 winter season.
Table 7.
Mean squares for the anthesis date, plant height, days to maturity, moisture, grain weight, test density and total grain yield of the bread wheat genotypes evaluated during the 2021 winter season.
| SOV | DF | AD | DMA | PLH | MOIST | GW | YIELD | TD |
|---|---|---|---|---|---|---|---|---|
| Gen | 23 | 11.95*** | 16.89*** | 104.83** | 1.05NS | 0.378** | 1.052** | 241.38*** |
| Loc | 2 | 18121.19*** | 74375.64*** | 6336.84*** | 23.5*** | 184.089*** | 521.854*** | 10163.74*** |
| Gen*Loc | 46 | 8.1*** | 13.03*** | 67.13NS | 1.12NS | 0.297** | 0.850** | 141.98*** |
| Residuals | 144 | 3.87 | 6.08 | 52.79 | 1.13 | 0.163 | 0.47 | 44.08 |
SOV: source of variation, ANTH days to 50% anthesis, PLH: plant height, DMA: days to maturity, MOI: grain moisture content, GW: grain weight, TD: test density (g/hl), *, **, ***: significant at 0.05, 0.01, and <0.01 probability levels, ns: non-significant at α=0.05 accordingly.
The mean performance for yield and other agronomic traits in 2021 is presented in Table 8. Across the three testing environments in the 2021 winter wheat season, the 24 genotypes displayed measurable variation in their performance. Anthesis date (AD) ranged from 82.78 days (G13 and G20) to 87.00 days (G15 and G22). G13 and G20 also recorded the shortest days to maturity (122.78 days), with most genotypes clustering between 124 and 126 days. Regarding plant height (PLH), genotypes showed significant differences, with the tallest plants recorded for G12 (108.33 cm), followed by G24 (104.56 cm) and G10 (103.56 cm). The shortest genotypes were G1, G15 and G22 with 94.22 cm for G1 and G15 and 94.33 cm for G22. Grain moisture content (MOIST) values ranged between 9.92% (G17) and 11.39% (G24). Genotypes G24, G5, and G6 exhibited the highest moisture levels (11.39%, 11.31%, and 11.27% respectively), whereas G17 showed the driest grain at harvest (9.92%). Grain weight per plot (GW) showed clear differentiation among genotypes. The highest values were recorded for G5 (3.21 kg), followed by G3 (3.19 kg) and 9 (3.13 kg). Conversely, the lowest grain weights were observed in G10 (2.48 kg) and G12 (2.51 kg). Across environments, grain yield (t/ha) exhibited substantial variability. The highest yielding genotypes were G3 (5.43 t/ha), G5 (5.40 t/ha), G9 (5.29 t/ha), G22 (5.28 t/ha), G15 (5.25 t/ha), and G17 (5.03 t/ha). On the lower end, G10 (4.23 t/ha) and G12 (4.28 t/ha) had the lowest yield. Test density (TD), values ranged from 394.31 g/hl (G16) to a maximum of 413.56 g/hl (G18) with 10 genotypes having test density greater than 400 g/hl.
3.4. Correlation Between Traits in 2021
Pearson’s correlation analysis for the 2021 winter season revealed strong and predominantly positive associations among traits (Figure 2). Grain yield was perfectly correlated with grain weight per plot (GW; r = 1.00, p < 0.001) and showed strong positive relationships with anthesis date (ANTH; r = 0.93), days to maturity (DMA; r = 0.63), and plant height (PLH; r = 0.61). Plant height was positively associated with ANTH (r = 0.66), DMA (r = 0.50), and GW (r = 0.61). Test density (TD) showed moderate and significant positive correlations with PLH (r = 0.36), ANTH (r = 0.42), GW (r = 0.48), and yield (r = 0.47). Grain moisture content (MOIST) exhibited weak but significant positive correlations with yield and related traits (r = 0.22–0.42), indicating a limited influence on yield expression in 2021.
3.5. Combined Analysis of Variance of the 15 Genotypes Evaluated in 2020 and 2021
The combined analysis of variance across seasons and locations revealed strong environmental effects and trait-dependent genotypic and genotype × location interaction influences on the performance of the evaluated wheat genotypes. Based on the combined analysis of variance across both seasons and all three locations, locations had a highly significant effect on all measured traits with p < 0.001 for all variables. A significant genotypic effect was detected for ANTH, DMA, PLH, and TD (p < 0.001). In contrast, genotype effects were non-significant for grain moisture content, grain weight per plot, and yield (p > 0.05). The genotype × location interaction was highly significant for AD, DMA, PLH, YIELD, and TD (p < 0.001). However, the genotype × location interaction was non-significant for grain moisture content, grain weight per plot, and yield (p > 0.05).
Table 9.
Mean squares for the anthesis date, plant height, days to maturity, moisture, grain weight, test density and total grain yield of the 15 bread wheat genotypes evaluated during the 2020 and 2021 winter seasons.
Table 9.
Mean squares for the anthesis date, plant height, days to maturity, moisture, grain weight, test density and total grain yield of the 15 bread wheat genotypes evaluated during the 2020 and 2021 winter seasons.
| Source | DF | ANTH | DMA | PLH | MOIST | GW | YIELD | TD |
|---|---|---|---|---|---|---|---|---|
| Gen | 14 | 29.22*** | 21.17*** | 246.13*** | 0.61NS | 0.344NS | 1.2779NS | 724.35*** |
| Loc | 5 | 8713.08*** | 21427.64*** | 3396.39*** | 30.43*** | 65.502*** | 238.342*** | 19590.8*** |
| Gen*Loc | 70 | 6.78** | 12.07*** | 83.06*** | 0.4NS | 0.333NS | 1.177NS | 682.73*** |
| Residuals | 180 | 3.78 | 4.29 | 38.9 | 0.4 | 0.245 | 1.013 | 37.85 |
SOV: source of variation, ANTH: days to 50% anthesis, PLH: plant height, DMA: days to maturity, MOI: grain moisture content, GW: grain weight, TD: test density (g/hl), *, **, ***: significant at 0.05, 0.01, and <0.01 probability levels, ns: non-significant at α=0.05 accordingly.
3.6. Adaptability and Stability Analysis for Grain Yield
3.6.1. Mean Performance Versus Stability of Grain Yield
The mean grain yield and stability of the evaluated genotypes were assessed using the average environment coordination (AEC) view of the GGE biplot (Figure 3). The AEC ordinate, which passes through the origin of the biplot, divided the genotypes into two groups according to their mean grain yield performance across environments. Genotypes located on the right side of the AEC ordinate, including G3, G4, G8, G10, G12, and G5, exhibited above-average grain yield, whereas genotypes positioned on the left side, such as G1, G2, G7, G9, G11, G13, and G14, showed below-average yield performance. The AEC abscissa, indicated by the arrowed line, represents the direction of increasing mean grain yield, while the perpendicular projection of genotypes onto this axis reflects yield stability. Genotypes with shorter projection lengths onto the AEC ordinate were considered more stable, whereas those with longer projections showed greater genotype × environment interaction and lower stability.
Among the high-yielding genotypes, G10 and G4 combined relatively higher mean grain yield with moderate stability. In contrast, G3, despite its superior mean yield, exhibited a longer projection from the AEC abscissa, indicating lower yield stability across environments. Genotypes G8 and G5 also displayed comparatively larger projections, suggesting specific adaptation rather than wide adaptability. Conversely, genotypes such as G1, G2, G11, G13, and G14, which were positioned closer to the AEC abscissa, demonstrated greater yield stability, although their mean grain yield was below the overall average. These genotypes may therefore be suitable for environments where yield consistency is prioritized over maximum productivity.
3.6.2. Which-Won-Where (Polygon) View of the GGE Biplot for Grain Yield
The which-won-where (polygon) view of the GGE biplot was used to identify the best-performing genotypes for grain yield across test environments and to delineate possible mega-environments (Figure 4). A polygon was constructed by joining the genotypes that were farthest from the biplot origin, such that all other genotypes were enclosed within the polygon. The genotypes located at the vertices of the polygon represent those with the greatest response to environmental interaction and are either the highest or the poorest yielders in one or more environments. In the present study, the vertex genotypes were G3, G11, G2, G7, G8, and G10, indicating their strong and differential responses across environments. The equality (ray) lines drawn perpendicular to the sides of the polygon divided the biplot into several sectors, and the environments falling within each sector defined distinct mega-environments. Based on the distribution of environment markers, the test environments were grouped into four major mega-environments. Mega-environment 1, represented mainly by E1 and E4, fell into the sector where G3 and G10 were the vertex genotypes, indicating that these genotypes produced the highest grain yield in these environments. Mega-environment 2, which included E2 and E3, was associated with G4, G8, and G5, suggesting their superior yield performance in the E2 and E3. Mega-environments 3 and 4 represented by E6 and E5 were not associated with any winning genotype, as no genotype fell into these sectors. Genotypes located near the origin of the biplot, encompassing G1, G6, G9, G12, G13, and G15 exhibited relatively smaller GE interaction effects and therefore showed more average but stable grain yield performance across environments. In contrast, some vertex genotypes (e.g., G2 and G7) were not associated with any test environment within their respective sectors, indicating that although they were highly responsive to environmental variation, they did not achieve superior yield performance in any of the evaluated environments.
3.6.3. Discriminativeness and Representativeness of Test Environments
The discriminativeness and representativeness of the test environments were evaluated using the GGE biplot based on the average environment coordination (AEC) method (Figure 5). In this biplot, the length of an environment vector reflects its discriminating ability, whereas the angle between the environment vector and the AEC abscissa indicates its representativeness of the overall target environment. In the present study, environments E1, E2, E5, and E6 exhibited relatively long vectors, indicating a high capacity to discriminate among genotypes. These environments provided substantial information on genotypic differences and are therefore effective for genotype evaluation. In contrast, environments E3 and E4 showed comparatively shorter vectors, suggesting limited discriminating ability and a reduced contribution to distinguishing genotypic performance.
Representativeness was assessed based on the proximity of environment vectors to the AEC abscissa. Environments E3 and E4 were positioned close to the AEC, indicating that they were more representative of the average testing conditions. Conversely, environments E1, E2, E5, and E6 formed relatively larger angles with the AEC, suggesting that although they were highly discriminative, they were less representative of the overall target environment. Considering both discriminating ability and representativeness, environment E3 can be regarded as the most representative test environment and is therefore suitable for selecting broadly adapted genotypes. In contrast, environments such as E1 and E5, which exhibited high discriminating power but lower representativeness, are particularly useful for identifying genotypes with specific adaptation to distinct conditions and for elucidating genotype × environment interaction patterns.
3.6.4. Ranking of Test Environments Based on GGE Biplot
The GGE biplot was further used to rank the test environments by simultaneously considering their discriminating ability and representativeness (Figure 6). In this view, the “ideal environment” is depicted at the center of the concentric circles on the average environment axis (AEA). An ideal test environment is characterized by a long vector (high discriminating power) and a small projection onto the AEA ordinate (high representativeness of the target environment). In the present analysis, environment E3 was positioned closest to the center of the concentric circles, indicating that it is most closely approximated as the ideal test environment by combining good discriminating ability with high representativeness. Environments E2 and E6 were located relatively close to the ideal environment and can therefore also be considered desirable testing sites. These environments are suitable for selecting genotypes with broad adaptation across the target environments. Conversely, environments E1, E5, and E4 were positioned farther from the center of the concentric circles, suggesting that they deviated more from the ideal environment. Although these environments may still be useful for identifying genotypes with specific adaptation or for exploiting genotype × environment interactions, nonetheless; they are less suitable for general selection aimed at broad adaptation.
3.6.5. Ranking of Genotypes Based on the GGE Biplot
The ranking of genotypes relative to an ideal genotype was examined using the GGE biplot based on the average environment coordination (AEC) method (Figure 7). In this view, the arrowed AEC abscissa represents increasing mean performance across environments, while the concentric circles centered on the ideal genotype indicate the relative distance of each genotype from the ideal combination of high mean performance and stability. Genotypes closer to the center of the concentric circles are therefore considered more desirable, as they combine superior performance with greater stability across test environments. In the present study, genotypes G5 and G8 were located closest to the center of the concentric circles, indicating that they were the most similar to the ideal genotype and thus exhibited high and stable performance across environments. These genotypes were followed by G12, G9, and G4, which were also relatively close to the ideal genotype and can be considered desirable for broad adaptation. Conversely, genotypes G3 and G11 were positioned farther from the center of the concentric circles, suggesting lower stability and/or reduced mean performance across environments.
3.6.6. Relationship Among Test Environments
The relationship among the test environments was examined using a GGE biplot constructed with environment-centered data (centering = 2), without scaling (scaling = 0), and with singular value partitioning focused on environment relationships (SVP = 3). The first two principal components explained 61.96% of the total G + GE variation, with PC1 and PC2 accounting for 39.71% and 22.25%, respectively (Figure 8). The vector view of the GGE biplot summarizes the associations among environments based on the angles between their vectors. Environments E1 and E2 formed acute angles and were positioned relatively close to each other, indicating a strong positive correlation and suggesting similar genotype performance patterns across these environments. In contrast, environments E5 and E6 were located in the negative side of PC1 with relatively long vectors, forming obtuse angles with E1 and E2, which implies weak or negative correlations and indicates that these environments were distinctly different in their discriminating ability. Environment E3 was positioned near the origin with a comparatively short vector, suggesting limited discriminating power and a reduced ability to differentiate genotypic performance. Conversely, environment E4 showed a predominantly vertical orientation along PC2 and formed near-orthogonal angles with several other environments, indicating weak correlations and highlighting its uniqueness relative to the remaining test environments.
4. Discussion
4.1. Analysis of Variance and Mean Performance of Genotypes for Yield and Other Agronomic Traits
The primary objective of this study was to identify high-yielding and stable genotypes among newly developed, pre-release bread wheat genotypes from the CBI for recommendation. The differential responses of the test genotypes across environments highlighted the extent of genetic variation within Zimbabwean wheat germplasm. As emphasized by Salgotra & Chauhan [29], the effectiveness of selection largely depends on the magnitude of genetic variability within the target population. This variability enables the identification of genotypes with superior agronomic traits [30]. This study revealed substantial variability among the test wheat genotypes, indicating strong potential for effective selection to advance wheat improvement in Zimbabwe.
Critical decisions in plant breeding programs are often guided by multi-environment trial (MET) data, where mean yield ranks across sites provide the basis for selecting promising lines for advancement or varietal release [31]. One of the major aims of METs is to identify genotypes that combine high yield with stability, as such varieties can serve as both commercial cultivars and breeding populations for subsequent improvement programs [32]. However, breeding efforts must also consider specific adaptation to target environments, since focusing exclusively on stability carries risks. Some genotypes may perform exceptionally well under particular conditions, even if they are not broadly adapted [33].
This present study recorded significant genotype × environment interaction (GEI) effects for the measured traits, revealing the influence of environmental factors on genotype performance [34]. The highly significant location effects observed for all traits in both 2020 and 2021 confirm that the three test environments differed markedly in their capacity to support crop development, grain filling, and quality formation. An important feature of this study is that the genotype composition differed between years, with 25 genotypes evaluated in 2020, 24 in 2021, and only 15 common genotypes across both seasons. This structure allowed a unique insight into how GEI depends not only on climate and location but also on the genetic diversity of the test population. In 2020, genotype × location interaction for grain yield was not significant, indicating that genotypes ranked similarly across locations and that superior genotypes such as G12, G7, G19, and G3 consistently outperformed inferior ones regardless of environment. This suggests that 2020 was characterized by relatively low crossover interaction for yield, meaning that genotypic differences were mainly in magnitude rather than in rank. In contrast, the genotype × location interaction for grain yield and grain weight in 2021 was significant, indicating the presence of strong crossover genotype × environment interaction (GEI), in which the relative ranking of genotypes changed across environments. This pattern was evident as genotypes such as G3, G5, G9, G22, and G15 exhibited outstanding performance in certain environments but not in others. When the two seasons were combined using only the 15 genotypes common to both years, genotype × location interaction for grain yield was non-significant, indicating that this subset of genotypes exhibited relatively stable performance across environments and seasons. This result is highly informative from a breeding perspective because it shows that stability is not merely an environmental artefact but a genetic property that can be selected for. The common genotypes appear to represent a more buffered genetic group, less sensitive to environmental fluctuation, whereas some of the genotypes included only in 2020 or 2021 were more responsive and therefore more unstable.
This stability for grain yield in 2020 and for the common genotypes across years is beneficial for breeders because it indicates that selection for these traits can be effective across different environments, without the need for strong location-specific recommendations. Similarly, there was a lack of significance for days to maturity and test density, suggesting these traits were relatively stable across environments. This stability is advantageous for breeding, as it means selection for these traits is less dependent on specific environments.
It is worth noting that several genotypes (G12, G7, G19, and G3) outperformed the check varieties in the 2020 season indicating that there could be the presence of superior genetic potential. These genotypes are promising candidates and could serve as a source population for further breeding or release. The relatively lower performance of the check varieties (G4 and G25) compared to the top-performing test genotypes demonstrates the progress achieved through recurrent selection breeding. It suggests that the pipeline of advanced breeding lines is capable of producing varieties with significantly higher yields than those currently in farmers’ fields. The consistently lower yields of G12 and G10 suggest limited potential for these genotypes in future selection, perhaps could be included in future breeding programs if they possess other desirable traits such as disease resistance, grain quality, early maturity or other farmer preferred traits.
4.2. GGE Biplot Analysis
The GGE biplot analysis clearly showed that the grain yield of the tested genotypes was strongly influenced by both their genetic potential and how they reacted to different environments. This confirms that genotype × environment interaction (GEI) plays a major role in determining which genotypes perform well and which do not across locations and seasons. In this study, some genotypes performed well only in certain environments, while others produced more consistent yields across all environments. This pattern is very common in wheat multi-environment trials and has also been reported in Ethiopia and Mozambique [35,36].
The Average Environment Coordination (AEC) view showed a clear separation between high-yielding and low-yielding genotypes. Genotypes such as G3, G4, G8, G10, G12, and G5 produced above-average grain yield, while others like G1, G2, G7, G9, G11, G13, and G14 were below the overall mean. However, high yield alone was not enough to identify the best genotypes. Stability was equally important. The AEC also showed that some high-yielding genotypes, especially G3, had large projections from the AEC axis, meaning that their yield changed strongly from one environment to another. This indicates low stability and strong GE interaction. Such genotypes perform very well in some locations but poorly in others, which makes them risky choices for farmers. Similar behaviour has been reported in Ethiopian and Mozambican wheat trials, where some top-yielding genotypes were unstable and suitable only for specific locations [35,37,38]. In contrast, genotypes such as G10 and G4 combined relatively high yield with moderate stability, making them more reliable across environments. Even more stable were genotypes such as G1, G2, G11, G13, and G14, which were positioned close to the AEC axis. Although their mean yield was below average, their performance changed very little across environments. These genotypes can be useful in marginal or unpredictable environments where yield stability is more important than maximum yield. This agrees with previous studies where stable but moderate-yielding genotypes were recommended for risk-prone farming systems [39].
The which-won-where biplot further confirmed that different genotypes were best suited to different groups of environments. Genotypes G3 and G10 were the best performers in mega-environment 1 (E1 and E4), while G4, G8, and G5 were superior in mega-environment 2 (E2 and E3). This shows clear crossover interaction, where the best genotype in one environment is not the best in another. Such patterns have also been widely reported in wheat where strong seasonal and location effects create different adaptation zones [40,41]. The fact that some environments (E5 and E6) did not fall clearly into any mega-environment suggests that these sites had unique growing conditions, making them especially useful for identifying stress-tolerant or specifically adapted genotypes.
Genotypes near the biplot origin, such as G1, G6, G9, G12, G13, and G15, had small GE interaction and showed average but stable performance across environments. These genotypes may not be the highest yielders, but their wide adaptability makes them valuable for breeding programs aiming to release varieties that perform reliably across large regions.
The analysis of discriminativeness and representativeness of environments showed that E1, E2, E5, and E6 were highly discriminative, meaning they were very good at revealing differences among genotypes. These sites are useful for identifying superior and inferior genotypes, especially those with specific adaptation. However, E3 and E4 were more representative of the overall target environment, meaning that a genotype’s performance there was closer to the overall average. This is important for selecting widely adapted genotypes. E3, in particular, was identified as the closest to an ideal test environment because it combined good discriminating ability with high representativeness.
The ranking of genotypes relative to the ideal genotype further strengthened these conclusions. G5 and G8 were closest to the ideal genotype, meaning they combined high grain yield with high stability across environments. These genotypes are therefore the most promising candidates for wide release. G12, G9, and G4 were also close to the ideal and can be considered good choices for broad adaptation. In contrast, genotypes such as G3 and G11, although sometimes high yielding, were far from ideal because of their instability. The relationships among environments also helped explain the stability results. E1 and E2 were strongly correlated, meaning genotypes performed similarly in these two environments. In contrast, E5 and E6 were very different from E1 and E2, showing weak or negative correlations. This explains why some genotypes performed well in one group of environments but poorly in another. E3 had low discriminating power, while E4 was unique compared to the others. Such diversity among environments increases GE interaction and makes stability analysis important.
These results clearly show that selecting wheat genotypes based only on high yield in one environment is not enough. Stability across environments is just as important, especially in regions with variable climate and growing conditions. Genotypes like G5 and G8, which combine good yield with high stability, are the best options for wide cultivation. Genotypes like G3 may be useful for specific high-potential environments, but they are risky for general release.
5. Conclusion
This study demonstrated that grain yield and related agronomic traits of bread wheat genotypes in Zimbabwe are strongly influenced by genotype, environment, and their interaction. The significant location effects observed across the two seasons confirmed that the test environments differ markedly in their capacity to support wheat growth and grain production. The contrasting genotype × location patterns between 2020 and 2021 further showed that seasonal conditions and the genetic makeup of the tested materials play a critical role in determining yield stability and adaptation. The GGE biplot analysis effectively revealed patterns of genotype performance, stability, and environmental discrimination. The which-won-where view grouped the six test environments into distinct mega-environments and identified genotypes with specific as well as wide adaptation. Genotypes G3 and G10 were superior in GVTC- and Harare-related environments, while G4, G5, and G8 performed best in Panmure-related environments, confirming the presence of crossover genotype × environment interaction. The mean versus stability and ideal genotype views further showed that G5 and G8 combined high grain yield with high stability, making them the most desirable candidates for broad adaptation across Zimbabwe’s wheat-growing areas. Genotypes such as G3 showed high yield but low stability and are therefore more suitable for specific high-potential environments. The evaluation of test environments indicated that E1, E2, E5, and E6 were highly discriminative, making them effective for identifying superior genotypes, while E3 was the most representative and closest to an ideal test environment for selecting broadly adapted cultivars. This suggests that future wheat testing in Zimbabwe can be optimized by combining highly discriminative sites with at least one representative environment to improve selection efficiency. The findings of this study confirm that both yield level and stability across environments must be considered to ensure reliable farmer performance. Based on all GGE biplot criteria, genotypes G5 and G8 were identified as the most stable and high-yielding across environments and are therefore recommended for wide adaptation. These genotypes can serve as strong candidates for variety release and as valuable parental material in future breeding programs.
Author Contributions
Conceptualization, L.D. K.C.N and P.M.; methodology, L.D., T.A-G. and F.A.U.; investigation, L.D. and P.M.; resources, K.C.N., J.M., and P.M.; data curation, O.B.O., A-R.O.M., P.A., M.H.B., and P.M.; original draft preparation, L.D. and P.A.; review and editing, O.B.O., A-R.O.M., M.H.B., T.A-G., N.A.A., F.A.U.; supervision, K.C.N and P.M.; project administration, L.D. The authors extend their profound gratitude to the Crop Breeding Institute for the logistics provision that lead to the success of the study.
Funding
This research did not receive any external funding.
Data Availability Statement
The data presented in this study are available in this article.
Conflicts of Interest
The authors declare no conflict of interest.
References
- Reynolds, M. P.; Braun, H. J. Wheat Improvement: Food Security in a Changing Climate. In Wheat Improvement: Food Security in a Changing Climate; 2022. [Google Scholar] [CrossRef]
- Abate, F.; Mehari, H.; Ahmed, S.; Odong, T.; Rubaihayo, P. Deciphering genotype-by-environment interaction for targeting test environments and genotypes resistant to wheat stem rust disease. Journal of Crop Science and Biotechnology 2023, 26, 585–594. [Google Scholar] [CrossRef]
- Mavindidze, P.; Mafandizvo, T.; Gasura, E.; Mavankeni, B. O.; Kutywayo, D.; Kamutando, C. N. Progress check of yielding ability and stability of selected pre-release bread-wheat cultivars in Zimbabwe. Journal of Crop Science and Biotechnology 2020, 23, 337–345. [Google Scholar] [CrossRef]
- Knoema, E. World Data Atlas; 2021. [Google Scholar]
- Mashonganyika, F.; Mugiyo, H.; Svotwa, E.; Kutywayo, D. Mapping of Winter Wheat Using Sentinel-2 NDVI Data. A Case of Mashonaland Central Province in Zimbabwe. Frontiers in Climate 2021, 1–10. [Google Scholar] [CrossRef]
- FAOSTAT. 2023. Available online: https://www.fao.org/faostat/en/#data/QCL.
- Mutanda, M.; Shimelis, H.; Chaplot, V.; Figlan, S. Managing drought stress in wheat (Triticum aestivum L.) production: strategies and impacts. South African Journal of Plant and Soil 2025, 0, 1–12. [Google Scholar] [CrossRef]
- Chawarika, A. An Assessment of the Critical Constraints To Wheat. Business & Social Sciences Journal (BSSJ) 2016, 33–47. [Google Scholar]
- Sadras, V.O.; Lawson, C.; Montoro, A. Photosynthetic traits in Australian wheat varieties released between 1958 and 2007. Field Crops Research 2012, 134, 19–29. [Google Scholar] [CrossRef]
- Muhammad, T.; Abid, M.; Mian, M. A.; Cheema, N.M.; Sabar, M.; Ihsan, M.; Attiq-ur-Rehman. Dharabi-11: A new high yielding drought and disease tolerant wheat variety. International Journal of Agriculture and Biology 2013, 15, 701–706. [Google Scholar]
- Kumar Singh, C.; Gupta, S.; Singh, S. P.; Kumar Singh, V.; Singh, V. Performance of Newly Released Wheat Varieties At Farmer’S Field. Annals of Plant and Soil Research 2015, 17, 507–509. Available online: https://www.researchgate.net/publication/334084624.
- Gupta, V.; Kumar, M.; Singh, V.; Chaudhary, L.; Yashveer, S.; Sheoran, R.; Dalal, M. S.; Nain, A.; Lamba, K.; Gangadharaiah, N.; Sharma, R.; Nagpal, S. Genotype by Environment Interaction Analysis for Grain Yield of Wheat (Triticum aestivum (L.) em.Thell)Genotypes. Agriculture 2022, 12, 1–15. [Google Scholar] [CrossRef]
- Joshi, K. D.; Rehman, A. U.; Ullah, G.; Nazir, M. F.; Zahara, M.; Akhtar, J.; Khan, M.; Baloch, A.; Khokhar, J.; Ellahi, E.; Khan, A.; Suleman, M.; Imtiaz, M. Acceptance and competitiveness of new improved wheat varieties by smallholder farmers. Journal of Crop Improvement 2017, 31, 608–627. [Google Scholar] [CrossRef]
- Alemu, G.; Geleta, N.; Dabi, A.; Sime, B.; Duga, R.; Delesa, A.; Zewdu, D.; Kasahun, C.; Solomon, T.; Zegaye, H.; Getamesay, A.; Asnake, D.; Asefa, B.; Abeyo, B.; Badebo, A.; Bayisa, T. Registration of Bread Wheat (Triticum aestivum L.) Variety Kulumsa for the Midlands of Ethiopia. Journal of Global Ecology and Environment 2023, 19, 67–78. [Google Scholar] [CrossRef]
- Duga, R.; Dabi, A.; Zewdu, D.; Sime, B.; Alemu, G.; Geleta, N.; Solomon, T.; Delasa, A.; Zegaye, H.; Asnake, D.; Asefa, B.; Getamesay, A.; Kasahun, C.; Abeyo, B.; Badebo, A.; Awas, G. Registration of New Bread Wheat Variety (Gutu) for Mid to Highland Altitude Wheat Producing Areas of Ethiopia. Asian Journal of Research in Crop Science 2024, 9, 332–340. [Google Scholar] [CrossRef]
- Patel, S. K. Development and Evaluation of High Yielding, Multiple Disease Resistant Bread Wheat Variety – GW. International Journal of Environmental and Agriculture Research 2025, 7, 118–125. [Google Scholar] [CrossRef]
- Mwadzingeni, L.; Shimelis, H.; Tesfay, S.; Tsilo, T. J. Screening of bread wheat genotypes for drought tolerance using phenotypic and proline analyses. Frontiers in Plant Science 2016, 7, 1276. [Google Scholar] [CrossRef] [PubMed]
- Govere, S.; Nyamangara, J.; Nyakatawa, E.Z. Climate change signals in the historical water footprint of wheat production in Zimbabwe. Science of the Total Environment 2020, 742, 513–526. [Google Scholar] [CrossRef]
- Wardofa, G. A.; Asnake, D.; Mohammed, H. GGE biplot analysis of genotype by environment interaction and grain yield stability of bread wheat genotypes in central Ethiopia. Journal of Plant Breeding and Genetics 2019, 7, 75–85. [Google Scholar] [CrossRef]
- Popović, V.; Ljubičić, N.; Kostić, M.; Radulović, M.; Blagojević, D.; Ugrenović, V.; Ivošević, B. Genotype× Environment Interaction for Wheat Yield Traits Suitable for Selection in Different Seed Priming Conditions. Plants 2020, 9, 1804. [Google Scholar] [CrossRef] [PubMed]
- Khan, M.M.H.; Rafii, M. Y.; Ramlee, S. I.; Jusoh, M.; Al Mamun, M. AMMI and GGE biplot analysis for yield performance and stability assessment of selected Bambara groundnut (Vigna subterranea L. Verdc.) genotypes under the multi-environmental trials (METs). Scientific reports 2021, 11, 1. [Google Scholar] [CrossRef]
- Kedir, A.; Alemu, S.; Tesfaye, Y.; Asefa, K.; Teshome, G. Effect of Genotype by Environment Interaction on Bread Wheat (Triticum aestivum L.) Genotypes in Midland of Guji Zone, Southern Ethiopia. Bioprocess Engineering 2022, 6, 16–21. [Google Scholar]
- Ottman, M. J.; Anthony Hunt, L.; White, J. W. Photoperiod and vernalization effect on anthesis date in winter-sown spring wheat regions. Agronomy Journal. 2013, 105, 1017–1025. [Google Scholar] [CrossRef]
- Waddington, S.R.; Ransom, J.K.; Osmanzai, M.; Saunders, D. A. Improvement in the yield potential of bread wheat adapted to northwest Mexico 1. Crop Science 1986, 26, 698–703. [Google Scholar] [CrossRef]
- Devkota, M.; Verhulst, N.; Saito, K; Johnson, J-M; Hauser, S; Corbeels, M; Devkota, M; Casimero, M. Measurement of wheat grain yield and aboveground biomass at maturity for crop cut at plot level, v1. Standard Operating Procedure 014. In Guideline for measuring agronomic gain key performance indicators in onfarm trials; Excellence in Agronomy for Sustainable Intensification and Climate Change Adaptation Initiative, 2023; Volume v. 1, pp. 1–5. [Google Scholar]
- Kim, K. H.; Kim, J. Y. Understanding Wheat Starch Metabolism in Properties, Environmental Stress Condition, and Molecular Approaches for Value-Added Utilization. Plants 2021, 10, 2282. [Google Scholar] [CrossRef]
- VSN International. Genstat for Windows 21st Edition. VSN International, Hemel Hempstead, UK. Web page: Genstat.co.uk. 2020.
- Yan, W.; Tinker, N. A. Biplot analysis of multi-environment trial data: Principles and applications. Canadian journal of plant science 2006, 86, 623–645. [Google Scholar] [CrossRef]
- Salgotra, R.K.; Chauhan, B. S. Genetic Diversity, Conservation, and Utilization of Plant Genetic Resources. Genes. 2023, 14, 1. [Google Scholar] [CrossRef]
- Gebre, W.; Mekbib, F.; Tirfessa, A.; Bekele, A. Genetic Diversity, Association, and Path Coefficient Analyses of Sorghum [Sorghum bicolor (L.) Monech] Genotypes. Scientifica 2024, 20. [Google Scholar] [CrossRef] [PubMed]
- Smith, A.; Ganesalingam, A.; Lisle, C.; Kadkol, G.; Hobson, K.; Cullis, B. Use of Contemporary Groups in the Construction of Multi-Environment Trial Datasets for Selection in Plant Breeding Programs. Frontiers in Plant Science 2021, 1–13. [Google Scholar] [CrossRef]
- Verma, A.; Singh, G.P. GxE Interactions Analysis of Wheat Genotypes Evaluated Under Peninsular Zone of the Country by AMMI Model. Am. J. Agric. For. 2021, 9, 29–36. [Google Scholar] [CrossRef]
- Tola, M.; Adane, A.; Regasa, C.D. Genotype × Environment Interaction and Yield Stability of Large Speckled Common Bean (Phaseolus vulgaris L.) Genotypes in Ethiopia Using AMMI Analysis. Journal of Natural Sciences Research 2023. [Google Scholar] [CrossRef]
- Bhartiya, A.; Aditya, J. P.; Kumari, V.; Kishore, N.; Purwar, J. P.; Agrawal, A.; Kant, L.; Pattanayak, A. Stability analysis of soybean [Glycine max (L.) Merrill] genotypes under multi-environments rainfed condition of North Western Himalayan hills. Indian Journal of Genetics and Plant Breeding 2018, 78, 342–347. [Google Scholar] [CrossRef]
- Dique, J. E. L.; Miguel, M. A.; Pedro, C.; Silota, G.; Fernando, C. J. J.; Bungala, L. T. da C.; Charimba, A. M.; Abílio, L. C.; Simbe, J. D.; Carneiro, V.Q. GGE biplot analysis of the adaptability and stability of wheat genotypes in Mozambique. Pesquisa Agropecuária Brasileira 2023, 58, e03549. [Google Scholar] [CrossRef]
- Megerssa, S. H.; Ishetu, Y. S.; Hailu, M.; Alemayehu Zemede; Lemma, A. Z. Genotype by environment interaction and stability analyses of durum wheat elite lines evaluated in Ethiopia. Crop Breeding and Applied Biotechnology 2024, 24, e45542417. [Google Scholar] [CrossRef]
- Mulugeta, B.; Tesfaye, K.; Geleta, M.; Johansson, E.; Hailesilassie, T.; Hammenhag, C.; Hailu, F.; Ortiz, R. Multivariate analyses of Ethiopian durum wheat revealed stable and high yielding genotypes. PLoS ONE 2022, 17, e0273008. [Google Scholar] [CrossRef]
- Alemayehu, L.; Kebede, M.; Wada, E. AMMI analysis of elite bread wheat (Triticum aestivum L.) selections for genotype by environment interaction and stability of grain yield in Southern Ethiopia. PLoS ONE 2025, 20, e0318559. [Google Scholar] [CrossRef] [PubMed]
- Menzir, A.; Firew, Y.; Kassaye, M.; Mequanint, G. Yield performance and stability of durum wheat varieties in northwestern Ethiopia. BMC Plant Biology 2025, 25, 1710. [Google Scholar] [CrossRef] [PubMed]
- Mullualem, D.; Tsega, A.; Mengie, T.; Fentie, D.; Kassa, Z.; Fassil, A.; Wondaferew, D.; Gelaw, T. S.; Astatkie, T. Genotype-by-environment interaction and stability analysis of grain yield of bread wheat (Triticum aestivum L.) genotypes using AMMI and GGE biplot analyses. Heliyon 2024, 10, e32918. [Google Scholar] [CrossRef] [PubMed]
- Kuru, B.; Abera, N.; Mulualem, T. Genotype X environment interaction and yield stability of finger millet (Eleusine Coracana L.) genotypes based on AMMI, GGE and MTSI analysis in humid lowland areas of Ethiopia. Field Crops Research 2025, 322, 109707. [Google Scholar] [CrossRef]
Figure 1.
Pearson’s correlation matrix among phenological, agronomic, yield, and grain quality traits of bread wheat genotypes evaluated across three locations during the 2020 winter season in Zimbabwe.
Figure 1.
Pearson’s correlation matrix among phenological, agronomic, yield, and grain quality traits of bread wheat genotypes evaluated across three locations during the 2020 winter season in Zimbabwe.
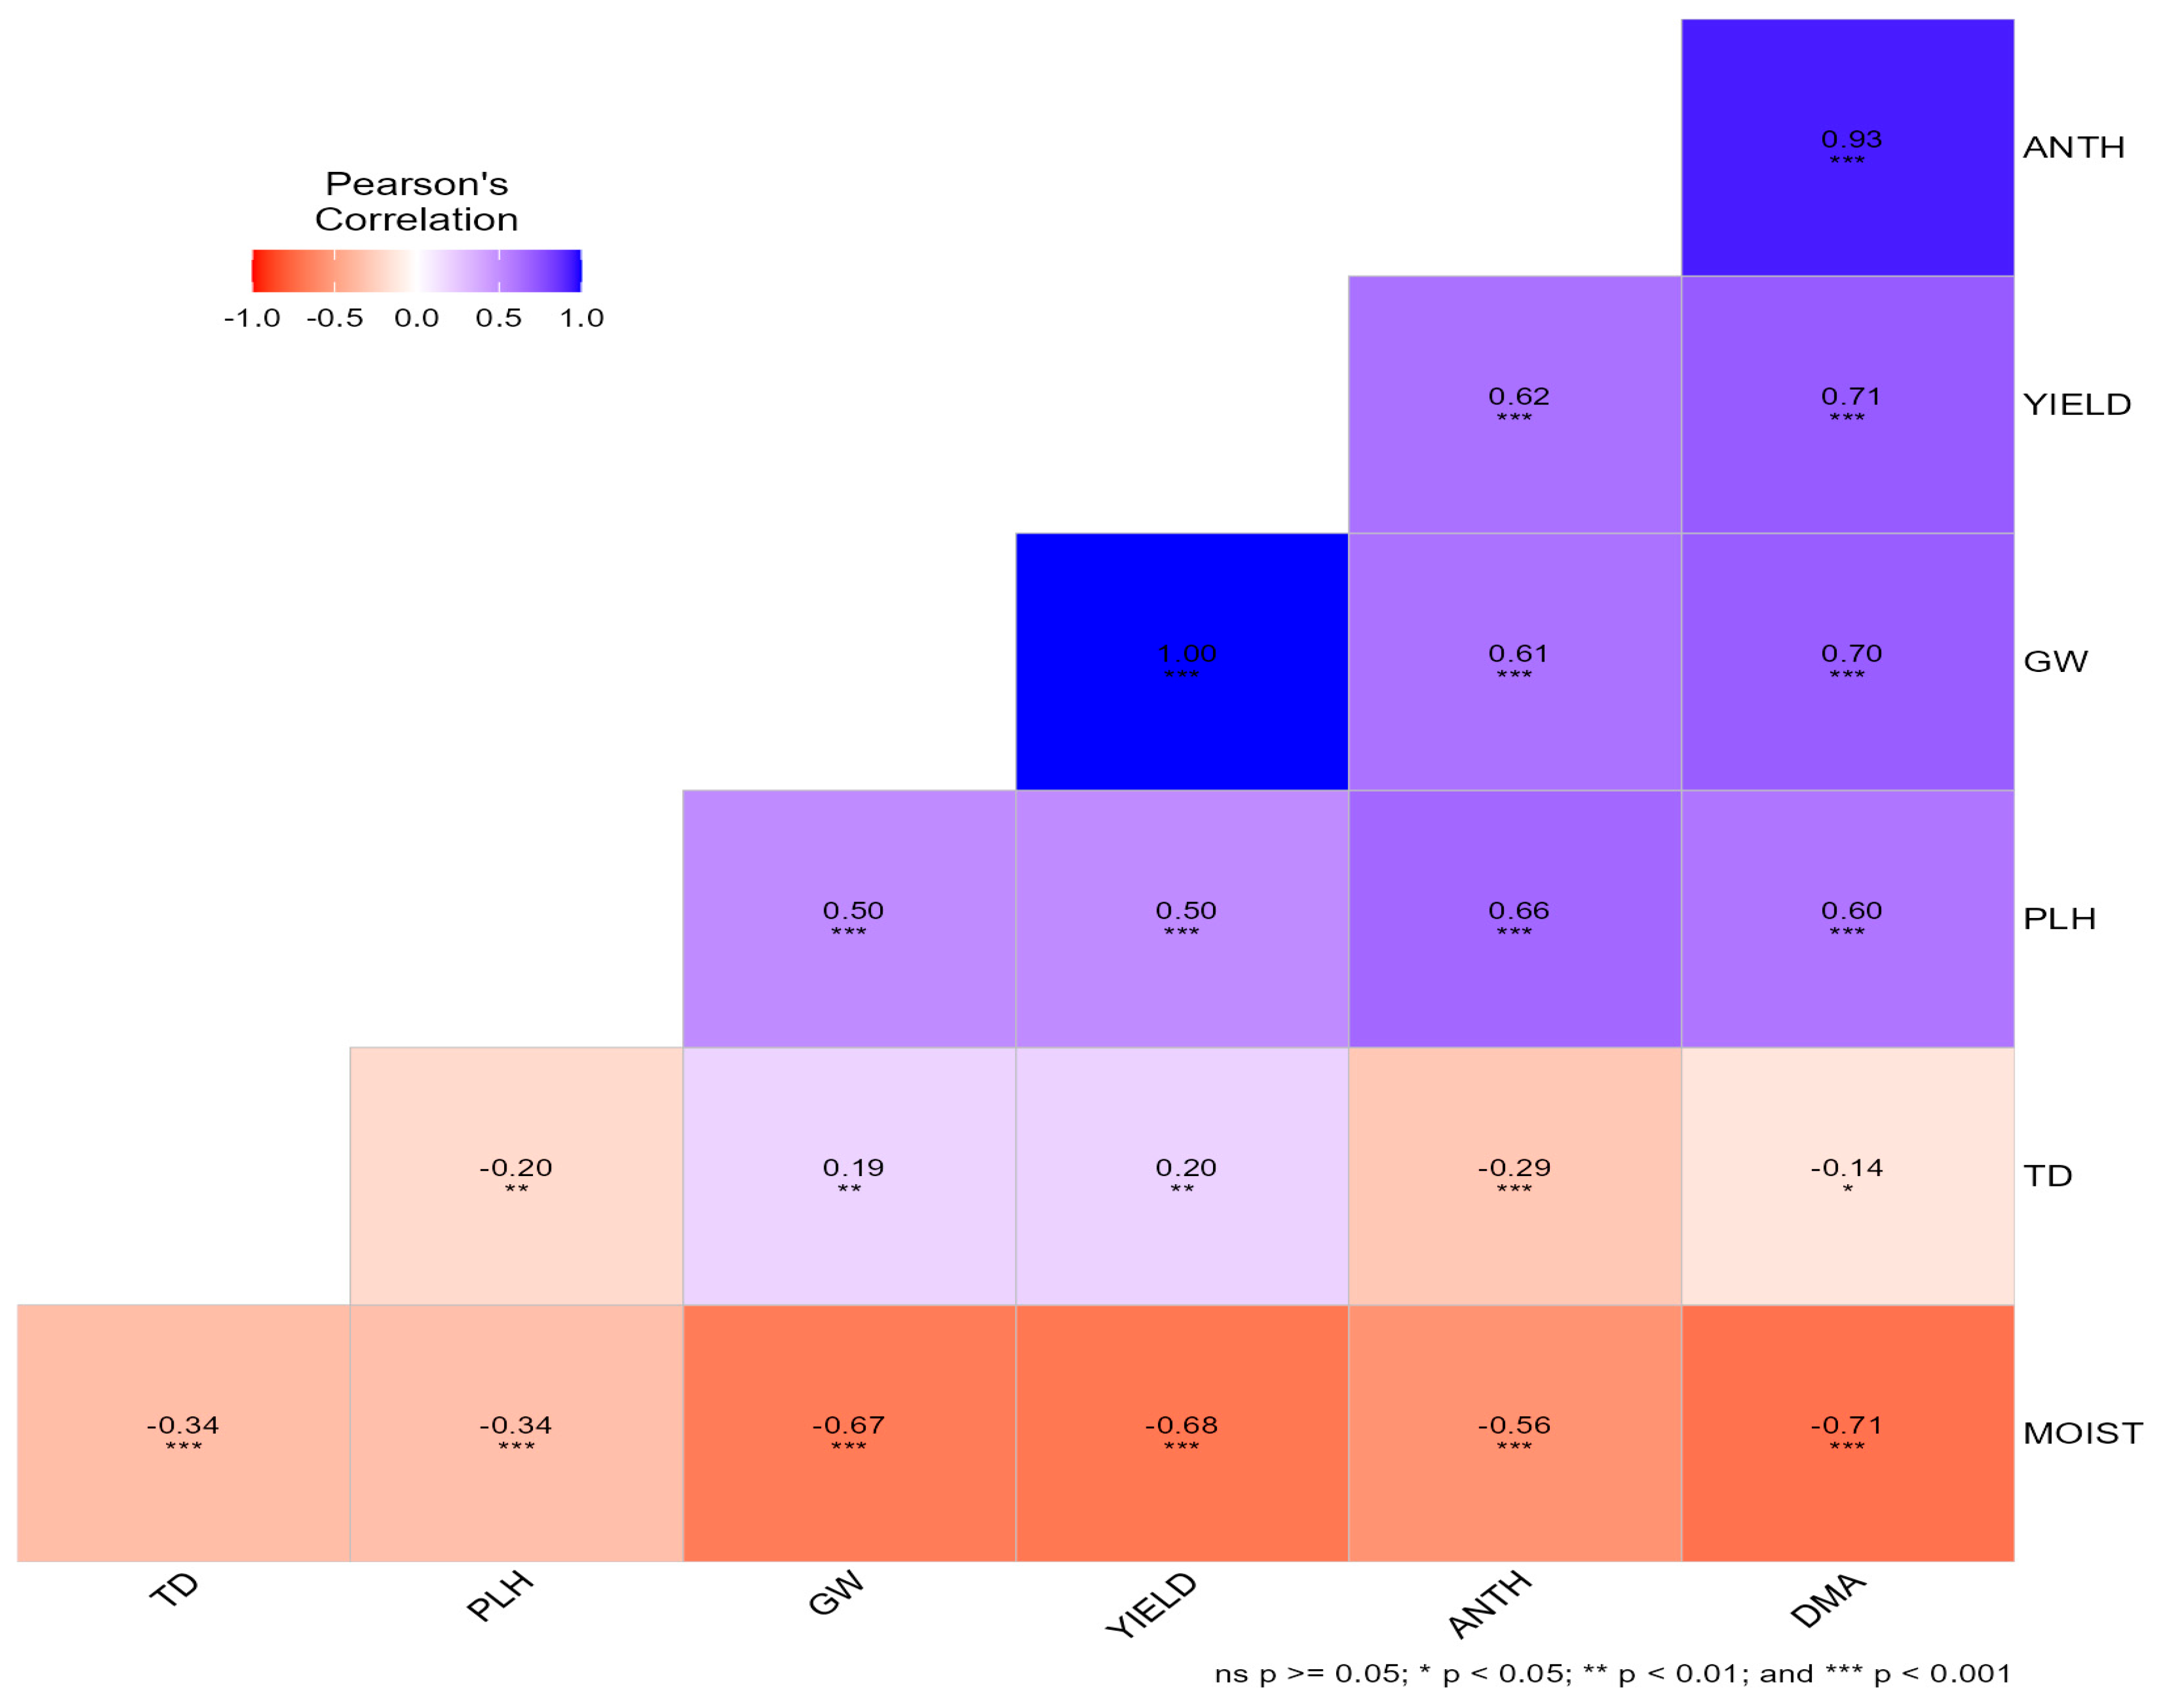
Figure 2.
Pearson’s correlation matrix among phenological, agronomic, yield, and grain quality traits of bread wheat genotypes evaluated across three locations during the 2021 winter season in Zimbabwe.
Figure 2.
Pearson’s correlation matrix among phenological, agronomic, yield, and grain quality traits of bread wheat genotypes evaluated across three locations during the 2021 winter season in Zimbabwe.
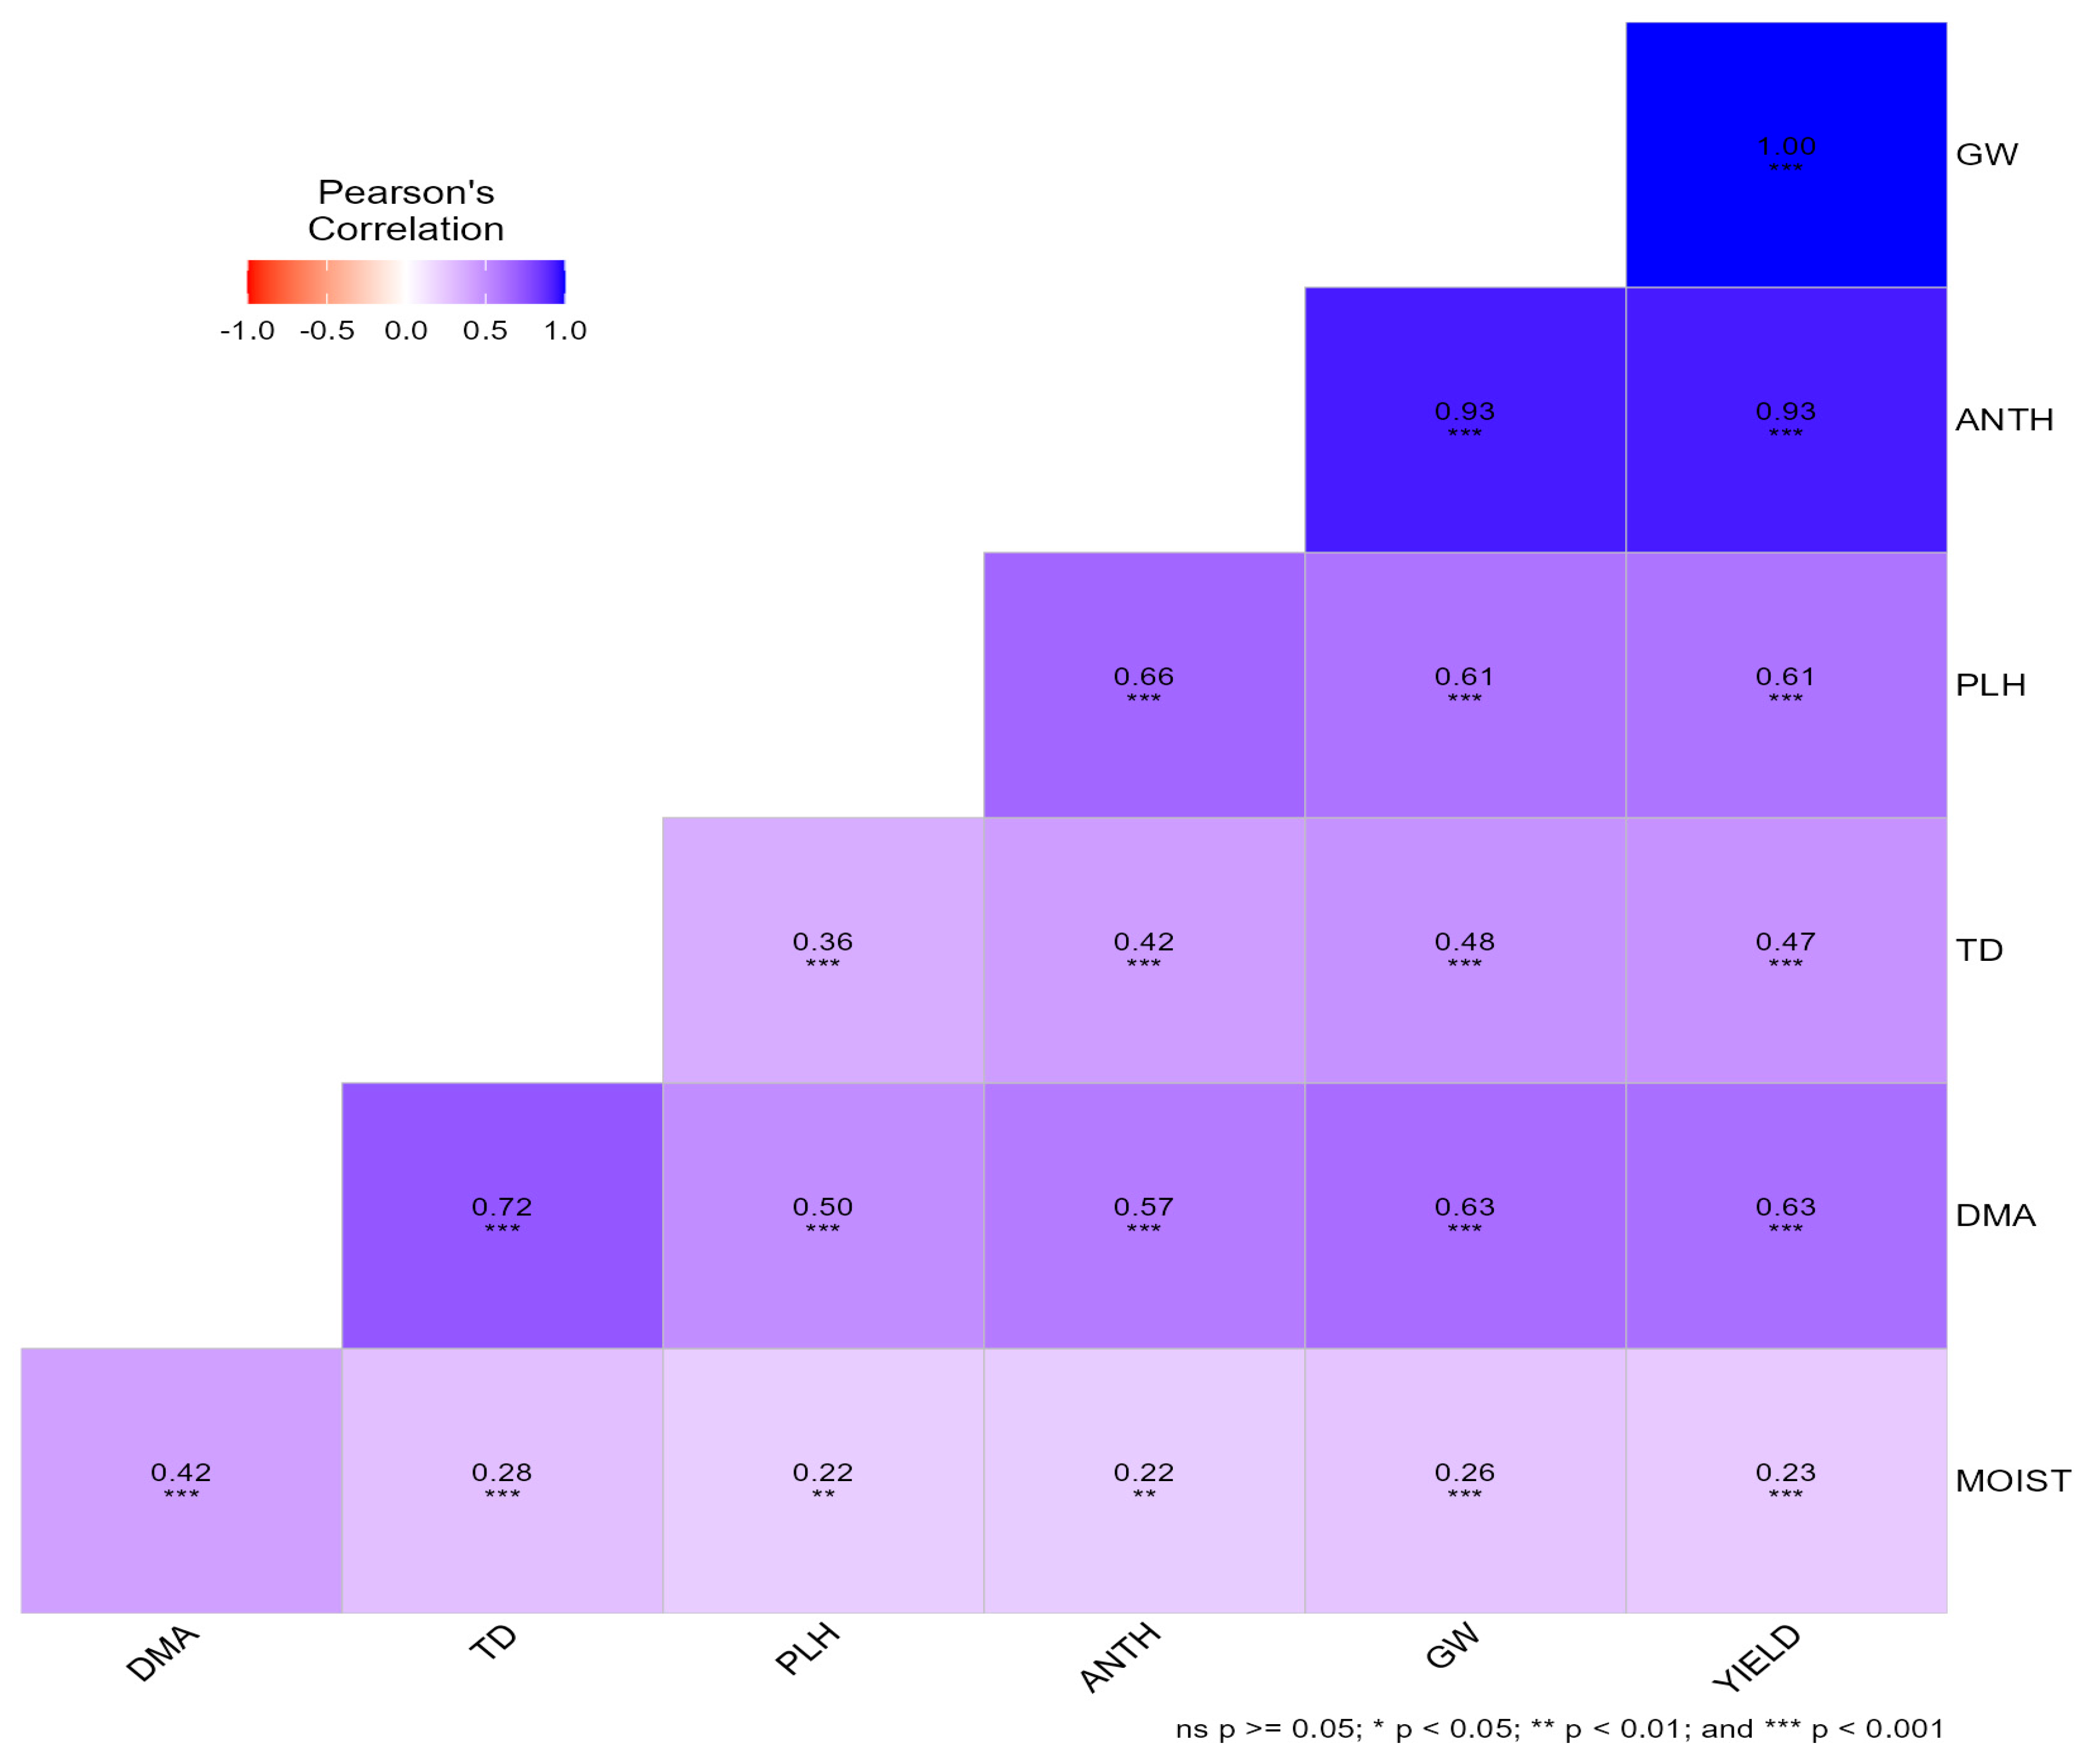
Figure 3.
Mean grain yield performance and stability of bread wheat genotypes across environments based on the average environment coordination (AEC) view of the GGE biplot.
Figure 3.
Mean grain yield performance and stability of bread wheat genotypes across environments based on the average environment coordination (AEC) view of the GGE biplot.
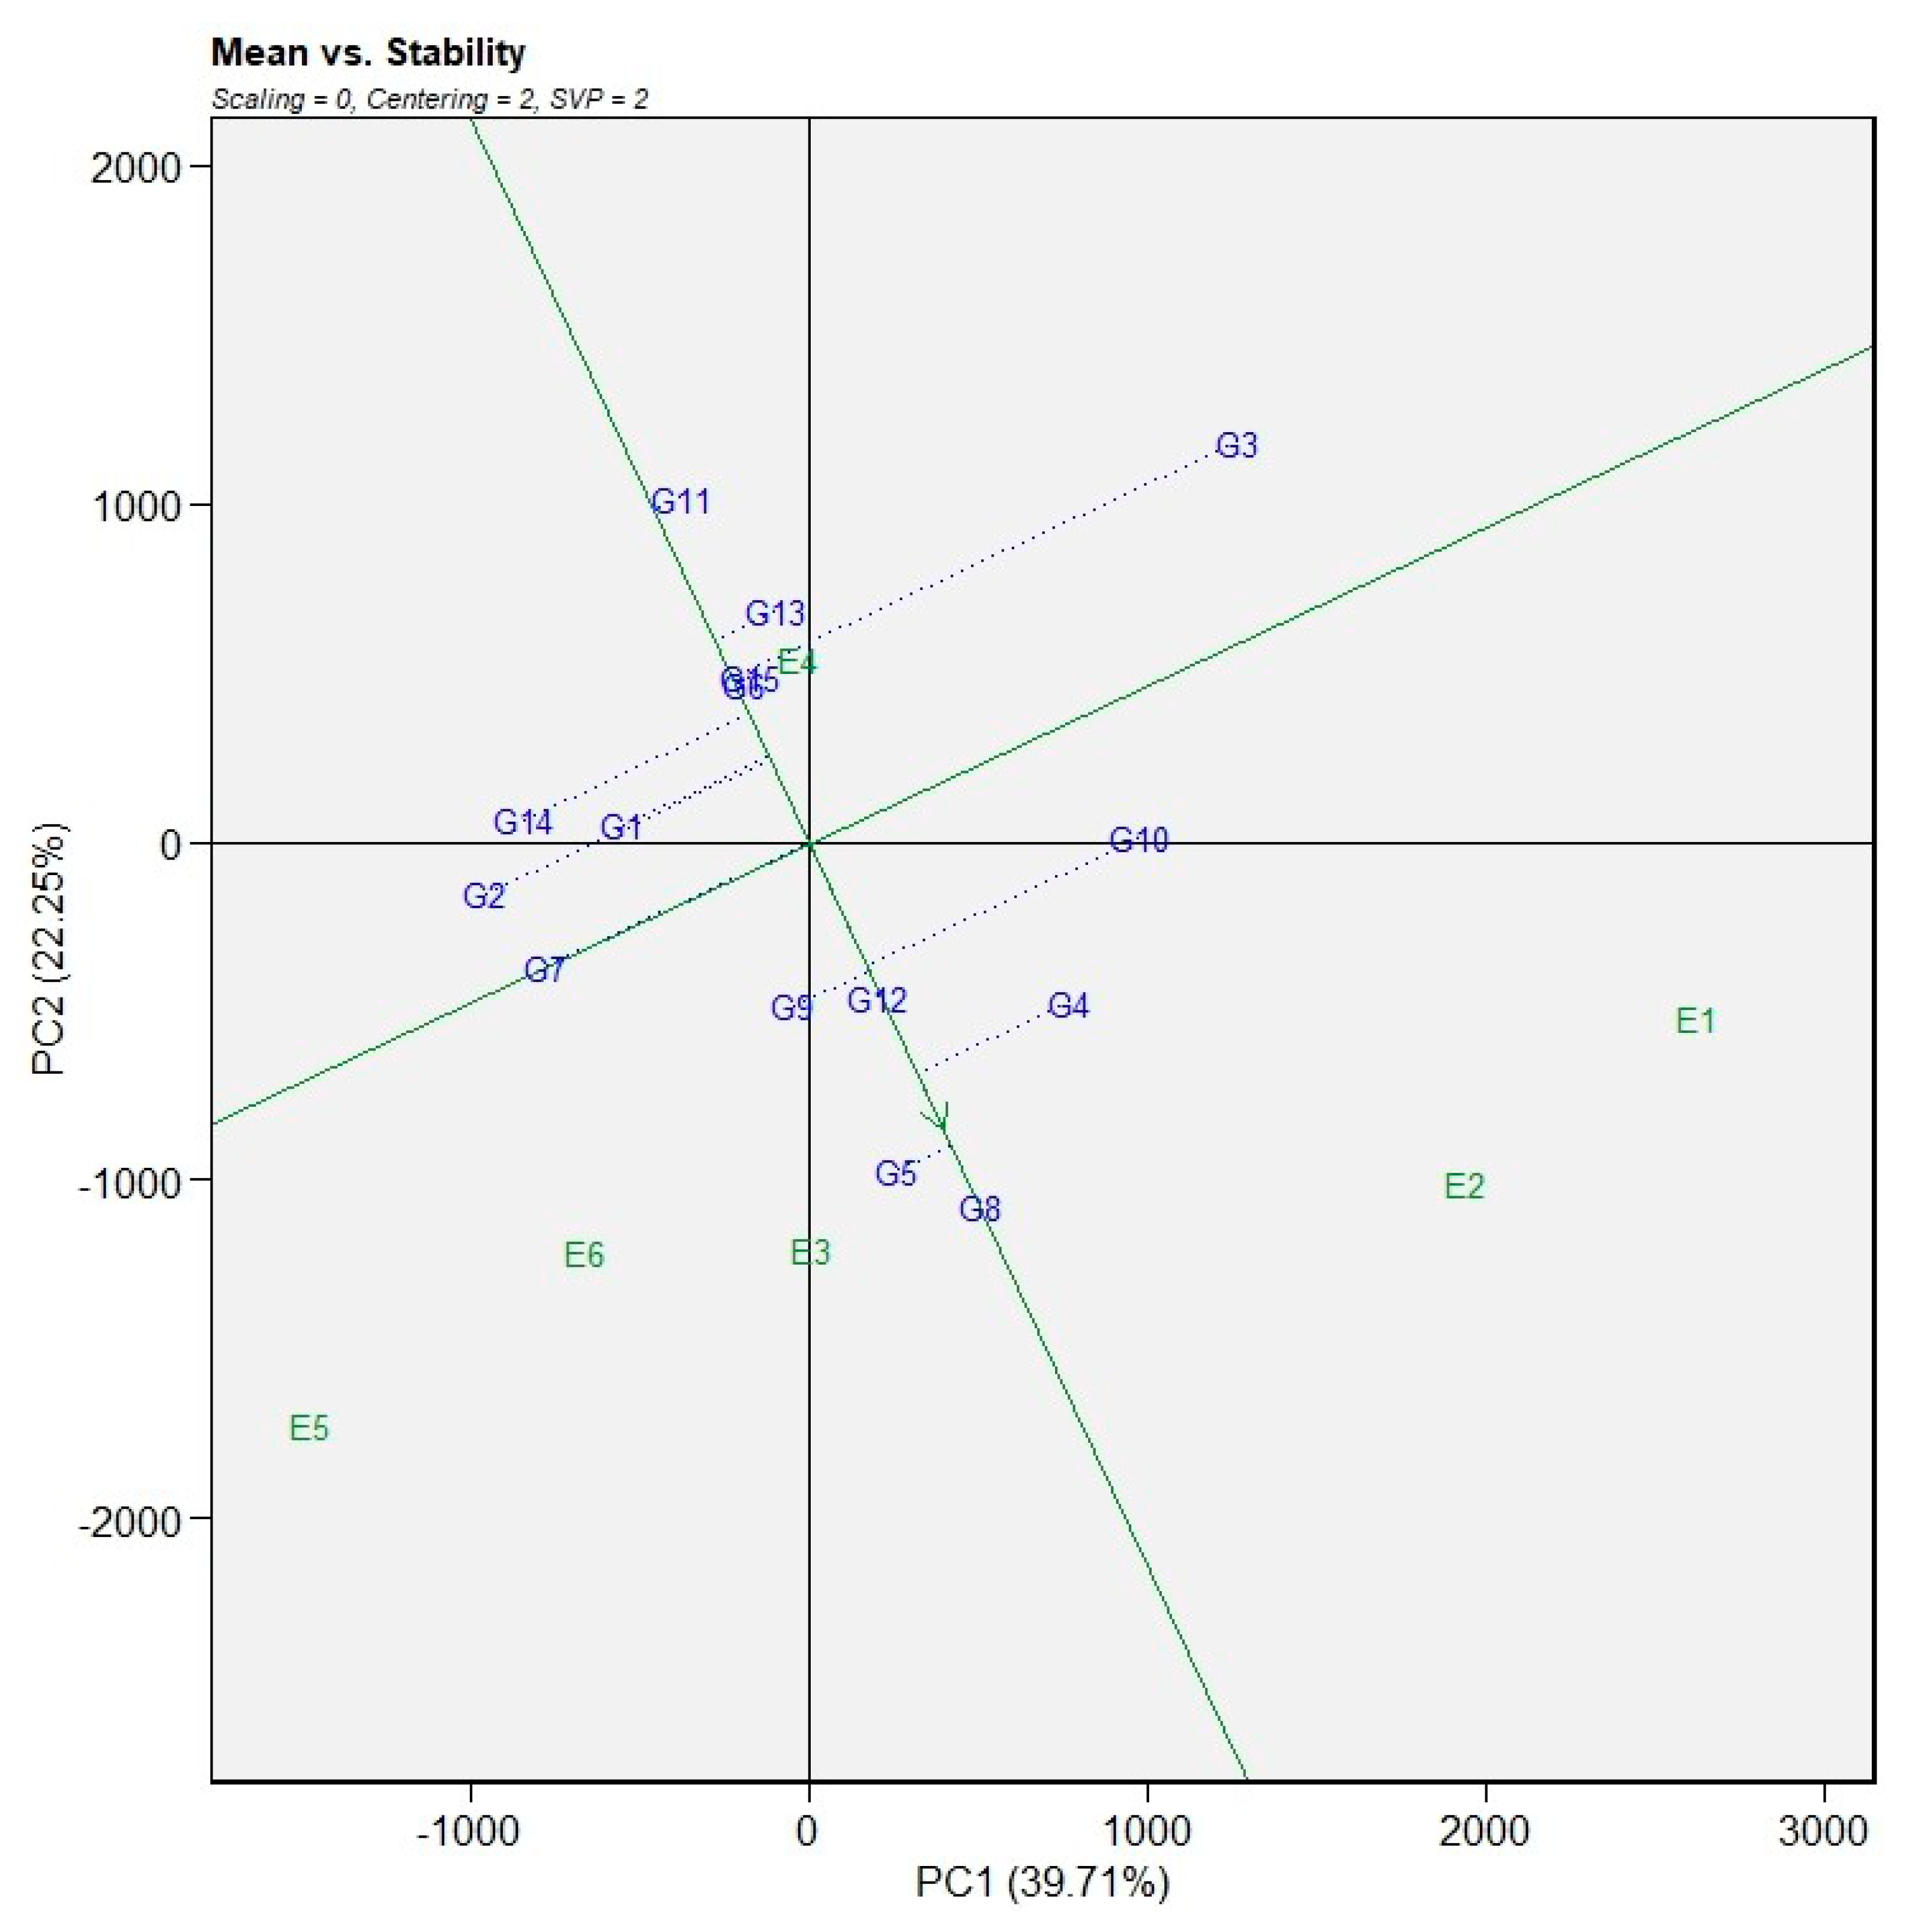
Figure 4.
Which-won-where pattern view of the GGE biplot (polygon view) showing genotype main effects and G × E interactions of 15 genotypes across two seasons for grain yield.
Figure 4.
Which-won-where pattern view of the GGE biplot (polygon view) showing genotype main effects and G × E interactions of 15 genotypes across two seasons for grain yield.
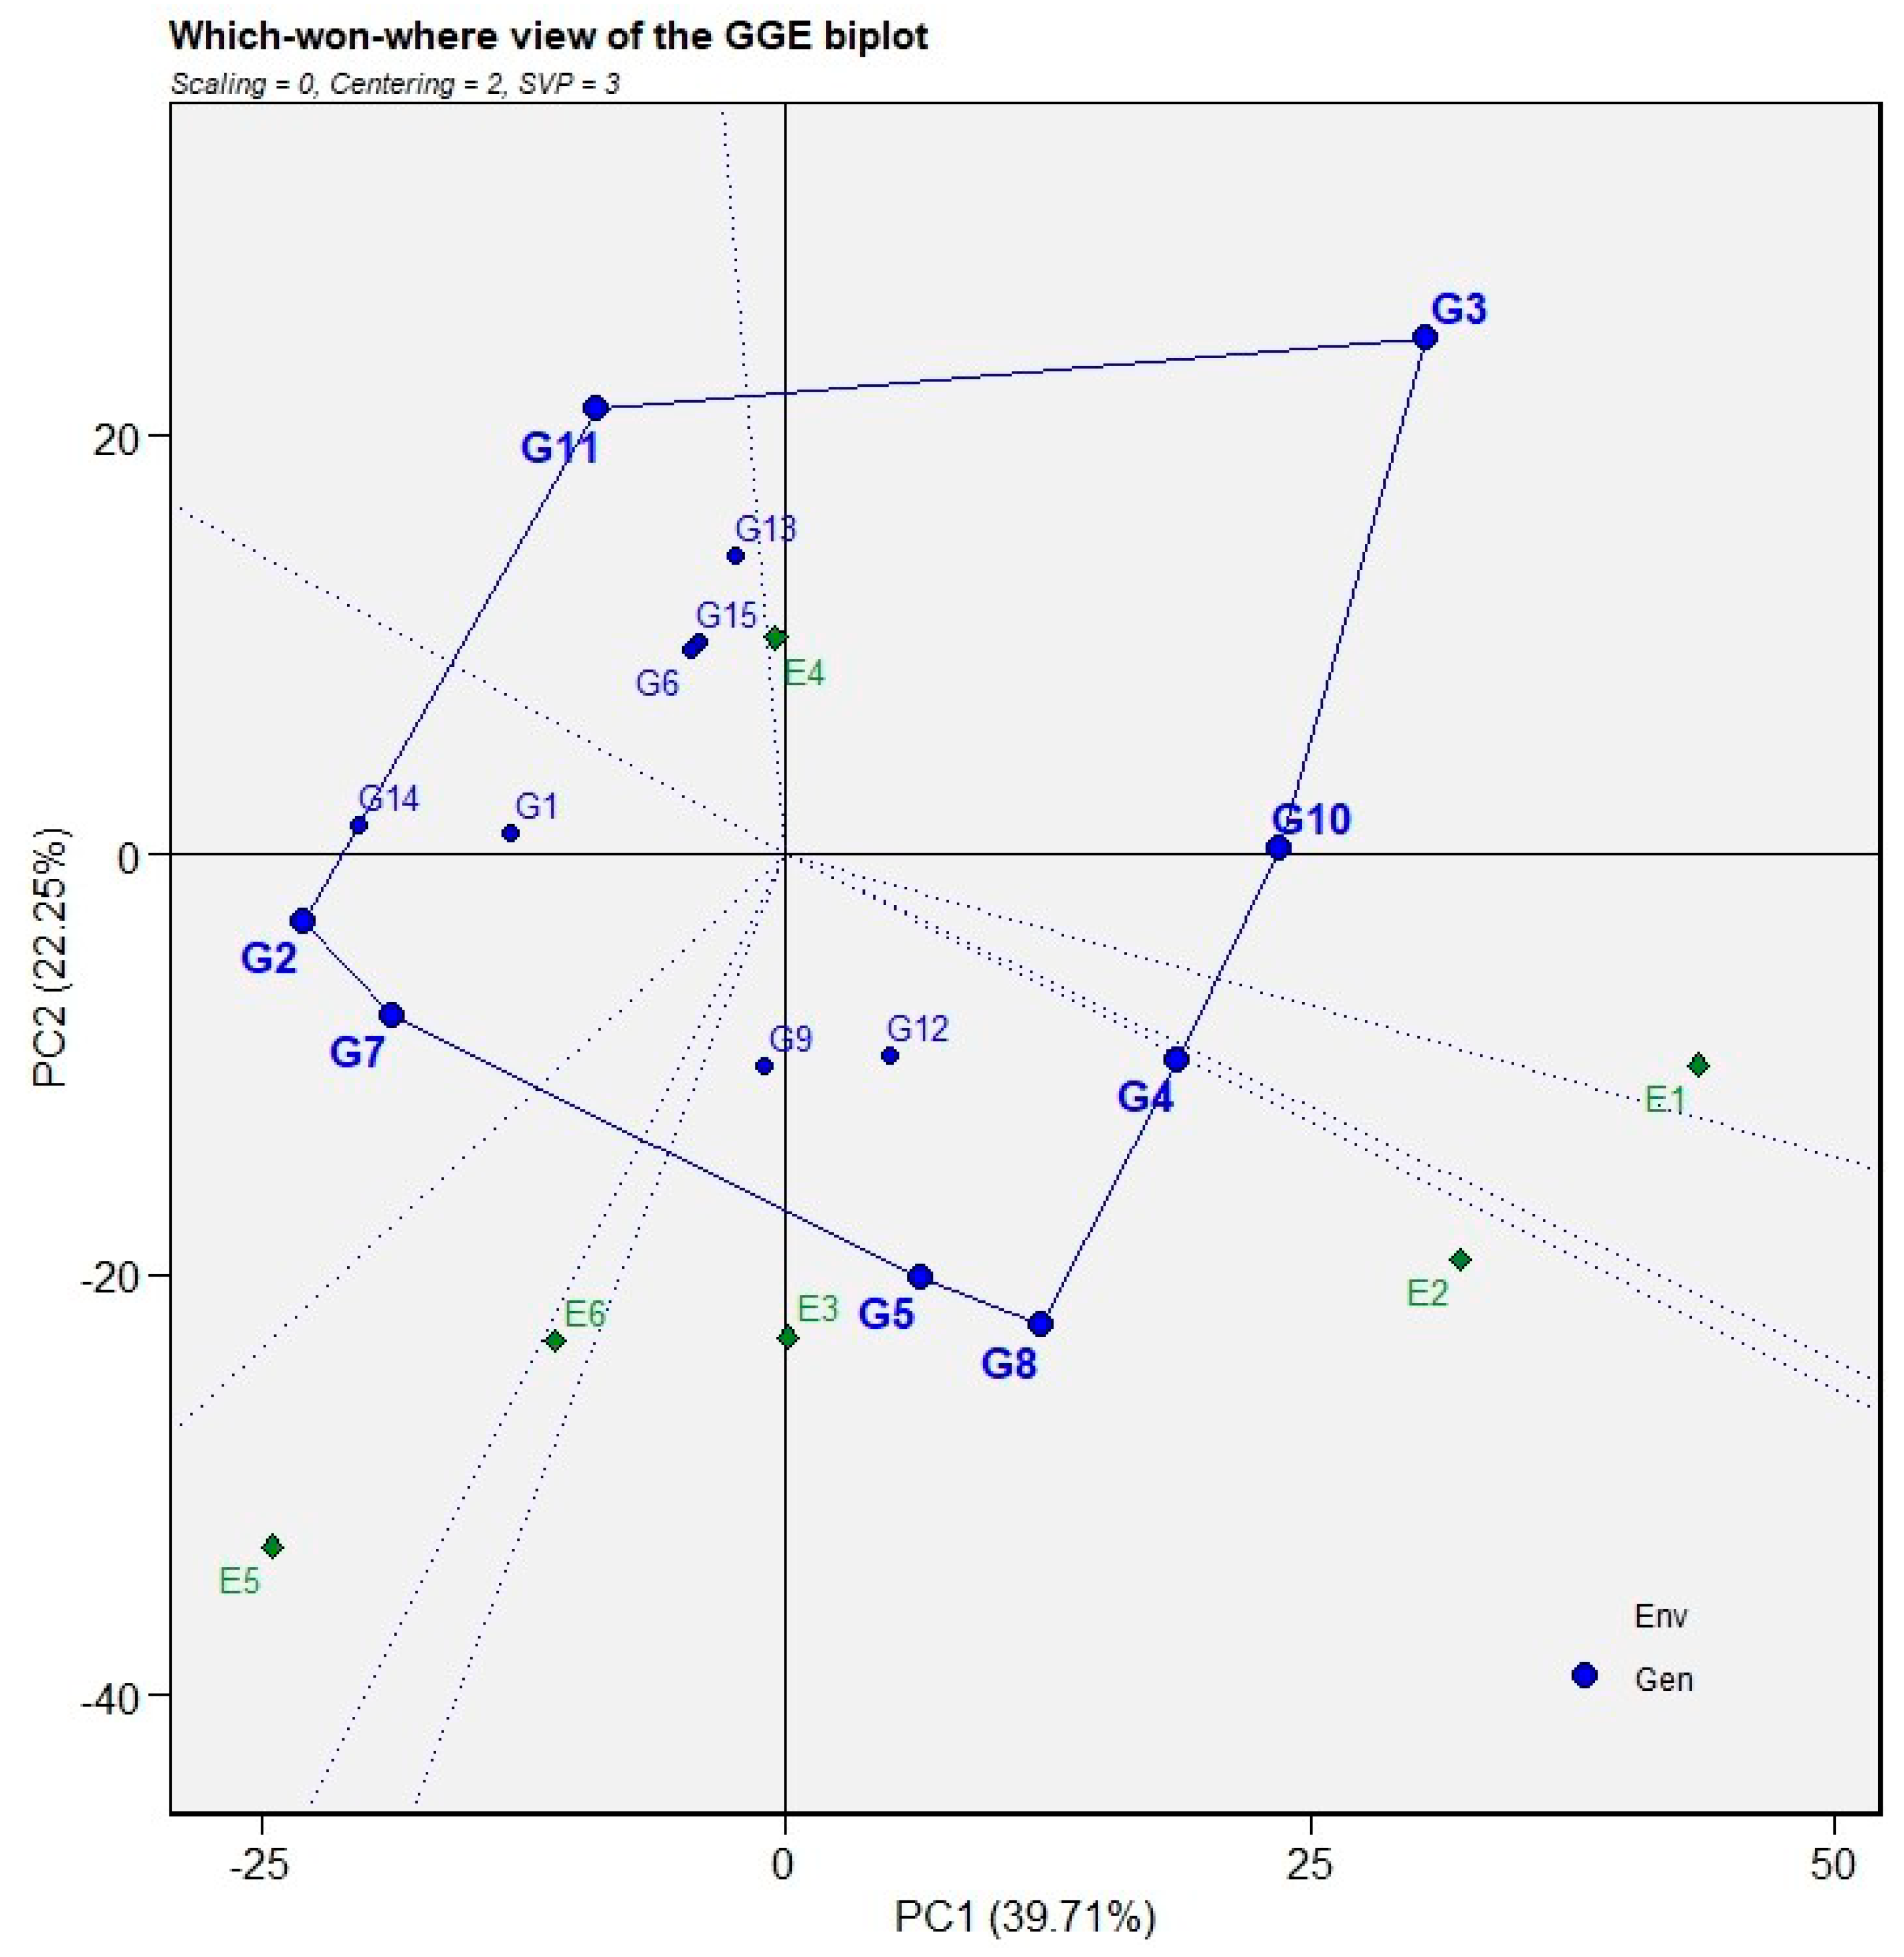
Figure 5.
Discriminating ability and representativeness of test environments for grain yield based on the GGE biplot analysis.
Figure 5.
Discriminating ability and representativeness of test environments for grain yield based on the GGE biplot analysis.
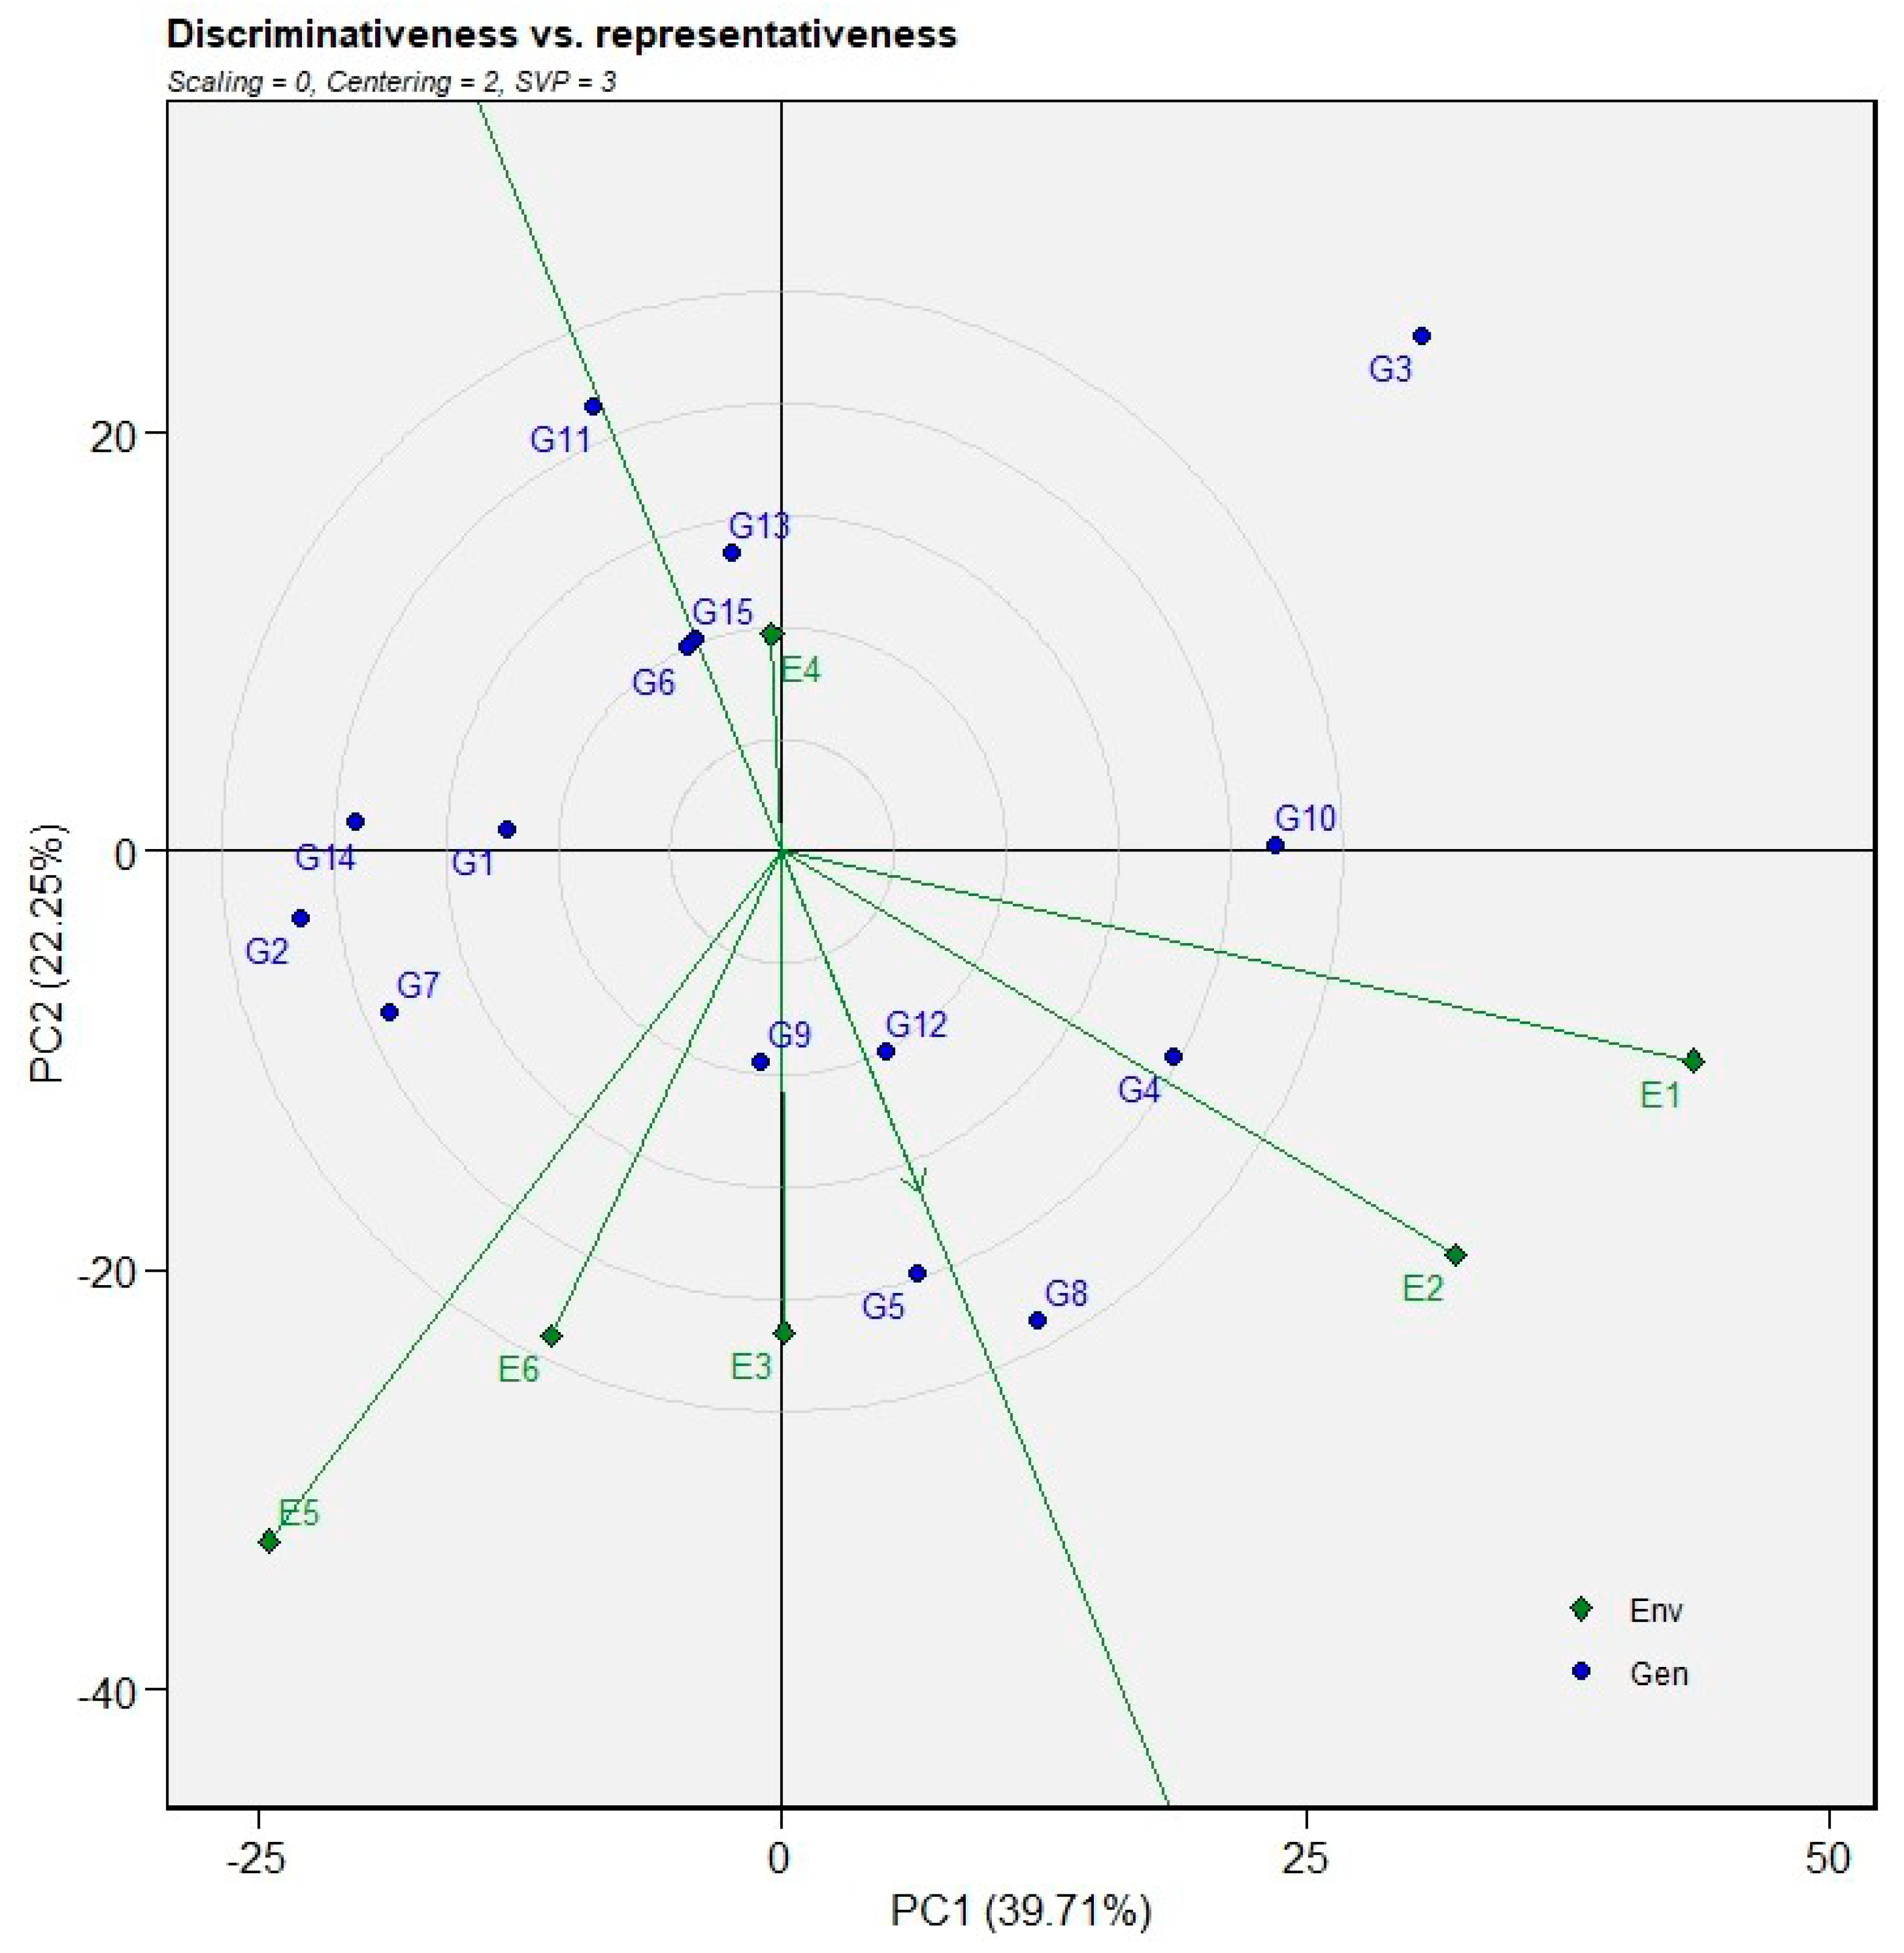
Figure 6.
GGE biplot view of the ranking of environments for the 15 wheat genotypes evaluated across two seasons for grain yield.
Figure 6.
GGE biplot view of the ranking of environments for the 15 wheat genotypes evaluated across two seasons for grain yield.
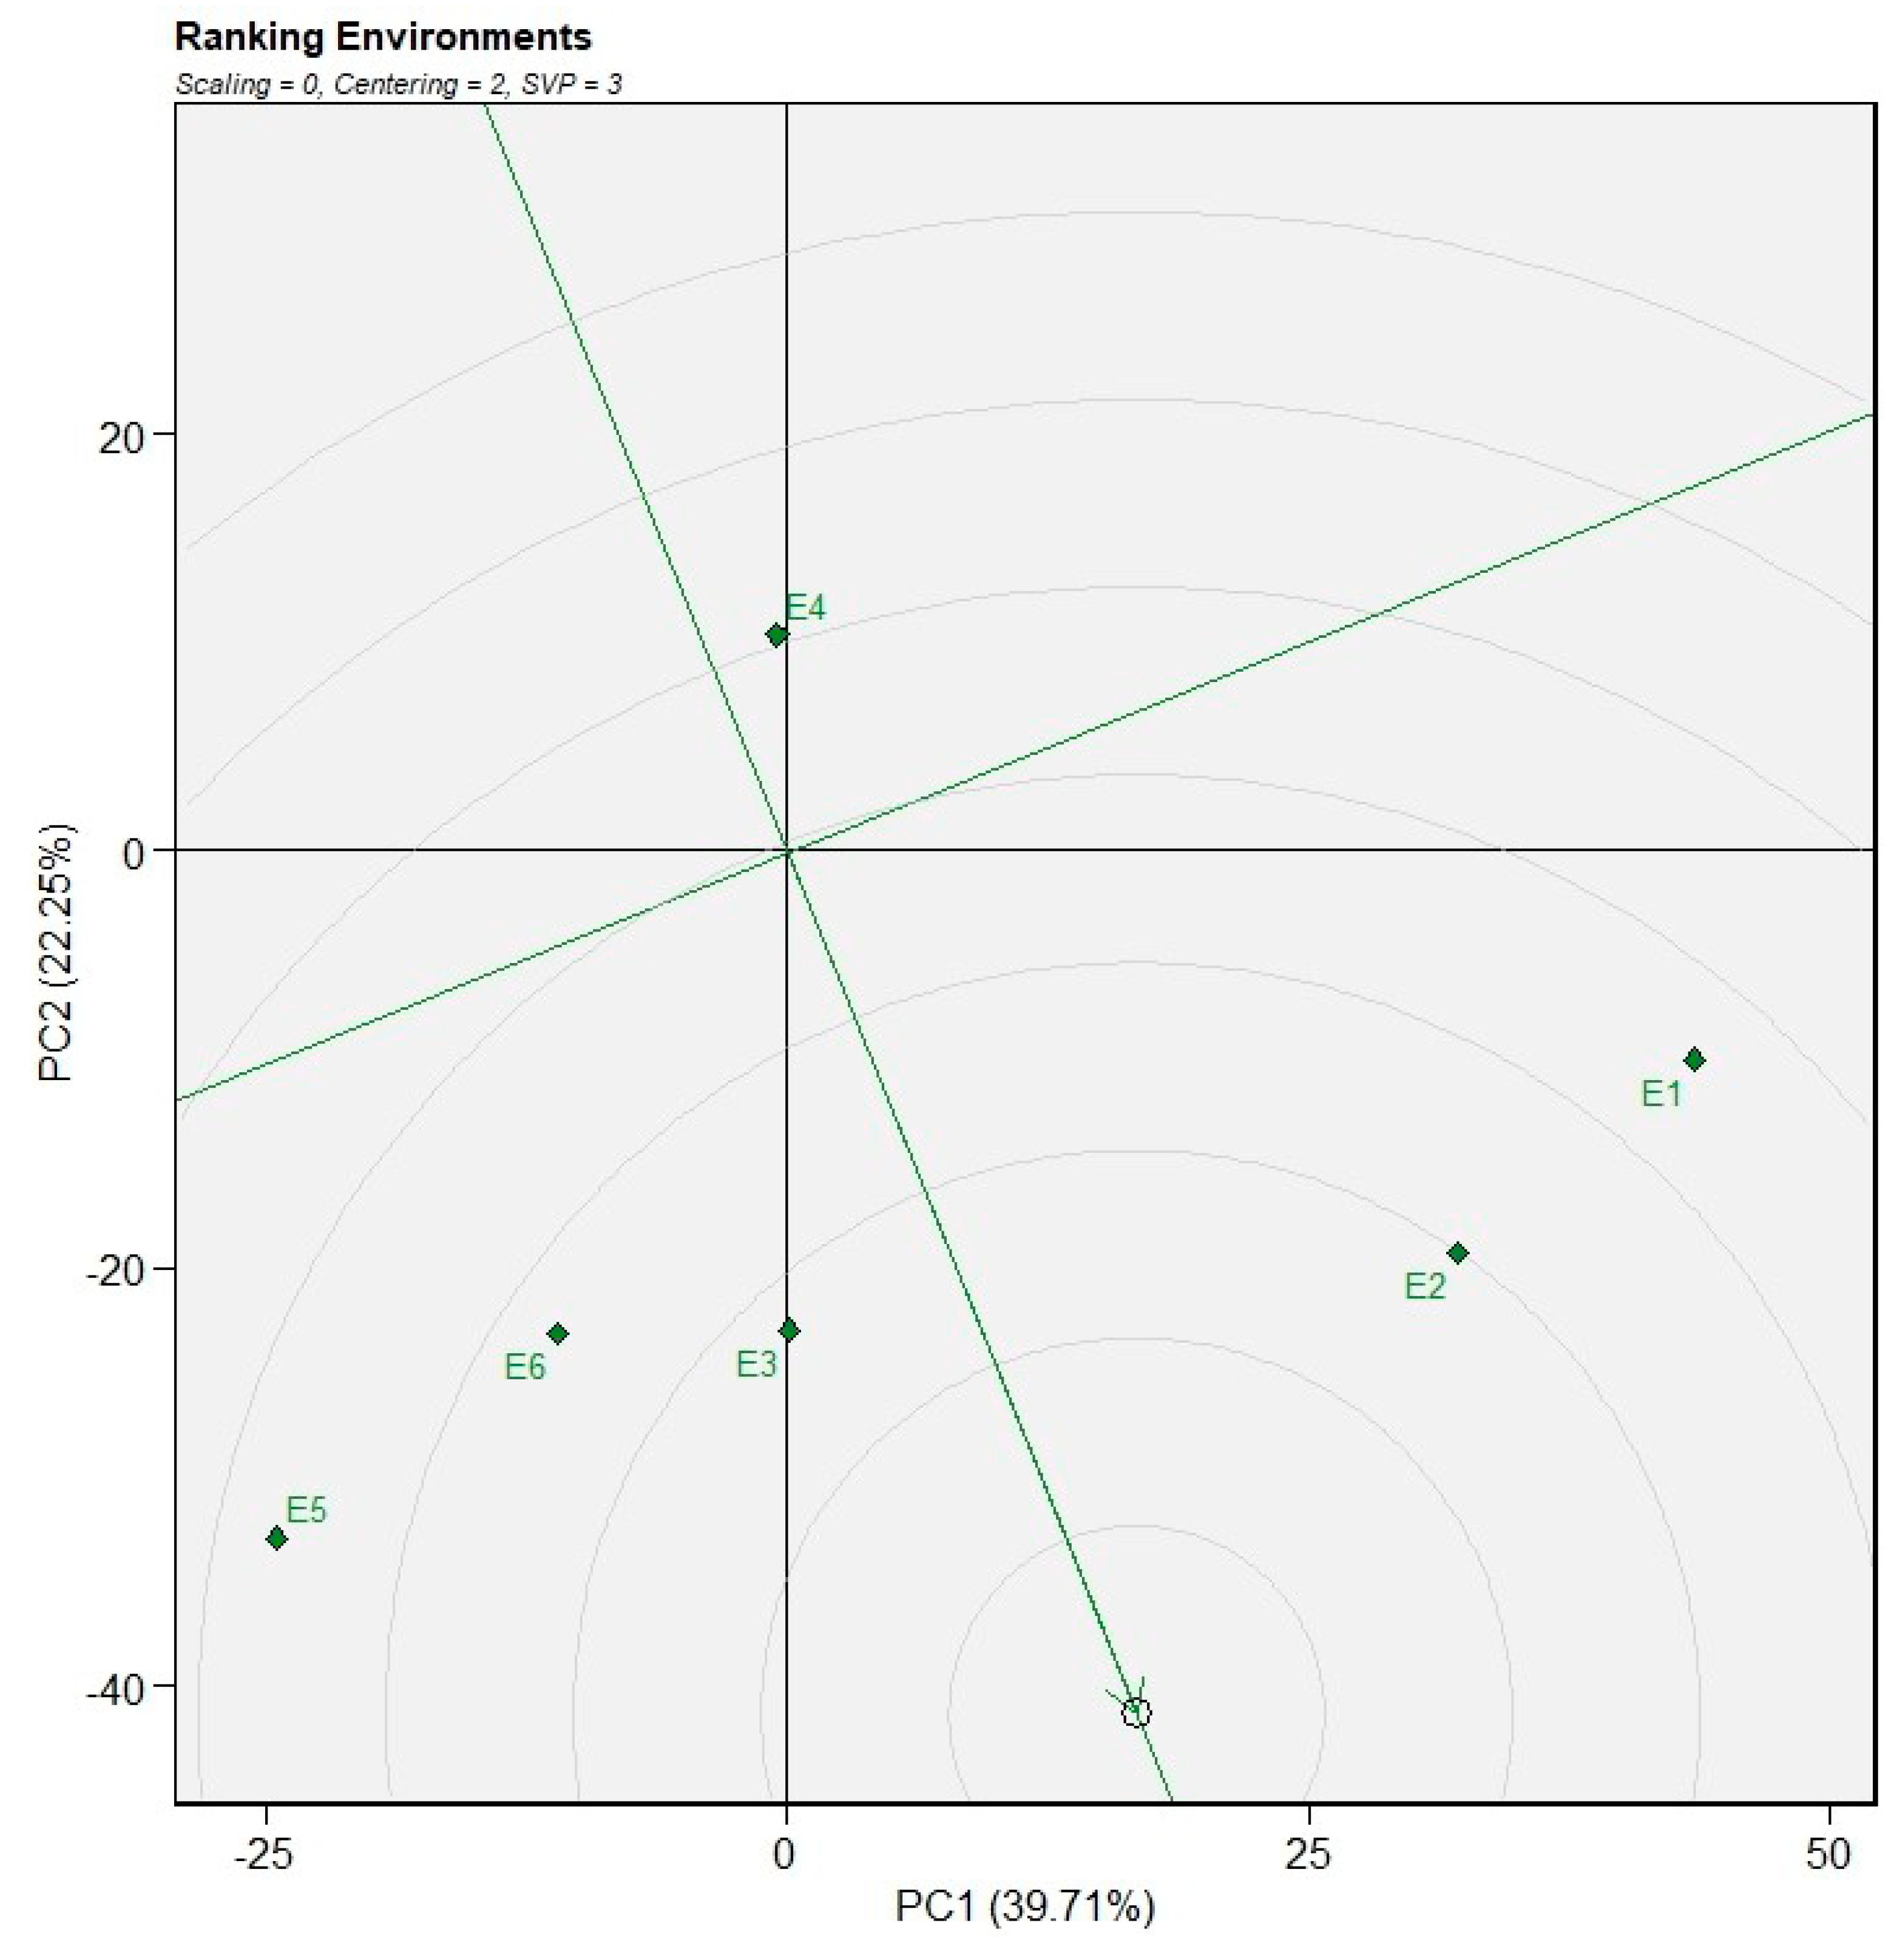
Figure 7.
Ranking of bread wheat genotypes for grain yield relative to an ideal genotype based on the GGE biplot.
Figure 7.
Ranking of bread wheat genotypes for grain yield relative to an ideal genotype based on the GGE biplot.
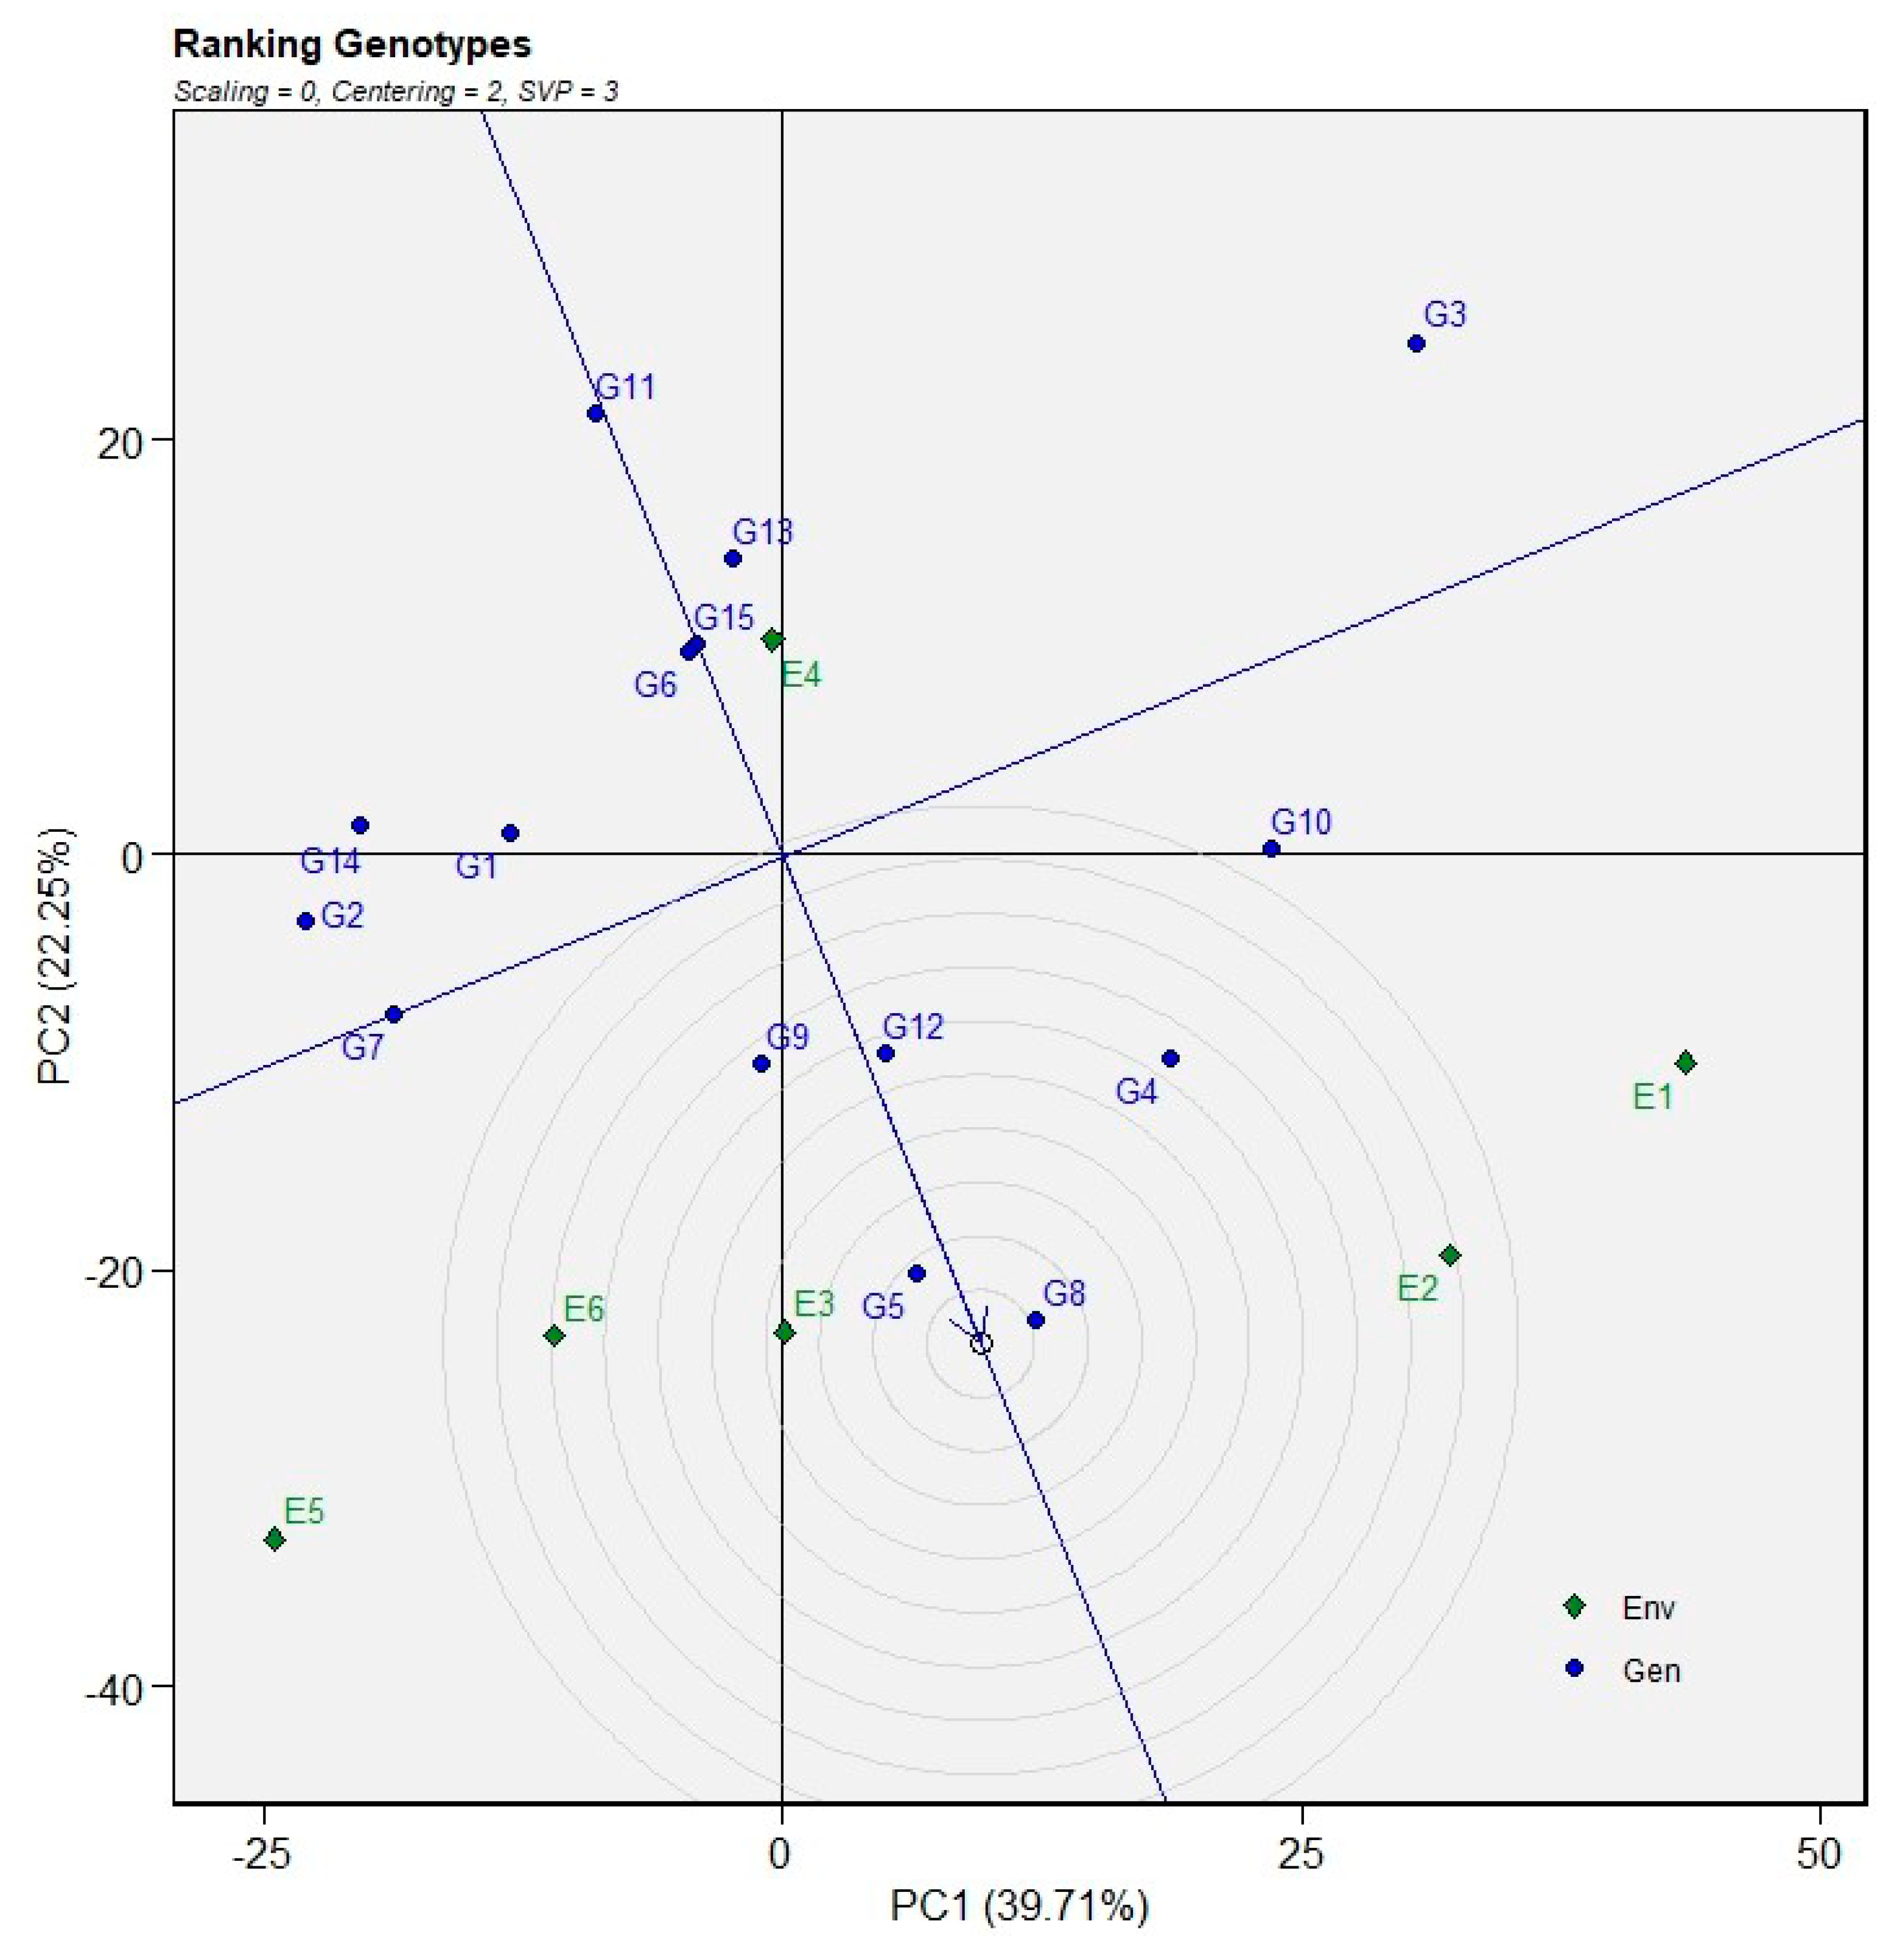
Figure 8.
Relationships among test environments for grain yield based on the vector view of the GGE biplot.
Figure 8.
Relationships among test environments for grain yield based on the vector view of the GGE biplot.
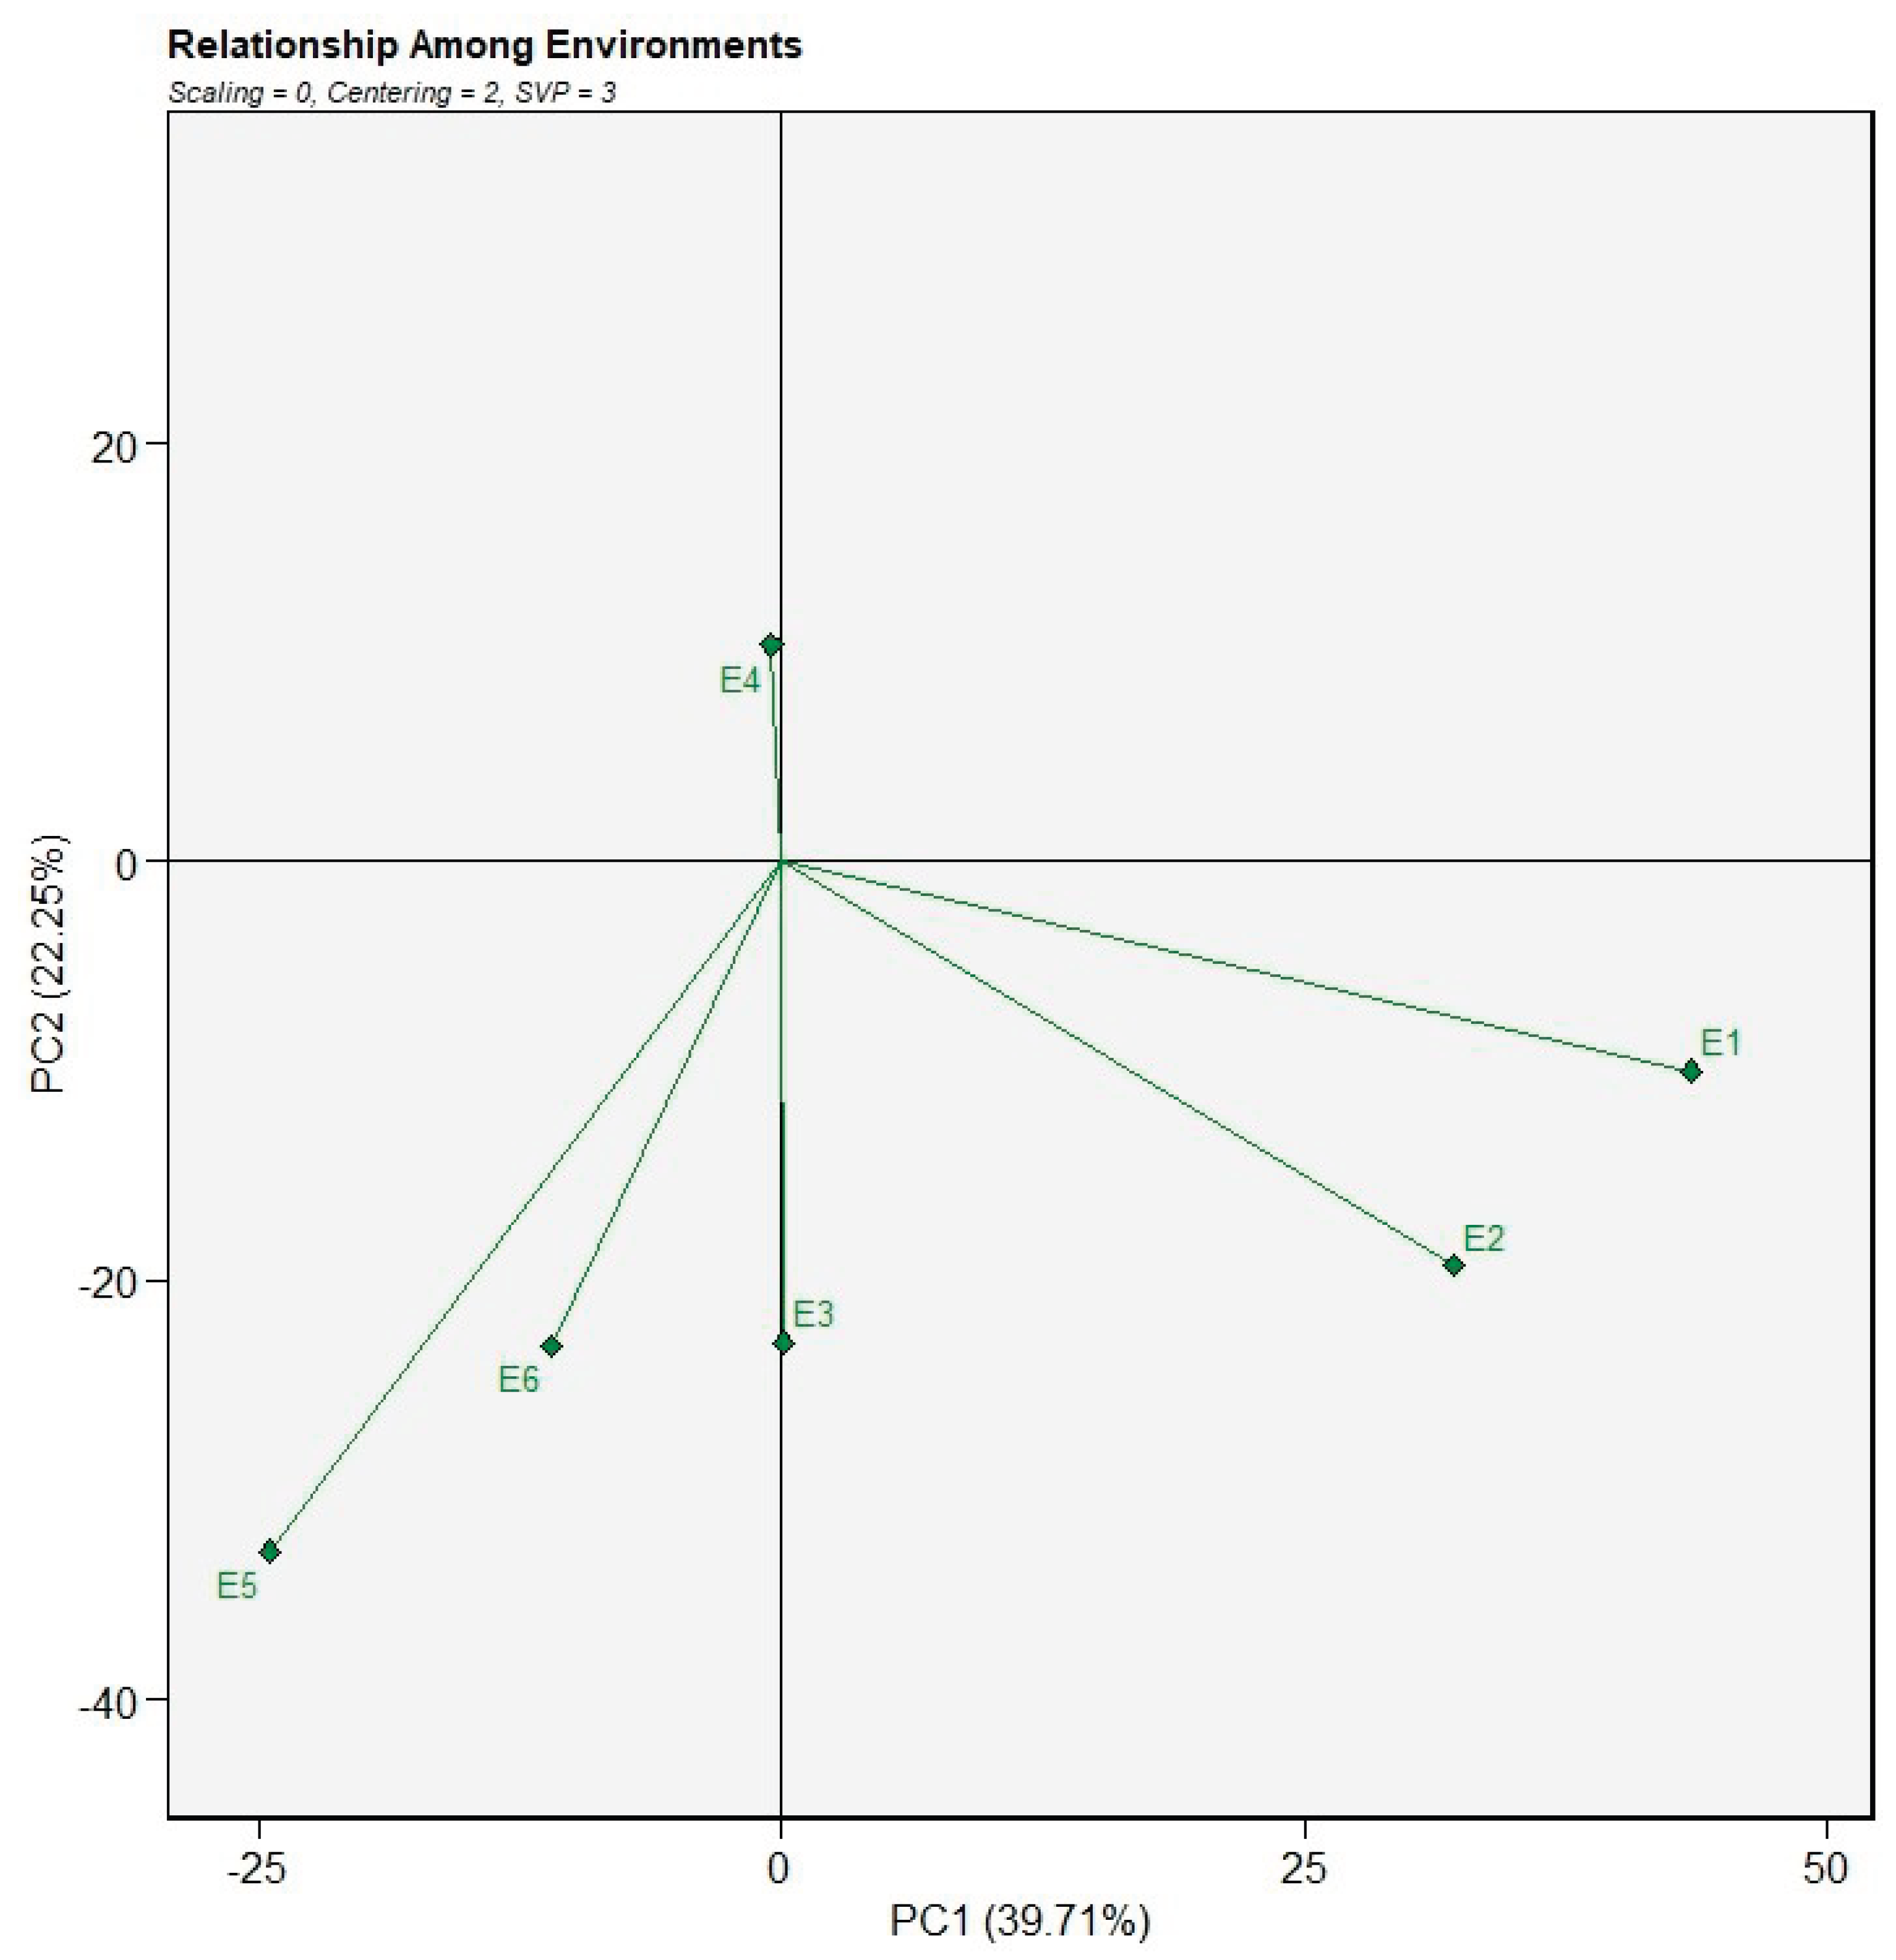
Table 1.
Passport information of trial sites used for the Winter Wheat Advanced Variety Trials in the 2020 and 2021 growing seasons.
Table 1.
Passport information of trial sites used for the Winter Wheat Advanced Variety Trials in the 2020 and 2021 growing seasons.
| Site | Region | Altitude | Geographical position | Reasons for choosing site |
|---|---|---|---|---|
| Harare Research Station | 2a | 1506m | 17.82160S,31.04920E | High potential area, seed bulking site |
| Gwebi Variety Testing Centre | 2a | 1448m | 17° 49' 00" S, 30° 34' 00" E | High potential area, seed bulking site, generation advancement during summer because of cool conditions |
| PANMURE Research Station | 2b | 925m | “17o.16’S.37.06E”, “31o36’S,31.86”E | Middle potential area, Hot spot for disease |
Table 2.
Lists of the genotypes used in the multi-environmental trials in season 1 (2020).
| Genotype Number | Genotype Name | Genotype Source |
|---|---|---|
| G1 | S09016-5H-OG-1C-OG | 2018 Winter WAVT Seed Bulk |
| G2 | 126-M7HPYT-H18 | 2018 Seed Bulk-Zinc Lines |
| G3 | 1259-47 IBWSN-G14 | 2018 Winter WAVT Seed Bulk |
| G4 | Ncema (check) | 2018 Seed Bulk/Breeder`s Seed |
| G5 | SHA7/KAUZ | 2018 Winter WAVT Seed Bulk |
| G6 | 338-23SAWYT-H16 | 2018 Winter WAVT Seed Bulk |
| G7 | 9104-35ESWYT-H15 | 2018 Winter WAVT Seed Bulk |
| G8 | 112-36ESWYT-H16 | 2018 Winter WAVT Seed Bulk |
| G9 | 45-1SATYT-G15 | 2018 Winter WAVT Seed Bulk |
| G10 | Kame (check) | 2018 Winter WAVT Seed Bulk/ Breeder`s Seed |
| G11 | Soonot-7 | 2018 Winter WAVT/Seed Bulk |
| G12 | 1233-47IBWSN-G14 | 2018 Winter WAVT/Seed Bulk |
| G13 | S06079-2H-0G-4H-0G | 2018 Winter WAVT/Seed Bulk |
| G14 | Gonglase-4 | 2018 Winter WAVT/Seed Bulk |
| G15 | 159-M7HPYT-H18 | 2018 Seed Bulk-Zinc Lines |
| G16 | 125-36ESWYT-H16 | 2018 Winter WAVT Seed Bulk |
| G17 | SC Nduna (Check) | 2018 Winter WAVT Seed Bulk |
| G18 | 3224-34SAWSN-G16 | 2018 Winter WAVT Seed Bulk |
| G19 | 15-2SWBON-14 | 2018 Winter WAVT Seed Bulk |
| G20 | 132-M7HPYT-H18 | 2018 Seed Bulk-Zinc Lines |
| G21 | S14002-0H-0N-0H-G(Kana/Smart) | 2018 Winter WAVT seed bulk |
| G22 | AGUILAL/FLAG-3(2KUL) | 2018 Winter WAVT seed bulk |
| G23 | Select(Check) | 2018 Winter WAVT Seed bulk |
| G24 | 145-36ESWYT-H16 | 2018 Winter WIVT seed bulk |
| G25 | Runde | 2018 WAVT Seed bulk/Breeder's seed |
WAVT: Wheat advanced variety trial.
Table 3.
Lists of the genotypes used in the multi-environmental trials in season 2 (2021).
| Genotype Number | Genotype Name | Genotype Source |
|---|---|---|
| G1 | AGUILAL/FLAG-3(2KUL) | 2018 Winter WAVT Seed Bulk |
| G2 | 15-2SWBON-14 | 2018 Seed Bulk-Zinc Lines |
| G3 | 1259-47 IBWSN-G14 | 2018 Winter WIVT Seed Bulk |
| G4 | SHA7/KAUZ | 2018 Seed Bulk/Breeder`s Seed |
| G5 | S14002-0H-0N-0H-0G | 2018 Winter WAVT Seed Bulk |
| G6 | SC Nduna (Check) | 2018 Winter WIVT Seed Bulk |
| G7 | Select(Check) | 2018 Winter WAVT Seed Bulk |
| G8 | 3266-35-SAWSN-H17 | 2018 Winter WIVT Seed Bulk |
| G9 | 45-1SATYT-G15 | 2018 Winter WIVT Seed Bulk |
| G10 | 3260-35SA-H17 | 2018 Winter WAVT Seed Bulk/ Breeder`s Seed |
| G11 | 126-M7HPYT-H18 | 2018 Winter WAVT/Seed Bulk |
| G12 | 131-M7HPVT | 2018 Winter WAVT/Seed Bulk |
| G13 | Kame (check) | 2018 Winter WAVT/Seed Bulk |
| G14 | Gonglase-4 | 2018 Winter WAVT/Seed Bulk |
| G15 | Ncema (check) | 2018 Seed Bulk-Zinc Lines |
| G16 | 112-36ESWYT-H16 | 2018 Winter WIVT Seed Bulk |
| G17 | 1185-50IBW-G17 | 2018 Winter WAVT Seed Bulk |
| G18 | S09016-5H-OG-1C-OG | 2018 Winter WIVT Seed Bulk |
| G19 | 3261-35SA-H17 | 2018 Winter WAVT Seed Bulk |
| G20 | 338-23SAWYT-H16 | 2018 Seed Bulk-Zinc Lines |
| G21 | S14013-OH-ON-OH-OG | 2018 Winter WAVT Seed Bulk |
| G22 | 9401-7SATY-H18 | 2018 Winter WIVT Seed Bulk |
| G23 | 344-25SAWYT-H18 | 2018 Winter WAVT Seed Bulk |
| G24 | F6 | 2018 Winter WIVT Seed Bulk |
WAVT: Wheat advanced variety trial.
Table 4.
List of the 15 common genotypes used for stability analysis in the experiment.
| Genotype Number | Genotype name | Source |
|---|---|---|
| G1 | S09016-5H-OG-1C-OG | 2018 Winter WAVT Seed Bulk |
| G2 | AGUILAL/FLAG-3(2KUL) | 2018 Winter WAVT Seed Bulk |
| G3 | 126-M7HPYT-H18 | 2018 Seed Bulk-Zinc Lines |
| G4 | 15-2SWBON-14 | 2018 Seed Bulk-Zinc Lines |
| G5 | 1259-47 IBWSN-G14 | 2018 Winter WAVT Seed Bulk |
| G6 | Ncema (check) | 2018 Winter WAVT Seed Bulk |
| G7 | SHA7/KAUZ | 2018 Winter WAVT Seed Bulk |
| G8 | S14002-0H-0N-0H-0G | 2018 Winter WAVT Seed Bulk |
| G9 | 338-23SAWYT-H16 | 338-23SAWYT-H16 |
| G10 | SC Nduna (Check) | 2018 Winter WAVT Seed Bulk |
| G11 | Select(Check) | 2018 Winter WAVT Seed Bulk |
| G12 | 112-36ESWYT-H16 | 2018 Winter WAVT Seed Bulk |
| G13 | 45-1SATYT-G15 | 2018 Winter WAVT Seed Bulk |
| G14 | Kame (check) | 2018 Winter WAVT Seed Bulk/ Breeder`s Seed |
| G15 | Gonglase-4 | 2018 Winter WAVT/Seed Bulk |
WAVT: Wheat advanced variety trial.
Table 6.
Mean performance for grain yield and other agronomic traits of the 25 bread wheat genotypes evaluated in three different environments in Zimbabwe during the 2020 winter season.
Table 6.
Mean performance for grain yield and other agronomic traits of the 25 bread wheat genotypes evaluated in three different environments in Zimbabwe during the 2020 winter season.
| Genotypes | ANTH | DMA | PLH | MOIST | GW | YIELD | TD |
|---|---|---|---|---|---|---|---|
| G1 | 82.67bcd | 134.56abcde | 93.44ab | 10.93abcd | 2.77ab | 5.90ab | 394.67a |
| G2 | 81.00bcde | 134.22abcdef | 97.44ab | 10.62def | 2.77ab | 5.91ab | 377.80ab |
| G3 | 80.56bcde | 132.44defg | 99.67ab | 10.39g | 3.06ab | 6.55ab | 391.06a |
| G4 | 84.00b | 136.11ab | 81.67c | 10.93abcd | 2.49ab | 5.31ab | 357.11b |
| G5 | 79.00de | 131.78efg | 97.44ab | 10.87abcde | 2.94ab | 6.24ab | 389.11a |
| G6 | 78.56e | 131.00g | 91.22bc | 10.67cdef | 3.00ab | 6.39ab | 383.94ab |
| G7 | 83.11bc | 136.67a | 93.78ab | 10.69bcdef | 3.19ab | 6.79ab | 391.00a |
| G8 | 80.33bcde | 132.56defg | 98.67ab | 10.53ef | 2.93ab | 6.26ab | 389.89a |
| G9 | 81.22bcde | 135.33abcd | 99.00ab | 11.03a | 2.63ab | 5.59ab | 374.78ab |
| G10 | 82.67bcd | 134.22abcdef | 82.89c | 11.00abc | 2.82ab | 5.99ab | 377.17ab |
| G11 | 81.78bcde | 131.56fg | 99.11ab | 10.73abcde | 2.69ab | 5.73ab | 394.61a |
| G12 | 83.00bc | 134.56abcde | 101.00ab | 10.84abcde | 3.34a | 7.09a | 392.25a |
| G13 | 80.56bcde | 135.00abcd | 98.00ab | 10.90abcd | 2.94ab | 6.25ab | 377.72ab |
| G14 | 80.11cde | 133.67bcdefg | 97.22ab | 10.76abcde | 2.65ab | 5.64ab | 376.39ab |
| G15 | 88.33a | 136.56ab | 101.89a | 10.72abcdef | 2.97ab | 6.34ab | 384.67ab |
| G16 | 80.67bcde | 133.00cdefg | 101.56a | 10.91abcd | 2.87ab | 6.10ab | 369.11ab |
| G17 | 79.67cde | 134.56abcde | 96.78ab | 10.79abcde | 2.85ab | 6.07ab | 382.28ab |
| G18 | 81.33bcde | 134.22abcdef | 94.00ab | 10.62def | 2.71ab | 5.77ab | 391.56a |
| G19 | 82.33bcd | 135.78abc | 99.89ab | 10.99abc | 3.10ab | 6.60ab | 370.29ab |
| G20 | 80.22cde | 131.33fg | 97.44ab | 10.78abcde | 2.14b | 4.56b | 389.44a |
| G21 | 84.00b | 136.11ab | 100.56ab | 10.80abcde | 3.02ab | 6.43ab | 389.50a |
| G22 | 82.00bcde | 135.00abcd | 94.11ab | 11.01ab | 2.86ab | 6.08ab | 392.56a |
| G23 | 80.56bcde | 133.78abcdefg | 97.11ab | 10.69bcdef | 2.63ab | 5.61ab | 359.11b |
| G24 | 81.22bcde | 134.56abcde | 100.89ab | 10.68bcdef | 2.77ab | 5.91ab | 390.28a |
| G25 | 80.33bcde | 133.78abcefg | 82.00c | 10.80abcde | 2.21b | 4.71ab | 383.06ab |
ANTH: anthesis date, PLH: plant height, DMA: days to maturity, MOIST: grain moisture content, GW: grain weight, TD: test density, LSD: least significant difference, CV: coefficient of variation, GM: grand mean.
Table 8.
Mean performance for grain yield and the other agronomic traits of the 24 bread wheat genotypes evaluated at 3 locations during the 2021 winter wheat season in Zimbabwe.
Table 8.
Mean performance for grain yield and the other agronomic traits of the 24 bread wheat genotypes evaluated at 3 locations during the 2021 winter wheat season in Zimbabwe.
| Genotypes | ANTH | DMA | PLH | MOIST | GW | YIELD | TD |
|---|---|---|---|---|---|---|---|
| G1 | 86.44ab | 123.78bc | 94.22b | 10.49a | 2.78ab | 4.75ab | 400.02bcde |
| G2 | 83.67abc | 124.11abc | 97.78ab | 10.39 a | 2.89ab | 4.94ab | 398.27bcde |
| G3 | 84.22abc | 127.33ab | 102.33ab | 10.61a | 3.19a | 5.43a | 394.93de |
| G4 | 83.78abc | 125.44abc | 97.78ab | 10.93a | 2.65ab | 4.49ab | 406.47abcd |
| G5 | 85.78abc | 125.56abc | 98.67ab | 11.3a | 3.21a | 5.40ab | 400.38bcde |
| G6 | 83.56bc | 124.00abc | 98.67ab | 11.27a | 3.04ab | 5.11ab | 396.30de |
| G7 | 85.33abc | 124.78abc | 100.00ab | 10.57a | 2.69ab | 4.58ab | 402.23abcde |
| G8 | 84.33abc | 125.56abc | 102.11ab | 10.52a | 2.72ab | 4.64ab | 396.01de |
| G9 | 84.89abc | 125.22abc | 103.00ab | 10.82a | 3.13ab | 5.29ab | 409.67ab |
| G10 | 85.33abc | 127.00abc | 103.56ab | 10.49a | 2.48b | 4.23b | 405.31abcde |
| G11 | 84.33abc | 125.78abc | 101.33ab | 10.79a | 2.72ab | 4.61ab | 395.49de |
| G12 | 84.67abc | 124.00abc | 108.33a | 10.62a | 2.51ab | 4.28ab | 401.18bcde |
| G13 | 82.78c | 122.78c | 97.89ab | 11.21a | 2.89ab | 4.89ab | 399.73bcde |
| G14 | 84.33abc | 126.11abc | 101.56ab | 10.54a | 2.62ab | 4.45ab | 401.78bcde |
| G15 | 87.00a | 125.89abc | 94.22b | 10.89a | 3.09ab | 5.25ab | 402.80abcde |
| G16 | 83.56bc | 124.78abc | 98.78ab | 10.59a | 2.85ab | 4.86ab | 394.31e |
| G17 | 84.22abc | 128.11a | 102.67ab | 9.92a | 2.94ab | 5.03ab | 397.42cde |
| G18 | 85.44abc | 126.78abc | 97.33ab | 10.66a | 2.86ab | 4.85ab | 413.56a |
| G19 | 85.56abc | 125.33abc | 100.44ab | 10.96a | 2.66ab | 4.51ab | 408.72abc |
| G20 | 83.22bc | 122.78c | 98.11ab | 10.83a | 2.69ab | 4.56ab | 397.07de |
| G21 | 86.11abc | 126.67abc | 102.22ab | 10.80a | 2.87ab | 4.86ab | 401.11bcde |
| G22 | 87.00a | 126.89abc | 94.33b | 10.28a | 3.10ab | 5.28ab | 394.32e |
| G23 | 85.56abc | 125.44abc | 100.89ab | 10.62a | 2.87ab | 4.88ab | 404.46abcde |
| G24 | 84.67abc | 125.67abc | 104.56ab | 11.3a | 2.94ab | 4.95ab | 396.78de |
ANTH: anthesis date, PLH: plant height, DMA: days to maturity, MOI: grain moisture content, GW: grain weight, TD: test density, GYD: grain yield, LSD: least significant difference, CV: coefficient of variation.
Disclaimer/Publisher’s Note: The statements, opinions and data contained in all publications are solely those of the individual author(s) and contributor(s) and not of MDPI and/or the editor(s). MDPI and/or the editor(s) disclaim responsibility for any injury to people or property resulting from any ideas, methods, instructions or products referred to in the content. |
© 2026 by the authors. Licensee MDPI, Basel, Switzerland. This article is an open access article distributed under the terms and conditions of the Creative Commons Attribution (CC BY) license.
Copyright: This open access article is published under a Creative Commons CC BY 4.0 license, which permit the free download, distribution, and reuse, provided that the author and preprint are cited in any reuse.


