
Submitted:
06 January 2026
Posted:
07 January 2026
You are already at the latest version
Abstract
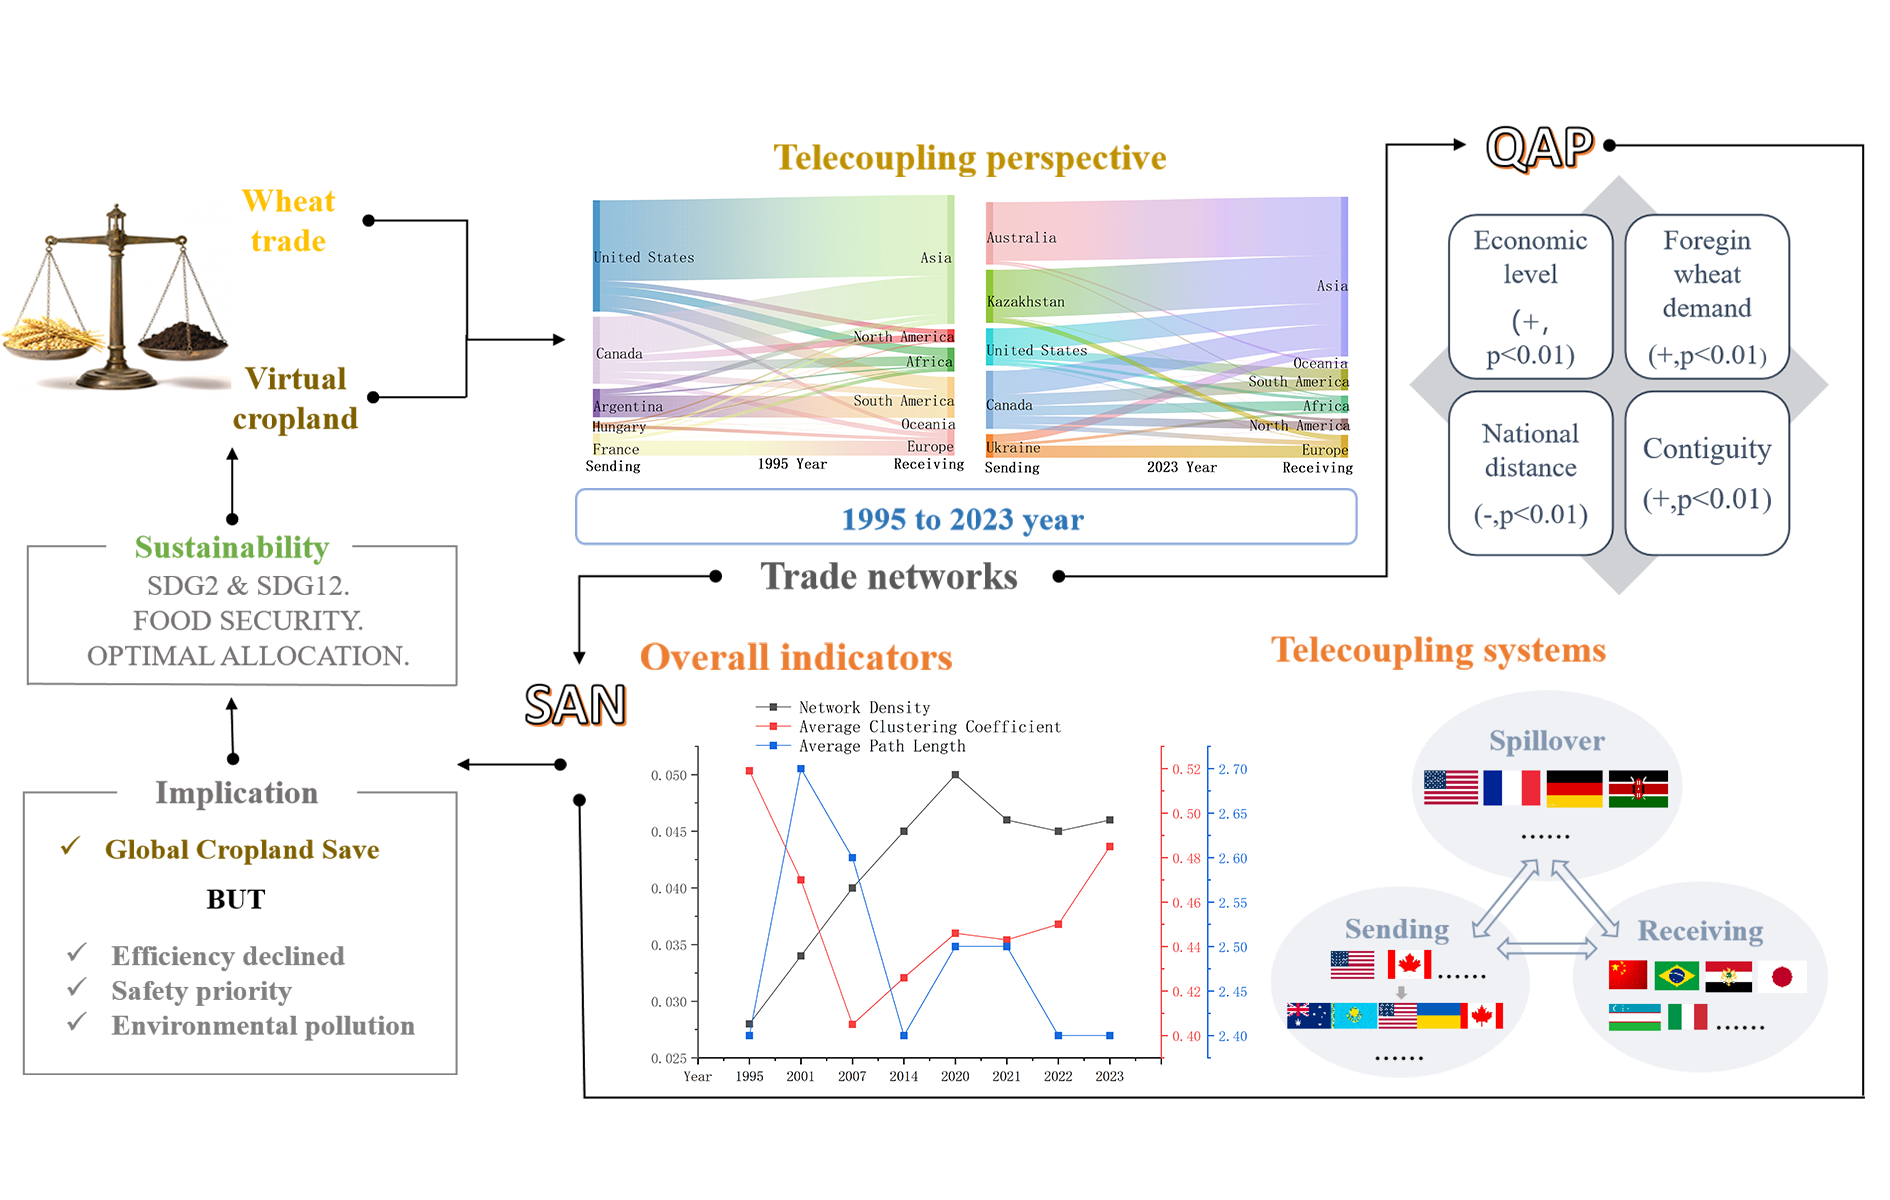
International agricultural trade plays a crucial role in balancing the global food supply and demand while facilitating the cross-regional allocation of cropland resources. This study examines the virtual cropland flows embedded in international wheat trade. Utilizing the telecoupling framework and wheat trade data from eight time points between 1995 and 2023, we developed a global virtual-cropland-flow network. Social network analysis (SNA) was used to characterize the structural features and identify telecoupling systems, whereas the quadratic assignment procedure (QAP) regression was applied to analyze the driving factors. The findings reveal that (1) the virtual cropland network shows structural vulnerability and evolutionary complexity amid increasing connectivity, with an overall rise in density and significant fluctuations in the average clustering coefficient and path length. (2) The network exhibits a distinct telecoupling structure. The sending system has shifted from U.S.-Canada dominance to a multipolar pattern involving Australia, Canada, Kazakhstan, and the United States. The receiving systems mainly comprise Asia, Africa, and Latin America, with China as the core inflow country. The United States and France, supported by major transnational agribusinesses, act as key spillover systems, consistently holding a high betweenness centrality. (3) Economic development and foreign demand significantly promote the establishment and intensification of trade relationships between countries. Geographical distance has a dual effect: it strongly negatively influences trade initiation but can be overcome by high complementarity between countries during trade deepening. (4) Although international wheat trade effectively conserves global cropland resources, it also introduces systemic risks and environmental spillovers in some countries. Developing nations that are highly dependent on wheat imports, such as Egypt, are more vulnerable to network fluctuations. By integrating multidisciplinary perspectives, this study provides a scientific basis for constructing sustainable food trade systems and agricultural resource governance. It offers valuable insights for advancing SDG 2 (Zero Hunger), SDG 12 (Responsible Consumption and Production), sustainable land systems, and the optimization of global land governance.
Keywords:
telecoupling
; social network analysis (SNA)
; virtual cropland
; QAP analysis
; driving factors
; sustainability
; cropland use efficiency
; trade-environment nexus
1. Introduction
Cultivated land use, a quintessential example of human-environment interaction, is a core focus of geographical research on human-land relationships [1]. These relationships persist under dynamically evolving productivity levels and social structures, with their scope and complexity expanding as society develops. Since the mid-20th century, deep-seated industrialization, urbanization, information, and globalization have markedly amplified human impacts on the Earth system, propelling the planet into an epoch dominated by human activity: the Anthropocene [2,3]. Amid accelerating global interconnectedness, the traditional localized paradigm—often encapsulated by the notion that “a particular environment shapes its inhabitants”—is increasingly inadequate to comprehensively explain the growing complexities of human-environment interactions emerging from globalization. In recent years, concepts and analytical approaches such as virtual water, embodied carbon emissions, and telecoupling in human-environment systems have provided robust support for investigating networked human-environment relationships [4]. Among these, the Telecoupling framework, proposed by Liu et al. [5], offers a valuable perspective for examining socioeconomic and environmental interactions between coupled human-natural systems across distances. This theoretical framework comprises five interconnected components: coupled human-natural systems (including sending, receiving, and spillover systems), flows, agents, causes, and effects. Oriented toward the value of global sustainability, it incorporates distant elements as systemic feedback and emphasizes long-distance socioeconomic and environmental interactions among multiple localities [6]. Leveraging its strengths in integrating multiple spatiotemporal scales and facilitating cross-sectoral systems analysis, the telecoupling framework has rapidly emerged as a cutting-edge research frontier in the field of sustainability science. Scholars are not only focusing on theoretical refinements, including literature reviews [7], framework standardization [8], and conceptual discussions [9], but are also actively extending the framework’s application to empirical research domains. Within this empirical expansion, agricultural trade has become a particularly prominent area for applying the telecoupling framework [10,11,12].
As one of the three major staple crops worldwide, wheat plays a critical role in the increasingly integrated international agricultural trade, although its production remains highly dependent on geographically fixed arable land resources [13]. Constrained by the immobility of croplands and region-specific consumer preferences, international wheat trade serves as a crucial mechanism for addressing geographical imbalances in wheat supply and demand and facilitating the cross-regional allocation of cropland resources [14,15]. Scholars worldwide have conducted extensive research on wheat trading activities. International studies have primarily focused on the dynamic evolution and shock responses of global wheat trade networks [16], vulnerability assessments of wheat producers [17], and the impact of differential extreme weather stresses on trade networks [18]. In contrast, domestic research in China has largely emphasized qualitative analyses of the evolution of wheat trade patterns [19] and corresponding policy recommendations [20] from a food-security perspective. As research deepens, quantitative approaches such as network analysis [21], the gravity model of trade [22], and Quadratic Assignment Procedure (QAP) modeling [23] are increasingly employed to examine the structure and determinants of wheat trade. However, current studies remain predominantly centered on the wheat trade network itself, with insufficient attention paid to the cross-regional flows and reconfiguration patterns of cropland resources embedded in trade and their linkages with land systems.
International wheat trade essentially embodies the physical manifestation of cropland resource flows, representing a form of telecoupling cross-regional coupled human-natural systems [24]. The implied "virtual cropland" has become a primary tool for quantifying cross-regional flows of cropland resources. The flows of virtual croplands not only reflect the global matching of cropland supply and demand but are also intrinsically linked to core issues in land system science, such as land cover change, the differentiation of land productivity, and land degradation risks. In terms of research scale and focus, existing studies have primarily concentrated on the Chinese context, covering the spatial patterns [25] and drivers [26,27] of virtual cropland flows and the relationship between virtual cropland trade and national food security [28]. At the global scale, while studies have examined the characteristics of virtual cropland flows associated with agricultural products such as soybeans [29] and grains [30], as well as the land-saving effects of global grain trade [31], and some scholars have utilized network analysis to reveal the connectivity features of virtual cropland flows within global agricultural trade [32], research specifically targeting wheat—a core staple crop—remains lacking. No study has systematically analyzed the structural characteristics and influencing factors of the virtual cropland resource network embedded within international wheat trade from a global perspective. Moreover, global croplands are projected to face large-scale and uneven loss pressures under current climate mitigation measures [33]. Therefore, key questions deserve further in-depth investigation: What are the flow patterns and network characteristics of the cropland resources implicitly transferred through global wheat trade? What are the main factors influencing the reallocation of cropland resources? How is it telecoupled with land system sustainability?.
Building on this foundation, this study applied the telecoupling framework to examine international wheat trade. We employed social network analysis (SNA) to quantitatively characterize the spatiotemporal evolution of virtual cropland flows embedded in the trade network. Furthermore, QAP regression was used to identify the key influencing factors. This study offers a novel perspective for understanding the teleconnections and ecological effects of globalization on land systems. Furthermore, it provides a scientific basis and decision-making support for enriching the empirical applications of the telecoupling concept, optimizing global cropland allocation, building sustainable food trade systems, and contributing to the achievement of the United Nations Sustainable Development Goals (SDGs).
2. Data Sources and Methods
2.1. Data on Wheat Trade and the Calculation of Virtual Cropland
This study used wheat export volumes as a proxy for trade volumes. Data on wheat exports (measured in metric tons) and yields (measured in metric tons per hectare) were obtained from the Food and Agriculture Organization Statistical Database (FAOSTAT). The wheat trade volumes for China's regions of Hong Kong, Macao, and Taiwan were integrated into the data for China, whereas data for overseas territories lacking independent sovereign governments were combined with their respective administering countries. Considering factors such as event-driven changes, technological innovations, and policy adjustments, we selected eight time points: 1995, 2001, 2007, 2014, and 2020-2023. Missing values for specific years were addressed using interpolation with data from adjacent years. Countries with significant long-term gaps in wheat yield data were excluded from the study. Finally, the wheat trade volumes were converted into virtual cropland equivalents.
Virtual croplands refer to the embedded resource consumption within physical products [34]. Currently, there are two primary methods for calculating the trade volume of virtual croplands. The first method, from the producer’s perspective, defines virtual croplands as the actual amount of cropland resources used to produce a given product in its origin region, thereby reflecting the real land resources embodied in agricultural trade. The second method, from the consumer perspective, defines it as the amount of cropland resources required to produce an equivalent product in the consuming region [35]. Accordingly, based on international wheat trade volumes and wheat yield data, this study calculated the virtual cropland volume from the exporter perspective, the virtual cropland volume from the importer perspective, and net virtual cropland transfer. The following formulas were used:
where denotes the virtual cropland volume from the exporter perspective in year t. denotes the virtual cropland volume from the importer perspective in year t. represents the volume of wheat trade between trading countries a and b in year t. denotes the wheat yield of the exporting country between trading countries a and b in year t. denotes the wheat yield of the importing country between trading countries a and b in year t. represents the virtual cropland difference between trading countries a and b in year t. A value exceeding 0 indicates that wheat trade between these countries conserved cropland resources in that year, whereas a value below 0 indicates that the trade resulted in an inefficient allocation of cropland resources.
2.2. Social Network Analysis
Social Network Analysis (SNA) is an analytical method that characterizes complex relational patterns into network configurations. It reveals the influence of network structure on the functions of groups and individuals by examining the interplay between structure and function [36]. This approach is widely applied in trade network research. Telecoupled systems represent a typical form of geographical network that exhibits distinct structural features [7]. The network topology and interconnections among the components can be effectively characterized using SNA.
Based on this, this study employs SNA to construct a telecoupled network model, denoted as G, which represents the global virtual cropland trade embodied in wheat trade. Participating countries (regions) in global wheat trade serve as network nodes, bilateral wheat trade flows constitute the edges, and the volume of virtual cropland trade embodied in wheat trade defines the edge weights. The network is formally defined as follows.
where represents the set of all nodes (countries or regions). represents the set of all edges (trade linkages). represents the set of all edge attributes (trade weights), specifically the virtual cropland trade volume embodied in each bilateral wheat trade flow. represents the set of years for which international wheat trade embodied the virtual cropland trade network.
G=(N,E,W,T)
Based on this, we constructed an unweighted adjacency matrix indicating the presence or absence of trade linkages between country pairs (matrix element=1 if a trade linkage exists, 0 otherwise) and a weighted adjacency matrix representing the intensity of trade ( matrix element= the total volume of virtual cropland trade between the two countries). Using these matrices, we calculated the key network topology metrics using Ucinet6. This enables the identification of the sending, receiving, and spillover systems of virtual croplands embodied in wheat trade, along with the direction and intensity of the trade flows. Finally, we quantified the evolutionary characteristics of the global virtual cropland resource network embodied in international wheat trade. Based on existing research, in this study, we operationalize the measurement of social network structure using three key metrics at the macro level—network density, average clustering coefficient, and average path length—to quantify global connectivity and cohesion. At the micro level, we employ relative degree centrality, relative closeness centrality, and betweenness centrality to examine the structural prominence and brokerage potential of individual nodes within the network (see Table 1 and Table 2).
2.3. QAP Regression Analysis
The Quadratic Assignment Procedure (QAP) is a method that takes “relational” data as its research object. Based on the permutation of matrix data, it compares the corresponding element values in two or more square matrices, calculates the correlation coefficient between the matrices, and simultaneously performs non-parametric tests on this coefficient [37]. QAP regression analysis can effectively overcome the issue of multicollinearity among the data [38] and is widely applied in social network research.
2.3.1. Selection of Variables
This study employs the virtual cropland trade flow matrix and dichotomized trade relationship matrix between countries (regions) as the dependent variable matrices. Guided by the telecoupling perspective and integrating theories of spatial interaction, factor endowment, comparative advantage, and new trade theory, this study selects influencing factors for the evolution of the virtual cropland trade network embodied in international wheat from two aspects—complementarity and accessibility between regional systems and across four dimensions: demand, supply, distance and facilitation [11]. A detailed explanation is provided in the following section.
Complementarity refers to the supply demand relationship of a specific element between regional systems, which serves as a fundamental condition for coupling interactions between systems [39]. In this study, three indications were selected to represent the demand-side factors of systemic complementarity: economic level, foreign wheat demand, and consumption structure. Three other indicators were chosen to represent the supply side factors: wheat cultivation area, wheat yield per unit area, and renewable freshwater resources.
Economic level (G): Measured by gross domestic product (GDP). Countries at different economic development levels often exhibit differences in their positions within the global value chain and variations in the structure of production and consumption of specific production [40]. Greater disparities in economic development imply larger industrial gaps, which may lead to greater opportunities for trade [41]. (2) Foreign wheat demand (N): Represented by the wheat self-sufficiency ratio (SSR). A lower self-sufficiency ratio indicates that domestic wheat production is less able to meet national demand, implying a higher reliance on imports. The self-sufficiency ratio was calculated using the following formula: Production/(Production+Imports-Exports). (3) Consumption structure (S): Expressed as Total domestic wheat demand/total population. Higher values indicate a stronger consumer preference for wheat products. The total domestic wheat demand was estimated using the formula: production+imports-exports. (4) Wheat cultivation area (A): the proportion of the actual harvested wheat area to the total cultivated land area. A higher proportion reflects more favorable endowment conditions of cropland resources for wheat production in a country (or region), indicating the greater importance of wheat in the agricultural structure. This may also imply a higher capacity to meet domestic demand and pursue export opportunities than other countries and wheat products. (5) Wheat yield per unit area (O): measured as wheat output per hectare of land. A higher yield per unit area suggests improved economies of scale and, thus, greater export advantages in the international market. (6) Renewable freshwater resources (F): expressed as per capita renewable internal freshwater resources. Countries with scarce freshwater resources often tend to develop water-saving industries, while those with per capita renewable freshwater resources above the world average are typically net exporters of virtual croplands [15].
Accessibility is a quantitative measure of the ease of connection between the sending and receiving systems. It is influenced by both distance and facilitating conditions and serves as a critical factor for coupling between systems [42]. This study selects two indicators—national distance and contiguity—to represent the distance dimension between systems, and two additional indicators—national governance level and WTO co-membership—to represent the facilitating conditions between systems. (1) National distance (D): Measured as the spherical distance between national capitals. Geographical distance partly reflects transportation costs and competitive dynamics in agricultural trade [15]. (2) Contiguity (C): This indicates whether two countries (or regions) share land borders. A value of 1 was assigned if they were adjacent, and 0, otherwise. Contiguous countries often leverage their geographic proximity to facilitate grain trade [43]. (3) National governance level (P): A sound political environment is a key component of the international trade landscape and an essential factor for sustaining stable agricultural trade. Greater disparities in governance levels between countries may reduce the likelihood of trade [44]. Drawing on the methodology of Cheng et al. [23], a national governance index was constructed as the arithmetic mean of six Worldwide Governance Indicators from the World Bank database: Voice and Accountability, Political Stability and Absence of Violence/Terrorism, Government Effectiveness, Regulatory Quality, Rule of Law, and Control of Corruption. This index reflects the quality of a country’s political environment. (4) WTO co-membership (W): The WTO plays a significant role in establishing trade rules, reducing trade barriers and promoting international cooperation and policy coordination. Shared WTO membership facilitates regional trade cooperation. A value of 1 is assigned if both countries (or regions) are WTO members, and 0 otherwise.
2.3.2. Model Specification
Based on the theoretical framework, we constructed a Quadratic Assignment Procedure (QAP) multiple regression model to analyze the determinants of the virtual cropland network embedded in international wheat trade. The general form of the model is specified as
where Y is the dependent variable, represented by both unweighted and weighted adjacency matrices of the virtual cropland network. β0 is the intercept. β1 to β10 are the coefficients to be estimated in the model. μ denotes the error term. G denotes the difference matrix in GDP between trading partners. N denotes the difference matrix of wheat self-sufficiency rates. S denotes the difference matrix of consumption structure. A denotes the difference matrix in the share of the wheat harvest area. O denotes the difference matrix of wheat yields per unit area. F denotes the difference matrix of per capita renewable inland freshwater resources. D denotes the geodesic distance matrix of the national capitals. C denotes a binary matrix indicating shared borders. P denotes the difference matrix of national governance performance. W denotes a binary matrix indicating mutual membership in the WTO.
Y=β0+β1G+β2N+β3S+β4A+β5O+β6F+β7D+β8C+β9P+β10W+μ
The names, detailed descriptions, construction methods of the matrices, hypothesized effects, and data sources for all the independent variables are summarized in Table 3. In terms of data processing, for variables with missing data in specific country-year observations, the gaps were interpolated with data from adjacent years. In cases where significant missing data persisted across multiple years or variables, the corresponding country nodes were excluded from the matrices. Finally, to eliminate the influence of different measurement units, the data standardization function in UCINET 6 software was utilized to normalize the independent variable matrices, including both difference matrices and multi-value matrices.
3. Results
3.1. Overall Network Evolution Characteristics
Between 1995 and 2023, the global wheat trade volume surged from 8.6298 million tons to 16.6535 million tons, whereas the virtual cropland trade expanded from 2.9097 million hectares to 4.8889 million hectares. The consistent growth in both trade volume and virtual cropland underscores not only the practical necessity for various countries and regions to secure food supplies but also the pivotal role international trade plays in the global distribution of cropland resources.
Network connectivity indicators reveal that the virtual cropland network within the global wheat trade has continued to evolve and deepen (Figure 1). In 1995, the network displayed a decentralized small-world cluster pattern, marked by a "low density, low average path length, and high average clustering coefficient," indicating generally loose global connections. Regional blocs like the European Union and the North American Free Trade Agreement formed small local clusters, yet comprehensive global trade linkages were lacking. By 2007, the network's average clustering coefficient had dropped to its lowest point, whereas the network density increased. The world food crisis and extreme weather events led to the dissolution of the original local clusters, resulting in more diverse wheat trading partnerships. As international wheat trade interactions evolved, network density steadily rose, peaking between 1995 and 2020, while the average clustering coefficient rebounded. This suggests that global interconnections in virtual cropland trade have intensified, with emerging export clusters and a restructured regional trade order following the food crisis.
However, network density saw a slight decline from 2020 to 2023. The global pandemic led to frequent grain export restrictions, disrupting existing trade linkages and causing logistical and supply chain blockages, which impeded the formation of new trade relationships. Additionally, since the onset of the Russia-Ukraine war in 2022, Ukraine's wheat production has decreased, exacerbated by successive export bans from several countries. This has affected the existing trade structure, leading to fragmentation within the wheat trade network [45]. In conclusion, the overall virtual cropland network in global wheat trade has shown a trend of increasing complexity, influenced by factors such as economic development, political dynamics, and trade agreements.
3.2. Evolutionary Characteristics of Individual Structure
The individual structural characteristics of the virtual cropland trade network embodied in wheat trade were measured using Ucinet 6 software, yielding degree centrality, closeness centrality, and betweenness centrality for each node across six time points spanning 1995 to 2023. The specific analysis is as follows.
(1) Degree centrality.
To enhance comparability across different trade scales and account for the direction of virtual cropland flows, this study standardizes degree centrality and derives relative out-degree and in-degree relative centrality.
Countries like the United States, Canada, Australia, Russia, and Kazakhstan demonstrate the highest out-degree centrality, indicating their strong capacity to export virtual cropland through wheat trade (Table 4). These nations serve as the primary sources of virtual croplands, having developed extensive export connections with other countries and holding a central position within the network. Between 1995 and 2023, the virtual cropland flow system transitioned from a duopoly dominated by the United States and Canada to a competitive landscape among four major exporters: Australia, Canada, Kazakhstan, and the United States (Figure 2). Australia overtook the United States to become the largest exporter, while Kazakhstan emerged as the third-largest. The international wheat trade is characterized by a seller's market, where exporting countries significantly influence trade structures and resource flow directions, with each exporter playing a distinct role in the global allocation of cropland resources. As traditional leading exporters, the United States and Canada, with average wheat yields of 2.89 t/ha and 2.61 t/ha respectively, act as net conservers of virtual croplands in their export activities. Conversely, emerging exporters like Australia and Kazakhstan, with average yields of 1.76 t/ha and 1.04 t/ha respectively, generally represent a net consumption of virtual cropland through their exports, leading to an inefficient substitution of cropland resources in trade with certain importing countries. Additionally, by 2023, Brazil in South America showed a significant rise in ranking, whereas Argentina's ranking fluctuated, dropping from third in 1995 to eighth in 2023. The position of Black Sea region countries, such as Ukraine, in virtual cropland exports has fluctuated but shown an upward trend.
From 1995 to 2023, countries such as China, Egypt, Japan, Brazil, Indonesia, and Italy have exhibited relatively high in-degree centrality, positioning them as primary recipients of virtual cropland in the wheat trade. China consistently ranked first in in-degree centrality in 1995, 2020, and 2023, underscoring its pivotal role in the virtual cropland inflow network. The source of China's virtual cropland inflows has transitioned from predominantly the United States to primarily Australia, a shift likely influenced by China's vast wheat consumption market, limited domestic cropland resources, and evolving international relations. In 2023, Uzbekistan overtook Brazil to become the second-largest receiving system, with all its virtual cropland flows originating from Kazakhstan. North African countries, exemplified by Egypt, consistently maintain high rankings, a reflection of their large populations, dietary traditions, and relatively scarce cropland resources. The significance of Central Asian countries has been increasing in both the sending and receiving of virtual cropland embedded in wheat trade.
(2) Closeness centrality
Closeness centrality measures the relative distance of a country's trade relationships with others within the network. In the virtual cropland flow network embedded in international wheat trade, out-closeness centrality and in-closeness centrality reflect the accessibility and dependency of a node (country or region) from the perspectives of virtual cropland outflow and inflow, respectively.
Specifically, from 1995 to 2023, countries ranking high in out-closeness centrality were primarily developed nations in Europe and America, such as the United States, Germany, Canada, and France. Among them, the United States held a dominant position from 1995 to 2001. The primary reason is that countries like the United States, Canada, and France dominate the global wheat market through their exports. These nations have established direct export relationships with numerous partners, granting them a strong capacity to export virtual cropland via trade. Additionally, the out-closeness centrality values for countries in the Black Sea region, such as Russia and Ukraine, have shown an upward trend, indicating their increasing influence in the outflow of virtual cropland through wheat trade. Meanwhile, the overall trend of in-closeness centrality over time is characterized by "a decline from 1995 to 2001, an increase from 2001 to 2014, and a decrease again from 2014 to 2023." As illustrated in Figure 3, the in-closeness centrality values are generally low, with no single node holding a monopolistic position. This is likely due to the high concentration of global wheat exporters, which limits the options for major suppliers available to importing countries. It is noteworthy that if countries with high out-closeness centrality implement policy changes, such as export restrictions, the direct impact would affect a broader range of countries, potentially triggering cascading effects throughout the network.
(3) Betweenness centrality.
Betweenness centrality reflects the bridging role of individuals within a social network and serves as an effective method for identifying telecoupling spillover systems [11]. As shown in Table 5, from 1995 to 2020, the betweenness centrality of the United States far exceeded that of other countries, consistently ranking first, while France and Germany stably held the second and third positions, respectively. In 2023, France surpassed the United States to take the top rank. These countries play significant bridging roles in the virtual cropland network embodied in international wheat trade, possessing strong capabilities for resource allocation and control. This pattern is closely related to the role of transnational agribusinesses within the network. Represented by ADM, Bunge, Cargill, and Louis Dreyfus Company, these multinational grain traders have established and dominated the underlying architecture of international wheat trade through their global subsidiaries, dedicated logistics facilities, and long-term contracts. They are not only carriers of technology and capital but also the actual organizers of trade flows, wielding intermediary power and resource allocation capabilities that transcend national borders. Specifically, the United States' sustained high betweenness centrality relies on the globally connected production model built by multinational traders such as ADM, Bunge, and Cargill. France, leveraging companies like Louis Dreyfus Company and the EU's Common Agricultural Policy, extends its institutional standards and enhances its network coordination capacity. Although Germany is not a major wheat producer, its key logistics hubs such as the ports of Hamburg and Bremen provide essential infrastructure services for the global circulation managed by multinational traders, making it a critical intermediary node for virtual cropland flows. In 2023, France overtook the United States to rank first. This shift may be related to the pandemic-induced disruptions to the U.S.-led globally connected model and reflects, to some extent, the vulnerability of the highly centralized, U.S.-corporate-dominated global direct-supply model when facing global shocks. In contrast, the French model, embedded within the more institutionally coordinated and regionally resilient EU network, is demonstrating increasingly prominent intermediary advantages.
Between 2020 and 2023, Kenya's betweenness centrality in the virtual cropland trade network notably increased, reinforcing its role as a transit hub. During the 2020 pandemic, disruptions in shipping operations at several major global ports coincided with the United Nations World Food Programme (WFP) designating Kenya as a distribution hub for food aid in East Africa. As the region's largest deep-water port, the Port of Mombasa's hub role became more prominent, prompting some virtual cropland flow paths to shift from a "global direct supply" model to an "exporter–Kenya–importer" pattern. Additionally, following the outbreak of the Russia–Ukraine conflict in 2022, several East African countries redirected their wheat imports from Ukraine to alternative sources like Australia. This further solidified Kenya's position as a crucial transit node for virtual cropland flowing from exporting countries into landlocked East African nations.
Overall, from 1995 to 2023, the United States, France, and Germany consistently held high intermediary positions within the international virtual cropland network for wheat trade. However, alongside developed economies such as Canada and the United Kingdom, developing countries in Asia and Africa—including Kenya—are increasingly taking on vital hub functions, reflecting a trend toward multipolarity in the global virtual cropland flow network.
3.3. Drivers of Evolution in the Virtual Cropland Trade Network
The QAP regression results (Table 6 and Table 7) indicate that, at the global scale, demand and distance factors serve as the primary drivers influencing the evolution of the virtual cropland network in international wheat trade. Supply and facilitation factors also affect the trade network, although their impacts are relatively weak. A comparison between Table 6 and Table 7 reveals that the correlation coefficients and significance levels of all explanatory variables are stronger in the unweighted trade network than in the weighted network. A detailed analysis is presented in the following sections.
The economic level variable shows a statistically significant positive correlation with the volume of virtual cropland flows, suggesting that countries with larger economic disparities are more likely to engage in wheat trade, thereby facilitating virtual cropland transfers. This finding is consistent with the previously identified structural characteristic, where developed economies like the United States, Canada, and Australia act as primary senders, while developing regions in Asia, Africa, and Latin America serve as main receivers. Notably, although the regression coefficients for the economic level variable remain relatively high in both unweighted and weighted network models, they exhibit a general downward trend over time, indicating a gradual weakening of its influence in driving virtual cropland resource flows.
The foreign wheat demand variable is significantly positive in both network types, indicating that countries with higher wheat self-sufficiency rates typically have greater exportable surpluses. Differences in national self-sufficiency capacities thus underpin differentiated demand in the international market. The greater the disparity in wheat self-sufficiency between two countries, the more likely they are to establish trade linkages, facilitating cross-regional coordination in allocating virtual cropland resources.
The influence of the consumption structure variable is more complex. In the unweighted network, although the coefficient is positive, its magnitude is small, indicating that when trade volume is not considered, countries with greater differences in consumption structure are more likely to establish wheat trade ties. In the weighted network, however, the direction of this variable’s coefficient is unstable and its statistical significance is weak. This suggests that when trade volume is considered, the effect of consumption structure on virtual cropland flows becomes less clear, and its mechanism may be influenced by additional contextual factors.
(2) Supply factors exhibit differentiated effects on the virtual cropland trade network;
The variable representing the wheat harvested area exhibits an overall negative influence, which contradicts theoretical expectations. In the unweighted network, its regression coefficient is small and trends downward, indicating that when trade volume is not considered, countries with smaller differences in the proportion of wheat harvested area are more likely to establish virtual cropland trade linkages. However, in the weighted network, this variable does not pass the significance test, suggesting that once trade volume is factored in, the effect of proportional differences may be overshadowed by other scale-related factors, especially when the actual disparity in harvested area between two countries is substantial. For instance, in 2020, Russia engaged in significant virtual cropland trade with countries like Turkey and Egypt despite notable differences in harvested area, while trade between China and the United States or Australia remained substantial even with smaller area differences (Figure 4). The high concentration of global wheat exports in a few countries (e.g., the United States, Canada, Australia) and the wide dispersion of importers diminish the overall explanatory power of the harvested area variable.
The wheat yield variable demonstrates a positive effect in the unweighted network, aligning with expectations: the greater the disparity in yield levels, the more pronounced the comparative advantage in wheat production between countries, thereby facilitating trade connections. However, its coefficient did not achieve statistical significance in 2020 and 2023, suggesting that comparative advantage is no longer the sole consideration for wheat trade amid external shocks such as the pandemic and increased geopolitical uncertainty. In the weighted network, the yield variable shows a negative and insignificant effect, contrary to expectations, further illustrating that virtual cropland flows are shaped by the complex interplay of multiple factors. Additionally, the renewable freshwater resource variable exhibits a significant positive effect in both network types, with stronger significance in the weighted network. This indicates that differences in freshwater resource endowments between countries not only promote the formation of trade linkages but also help expand actual trade volume, thereby reinforcing connections within the virtual cropland trade network.
(3) Distance factors exhibit dual nature within the virtual cropland network;
The geographic distance between countries has a notably negative impact on virtual cropland flows. In the unweighted network, its regression coefficient consistently remains below -0.2, with its absolute value increasing over time. Although the absolute value of the coefficient decreases in the weighted network, it still remains significantly negative. In contrast, the contiguity variable exhibits a statistically significant positive coefficient at the 1% level in both network types, suggesting that geographical proximity actively fosters the formation of trade relationships. From 1995 to 2023, the average distance of virtual cropland flows in global wheat trade decreased from 4,801 km to 4,664 km (Figure 5). On one hand, trade volumes over medium distances (5,000–10,000 km) increased substantially, with neighboring countries like Uzbekistan and Kazakhstan capitalizing on their proximity to forge closer trade ties. On the other hand, ultra-long-distance trade links exceeding 10,000 km—such as those between China and Canada, Canada and Japan, and China and the United States—consistently facilitated large-scale virtual cropland transfers. This illustrates that while distance serves as a fundamental barrier to trade connections, it can be surmounted by high complementarity between countries when driven by large-scale supply and demand dynamics.
Virtual cropland flows can originate not only from nearby receiving systems but also directly "jump" to distant ones. When demand in a receiving system is sufficiently concentrated and substantial, these virtual cropland flows can overcome the friction of distance, linking remote sending systems and creating leapfrogging telecoupling connections. This results in a complex spatial pattern marked by the coexistence of localized clusters and globalized connections.
(4) Facilitating factors exhibit differentiated effects on virtual cropland flows.
The governance variable shows a significantly negative regression coefficient at the 1% level in the unweighted network, with the absolute value of the coefficient fluctuating upward over time. This indicates that smaller differences in governance quality between countries facilitate the establishment of wheat trade linkages and promote virtual cropland flows, and the marginal impact of this factor on trade formation continues to strengthen. This finding aligns with the conclusions of Cheng et al. [23]. In the weighted network, the significance of this variable weakens, suggesting that governance quality has a relatively limited influence on trade volume.
The WTO co-membership variable generally has a positive, albeit modest, impact on virtual cropland flows. As a multilateral trade coordination mechanism, the WTO fosters the establishment of wheat trade connections between countries by enhancing trade facilitation. However, with the rise of regional trade agreements and the restructuring of global value chains, its economic facilitation influence in international wheat trade may increasingly be diverted by regional governance mechanisms, leading to a weakening effect on the virtual cropland trade network.
The flow of virtual cropland embedded in international wheat trade essentially represents a cross-regional reconfiguration of global cropland resources, facilitated by the physical trade of wheat. It reflects increasingly complex and networked human-land interactions. Within this telecoupled system, spatial disparities in economic development levels and the cross-regional transmission of wheat consumption demand drive sending systems (exporting countries) to leverage their natural endowment advantages, transforming local cropland resources into tradable wheat production capacity and virtual cropland output. Concurrently, governance coordination, trade facilitation, logistical efficiency, and transnational agribusinesses provide the operational channels for virtual cropland to flow from sending systems to receiving systems (importing countries). This flow, shaped by supply-demand matching, forms a bidirectional feedback loop. It transcends the rigid constraint of the immobile geographical location of cropland resources, promotes the reallocation of these resources within the global social-ecological system, and establishes a cross-territorial system for the synergistic utilization of cropland resources.
3.4. Telecoupling Implications of Virtual Cropland Trade Embodied in Global Wheat Trade
The virtual cropland difference is a crucial indicator for assessing the efficiency of cropland resource allocation in international trade. From 2019 to 2023, global wheat trade generally optimized cropland use, leading to a cumulative saving of 47.5812 million hectares of cropland. However, this optimization effect is waning: global cropland savings have declined each year since 2020, dropping from 12.9118 million hectares to 10.0939 million hectares by 2023. This downward trend is closely tied to a series of shocks affecting the global wheat trade network, including the COVID-19 pandemic, the Russia-Ukraine conflict, and wheat export bans by several countries. These disruptions have reduced the overall efficiency of virtual cropland trade allocation and have disproportionately impacted low- and middle-income countries [47].
Using Egypt as a case study, we found that its dietary structure heavily relies on imported wheat. Typically, virtual cropland inflows help mitigate the strict limitations of domestic resources. However, this reliance makes the country vulnerable to external risks. From 2020 to 2023, there was a significant restructuring of its import sources. The share of virtual cropland from Russia and Ukraine dropped dramatically from 86.19% to 36.04%, while the contribution from the United States and Canada increased from less than 1% to about 9%. This shift extended the geographical distance of trade links, resulting in higher transport-related carbon emissions and increased shipping costs, which in turn raised the landed price of wheat. Additionally, fluctuations in the global trade network imposed fiscal pressure and posed risks to social stability within Egypt. In summary, while global wheat trade redefines local resource boundaries and creates cropland savings, its network volatility also redistributes global risks, increasingly linking the food security of low- and middle-income countries to political and environmental changes in distant regions.
The rise in virtual cropland trade volume within the global wheat market highlights a deeper cross-regional allocation while also revealing its concealed eco-environmental costs (Figure 6). In Australia, a burgeoning wheat exporter, the area of permanent grassland and pasture shrank by nearly 1.22 million km² between 1995 and 2020, with a significant portion converted into wheat-growing regions. Meanwhile, wheat expansion in South American countries like Brazil and Argentina has been accompanied by extensive deforestation. According to World Bank data, the cumulative forest loss in these two countries during the same period reached approximately 800,000 km², severely impairing the carbon sequestration and biodiversity functions of their ecosystems. In terms of chemical inputs, India and Brazil increased their fertilizer application rates per unit of cropland from 85 kg/ha and 98 kg/ha to 210 kg/ha and 353 kg/ha, respectively, illustrating a growth pattern driven by intensified chemical use. In contrast, while the volume of virtual cropland flows from traditional major exporters such as the United States and Canada has not expanded significantly, their cropland fertilizer application rates remained high, reaching 131 kg/ha in 2020, exerting cumulative pressure on local soil and water environments.
While international wheat trade has optimized the allocation of global cropland resources on a broad scale, it has increasingly strayed from its optimal state due to the impacts of pandemic shocks, regional conflicts, and rising international uncertainties. This has created a transmission chain of "shock impact → network evolution → ecological cost → economic effect," highlighting the deeper challenges of global food security and environmental governance. Future research should further quantify the loss of cropland quality and ecological footprints associated with virtual cropland flows under different trade pathways, thereby providing a more precise scientific underpinning for the sustainable management of land systems.
4. Discussion and Conclusions
4.1. Discussion
The vulnerability of the virtual arable land trade network in the international wheat market has become increasingly evident. The trade pattern, characterized by exports dominated by Europe, the United States, Canada, and Australia, and imports dependent on Asia, Africa, and Latin America, has yet to undergo a fundamental transformation. Meanwhile, the seller’s market characteristics further intensify the risk of imbalance in the trade system [46]. In this context, a trade model focused solely on efficiency is no longer sufficient to address the myriad challenges, such as economic disruptions and hidden transfers of ecological costs. Therefore, strengthening the governance of the global wheat trade system is urgent. Both importing and exporting countries must embrace the vision of a community with a shared future and enhance coordinated governance of the receiving, sending, and spillover systems within the global wheat trade. This approach should ensure food security while balancing ecological sustainability and equity.
From the perspective of virtual cropland-receiving systems, importing countries should implement integrated strategies that combine risk management with environmental standards. This approach involves utilizing geographical proximity and existing cooperation mechanisms to prioritize the creation of regional wheat reserve alliances with neighboring nations. For example, China could leverage agricultural cooperation under the Belt and Road Initiative to develop emerging suppliers with seasonal complementarity, such as Kazakhstan, while partnering with multinational agribusinesses, such as COFCO, to establish sustainable production bases. Through these collaborations, green production standards and traceability systems can be disseminated along the supply chain, with tariff preferences offered for wheat that meets these standards, thereby encouraging ecological transformation at the source. Meanwhile, core importing countries such as China could incorporate virtual cropland imports into a dynamic balance framework for their cultivated land preservation systems. By establishing a synergistic mechanism that links virtual cropland inflows with domestic cropland conservation and integrating this approach with high-standard farmland construction to enhance the quality of local cropland, it is possible to mitigate the risks of domestic cropland abandonment and quality degradation associated with over-reliance on imports. Differentiated technological empowerment is essential to mitigate the risks stemming from economic disparities. Less-developed importing countries should focus on enhancing innovation to increase yields and reduce post-harvest losses, thereby replacing high-ecological-cost imports with environmentally friendly domestic production. More developed importers can assist by investing in green technology research and development in exporting developing countries. Additionally, developing importers should expedite alignment with international standards to bridge the governance gap with developed exporters and foster standardized and unified inspection protocols at trade ports.
At the level of virtual cropland sending systems, major exporting nations must take greater responsibility for minimizing the environmental impacts of production. Countries that rely heavily on fertilizers, for instance, should expedite the development and implementation of green production technologies to reduce their environmental costs. Sustainable practices, such as conservation tillage techniques from countries like Canada, can be adapted and transferred to emerging suppliers in regions like South America and Africa, including Argentina, to help build resilient and sustainable production systems that strengthen the global wheat supply network. Drawing on the green direct payment scheme within the EU’s Common Agricultural Policy (CAP), major wheat-exporting countries could provide subsidies to wheat farmer who adopt conservation cultivation and crop rotation practices.
Overall, creating a trade system that balances efficiency, security, and sustainability requires a cooperative mechanism focused on the synergy of receiving, sending, and spillover systems. Building upon the Land Degradation Neutrality (LDN) target under the United Nations Convention to Combat Desertification (UNCCD), the ecological costs associated with virtual cropland flows can be incorporated into environmental impact assessments for international trade. Furthermore, drawing on the rationale of mechanisms like the Carbon Border Adjustment Mechanism (CBAM) , an ecological compensation tariff could be imposed on wheat exports from countries with high fertilizer input or significant forest-to-cropland conversion. The revenue generated should be earmarked specifically for cropland quality restoration in less-developed regions. Importing and exporting countries should establish regular platforms for policy and technical exchange to reduce trade barriers, especially between nations with similar dietary patterns but different governance systems, such as India and Argentina. At the same time, multinational agribusinesses, as key intermediaries influencing trade flows, should be encouraged through incentives or regulations to actively fulfill inclusive governance responsibilities and maintain a fair and open trading environment. Ultimately, the governance of the trade network must be closely aligned with the United Nations Sustainable Development Goals, particularly SDG 2 (Zero Hunger) and SDG 12 (Responsible Consumption and Production), to achieve a synergistic win-win outcome for global food security and ecological sustainability.
While this study broadens the research perspective on resource flows in international agricultural trade through the lens of telecoupling, it has certain limitations. First, at the methodological level, the quantification of virtual croplands relies solely on the single indicator of “area,” without incorporating dimensions such as carbon storage, biogeochemical characteristics, and human well-being disparities across different croplands. This makes it challenging to accurately reflect the environmental costs associated with different trade routes. In the QAP regression, variables such as “wheat production area”—measured as the proportion of harvested area—and “WTO proximity”—which does not differentiate governance capacities between new and existing members—may warrant reconsideration in their construction. Furthermore, the model includes relatively few environmental variables. Additionally, telecoupling in international agricultural trade significantly influences both intracoupling and pericoupling dynamics (Herzberger et al.,2019). This study does not address the interactive mechanisms between telecoupling, pericoupling, and intracoupling, such as examining the mutual influence between intra-European wheat trade and transatlantic trade between the United States and Europe.
Future research could advance in two main directions. On the one hand, a comprehensive virtual cropland assessment framework integrating both area and environmental quality could be developed. Introducing environmental correction factors would enable a more precise quantification of environmental costs and effect disparities across trade pathways. On the other hand, systematic analysis is needed to elucidate the processes, mechanisms, and effects of telecoupling, pericoupling, and intracoupling within international wheat trade systems. The reshaping of these coupled relationships by accelerating regional integration and profound geopolitical shifts also calls for systematic exploration in future research.
4.2. Conclusions
Utilizing the telecoupling perspective and social network analysis, this study investigates the global virtual cropland trade network in wheat across eight time points from 1995 to 2023. It employs the Quadratic Assignment Procedure (QAP) regression model to quantitatively analyze the drivers behind the spatiotemporal evolution of this telecoupled network. The main conclusions are as follows.
- (1)
- The global virtual cropland network embodied in wheat trade shows vulnerability amid increasing connectivity. Although network density generally trends upward, the average clustering coefficient and average path length fluctuate over time. Subject to external shocks, the network structure reveals complex evolutionary characteristics, marked by the coexistence of regional clustering tendencies and improvements in trade efficiency.
- (2)
- The telecoupling structure of the global virtual cropland trade network is distinct. The sending system has transitioned from a duopoly dominated by the United States and Canada to a multipolar export structure involving Australia, Canada, Kazakhstan, and the United States. The receiving system primarily comprises developing countries across Asia, Africa, and Latin America, with China as the core inflow country. The intermediary power of spillover systems is closely linked to their transnational agribusiness corporations. The intermediary model represented by France—embedded within regional institutional networks—demonstrates stronger coupling and coordination capabilities than the U.S.-led global direct-connection model. Furthermore, under external shocks, specific critical nodes, such as Kenya, can rapidly emerge as new secondary hubs.
- (3)
- Demand and distance factors are fundamental drivers of network evolution, while supply factors exhibit non-stationary characteristics. Facilitating factors align with theoretical expectations but have a limited overall impact. The level of economic development and foreign demand significantly promote both the establishment and intensification of trade relationships. Distance has a dual nature: it serves as a fundamental friction hindering trade connections, yet can be overcome by high complementarity between countries under specific conditions. Geographical distance remains a primary constraint on trade linkages, particularly in the initial establishment of trade relations. Although contiguity has a significant positive effect, its role is primarily manifested in lowering the threshold for forming trade relationships.
- (4)
- While international wheat trade enhances the efficient use of global arable land resources, it is currently grappling with multiple disruptions and striving to find a new equilibrium between efficiency and security. External factors such as the COVID-19 pandemic and the Russia-Ukraine conflict, along with policy and production changes in various countries, have shifted the global virtual arable land trade network from being efficiency-driven to security-focused. For example, Egypt quickly redirected its wheat imports from Russia and Ukraine to the United States and Canada, replacing previously efficient trade routes based on geographic proximity with new, more secure but less efficient supply chains. This transition essentially sacrifices efficiency for supply chain stability, resulting in an overall decline in resource allocation efficiency. Consequently, it is crucial to promote the development of a new framework for grain trade that balances efficiency and security, transcending the management perspectives of individual nations or sectors, to achieve the sustainable and optimized use of global arable land resources.
Supplementary Materials
The following supporting information can be downloaded at the website of this paper posted on Preprints.org, Table S1: Regression results of the unweighted and weighted trade network.
Author Contributions
Conceptualization, S.P. and E.M.; methodology, S.P. and E.M.; software, F.X.; validation, L.L. and M.W.; formal analysis, S.P.; resources, L.L.; data curation, M.W. and F.X.; writing—original draft preparation, S.P.; writing—review and editing, E.M.; visualization, S.P.; supervision, E.M.; project administration, E.M. and L.L.; funding acquisition, E.M. and L.L. All authors have read and agreed to the published version of the manuscript.
Funding
This research was funded by the National Natural Science Foundation of China (Grant Nos. 42101267, 42101198) and the Hunan Provincial Natural Science Foundation Youth Project (2025JJ60262).
Data Availability Statement
All relevant data, analytical process files, and results supporting the findings of this study are available at the following link: https://doi.org/10.5281/zenodo.18149578.
Acknowledgments
During the preparation of this manuscript, the authors used DeepSeek, V3.2 for the purpose of text translation. The authors have reviewed and edited the output and take full responsibility for the content of this publication.
Conflicts of Interest
The authors declare no conflicts of interest.
Abbreviations
The following abbreviations are used in this manuscript:
| SNA | Social Network Analysis |
| QAP | Quadratic Assignment Procedure |
References
- Ellis, E.C.; Ramankutty, N. Putting people in the map: anthropogenic biomes of the world. Frontiers in Ecology and the Environment.2008,6,439-447.
- Crutzen, P.J. Geology of mankind. Nature.2002,415,23.
- Lewis, S.L.; Maslin, M.A. Defining the Anthropocene. Nature.2015,519,171-180.
- Tan, M.H.; Li, X.B. Paradigm transformation in the study of man-land relations: From local thinking to global network thinking modes. Acta Geographica Sinica.2021,76,2333-2342.
- Liu, J.G.; Hull, V.; Batistella, M.; DeFries, R.; Dietz, T.;Fu, F.; Hertel, T.W.; Izaurralde, R.C.; Lambin, E.F.; Li, S.X.; Martinelli, L.A.; McConnell, W.J.; Moran, E.F.; Naylor, R.; Ouyang, Z.Y.; Polenske, K.R.; Reenberg, A.; Rocha, G.D.; Simmons, C.S.; Verburg, P.H.; Vitousek, P.M.; Zhang, F.S.; Zhu, C.Q. Framing Sustainability in a Telecoupled World. Ecology and Society.2013,18.
- Liu, J.G.; Hull, V.; Batistella, M.; DeFries, R.; Dietz, T.; Fu, F.; W. Hertel, T.; Izaurralde, R.C.; F. Lambin, E.; Li, S.X.; A. Martinelli, L.; J. McConnell, W.; F. Moran, E.; Naylor, R.; Ouyang, Z.Y.; R. Polenske, K.; Reenberg, A.; Rocha, G.d.M.;S. Simmons, C.; H. Verburg, P.; M. Vitousek, P.; Zhang, F.S.; Zhu, C.Q. A Framework for Sustainability in a Telecoupled World. Acta Ecologica Sinica.2016,36,7870-7885.
- Ma, E.P.; Cai, J.M.; Han, Y.; Liao, L.W.; Lin, J. Research progress and prospect of telecoupling of Human-Earth system. Progress in Geography.2020,39,310-326.
- Sun, J.; Liu, J.G.; Yang, X.J.; Zhao, F.Q.; Qin, Y.C.; Yao, Y.Y.; Wang, F.; Lun, F.; Wang, J.J.; Qin, B.; Liu, T.; Zhang, C.L.; Huang, B.R.; Cheng, Y.Q.; Shi, J., L.; Zhang, J.S.; Tang, H.J.; Yang, P.; Wu, W.B. Sustainability in the Anthropocene: Telecoupling framework and its applications. Acta Geographica Sinica.2020,75,2408-2416.
- Ma, E.P.; Cai, J.M.; Guo, H.; Lin, J.; Liao, L.W.; Han, Y. A Theoretical Framework and Research Priorities for Food System Coupling under Urbanization. Acta Geographica Sinica.2021,76,2343-2359.
- Herzberger, A.; Chung, M.G.; Kapsar, K.; Frank, K.A.; Liu, J. Telecoupled Food Trade Affects Pericoupled Trade and Intracoupled Production. Sustainability.2019,11.
- Ye, W.Y.; MA, E.P.; Liao, L.W.; Yu, Z.S. Spatio-temporal evolution and influencing factors of international soybean trade network from a telecoupling perspective. Journal of Natural Resources.2023,38,1632-1650.
- Sondergaard, N.; Thives, V.; de Jesus, C.L.G.; de Campos, I.P.V. Fragmented sustainability governance of telecoupled flows: Brazilian beef exports to China. Journal of Environmental Planning and Management.2024,67,454-476.
- Liu, D.H.; Tian, B.X.; Zhang, M.Q.; Jiang, L.N.; Li, C.X.; Qin, X.L.; Ma, J.H. Meta-analysis of the effects of different tillage methods on wheat yields under various conditions in China. Soil & Tillage Research.2025,248.
- Wang, J.Y.; Dai, C.; Zhou, M.Z.; LIU, Z.J. Research on global grain trade network pattern and its influencing factors. Journal of Natural Resources.2021,36,1545-1556.
- Qiang, W.L.; Zhang, C.L.; Liu, A.M.; Cheng, S.K.; Wang, X. Li, F. Evolution of global virtual land flow related to agricultural trade and driving factors. Resources Science.2020,42,1704-1714.
- Fair, K.R.; Bauch, C.T. Anand, M. Dynamics of the Global Wheat Trade Network and Resilience to Shocks. Scientific Reports.2017,7.
- Gutiérrez-Moya, E.; Adenso-Díaz, B. Lozano, S. Analysis and vulnerability of the international wheat trade network. Food Security.2021,13,113-128.
- Vishwakarma, S.; Zhang, X.; Lyubchich, V. Wheat trade tends to happen between countries with contrasting extreme weather stress and synchronous yield variation. Communications Earth & Environment.2022,3.
- Li, S.J. Review of the Global Wheat Market in 2022/2023 and Outlook for the 2023/2024 Crop Year. China Grain Economy.2023,65-69.
- Guo, H.; Dilinaer, A. A Study on the Influencing Factors and Countermeasures of Wheat Trade between China and Russia. Eurasian Economic Review.2023,96-124+126.
- Wang, R.H. The Structure and Evolution of International Wheat Trade: A Complex Network Analysis. Agricultural Economy.2024,136-138.
- Li, H.R.; Mu, Y.Y. Wheat Import Trade Pattern and Its Influencing Factors in China: Based on the Trade Gravity Model. Chinese Agricultural Science Bulletin.2020,36,132-139.
- Cheng, Y.J.; Gong, G.Y. Evolution and Influencing Factors of Wheat Trade Network Between China and Countries Along the Belt and Road. Journal of Chongqing University of Arts and Sciences (Social Sciences Edition).2024,43,73-86.
- MA, E.P.; Cai, J.M.; Lin, J.; Han, Y.; Liao, L.W.; Han, W. Explanation of land use/cover change from the perspective of tele-coupling. Acta Geographica Sinica.2019,74,421-431.
- Wu, H.F.; Liu, A.; Jin, R.C.; Chai, L. Interregional flows of virtual cropland within China. Environmental Research Communications.2022,4.
- Meng, H.; Xing, L.W.; Hu, J.X.; Shen, C.; Zhang, H.Y.; Wu, J.Z. Exploring the characteristics and drivers of virtual cropland trade of major agricultural products in China. Journal of Cleaner Production.2024,448.
- Zhou, M.; Wang, J.; Ji, H. Virtual Land and Water Flows and Driving Factors Related to Livestock Products Trade in China. Land.2023,12.
- Luo, L.; Xing, Z.; Chu, B.; Zhang, H.; Wang, H. Virtual land trade and associated risks to food security in China. Environmental Impact Assessment Review.2024,106.
- Liu, X.; Yu, L.; Cai, W.; Ding, Q.; Hu, W.; Peng, D.; Li, W.; Zhou, Z.; Huang, X.; Yu, C. Gong, P. The land footprint of the global food trade: Perspectives from a case study of soybeans. Land Use Policy.2021,111.
- Park, S.; Munroe, D.K.; Xiao, N. Visualizing economic drivers of virtual land trade: A case study of global cereals trade. Environment and Planning B-Urban Analytics and City Science.2023,50,1695-1698.
- Zhang, J.; Zhao, N.; Liu, X.; Liu, Y. Global virtual-land flow and saving through international cereal trade. Journal of Geographical Sciences.2016,26,619-639.
- Qiang, W.; Niu, S.; Liu, A.; Kastner, T.; Bie, Q.; Wang, X.; Cheng, S. Trends in global virtual land trade in relation to agricultural products. Land Use Policy.2020,92.
- Gao, P.; Gao, Y.; Ou, Y.; McJeon, H.; Iyer, G.; Ye, S.; Yang, X.; Song, C. Heterogeneous pressure on croplands from land-based strategies to meet the 1.5 °C target. Nature Climate Change.2025,15.
- Qiang, W.; Liu, A.; Cheng, S.; Kastner, T.; Xie, G. Agricultural trade and virtual land use: The case of China's crop trade. Land Use Policy.2013,33,141-150.
- Qiang, W.L.; Liu, A.M.; Cheng, S.K.; Xie, G.D.; Zhao, M.Y. Quantification of Virtual Land Resources in China's Crop Trade. Journal of Natural Resources.2013,28,1289-1297.
- Xavier, D.L.D.; dos Reis, J.G.M.; Ivale, A.H.; Duarte, A.C.; Rodrigues, G.S.; de Souza, J.S.; Correia, P.F.D. Agricultural International Trade by Brazilian Ports: A Study Using Social Network Analysis. Agriculture-Basel.2023,13.
- Pan, Z.; Ma, L.; Tian, P.; Zhu, Y. Structural characteristics and influencing factors of agricultural trade spatial network: evidence from RCEP 15 countries. Ciencia Rural.2024,54.
- Alhussam, M.I.; Ren, J.; Yao, H.; Abu Risha, O. Food Trade Network and Food Security: From the Perspective of Belt and Road Initiative. Agriculture-Basel.2023,13.
- Karg, H.; Bellwood-Howard, I.; Ramankutty, N. How cities source their food: spatial interactions in West African urban food supply. Food Security.2025,17,439-460.
- Ma, S.Z.; Ren, W.W.; Wu, G.J. The characteristics of a country's agricultural trade network and its impact on the global value chain division: A perspective from social network analysis. Management World.2016,60-72.
- Bai, Z.; Liu, C.; Wang, H.; Li, C. Evolution Characteristics and Influencing Factors of Global Dairy Trade. Sustainability.2023,15,.
- Long, F.J.; Zheng, L.F.; Song, Z.D. High-speed rail and urban expansion: An empirical study using a time series of nighttime light satellite data in China. Journal of Transport Geography.2018,72,106-118.
- Duan, J.; Nie, C.; Wang, Y.; Yan, D.; Xiong, W. Research on Global Grain Trade Network Pattern and Its Driving Factors. Sustainability.2022,14.
- Deng, G.; Di, K. A Study on the Characteristics and Influencing Factors of the Global Grain Virtual Water Trade Network. Water.2025,17.
- Jia, N.; Xia, Z.L.; Li, Y.S.; Yu, X.; Wu, X.T.; Li, Y.J.; Su, R.F.; Wang, M.T.; Chen, R.S.; Liu, J.G. The Russia-Ukraine war reduced food production and exports with a disparate geographical impact worldwide. Communications Earth & Environment.2024,5.
- Yin, Z.Q.; Wu, J.Z.; Sun, J.; Ding, J.J.; Zhou, X.Y.; Cao, S.S.; Shen, C. Pattern and Evolution Analysis of World Wheat Trade. Food and Nutrition in China.2021,27,48-51.
Figure 1.
Macro-level structural metrics of the virtual cropland trade network within the international wheat trade, 1995-2023.
Figure 1.
Macro-level structural metrics of the virtual cropland trade network within the international wheat trade, 1995-2023.
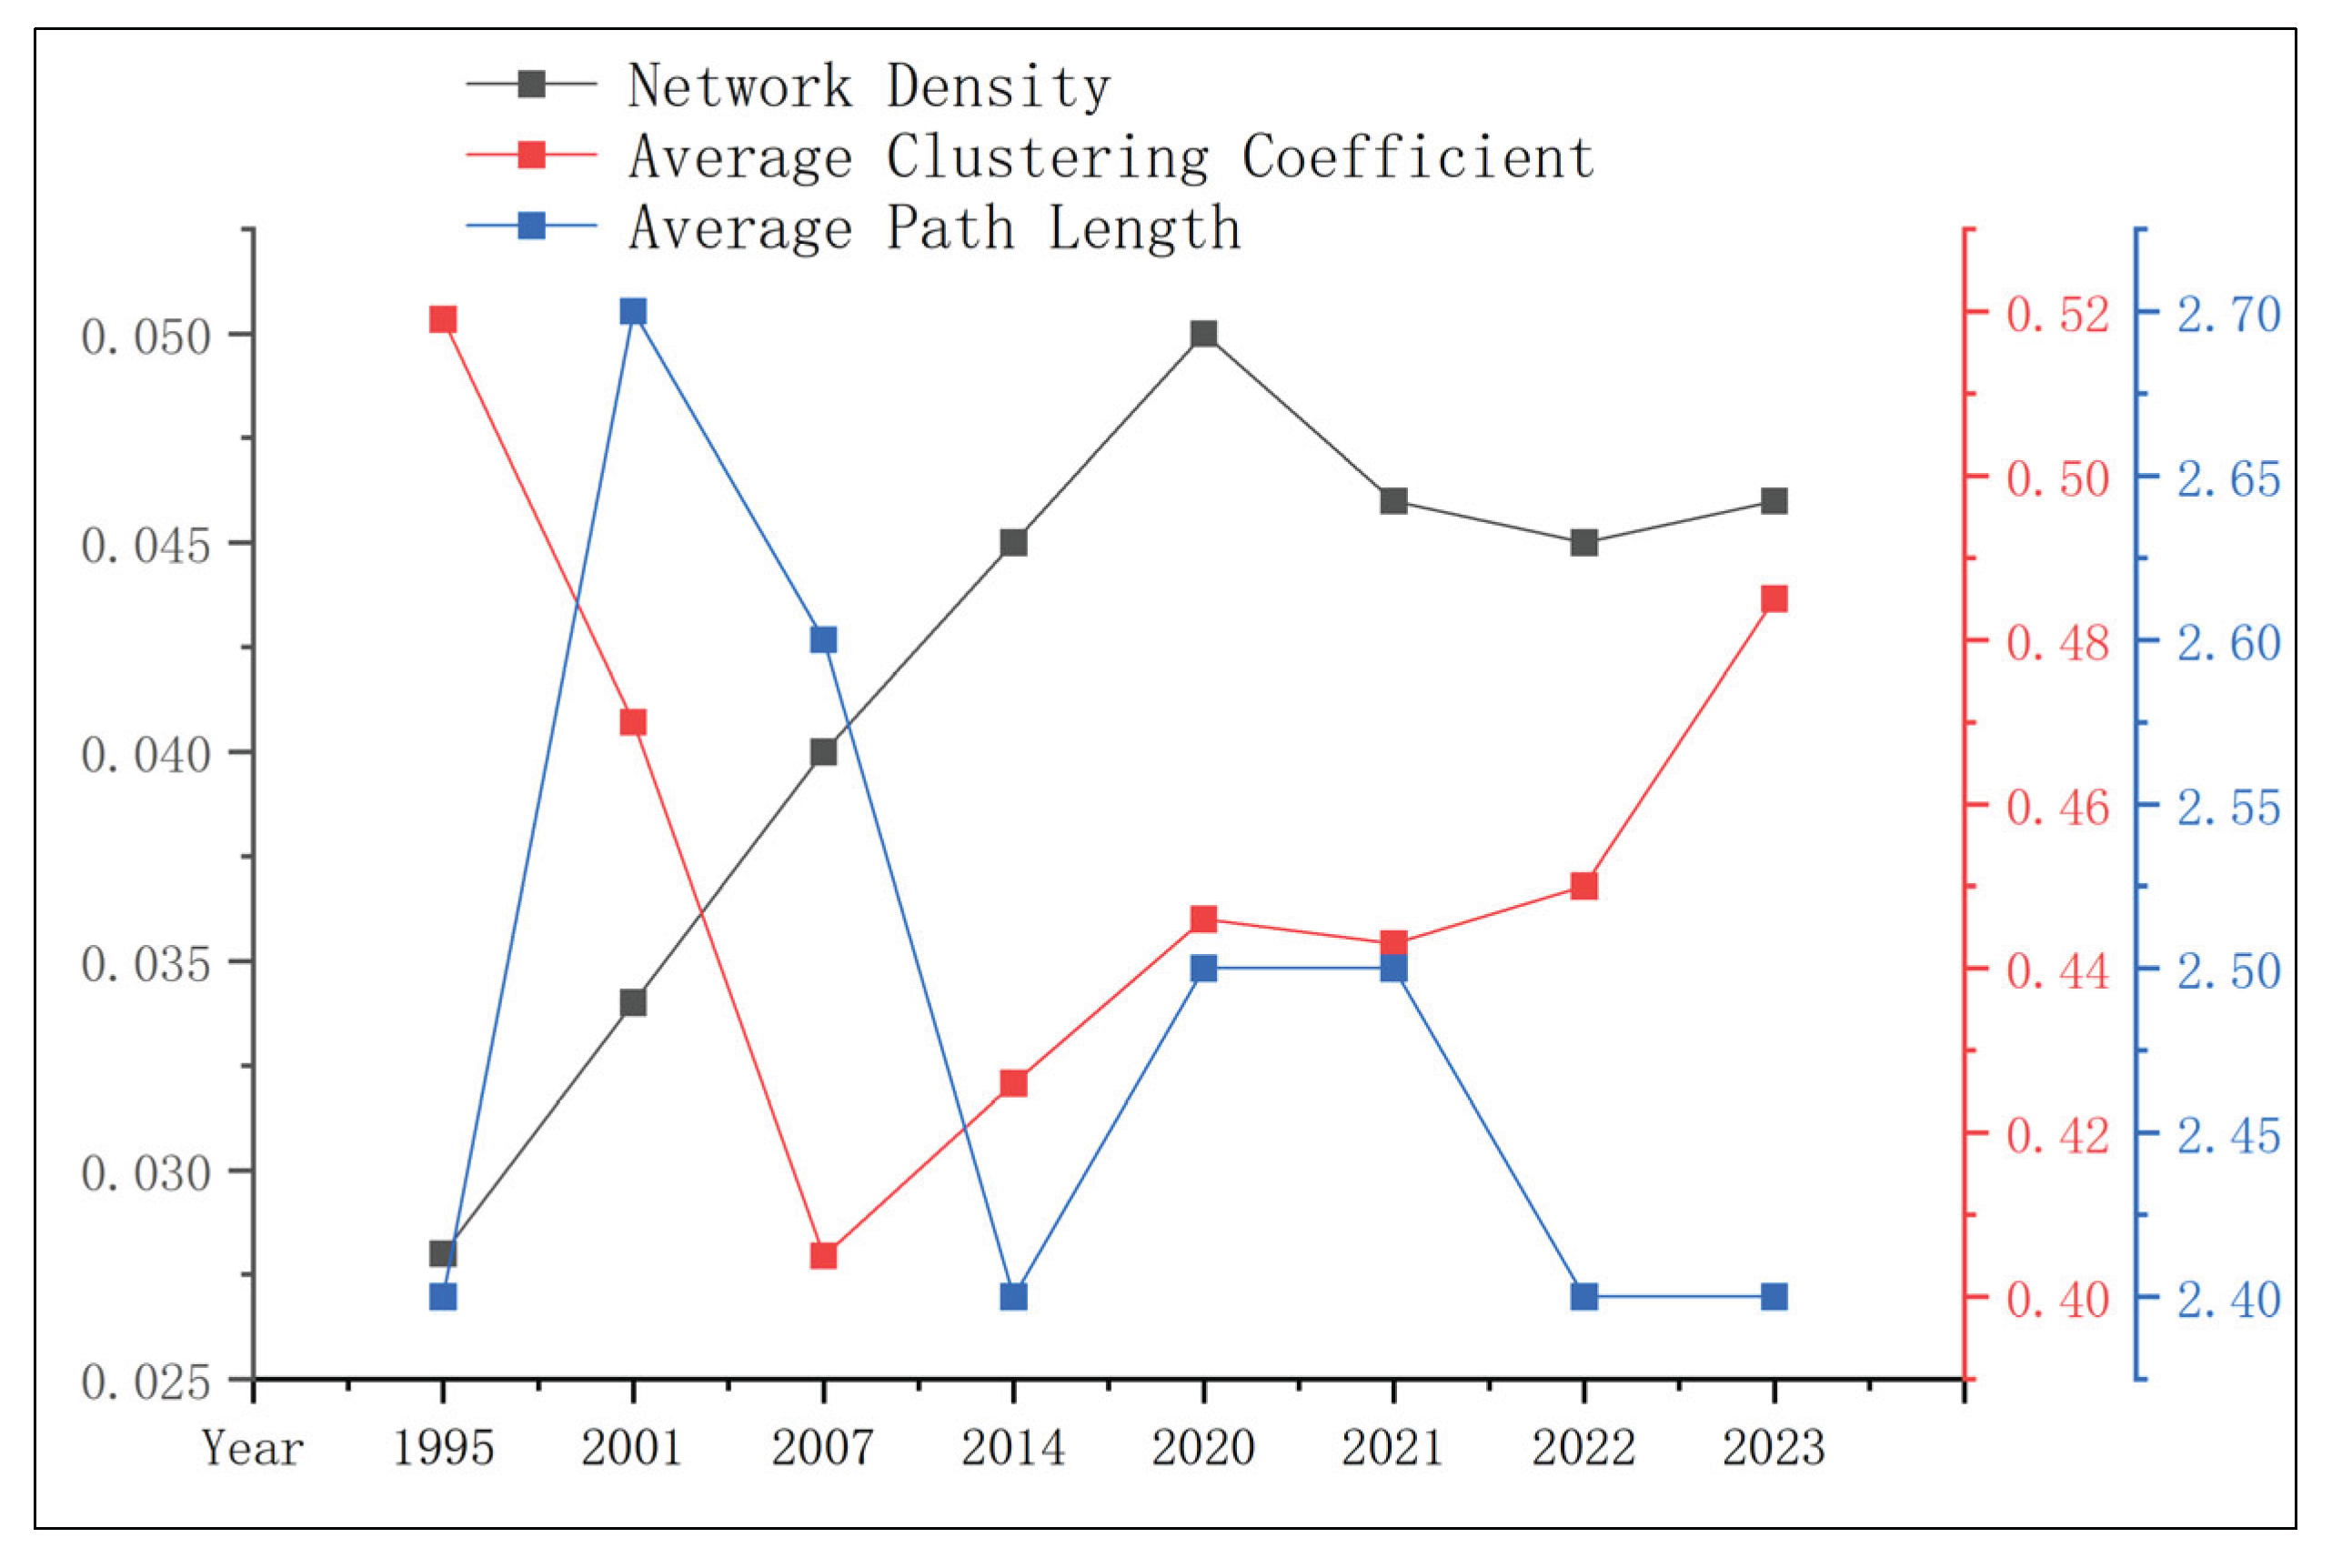
Figure 2.
Flow direction and intensity of virtual cropland associated with wheat trade for the top five countries ranked by out-degree relative centrality in 1995 and 2023.
Figure 2.
Flow direction and intensity of virtual cropland associated with wheat trade for the top five countries ranked by out-degree relative centrality in 1995 and 2023.
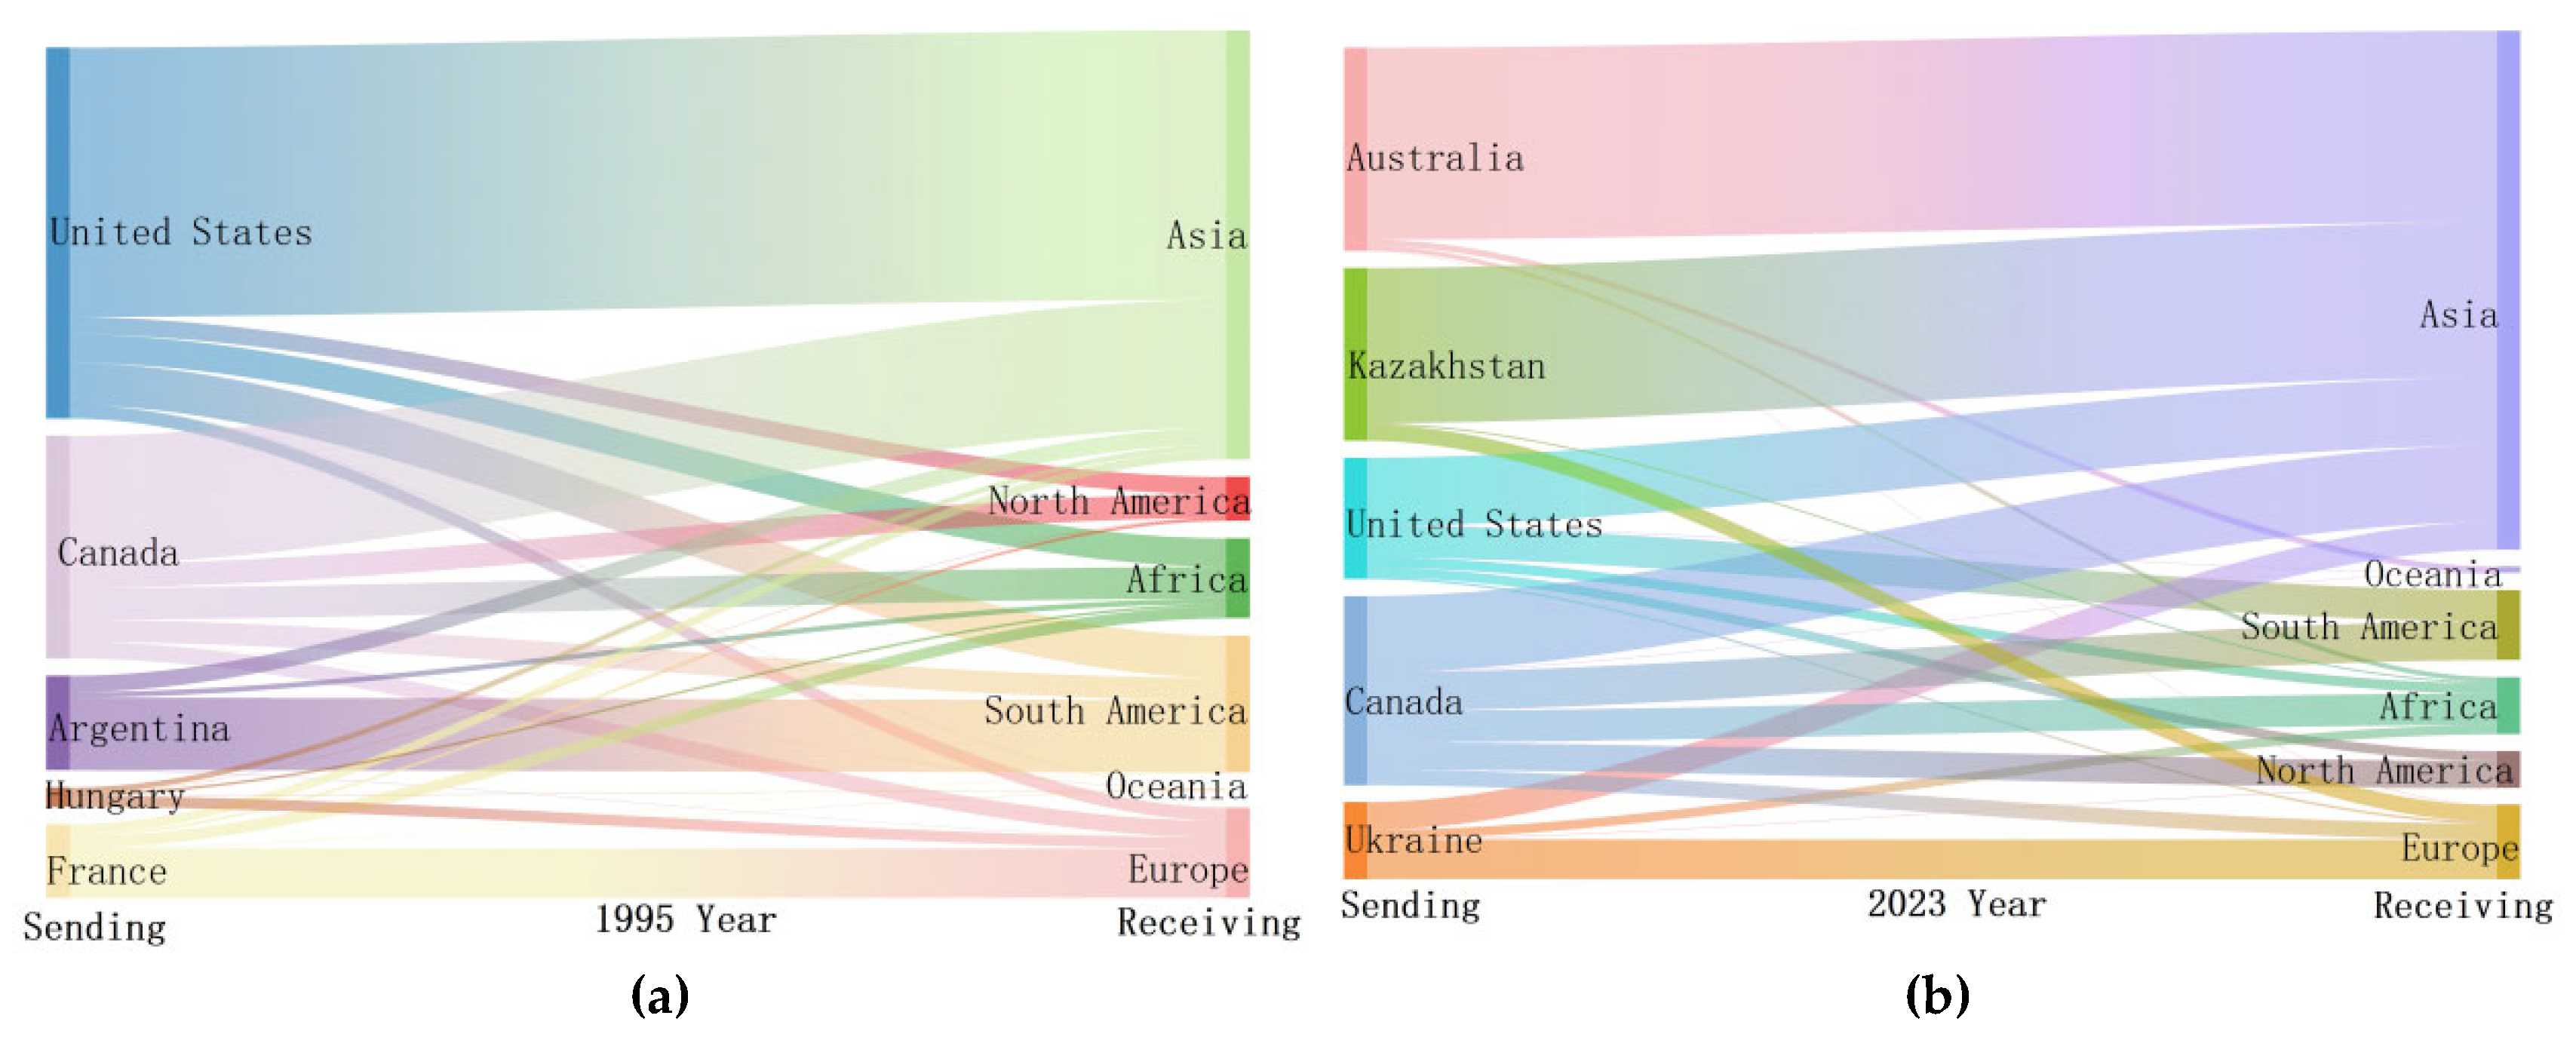
Figure 3.
Distribution of ranking for out-closeness and in-closeness centrality among trading countries, 1995-2023.
Figure 3.
Distribution of ranking for out-closeness and in-closeness centrality among trading countries, 1995-2023.
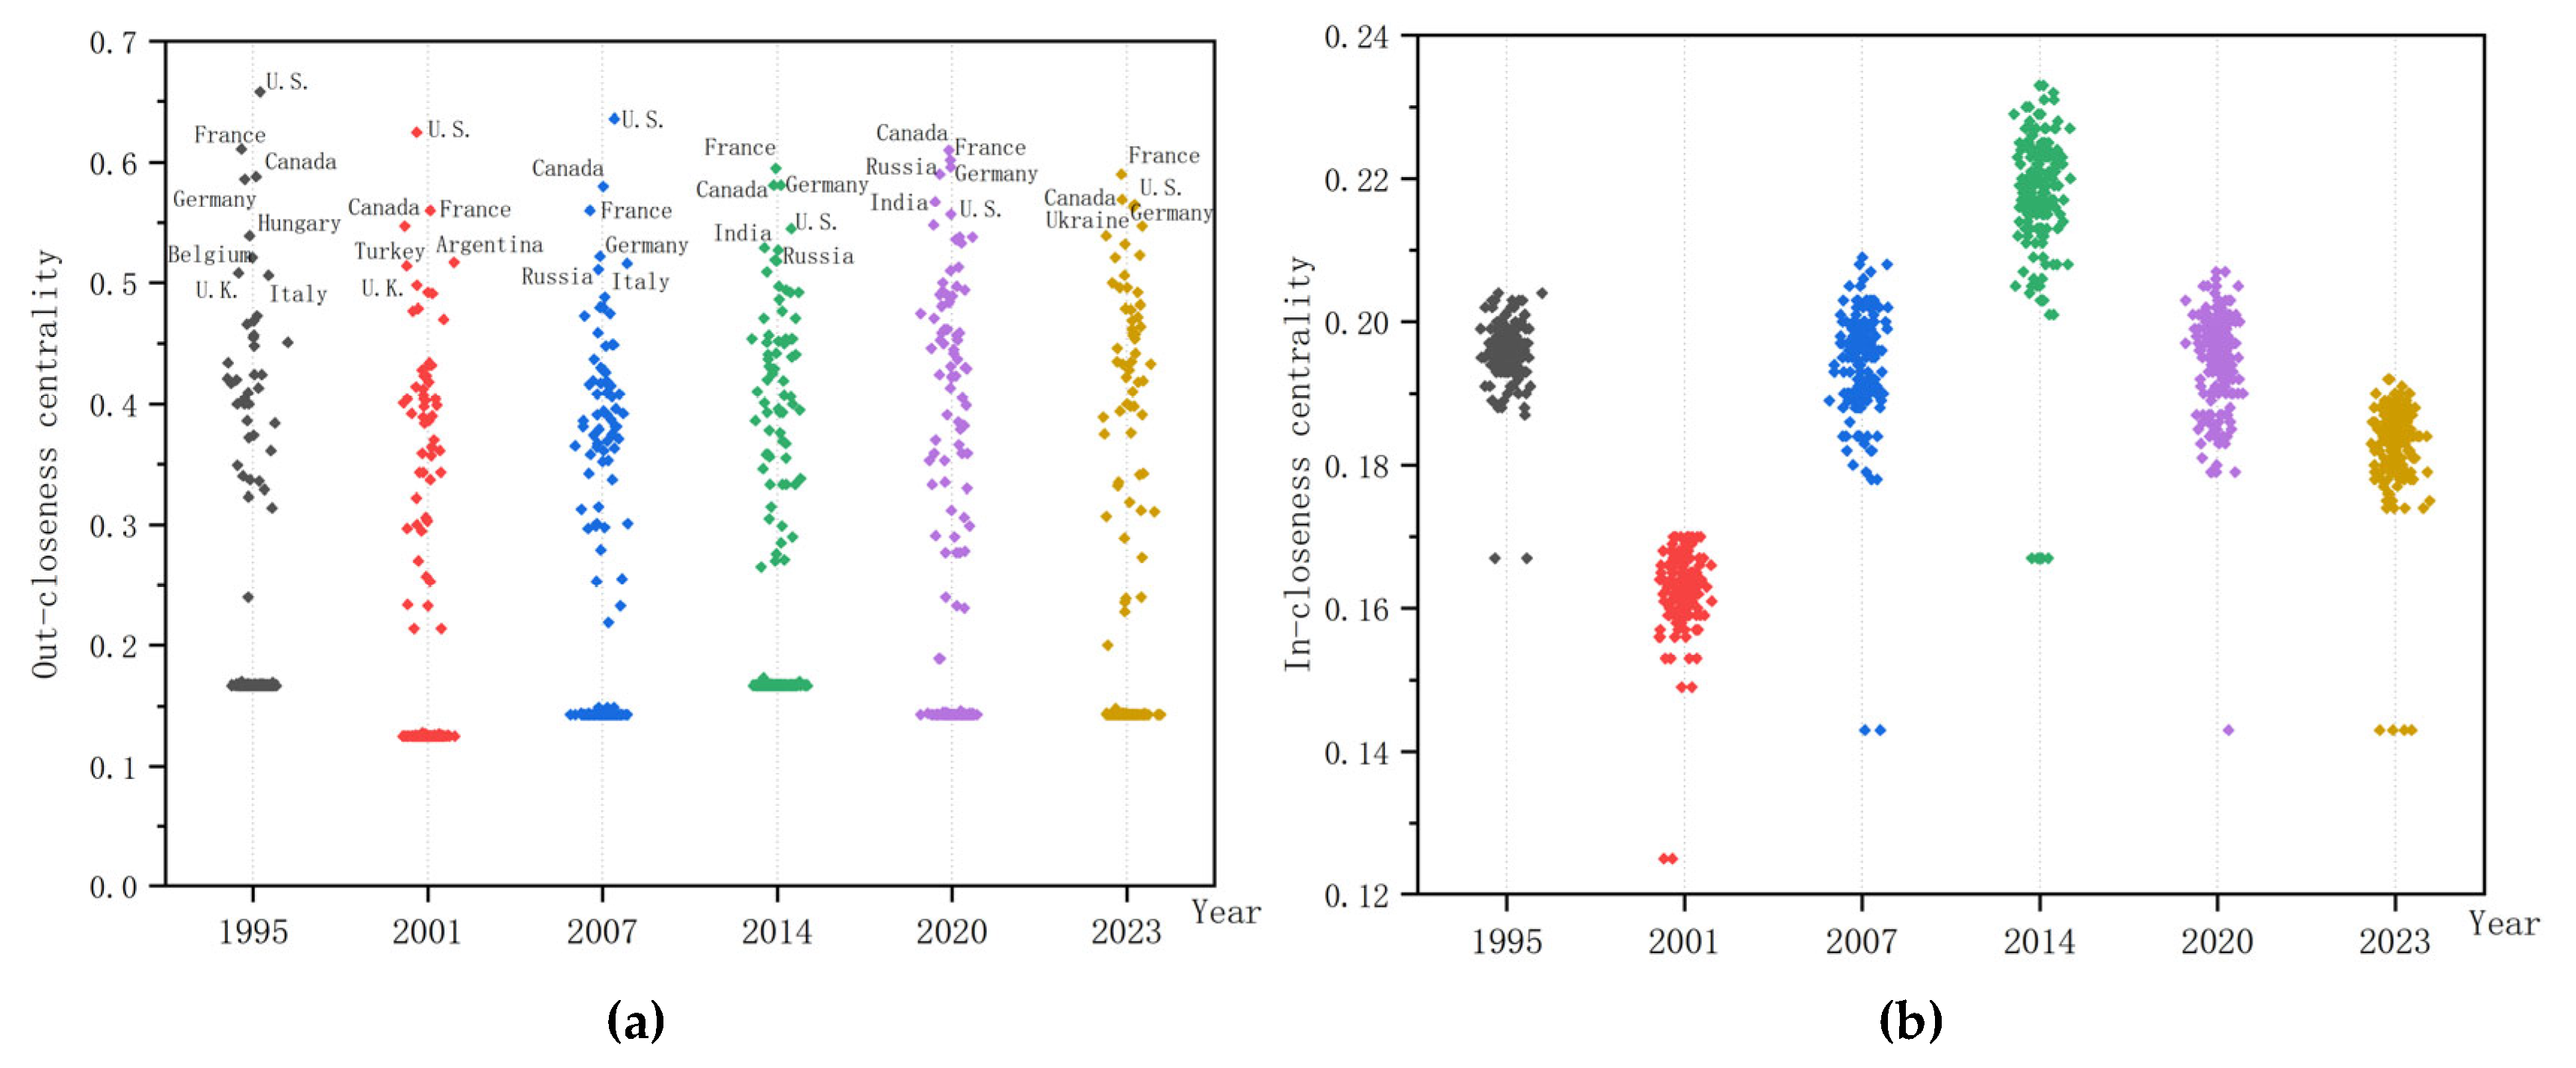
Figure 4.
Relationship between wheat harvested area and virtual cropland trade for trading countries in 2020.
Figure 4.
Relationship between wheat harvested area and virtual cropland trade for trading countries in 2020.
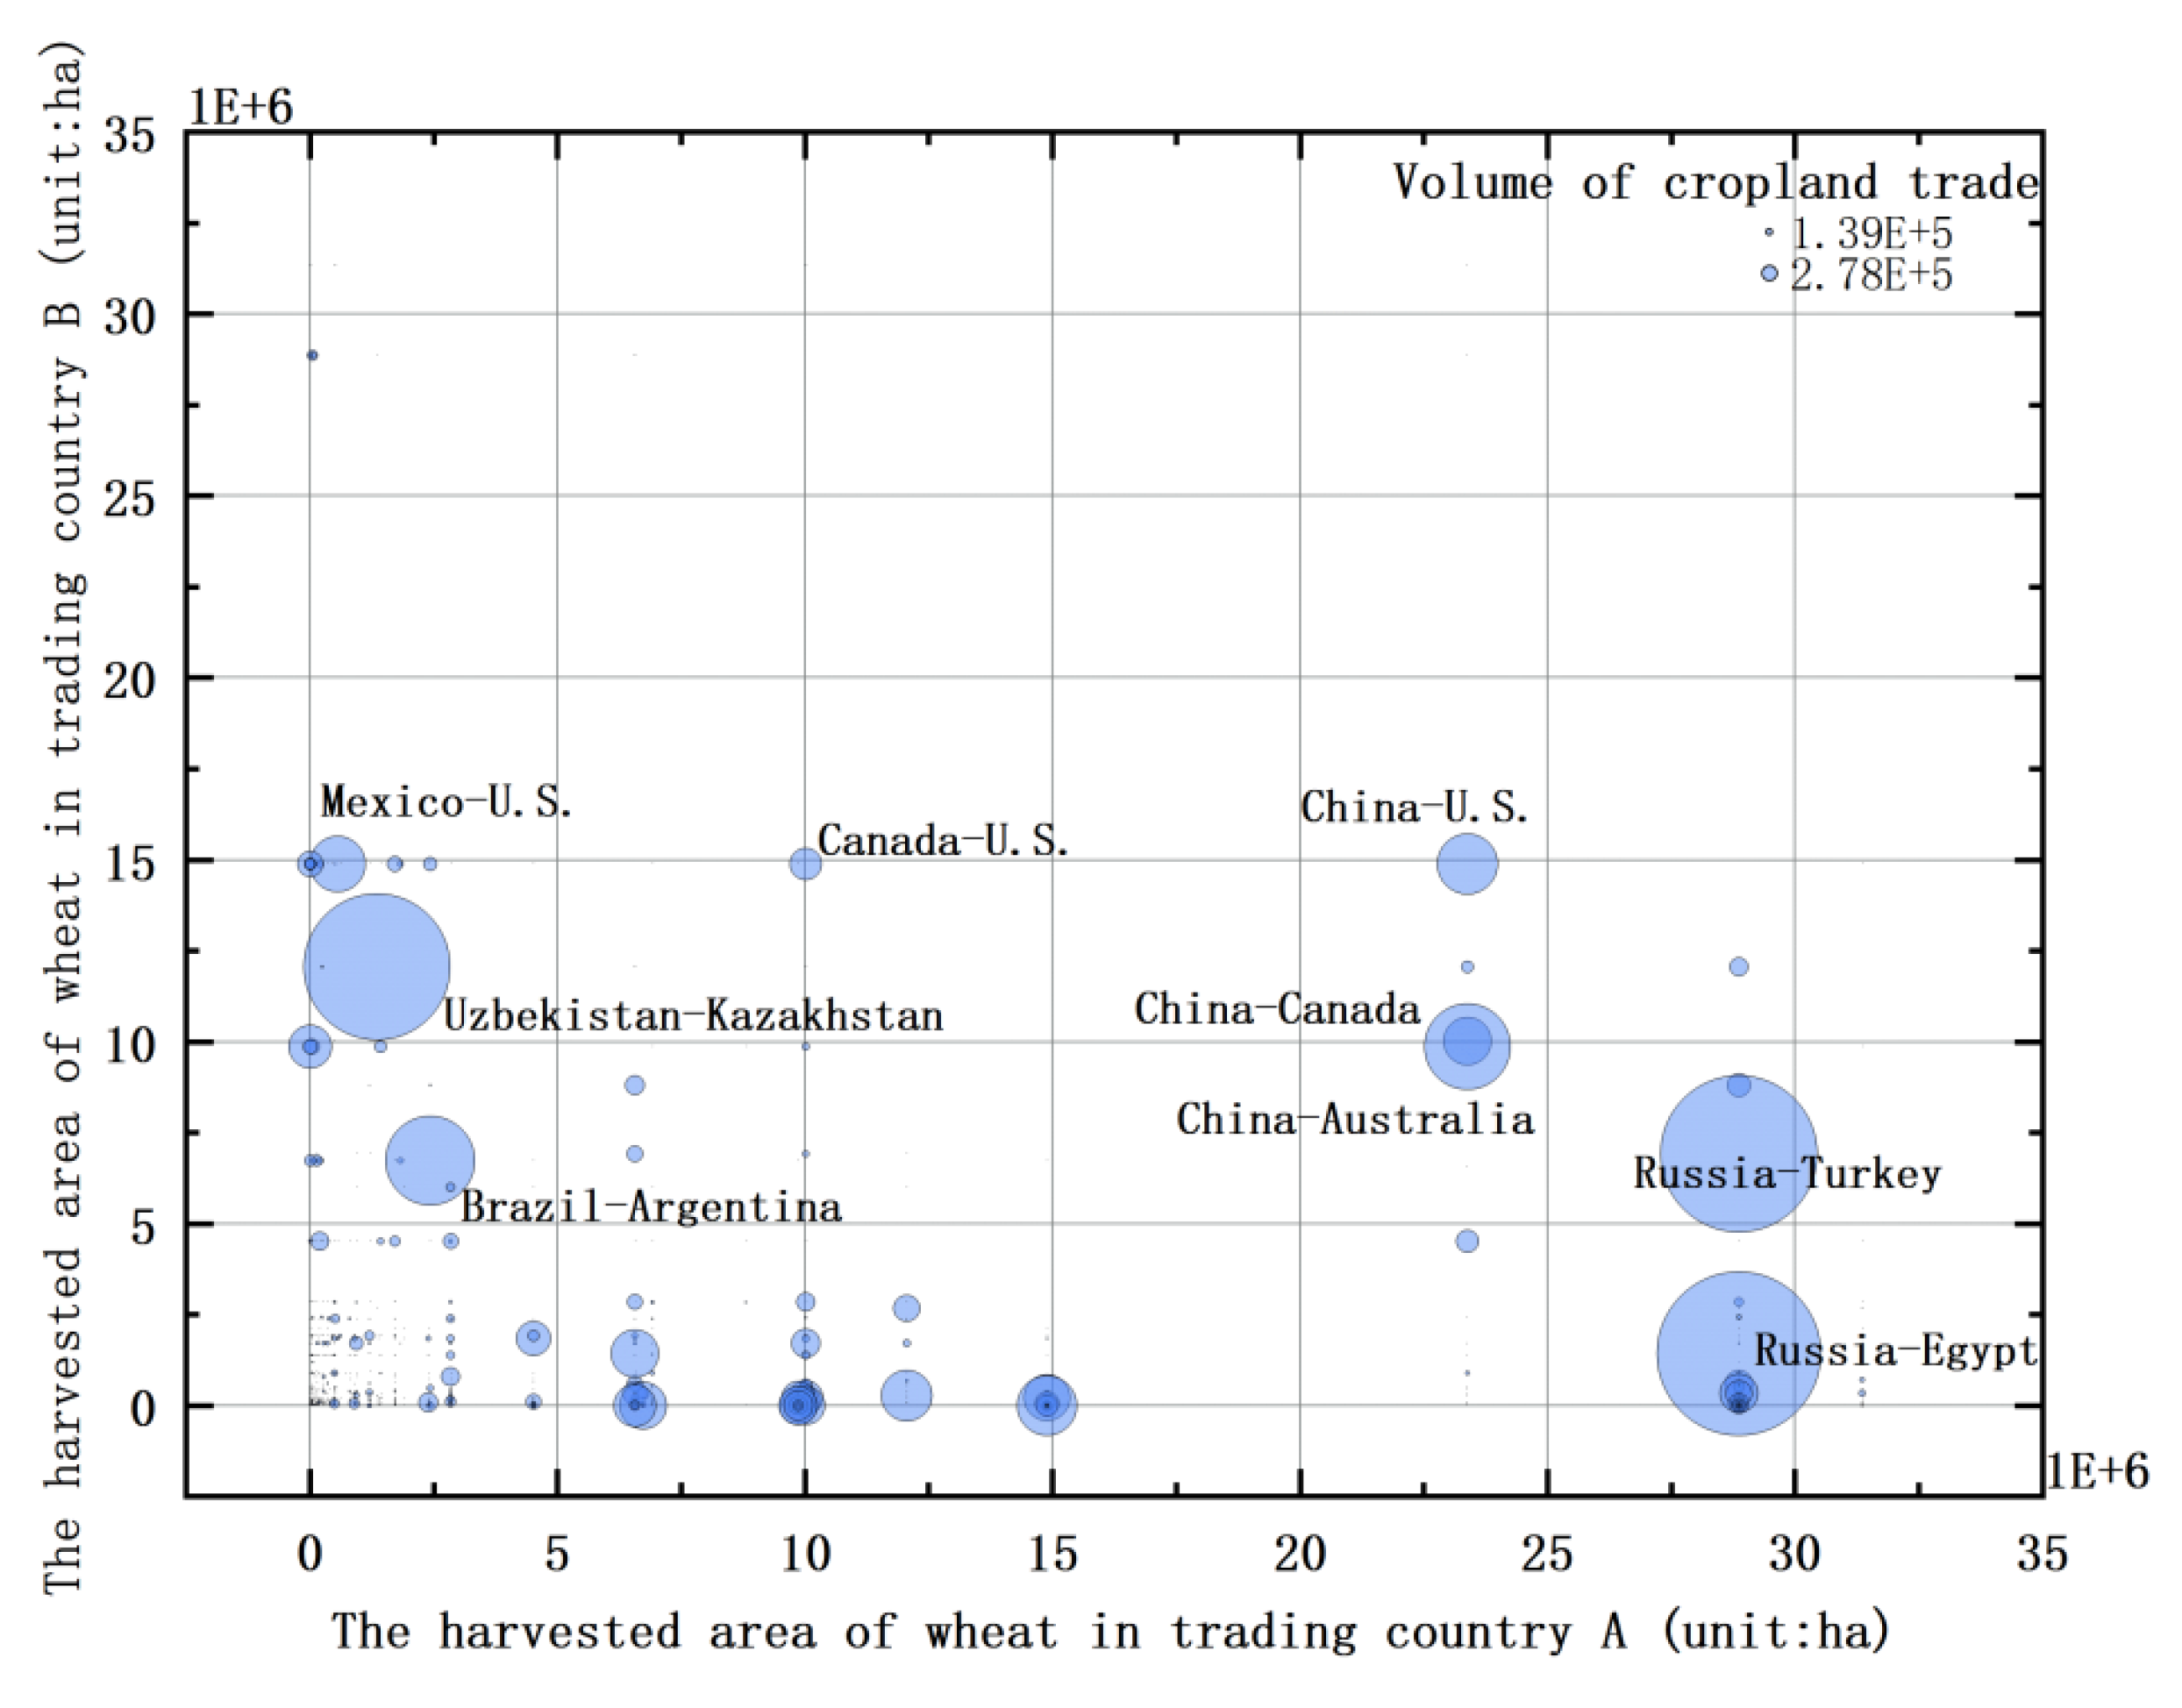
Figure 5.
Virtual cropland trade link distance and its proportion of total trade volume in international wheat trade, 1995-2023.
Figure 5.
Virtual cropland trade link distance and its proportion of total trade volume in international wheat trade, 1995-2023.
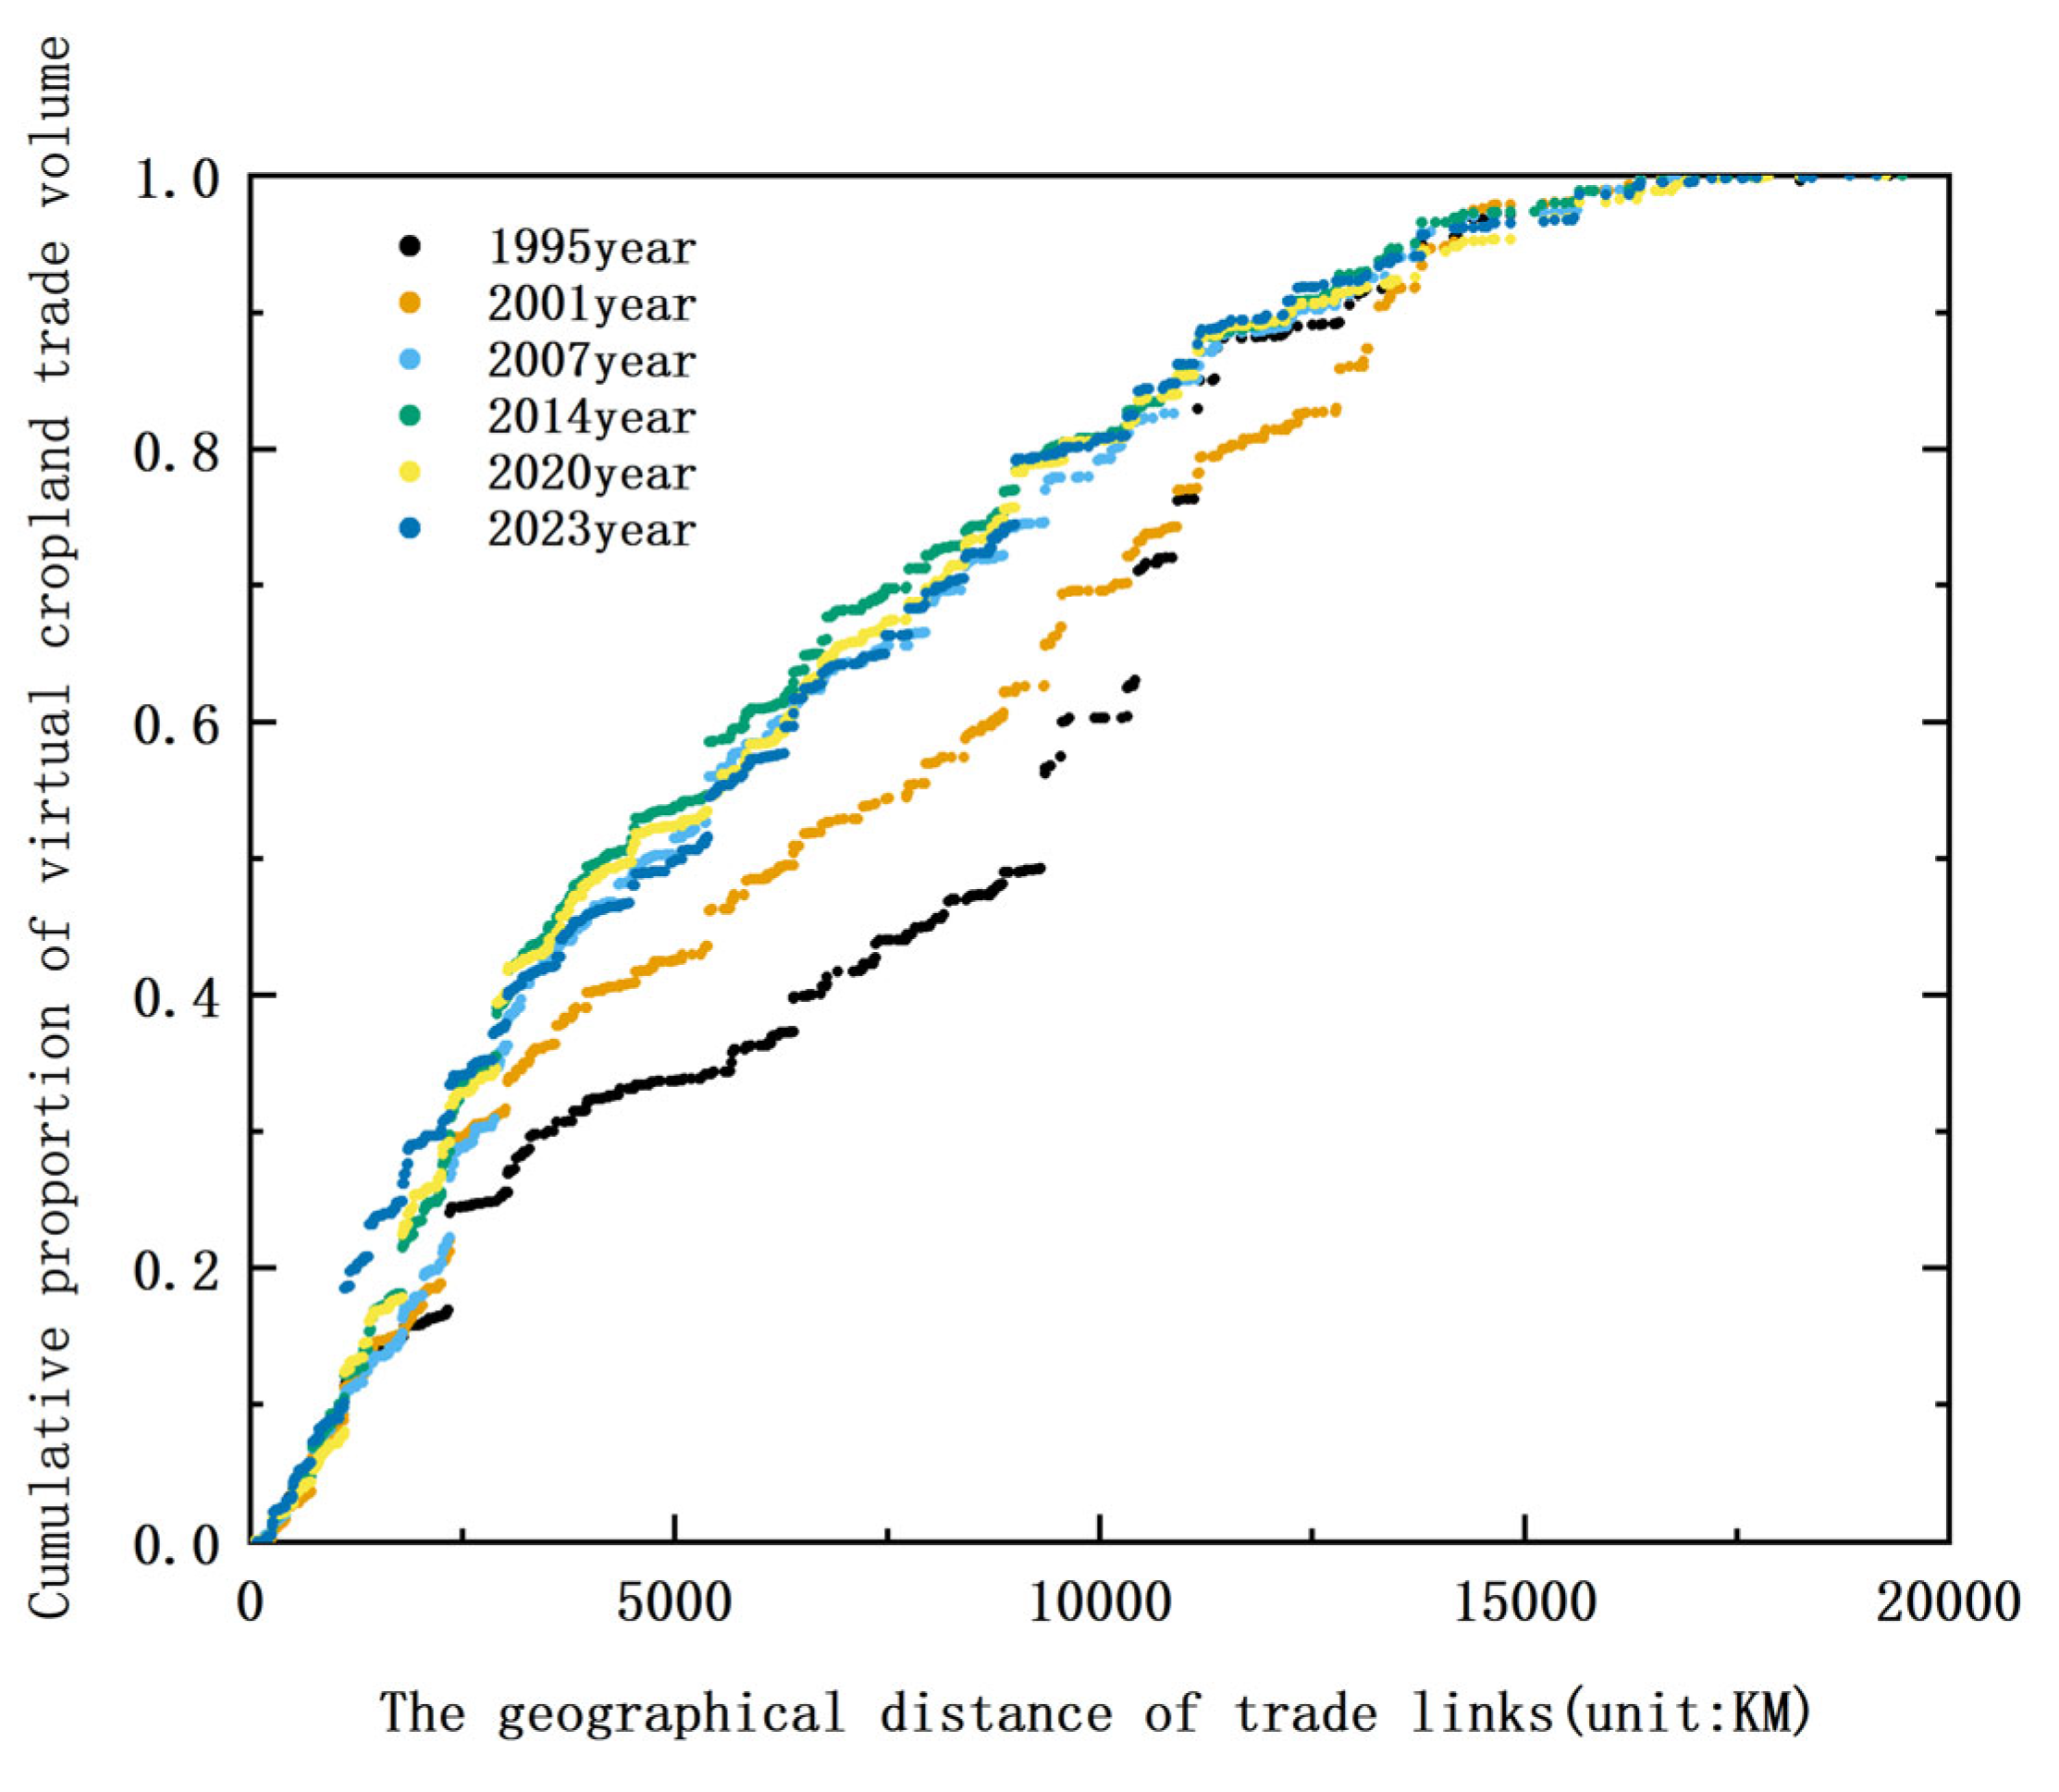
Figure 6.
Distribution of the increase in virtual cropland exports relative to changes in fertilizer application and wheat harvested area, 1995-2020.
Figure 6.
Distribution of the increase in virtual cropland exports relative to changes in fertilizer application and wheat harvested area, 1995-2020.
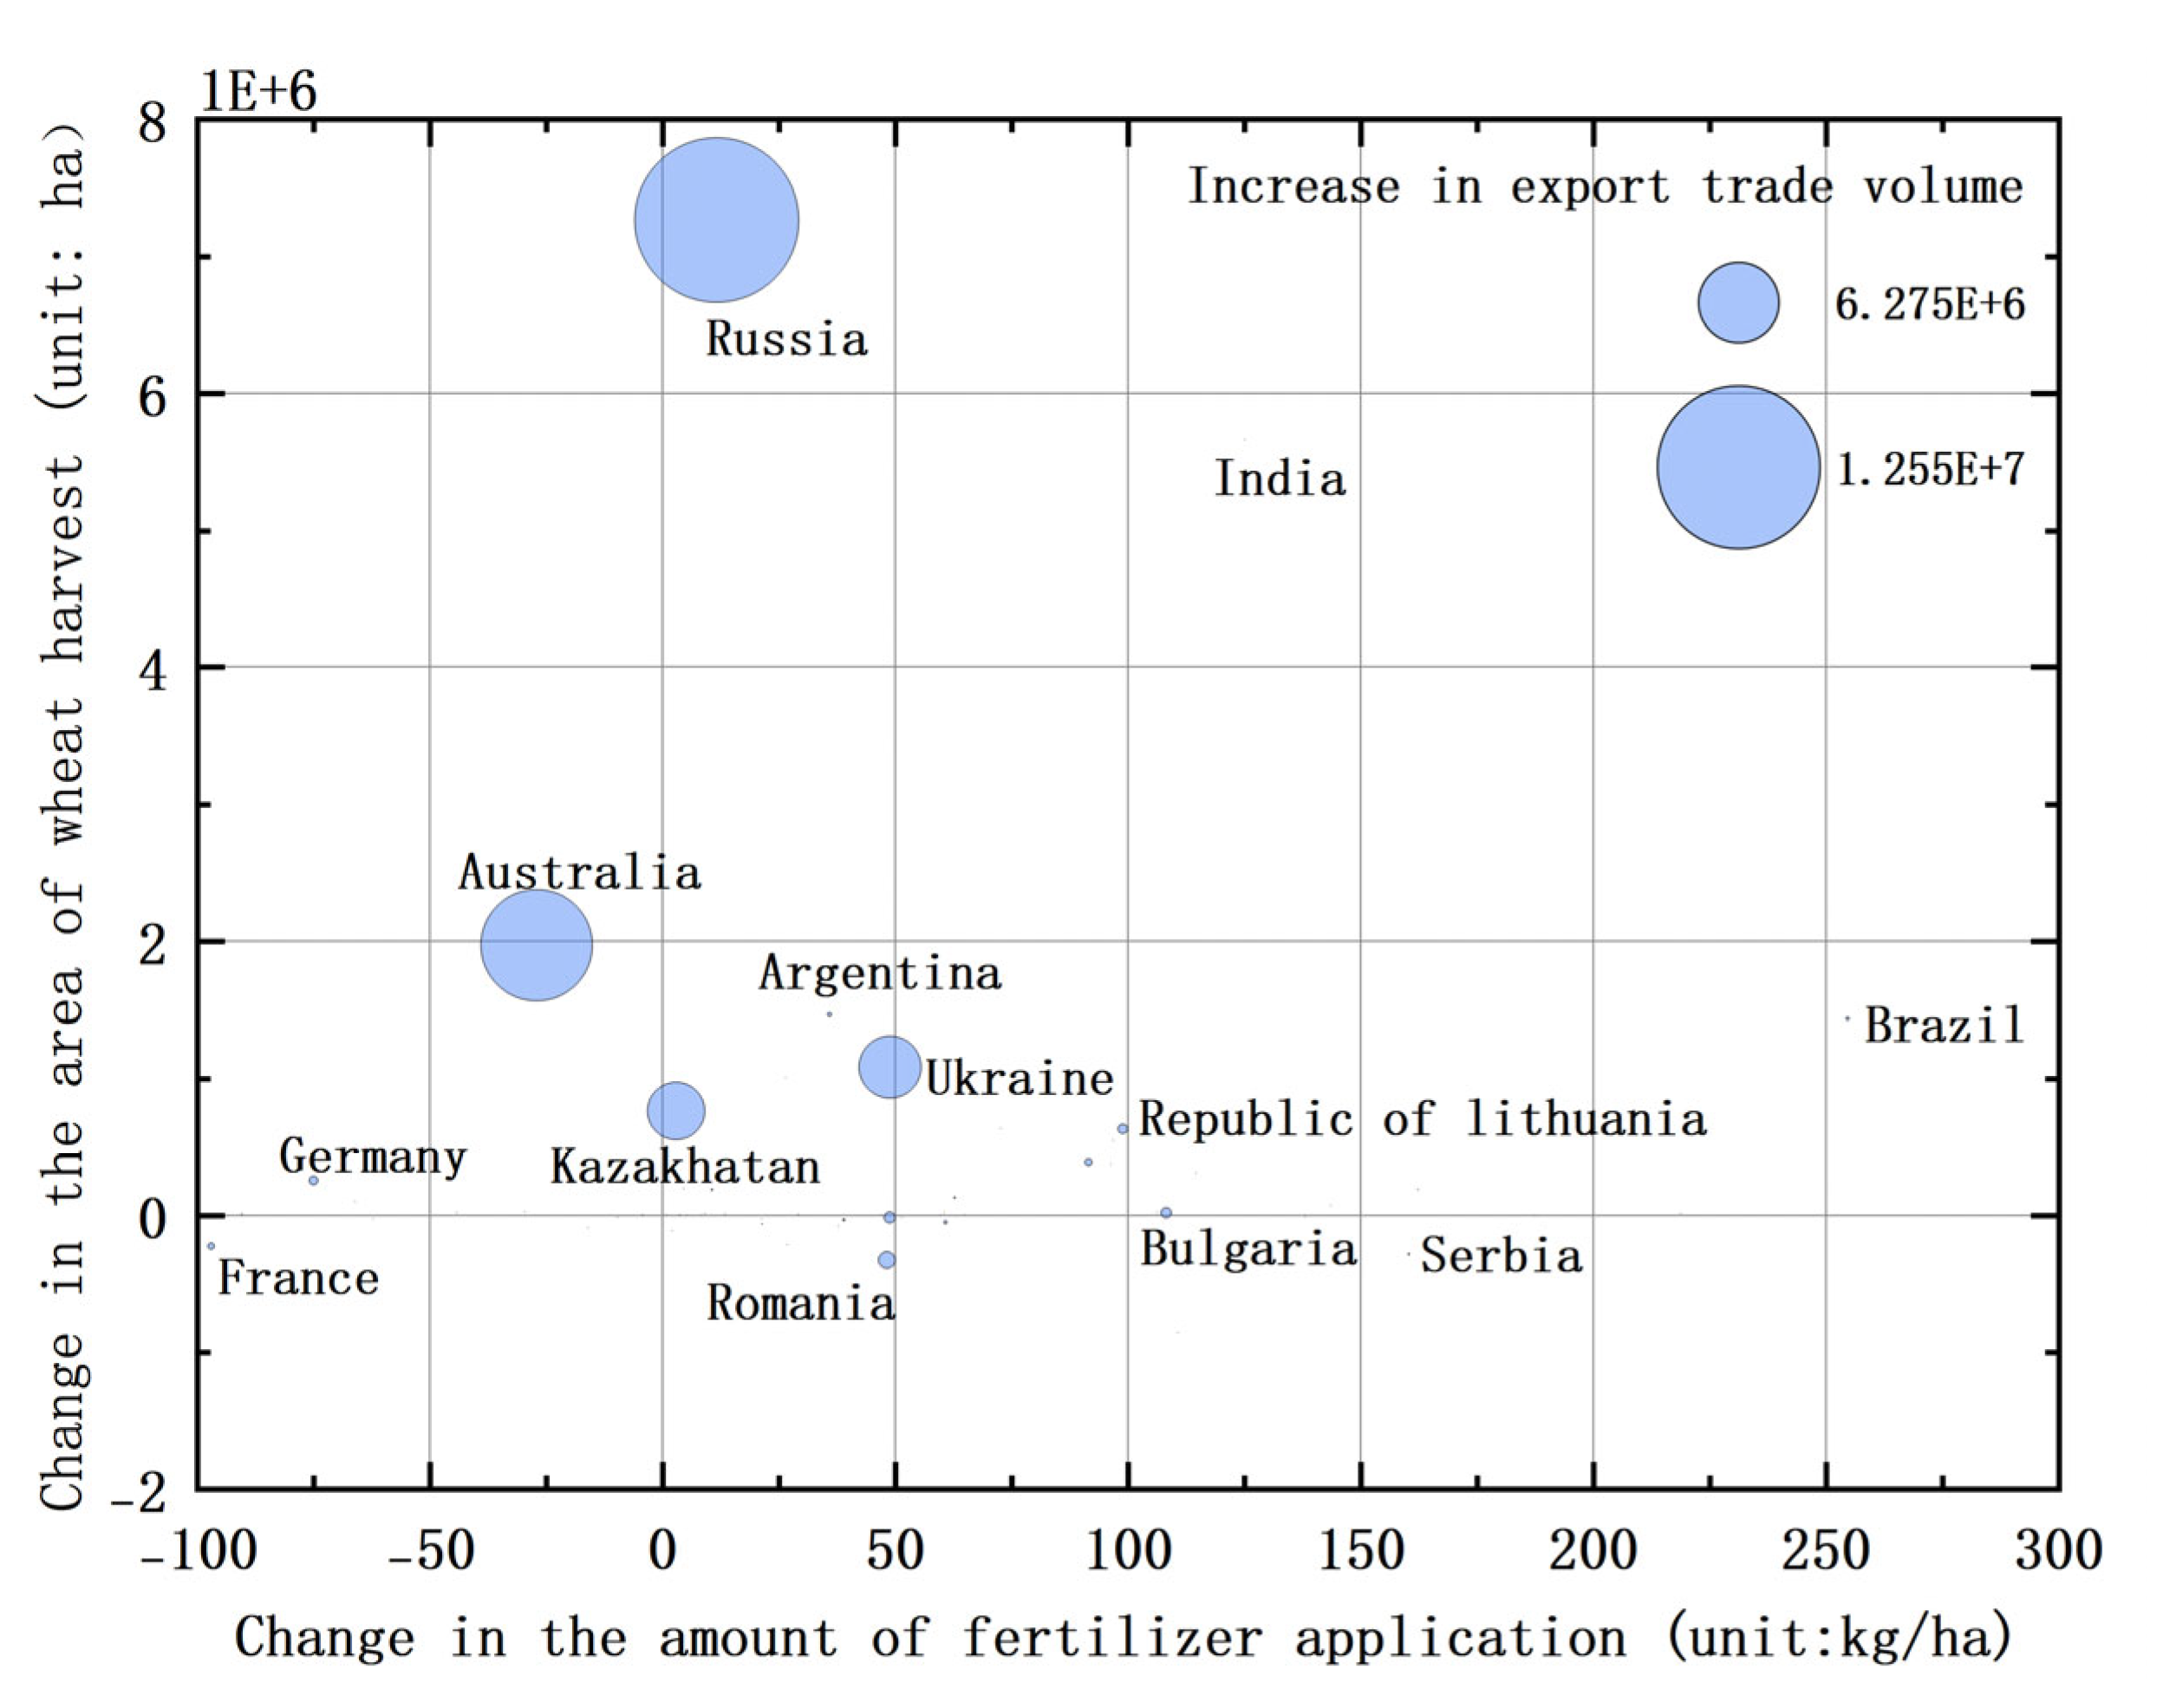

Table 1.
Overall network structure metrics.
| Indicator name | Indicator description | Expression |
|---|---|---|
| Network density (D) | The ratio of the actual number of trade connections in the network to the maximum possible number of connections. It measures the overall connectivity of a network. A higher density indicates more connections between nodes, reflecting more frequent trade interactions between countries. |
: number of actual trade links. : total number of nodes. |
| Average clustering coefficient (C) | The average clustering coefficient of all nodes in the network. The clustering coefficient of a node is defined as the ratio of the actual number of links between its neighbors to the maximum possible number of links. This reflects the extent to which neighboring nodes are clustered together. |
: number of neighbors of node . : number of actual links between the neighbors of node . |
| Average path length (L) | The average number of edges along the shortest paths for all possible pairs of nodes in the network. It indicates the efficiency of the connectivity between the nodes. |
: distance (shortest path length) between node and node . |
Table 2.
Node-level structural metrics.
| Indicator name | Indicator description | Expression |
|---|---|---|
| Relative degree centrality () | The number of nodes directly connected to a given node in the network. A higher value indicates a stronger ability of the node to form connections and a more central position in the network. |
: absolute degree centrality of node . |
| Relative closeness centrality () | Reflects how close a node is to all other nodes in the network and its ability to avoid being controlled by others. A higher value indicates greater independence and efficiency in reaching the other nodes. |
:distance (shortest path length) between node and node . |
| Betweenness centrality () | The proportion of all shortest paths between pairs of nodes in the network that pass through a given node. It reflects the role of the node as a bridge or intermediary in the network. |
: total number of shortest paths between node and node . :number of the shortest paths that pass through node . |
Table 3.
Description of independent variables.
| Criterion layer | Element layer | Variables name | Variables description | Matrix processing | Expected effect | Data source |
| Complementarity | Demand factors | Economic level (G) | Gross domestic product | Difference matrix | + | World Bank database |
| Foreign wheat demand (N) | Wheat self-sufficiency rate | Difference matrix | + | FAO database | ||
| Consumption structure (S) | Total domestic wheat demand/ Total domestic population | Difference matrix | + | World Bank database | ||
| Supply factors | Wheat planting area (A) | Percentage of wheat harvested area to total arable land | Difference matrix | + | FAO database | |
| Wheat yield (O) | Difference in yield per unit area | Difference matrix | + | FAO database | ||
| Renewable freshwater (F) | Per capita available productive inland freshwater resources | Difference matrix | + | World Bank database | ||
| Accessibility | Distance factors | National distance (D) | Spherical distance between national capitals | Multi-value matrix | - | CEPII database |
| Contiguity (C) | Whether territories are adjacent | Binary matrix | + | CEPII database | ||
| Convenience factors | Governance level (P) | Worldwide governance indicators | Difference matrix | - | World Bank database | |
| WTO membership (W) | Whether both are WTO members | Binary matrix | + | WTO official website |
Table 4.
Top 10 countries by relative degree centrality (1995-2023).
| Year | 1 | 2 | 3 | 4 | 5 | 6 | 7 | 8 | 9 | 10 | |
| 1995 | Out | U.S. | Canada | Argentina | France | Hungary | Czech Republic | Germany | U.K. | India | Romania |
| Input | China | Brazil | Egypt | Japan | Italy | Algeria | Pakistan | Belgium | South Korea | U.S. | |
| 2001 | Out | U.S. | Canada | Australia | Kazakhstan | France | Germany | Russia | India | Spain | U.K. |
| Input | Iran | Japan | Brazil | Egypt | Italy | Indonesia | Mexico | Philippines | China | Russia | |
| 2007 | Out | U.S. | Canada | Australia | Russia | Kazakhstan | France | India | Germany | Romania | Argentina |
| Input | Egypt | Japan | Indonesia | Brazil | Italy | South Korea | India | Mexico | Yemen | Turkey | |
| 2014 | Out | Australia | Russia | U.S. | Canada | Kazakhstan | France | India | Germany | Romania | Argentina |
| Input | Indonesia | Egypt | Iran | Turkey | Japan | Brazil | Italy | Nigeria | China | Mexico | |
| 2020 | Out | Russia | Australia | U.S. | Canada | Ukraine | Kazakhstan | Egypt | Argentina | France | Romania |
| Input | China | Egypt | Indonesia | Turkey | Philippines | Uzbekistan | Italy | Japan | Brazil | Bangladesh | |
| 2023 | Out | Australia | Canada | Kazakhstan | U.S. | Ukraine | Romania | France | Argentina | Brazil | Bulgaria |
| Input | China | Uzbekistan | Indonesia | Italy | Philippines | Spain | Mexico | Brazil | Morocco | Thailand |
Table 5.
Top 10 countries by betweenness centrality (1995-2023).
| Year | 1 | 2 | 3 | 4 | 5 | 6 | 7 | 8 | 9 | 10 |
| 1995 | U.S. 7.930 |
France 4.559 |
Germany 4.271 |
Netherlands 2.409 |
U.K. 2.025 |
Italy 1.688 |
Spain 1.657 |
Belgium 1.083 |
Denmark 0.877 |
Canada 0.874 |
| 2001 | U.S. 8.392 |
France 6.162 |
Germany 4.740 |
Canada 4.185 |
Argentina 3.940 |
Australia 3.565 |
U.K. 3.063 |
Russia 2.711 |
Japan 2.612 |
Turkey 2.604 |
| 2007 | U.S. 11.072 |
France 7.573 |
Germany 4.396 |
Italy 4.235 |
Russia 4.119 |
Ukraine 3.120 |
U.K. 2.863 |
Canada 2.822 |
China 1.902 |
Australia 1.876 |
| 2014 | U.S. 8.117 |
France 4.484 |
Germany 4.400 |
Canada 4.369 |
U.K. 3.244 |
Italy 2.925 |
India 2.301 |
Russia 2.087 |
South Africa 1.495 |
China 1.256 |
| 2020 | U.S. 8.376 |
France 6.552 |
Germany 4.768 |
U.K. 3.896 |
Kenya 3.416 |
South Africa 3.201 |
Canada 3.016 |
Russia 2.950 |
Uganda 2.456 |
Italy 2.139 |
| 2023 | France 5.511 |
Kenya 3.869 |
U.S. 3.811 |
France 3.484 |
U.K. 3.191 |
Canada 2.026 |
South Africa 1.914 |
Brazil 1.891 |
Australia 1.719 |
Tanzania 1.567 |
Table 6.
Regression results of the unweighted trade network.
| Variable | 1995 Year | 2001 Year | 2007 Year | 2014 Year | 2020 Year | 2023 Year | |
|---|---|---|---|---|---|---|---|
| Demand factors | G | 0.2664*** (0.001) |
0.2324*** (0.001) |
0.2132*** (0.001) |
0.1936*** (0.001) |
0.1726*** (0.001) |
0.1749*** (0.001) |
| N | 0.1582*** (0.001) |
0.2663*** (0.001) |
0.2054*** (0.001) |
0.2471*** (0.001) |
0.2234*** (0.001) |
0.1760*** (0.001) |
|
| S | 0.0901*** (0.009) |
0.0251 (0.199) |
0.0947*** (0.007) |
0.0246 (0.208) |
0.0591** (0.048) |
0.0909*** (0.007) |
|
| Supply factors | A | -0.0905*** (0.001) |
-0.0580*** (0.005) |
-0.0332* (0.074) |
-0.0845*** (0.001) |
-0.0873*** (0.001) |
-0.0644** (0.011) |
| O | 0.0724** (0.012) |
0.0764*** (0.002) |
0.0491** (0.027) |
0.0664** (0.022) |
0.0164 (0.266) |
0.0150 (0.3133) |
|
| F | 0.0746** (0.033) |
0.0358 (0.147) |
0.0224 (0.214) |
0.0653* (0.051) |
0.0971** (0.012) |
0.0777** (0.035) |
|
| Distance factors | D | -0.2105*** (0.001) |
-0.2096*** (0.001) |
-0.2876*** (0.001) |
-0.266*** (0.001) |
-0.2533*** (0.001) |
-0.2422*** (0.001) |
| C | 0.1685*** (0.001) |
0.1891*** (0.001) |
0.1306*** (0.001) |
0.1560*** (0.001) |
0.1626*** (0.001) |
0.1408*** (0.001) |
|
| Convenience factors | P | -0.0606*** (0.005) |
-0.0833*** (0.001) |
-0.0844*** (0.001) |
-0.0905*** (0.001) |
-0.0912*** (0.001) |
-0.0706*** (0.002) |
| W | 0.1076*** (0.002) |
0.0425* (0.077) |
0.0109 (0.393) |
0.0799** (0.013) |
0.0914*** (0.006) |
0.1138*** (0.001) |
|
| R2 | 0.1859 | 0.2105 | 0.2158 | 0.2040 | 0.1948 | 0.1631 | |
| Adj-R2 | 0.1853 | 0.2099 | 0.2152 | 0.2034 | 0.1942 | 0.1625 |
1 Note: Values reported are standardized regression coefficients, with significance levels in parentheses; *, **, *** indicate statistical significance at the 0.1, 0.05, and 0,01 levels, respectively; the constant term is 0 for all models. The same applies to the table below as well.
Table 7.
Regression results of the weighted trade network.
| Variable | 1995 Year | 2001 Year | 2007 Year | 2014 Year | 2020 Year | 2023 Year | |
|---|---|---|---|---|---|---|---|
| Demand factors | G | 0.1579*** (0.002) |
0.1294*** (0.003) |
0.1796*** (0.001) |
0.1354*** (0.001) |
0.0855** (0.012) |
0.0849** (0.012) |
| N | 0.0644** (0.017) |
0.1992*** (0.001) |
0.1406*** (0.001) |
0.1390*** (0.001) |
0.0762*** (0.008) |
0.0600** (0.018) |
|
| S | 0.0131 (0.205) |
-0.0010 (0.520) |
0.0158 (0.160) |
-0.0013 (0.513) |
0.0323* (0.053) |
0.0300* (0.065) |
|
| Supply factors | A | -0.0219 (0.103) |
-0.0052 (0.360) |
0.0239* (0.071) |
0.0036 (0.396) |
-0.0187 (0.144) |
-0.0040 (0.413) |
| O | -0.0290** (0.039) |
-0.0185 (0.104) |
0.0062 (0.353) |
-0.0257* (0.098) |
-0.0164 (0.169) |
-0.0013 (0.474) |
|
| F | 0.0528** (0.025) |
0.0234* (0.083) |
0.0362** (0.042) |
0.0539** (0.022) |
0.0575** (0.025) |
0.0366* (0.057) |
|
| Distance factors | D | -0.0317** (0.029) |
-0.0331** (0.012) |
-0.0753*** (0.001) |
-0.0688*** (0.001) |
-0.0459*** (0.007) |
-0.0256* (0.073) |
| C | 0.0643*** (0.001) |
0.1084*** (0.001) |
0.0829*** (0.001) |
0.1067*** (0.001) |
0.0906*** (0.001) |
0.1211*** (0.001) |
|
| Convenience factors | P | 0.0047 (0.380) |
-0.0044 (0.401) |
-0.0405*** (0.004) |
-0.0116 (0.255) |
-0.0316** (0.024) |
-0.0010 (0.278) |
| W | 0.0193 (0.141) |
-0.0000 (0.499) |
-0.0326** (0.034) |
0.0032 (0.460) |
0.0200 (0.177) |
0.0082 (0.367) |
|
| R2 | 0.0373 | 0.0747 | 0.0751 | 0.0573 | 0.0282 | 0.0278 | |
| Adj-R2 | 0.0366 | 0.0739 | 0.0744 | 0.0566 | 0.0274 | 0.0271 |
(1) Demand factors constitute a key driver of virtual cropland flows.
Disclaimer/Publisher’s Note: The statements, opinions and data contained in all publications are solely those of the individual author(s) and contributor(s) and not of MDPI and/or the editor(s). MDPI and/or the editor(s) disclaim responsibility for any injury to people or property resulting from any ideas, methods, instructions or products referred to in the content. |
© 2026 by the authors. Licensee MDPI, Basel, Switzerland. This article is an open access article distributed under the terms and conditions of the Creative Commons Attribution (CC BY) license (http://creativecommons.org/licenses/by/4.0/).
Copyright: This open access article is published under a Creative Commons CC BY 4.0 license, which permit the free download, distribution, and reuse, provided that the author and preprint are cited in any reuse.


