
Submitted:
27 February 2025
Posted:
27 February 2025
You are already at the latest version
Abstract
Against the backdrop of rapid advancements in information technology, the complex network characteristics of agricultural product trade relationships among global economies have exhibited increasing prominence. This study takes the soybean trade market as an empirical case, employing a combination of social network analysis to investigate the dynamic evolution of agricultural trade network structures; then, the Temporal Exponential Random Graph Model (TERGM) is adopted to analyze the factors influencing the soybean trade network. Based on comprehensive empirical data encompassing soybean trade data among 126 economies from 2000 to 2022, this research demonstrates several key findings: Firstly, the soybean trade network is characterized by pronounced trade agglomeration effects and "small-world" properties, accompanied by heightened trade substitutability. Secondly, the network's structural configuration has undergone a distinct transformation, shifting from a traditional single-core-periphery structure to a more complex multi-core-periphery architecture. Thirdly, in response to external shocks impacting network topology, the core structure exhibits greater resilience and stability, whereas the periphery displays heterogeneous responses. Finally, the evolution of soybean trade relations is governed by a dual mechanism involving both endogenous dynamics and exogenous influences.
Keywords:
agricultural trade network structure
; dynamic evolution
; influencing factors
; social network analysis
; the Temporal Exponential Random Graph Model
1. Introduction
The rapid advancement of information technology has profoundly reshaped global agricultural trade patterns. Online e-commerce has broken geographical barriers, enabling direct access to global consumers for agricultural products. Agricultural futures now utilize information technology for precise price forecasting and efficient risk management. Digital cold chain logistics and traceability systems enhance product quality and transportation efficiency. However, these developments have intensified trade complexity, with increased participating countries/regions, rapidly changing market information, and multifaceted influencing factors. Among agricultural products, the soybean market stands as a representative case. Soybeans, as a vital global source of edible oil and protein, directly impact food security. Research on the soybean market, a key player in the global agricultural trade, contributes to understanding the structural framework and operational logic of agricultural trade.
The soybean trade has flourished with increasingly intertwined relationships, forming a complex trade network. According to the CEPII-BACI international trade database, frequent soybean trading activities occurred between 2000 and 2022, with expanding import-export volumes. This has established a pattern dominated by the United States and Brazil as primary exporters, while Asian countries function as major importers. USDA data indicates that Brazil and the United States accounted for nearly 80% of global soybean production in 2022, highlighting the global impact of the soybean trade network. As the largest importer, China’s sustained demand growth primarily supports oil extraction and feed processing, addressing domestic edible oil consumption and livestock farming needs. Being a land-intensive crop requiring flat cultivation areas, most countries increasingly rely on international trade to meet demand as economies develop, resulting in import dependencies. A notable example is China: despite ranking as the world’s fourth-largest soybean producer, it depends on imports for over 80% of its soybean requirements.
In recent years, an increasing number of scholars have adopted social network analysis methods to investigate the changes in agricultural product trade network structures under various event shocks. These studies primarily focus on analyzing the impacts of such shocks on key structural features of trade networks, including connectivity, density, and centrality, thereby revealing the dynamic evolution and adaptability of trade networks in response to external disturbances.
From a methodological perspective, existing literature predominantly employs social network analysis tools to abstract agricultural product trade relationships as either unweighted, weighted, or directed networks. For instance, some scholars constructed a directed trade network for agricultural products along the Belt and Road Initiative (BRI) and found that the COVID-19 pandemic significantly reduced network connectivity and density, leading to sparser trade relations [1]. Similarly, some researchers utilized near-real-time global grain trade data to demonstrate that developed countries exhibited greater resilience due to higher connectivity and stronger trade alliances during the pandemic, while developing countries faced greater challenges [2]. In terms of mathematical models, some scholars have employed the Temporal Exponential Random Graph Model (TERGM) to analyze the influencing factors of agricultural product trade networks and assess their resilience to external shocks [3].
As for the specific events examined, existing studies primarily focus on the impacts of the COVID-19 pandemic, the Russia-Ukraine conflict, and other economic disruptions on trade networks. For instance, some researchers constructed a multilayer network model to analyze the effects of the Russia-Ukraine conflict on the global grain trade network, revealing that sunflower oil and corn trade losses reached 89% and 85%, respectively, while poultry meat exports were directly impacted by 25% [4]. While some analyzed the impacts of food crises and financial crises on agricultural product trade networks between 2000 and 2016, concluding that these events had relatively limited effects and exhibited significant heterogeneity across countries [5]. Furthermore, the structural characteristics of global grain trade networks for four major crops (soybeans, wheat, rice, and corn) are investigated, finding that the global grain trade network is transitioning toward greater interconnectivity and resilience in response to the dual shocks of COVID-19 and the Russia-Ukraine conflict [6].
Additionally, some scholars have utilized the Quadratic Assignment Procedure (QAP) to study the self-organizing structures of agricultural product trade networks. These studies primarily explore how factors such as geographic distance, natural endowments, economic development, trade policies, and political stability influence the formation and evolution of trade networks [7,8]. Besides, QAP has been applied to analyze trade networks at regional and commodity-specific levels. Some researchers employed QAP regression to investigate the drivers of agricultural trade networks within the Regional Comprehensive Economic Partnership (RCEP), identifying four distinct blocks: net gainers, mutual spillover zones, intermediary hubs, and net spillers; the study revealed that spillover effects between blocks are transitive and that geographic distance, economic and social conditions, resource endowments, and language proximity significantly influence RCEP agricultural trade network structures [9]. Some utilized QAP to explore the evolution mechanisms of global cereals trade networks, finding that economic disparities, resource endowments, and regional free trade agreements positively influenced network evolution, while cultural similarities and political differences had negative impacts on trade patterns [10]. From a regional perspective, the QAP model has been applied to identify key influencing factors of agricultural product trade networks in specific regions, which provides valuable implications for understanding their structural dynamics. [11,12].
However, the QAP model also has certain limitations. While QAP can effectively measure the relationships between networks, its scope of application is relatively narrow, typically suitable only for specific feature models or issues, and lacks universality. In addition, when analyzing trade networks, the QAP model often requires integration with other methodologies, such as the gravity model, to complement its limitations. While the gravity model can explain trade relationships by leveraging node attribute characteristics (e.g., GDP, market size) and exogenous mechanism variables (e.g., geographic distance), it assumes trade relations are independent of each other, thereby overlooking the structural characteristics of complex trade networks. This limitation, to some extent, restricts a comprehensive understanding of the self-organizing structure of trade networks. Despite these limitations, the application of the QAP model remains highly valuable in the study of agricultural product trade networks.
Existing literature predominantly focuses on exploring how various event shocks influence agricultural product trade network structures and how these networks evolve through self-organizing processes. These studies provide a robust theoretical foundation and empirical support for this research. Building upon previous work, this study aims to make contributions in two key areas: first, by comprehensively analyzing the dynamic evolution characteristics of soybean trade networks from multiple dimensions, including their core-periphery structural features; second, by systematically examining how various event shocks influence the evolution of soybean trade network structures and employing TERGM to identify key influencing factors. The organization of this paper is shown in Figure 1.
2. Research Design
2.1. Theoretical Hypotheses
The soybean trade network, a complex and evolving structure, is continuously influenced by external events, with the degree of impact varying across different countries. This paper provides a detailed explanation of these dynamics. Due to the limited theoretical research specifically on soybeans, this study expands its analysis to the broader category of agricultural trade to which soybeans belong. The structure of the soybean trade network, as revealed by this study, is of significant importance and can potentially influence future research in this field.
First, the scale of global agricultural trade networks is expanding, and trade complexity is increasing [13]. Different agricultural trade networks exhibit hidden trade clustering characteristics [14]. The global agricultural trade landscape is gradually being reshaped, with the European economic bloc and the United States still dominating the network control, demonstrating a clear “core advantage” hierarchy [15]. From a regional perspective, agricultural trade among countries along the “Belt and Road” is highly concentrated in regions and types [16], with import trade dispersed and export trade concentrated. Trade intensity is particularly high among neighboring countries. The agricultural trade network of RCEP countries shows significant spatial correlation [9], exhibiting strong stability and “small-world” characteristics. Based on this, the following hypothesis is proposed regarding the topological structure of the soybean trade network:
Hypothesis 1.
The soybean trade network exhibits trade agglomeration effects and “small-world” characteristics.
Agricultural trade networks have formed a distinct core-periphery structure [9]. Countries such as China, Australia, Japan, Thailand, and Vietnam, with their large trade volumes, serve as essential trade nodes and are located in the core areas of the network. The periphery regions exhibit a “three-core, multi-node” structure, with Malaysia, the Philippines, and Singapore as the core areas and Brunei, Cambodia, Laos, Myanmar, and New Zealand as secondary nodes. Overall, secondary node regions in the periphery account for a significant proportion, and these countries have weak trade connections with both intra- and extra-cluster nations. From a sectoral perspective, the global grain trade network also demonstrates a significant core-periphery structure [17], with the United States, Japan, Mexico, Egypt, South Korea, and Colombia as core countries, evolving from a single-core to a multi-core structure. Similarly, the dairy trade network exhibits a clear core-periphery structure, with core import regions shifting from Europe, East Asia, and the Americas to North America, the Middle East, and East Asia, while core export regions remain relatively unchanged. In the land flow trade network [18], a few economies play a hub role in large-scale land transfers, resulting in a typical core-periphery structure. Therefore, the following hypothesis is proposed:
Hypothesis 2.
The soybean trade network exhibits a distinct core-periphery structure, evolving from a single-core to a multi-core structure.
Agricultural products are highly susceptible to natural disasters; thus, agricultural trade networks are also vulnerable to the impact of sudden events. Based on the types of sudden events, they can be broadly categorized into two types: First, international conflict events. In the context of the Russia-Ukraine conflict, the complete loss of agricultural production in Ukraine has had varying impacts on different countries [4], indicating heterogeneity in the effects across nations. The impact is smaller on major grain-exporting countries and larger on major grain-importing countries. Additionally, the effects can be traced along a single linear axis, where initial minor declines in food supply have escalated into market panic, exacerbating inflation and food insecurity in import-dependent regions [19]. Second, natural disaster events. Studies simulating the impact of sudden declines in U.S. wheat production due to natural disasters such as sandstorms on the global agricultural trade network [20] found that such events generally affect global trade networks by impacting the reserves of major grain-producing countries. A reduction in U.S. exports led other countries to utilize their reserves to meet demand, resulting in a 31% decline in global wheat reserves. This indicates that extreme production declines in core countries of the network have a significant impact on the entire network, while declines in peripheral countries may have a lesser effect. Based on this, the following hypothesis is proposed:
Hypothesis 3.
The impact of sudden events on core structures tends to stabilize, while the impact on peripheral structures exhibits heterogeneity.
2.2. Construction of Social Network Model
This section begins by constructing a soybean trade network model based on social network analysis. Subsequently, appropriate network statistical models are selected based on trade network theory to study the evolution characteristics and influencing factors of the network.
2.2.1. Construction of the Soybean Trade Network
To comprehensively understand the global soybean trade landscape and its evolution trends, this study employs complex network methods, treating each country participating in soybean trade as a network node and the trade relationships between countries as network connections, thereby constructing a global soybean trade network. In the soybean trade network, the size of a node is represented by its degree, which is measured by the number of soybean trade relationships an economy has with other economies in the network. The larger the node, the greater the volume of soybean trade the economy sends or receives, indicating its more significant position in the soybean trade network. The thickness of the edges represents the degree of trade dependency between economies, with thicker edges indicating a higher level of soybean trade dependency between the two economies. The trade dependency value draws on the approach of [21], measuring the “irreplaceability” in trade, that is, the degree of dependency of one country on soybean trade with another. The higher the dependency value, the stronger the irreplaceability of the trade relationship.
Therefore, before constructing the soybean trade network, it is necessary to calculate the trade dependency indicators between economies. The specific calculation is as follows: the soybean trade dependency of Economy i on Economy j is equal to the import dependency value of soybean trade between the two economies, expressed as:
Among them, represents the degree of soybean import dependence of country i on country j,is the proportion of the amount of soybeans imported by country i from country j to its total soybean imports,is the soybean import concentration of country i, and is the soybean export concentration of country i.
Both and are constructed through the standardized Herfindahl-Hirschman Index (HHI) method, which can reflect the influence of other economies in the soybean trade dependence relationship. The calculation methods are as follows:
Next, based on the soybean trade dependency index, the soybean trade network from 2000 to 2022 is constructed to explore the structural characteristics of soybean trade among various economies during the sample period. Specifically, the soybean trade network is defined as G=(V, E, W, T), where V represents the set of all nodes; E represents the set of all trade connections; W represents the trade weights indicated by the trade dependency values; and T represents the trade network for each year. Since the soybean trade network is a weighted network, with edge information including the degree of dependency, effective information is extracted and prepared for empirical analysis by following other scholars’ approaches in extracting the backbone network structure. Referring to [22], network nodes are screened, resulting in 77 representative agricultural trade economies. Based on the method of [23] and considering that each economy has a small number of key agricultural trade partners, this study retains the top three edges with the highest trade dependency indices. Ultimately, the number of network edges each year is around 165, sufficient to capture the top 1 to 3 important trade partners of each economy in the trade network.
2.2.2. Measurement Indicators for the Soybean Trade Network
This study employs a series of network statistical indicators to describe the overall structural characteristics of the soybean trade network among 126 major global economies.
Clustering Coefficient (CC) measures the degree of interconnection and clustering among economies within the soybean trade network, as shown in Equation (3):
In Equation (3), represents the number of trade partner economies that have actual soybean trade relationships with Economy i. It measures the global clustering of the trade network, reflecting the closeness of connections among the trade partners of each country. A higher Clustering Coefficient indicates a greater degree of clustering among economies in the network, suggesting closer cooperation in soybean trade.
Average Path Length (APL) measures the average of the shortest paths between economies in the soybean trade network. It reflects the average minimum number of steps required for any economy in the trade network to establish a trade relationship with another economy.
In Equation (4), represents the shortest path between Economy i and Economy j. A shorter Average Path Length (APL) indicates higher efficiency of information transmission in the soybean trade network, making soybean trade interactions more convenient.
Network Density (ND) measures the strength of relationships among economies in the soybean trade network. The network density value will be higher if there are more soybean trade relationships between economies. Since the soybean trade network is a directed one, the maximum possible number of relationships between economies is N(N-1), where N is the number of economies. Thus, the directed network density can be calculated as:
In Equation (5), represents the actual number of soybean trade relationships in the network, and the maximum distance between any two economies in the network is defined as the network diameter.
Network Centralization measures the overall tendency of the network to concentrate around certain nodes. A higher value indicates greater network centralization, meaning that a small number of nodes control a significant portion of trade resources. The formula for overall network centralization is as follows:
where kmax is the maximum degree in the network. By distinguishing between in-degree and out-degree, the in-degree centralization and out-degree centralization of the network can be calculated separately.
2.3. Temporal Exponential Random Graph Model Construction
This study has two core objectives. First, it systematically examines the dynamic evolution of the soybean trade network from 2000 to 2022, focusing on its core-periphery structural characteristics and the network characteristics it exhibits under the impact of significant events. Through this analysis, the study aims to comprehensively summarize the dynamic evolution patterns of the global soybean trade network. The second key objective is to deeply explore the mechanisms behind the formation of trade network relationships and their primary influencing factors.
Notably, traditional statistical and econometric methods typically rely on the assumption that the research objects are independent of one another. This approach overlooks the potential influence of other relationships within the network on specific relationships [21]. For instance, the QAP (Quadratic Assignment Procedure) analysis method mentioned earlier fails to fully account for the structural characteristics of complex trade networks, which, to some extent, limits our comprehensive understanding of the self-organizing structure of trade networks. However, soybean trade networks exhibit highly complex relational characteristics. If traditional statistical and econometric methods are still applied, the interdependence among observational errors may lead to biased results, undermining the accuracy of the findings [24,25,26]. Therefore, this study directly models soybean trade relationships as the topological structure of trade networks and employs the temporal exponential random graph model [27,28], which is suitable for analyzing network data to conduct an empirical test of the influencing factors.
TERGM (Temporal Exponential Random Graph Models) is an extension of ERGM (Exponential Random Graph Models). While traditional ERGM models can explain the mechanisms underlying network formation at specific points in time, they struggle to account for the temporal dependencies inherent in network data. To address this limitation, the TERGM model was developed. TERGM introduces parameters from previous network realizations into the ERGM framework, enabling the analysis of temporal dependencies in longitudinal network data. Currently, several versions of the TERGM model have been developed. The analysis in this study is based on the TERGM framework proposed by Leifeld et al. [29]. This framework is grounded in the definition of discrete-time Markov chains, creating a Markovian network configuration where each soybean trade network configuration at time t depends only on the network state at the previous time step t-1. Specifically, the model assumes that the soybean trade network configuration at time t is related only to the network configurations of the previous k periods. The general form of this model can be represented as:
Within the TERGM framework, represents the network, conceptualized as an adjacency matrix where if there is a trade relationship between nodes i and j, and otherwise. The variable t denotes time, represents the coefficient matrix, and is a non-Markovian constant ensuring probabilities remain within the range [0,1]. is a vector of network statistics based on the structural characteristics of the network. The TERGM model incorporates various variables, including endogenous network structural variables (e.g., reciprocity), actor attributes (e.g., type of trading partner), and exogenous covariates (e.g., other relationships between nodes). This study integrates complex network theory with the classical gravity model of trade, resulting in the following TERGM model:
Where and represent the global soybean trade networks at time t and t-1, respectively. The dependent variable is the logarithm of the probability that an economic entity establishes a soybean trade network connection. The coefficient is interpreted as a log-advantage ratio. represents the number of edges, and its coefficient is generally not specifically interpreted. Reciprocity, Expansiveness, Multiple_2-paths, Triadic_closure, Stability, and Variability are endogenous structural variables. ln_GDP and ln_pop are variables representing the attributes of the actors, where the subscripts r, s, and o indicate the receiver, sender, and shared attributes, respectively. , , and are external network covariates. The specific meanings and construction methods of each variable will be discussed in detail in the following text. The TERGM model uses pseudo-maximum likelihood estimation for fitting, and the parameters are adjusted through estimation, simulation, comparison, and improvement steps to obtain relatively stable estimation results.
2.4. Data Sources and Explanation
Selecting appropriate data is a critical component of investigating the global production and trade dynamics of an industry. The primary data source for this study is the CEPII-BACI database from the French Institute for International Economic Studies. This database is a refined variant of the highly classified trade data from the United Nations Comtrade Database (UN Comtrade), encompassing import and export values and quantities in standardized units for 251 economies at the HS-6-digit product level. The advantages of this database include timely updates and the provision of detailed and reliable product trade information. Therefore, soybean trade data under the HS code 120100 from the CEPII-BACI database is selected for this study. Since this research aims to examine the impact of specific sudden events on the network structure, annual data is required. Considering data availability and timeliness, the study period is set from 2000 to 2022. Additionally, due to the large volume of data and the fact that excessively large datasets can hinder research efficiency, the final dataset is filtered to include soybean trade data for 126 countries over 22 sample years. This refined dataset ensures a balance between comprehensiveness and analytical efficiency.
3. Analysis of the Evolutionary Characteristics of the Soybean Trade Network Structure
Building on the network model constructed in the previous section, this section analyzes the structural evolution of the soybean trade network, focusing on two main aspects: the topological structure and the core-periphery structure.
3.1. Analysis of Network Topological Structure Characteristics
Based on the network statistical indicators selected in Section 2, this section calculates the statistical characteristic parameters of the soybean trade network for 12 periods from 2000 to 2022, using a 2-year interval. These calculations are used to analyze the topological structure characteristics of the soybean trade network, as presented in Table 1.
The soybean trade network has been continuously expanding. During the sample period, the number of trade edges increased from 935 to 1,657, and the network density rose from 0.023 to 0.03. This indicates an overall expansion trend in the soybean trade network, with trade activities between countries becoming more active and connections growing tighter.
The soybean trade network exhibits trade agglomeration effects. The clustering coefficient, also known as the transitivity coefficient, measures the proportion of closed triads in the network and reflects the degree of clustering and stability among nodes. The clustering coefficient ranges between 0.145 and 0.290. Although there are fluctuations in some years, the overall trend is upward, suggesting an increase in the number of closed triads in the network.
The soybean trade network demonstrates “small-world” characteristics. The average path length ranges from 2.488 to 2.953, indicating that any economy i can establish a soybean trade relationship with another economy j through an average of two to three steps. This reduces the difficulty of cooperation between countries, confirming Hypothesis 1.
The gap between in-degree and out-degree centralization is narrowing. Centralization reflects the overall tendency of the network to concentrate around certain nodes. A higher centralization value indicates greater network concentration, with a few nodes controlling a significant share of trade resources, and also suggests the presence of a core-periphery structure. The results show that the network’s centralization is on an upward trend, indicating an evolving “core-periphery” structure. In-degree centralization represents import concentration, while out-degree centralization reflects export concentration. As shown in Table 1, from 2000 to 2022, in-degree centralization fluctuated but generally increased from 0.0144 to 0.0230, while out-degree centralization fluctuated but generally decreased from 0.0410 to 0.0116. This narrowing gap between in-degree and out-degree centralization highlights a growing trend of import centralization and export decentralization in the soybean trade network. It also suggests that soybean importers are becoming more concentrated while exporters are becoming more dispersed.
The substitutability of soybean trade has increased, reducing trade risks. The trade dependency value reflects the “irreplaceability” of the soybean trade. By introducing this metric, the degree of “irreplaceability” between trading partners can be further analyzed, revealing the overall dependency level of the network. The average trade dependency value shows a slight downward trend, decreasing from 0.1721 in 2000 to 0.1588 in 2022. This indicates that, with the deepening of globalization, economies have more soybean trade partners, enhancing the substitutability of soybean trade. For example, Country A can import soybeans not only from Country B but also from Countries C or D. This reduces the dependency between economies and lowers the risks associated with soybean trade.
3.2. Analysis of the Core-Periphery Structure Characteristics of the Network
The soybean trade network exhibits a relatively stable “core-periphery” hierarchical structure with spatiotemporal variations. Using the Ucinet software, the core coefficients from 2000 to 2022 were calculated, and core and peripheral countries were identified, revealing a distinct “core-periphery” structure in the global soybean trade network. This section selects 2000 and 2022 as the start and end years of the study. To visually observe the evolution of the “core-periphery” structure, the soybean trade networks for the start and end years (2000 and 2022), as well as two critical transition years (2009 and 2018), are visualized. Additionally, the top 10 countries in terms of network core coefficients for these four key periods are calculated using Ucinet software, allowing for a comprehensive exploration of the changes in the network’s core structure before and after critical events.
3.2.1. Visualization Analysis
Under the previous conditions, first, visualize the weighted directed network constructed previously with trade dependence values as weights to more intuitively demonstrate the “core-periphery” structural characteristics of the soybean trade network. Here, nodes represent sample economies, and the size of the node’s shadow reflects the average degree of the node; that is, the more trade-related edges an economy has, the larger the node’s shadow; economies with close trade relations are close to each other, while those with weak trade relations repel each other; the connecting lines represent the existence of trade-related edges, and the thickness of the edges represents the magnitude of trade dependence, with thicker edges indicating a higher degree of dependence. The visualization results are shown in Figure 2, Figure 3 and Figure 4.
From the four visualizations, it is evident that the soybean trade network exhibits a distinct core-periphery structure. Over time, the network’s structural characteristics have evolved from a single-core periphery model to a multi-core periphery model. This shift indicates that the network is no longer driven by a “few cores”; instead, more economies are playing a “multi-core driving” role in the trade network. This evolution has, to some extent, weakened the central market dominance of a few developed economies. Therefore, Hypothesis 2 is supported.
3.2.2. Analysis of the Evolution of the Core-Periphery Structure
To refine the classification and highlight structural changes, this section categorizes the top 2% of countries as core countries, the next 10% (excluding core countries) as semi-peripheral countries, and the remaining countries as peripheral countries. The classification is presented in the order of core countries, semi-peripheral countries, and peripheral countries. Furthermore, by focusing on four critical events—T1: The Big Four Grain Merchants Shorting Chinese Soybeans (2003), T2: The Global Financial Crisis (2008), T3: The US-China Trade War (2018), and T4: The COVID-19 Pandemic (2020)—the evolution characteristics of the core-periphery structure are extracted. The core coefficient rankings for these events are summarized in Table 2.
- T1: The Big Four Grain Traders Short–sell Chinese Soybeans
In 2003, the four major international grain traders launched a siege on Chinese soybeans, an action that caused heavy losses to China’s soybean industry.
The core position of the United States was further consolidated, while China’s trade status declined. The top ten countries in terms of core coefficient ranking were the United States, Brazil, France, Canada, the Netherlands, China, Japan, Argentina, Germany, and South Korea. From the perspective of countries related to this event, the short-selling of Chinese soybeans by international grain traders led to a drop in China’s core coefficient, ranging from 6th to 10th. Among them, the core position of the United States was further strengthened, and the positions of Canada and the Netherlands were both enhanced. Italy rose from 12th to 5th.
- T2: The 2008 Global Financial Crisis
In 2008, the financial crisis swept the world, and the agricultural product market faced a joint crisis in both supply and demand. The soybean trade was significantly impacted.
The overall core coefficient of the network decreased, but that of the United States increased instead, further strengthening its position and demonstrating a significant “Matthew Effect.” The positions of Italy, China, and Canada gradually became prominent. The soybean trade network was severely hit, and the soybean trade market faced a crisis. From the perspective of individual nodes, except for the United States, the core coefficients of other core countries decreased, facing an influence crisis, which reflects a relatively strong “Matthew Effect” in the soybean market.
- T3: The China-US Trade War
The United States enhanced its trade position by exporting soybean crises to its original soybean trading partners. In addition, the positions of South Korea, India, Canada, and other soybean trading partners of the United States were strengthened.
From a macro-perspective of the soybean trade market, the United States is the largest exporter. According to the BACI database, in 2022, the United States exported 57.33 million tons of soybeans, accounting for 36.8% of the world’s total soybean exports. In the same period, China is the largest importer. In 2022, China imported 91.08 million tons of soybeans, accounting for 58.3% of the world’s total soybean exports. The influence of the two countries on the trade network is self-evident. From a micro-perspective, China is the largest soybean export market for the United States, and the United States is the second-largest soybean import market for China. The bilateral trade dependence is relatively close. In fact, since August 19, 2017, when the Office of the United States Trade Representative (USTR) launched a Section 301 investigation against China, there have been continuous trade frictions between China and the United States, bringing many impacts on the trade between the two countries and also bringing uncertainties to the stability of the soybean trade network. In April 2018, the United States announced the proposed tariffs on China under the Section 301 investigation. In response, China imposed a 25% tariff on 106 commodities, including soybeans, originating from the United States.
Affected by China’s tariff countermeasures, the total amount of US soybean exports to the world in 2018 decreased by 16.2% compared with 2017, among which the amount of soybeans exported to China decreased by 72.7%. Although China’s tariff increases on US soybeans led to a 16.2% decline in the total US exports compared with 2017, it did not change the core position of the United States in the soybean market. Instead, it strengthened its position. In fact, in response to the economic sanctions, the United States tried to expand its soybean export market to digest its domestic soybeans. It sold some of the soybeans that could not be exported to China to its original trading partners. The export volume to countries such as Egypt, the Netherlands, Germany, and Mexico increased significantly. The import volume of Egypt from the United States doubled compared with 2017. Moreover, the United States actively expanded new trading partners, further deepening its connections with trading countries and thus enhancing its position. At the same time, the positions of South Korea, India, Canada, and other soybean trading partners of the United States were strengthened as a result, indicating obvious reciprocity in the soybean trade network.
- T4: The COVID-19 Pandemic
It had a limited impact on the overall core structure. Among them, the core position of the United States declined, while the position of Brazil was strengthened, and the trade positions of China and Canada were further consolidated.
At the end of 2019, the COVID-19 pandemic quietly emerged, having a profound impact on the world economy. This global crisis has not only affected South American ports such as the Port of Rosario in Argentina and the Port of Santos in Brazil, but also the entire logistics and port loading system. The uncertainty in soybean supply is a shared concern across the globe.
In 2020, the top five economies in terms of the network core coefficient ranking were the United States, Brazil, China, Canada, and the Netherlands. Compared with 2019, the top four countries in the 2020 ranking remained unchanged, and the fifth place changed from Argentina to the Netherlands. Compared with the T1 period, China was basically in the third place during the T3 and T4 periods, indicating that its position has been improved, and its trade position is becoming increasingly prominent, moving towards a core country. It is worth noting that Argentina was squeezed out of the top five. According to the report of the Buenos Aires Grain Exchange, Argentina suffered from a drought in 2020, with a 7% reduction in soybean production and a 33% decrease in soybean exports compared with 2019. Secondly, the core coefficient of the United States decreased, while that of Brazil increased, and Brazil’s say in the market was enhanced. Affected by factors such as a bumper soybean harvest and local currency depreciation, Brazil had a strong impetus for soybean exports, with an 8.8% increase in exports in 2020 compared with 2019.
Overall, looking at the four periods, among the impacts of external events on the network structure, the impact on the core structure tends to be stable, but the impact on the peripheral structure is heterogeneous. That is, when the soybean trade network structure is affected by external shocks, the core structure is stable, but the peripheral structure differentiates, proving that Hypothesis 3 holds.
4. Analysis of Influencing Factors of the Soybean Trade Network
After analyzing the evolutionary characteristics of the soybean trade network structure, the next step is to investigate the factors that determine the formation of new trade relationships and the dissolution of existing ones in the global soybean trade. Clarifying this issue is crucial for formulating effective soybean trade policies. This section proposes hypotheses regarding the factors influencing the evolution of soybean trade network relationships and conducts empirical tests using the Temporal Exponential Random Graph Model (TERGM).
4.1. Theoretical Analysis
According to the existing complex network theory, the evolution of a network is influenced by both endogenous and exogenous factors [30,31,32]. Finally, the variable meanings for constructing the Temporal Exponential Random Graph Model and their hypothesis tests are selected.
(1) Endogenous Mechanism Variables
The emergence of some relationships in a network often determines the probability of the emergence of other relationships. The formation of such relationships does not involve factors such as the attributes of economies or the political, economic, and cultural differences between economies. It only depends on the self-organizing process of the network system. This is often referred to as the endogenous structural effect.
Real-world networks often exhibit the characteristic of reciprocity. Reciprocity is an important way to observe and reveal the formation mechanism of network structures. In this paper, reciprocity is incorporated into the TERGM model to describe the tendency of forming reciprocal relationships among various economies. Its root may lie in two mechanisms. One is the information mechanism. The trade flow between two connected economies in the network drives the flow of information, improves the trust level between the two sides, and thus reduces trade costs. The other is the trade balance mechanism. Each economy has different comparative advantages in soybean production. Through trade, the exchange and integration of resources and factors are completed, thereby establishing a mutually beneficial soybean trade relationship. In fact, in the above-mentioned analysis of the evolutionary characteristics of the soybean trade network, it has been observed that this network conforms to the basic characteristics of reciprocity. Therefore, a positive reciprocity effect is expected.
Secondly, the empirical evidence of the soybean trade network shows that this network has a noticeable “core-periphery” hierarchical structure. Therefore, the formation of new relationships is likely to be driven by the status effect. The status effect is the root of asymmetric relationships and hierarchical network structures. In this paper, an expansion index is used to test whether there is a status effect in the network that promotes the formation of new relationships. Considering that in soybean trade, the economies at the export end have more advantages, this paper focuses on the out-degree-based preferential attachment. Economies at the edge of the network cannot obtain effective information about other economies. In contrast, the star nodes in the network that initiate more trade relationships, due to their production and information advantages, will attract new economies to trade with them, gradually strengthening the central position of the central economies. Therefore, the coefficient of the expansion variable is expected to be negative, indicating that there are a small number of economies with high out-degrees in the network, and economies with prominent status will form more connections over time.
In addition, over time, the soybean trade network has a strong cohesion effect. This paper believes that this may be due to the inertia mechanism of reciprocal relationships and the opportunity conditions that lead to a higher degree of closure of network relationships between different economies (such as transitive closure). The trade network is the spatial organization and relationship state formed by the trade between economies. Transitive closure can more easily monitor relationships, prevent opportunistic behavior, and promote valuable and implicit information exchange [33,34]. The test of the transitive closure effect can be explained by a negative multiple connectivity (Multiple2_paths) and a positive triadic closure (Triadic_closure) coefficient, indicating that the connected trade relationships in the network tend to be closed, and macroscopically, it shows a tendency for economies to connect in small groups. In a network diagram, multiple connectivity means that the transmission of the relationship between two nodes requires one or more other nodes as a bridge, which is a basic parameter and prerequisite for ensuring the existence of the transitive closure effect in the network structure [35,36,37]. Adding a connection relationship on the basis of multiple connectivity forms triadic closure, referring to the formation of a division-of-labor closed-loop in the network relationship among three economies. The more division-of-labor closed loops there are, the more obvious the characteristics of the small-group division of labor are. The soybean trade network has the characteristics of a “small-world”; over time, the regional clustering characteristics of the soybean trade network become more prominent. Therefore, the multiple connectivity coefficient is expected to be negative, and the triadic closure is expected to be positive.
As can be seen from the previous text, the network structure shows different characteristics in different periods, and the trade relationships among network nodes are constantly evolving. Therefore, when studying the factors influencing the correlation relationships in the soybean trade network, the time-dependence effect needs to be considered, which mainly includes two indicators: stability and variability. Stability describes the trend of the stable development of the network pattern. After establishing a soybean trade relationship between economies, making hasty changes may bring adverse effects to each other. Therefore, economies usually do not easily change their trade relationships. However, the occurrence of some special events may lead to the breakdown of trade relationships or the emergence of new correlation relationships. The tendency of network relationships to change in different periods is defined as variability. This paper expects that there is a time-dependence effect in the evolution of the correlation relationships in the soybean trade network, with stability being positive and variability being negative. The variable meanings and their hypothesis tests are shown in Table 3.
(2) Exogenous Mechanism Variables
Proxy variables at the node level are incorporated into the network as exogenous attribute variables, and the differences at the economic entity level are regarded as important driving factors rather than the results of network changes. Most existing studies are based on the gravity model to empirically test the formation of trade relationships [38,39,40]. In the classical gravity model, the trade flow between two countries is simulated as a function that is proportional to their economic sizes and inversely proportional to the geographical distance between the two countries. With the in-depth development of research, explanatory variables such as whether they belong to the same economic organization, whether they use the same language, and whether there was a colonial relationship in history have been introduced into the gravity model [41,42,43], expanding the applicable scope and explanatory power of the gravity model.
Based on the theoretical basis of the gravity model, the exogenous explanatory variables for constructing the Temporal Exponential Random Graph Model are finally selected as follows: ① Level of economic development. Generally speaking, the higher the level of economic development of a country, the better the comprehensive conditions for supporting the division of labor in soybean trade, and the more conducive it is to establishing soybean trade relationships globally. The level of economic development is reflected by the GDP of each economic entity, a traditional macroeconomic characteristic indicator, and is logarithmically transformed and then incorporated into the TERGM. ② Market size. Generally, the larger the soybean consumer market of a country, if the domestic supply cannot meet the domestic demand, the demand for international soybean trade will increase, which is conducive to establishing soybean trade relationships with other economic entities. The market size is reflected by the population data released by the World Bank. ③ Distance. In this paper, the geographical distance in the traditional gravity model is expanded, and language proximity and colonial relationships are incorporated into the TERGM model for estimation. Geographical distance measures the distance between the capitals or core cities of any two economic entities. Language proximity measures the language distance through the language differences between different economic entities, and whether there was a colonial relationship in history is examined to capture the religious and cultural distance between economic entities.
To sum up, the exogenous attribute variables include a total of 5 variables in the above-mentioned three aspects. In the TERGM model, exogenous mechanism variables can be divided into two categories: First, actor-attribute variables, which explain the impact of the attributes of specific economic entities on the formation of network relationships and can be further subdivided into two effects; the sender effect and the receiver effect. Second, exogenous covariate networks are all other network relationships formed based on a certain proximity or distance between paired participants in the network. Considering the data structure of the variables, the variables measuring the level of economic development and market size are taken as actor-attribute variables, while the variables measuring distance are constructed into exogenous covariate networks. That is, in order to examine the impact of the level of economic development on soybean trade relationships, in the TERGM model, the economic entity that initiates the soybean trade relationship Nodeofactor (“ln_GDP”) and the economic entity that receives the soybean trade relationship Nodeifactor (“ln_GDP”) are added for estimation. To explore the impact of the market-size characteristics of economic entities on the evolution of network relationships, the TERGM respectively estimates Nodeofactor (“ln_pop”) and Nodeifactor (“ln_pop”). Colony, Contig, and distcap, respectively, describe the geographical distance, language proximity, and historical colonial-relationship network between economic entities.
4.2. Results of TERGM Benchmark Test
Table 4 reports the TERGM estimation results of the soybean trade network from 1996 to 2022. In Table 4, Model 1 only includes the benchmark regression results of the number of edges and node attributes. Model 2 is the regression result obtained by adding exogenous network covariates based on Model 1. Model 1 and Model 2 function as intercept terms, and their coefficients are generally not interpreted separately. Model 3 and Model 4 are used for comparative analysis by gradually adding network-structure-dependent variables represented by reciprocity, expansiveness, multiple connectivity, and transitive closure, as well as time-dependent variables represented by stability and variability.
Soybean trade is characterized by reciprocity. Judging from the estimation results of the most common reciprocity-structured variable among the network endogenous structure variables, the reciprocity (mutual) in Model 3 and Model 4 is significantly positive. This means that if an economy initiates a soybean trade relationship with Economy i, it will increase the probability that Economy j will initiate a trade relationship with Economy i.
The core-periphery structure is obvious. The coefficient of expansiveness (gwodegree) is significantly negative, indicating that the out—degree distribution of network nodes is significantly discrete. In the soybean trade network, the out-degree distribution of nodes is uneven. Compared with economies with low out-degrees, economies at the center of the network are more likely to obtain new trade relationships. In contrast, peripheral economies deviating from the network center are more likely to lose trade relationships. Eventually, at the macro level, it shows a “core-periphery” macro-trade structure, which explains the obvious “core-periphery” structure feature mentioned above.
The soybean trade network has a significant agglomeration and exhibits the characteristics of a “small-world” network. The coefficient of triadic transitive closure (dgwesp) is 1.05722, and the coefficient of multiple connectivity (dgwdsp) is—0.04973, both passing the 0.1% significance level. This indicates that in the soybean trade network, economies transmit and maintain their trade relationships through diversified paths. However, these connectivity paths gradually show a trend of closure. In fact, in order to reduce the uncertainty brought about by information asymmetry and prevent risks caused by the opportunistic behavior of potential trading partners, economies are more inclined to establish soybean trade connections with entities that have been verified by other reliable partners. From a macro perspective, this selective cooperation model has led to the agglomeration effect of the trade network and exhibits the characteristics of a “small-world” network; that is, most nodes can be quickly connected through a few intermediate nodes, and at the same time, there is a high degree of clustering within the network. This also confirms the previous conclusion. This structure not only promotes the accumulation of trust and the reduction of risks but also enhances the stability and efficiency of the global soybean market.
There is an obvious path-dependence characteristic in the soybean trade network. Regarding the time-dependence effect (Stability), the estimated coefficient of stability is 1.52725, passing the 0.1% significance level. This result indicates that there is an obvious path-dependence characteristic in the soybean trade network; that is, the current trade relationships are largely influenced by historical connections. Since establishing and maintaining trade relationships requires certain costs, once a specific trade pattern is formed, economies tend to maintain the status quo to avoid the uncertainties and potential losses that may arise from changing the existing trade relationships. This explains why countries usually do not easily adjust their existing soybean trading partnerships. Variability (loss), as an indicator to measure the structural interruption of network connections, has a negative coefficient, indicating that, ceteris paribus, over time, the relationships in the soybean trade network tend to gradually weaken and even disappear. This finding is consistent with the changes in the global trade pattern in recent years, especially in the context of the rise of trade protectionism. For example, during the China-US trade war mentioned above, some traditional trade relationships encountered challenges and were forced to break. This phenomenon not only reflects the impact of the external environment on the stability of the trade network but also reminds us to pay attention to the sustainability of long-term trade relationships and the ability to cope with uncertain risks.
In the soybean trade network, the sender effect refers to whether an economy with a higher value of a given attribute variable is more inclined to initiate soybean trade connections with other economies in soybean trade. The receiver effect refers to whether an economy with a higher value of a given attribute variable is more inclined to receive trade relationships from other economies in soybean trade. The assortativity effect refers to whether countries with the same attributes are more inclined to engage in trade relationships. The coefficients of nodeicov.ln_gdp and nodeocov.ln_gdp are both significantly positive, indicating that the higher the economic level, the easier it is to receive soybean trade relationships and also to initiate soybean trade relationships. Regions with a larger economic scale are more inclined to establish soybean trade connections with other regions. The coefficient of nodeicov.ln_pop is negative, while that of nodeocov.ln_pop is positive, passing the 0.1% significance level. This shows that the larger the market scale based on population size, the less inclined it is to import soybeans and the more inclined it is to export soybeans. In addition, the assortativity node attributes nodematch.ln_gdp and nodematch.ln_pop did not pass the test.
Regarding exogenous network covariates, the coefficient of edgecov.colony is positive, indicating that economies with a historical colonial relationship are more inclined to establish relationships in soybean trade. The coefficient of edgecov.contig is significantly positive, indicating that two neighboring countries are more likely to engage in soybean trade. The coefficient of edgecov.distcap is negative, which means that geographical distance has an inhibitory effect on soybean trade. The farther the geographical distance between economies, the higher the trade costs, such as transportation and communication, and the less likely it is to form a soybean trade relationship.
4.3. Robustness Test
In order to verify the robustness of the empirical results of the TERGM model, this paper reconducts the empirical estimation of TERGM by adjusting the time interval of trade network data, sample selection criteria, and changing the estimation method. The results are shown in Table 5. Specifically, the following steps are included: ① Set the time interval of the dynamic soybean trade network to 3-year intervals, respectively, and the empirical results of TERGM correspond to Model 5. ② Retain the countries ranked in the top 25% in terms of centrality, and keep the time interval at 2 years. The empirical results are shown in Model 6. ③ Replace the MCMC MLE estimation method of TERGM with the bootstrap MPLE method. The empirical results are shown in Model 7. By analyzing the estimation results in Table 5, it is not difficult to find that Models 5-7 show basically the same empirical results as Model 4, indicating that the TERGM estimation results of this paper are robust.
4.4. Goodness of Fit Test
Figure 6 shows the gaps between the frequency distribution results of the dyad-wise shared partners, edge-wise shared partners, degree centrality, in-degree centrality, and the key network characteristic parameter-geodesic distance obtained from simulating the network 500 times based on the estimated parameters of Model 4 and the corresponding observed values of the real network. In the first five figures, the thick black solid line represents the distribution of each characteristic parameter observed in the real network, and the gray lines and box-and-whisker plots represent the 95% confidence intervals of each characteristic parameter of the simulated network. It can be observed that the observed values of the five key network characteristic parameters are all within or close to the 95% confidence intervals of the simulated network, indicating that the benchmark model has a good fitting effect and can better explain the structural characteristics of the real network. In addition, the sixth figure is the ROC curve. Generally, the larger the area under each of the two curves, the better the performance of the model and the higher the degree of fitting. It can be clearly seen that the areas under the two curves in the figure account for a relatively large proportion of the total area, further indicating that the benchmark model has a good fitting effect.
5. Conclusions
This paper is based on the original global bilateral soybean trade data from 2000 to 2022. The social network analysis method is used to construct the soybean trade network. A series of network statistical indicators are utilized to explore the dynamic evolution characteristics of the soybean trade network, and the influencing factors of the soybean trade network are explored through the TERGM model. The following conclusions are drawn from the research.
The soybean trade network exhibits obvious dynamic evolution characteristics. In terms of topological structure, the number of nodes and edges in the soybean trade network has increased, indicating a continuous expansion of the network scale. The clustering coefficient has risen, showing the trade agglomeration effect in the soybean trade network. The average path has shortened, demonstrating the “small-world” feature of the soybean trade network, which reduces the difficulty of soybean trade cooperation among countries. The difference in the centralization of in-degree and out-degree has narrowed, and the centralization of the import side and the decentralization of the export side in the soybean trade network have become more prominent. This indicates that soybean-importing countries are becoming increasingly concentrated, with a few or even a single economy importing a large number of soybeans. The overall dependence average of the trade network has decreased, the substitutability of soybean trade has increased, the selectivity of trade has increased, and the soybean trade risk has decreased. From the perspective of the “core-periphery” structure, the structural characteristics of the soybean trade network have gradually evolved from a single-core periphery structure to a multi-core periphery structure. It is no longer “driven by a few cores,” and more economies play a “multi-core driving” role in the trade network. Among the impacts of the four external events on the network structure, the impact on the core structure tends to be stable. For example, the United States and Brazil, which have long been at the core of the network, are less affected. However, the impact on the peripheral structure is heterogeneous. Importing giants like China are vulnerable to the adverse effects of unexpected events.
The evolution of the soybean trade network relationships is influenced by both endogenous and exogenous mechanisms. In terms of the endogenous mechanism, the degree of reciprocity has a significantly positive effect on the formation and development of the network, indicating a high degree of dependence on the trade relationships among countries. The expansion coefficient has a significantly negative effect, indicating that preference-dependence leads to the emergence of “star” nodes in the soybean trade network, reflecting the agglomeration of the network and the obvious “core-periphery” structure from the side. The transitive closure is significantly positive, and the multiple connectivity is significantly negative, indicating a significant agglomeration in the soybean trade network and confirming the “small-world” feature of the network. The stability coefficient is significantly positive, and the variability coefficient is significantly negative, indicating an obvious path-dependence characteristic in the soybean trade network. Moreover, over time, the relationships in the soybean trade network tend to gradually weaken and even disappear. In terms of the exogenous mechanism, the higher the economic level of an economy, the easier it is to both receive and initiate soybean trade relationships. The larger the market scale of an economy, the less inclined it is to import soybeans and the more inclined it is to export soybeans. In addition, economies with a historical colonial relationship and those that share a border are more inclined to establish relationships in soybean trade, while geographical distance has an inhibitory effect on soybean trade. The farther the geographical distance between economies, the higher the trade costs, such as transportation and communication, and the less likely it is to form a soybean trade relationship.
Countries around the world can obtain strategically valuable information based on the panoramic view of the soybean network drawn above:
1. Optimize the trade network structure: Given the expansion of the soybean trade network scale, the manifestation of the agglomeration effect, and the “small-world” feature, countries should actively promote the diversification of trade cooperation. Encourage more small and medium-sized economies to participate in soybean trade, balance the import-export structure of the trade network, and avoid over-concentration of importing countries. Countries on the periphery of the trade network, especially large importing countries like China, should strengthen trade ties with core countries, enhance their position in the trade network, and reduce the risk of being impacted by unexpected events.
2. Respond to trade risks: With the increased substitutability of soybean trade, countries should make full use of this advantage, broaden soybean import channels, and reduce their dependence on a few exporting countries. Establish a soybean trade risk early-warning mechanism and formulate response strategies in advance for unexpected events that may affect the peripheral structure of the trade network to ensure the stable domestic supply of soybeans.
3. Coordinate the endogenous mechanism: Based on the positive impact of reciprocity on the trade network, countries should strengthen mutually beneficial cooperation with their trading partners and establish long-term and stable trade relationships. Guide the rational allocation of trade resources, prevent “star” nodes from over-aggregating resources, and promote a more balanced development of the trade network. Consolidate and expand existing trade relationships, and at the same time, pay attention to the weakening trend of relationships and adjust trade strategies in a timely manner.
4. Comply with the exogenous mechanism: Countries with a relatively high economic level should further leverage their advantages, actively participate in international soybean trade, and promote the prosperity of the global soybean trade market. When expanding soybean trade relationships, factors such as historical colonial relationships, border-sharing situations, and geographical distance should be fully considered. Strengthen trade cooperation with countries that share a border or have a historical colonial relationship; for countries that are far away, overcome trade barriers brought about by geographical distance through means such as reducing transportation costs and strengthening communication.
Author Contributions
Conceptualization, Lichang Zhang and Yue Liu; methodology, Lichang Zhang, Yue Liu and Zirui Wang; software, Lichang Zhang; validation, Lichang Zhang and Yue Liu; formal analysis, Lichang Zhang, Yue Liu and Pierre Failler; investigation, Lichang Zhang, Yue Liu and Pierre Failler; resources, Lichang Zhang and Zirui Wang; data curation, Lichang Zhang; writing—original draft preparation, Yue Liu and Lichang Zhang; writing—review and editing, Pierre Failler and Yue Liu; visualization, Lichang Zhang; supervision, Yue Liu. All authors have read and agreed to the published version of the manuscript.
Funding
This research was funded by the National Social Science Fund Project “Research on Statistical Monitoring of Industrial Digitalization in China”, grant number 22BTJ053.
Data Availability Statement
All data used in this study were sourced from the CEPII-BACI database provided by the French Center for International Economics. The raw data analyzed in this research are publicly available in the CEPII-BACI database, accessible at https://www.cepii.fr/CEPII/en/bdd_modele/bdd_modele_item.asp?id=37, under the dataset name “HS96 (1996-2023).
Conflicts of Interest
The authors declare no conflicts of interest. The funders had no role in the design of the study; in the collection, analyses, or interpretation of data; in the writing of the manuscript; or in the decision to publish the results.
References
- Hu, Q.G.; Guo, M.Q.; Wang, F.; Shao, L.Q.; Wei, X.Y. External supply risk of agricultural products trade along the Belt and Road under the background of COVID-19. FRONTIERS IN PUBLIC HEALTH 2023, 11.
- Wei, C.Z.; Xiao, Y.Q.; Li, L.Y.; Huang, G.Z.; Liu, Z., Xue, D.S. After pandemic: Resilience of grain trade network from a port perspective on developed and developing countries. Resources, Conservation and Recycling 2025, 215 0921-3449.
- Abudukeremu, A.; Youliwasi, A.; Abula, B.; Yiming, A.; Wang, D. Study on the Evolution of SCO Agricultural Trade Network Pattern and Its Influencing Mechanism. Sustainability 2024, 16, 7930.
- Laber, M., Klimek, P., Bruckner, M., Yang, L., Thurner, S. Shock propagation from the Russia-Ukraine conflict on international multilayer food production network determines global food availability. Nat Food 2023, 4, 508–517.
- Dong, J.X., Li, S.W., Huang, L.N., He, J., Jiang, W.P., Ren, F., Wang, Y.J., Sun, J., Zhang, H. Identification of international trade patterns of agricultural products: the evolution of communities and their core countries. Geo-spatial Information Science 2022, 27:1, 49-63.
- Xu, H.; Niu, N.; Li, D.; Wang, C. A Dynamic Evolutionary Analysis of the Vulnerability of Global Food Trade Networks. Sustainability 2024, 16, 3998.
- Yu, A.; She, H.; Cao, J. Evolution of the Spatial Patterns of Global Egg Trading Networks in the 21 Century. Sustainability 2023, 15, 11895.
- Bai, Z.; Liu, C.; Wang, H.; Li, C. Evolution Characteristics and Influencing Factors of Global Dairy Trade. Sustainability 2023, 15, 931.
- Pan, Z.C.; Ma, L.Y.; Tian, P.P.; Zhu, Y.C. Structural Characteristics and Influencing Factors of Agricultural Trade Spatial Network: Evidence from RCEP 15 Countries. Ciência Rural 2024, 54 (9).
- Duan, J.; Nie, C.L.; Wang, Y.Y.; Yan, D.; Xiong, W.W. Research on Global Grain Trade Network Pattern and Its Driving Factors. Sustainability 2022, 14, 245.
- Zhou, L.Z.; Tong, G.J. Structural Evolution and Sustainability of Agricultural Trade between China and Countries along the “Belt and Road”. Sustainability 2022, 14, 9512.
- Hu, W.; Xie, D.L.; Le, Y.L.; Fu, N.N.; Zhang, J.Z.; Yin, S.G.; Deng, Y. Evolution of Food Trade Networks from a Comparative Perspective: An Examination of China, the United States, Russia, the European Union, and African Countries. Foods 2024, 13, 2897.
- Qiang, W., Niu, S., Wang, X., Zhang, C., Liu, A., Cheng, S. Evolution of the Global Agricultural Trade Network and Policy Implications for China. Sustainability 2020, 12, 192.
- Tu, Y., Shu, Z., Wu, W., He, Z., Li, J. Spatiotemporal Analysis of Global Grain Trade Multilayer Networks Considering Topological Clustering. Transactions in GIS 2024, 28 (3), 509–534.
- Zhang, T., Yang, J. Factors Influencing the Global Agricultural Trade: A Network Analysis. Agricultural Economics 2023, 69 (9), 343–357.
- Zhou, L., Tong, G. Research on the Competitiveness and Influencing Factors of Agricultural Products Trade between China and the Countries along the “Belt and Road.”. Alexandria Engineering Journal 2022, 61 (11), 8919–8931.
- Duan, J., Nie, C., Wang, Y., Yan, D., Xiong, W. Research on Global Grain Trade Network Pattern and Its Driving Factors. Sustainability 2022, 14, 245.
- Cheng, M.Y., Wu, J.L. Li, C.H. Jia, Y.X., Xia, X.H. Tele-connection of global agricultural land network: Incorporating complex network approach with multi-regional input-output analysis, Land Use Policy 2023,125.
- Hussein, H., Knol, M. The Ukraine War, Food Trade and the Network of Global Crises. The International Spectator 2023, 58 (3), 74–95.
- Heslin, A., Puma, M. J., Marchand, P., Carr, J. A. Simulating the Cascading Effects of an Extreme Agricultural Production Shock: Global Implications of a Contemporary US Dust Bowl Event. Frontiers in Sustainable Food Systems 2020, 4.
- Liu, L., Shen, M., Sun, D., Yan, X., Hu, S. Preferential Attachment, R&D Expenditure and the Evolution of International Trade Networks from the Perspective of Complex Networks. Physica A: Statistical Mechanics and its Applications 2022, 603, 127579.
- De Benedictis, L., S. Nenci, G. Santoni, L. Tajoli, and C. Vicarelli. Network Analysis of World Trade Using the BACI-CEPII Datase. Global Economic Journal 2014, 14(3-4): 287-343.
- Hidalgo, C.A., Klinger, B., Barabasi, A.L., Hausmann, R. The Product Space Conditions the Development of Nations. Science 2007, 317 (5837):482-487.
- Desmarais, B. A.; Cranmer, S. J. Statistical Mechanics of Networks: Estimation and Uncertainty. Physica A: Statistical Mechanics and its Applications 2012, 391 (4), 1865–1876.
- Weber H., Schwenzer M., Hillmert S. Homophily in the formation and development of learning networks among university students. Network Science. 2020;8(4):469-491.
- Van Wijk, B. C. M., Stam, C. J., Daffertshofer, A. Comparing Brain Networks of Different Size and Connectivity Density Using Graph Theory. PLoS ONE 2010, 5 (10), e13701.
- Pan, A., Xiao, T., Dai, L. The structural change and influencing factors of carbon transfer network in global value chains. Journal of Environmental Management 2022, 318.
- Chang, C., Lin, H.W. A topological based feature extraction method for the stock market. Data Science in Finance and Economics 2023, 3(3): 208-229.
- Leifeld, P., Cranmer, S.J., Desmarais, B.A. Temporal Exponential Random Graph Models with Btergm: Estimation and Bootstrap Confidence Intervals. Journal of Statistical Software 2018, 83 (6).
- Xu, H., Feng, L., Wu, G., Zhang, Q. Evolution of Structural Properties and Its Determinants of Global Waste Paper Trade Network Based on Temporal Exponential Random Graph Models. Renewable and Sustainable Energy Reviews 2021, 149, 111402.
- Cai, H., Wang, Z., Zhu, Y. Understanding the Structure and Determinants of Intercity Carbon Emissions Association Network in China. Journal of Cleaner Production 2022, 352, 131535.
- Block, P., Koskinen, J., Hollway, J., Steglich, C., Stadtfeld, C. Change We Can Believe in: Comparing Longitudinal Network Models on Consistency, Interpretability and Predictive Power. Social Networks 2018, 52, 180–191.
- Yu, G., Xiong, C., Xiao, J., He, D., Peng, G. Evolutionary Analysis of the Global Rare Earth Trade Networks. Applied Mathematics and Computation 2022, 430, 127249.
- Fritz, C., Lebacher, M., Kauermann, G. Tempus Volat, Hora Fugit: A Survey of Tie-oriented Dynamic Network Models in Discrete and Continuous Time. Statistica Neerlandica 2019, 74 (3), 275–299.
- Li, M. Li, Y. Research on crude oil price forecasting based on computational intelligence. Data Science in Finance and Economics 2023, 3(3): 251-266.
- Matous, P., Wang, P., Lau, L. Who Benefits from Network Intervention Programs? TERGM Analysis across Ten Philippine Low-Income Communities. Social Networks 2021, 65, 110–123.
- Dwarika, N. Asset pricing models in South Africa: A comparative of regression analysis and the Bayesian approach. Data Science in Finance and Economics 2023, 3(1): 55-75.
- Jang, Y., Yang, J.S. Environmental policy and the evolution of nuclear trade network: Insights from the European Union. Structural Change and Economic Dynamics 2024, 68, 425-432.
- Wang, X.Y, Chen, B., Hou, N., Chi, Z.P. Evolution of structural properties of the global strategic emerging industries’ trade network and its determinants: An TERGM analysis. Industrial Marketing Management 2024, 118, 78-92.
- Li, Z., Chen, B., Lu, S., & Liao, G. (2024). The impact of financial institutions’ cross-shareholdings on risk-taking. International Review of Economics & Finance, 92(6). [CrossRef]
- Wu, G., Feng, L., Peres, M., Dan, J. Do Self-Organization and Relational Embeddedness Influence Free Trade Agreements Network Formation? Evidence from an Exponential Random Graph Model. The Journal of International Trade & Economic Development 2020, 29 (8), 995–1017.
- Lake, J., Yildiz, H. M. On the Different Geographic Characteristics of Free Trade Agreements and Customs Unions. Journal of International Economics 2016, 103, 213–233.
- Miao, C., Wan, Y., Kang, M., Xiang, F. Topological Analysis, Endogenous Mechanisms, and Supply Risk Propagation in the Polycrystalline Silicon Trade Dependency Network. Journal of Cleaner Production 2024, 439, 140657.
Figure 1.
Organization of this paper.
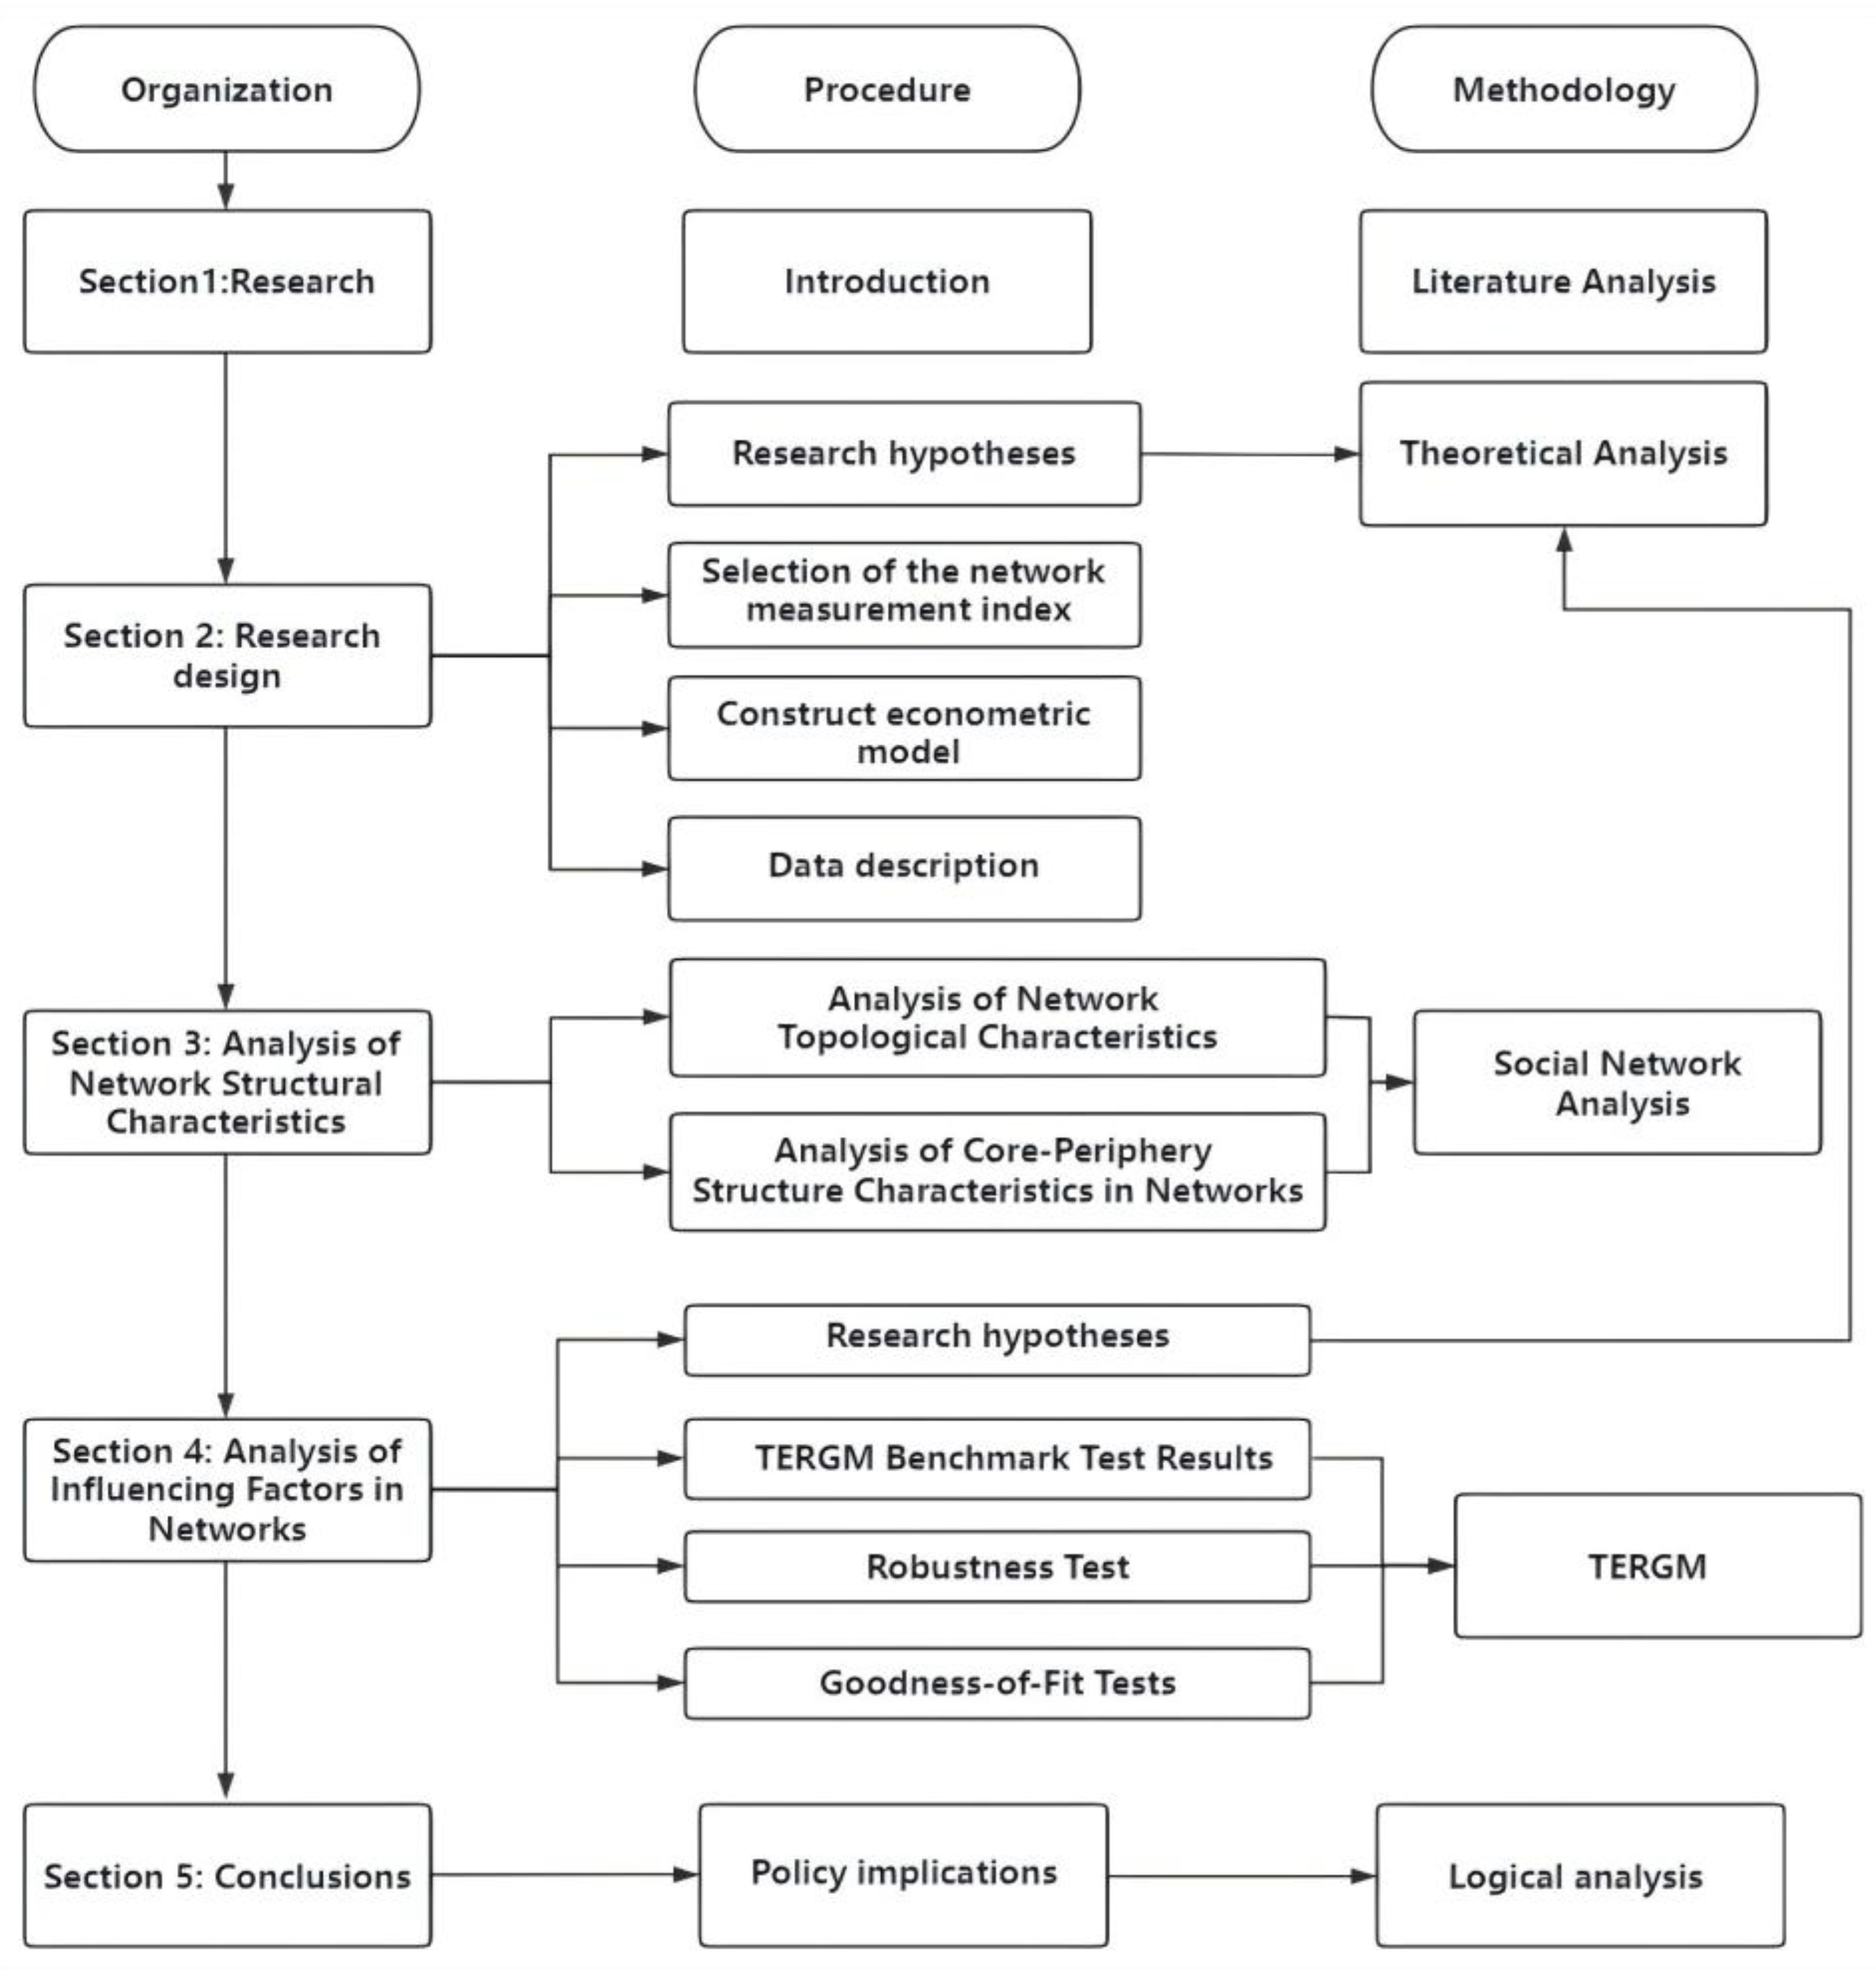
Figure 2.
The soybean trade network in 2000.
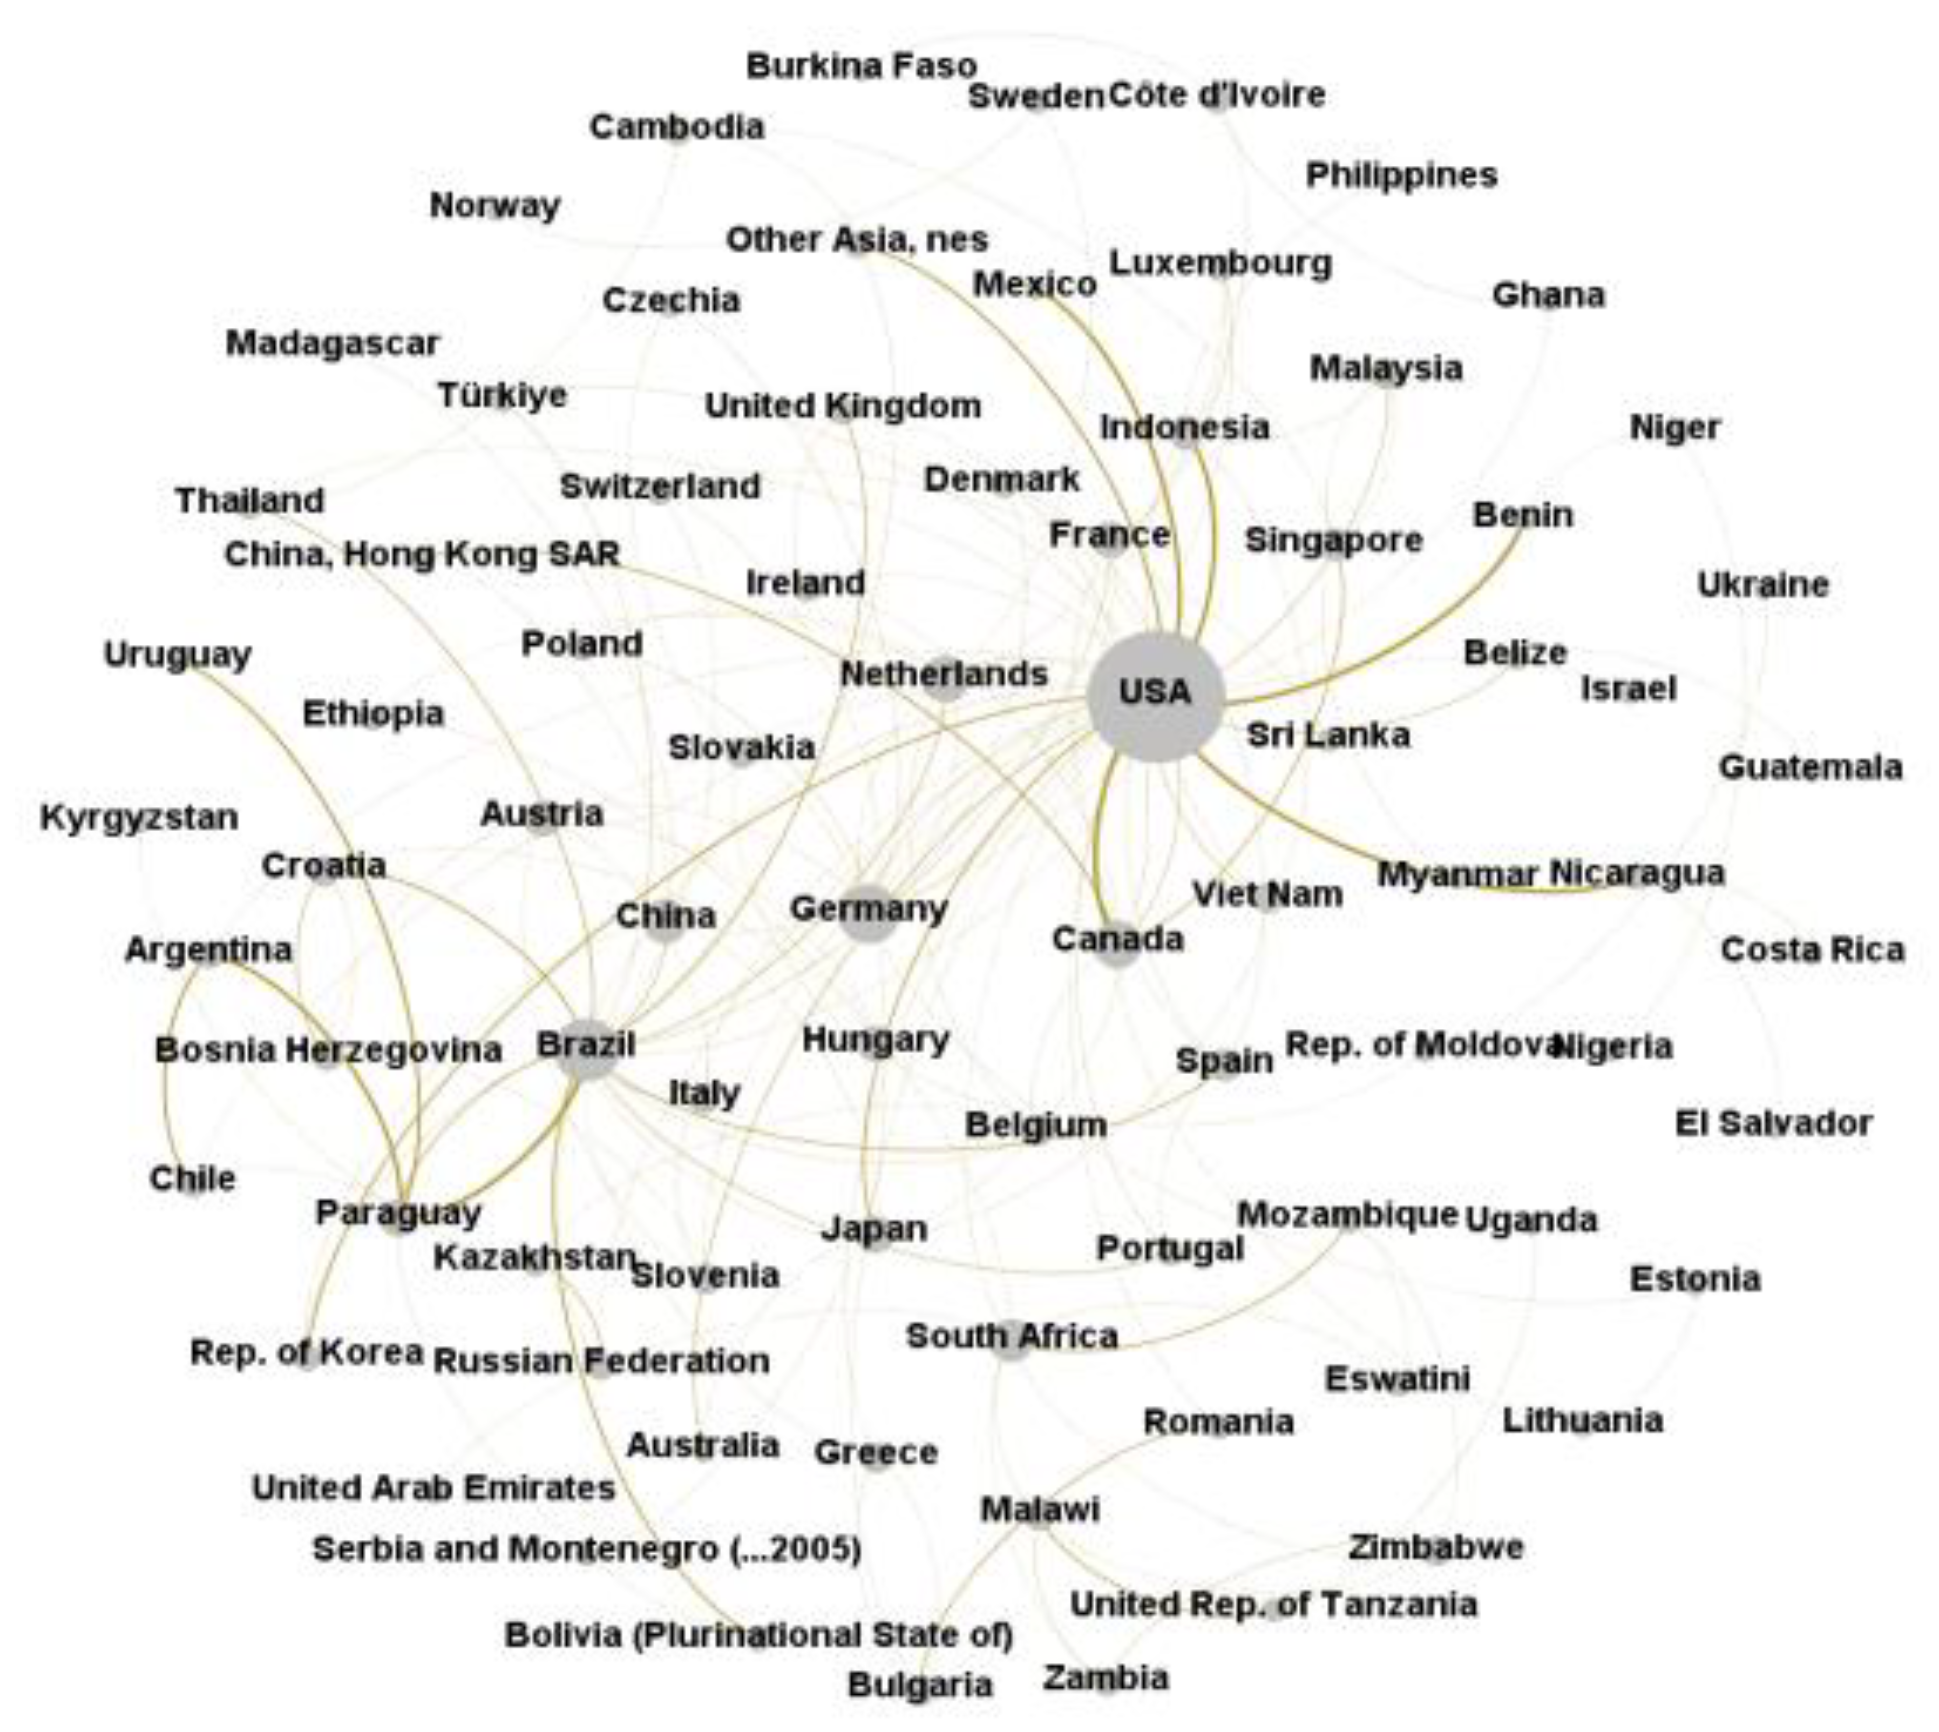
Figure 3.
The soybean trade network in 2009.
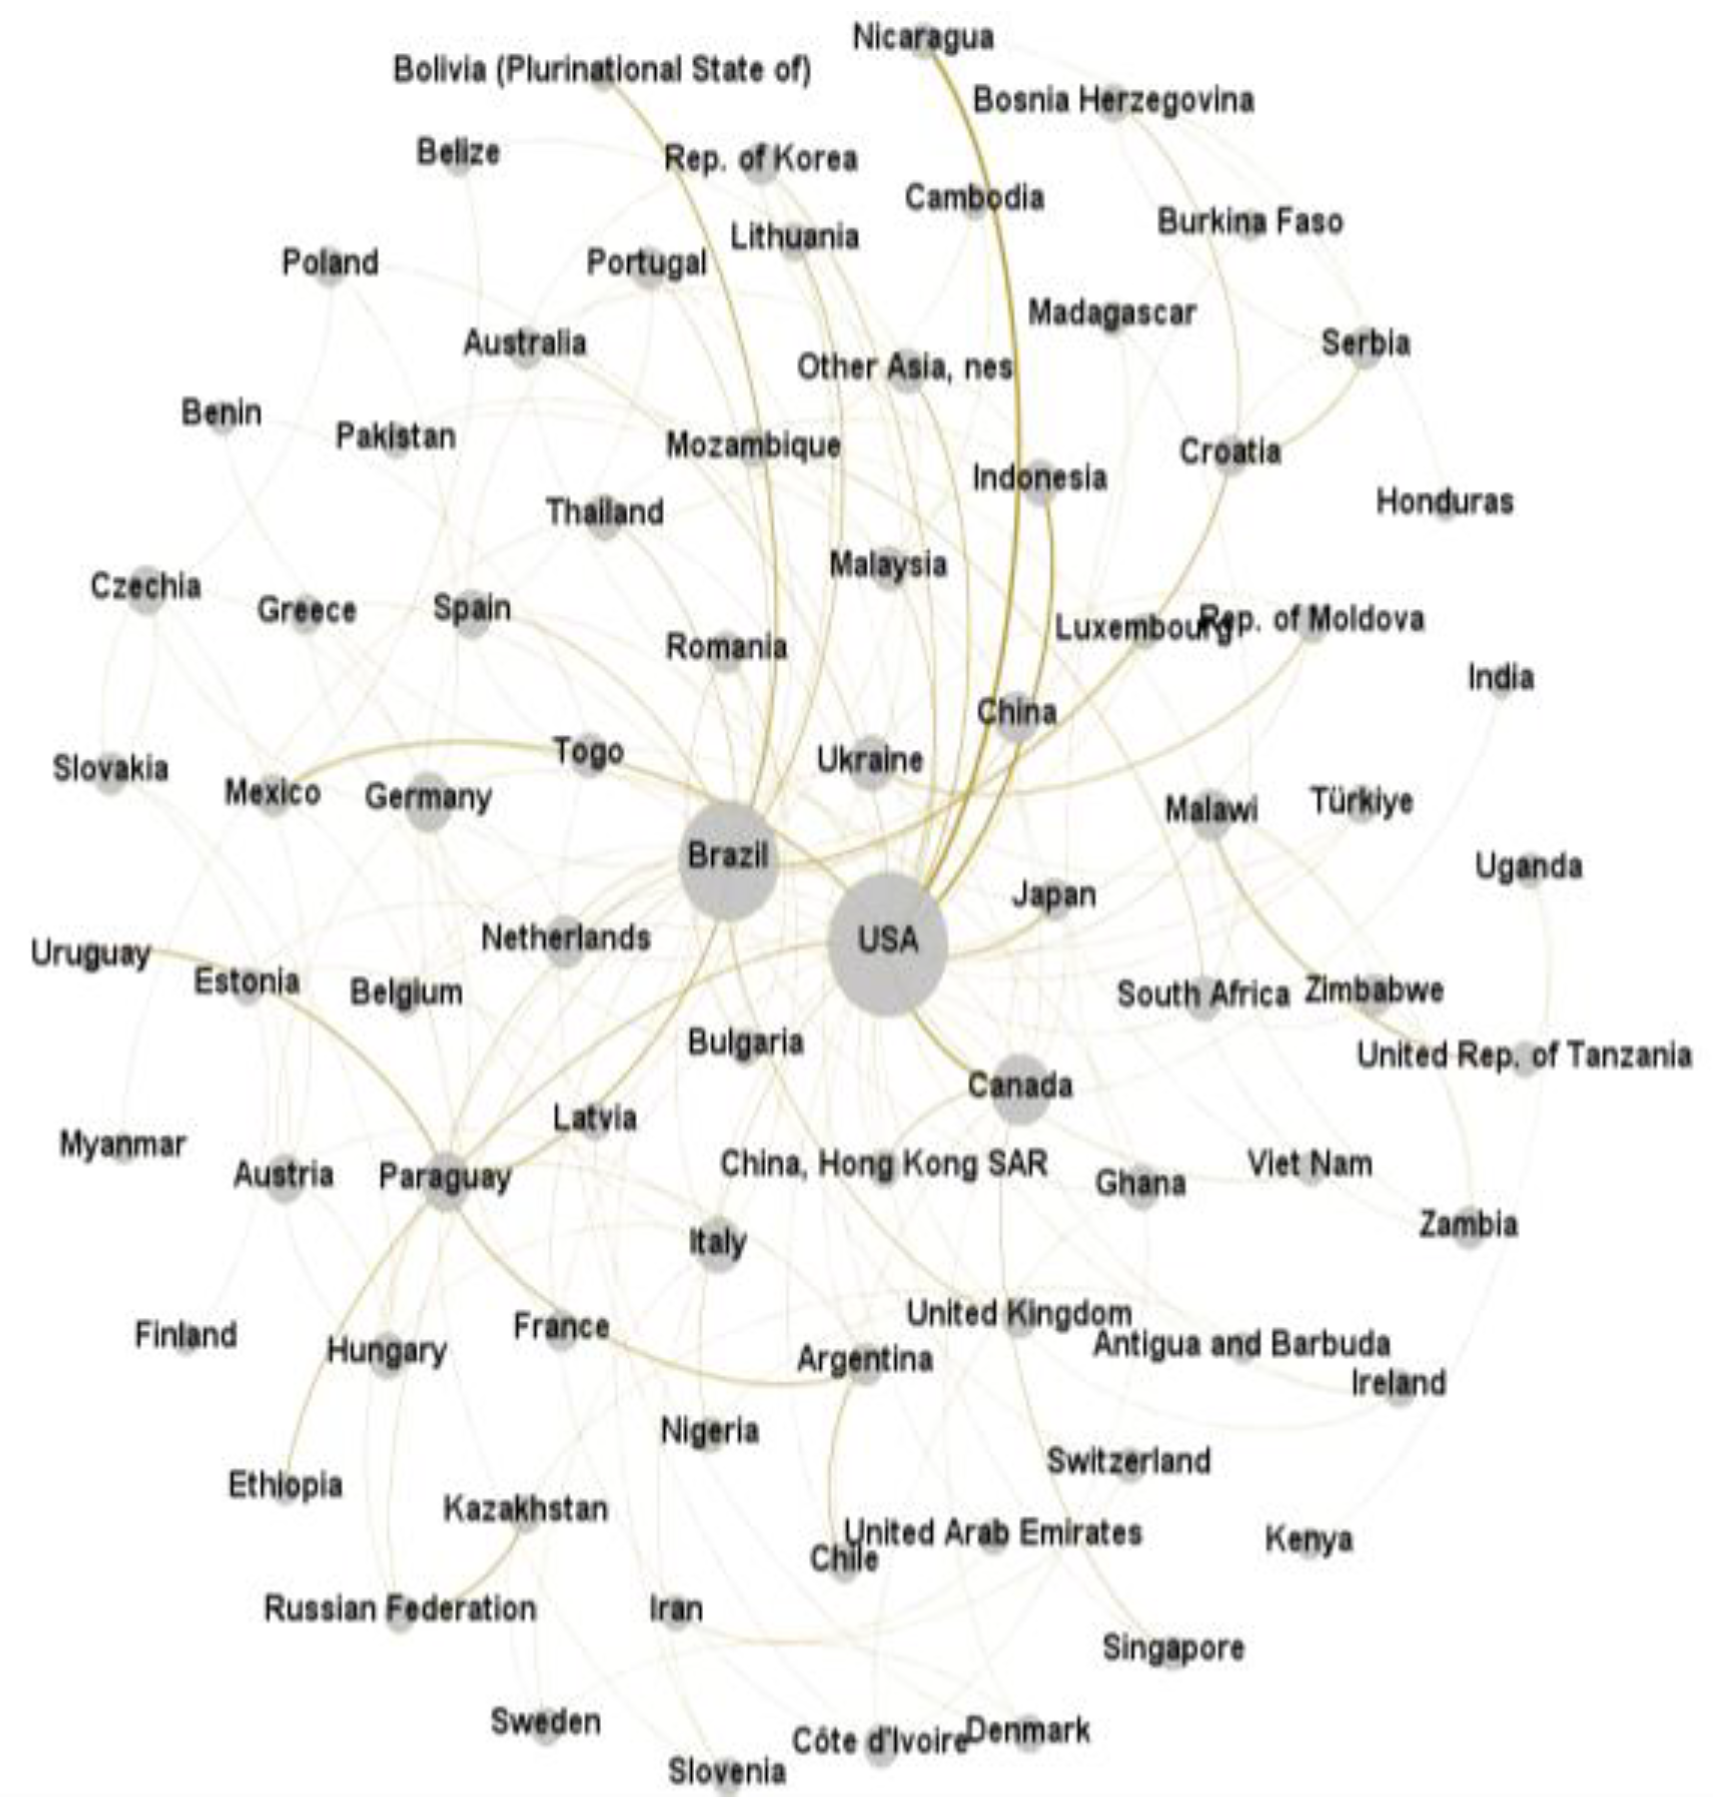
Figure 4.
The soybean trade network in 2018.
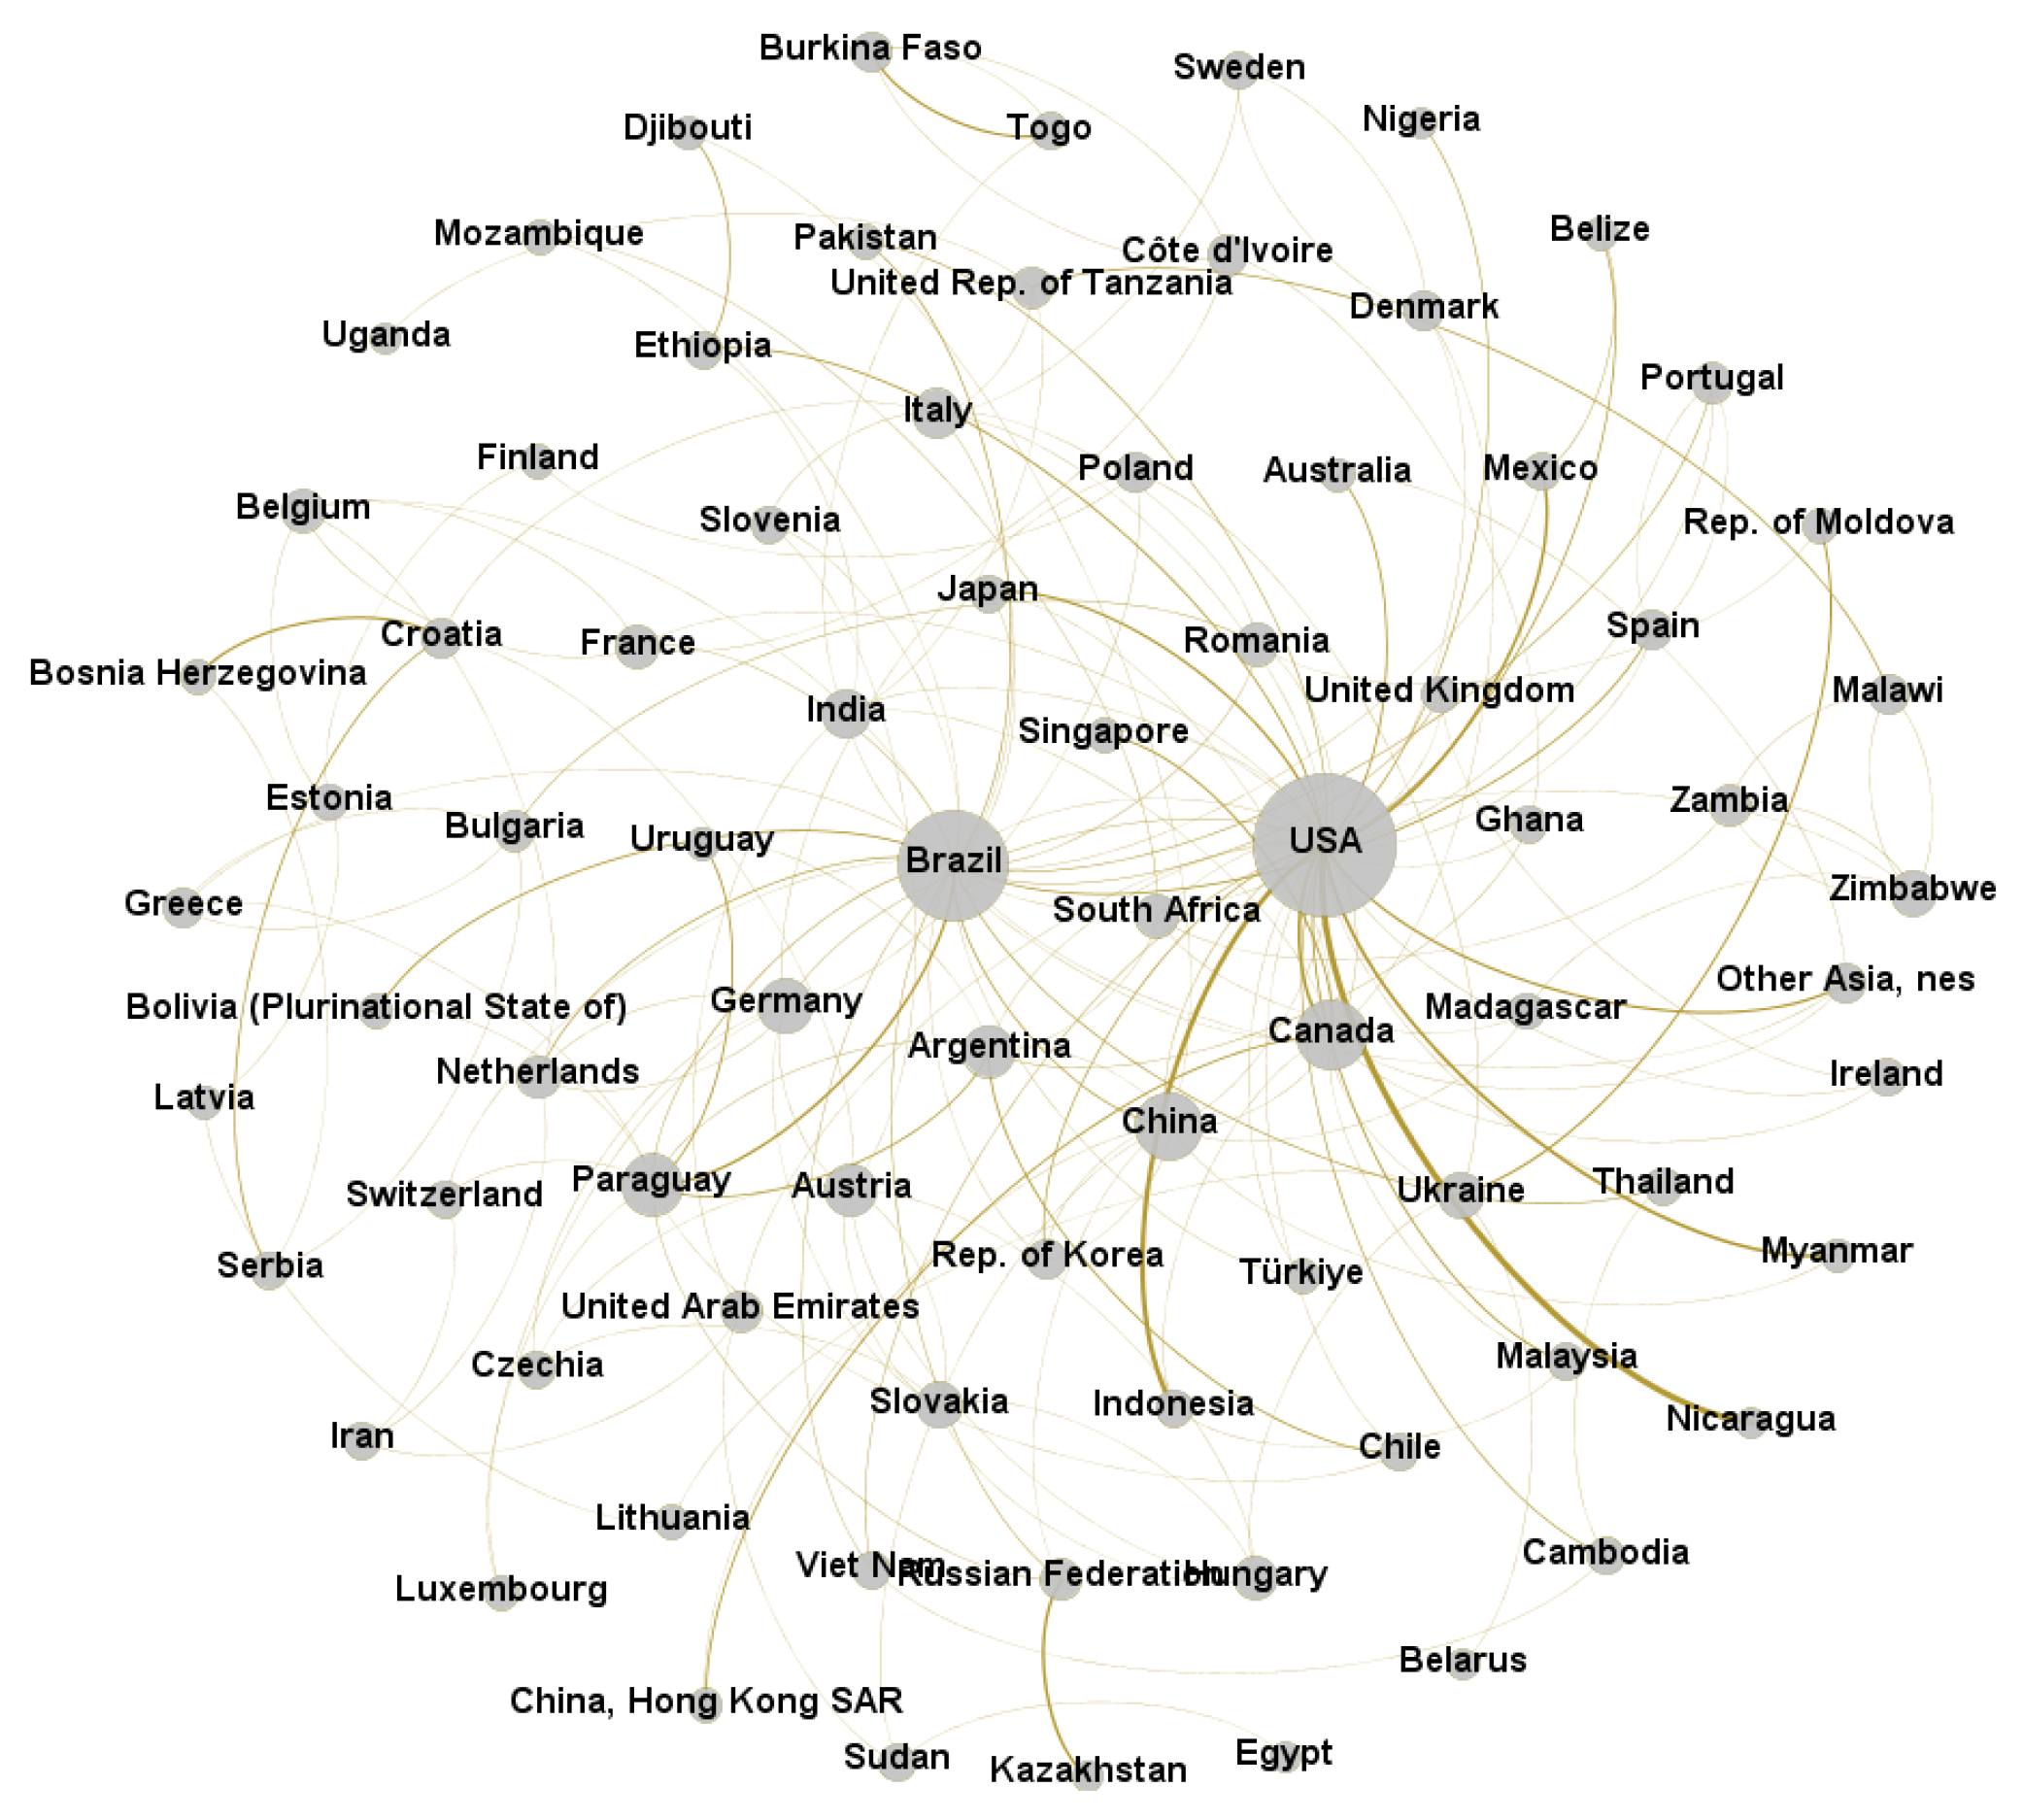
Figure 5.
The soybean trade network in 2022.
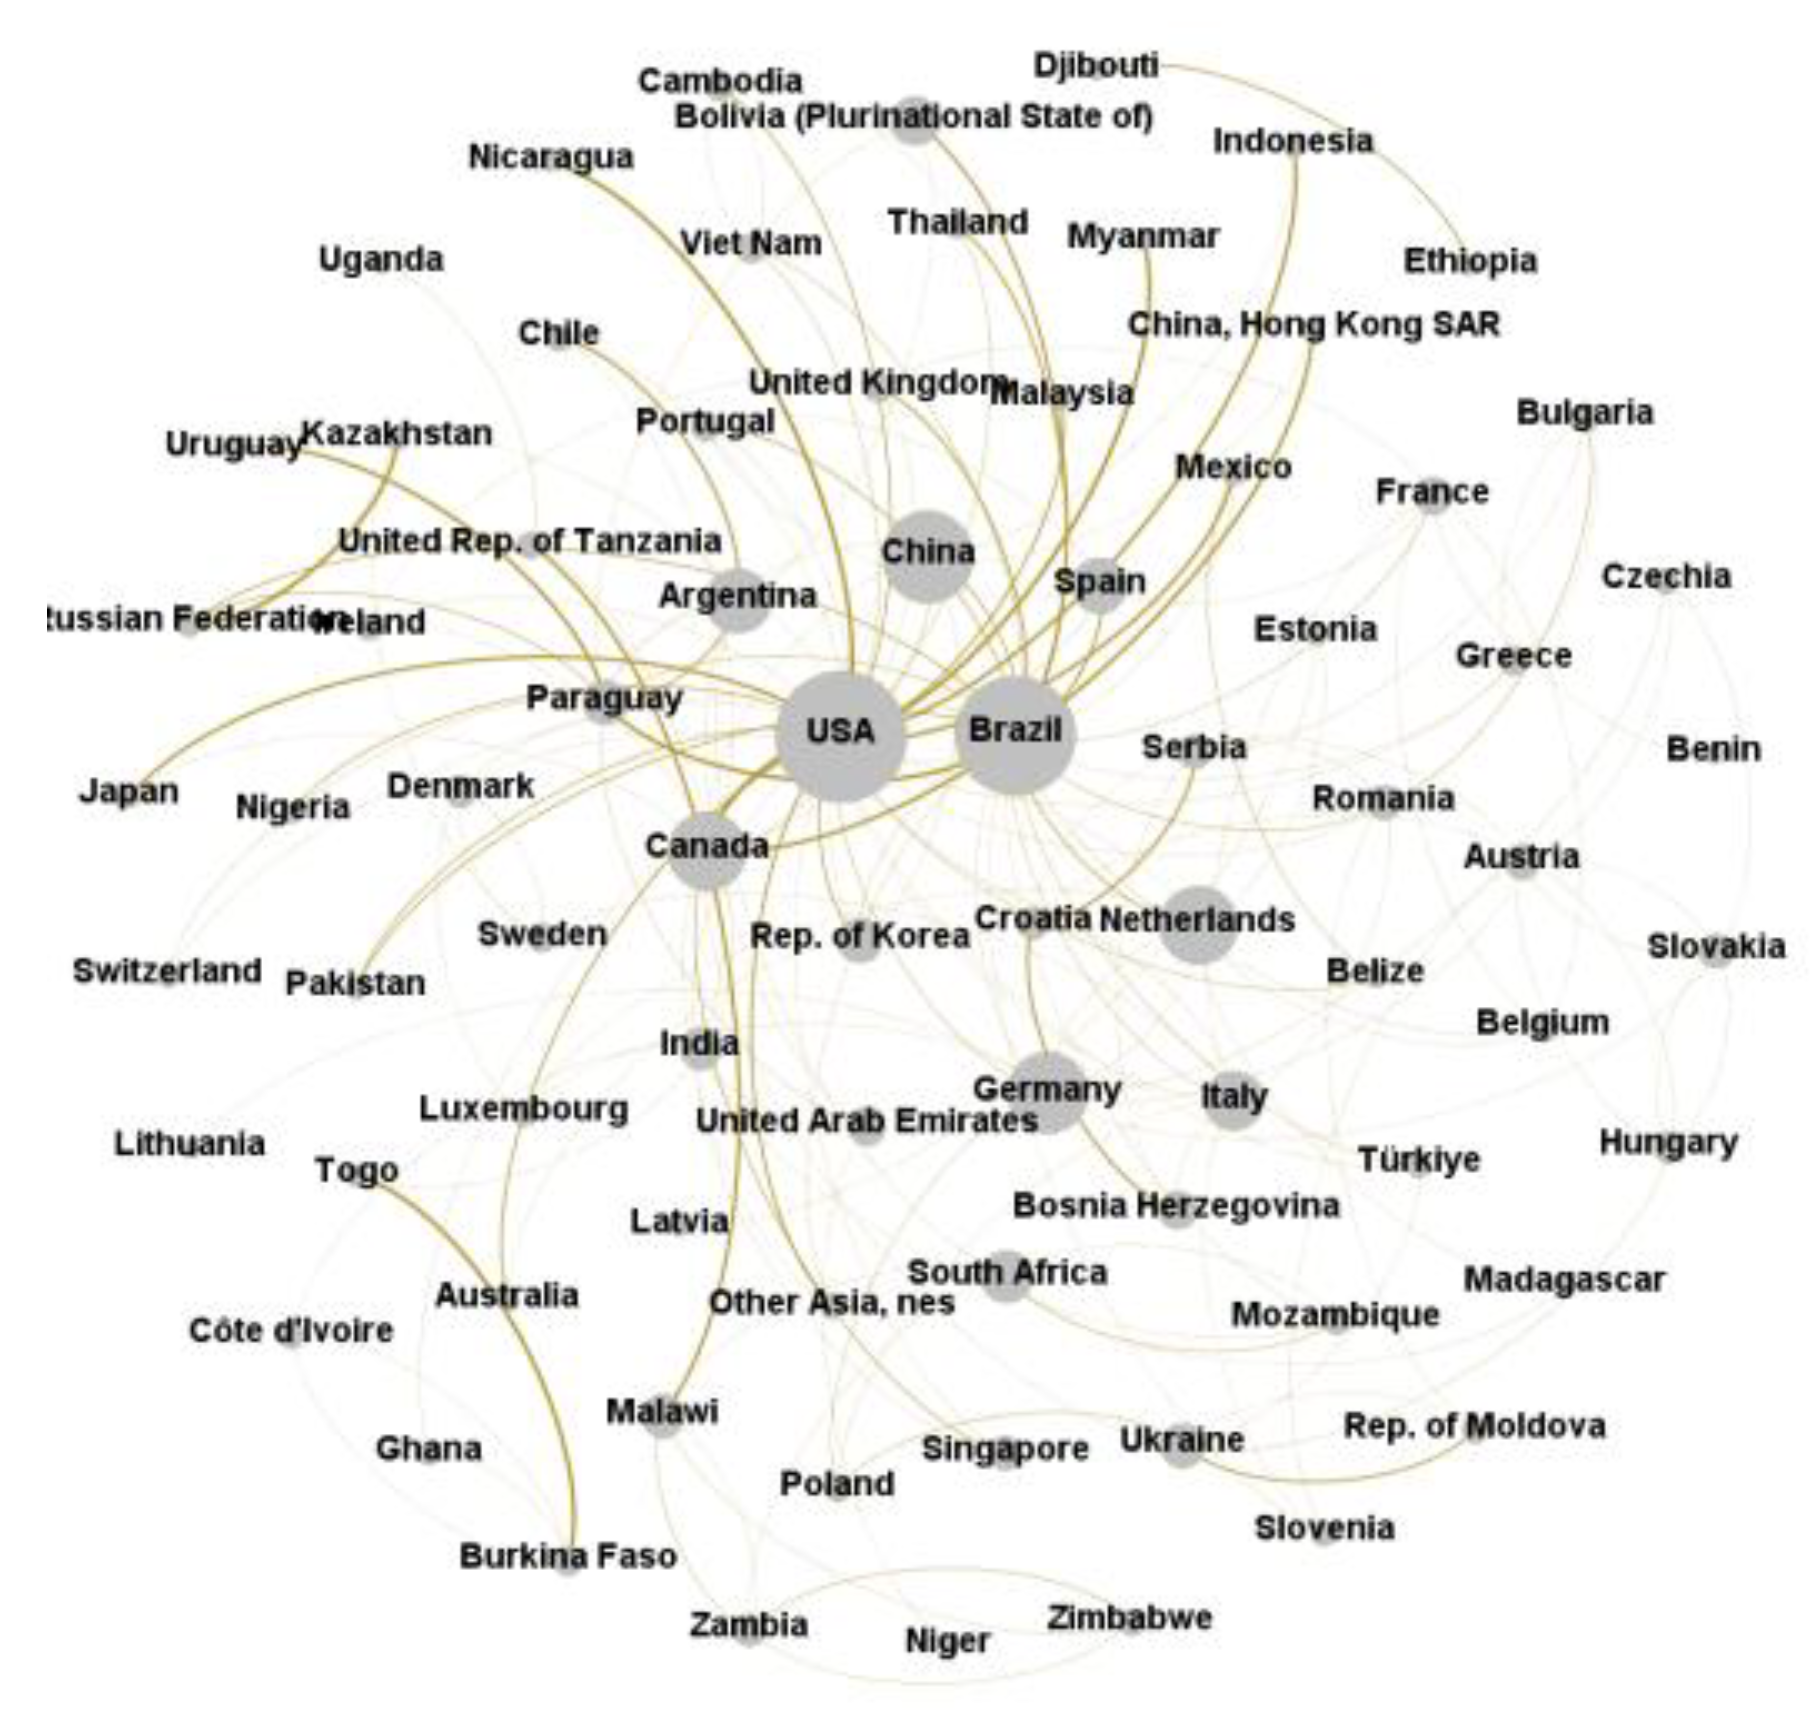
Figure 6.
Results of Goodness-of-Fit Test.
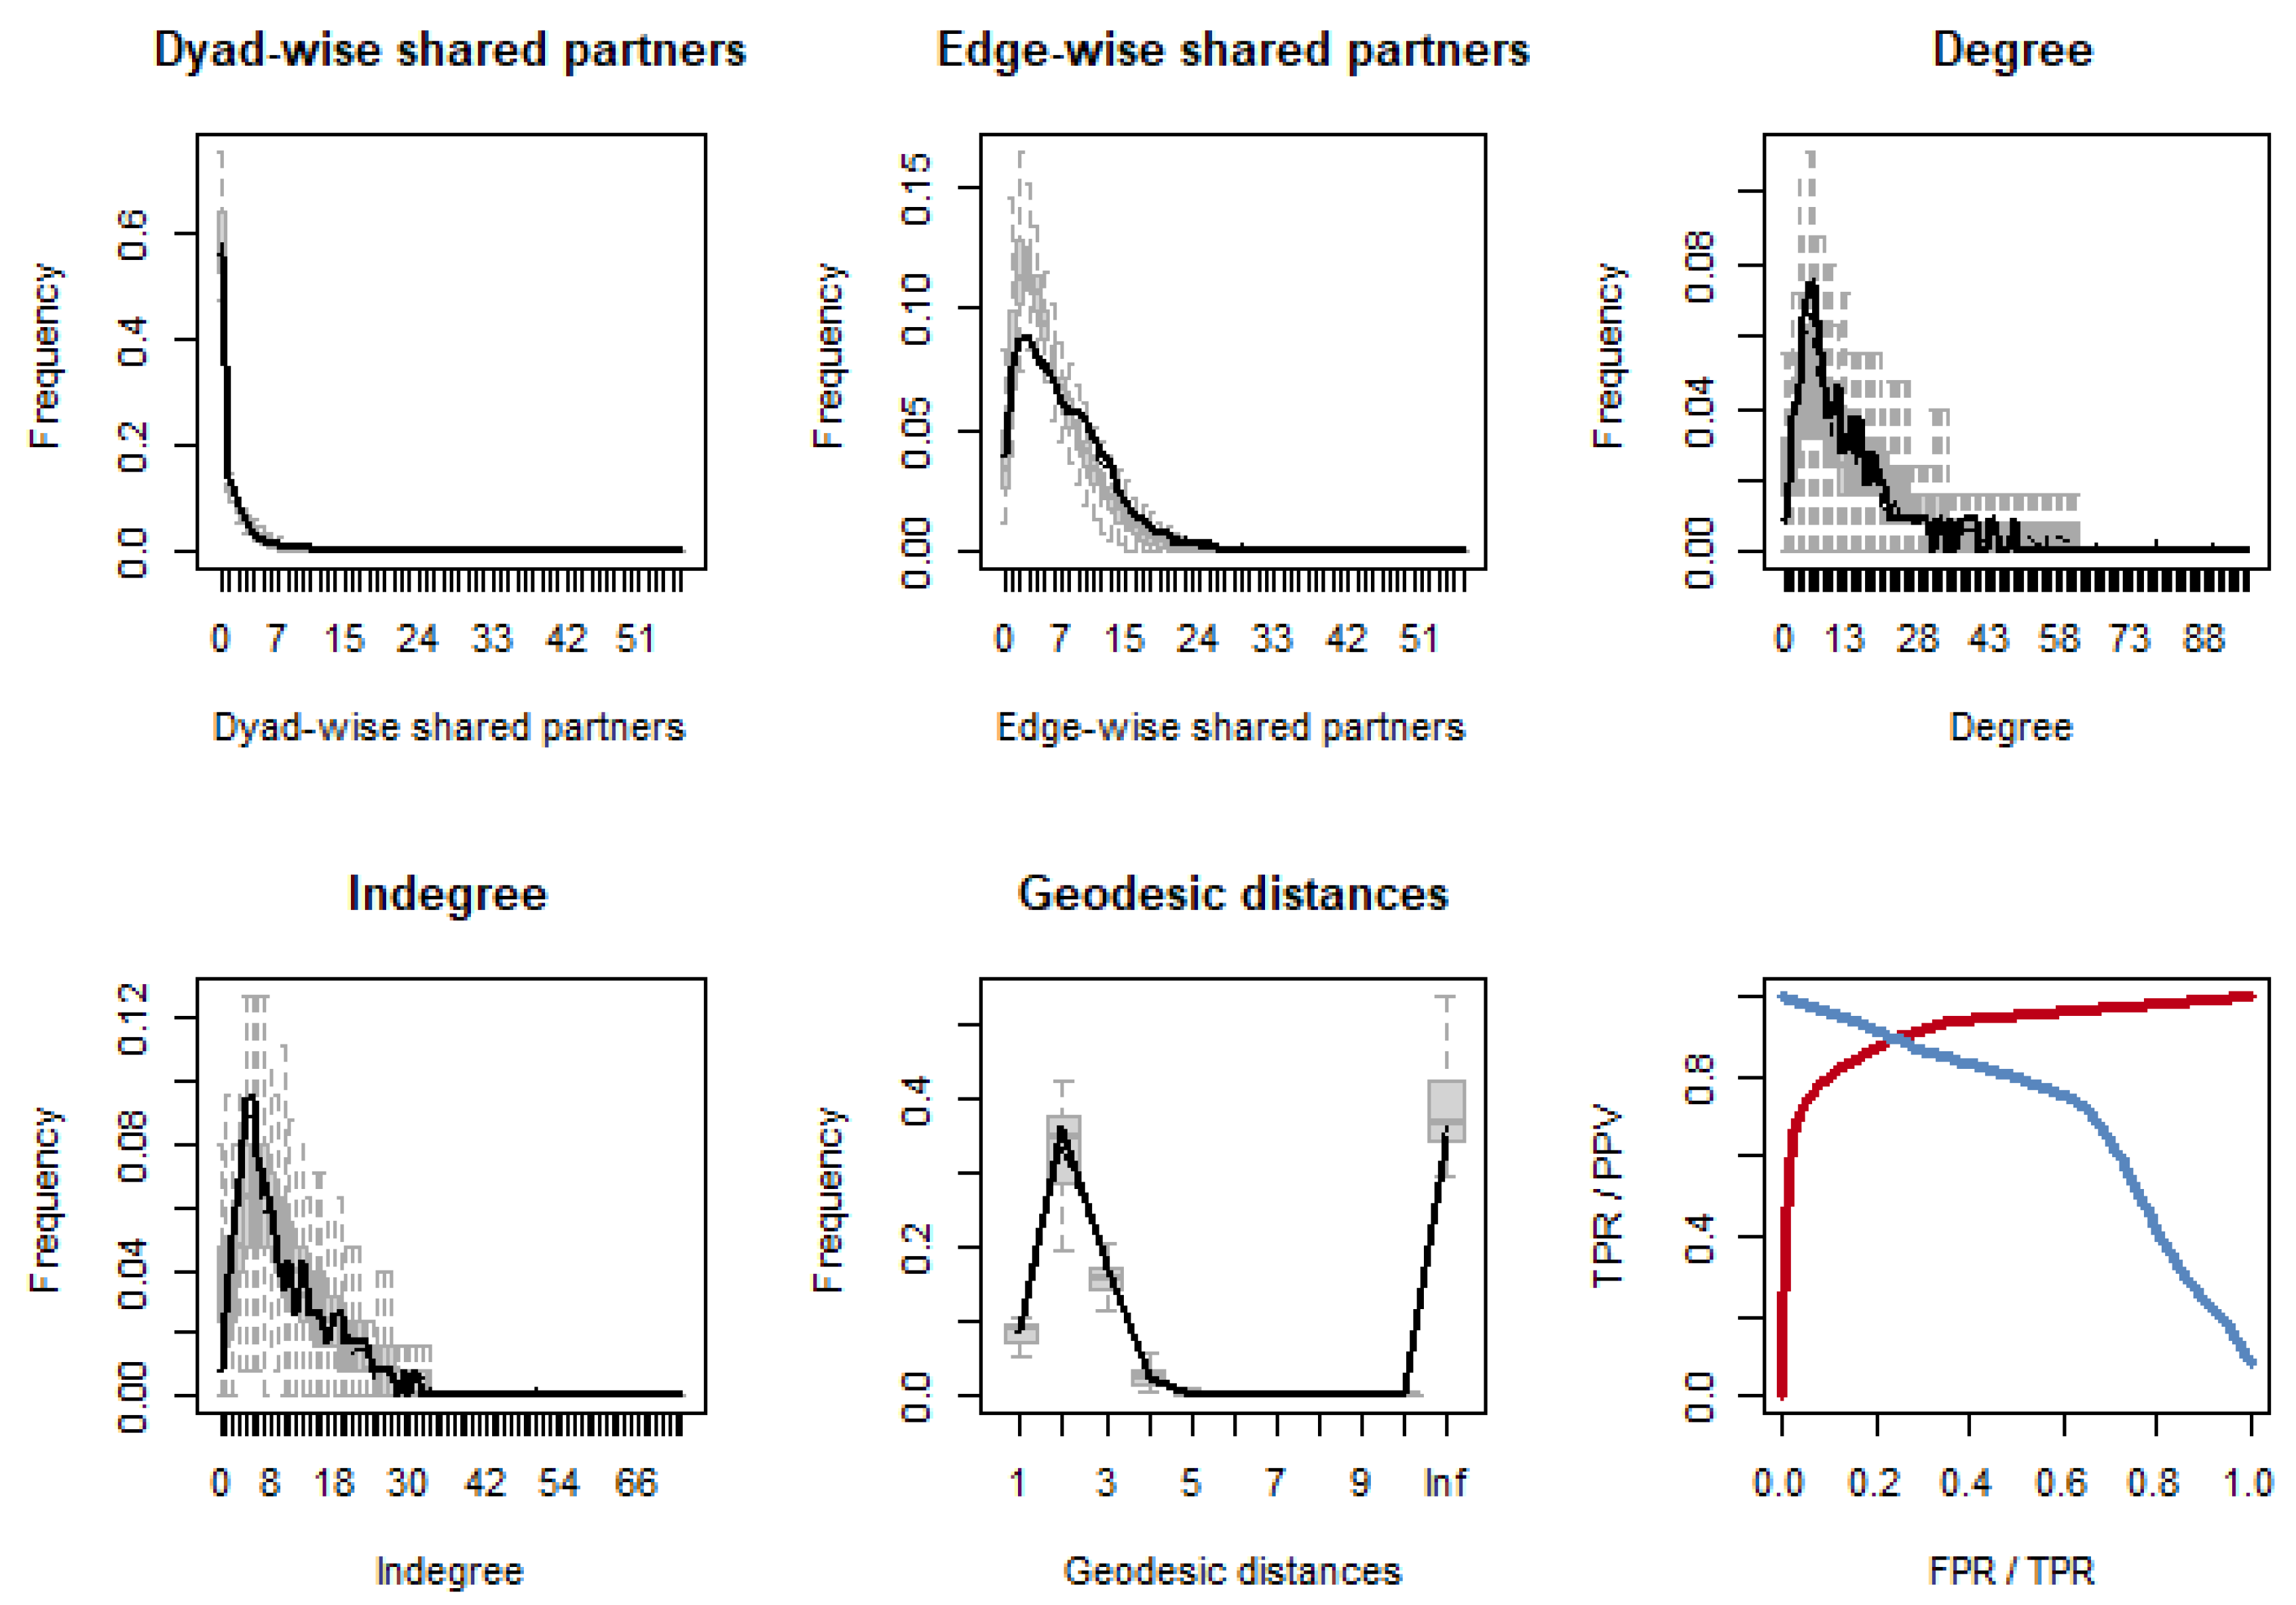

Table 1.
Calculation Results of Network Metrics.
| Year | Clustering Coefficient | Average Path Length | Density | Number of Edges |
Mean Trade Dependency | In-Degree Centralization | Out-Degree Centralization |
| 2000 | 0.167 | 2.950 | 0.023 | 935 | 0.1721 | 0.0144 | 0.0410 |
| 2002 | 0.145 | 2.898 | 0.027 | 1016 | 0.1779 | 0.0182 | 0.0473 |
| 2004 | 0.212 | 2.816 | 0.027 | 1013 | 0.1807 | 0.0170 | 0.0231 |
| 2006 | 0.185 | 2.953 | 0.024 | 1113 | 0.1881 | 0.0199 | 0.0218 |
| 2008 | 0.203 | 2.796 | 0.025 | 1263 | 0.1912 | 0.0177 | 0.0270 |
| 2010 | 0.201 | 2.651 | 0.027 | 1329 | 0.1693 | 0.0163 | 0.0136 |
| 2012 | 0.191 | 2.644 | 0.026 | 1360 | 0.1441 | 0.0163 | 0.0129 |
| 2014 | 0.233 | 2.586 | 0.028 | 1506 | 0.1579 | 0.0115 | 0.0168 |
| 2016 | 0.232 | 2.488 | 0.028 | 1458 | 0.1683 | 0.0179 | 0.0126 |
| 2018 | 0.282 | 2.537 | 0.028 | 1463 | 0.1607 | 0.0198 | 0.0096 |
| 2020 | 0.210 | 2.496 | 0.028 | 1580 | 0.1611 | 0.0201 | 0.0107 |
| 2022 | 0.290 | 2.505 | 0.030 | 1657 | 0.1588 | 0.0230 | 0.0116 |
Table 2.
Core Coefficient Table.
| T1 | T2 | |||||||
| Type | 2002 | 2003 | 2007 | 2009 | ||||
| Core Country | USA | 0.789 | USA | 0.803 | USA | 0.657 | USA | 0.743 |
| BRA | 0.224 | BRA | 0.224 | BRA | 0.375 | BRA | 0.288 | |
| Semi-peripheral Country |
FRA | 0.200 | CAN | 0.123 | NLD | 0.170 | CAN | 0.153 |
| CAN | 0.191 | NLD | 0.119 | JPN | 0.161 | ITA | 0.146 | |
| NLD | 0.110 | ITA | 0.115 | CAN | 0.158 | CHN | 0.139 | |
| CHN | 0.108 | ARG | 0.113 | ITA | 0.145 | NLD | 0.133 | |
| JPN | 0.108 | JPN | 0.113 | ESP | 0.143 | SVN | 0.122 | |
| ARG | 0.106 | FRA | 0.111 | CHN | 0.136 | AUS | 0.120 | |
| DEU | 0.100 | THA | 0.111 | KOR | 0.134 | GBR | 0.119 | |
| KOR | 0.097 | CHN | 0.107 | FRA | 0.130 | FRA | 0.116 | |
| T3 | T4 | |||||||
| Type | 2017 | 2018 | 2019 | 2022 | ||||
| Core Country | USA | 0.714 | USA | 0.743 | USA | 0.777 | USA | 0.743 |
| BRA | 0.340 | BRA | 0.307 | BRA | 0.302 | BRA | 0.324 | |
| Semi-peripheral Country |
CHN | 0.237 | CAN | 0.215 | CHN | 0.215 | CHN | 0.199 |
| CAN | 0.219 | CHN | 0.214 | CAN | 0.161 | CAN | 0.178 | |
| KOR | 0.113 | KOR | 0.119 | ARG | 0.097 | NLD | 0.126 | |
| ARG | 0.103 | IND | 0.108 | MEX | 0.096 | ARG | 0.121 | |
| VNM | 0.103 | ARG | 0.104 | PRT | 0.096 | ESP | 0.110 | |
| FRA | 0.102 | JPN | 0.102 | GBR | 0.096 | DEU | 0.106 | |
| DEU | 0.102 | PRT | 0.100 | ITA | 0.095 | ITA | 0.105 | |
| PRT | 0.102 | ESP | 0.100 | THA | 0.095 | VNM | 0.102 | |
Table 3.
Meanings of TERGM Regression Variables and Their Hypothesis Tests.
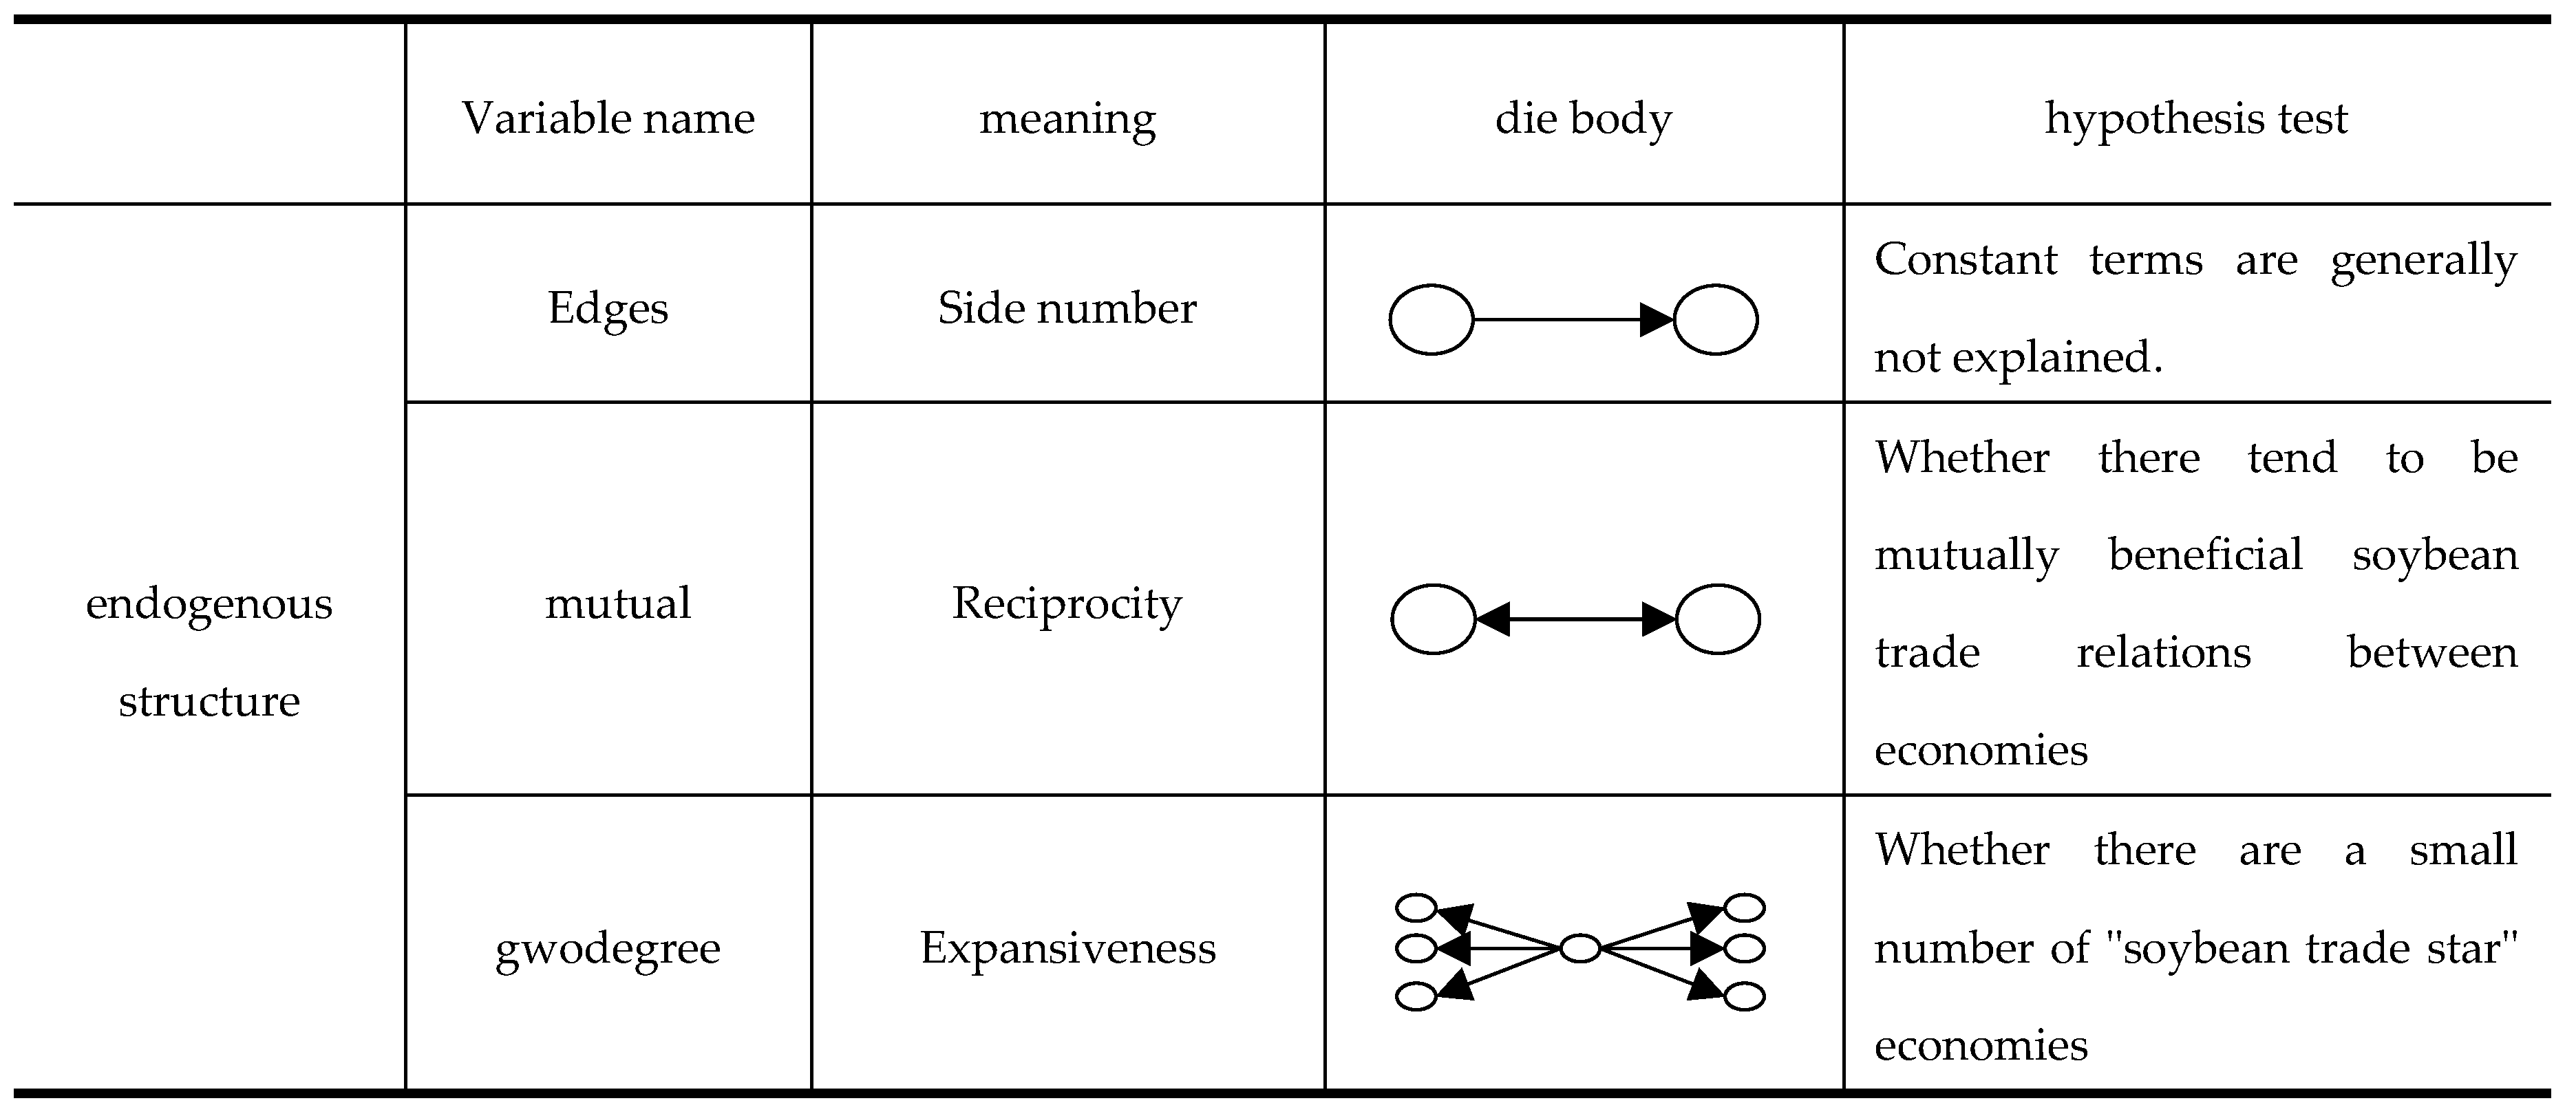 |
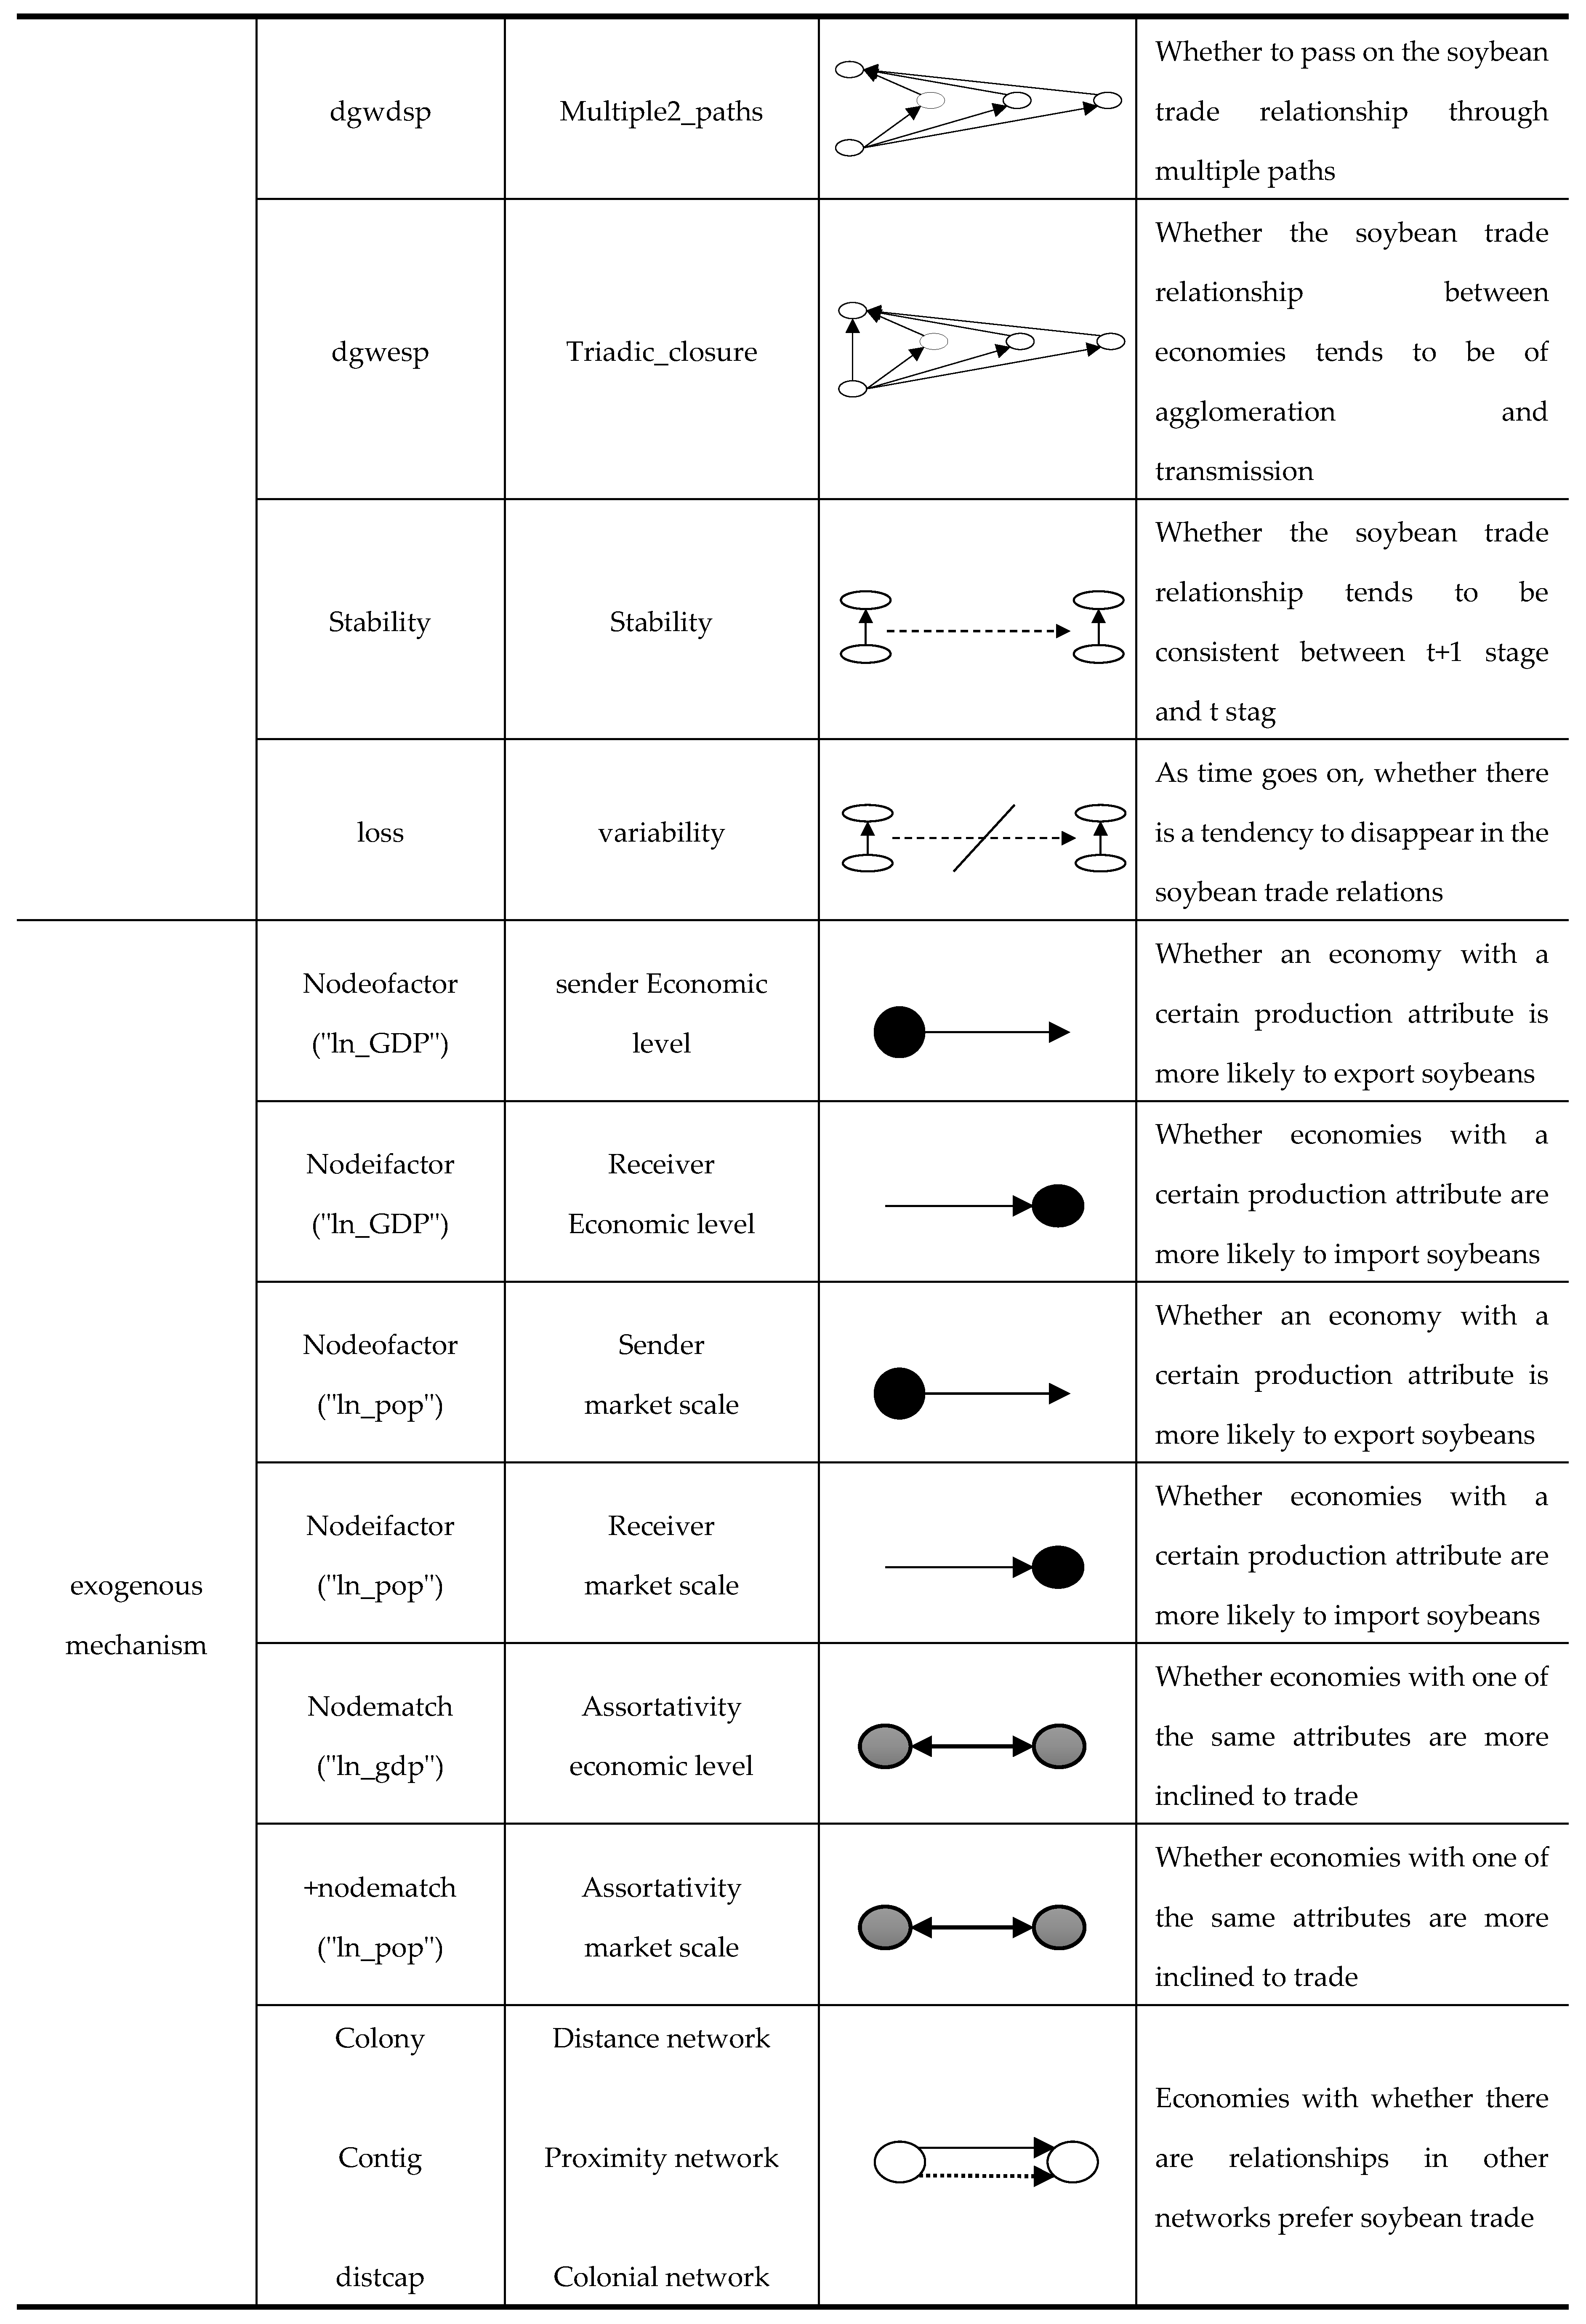 |
Table 4.
TERGM Estimation Results.
| Mode 1 | Mode 2 | Mode 3 | Mode4 | |
| edges | -27.07767 *** (0.20125) |
-27.32832 *** (0.21494) |
-14.08031 *** (0.22414) |
-9.41716 *** (0.24931) |
| nodeicov.ln_gdp | 1.08865 *** (0.01657) |
1.07584 *** (0.01735) |
0.42967 *** (0.01641) |
0.93783 *** (0.02009) |
| nodeicov.ln_pop | -0.52736 *** (0.01781) |
-0.52476 *** (0.01872) |
-0.38485 *** (0.01581) |
-0.29520 *** (0.02181) |
| nodeocov.ln_gdp | 1.121101 *** (0.01642) |
1.22884 *** (0.01720) |
0.46690 *** (0.01495) |
0.22360 *** (0.01837) |
| nodeocov.ln_pop | 0.36922 *** (0.01792) |
0.48125 *** (0.01886) |
0.42533 *** (0.01473) |
0.30501 *** (0.02069) |
| colony | 0.46980 *** (0.05097) |
0.51227 *** (0.05042) |
0.34991 *** (0.06197) |
|
|
contig |
2.13160 *** (0.04313) |
1.95234 *** (0.04044) |
1.17630 *** (0.05391) |
|
| distcap | -0.00012 *** (0.00000) |
-0.00005 *** (0.00000) |
-0.00005 *** (0.00000) |
|
| mutual | 0.96381 *** (0.03617) |
0.63575 *** (0.04151) |
||
|
gwodegree |
-1.09512 *** (0.10964) |
-1.84010 *** (0.12466) |
||
| dgwdsp | -0.06351 *** (0.00195) |
-0.04973 *** (0.00193) |
||
|
dgwesp |
1.21727 *** (0.02608) |
1.05722 *** (0.02775) |
||
|
Stability |
1.52725 *** (0.01239) |
|||
| loss | -0.02239 *** (0.00320) |
Table 5.
Results of the Robustness Test.
| Model 5 | Model 6 | Model 7 | |
| edges | -8.95457 *** | -8.68033 *** | -12.75974 * |
| (-0.46803) | (-0.47709) | [-13.60265; -12.10730] | |
| nodeicov.ln_gdp | 0.35368 *** | 0.35878 *** | 0.60186 * |
| (-0.03737) | (-0.0367) | [0.53394; 0.69151] | |
| nodeicov.ln_pop | -0.24479 *** | -0.21820 *** | -0.34711 * |
| (-0.04177) | (-0.04038) | [ -0.44474; -0.27274] | |
| nodeocov.ln_gdp | 0.19936 *** | 0.17597 *** | 0.42443 * |
| (-0.0338) | (-0.03374) | [0.36398; 0.48986] | |
| nodeocov.ln_pop | 0.35016 *** | 0.29641 *** | 0.28269 * |
| (-0.03924) | (-0.03821) | [0.21398; 0.34542] | |
| colony | 0.38307 ** | 0.50797 *** | 0.37477 * |
| (-0.1315) | (-0.1223) | [0.28146; 0.46397] | |
| contig | 1.29630 *** | 1.29089 *** | 1.12567 * |
| (-0.10602) | (-0.10285) | [1.01282; 1.26745] | |
| distcap | -0.00005 *** | -0.00005 *** | -0.00006 * |
| (-0.00004) | (-0.00001) | [ -0.00007; -0.00005] | |
| mutual | 0.71290 *** | 0.54929 *** | 0.67012 * |
| (-0.09101) | (-0.087) | [0.59583; 0.73729] | |
| gwodegree | -1.75009 *** | -1.97298 *** | -2.74005 * |
| (-0.22) | (-0.22571) | [ -3.19400; -2.39058] | |
| dgwdsp | -0.05673 *** | -0.06422 *** | -0.04562 * |
| (-0.00423) | (-0.00411) | [ -0.05156; -0.03854] | |
| dgwesp | 1.58793 *** | 0.96529 *** | 0.73895 * |
| (-0.04971) | (-0.04945) | [ 0.68589; 0.79498] | |
| Stability | 1.61264 *** | 1.52177 *** | 1.48738 * |
| (0.02647) | (-0.02475) | [1.45852; 1.51794] | |
| loss | -0.10031 *** | -0.03244 * | -0.03509 * |
| (-0.02329) | (-0.02291) | [ -0.05487; -0.01544] |
Disclaimer/Publisher’s Note: The statements, opinions and data contained in all publications are solely those of the individual author(s) and contributor(s) and not of MDPI and/or the editor(s). MDPI and/or the editor(s) disclaim responsibility for any injury to people or property resulting from any ideas, methods, instructions or products referred to in the content. |
© 2025 by the authors. Licensee MDPI, Basel, Switzerland. This article is an open access article distributed under the terms and conditions of the Creative Commons Attribution (CC BY) license (http://creativecommons.org/licenses/by/4.0/).
Copyright: This open access article is published under a Creative Commons CC BY 4.0 license, which permit the free download, distribution, and reuse, provided that the author and preprint are cited in any reuse.


