
Submitted:
23 March 2025
Posted:
26 March 2025
You are already at the latest version
Abstract
This study aims to reveal the spatiotemporal evolution patterns of the global frozen meat trade network from 2003 to 2022 and assess its static and dynamic structural resilience. Based on UN commodity trade data, directed weighted networks for beef, pork, mutton, and poultry are constructed. By combining complex network theory and simulation and emulation models, the static resilience is analyzed from four dimensions: transmissibility, clustering, hierarchy, and assortativity. The impact of single node failures on network performance is simulated to assess dynamic resilience. The results indicate that the global frozen meat trade network shows a trend of polarization, with China emerging as the largest import hub and Brazil becoming the dominant exporter of beef and poultry, reflecting the coexistence of regionalization and globalization. The static resilience analysis reveals that the weighted network exhibits prominent hierarchy and increased assortativity. The poultry network has the highest transmissibility, while the beef network demonstrates the strongest resilience. Interruption simulation results show that the failure of core nodes causes more significant damage to the weighted network, but the network’s invulnerability to disruption increases over time. The conclusion emphasizes that the resilience of the frozen meat trade network is driven by both weights and topological structure. Reducing dependence on key nodes through diversified trade partners and optimizing regional cooperation is crucial for enhancing trade stability. The weighted directed network model and dynamic resilience evaluation framework proposed in this study provide new methods for global food trade risk management and supply chain optimization.
Keywords:
Frozen meat
; Trade network
; Structural resilience
; Complex network
1. Introduction
With the global economic growth and the improvement of living standards, international frozen meat trade has become an important part of global trade. It balances meat supply and demand, promotes economic development, and meets the diversified needs of consumers[1]. According to data from UN commodity trade, the total value of frozen meat trade has increased by 231.6% over the past 20 years, with an average annual growth rate of 11.5%; the trade volume has increased by 78.3%, with an average annual growth rate of 3.9%. Beef, pork, mutton, and poultry are the dominant categories, with average annual growth rates of 3.9%, 4.7%, 2.1%, and 3.4%, respectively. This demonstrates the vitality of frozen meat trade and the differentiated growth of various types of meat. However, the global meat trade landscape is complex and influenced by various factors. To protect domestic industries, many governments adopt policy measures to restrict meat imports and exports[2]. In recent years, public health crises such as the COVID-19 pandemic[3]and African swine fever have posed challenges to the frozen meat supply chain. In order to fill supply-demand gaps and mitigate the impact of international market shocks, countries need to carefully consider moderately increasing meat imports[4]. Scholars have studied the relationship between meat and the economy: Cheng et al. (2015) found that China's meat imports were negatively correlated with prices and positively correlated with real GDP[5]; Aranda et al. (2019) analyzed the import barriers faced by Brazilian chicken[6]; Chapot et al. (2021) explored the impact of COVID-19 on the poultry food system[7]; Calvia (2024) pointed out that the global meat price cycle is approximately 3.8 to 4.6 years, with price synchronization intensifying during the COVID-19 pandemic and the Russia-Ukraine conflict. Research on the resilience of the global frozen meat trade network can provide valuable insights for addressing future trade risks[8].
In the field of food studies, numerous research efforts have been devoted to trade network pattern. Ercsey-Ravasz et al. (2012) found that international agricultural and food trade networks are highly heterogeneous, with a small number of countries occupying key positions[9]. Torreggiani et al. (2018) revealed that international food trade networks have a multi-layered structure, where trade agreements and geographical proximity are critical factors[10]. Chung et al. (2020) examined the spatiotemporal dynamics of the global meat trade network, focusing on influences such as trade agreements[1]. Karakoc and Konar (2021) discovered a synergistic relationship between the efficiency and resilience of food trade networks when considering weighted factors[11]. Wang and Dai (2021) and Wang et al. (2023) studied the evolution of global food/agricultural trade networks, noting increasing complexity and structural multipolarity[12,13]. Clemente et al. (2023) found that agricultural and food trade networks are influenced by multiple factors[14]. Silvestrini et al. (2023) showed that the strength and complexity of food trade networks have significantly increased[15]. Alhussam et al. (2023) found that the centrality of the food trade network is positively correlated with food security, while geographical distance negatively impacts food security[16].
In recent years, research on network resilience has grown significantly. The concept originates from mechanics, where it is used to describe the ability of materials to recover[17], and was later introduced to ecosystem restoration studies[18], eventually expanding to complex social-ecological systems. As complex network theory evolved, academic discussions on network resilience increased, covering fields such as urban networks[19], transportation networks[20], economic networks[21], supply chain networks[22], and ecological networks[23]. Network resilience refers to the ability of network members to collaborate across multiple dimensions, effectively responding to external shocks and pressures, while also possessing recovery or transformation capabilities[24].
In the early stages of the development of complex network theory, researchers focused on the basic topological properties of networks, such as node degree distribution, clustering coefficient, and path length. These characteristics laid the foundation for subsequent research on network resilience. Ash and Newth (2007) proposed optimizing network structures to enhance resilience[25]. As the theory advanced, researchers began exploring the application of network resilience in different fields, particularly in supply chains and infrastructure networks. Berche et al. (2009) emphasized the importance of key nodes[26], while Reggiani (2013) explored the resilience of transportation networks, noting that scale-free networks performed better under random failures. Mid-stage scholars delved deeper into the analysis of network characteristics[27], with Zhao et al. (2011) examining the impact of topological structures on supply chain resilience[28]. In recent years, research has expanded into multiple dimensions and fields. Chopra et al. (2016) proposed a resilience assessment framework for infrastructure[29], while Wang et al. (2018) and Yang et al. (2018) analyzed the relationship between network characteristics and resilience[30,31]. Li et al. (2020) found that network characteristics better reflect resilience than network type[32]. Wang and Dai (2021) explored the application of robustness, elasticity, and centrality indicators[12], while Wang et al. (2021) revealed that the complexity of trade relations enhances resilience[33]. Tan and Ma (2022) observed that a "two-core separation" structure reduces resilience[34], and Liu et al. (2022) analyzed the robustness and resilience conceptual frameworks of international trade networks[35]. Jiao (2024) assessed the structural resilience of trade networks[36], while Li et al. (2024) analyzed the stability and vulnerability of the global chromium ore trade network[37]. These studies have enriched our understanding of the static resilience of networks.
Research on network resilience in the food sector has also made significant progress, Dolfing et al. (2019) analyzed the impact of network topology, climate change, and sudden shocks on the evolution of food trade networks, finding that topology has a significant effect on resource distribution and population growth[38]. Hedlund et al. (2022) studied the impact of climate change on the stability of crop trade networks, noting that the maize trade network is the most vulnerable, while the wheat and rice networks are more resilient[39]. Enns et al. (2023) explored the increased vulnerability of wildlife meat trade networks during the COVID-19 pandemic[40]. Dong et al. (2024) simulated trade node attacks to analyze the resilience of the cold-chain meat product trade network, finding that it demonstrated robustness under random attacks and vulnerability under targeted attacks[41]. Ji et al. (2024) and H. Xu et al. (2024) studied the structural changes, dynamic evolution characteristics, and potential vulnerabilities of the global food trade network, revealing the tightness of network connections and the resilience differences among different crop trade networks[42,43]. Through a systematic literature review and analysis, this study summarizes and organizes the various indicators related to network structure resilience, as shown in Error! Reference source not found. below.

Table 1.
Literature on indicators related to network structure resilience.
| Evaluation Dimensions | Measurement Indicators | Some of the Mentioned Literatures |
| redundancy | network density | Gao et al. (2016) [44]; Wu et al. (2024)[45]. |
| Number of nodes and edges | Yuan et al.(2022)[46]; Chen and Chen (2023)[47]; Xu and Xu (2024)[48]. | |
| average degree | Kim et al. (2015)[49]. | |
| connectivity | global efficiency | Bai et al. (2023)[50]; Ji et al. (2024)[42]; Li et al. (2024)[51]. |
| average path length | Gao et al. (2015)[52]; Kim et al. (2017)[53]; Herrera et al. (2016)[54]. | |
| diameter | Berche et al. (2009)[26]; Zhao et al. (2011)[28]; Miao et al. (2024)[55]. | |
| proportion of nodes in the largest connected subgraph | Kim et al. (2017)[53]; Reggiani et al. (2013)[27]; Dong et al. (2021)[56]. | |
| average number of independent paths | Li et al. (2024)[51]; Wu et al. (2024)[45]. | |
| clustering |
clustering coefficient | Wan et al. (2021)[57]; Artime et al. (2024)[58]; Liu et al. (2022)[35]. |
| Modularity | Chopra et al. (2016)[29]; Ash and Newth (2007)[25]. | |
| reciprocity | Miao et al. (2024)[55]. | |
| hierarchy | degree distribution | Artime et al. (2024)[58]; Reggiani et al. 2013()[27]. |
| Gini coefficient | Sun et al. (2023)[59]. | |
| assortativity | Pearson correlation-based assortativity coefficient | Ash and Newth (2007)[25]; Sun et al. (2023)[59]. |
| cohesion | K-shell | Wu et al. (2024)[45]; Wang an Dai et al. (2021)[12] |
| centrality | degree centrality | Yuan et al. (2022)[46]; Miao et al. (2024)[55]; Meng et al. (2023)[60]. |
| eigenvector centrality | Meng et al. (2023)[60]; Ji et al. (2024)[42] | |
| closeness centrality | Clark et al. (2018)[61]; Berche et al. (2009)[26]; Li et al. (2020)[32]. | |
| betweenness centrality | Xu and Xu et al. (2024)[48]; Kim et al. (2015)[49]. | |
| Pagerank centrality | Meng et al. (2023)[60]; Ji et al. (2024)[42]. |
The existing research on trade network patterns and network resilience based on complex network theory provides a valuable foundation for this study, yet there are still several research gaps: (1) There is a lack of systematic and widely accepted evaluation standards for trade network resilience. Given the uniqueness of each network, resilience evaluation indicators should be customized for specific networks. (2) In the resilience assessment of the food trade network, although relevant results have been achieved in the research on static resilience related to network structural characteristics, most resilience studies do not take into account the weighting factors of trade intensity distance. Research on the resilience of weighted networks is relatively scarce. Meanwhile, research on dynamic resilience assessment under disruptions is still in its infancy. (3) Compared to resilience studies in energy and mineral trade networks, research on food trade networks is relatively insufficient, and there is a significant gap in the resilience studies of frozen meat trade networks. This necessitates a comprehensive analysis of the evolution of frozen meat trade network resilience from both temporal and spatial dimensions.
This article first constructs a directed weighted trade network based on global frozen meat trade data from 2003 to 2022 provided by the United Nations Commodity Trade Statistics Database. Then, by analyzing the network's structural characteristics and simulating the performance under single node disruptions, it empirically studies the network's static resilience and dynamic structural resilience. The specific contributions are as follows: (1) From both temporal and spatial perspectives, the static and dynamic resilience of the frozen meat trade network are analyzed and visualized in depth. This analysis highlights the critical role of visualization techniques in studying network resilience. Additionally, this analysis has profound significance for improving the security and stability of frozen meat trade supply. (2) A dynamic resilience evaluation model under disruption disturbances is designed, which provides an important supplement and reference to the trade network resilience evaluation framework. (3) By simulating resilience loss caused by single node disruptions, we rank the importance of nodes in the frozen meat trade network and identify key nodes. This research provides a scientific basis for enhancing trade security and stability.
2. Research Methods and Data Sources
2.1. Research Framework
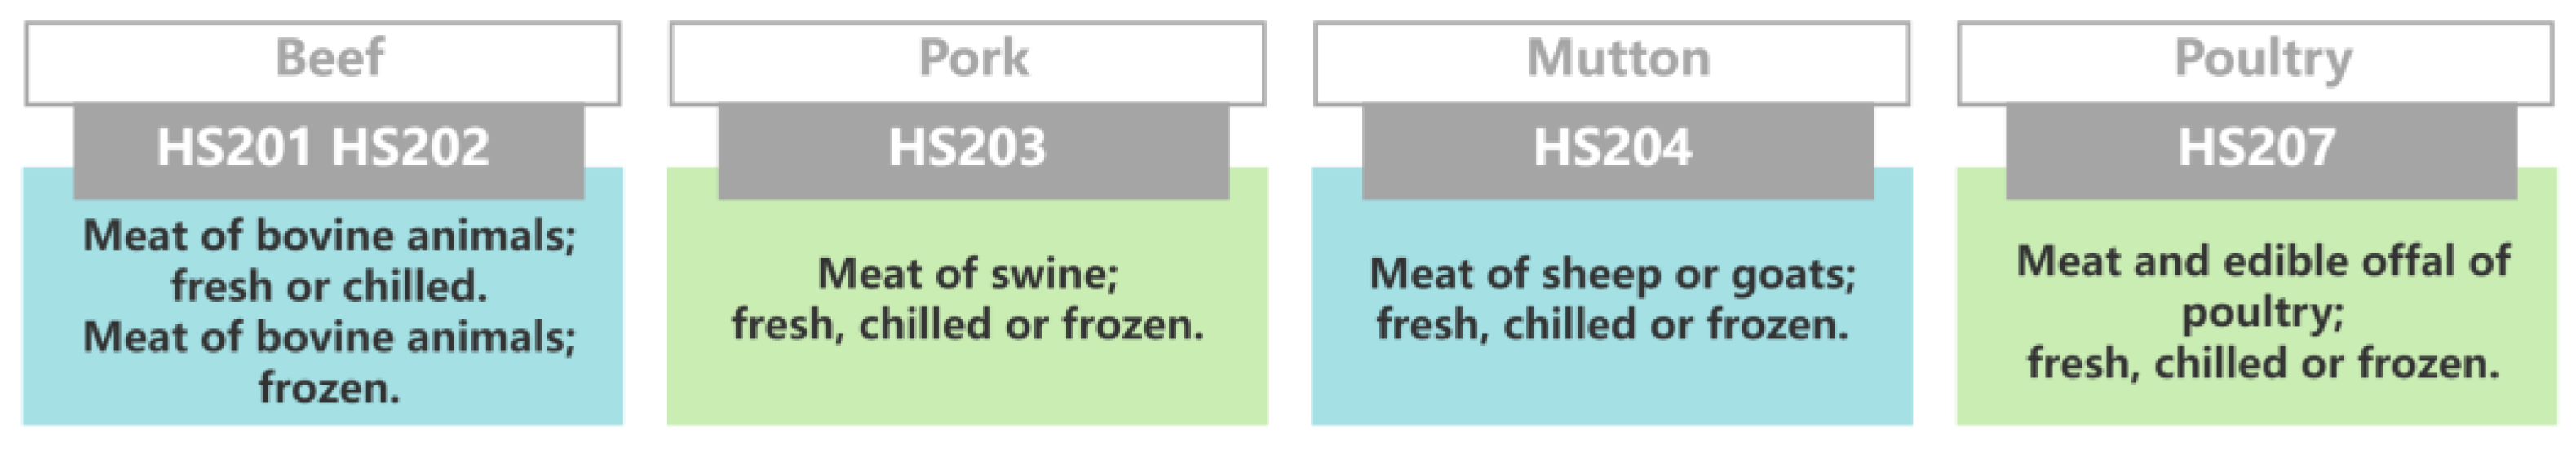
This study focuses on frozen meat as the subject of research. Based on existing literature on the definition of frozen meat, it is primarily categorized into four major groups: beef, pork, mutton, and poultry. Although other types of frozen meat are not discussed in this paper, this classification is sufficient to allow for an in-depth analysis of the changes in the global trade network pattern of these four major categories of meat products and their resilience characteristics. The specific classification and corresponding HS codes are shown in Error! Reference source not found..
Figure 1.
Classification of frozen meat.
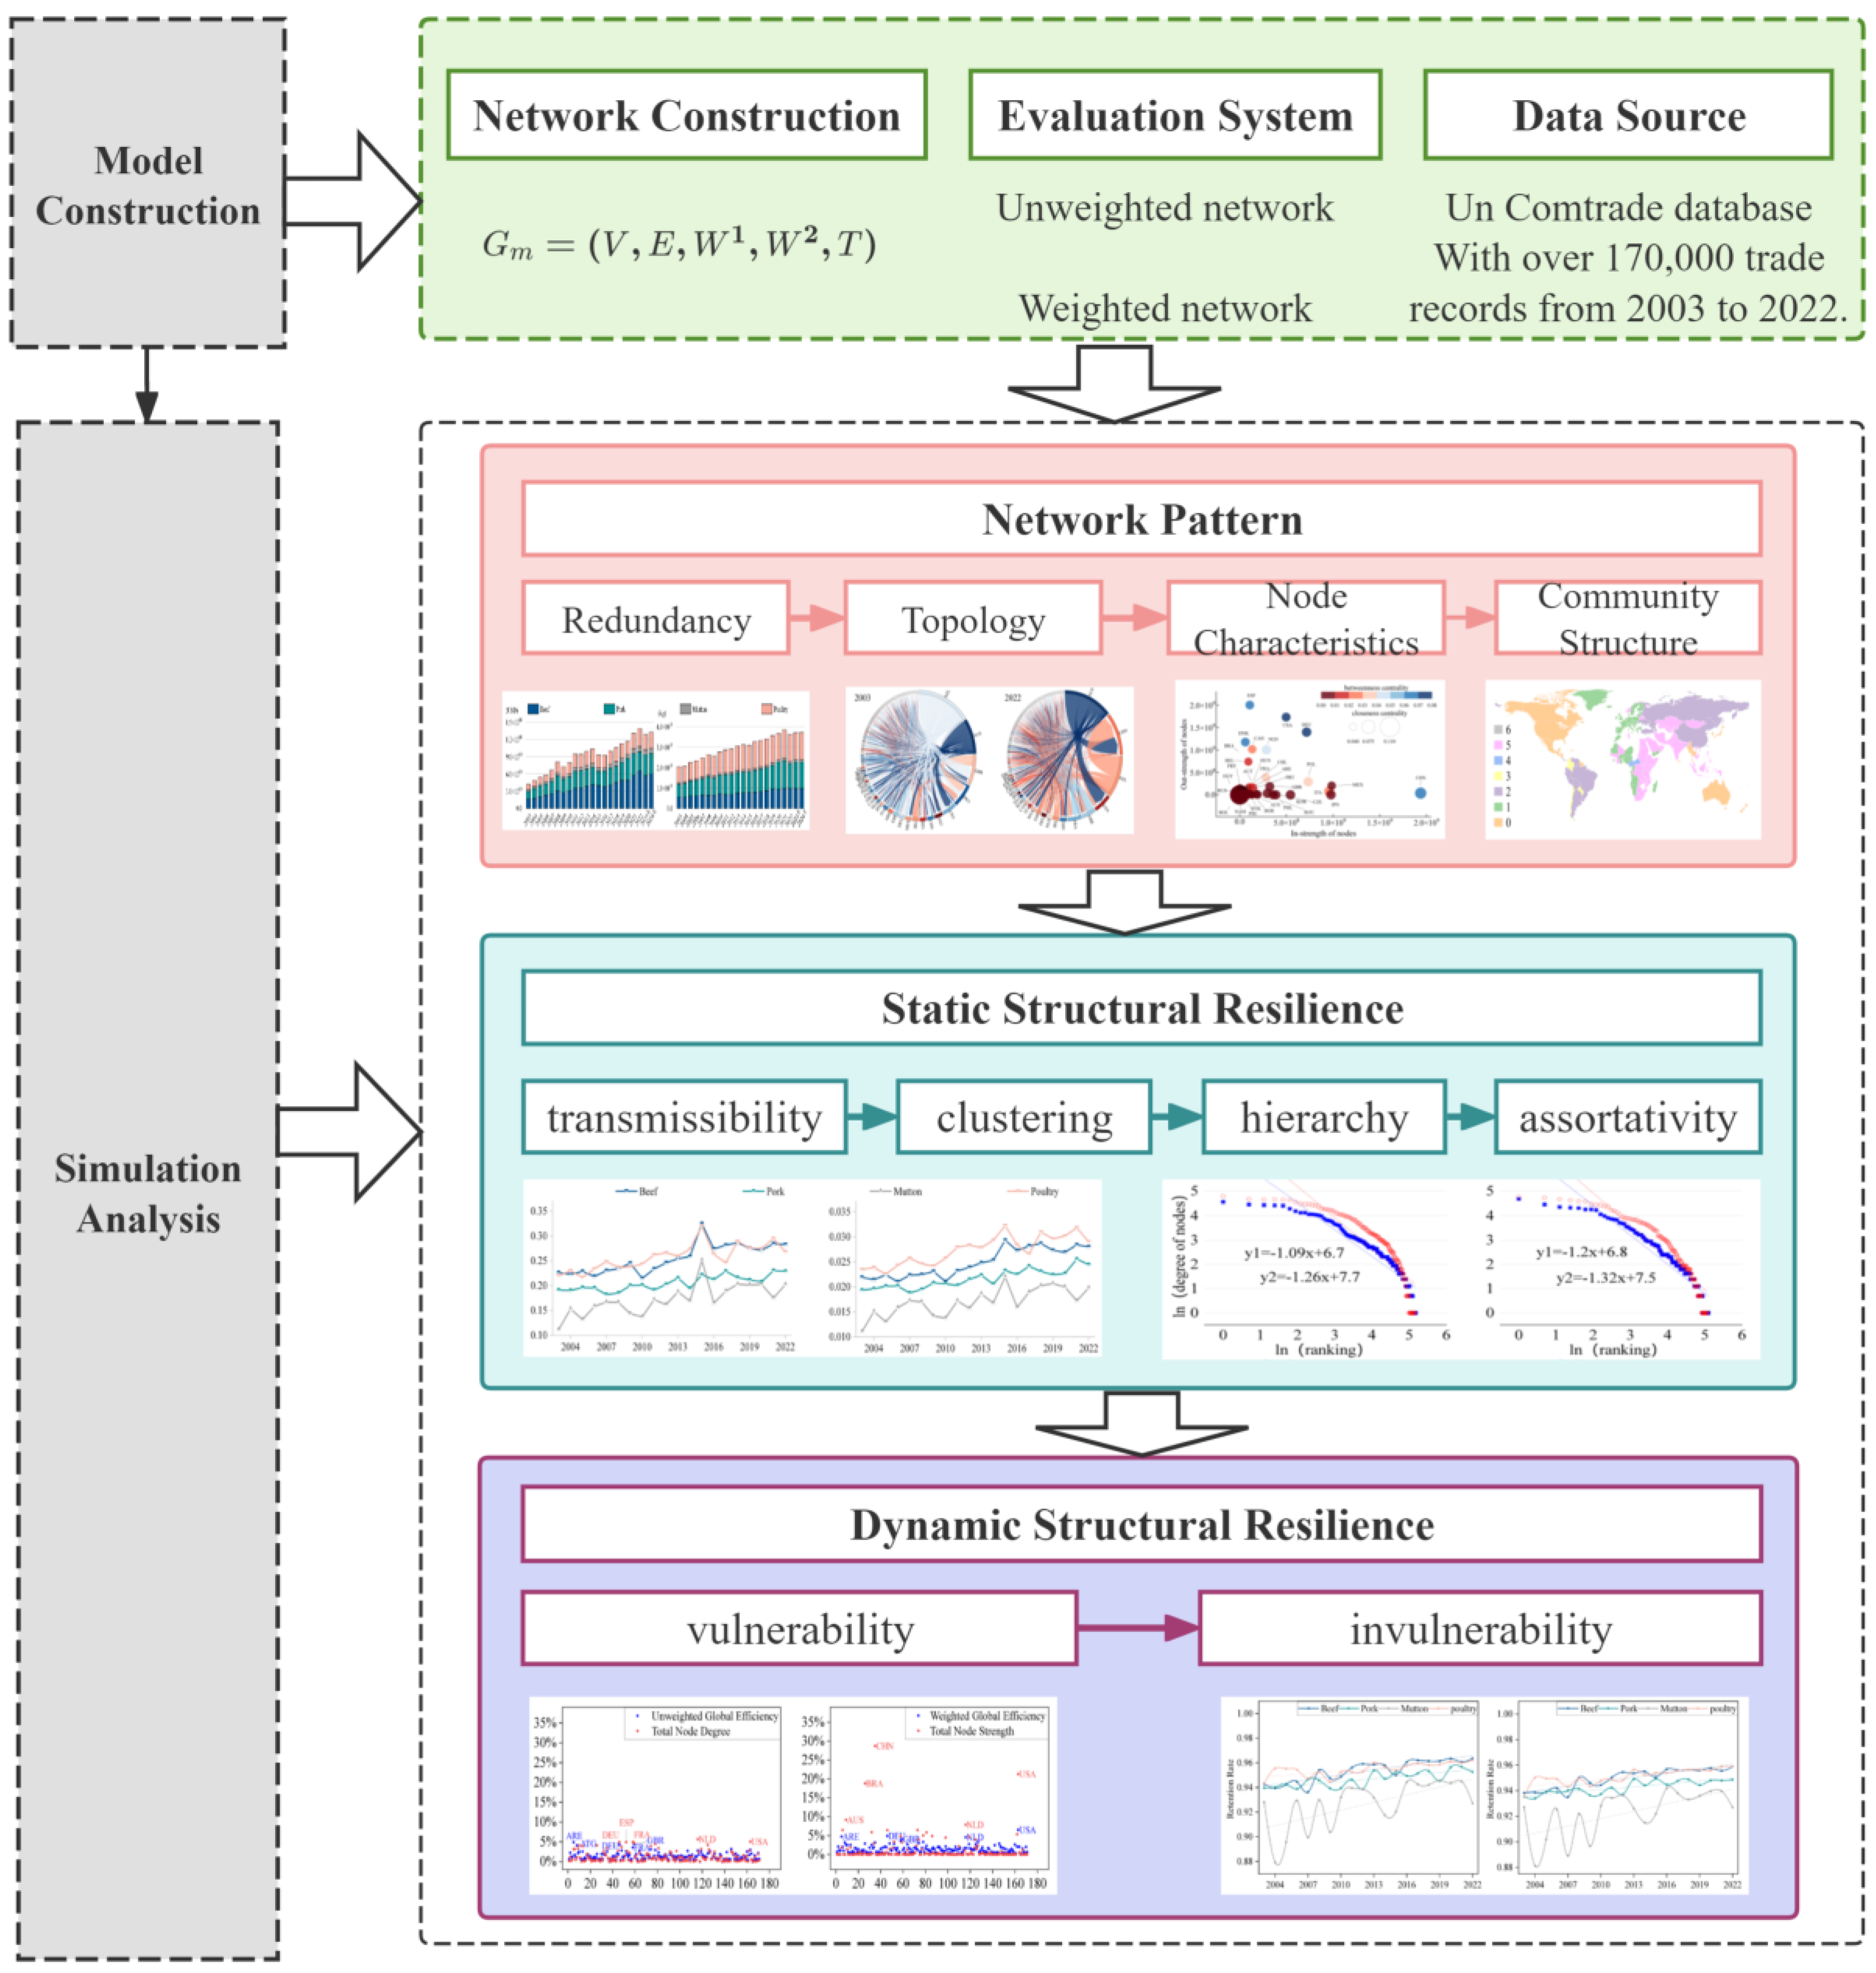
Based on complex network theory and resilience theory, this paper measures the resilience of the global frozen meat trade network from two perspectives: static structural resilience and dynamic structural resilience. Static structural resilience reveals the redundancy and stability of the network from the perspective of its topology, while dynamic structural resilience highlights the network's vulnerability and invulnerability in response to shocks as it evolves over time. As a typical directed weighted network, the resilience measurement of the global frozen meat trade network requires not only attention to trade relations between countries (regions) but also a focus on the significant impact of trade volume on resilience measurement. Based on existing research and the practical situation of the global frozen meat trade, we have constructed a network structural resilience evaluation indicator system, as shown in Error! Reference source not found..
Table 2.
evaluation indicator system for the structural resilience of the global frozen meat trade network.
Table 2.
evaluation indicator system for the structural resilience of the global frozen meat trade network.
| Aspect | Influence Factor | Indicator | Impact on the Network |
| Static structural resilience | transmissibility | global efficiency | Global efficiency measures the speed and capacity of information transmission in the trade network. The higher the efficiency, the smoother the flow of information or materials, resulting in stronger resilience. |
| clustering | average clustering coefficient | The average clustering coefficient measures the local structural density of the trade network. The higher the coefficient, the tighter the local clustering between countries (regions), which helps improve the network's local stability and robustness, as well as its connectivity and transmission efficiency, thereby enhancing network resilience. | |
| hierarchy | degree distribution | Degree distribution refers to the probability distribution of node degrees. Its impact on network resilience is dual: highly hierarchical structures can provide robustness but also lead to vulnerability; moderate hierarchical and flat structures help strike a balance between the two, improving network resilience. | |
| assortativity | assortativity coefficient | Assortativity coefficient reflects the degree to which countries (regions) tend to connect with partners that have similar trade volumes. The assortativity coefficient affects the network's attack resistance ability and stability. Assortative networks strengthen hub connections, providing stability and rapid recovery, while disassortative networks promote information exchange and resource sharing. Due to the different attributes of connected nodes, they offer more redundant paths and recovery capacity. | |
| Dynamic structural resilience | vulnerability | loss rate of network performance caused by single node interruption | Loss rate of network performance caused by single node interruption refers to the percentage decrease in network performance when a single node fails. It reflects the network's sensitivity to single node failures. A failure of a single node may cause a significant decline in the performance of the entire network, thus measuring the network's vulnerability and instability. |
| invulnerability | average retention rate of network performance | The average performance retention rate of the network refers to the proportion of original performance that the network can retain when facing failures or attacks, measuring the network's resilience and invulnerability. Networks with a high average performance retention rate are able to quickly recover and retain most of their original performance when facing failures or attacks. This helps ensure the continuous stable operation. |
Based on the construction of the above indicator system, further data collection was conducted to establish a global frozen meat directed trade network model, systematically conducting empirical research on network patterns and structural resilience. The research framework is shown in Error! Reference source not found..
Figure 2.
Research framework.
2.2. Research Methodology
2.2.1. Global Frozen Meat Network Construction
The global frozen meat trade countries (regions) are treated as network nodes, with trade relations between countries (regions) forming the edges. The trade volume and trade intensity distance serve as the edge weights, constructing a complex network model. The global frozen meat trade network is defined as follows:
Where: represents the four different global frozen meat networks: beef, pork, mutton, and poultry. is the set of nodes, representing all countries (regions). is the set of edges, representing trade relations between countries (regions). is the set of edge weights based on trade volume between all nodes. is the set of edge weights based on trade intensity distance between all nodes.
Trade volume (in kilograms) is selected as the edge weight for modeling, in order to avoid the effects of inflation and price fluctuations, thus providing a true representation of supply chain trade relationships and dependencies, which is crucial for analyzing network characteristics. At the same time, following existing research[62], trade intensity distance is introduced as an edge weight to explore its impact on the shortest path length. The specific formula for this edge weight is as follows:
Where: represents the trade intensity distance between node and node . represents the maximum trade volume between any two nodes in the network. represents the trade volume of frozen meat exported from node and node .
In real-world scenarios, trade intensity distance is undoubtedly influenced by more complex factors, such as political relations, geographical location, cultural differences, and many other hard to quantify elements between two countries. However, within the specific analytical framework of this paper, we focus solely on trade volume as the core factor.
2.2.2. Weighted Network Characteristics Indicators Involved
Before conducting the network resilience analysis, we first perform an analysis of the topology and trade group evolution of the frozen meat directed weighted trade network. The relevant indicators are shown in Error! Reference source not found. below. All the indicators in this table are weighted metrics.
Table 3.
Indicators of complex network related features.
| Indicator | Meaning | |
| Network density | Network density, , in the graph to the maximum possible number of directed edges between all pairs of nodes V(V−1). | |
| Node out-strength | Node out-strength [63]) that node i exports to all other nodes. | |
| Node in-strength | ) that node i imports from all other nodes. | |
| Betweenness centrality |
Weighted betweenness centrality [64]. This metric captures the "bridge" role of a node in the network. | |
| Closeness centrality | Weighted closeness centrality [63]to all other nodes, considering trade intensity distance weights. It measures the importance of a node in the network based on its average distance to all other nodes. | |
| Modularity |
. =0. |
2.2.3. Static Structural Resilience Indicators
The resilience of network structure is generally defined as the ability of a network to maintain its overall functionality and continue to operate despite encountering failures, attacks, or disruptions. This article comprehensively analyzes the structural resilience of the global frozen meat trade network from four dimensions: transmissibility, clustering, hierarchy, and assortativity. Four indicators—global efficiency, average clustering coefficient, degree distribution, and assortativity coefficient—are selected to perform resilience analysis in both unweighted and weighted forms for each indicator. In the unweighted network, we focus on the existence of trade connections between countries, outlining the structure of the frozen meat trade network. The weighted network introduces trade volume or trade strength distance as weights to more precisely measure interaction intensity, revealing deeper information and patterns. The specific indicators are shown in Error! Reference source not found..
Table 4.
Static Structural Resilience Indicators.
| Indicator | Formulae | |
| Transmissibility | global efficiency | |
| is the total number of nodes in the network. | ||
| Clustering | average clustering coefficient |
|
| , does not consider the influence of weights. | ||
| Hierarchy | degree distribution | |
| is the slope of the degree distribution curve [66]. | ||
| Assortativity | Assortativity coefficient | |
| -th edge [67]. | ||
2.2.4. Dynamic Structural Resilience Indicators
Dynamic structural resilience of networks is a comprehensive concept that involves the vulnerability and invulnerability exhibited by the network when faced with challenges. Vulnerability refers to the potential for information disruption, resource imbalance, or even network paralysis due to dependence on key nodes, links, or insufficient redundancy in path design when the network encounters internal or external disturbances. In contrast, invulnerability refers to the network's ability to maintain its performance or functionality under impact. This paper evaluates and compares the dynamic structural resilience of unweighted and weighted directed networks from the two dimensions of vulnerability and invulnerability. The relevant indicators are shown in Error! Reference source not found..
Table 5.
Dynamic Structural Resilience Indicators.
| Indicator | Formulae | |
| Vulnerability | loss rate of network performance caused by single node interruption | |
|
. . . . | ||
| Invulnerability | average retention rate of network performance |
|
| . | ||
2.3. Data Sources and Processing
This study utilizes data from the United Nations Commodity Trade Statistics Database (UN Comtrade Database) spanning from 2003 to 2022, covering over 170,000 trade records between 232 countries (or regions) worldwide. For consistency in the data, the study selects import data and addresses issues such as missing data and regional consolidation (combining data from Hong Kong and Macau into China, but excluding Taiwan). Finally, the trade data is categorized and aggregated by the four major types of meat: beef, pork, mutton, and poultry.
3. Result Analysis
3.1. Evolution of the Pattern of the Global Frozen Meat Trade Network
3.1.1. Descriptive Statistical Analysis of the Trade Network
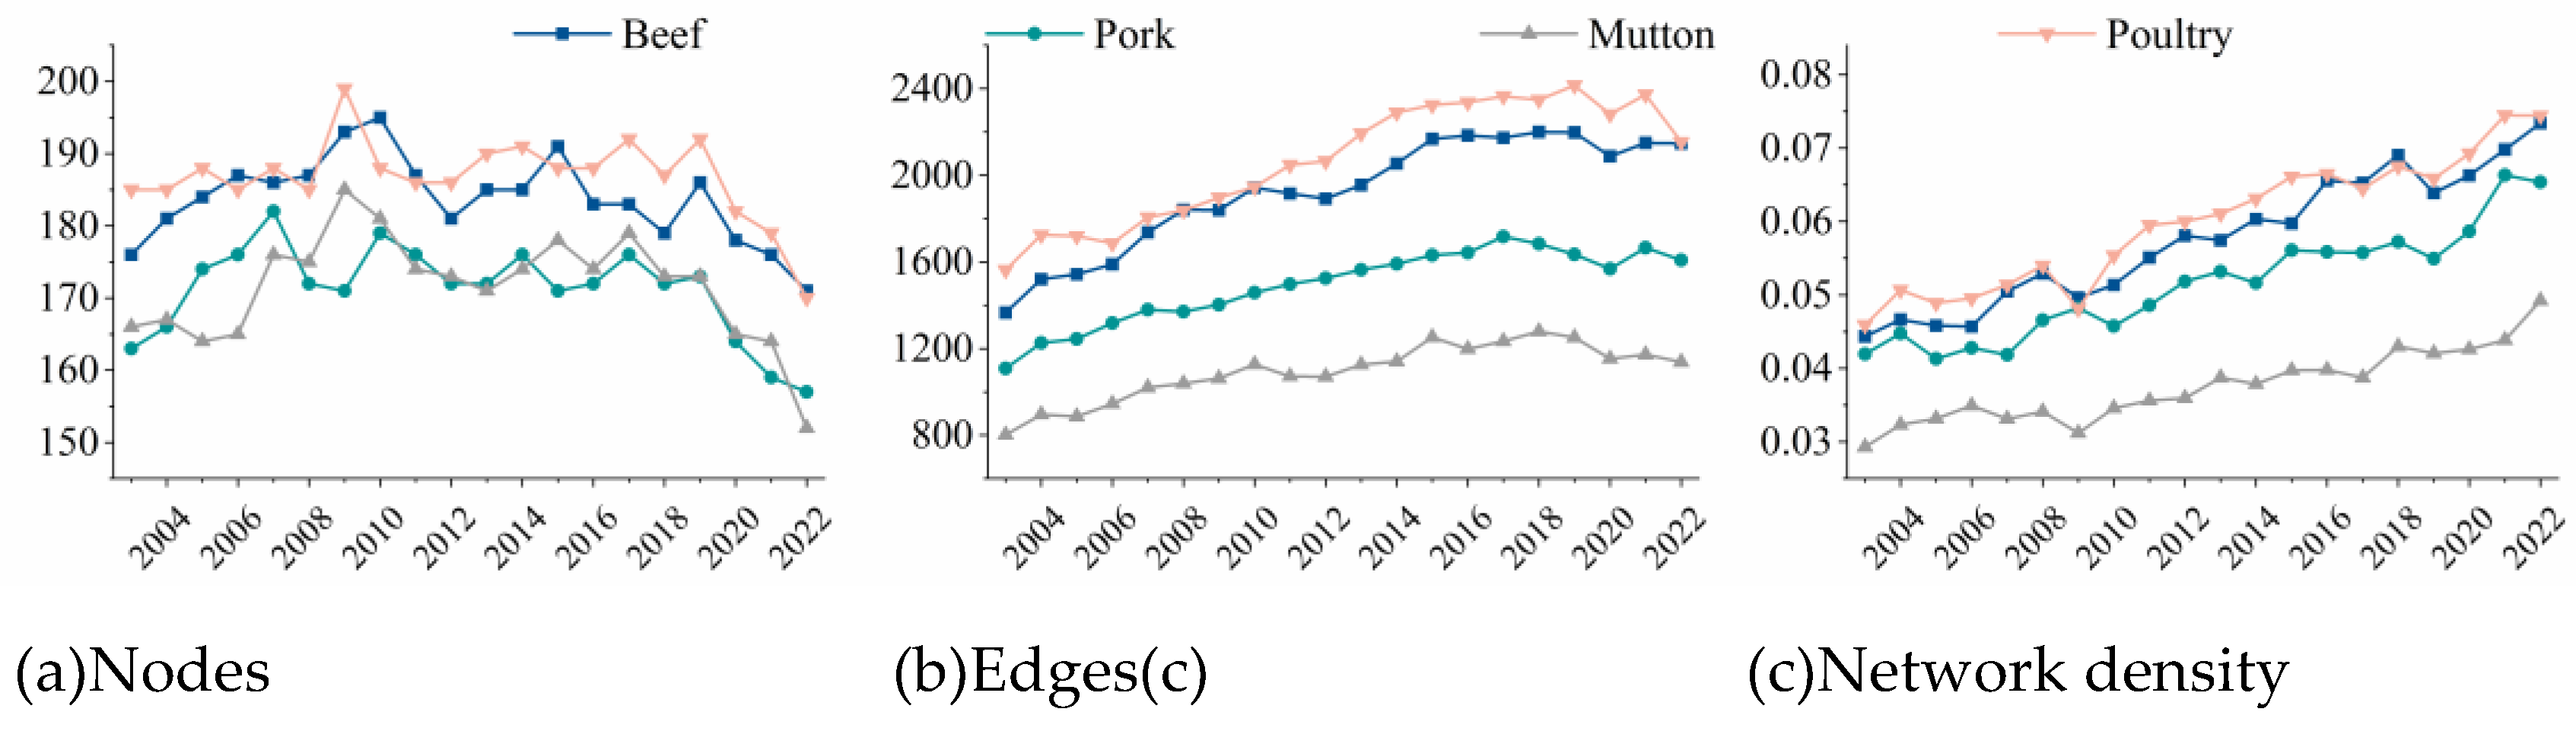
Error! Reference source not found. presents the statistical characteristics of the global frozen meat trade network from 2003 to 2022. The number of trade nodes exhibits a downward trend during this period, with a more pronounced decline following the outbreak of the global COVID-19 pandemic in 2020. However, the number of trade edges and network density continue to show an upward trend, reflecting the deepening trade ties between core countries and the optimization of the trade network. This also highlights the challenges that globalization may pose to smaller or peripheral countries.
Figure 3.
Time series graph of the number of nodes, number of edges, and network density in the trade network from 2003 to 2022.
Figure 3.
Time series graph of the number of nodes, number of edges, and network density in the trade network from 2003 to 2022.
Error! Reference source not found. depicts the overall changing trends of the global trade volume and trade value of frozen meat from 2003 to 2022, among which the data for 2023 and 2024 are estimated figures.
Figure 4.
Temporal variation in the value and volume from 2003 to 2024.
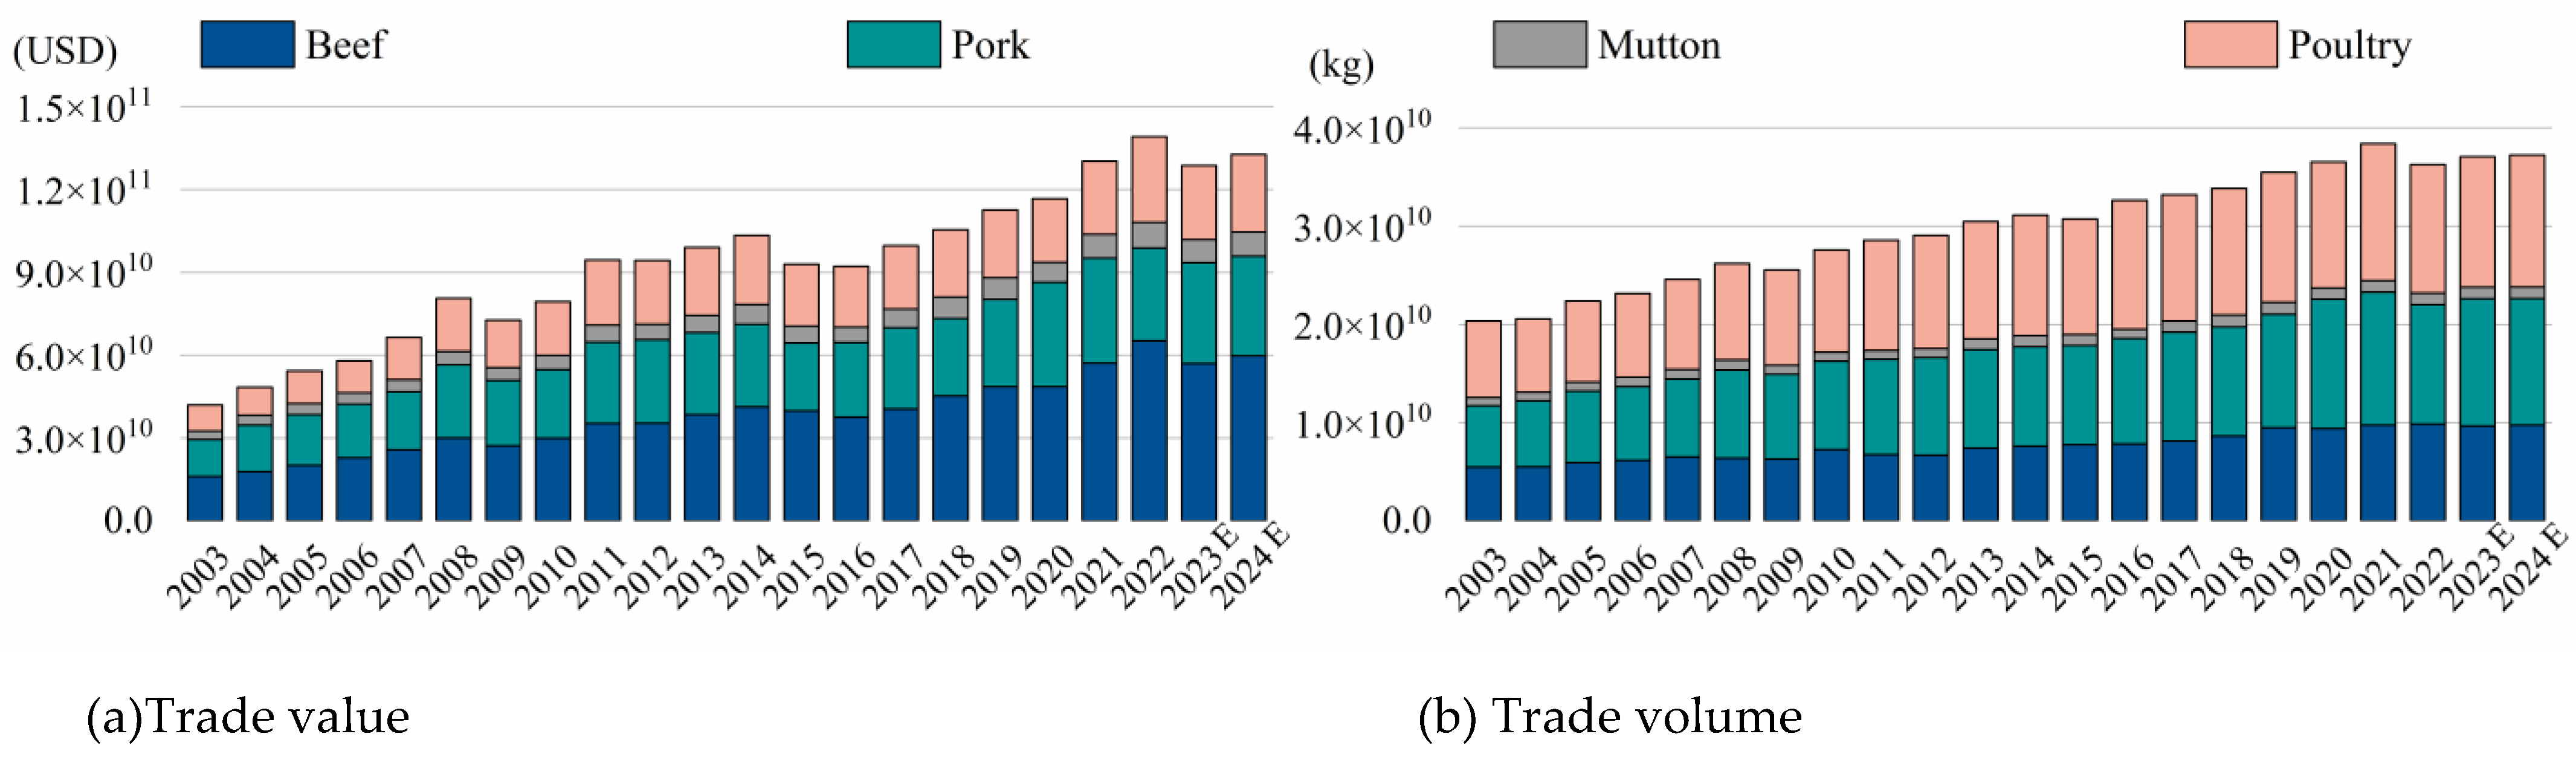
As shown in Figure 4, during the study period, global frozen meat trade exhibited a significant expansion in scale, with both trade volume and trade value achieving dual growth amid fluctuations. Specifically, the total value of global frozen meat trade increased from $41.959 billion at the base period to $139.143 billion, with an average annual compound growth rate of 11.5%. The trade volume grew from 20.349 billion kilograms to 36.291 billion kilograms, with an average annual growth rate of 3.9%. It is noteworthy that, with a relatively low unit price, the trade value of poultry meat only accounts for 22% of the total trade value, while its trade volume accounts for more than 37%. In contrast, beef trade displayed a reverse pattern, with its high added-value attribute driving its trade value share to exceed 40%, while its trade volume share was only 25%. Given that price fluctuations and inflation factors could potentially interfere with trade value data, this study chooses trade volume as the core analytical indicator to systematically reveal the dynamic evolution of the global frozen meat trade network's topology and resilience.
3.1.2. Evolutionary Analysis of Trade Network Topology
To clearly illustrate the topological characteristics of the global frozen meat trade network, this study utilizes flow chord diagrams to visualize the trade link features of four categories—pork, beef, mutton, and poultry—for the years 2003 and 2022. In these diagrams, the thickness of the arcs represents the trade volume of each country (or region), while the arrows indicate the direction of trade flow.
Figure 5.
The topological structure of the trade network in 2003 and 2022.
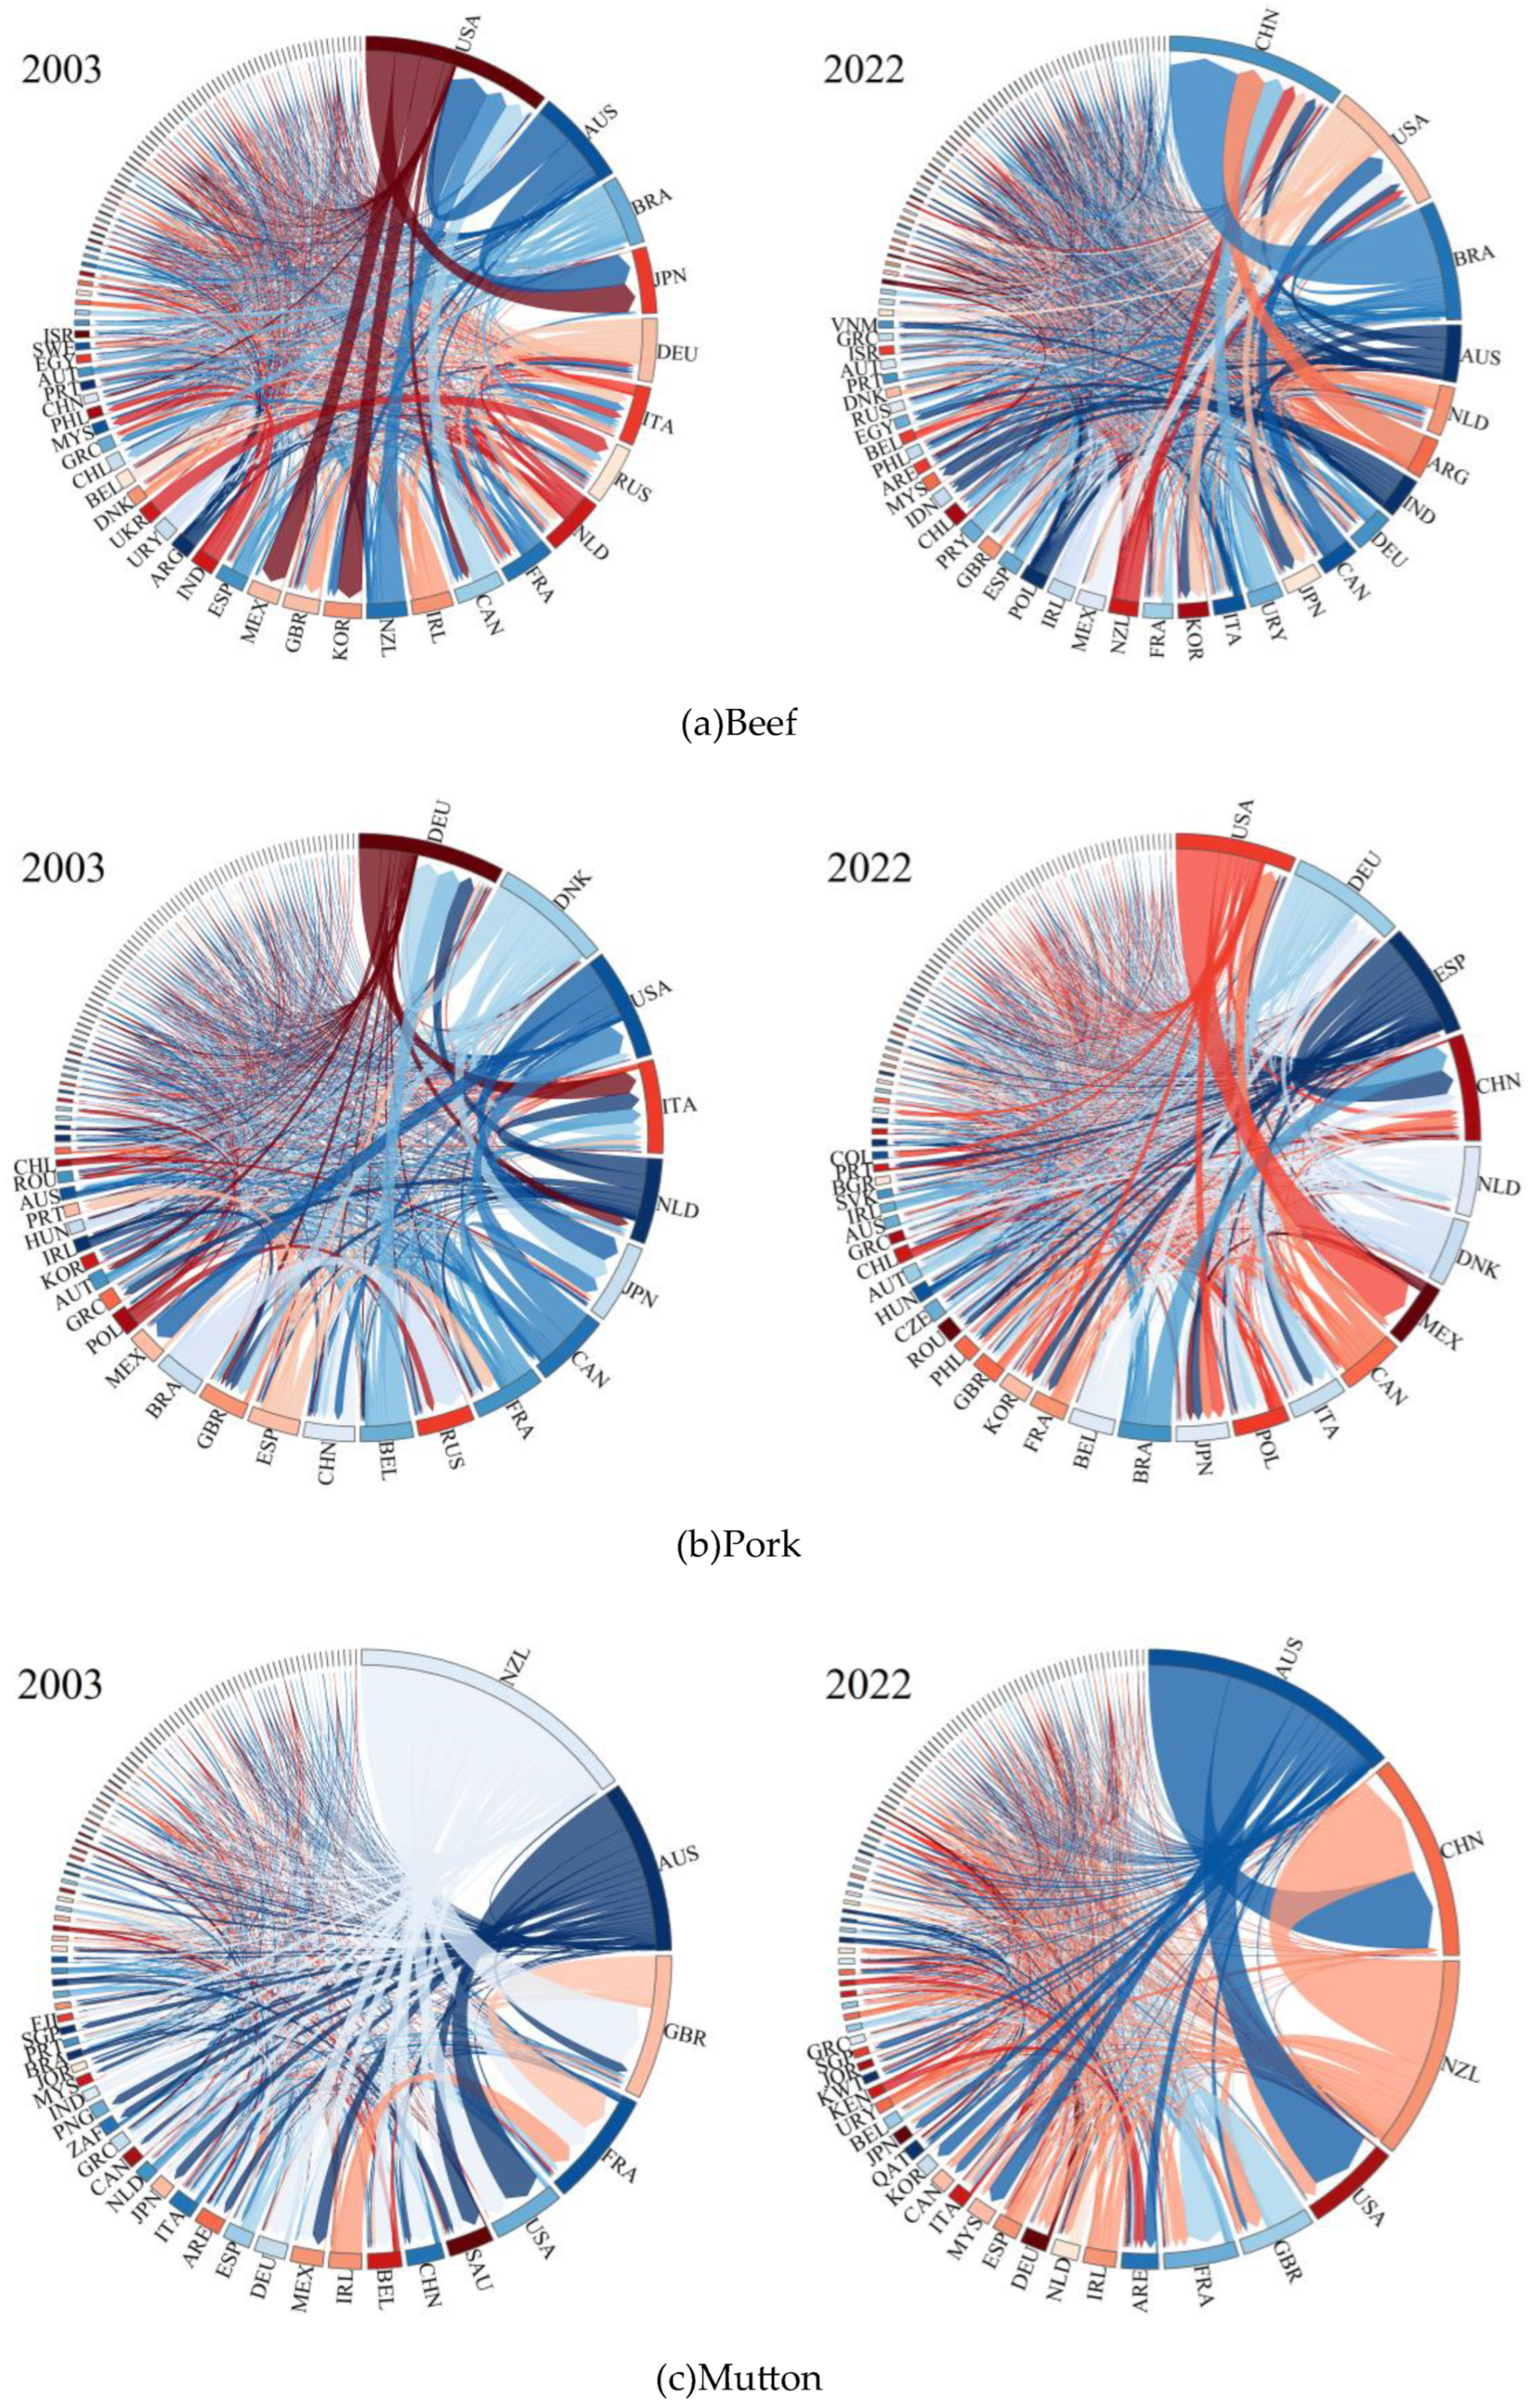
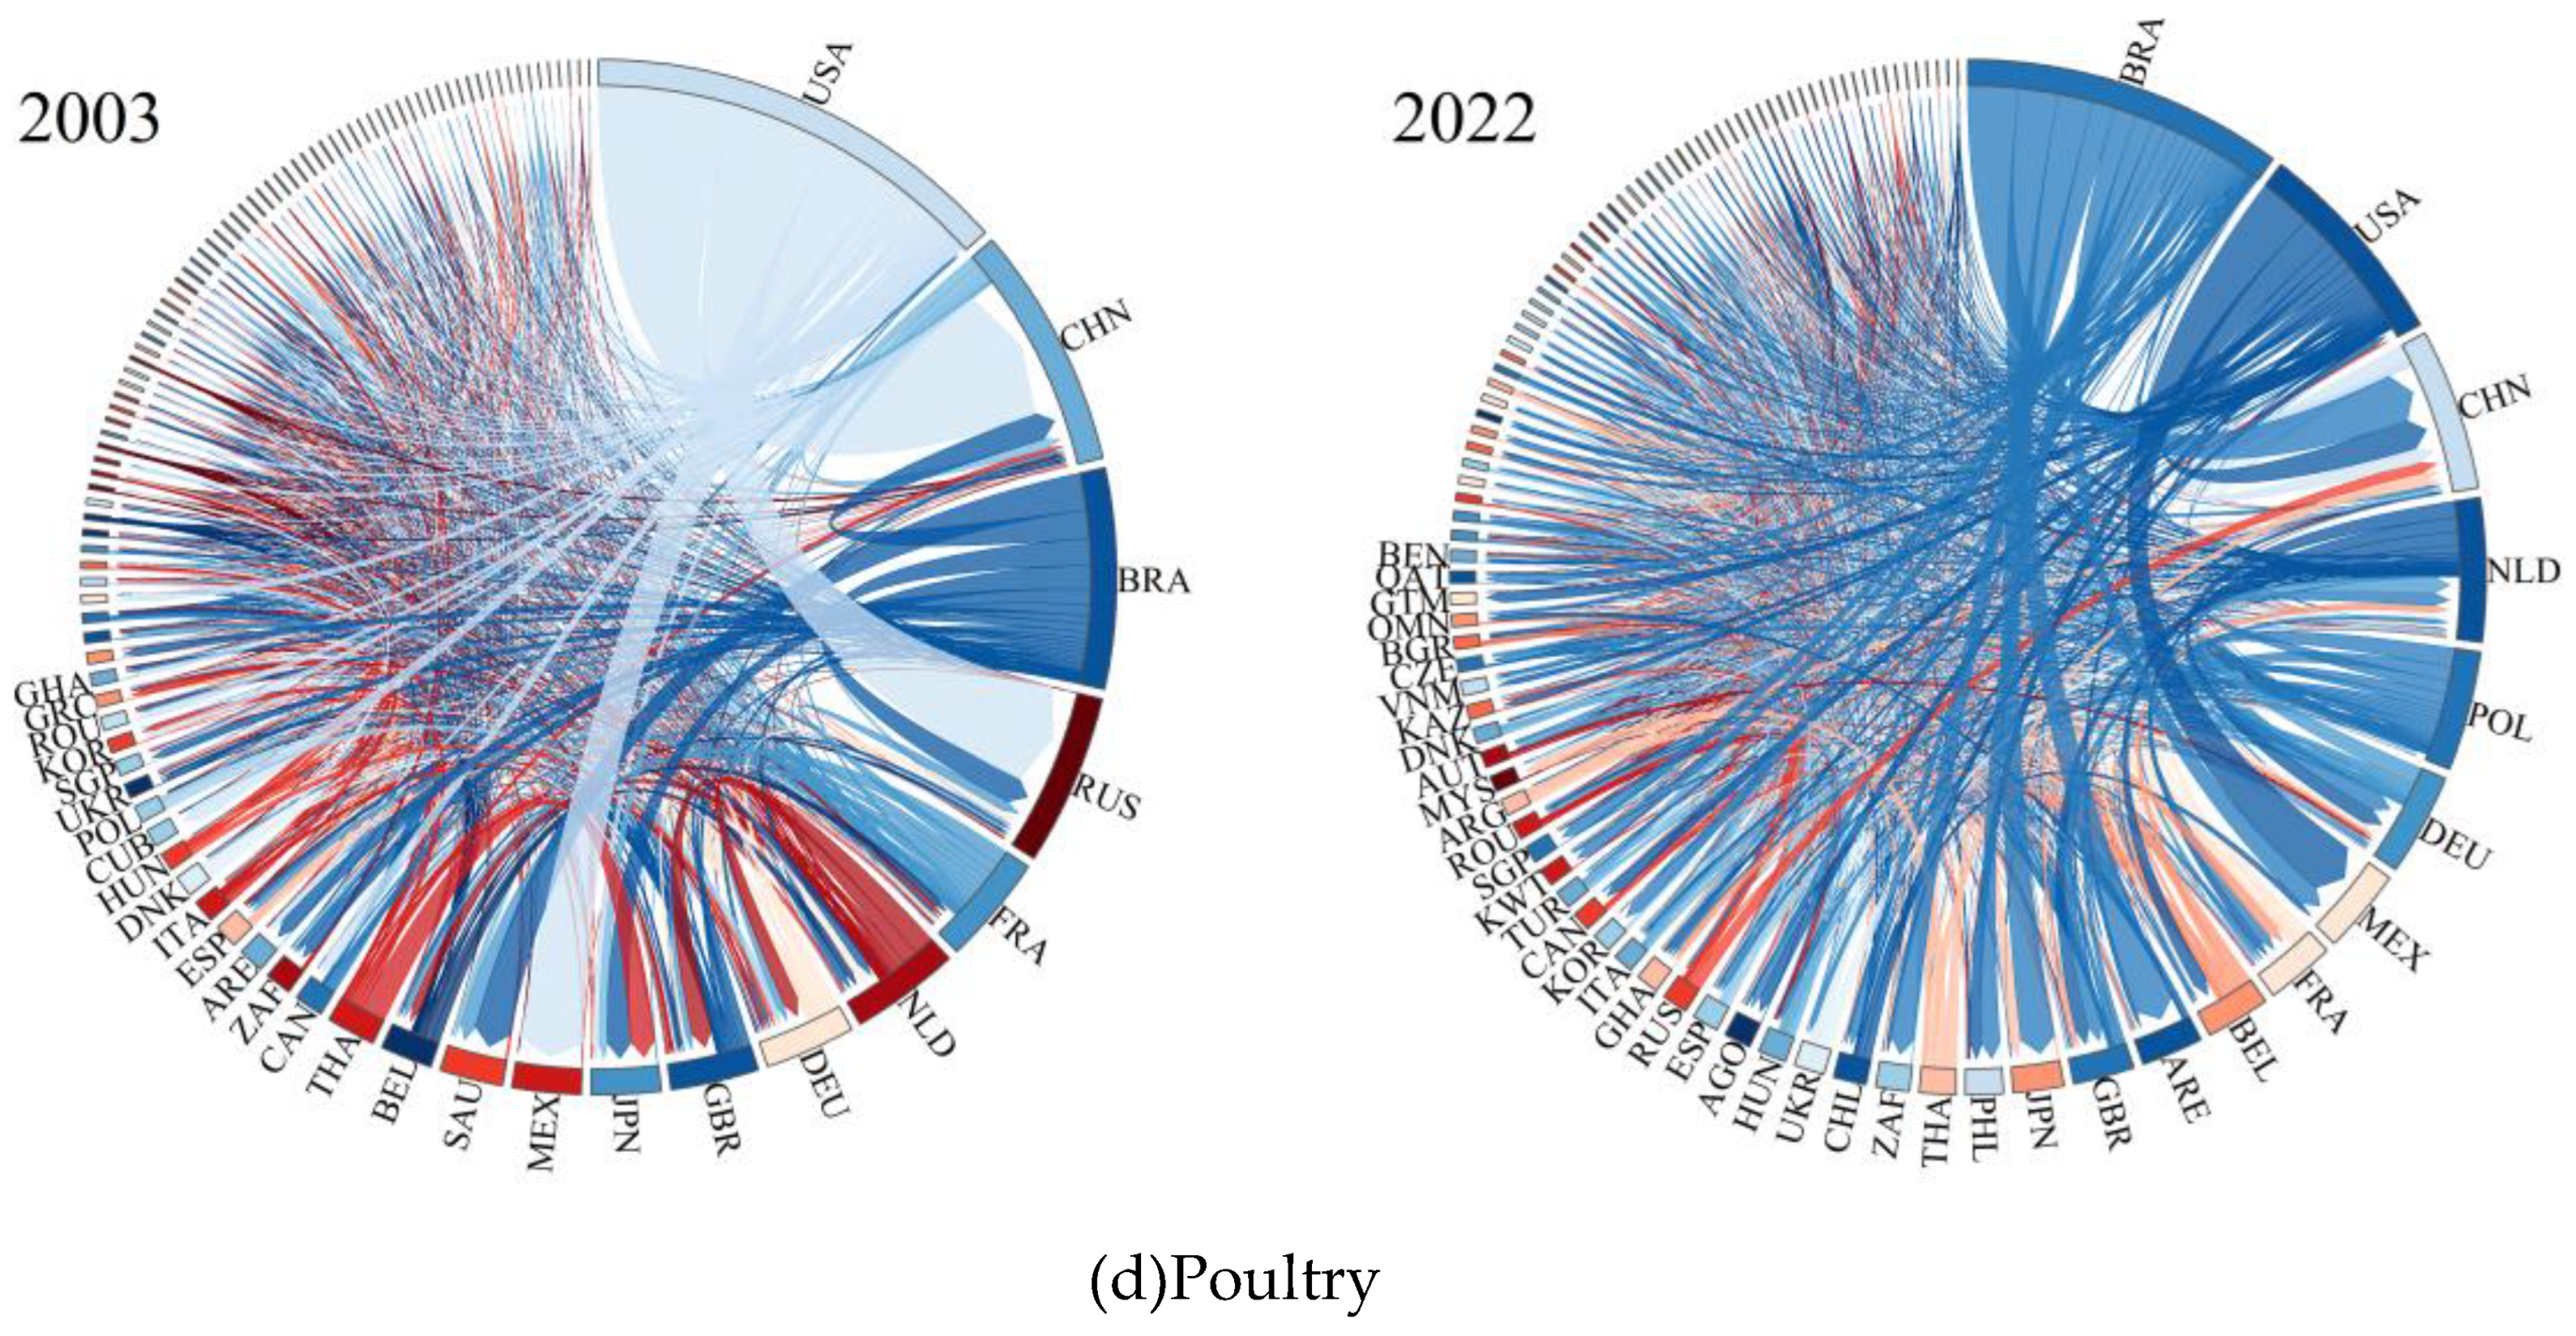
As shown in Error! Reference source not found., the beef trade pattern experienced significant changes. In 2003, Australia and the United States dominated the market, but by 2022, exports from Brazil to China had become the largest trade flow, with China emerging as the largest importer and the United States remaining an important node. In pork trade, the early period was characterized by imports from Italy and Germany and exports mainly from Denmark and the United States. By 2022, the trade pattern shifted to China being the dominant importer and Spain the leading exporter, with the United States exporting large quantities to Mexico. For mutton exports, New Zealand and Australia redirected their trade from traditional European markets to China, with China, the United States, and France becoming the main importers. In poultry trade, the United States was the largest exporter to China in 2003, but by 2022, Brazil surpassed the United States as the leading exporter, with its primary exports directed to China.
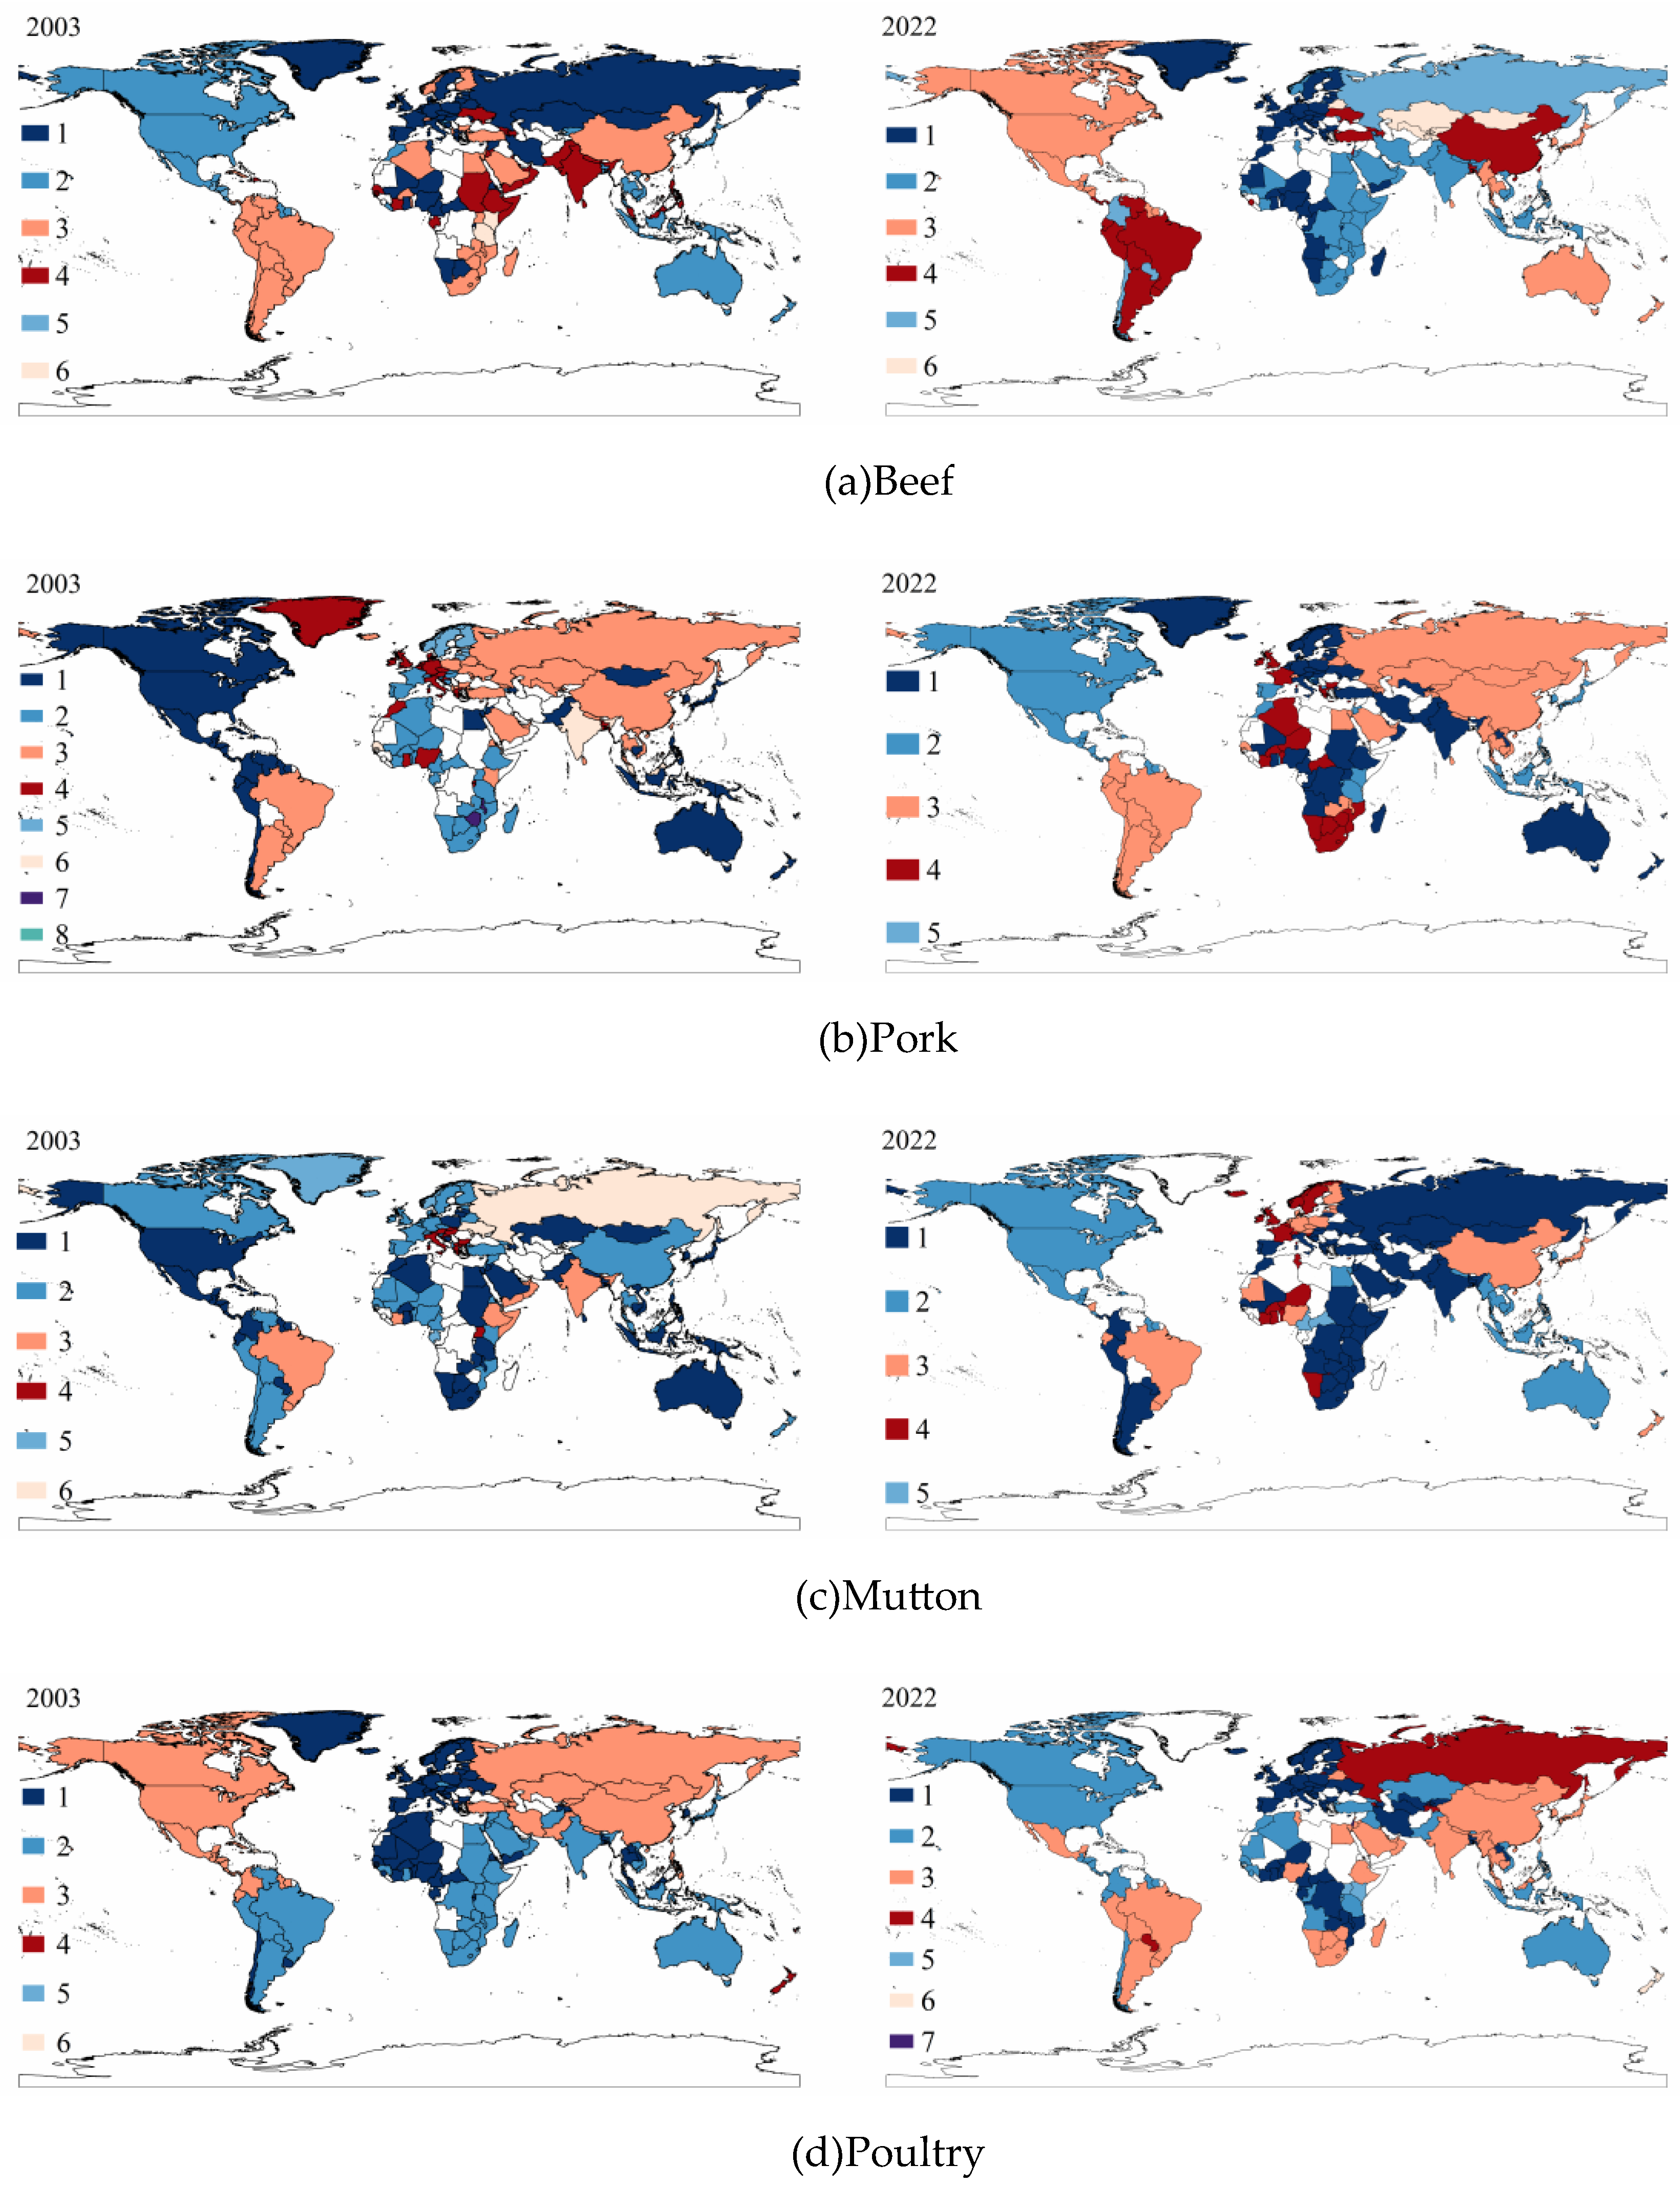
To clearly demonstrate the evolution of frozen meat node strength across countries, this study compares trade volume changes between 2003 and 2022, classifies the changes according to magnitude, and presents the results through a graded map, as shown in Error! Reference source not found..
Overall, as shown in Figure 6, the number of nodes with increased trade strength is greater than those with decreased trade strength, indicating a noticeable expansion trend in the trade network. In Figure 6 (a), traditional beef exporters such as Brazil and Argentina show significant changes in export strength, maintaining their important positions in global beef trade. The increased demand for beef in the United States and Germany results in a rise in import strength. In Figure 6 (b), China has increased pork imports while reducing exports, whereas Germany shows the opposite trend, with Spain significantly enhancing its export strength. Figure 6 (c) illustrates that major mutton exporters, New Zealand and Australia, are in competition with each other, showing large changes in export strength. In Figure 6 (d), both the United States and Brazil experience substantial changes in poultry export stren gth, reflecting their competitive advantages in the global poultry market.
Additionally, there are notable differences in performance across countries in different meat trade categories. Russia's frozen meat imports have decreased significantly, while China's imports have grown substantially, indicating China's rising position in the frozen meat trade. Mexico has reduced beef and mutton imports while increasing pork and poultry imports, reflecting an adjustment in its import structure. Countries(regions) with smaller changes in import/export strength have relatively stable trade patterns.
In order to intuitively present the changes in the trade volume of the main bilateral trade within the global frozen meat trade network in 2003 and 2022, this article has drawn a map of trade flow changes, and distinguished the flow change amounts of each connection through different colors. The results are shown in Error! Reference source not found..
As shown in Figure 7, China has become the core node for beef imports, with exports from Brazil surging by 1.13 billion kilograms and exports from Argentina increasing by 486 million kilograms. In contrast, traditional exporters such as Australia and New Zealand have significantly reduced their trade with the United States.
In the pork network, China's dependence on Spain and Brazil has risen rapidly. Exports from the United States to Mexico have increased by 611 million kilograms, making it the largest trade flow. Exports from Brazil and traditional European exporters to Russia have significantly decreased. Germany has expanded its market to Eastern Europe, with Spain emerging as a new export hub in Europe, experiencing a surge in trade volume with the Asia-Pacific market.
In the mutton trade, New Zealand's exports to Europe have generally decreased, but exports to emerging markets in Asia and the Middle East have grown significantly. For example, exports to the United Kingdom decreased by 49.26 million kilograms, while exports to China increased by 167 million kilograms. Australia, on the other hand, has expanded its trade in North America (the United States) and East Asia (China, South Korea).
In poultry trade, China has increased imports from Brazil and Russia, while exports from the United States to China and Russia have decreased, with trade volumes dropping by 631 million kilograms and 735 million kilograms, respectively. Meanwhile, Brazil has become a core export node, with a significant increase in trade with South Korea, Mexico, and the Philippines.
3.1.3. Evolutionary Analysis of Trade Network Node Centrality.
To gain a deeper understanding of the evolution of the frozen meat trade network, particularly the changes in the status and influence of core nodes, we further conducted a comparative analysis of the centrality of key nodes within the frozen meat trade network. The results are shown in Error! Reference source not found..
A comparison of data from 2003 to 2022 reveals that the global frozen meat trade network has become “multipolar,” with regional hubs rising to reflect a parallel process of globalization and regionalization. Specifically:
Beef: The United States has moved up significantly in terms of weighted indegree and intermediary centrality, ranking from 14th to 2nd, showing a notable improvement in its status. China has transitioned from a peripheral importer to the world's largest import hub, with its intermediary centrality rising. The Netherlands has strengthened its transshipment function, with both intermediary centrality and overall ranking rising to 1st, making it the most influential. Germany, France, and the United Kingdom have maintained high rankings in weighted indegree and intermediary centrality, with their comprehensive capabilities ranking within the top 10. Brazil’s strong export capacity has pushed its weighted outdegree to 1st place. Nepal approached the top of the closeness centrality rankings in 2022, highlighting its role as a regional hub.
Pork: China has seen rapid growth in both its weighted indegree and intermediary capacity. The United States continues to maintain dual advantages in exports and intermediary roles. Germany’s weighted indegree has slightly decreased but remains among the top, with a stable overall position. Paraguay’s rising closeness centrality has made it a key node in the network. Denmark’s weighted outdegree and intermediary centrality have slightly declined but remain high. Spain has expanded its exports, becoming the largest exporter.
Mutton: France still holds the top position overall, but its ranking in weighted in-degree has dropped, and its bridging role has weakened. China has jumped to the top in terms of weighted indegree, with a significant increase in intermediary centrality, becoming an absolute hub. The United States has seen growth in weighted indegree, but its influence on trade routes has weakened. The United Arab Emirates has emerged as a new trading center, with active imports and an intermediary role. Tanzania’s export capacity has grown, placing it second in intermediary centrality, making it a key transshipment node in Africa. Ecuador's rising centrality has made it the top player, with high efficiency in information transmission. Australia has surpassed New Zealand to become the largest exporter.
Poultry: China ranked first in 2003, with multiple indicators in the top 3, and remains a core player, ranking second in 2022. The United States has seen growth in weighted outdegree, though its intermediary centrality has decreased. The Netherlands performed exceptionally in 2022, ranking first overall and in intermediary centrality, with a weighted outdegree of 4th, emerging as a new core player. The United Arab Emirates has strengthened its control and become a new hub, while traditional strongholds like France have seen a decline in their status. Brazil has strengthened its export capacity, although its intermediary centrality has not risen in tandem. Germany’s export capacity has steadily grown, with intermediary centrality ranking 6th, maintaining its position as a European hub. Changes in the network structure have caused Fiji’s centrality to drop significantly, with its hub status being replaced by Ghana.
3.1.4. Evolutionary Analysis of Trade Network Community Division
To further reveal the clustering relationships and community structure characteristics among countries (regions) within the network, this study applies the Louvain community detection algorithm to divide the trade community of 2003 and 2022, with the aim of comparing and analyzing the evolutionary trends of these trade community over the two years[68].
Figure 9.
Geographic distribution of trade groups in 2003 and 2022.
Error! Reference source not found. illustrates the evolution of the global frozen meat trade network's community structure from 2002 to 2023, with the following details:
During this period, the number of communities in the beef trade network remained unchanged. The largest community, primarily composed of European countries, had 52 and 57 member countries in 2002 and 2023, respectively. Russia, Mongolia, and Kazakhstan separated from this community, joining two smaller communities. The communities consisting of North America and Oceania, as well as those led by China and Brazil, both saw a reduction in size.
The pork trade network became more regionally concentrated, with the number of communities decreasing from 8 to 5. Several smaller communities merged into larger ones, such as Mongolia and Colombia joining the community led by China, Russia, and Brazil. Australia separated from Community 1 and formed a larger community with Western Europe, Central Africa, and other countries, comprising 53 member countries.
In the mutton trade network, community 6, which was dominated by Russia and other countries, merged with the largest community. The United States and Australia separated from community 1 and joined community 2, while China and Brazil formed a new community, with closer trade ties.
The poultry trade network was composed of three major communities and several smaller ones. The number of countries (regions) in community 1 decreased from 77 to 67. community 3, primarily consisting of Asia and North America, split into several sub-communities: North America and Oceania, South America and East Asia, as well as a community led by Russia.
3.2. Evolution of Static Structural Resilience in the Global Frozen Meat Trade Network
3.2.1. Transmissibility Evolution Analysis
Error! Reference source not found. shows the evolution of global efficiency in the global frozen meat trade network from 2003 to 2022. From the Figure 10, it can be seen that the trends of both weighted and unweighted global efficiency in the four frozen meat trade networks are largely consistent, both showing an upward trend. This indicates that the transmissibility of the network has been continuously improving, and the connectivity and circulation of frozen meat trade have been significantly enhanced. In general, the global efficiency of poultry, beef, pork, and mutton trade decreases in this order, which aligns with the network density ranking, suggesting that there is a positive correlation between network transmissibility and network density.
3.2.2. Clustering Evolution Analysis
Error! Reference source not found. illustrates the evolution of the average clustering coefficient in the global frozen meat trade network from 2003 to 2022. The trends of both weighted and unweighted average clustering coefficients are mostly the same. Notably, pork and poultry show a clear upward trend, while beef and mutton exhibit a more gradual increase, indicating that the trade networks of pork and poultry have formed tighter clustering structures over the study period. In contrast, beef and mutton trade partners have remained relatively stable, with little change. Furthermore, the unweighted average clustering coefficient fluctuates significantly, while the weighted average clustering coefficient rises steadily with minimal fluctuation. There is also a clear stratification in the weighted average clustering coefficients across different meat types. This suggests that the frozen meat trade network is continuously adjusting dynamically. The fluctuations in clustering coefficients are driven by the dynamic changes in peripheral and new nodes, but the trade volume among core nodes continues to grow steadily, forming an inertia effect of trade volume weight.
3.2.3. Hierarchy Evolution Analysis
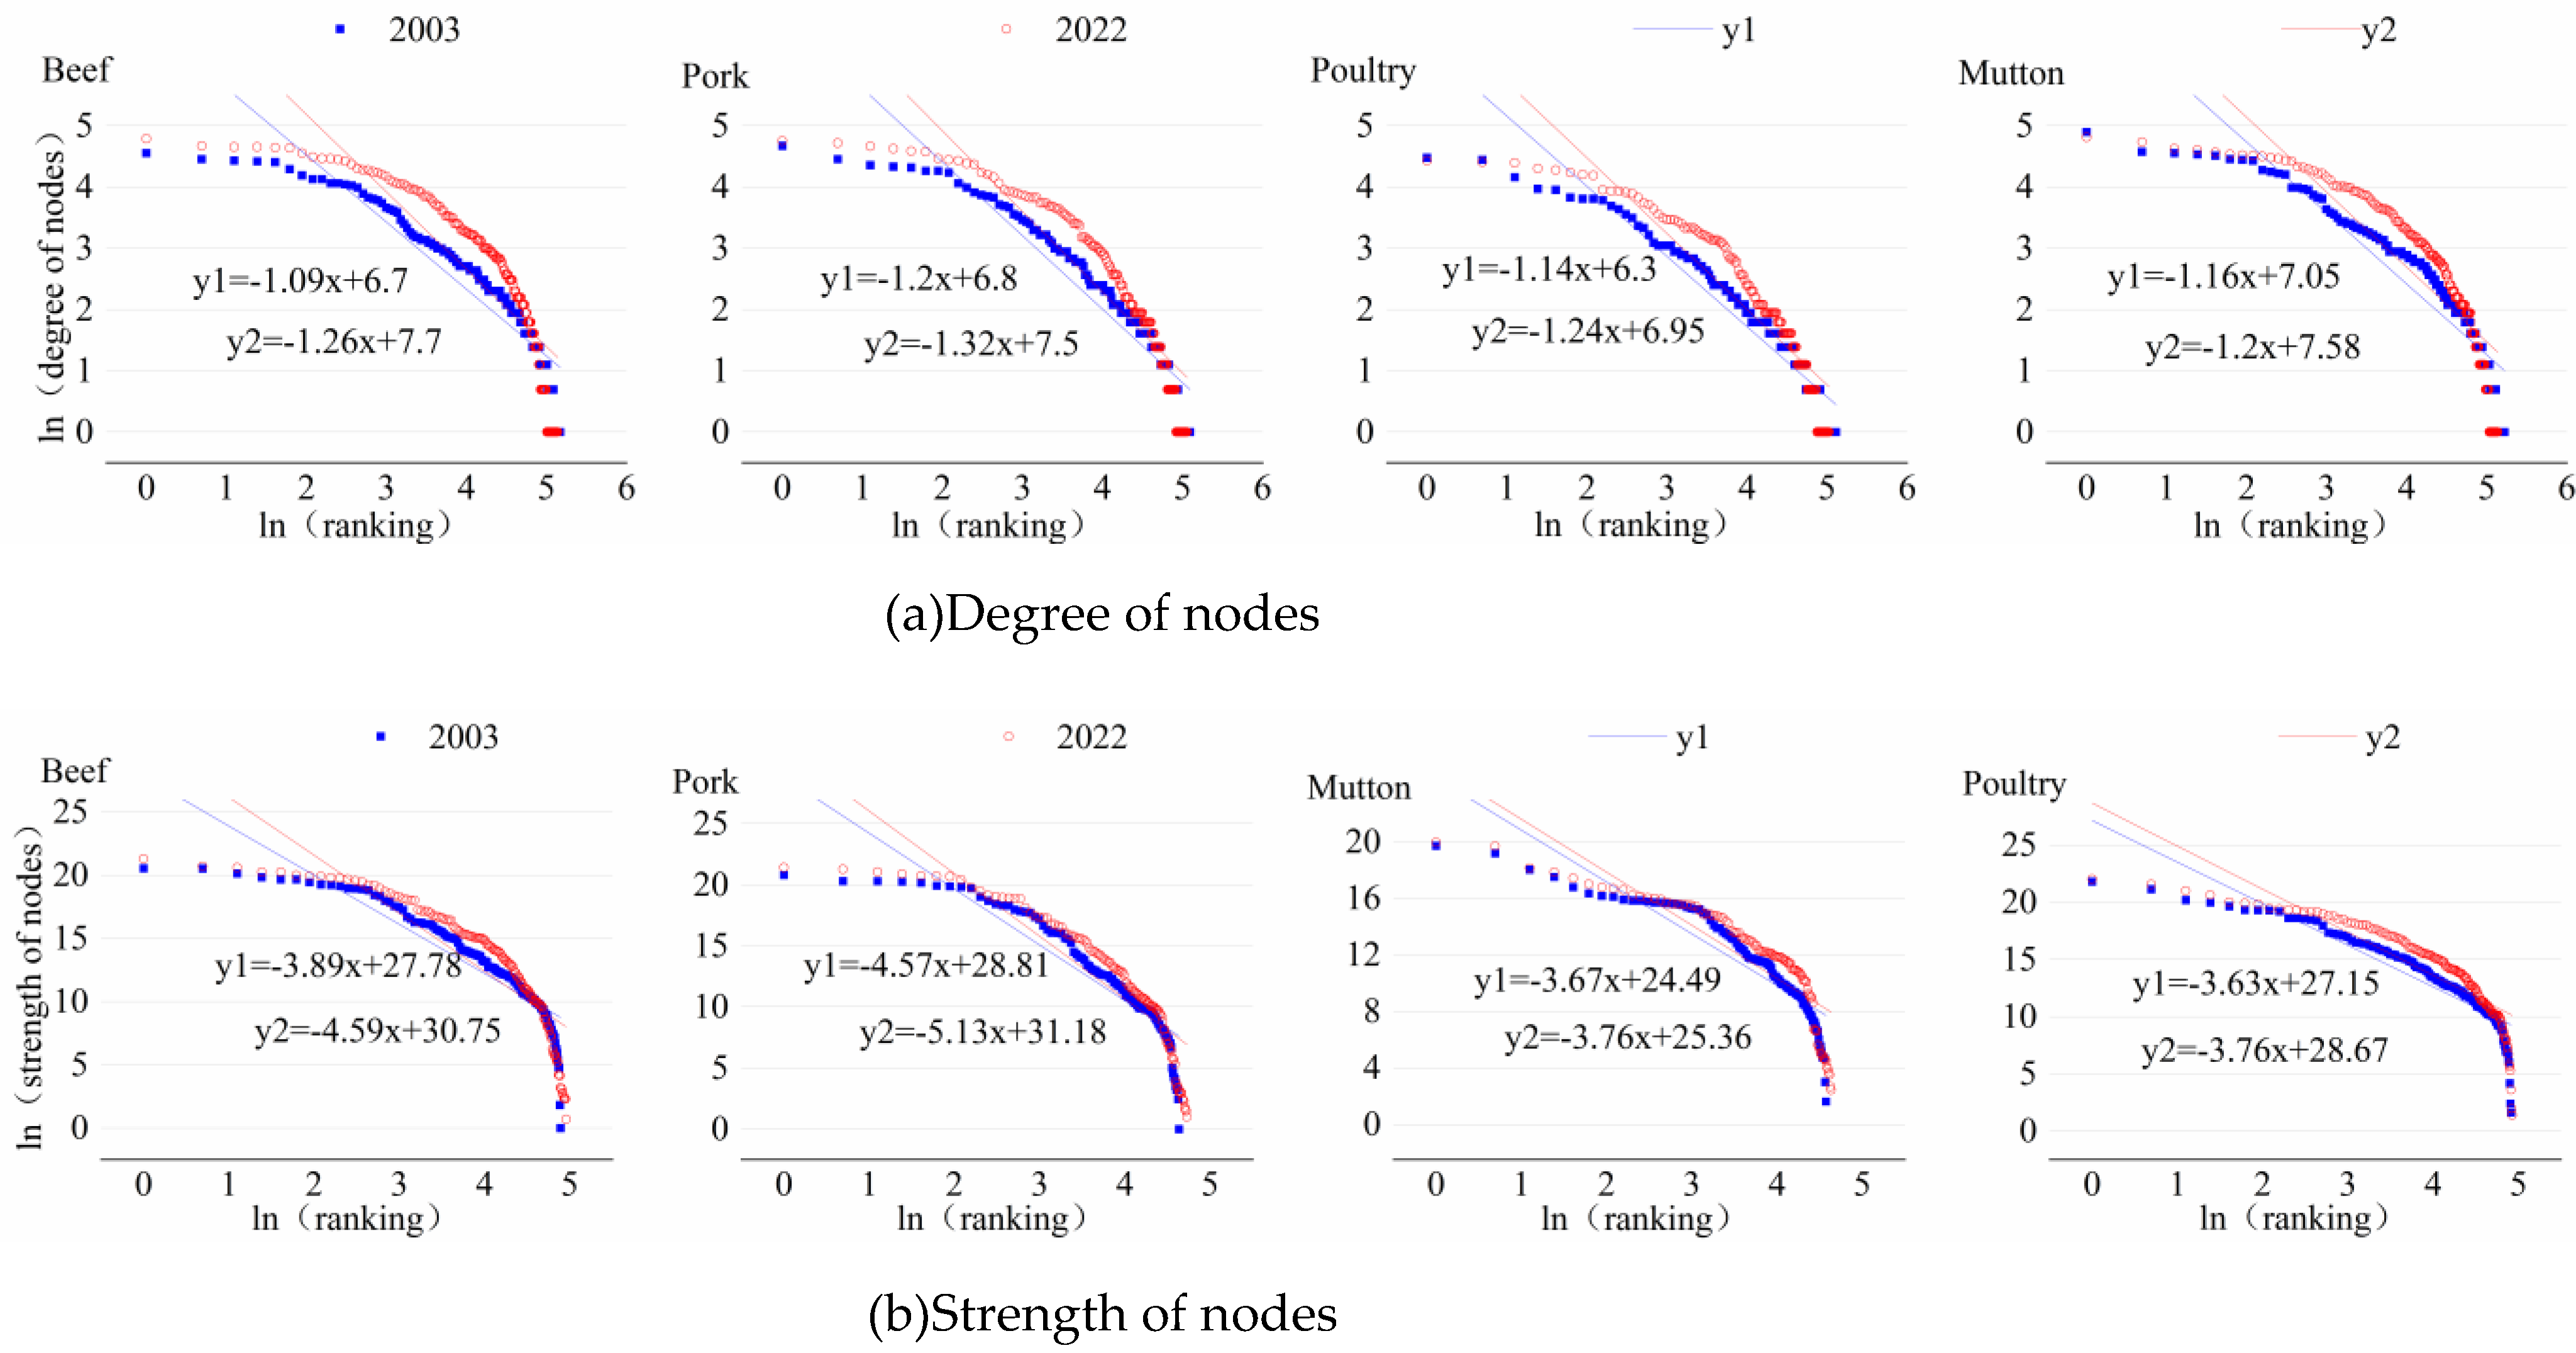
This paper provides an in-depth analysis of the degree distribution characteristics of the four frozen meat trade networks, both weighted and unweighted, to visually present the network’s hierarchical structure. The results are shown in Error! Reference source not found.:
The degree distributions of the four frozen meat trade networks all follow a power-law distribution, reflecting the characteristics of scale-free networks. Among them, the degree distribution of the weighted networks is more hierarchical than that of the unweighted networks. This means that a few nodes control a disproportionately high trade volume, while the majority of nodes have relatively lower trade volumes. Comparing data across different years, the power-law exponents of both unweighted and weighted networks have increased. Specifically, in 2022, the power-law exponents for the weighted degree distributions of pork and beef networks were 5.13 and 4.59, respectively, highlighting a strong hierarchical structure. The power-law exponents for mutton and poultry networks were both 3.76, indicating a more flattened network structure.
Figure 12.
Evolution of the degree distribution of the trade network.
3.2.4. Assortativity Evolution Analysis
The assortativity of a network is a key metric for measuring whether nodes tend to connect with similar nodes, revealing the connection preferences in trade networks. In this study, the assortativity coefficient is used for measurement. When the assortativity coefficient is positive, high-degree (or high-trade volume) nodes are more likely to connect with each other, forming a tightly-knit core group. When the coefficient is negative, low-degree (or low-trade volume) nodes connect to high-degree nodes through hubs, resulting in a more decentralized network structure. The results are shown in Error! Reference source not found..
From Figure 13, it can be seen that from 2003 to 2022, only in 2003 did the unweighted assortativity coefficient for pork briefly exceed 0, while all other assortativity coefficients were negative. This reveals the disassortative nature of these networks. Observing the data in Figure 13 (a), it is clear that the assortativity coefficients for beef and pork fluctuate within the range of 0 to -0.3, while for mutton and poultry, the coefficients fluctuate between -0.3 and -0.6. Further, in Figure 13 (b), the assortativity coefficients of different meat fluctuate with a slightly declining trend. This suggests that the global frozen meat trade network is not a static structure, but rather one that is continually evolving and adjusting. The dependence of "small nodes" on "hubs" also changes as various factors evolve.
3.3. Simulation Analysis of Dynamic Structural Resilience in Global Frozen Meat Trade Network
To explore the evolutionary characteristics of dynamic structural resilience in trade networks, this study employs a dual-dimensional comparative framework of unweighted and weighted networks, examining the following dimensions: (1) quantifying the network performance loss rate caused by the failure of a single node based on 2022 cross-sectional data; (2) identifying vulnerable nodes through temporal evolution data analysis, revealing the evolutionary patterns of the maximum performance loss rate resulting from node removal; (3) assessing the mean performance loss in network performance under the failure scenario of core nodes, and analyzing the role of key nodes in system stability. The study focuses on examining the two key indicator systems: global efficiency loss rate and node degree/strength loss rate.
3.3.1. Simulation Analysis of Single Node Interruption Network Performance Loss Rate
Through disruption simulation, the global efficiency loss rate and node strength loss rate at the single node failure of each node in the frozen meat trade networks of beef, pork, mutton, and poultry in 2022 were sequentially calculated. The results are shown in Error! Reference source not found.. Similar to the previous studies, this research also analyzes both the unweighted and weighted network dimensions.
Through visual analysis of the simulation data, it was found that in the unweighted trade networks for beef, pork, mutton, and poultry, the nodes whose failure leads to a network performance loss rate between 5% and 10% account for 0.58%, 3.8%, 4.6%, and 0.88% of their respective networks. In the weighted trade networks, the proportion of failed nodes within the same loss rate range was 3.8%, 5.7%, 6.2%, and 3.8% for the four types of meat. Further observation reveals that in the unweighted network, only the mutton trade network exhibited a loss rate greater than 10%, with a corresponding node proportion of 0.98%. In the weighted networks, the proportion of nodes with a performance loss rate greater than 10% after node failure was 0.87%, 1.9%, 2.9%, and 1.4% for the beef, pork, mutton, and poultry networks, respectively.
Notably, certain nodes exhibited extraordinary destructive power when they failed, such as China and the United States. This further supports the idea that scale-free networks are robust to random failures but highly sensitive to targeted attacks. Error! Reference source not found. lists the top 10 nodes with the highest performance loss rates for each category.
From Table 6, it can be seen that the degree of disruption caused by the failure of the same node varies across different network performances, with some nodes showing significant differences. To further analyze the impact of core node failures on network performance from multiple perspectives, we constructed a radar chart showing the network performance loss rate under core node failure scenarios, as shown in Error! Reference source not found..
Figure 15 indicates that in the beef trade network, the failure of the China node resulted in a node strength loss rate of 0.28 and a global efficiency loss rate of only 0.03. This suggests that while this node dominates trade flow, it is not at the core layer of the network topology. Similar nodes include Australia in the mutton network and Brazil in the poultry network. Furthermore, in the mutton trade network, after the removal of the Tanzania node, the global efficiency loss rates were 0.11 and 0.10, respectively, but the node strength loss rate (0.007) and degree loss rate (0.008) were less than one-tenth of the efficiency indicator. Structural analysis indicates that this node has high intermediary centrality and is positioned at a critical path in the network topology. Other examples of such structural hub nodes include the United Arab Emirates node in the beef, pork, and mutton networks, the Antigua and Barbuda node in the beef network, and the Ireland node in the poultry network. These nodes are primarily valuable in optimizing the network path structure and improving the overall system efficiency.
3.3.2. Evolution Analysis of Maximum Loss Rate in Network Performance Due to Single Node Disruptions
The evolution of network vulnerability is primarily analyzed by examining the maximum network performance loss rate caused by the single node deletion of the most vulnerable node each year. This approach aims to reveal the extreme manifestation of network vulnerability in the time dimension. The temporal distribution of this indicator is shown in Error! Reference source not found., Error! Reference source not found., with analysis conducted from both unweighted and weighted perspectives.
As shown in the Figure 16, Figure 17, there was a significant fluctuation in the maximum loss rate in 2015. The primary reason for this was the failure of the Dutch node, which led to a sudden increase in the performance loss rates of the global frozen beef, pork, and poultry trade networks. Further analysis revealed that, in that year, Dutch established new trade relationships with multiple countries, resulting in a dense increase in trade connections. Subsequently, the network returned to its historical state, and this process caused the fluctuation in the maximum loss rate for that year.
To further analyze the most disruptive nodes to the network each year and their evolutionary process, the nodes causing the greatest disruption each year were further compiled. The statistical data is shown in Error! Reference source not found..
3.3.3. Dynamic Resilience Evolution Analysis of Trade Networks
The evolutionary analysis of network dynamic resilience mainly involves calculating the average loss rate of network performance after the deletion of core nodes each year, in order to assess the contribution of key nodes to the overall stability of the network and their potential risks. The temporal distribution of this metric is shown inError! Reference source not found.,Error! Reference source not found., with the analysis conducted from both the unweighted and weighted network dimensions.
From Figure 18 and Figure 19, it is evident that the retention rate of the trade network remains high, whether unweighted or weighted. This indicates that even with the failure of core nodes, the trade network can maintain a relatively high level of efficiency and structural integrity, demonstrating certain resilience. As the network continues to evolve and optimize, the "single node vulnerability" of core nodes decreases, and the network’s invulnerability to the failure of core nodes strengthens. With the increasing diversification of network trade, the network is no longer overly reliant on a few core nodes but instead distributes trade across more nodes, forming more alternative paths and redundant connections. This allows the network to maintain high connectivity even when certain core nodes fail.
Except for mutton, the retention rate trends for different meats are similar, showing an upward trend. This indicates that the network is more adaptable and resilient, with higher substitutability and flexibility in the supply chain, which can better cope with the interruption of core nodes. Comparing different types of meat, the beef network shows the highest resilience, followed by poultry and pork. The mutton trade network experiences a decline in node strength after core node disruptions, mainly due to its high dependence on core nodes and relatively fragile supply chains.
4. Discussion and Conclusions
This study constructs a global frozen meat trade network from 2003 to 2022, combining complex network theory and dynamic simulation models, revealing its spatiotemporal evolution patterns and structural resilience characteristics. The main conclusions are as follows:
(1) Polarization and Coexistence of Regionalization and Globalization: The global frozen meat trade network shows a trend of polarization, with both regionalization and globalization coexisting. China has emerged as the largest import hub, with beef imports mainly relying on Brazil and Argentina, and pork imports depending on Spain and Brazil. Brazil has become the dominant exporter of beef and poultry. Trade connections between core countries have deepened, such as the strengthening of trade relations between China and Latin America, and the United States and Mexico, while the market share of traditional exporting countries (such as Australia and New Zealand) has declined. The importance of emerging hubs (e.g., the Netherlands, the United Arab Emirates) has increased, reflecting the dynamic adjustments and regionalization trend of the trade network. Meanwhile, the global frozen meat trade volume has significantly increased, with the total value rising from 41.96 billion USD to 139.14 billion USD, an average annual growth rate of 11.5%. The trade volume has increased from 20.35 billion kilograms to 36.29 billion kilograms, with an average annual growth rate of 3.9%. Among these, poultry trade volume accounts for the highest proportion (37%), while beef trade value accounts for the largest share (40%), reflecting the differentiated positions of different meats in global trade.
(2) Static Structural Resilience: Static structural resilience analysis shows that the frozen meat trade network exhibits significant hierarchical and assortative features. The global efficiency of the weighted network has increased year by year, with poultry having the highest network efficiency and mutton having the lowest. The network's transmissibility is positively correlated with network density. The trade volume is highly concentrated in a few core nodes, and the hierarchical nature of the weighted network is significant (e.g., the power-law exponent of the beef network is 4.59, and that of the pork network is 5.13), reflecting the properties of a scale-free network. In contrast, the unweighted network structure is relatively flat. Moreover, the assortativity coefficient is negative for all networks, indicating that the network relies on "hub" nodes to connect low-degree nodes, with core countries dominating trade paths.
(3) Dynamic Resilience: Dynamic simulation results show that the failure of core nodes causes more significant damage to the weighted network, but the network’s invulnerability to disruption improves over time. The failure of core nodes such as China, the United States, and Brazil has a significant impact on network performance. For instance, the loss rate of China's beef node strength reaches 28%, and the global efficiency loss rate for the Netherlands reaches 50%. However, as trade paths diversify and redundancy is optimized, the network’s invulnerability to core node failure gradually increases, with an average retention rate exceeding 80%. The beef network exhibits the strongest dynamic resilience, while the mutton network is the most fragile due to its dependence on single nodes (such as New Zealand and Australia). The diversification of trade paths effectively reduces "single-node dependency," enhancing the overall resilience of the network.
This study provides methodological innovations for the resilience analysis of the global frozen meat trade network but still has certain limitations. In terms of data, it does not cover unofficial trade and data from smaller economies, which may underestimate the regionalization trend. The trade intensity distance is based solely on trade volume, without considering complex factors such as politics and geography. Methodologically, dynamic resilience analysis only simulates single-node failure and does not involve scenarios of multi-node interrelated failures or supply chain cascading disruptions. Future research could further integrate multi-dimensional weights (e.g., political relationships, logistics costs, environmental policies), develop multi-scenario simulation models (e.g., geopolitical conflicts, climate change), and combine enterprise-level supply chain data to explore the interaction mechanisms between micro-node behavior and macro-network evolution. Additionally, based on the identification of key nodes, strategies such as "regional cooperation + diversified trade" could be designed to provide scientific basis for improving the stability of the global food supply chain.
Author Contributions
Conceptualization, Xiangyu Huang; methodology, Xiangyu Huang and Yihua Li; software, Ming Zhang ,Wujun Tian and Xiangyu Huang; validation, Xiangyu Huang and Ming Zhang; formal analysis, Xiangyu Huang and Ming Zhang; investigation, Xiangyu Huang, Yihua Li and Ming Zhang; resources, Xiangyu Huang, Yihua Li and Ying Fu; data curation, Ming Zhang and Xiangyu Huang; writing—original draft preparation, Ming Zhang and Xiangyu Huang; writing—review and editing, Ming Zhang and Xiangyu Huang; visualization, Ming Zhang; funding acquisition, Yihua Li. All authors have read and agreed to the published version of the manuscript.
Funding
This research was supported by the funding from the National Social Science Fund of China (22BGL173), Changsha Natural Science Foundation Program (kq2402263), National College Students Innovation and Entrepreneurship Training Program of China(S202410538013X), and Hunan Provincial Key Research and Development Program (2022GK2025).
Data Availability Statement
The data presented in this study are available in UN Comtrade Database at https://comtradeplus.un.org , reference number is as shown in Error! Reference source not found..
Conflicts of Interest
The authors declare that they have no known competing financial interests or personal relationships that could have appeared to influence the work reported in this paper.
References
- Chung, M.G.; Kapsar, K.; Frank, K.A.; Liu, J.G. The spatial and temporal dynamics of global meat trade networks. Sci Rep 2020, 10, 10. [Google Scholar] [CrossRef] [PubMed]
- C.Ridley, W.; JeffLuckstead; StephenDevadossImpacts of tariffs and NTMs on beef, pork and poultry trade. Journal of Agricultural Economics 2024, 75, 546–572. [CrossRef]
- Su, H.G.; Tian, Z.M.; Li, Y.; Zhu, Z.R. The Impact of the COVID - 19 Pandemic on the Global Meat Market China Animal Industry. 2020, 56, 186–190. [Google Scholar] [CrossRef]
- Lv, L.; Chen, Y.F. Analysis of the Comparative Advantages of Main Meat Products and the Structure of Import Sources China Animal Industry. 2023, 21–23. [Google Scholar]
- Cheng, Y.H.; Gao, Z.F.; Seale, J. Changing structure of China's meat imports. J. Integr. Agric. 2015, 14, 1081–1091. [Google Scholar] [CrossRef]
- Aranda, M.A.; Sgavioli, S.; Domingues, C.H.F.; Santos, E.T.; Nääs, I.A.; Moura, J.B.; Garcia, R.G. Analysis of Barriers to Brazilian Chicken Meat Imports. Braz. J. Poult. Sci. 2019, 21, 6. [Google Scholar] [CrossRef]
- Chapot, L.; Whatford, L.; Compston, P.; Tak, M.; Cuevas, S.; Garza, M.; Bennani, H.; Bin Aslam, H.; Hennessey, M.; Limon, G.; et al. A Global Media Analysis of the Impact of the COVID-19 Pandemic on Chicken Meat Food Systems: Key Vulnerabilities and Opportunities for Building Resilience. Sustainability 2021, 13, 12. [Google Scholar] [CrossRef]
- Calvia, M. Beef, lamb, pork and poultry meat commodity prices: Historical fluctuations and synchronisation with a focus on recent global crises. Agric. Econ. 2024, 70, 24–33. [Google Scholar] [CrossRef]
- Ercsey-Ravasz, M.; Toroczkai, Z.; Lakner, Z.; Baranyi, J. Complexity of the International Agro-Food Trade Network and Its Impact on Food Safety. PLoS One 2012, 7, 7. [Google Scholar] [CrossRef]
- Torreggiani, S.; Mangioni, G.; Puma, M.J.; Fagiolo, G. Identifying the community structure of the food-trade international multi-network. Environ. Res. Lett. 2018, 13, 14. [Google Scholar] [CrossRef]
- Karakoc, D.B.; Konar, M. A complex network framework for the efficiency and resilience trade-off in global food trade. Environ. Res. Lett. 2021, 16, 19. [Google Scholar] [CrossRef]
- Wang, J.Y.; Dai, C. Evolution of Global Food Trade Patterns and Its Implications for Food Security Based on Complex Network Analysis. Foods 2021, 10, 15. [Google Scholar] [CrossRef] [PubMed]
- Wang, X.; Ma, L.B.; Yan, S.M.; Chen, X.F.; Growe, A. Trade for Food Security: The Stability of Global Agricultural Trade Networks. Foods 2023, 12, 16. [Google Scholar] [CrossRef]
- Clemente, G.P.; Cornaro, A.; Della Corte, F. Unraveling the key drivers of community composition in the agri-food trade network. Sci Rep 2023, 13, 13. [Google Scholar] [CrossRef] [PubMed]
- Silvestrini, M.M.; Smith, N.W.; Sarti, F.M. Evolution of global food trade network and its effects on population nutritional status. Curr. Res. Food Sci. 2023, 6, 9. [Google Scholar] [CrossRef]
- Alhussam, M.I.; Ren, J.F.; Yao, H.X.; Abu Risha, O. Food Trade Network and Food Security: From the Perspective of Belt and Road Initiative. Agriculture-Basel 2023, 13, 19. [Google Scholar] [CrossRef]
- C. S. Holling (1973). In Foundations of Socio-Environmental Research: Legacy Readings with Commentaries, Burnside, W.R., Pulver, S., Fiorella, K.J., Avolio, M.L., Alexander, S.M., Eds.; Cambridge University Press: Cambridge. 2022; pp. 460–482.
- Li, L.; Zhang, P.; Tan, J.; Guan, H. Review on the evolution of resilience concept and research progress on regional economic resilience. Hum. Geogr 2019, 34, 1–7. [Google Scholar]
- Liu, W.; Song, Z.Y. Review of studies on the resilience of urban critical infrastructure networks. Reliab. Eng. Syst. Saf. 2020, 193, 16. [Google Scholar] [CrossRef]
- Akbarzadeh, M.; Memarmontazerin, S.; Derrible, S.; Reihani, S.F.S. The role of travel demand and network centrality on the connectivity and resilience of an urban street system. Transportation 2019, 46, 1127–1141. [Google Scholar] [CrossRef]
- Kharrazi, A.; Rovenskaya, E.; Fath, B.D. Network structure impacts global commodity trade growth and resilience. PLoS One 2017, 12, 13. [Google Scholar] [CrossRef]
- Mohammed, A.; Govindan, K.; Zubairu, N.; Pratabaraj, J.; Abideen, A.Z. Multi-tier supply chain network design: A key towards sustainability and resilience. Comput. Ind. Eng. 2023, 182, 18. [Google Scholar] [CrossRef]
- Kharrazi, A.; Akiyama, T.; Yu, Y.D.; Li, J. Evaluating the evolution of the Heihe River basin using the ecological network analysis: Efficiency, resilience, and implications for water resource management policy. Sci. Total Environ. 2016, 572, 688–696. [Google Scholar] [CrossRef] [PubMed]
- Wei, Y.; Xiu, C. Study on the concept and analytical framework of city network resilience. Progress in Geography 2020, 39, 488–502. [Google Scholar] [CrossRef]
- Ash, J.; Newth, D. Optimizing complex networks for resilience against cascading failure. Physica A: Statistical Mechanics and its Applications 2007, 380, 673–683. [Google Scholar] [CrossRef]
- Berche, B.; von Ferber, C.; Holovatch, T.; Holovatch, Y. Resilience of public transport networks against attacks. Eur. Phys. J. B 2009, 71, 125–137. [Google Scholar] [CrossRef]
- Reggiani, A. Network resilience for transport security: Some methodological considerations. Transport Policy 2013, 28, 63–68. [Google Scholar] [CrossRef]
- Zhao, K.; Kumar, A.; Harrison, T.P.; Yen, J. Analyzing the Resilience of Complex Supply Network Topologies Against Random and Targeted Disruptions. IEEE Syst. J. 2011, 5, 28–39. [Google Scholar] [CrossRef]
- Chopra, S.S.; Dillon, T.; Bilec, M.M.; Khanna, V. A network-based framework for assessing infrastructure resilience: a case study of the London metro system. J. R. Soc. Interface 2016, 13, 11. [Google Scholar] [CrossRef]
- Wang, X.; Qiang, W.L.; Niu, S.W.; Liu, A.M.; Cheng, S.K.; Li, Z. Analysis of the Global Agricultural Product Trade Network and Its Evolution. journal of Natural Resources 2018, 33, 940–953. [Google Scholar]
- Yang, W.L.; Du, D.B.; Ma, Y.H.; Jiao, M.Q. Spatial Structure and Proximity of the Trade Network of Countries along the Belt and Road Initiative Geographical research. 2018, 37, 2218–2235. [Google Scholar]
- Li, Y.H.; Zobel, C.W.; Seref, O.; Chatfield, D. Network characteristics and supply chain resilience under conditions of risk propagation. Int. J. Prod. Econ. 2020, 223, 13. [Google Scholar] [CrossRef]
- Wang, F.; Tian, M.H.; Yin, R.S.; Yin, Z.H.; Zhang, Z.Y. Change of global woody forest products trading network and relationship between large supply and demand countries. Resources Science 2021, 43, 1008–1024. [Google Scholar] [CrossRef]
- Tan, D.; Ma, S.T. Evolution of Soybean International Trade Pattern and China’sCountermeasures. Economic Geography 2022, 42, 110–119. [Google Scholar] [CrossRef]
- Liu, X.M.; Li, D.Q.; Ma, M.Q.; Szymanski, B.K.; Stanley, H.E.; Gao, J.X. Network resilience. Phys. Rep.-Rev. Sec. Phys. Lett. 2022, 971, 1–108. [Google Scholar] [CrossRef]
- Jiao, B. Measuring the Resilience of International Energy Trade Networks From an Energy Security Perspective. J. Ind. Technol. Econ 2024, 43, 131–140. [Google Scholar]
- Li, J.Y.; Zhou, N.; Hu, P.Q.; Wu, Y.Q.; Cheng, J.H. Evolution of trade network pattern of chromium ore in global and analysis of competitiveness. China Mining magazine 2024, 33, 48–58. [Google Scholar]
- Dolfing, A.G.; Leuven, J.; Dermody, B.J. The effects of network topology, climate variability and shocks on the evolution and resilience of a food trade network. PLoS One 2019, 14, 18. [Google Scholar] [CrossRef]
- Hedlund, J.; Carlsen, H.; Croft, S.; West, C.; Bodin, O.; Stokeld, E.; Jägermeyr, J.; Mueller, C. Impacts of climate change on global food trade networks. Environ. Res. Lett. 2022, 17, 14. [Google Scholar] [CrossRef]
- Enns, C.; van Vliet, N.; Mbane, J.; Muhindo, J.; Nyumu, J.; Bersaglio, B.; Masse, F.; Cerutti, P.O.; Nasi, R. Vulnerability and coping strategies within wild meat trade networks during the COVID-19 pandemic. World development 2023, 170, 106310. [Google Scholar] [CrossRef]
- Dong, Z.L.; Wang, Q.; Yang, Q.R. Research on the Changes in the Network Robustness of International Cold - chain Meat Products Trade under the Background of COVID - 19. Journal of Handan University 2024, 34, 96–107. [Google Scholar]
- Ji, G.; Zhong, H.; Feukam Nzudie, H.L.; Wang, P.; Tian, P. The structure, dynamics, and vulnerability of the global food trade network. Journal of Cleaner Production 2024, 434, 140439. [Google Scholar] [CrossRef]
- Xu, H.; Niu, N.; Li, D.M.; Wang, C.J. A Dynamic Evolutionary Analysis of the Vulnerability of Global Food Trade Networks. Sustainability 2024, 16, 17. [Google Scholar] [CrossRef]
- Gao, J.X.; Barzel, B.; Barabási, A.L. Universal resilience patterns in complex networks. Nature 2016, 530, 307–312. [Google Scholar] [CrossRef] [PubMed]
- Wu, Z.; Cheng, S.; Xu, K.Y.; Qian, Y.P. Ecological network resilience evaluation and ecological strategic space identification based on complex network theory: A case study of Nanjing city. Ecol. Indic. 2024, 158, 17. [Google Scholar] [CrossRef]
- Yuan, X.J.; Ge, C.B.; Liu, Y.P.; Li, N.; Wang, Y. Evolution of Global Crude Oil Trade Network Structure and Resilience. Sustainability 2022, 14, 21. [Google Scholar] [CrossRef]
- Chen, Y.R.; Chen, M.P. Evolution of the global phosphorus trade network: A production perspective on resilience. Journal of Cleaner Production 2023, 405, 10. [Google Scholar] [CrossRef]
- Xu, C.; Xu, X.G. A two-stage resilience promotion approach for urban rail transit networks based on topology enhancement and recovery optimization. Physica A 2024, 635, 28. [Google Scholar] [CrossRef]
- Kim, Y.; Chen, Y.S.; Linderman, K. Supply network disruption and resilience: A network structural perspective. J. Oper. Manag. 2015, 33-34, 43–59. [Google Scholar] [CrossRef]
- Bai, X.W.; Ma, Z.J.; Zhou, Y.M. Data-driven static and dynamic resilience assessment of the global liner shipping network. Transp. Res. Pt. e-Logist. Transp. Rev. 2023, 170, 19. [Google Scholar] [CrossRef]
- Li, J.X.; Nie, W.B.; Zhang, M.X.; Wang, L.N.; Dong, H.Y.; Xu, B. Assessment and optimization of urban ecological network resilience based on disturbance scenario simulations: A case study of Nanjing city. Journal of Cleaner Production 2024, 438, 16. [Google Scholar] [CrossRef]
- Gao, J.X.; Liu, X.M.; Li, D.Q.; Havlin, S. Recent Progress on the Resilience of Complex Networks. Energies 2015, 8, 12187–12210. [Google Scholar] [CrossRef]
- Kim, D.H.; Eisenberg, D.A.; Chun, Y.H.; Park, J. Network topology and resilience analysis of South Korean power grid. Physica A 2017, 465, 13–24. [Google Scholar] [CrossRef]
- Herrera, M.; Abraham, E.; Stoianov, I. A Graph-Theoretic Framework for Assessing the Resilience of Sectorised Water Distribution Networks. Water Resour. Manag. 2016, 30, 1685–1699. [Google Scholar] [CrossRef]
- Miao, C.H.; Wan, Y.F.; Kang, M.L.; Xiang, F. Topological analysis, endogenous mechanisms, and supply risk propagation in the polycrystalline silicon trade dependency network. Journal of Cleaner Production 2024, 439, 18. [Google Scholar] [CrossRef]
- Dong, G.G.; Wang, F.; Shekhtman, L.M.; Danziger, M.M.; Fan, J.F.; Du, R.J.; Liu, J.G.; Tian, L.X.; Stanley, H.E.; Havlin, S. Optimal resilience of modular interacting networks. Proc. Natl. Acad. Sci. U. S. A. 2021, 118, 8. [Google Scholar] [CrossRef]
- Wan, Z.L.; Mahajan, Y.; Kang, B.W.; Moore, T.J.; Cho, J.H. A Survey on Centrality Metrics and Their Network Resilience Analysis. IEEE Access 2021, 9, 104773–104819. [Google Scholar] [CrossRef]
- Artime, O.; Grassia, M.; De Domenico, M.; Gleeson, J.P.; Makse, H.A.; Mangioni, G.; Perc, M.; Radicchi, F. Robustness and resilience of complex networks. Nat. Rev. Phys. 2024, 6, 114–131. [Google Scholar] [CrossRef]
- Sun, X.; Wei, Y.; Jin, Y.; Song, W.; Li, X. The evolution of structural resilience of global oil and gas resources trade network. Global Networks 2023, 23, 391–411. [Google Scholar] [CrossRef]
- Meng, Y.Y.; Zhao, X.F.; Liu, J.Z.; Qi, Q.J. Dynamic Influence Analysis of the Important Station Evolution on the Resilience of Complex Metro Network. Sustainability 2023, 15, 15. [Google Scholar] [CrossRef]
- Clark, K.L.; Bhatia, U.; Kodra, E.A.; Ganguly, A.R. Resilience of the US National Airspace System Airport Network. IEEE Trans. Intell. Transp. Syst. 2018, 19, 3785–3794. [Google Scholar] [CrossRef]
- Huang, X.; Wang, Z.; Pang, Y.; Tian, W.; Zhang, M. Static Resilience Evolution of the Global Wood Forest Products Trade Network: A Complex Directed Weighted Network Analysis. Forests 2024, 15, 1665. [Google Scholar] [CrossRef]
- Newman, M.E.J. The Structure and Function of Complex Networks. SIAM Review 2003, 45, 167–256. [Google Scholar] [CrossRef]
- Yu, Y.U.; Daipeng, M.A.; Xianmei, W. International trade network resilience for products in the whole industrial chain of iron ore resources. Resources Science 2022, 44, 2006–2021. [Google Scholar] [CrossRef]
- Wang, X.F.; LI, X.; Chen, G.R. Network Science: An Introduction; Higher Education Press: 2012.
- Crespo, J.; Suire, R.; Vicente, J. Lock-in or lock-out? How structural properties of knowledge networks affect regional resilience. Journal of Economic Geography 2013, 14, 199–219. [Google Scholar] [CrossRef]
- Pigorsch, U.; Sabek, M. Assortative mixing in weighted directed networks. Physica A: Statistical Mechanics and its Applications 2022, 604, 127850. [Google Scholar] [CrossRef]
- Blondel, V.D.; Guillaume, J.-L.; Lambiotte, R.; Lefebvre, E. Fast unfolding of communities in large networks. Journal of Statistical Mechanics: Theory and Experiment 2008, 2008, P10008. [Google Scholar] [CrossRef]
Figure 6.
Grading map of the change values of the node strength in trade network in 2003 and 2022.
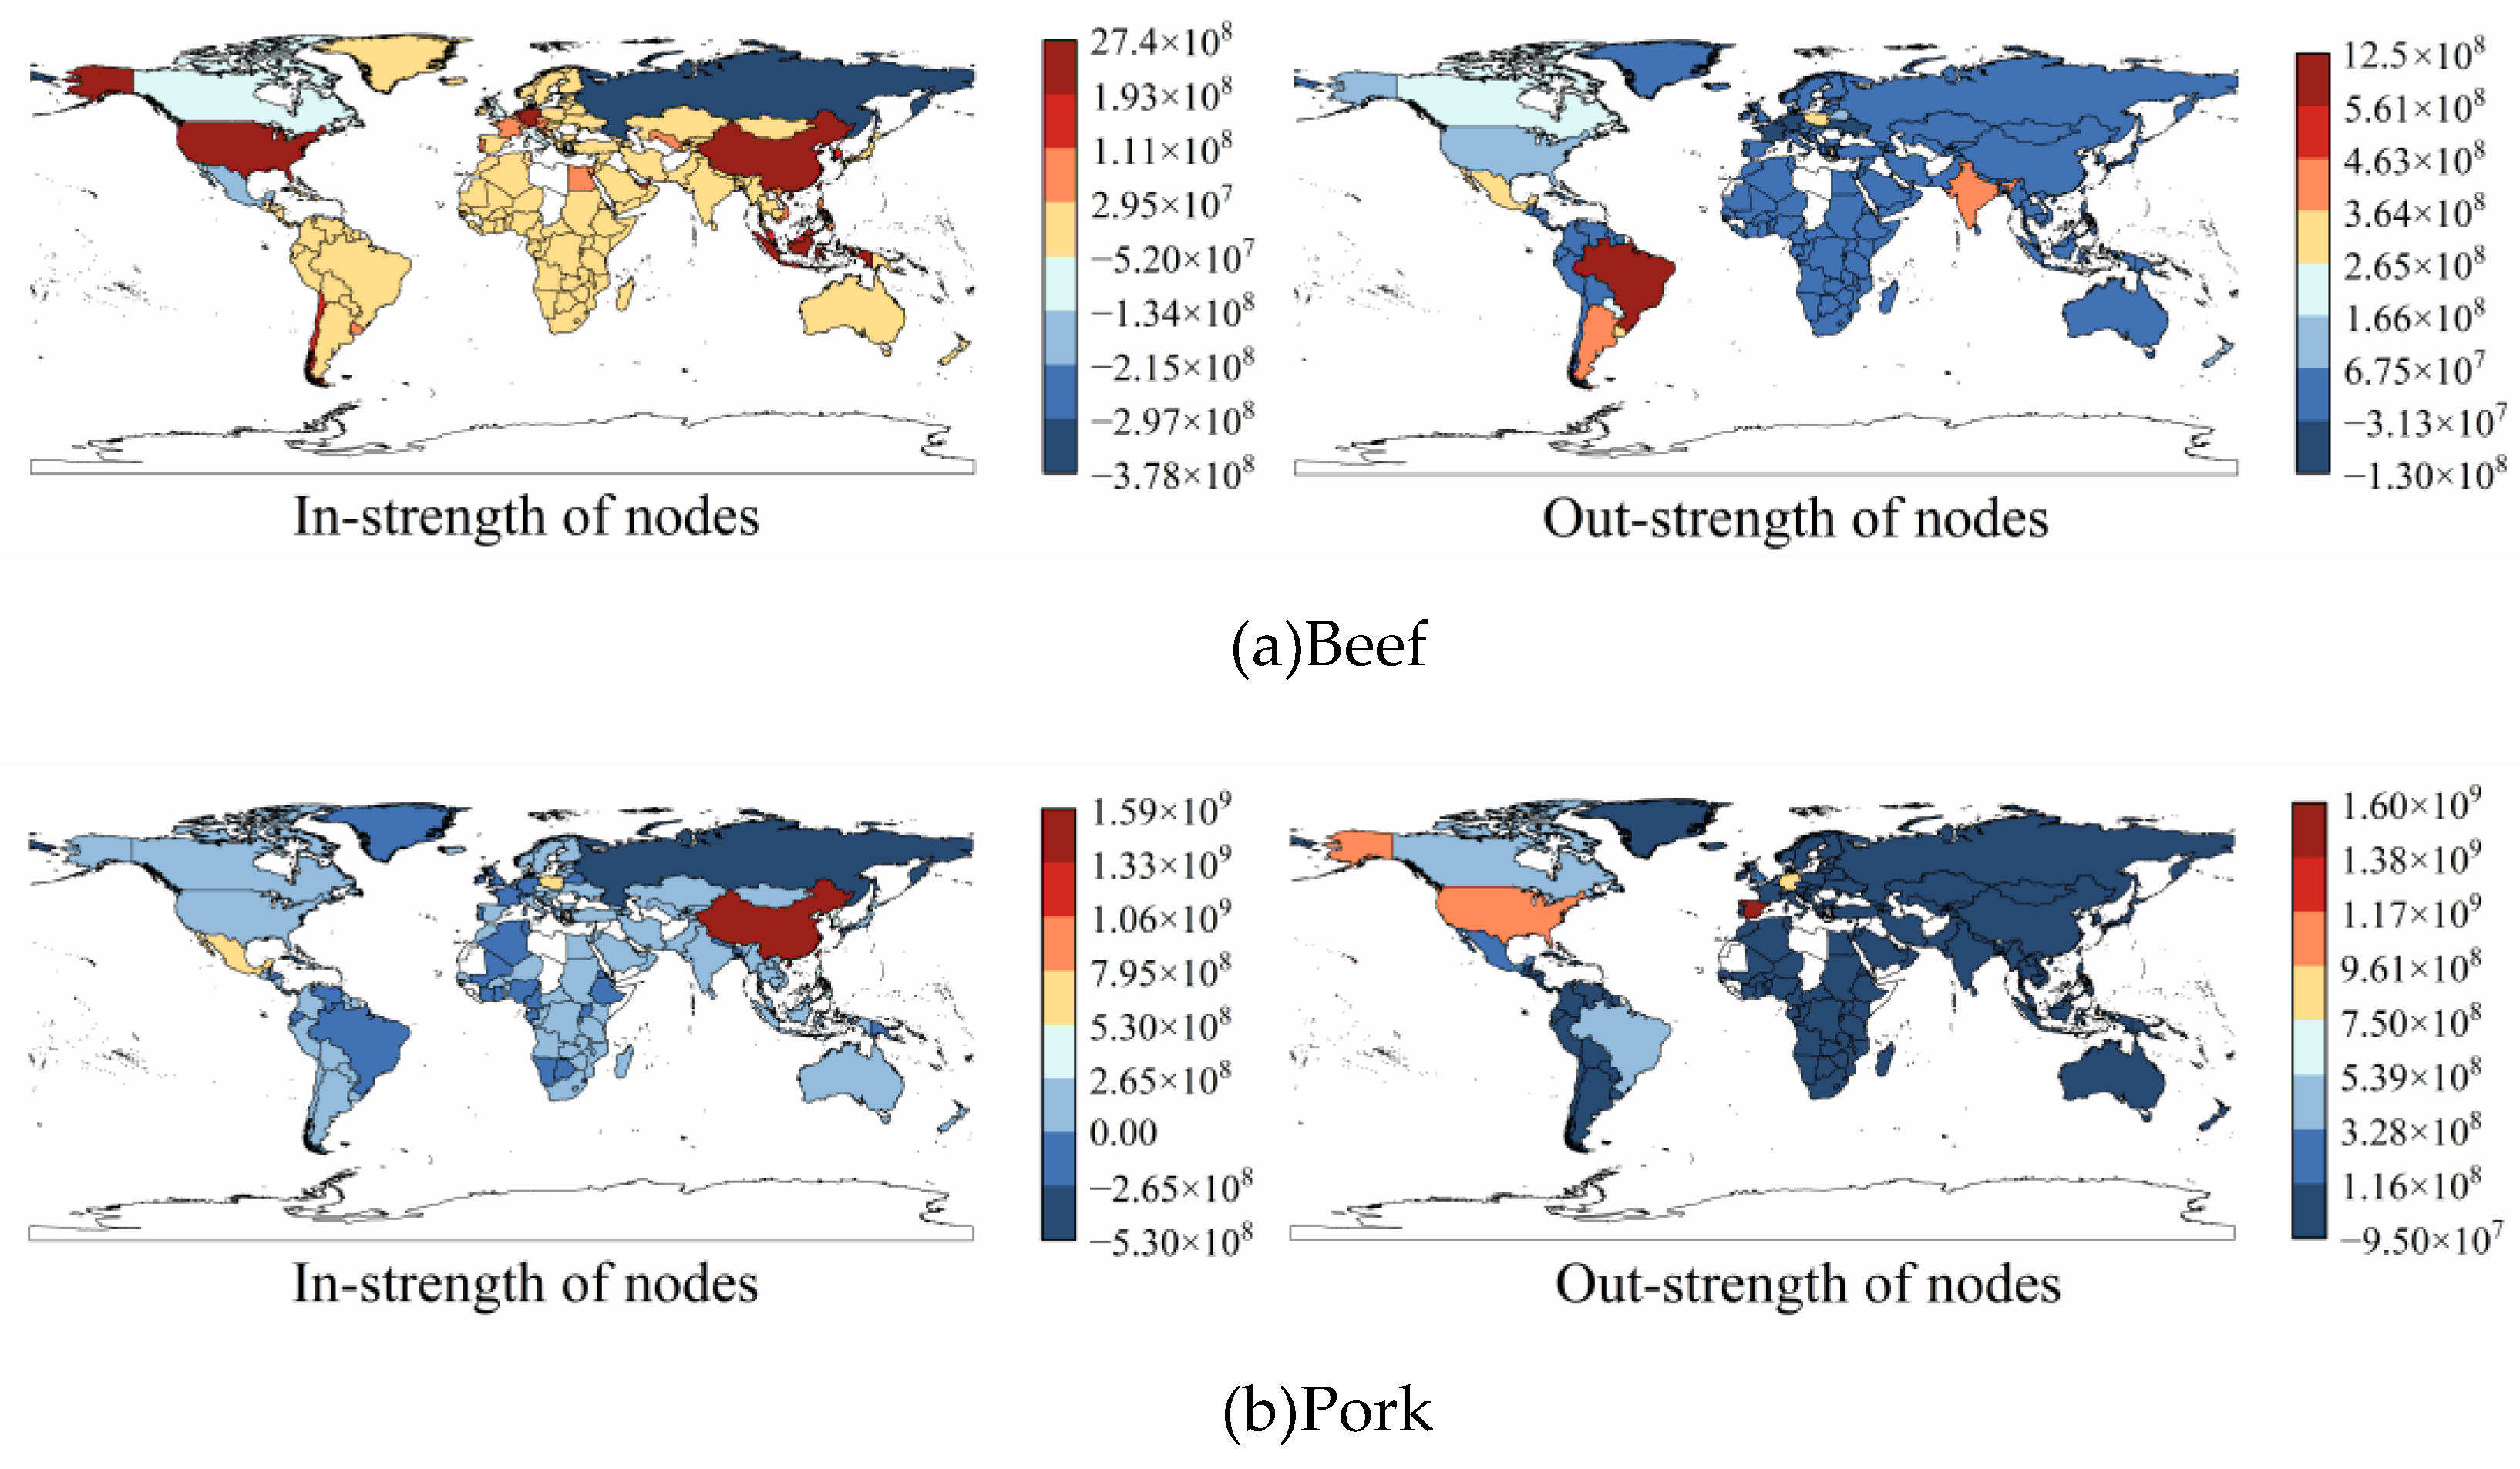
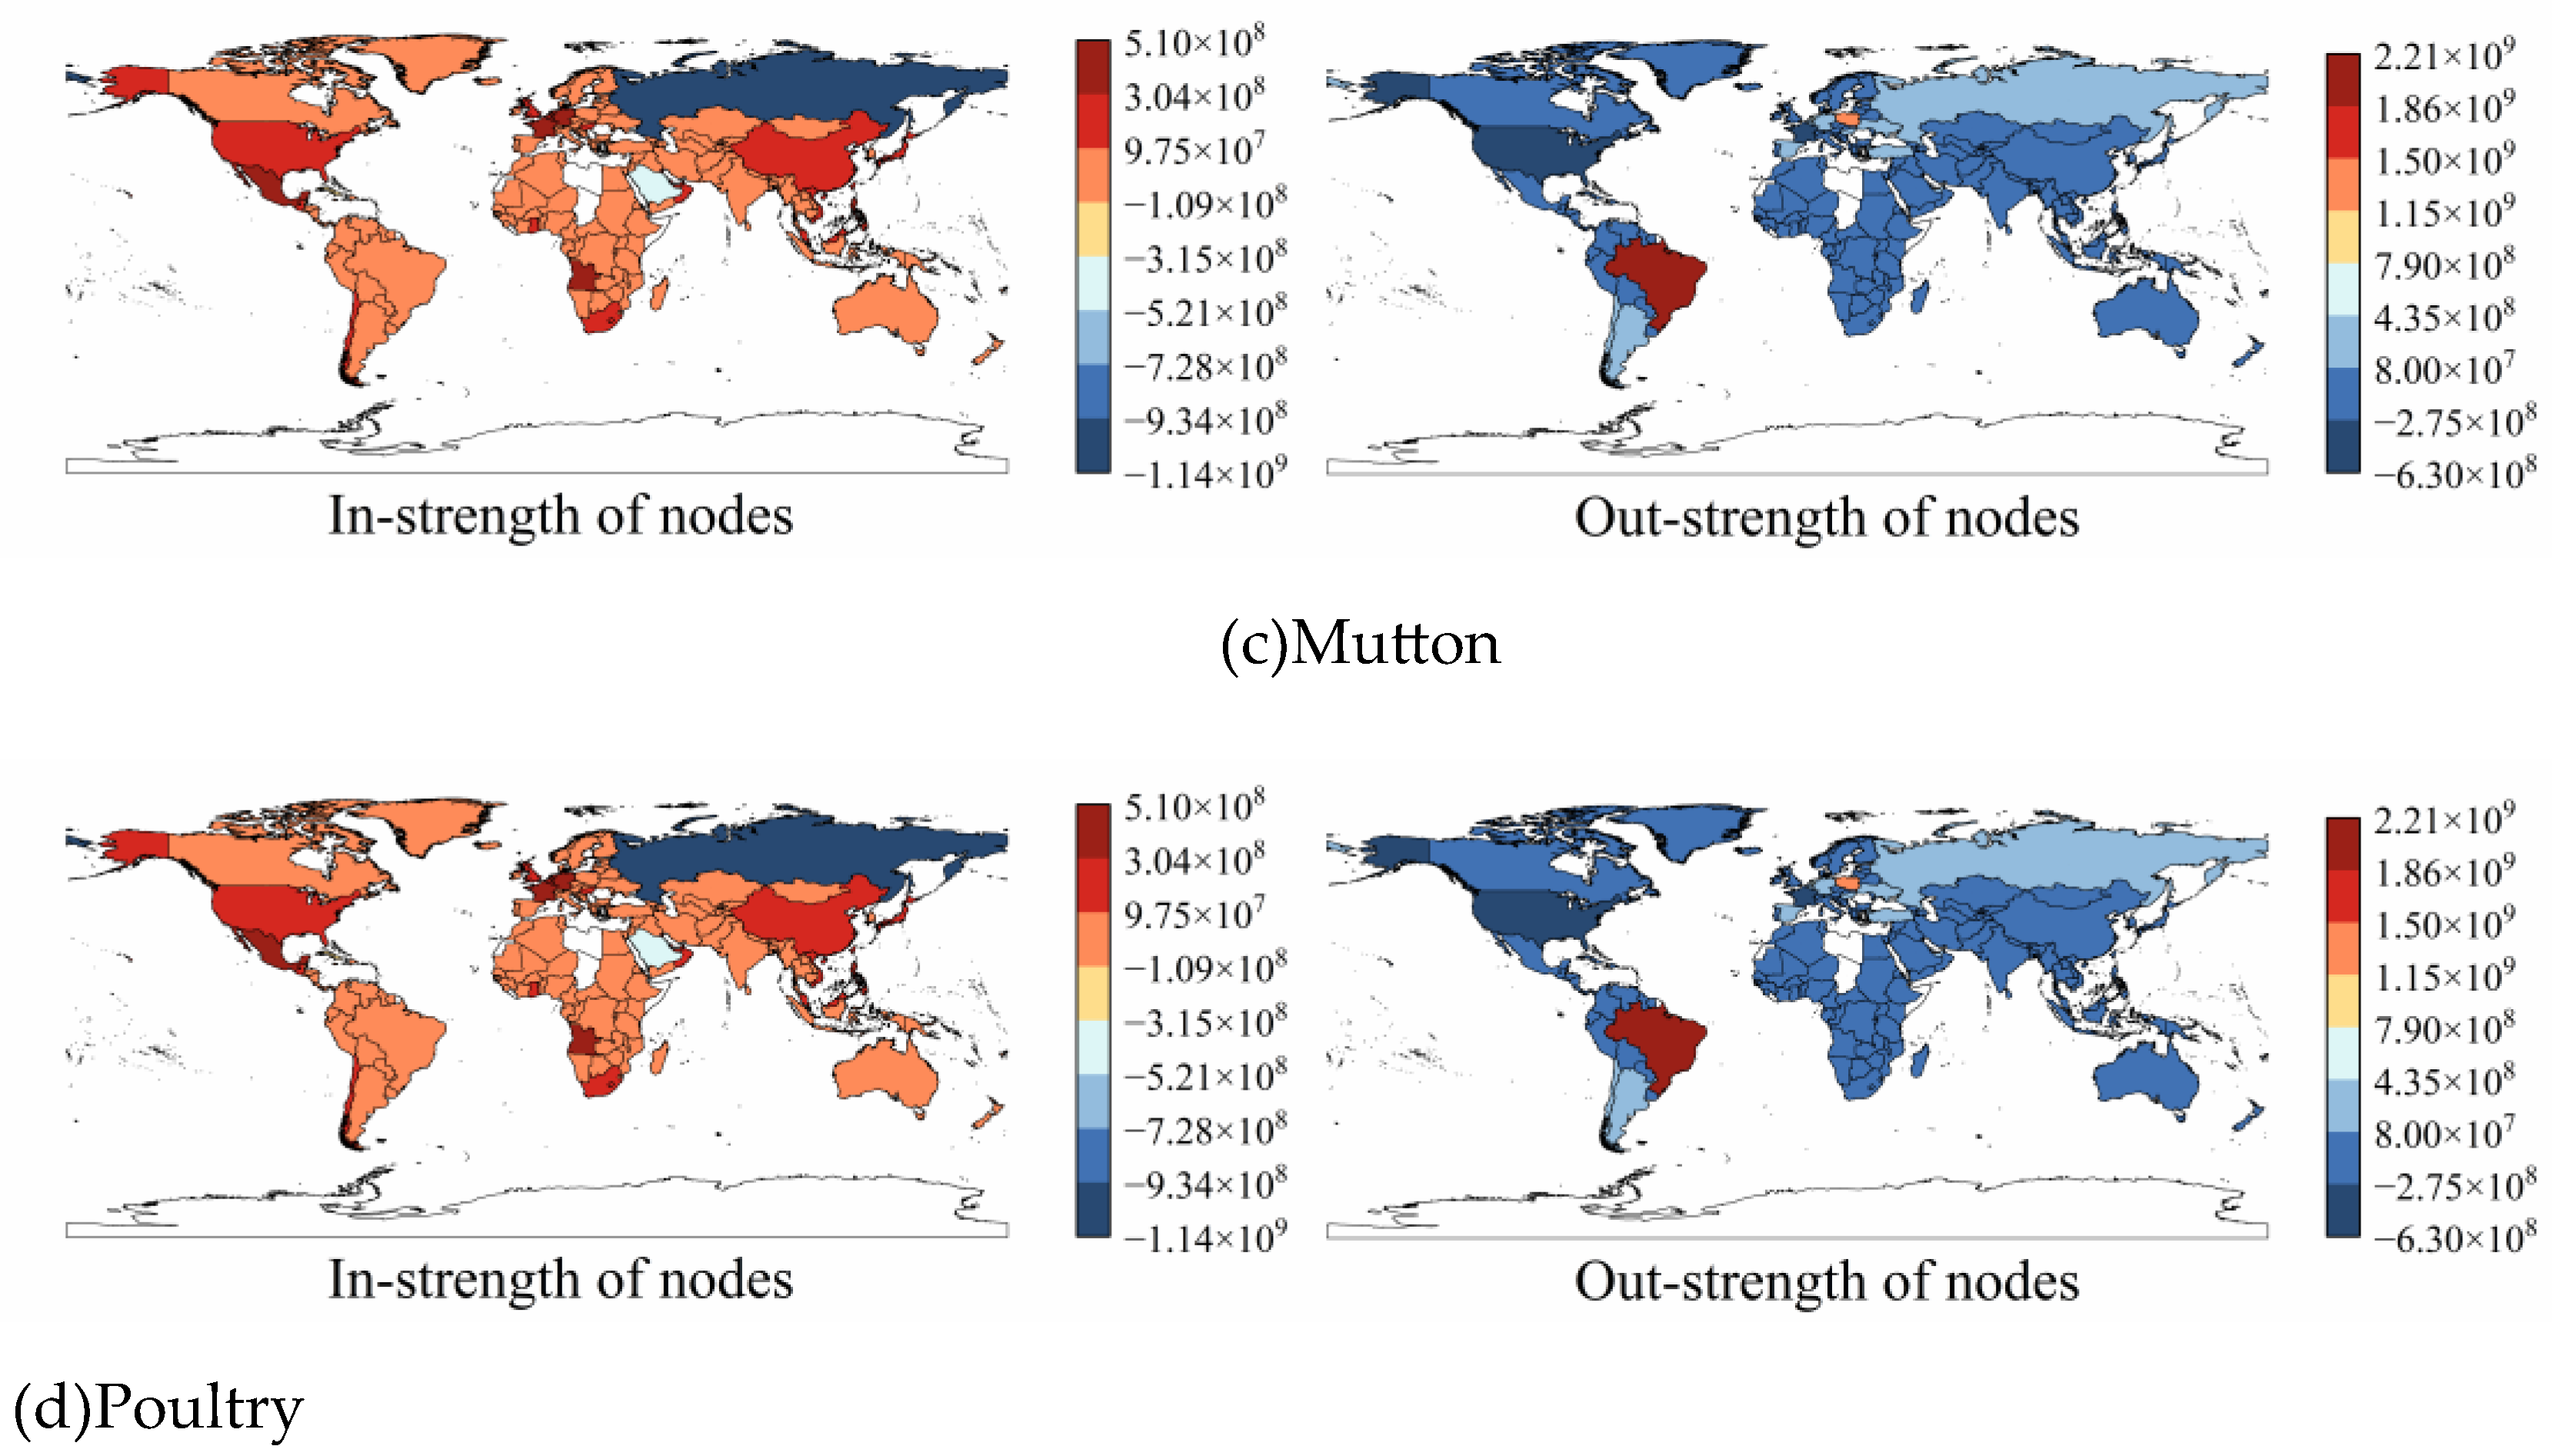
Figure 7.
Map of flow changes of main trade nodes and their connected edges in trade network in 2003 and 2022.
Figure 7.
Map of flow changes of main trade nodes and their connected edges in trade network in 2003 and 2022.
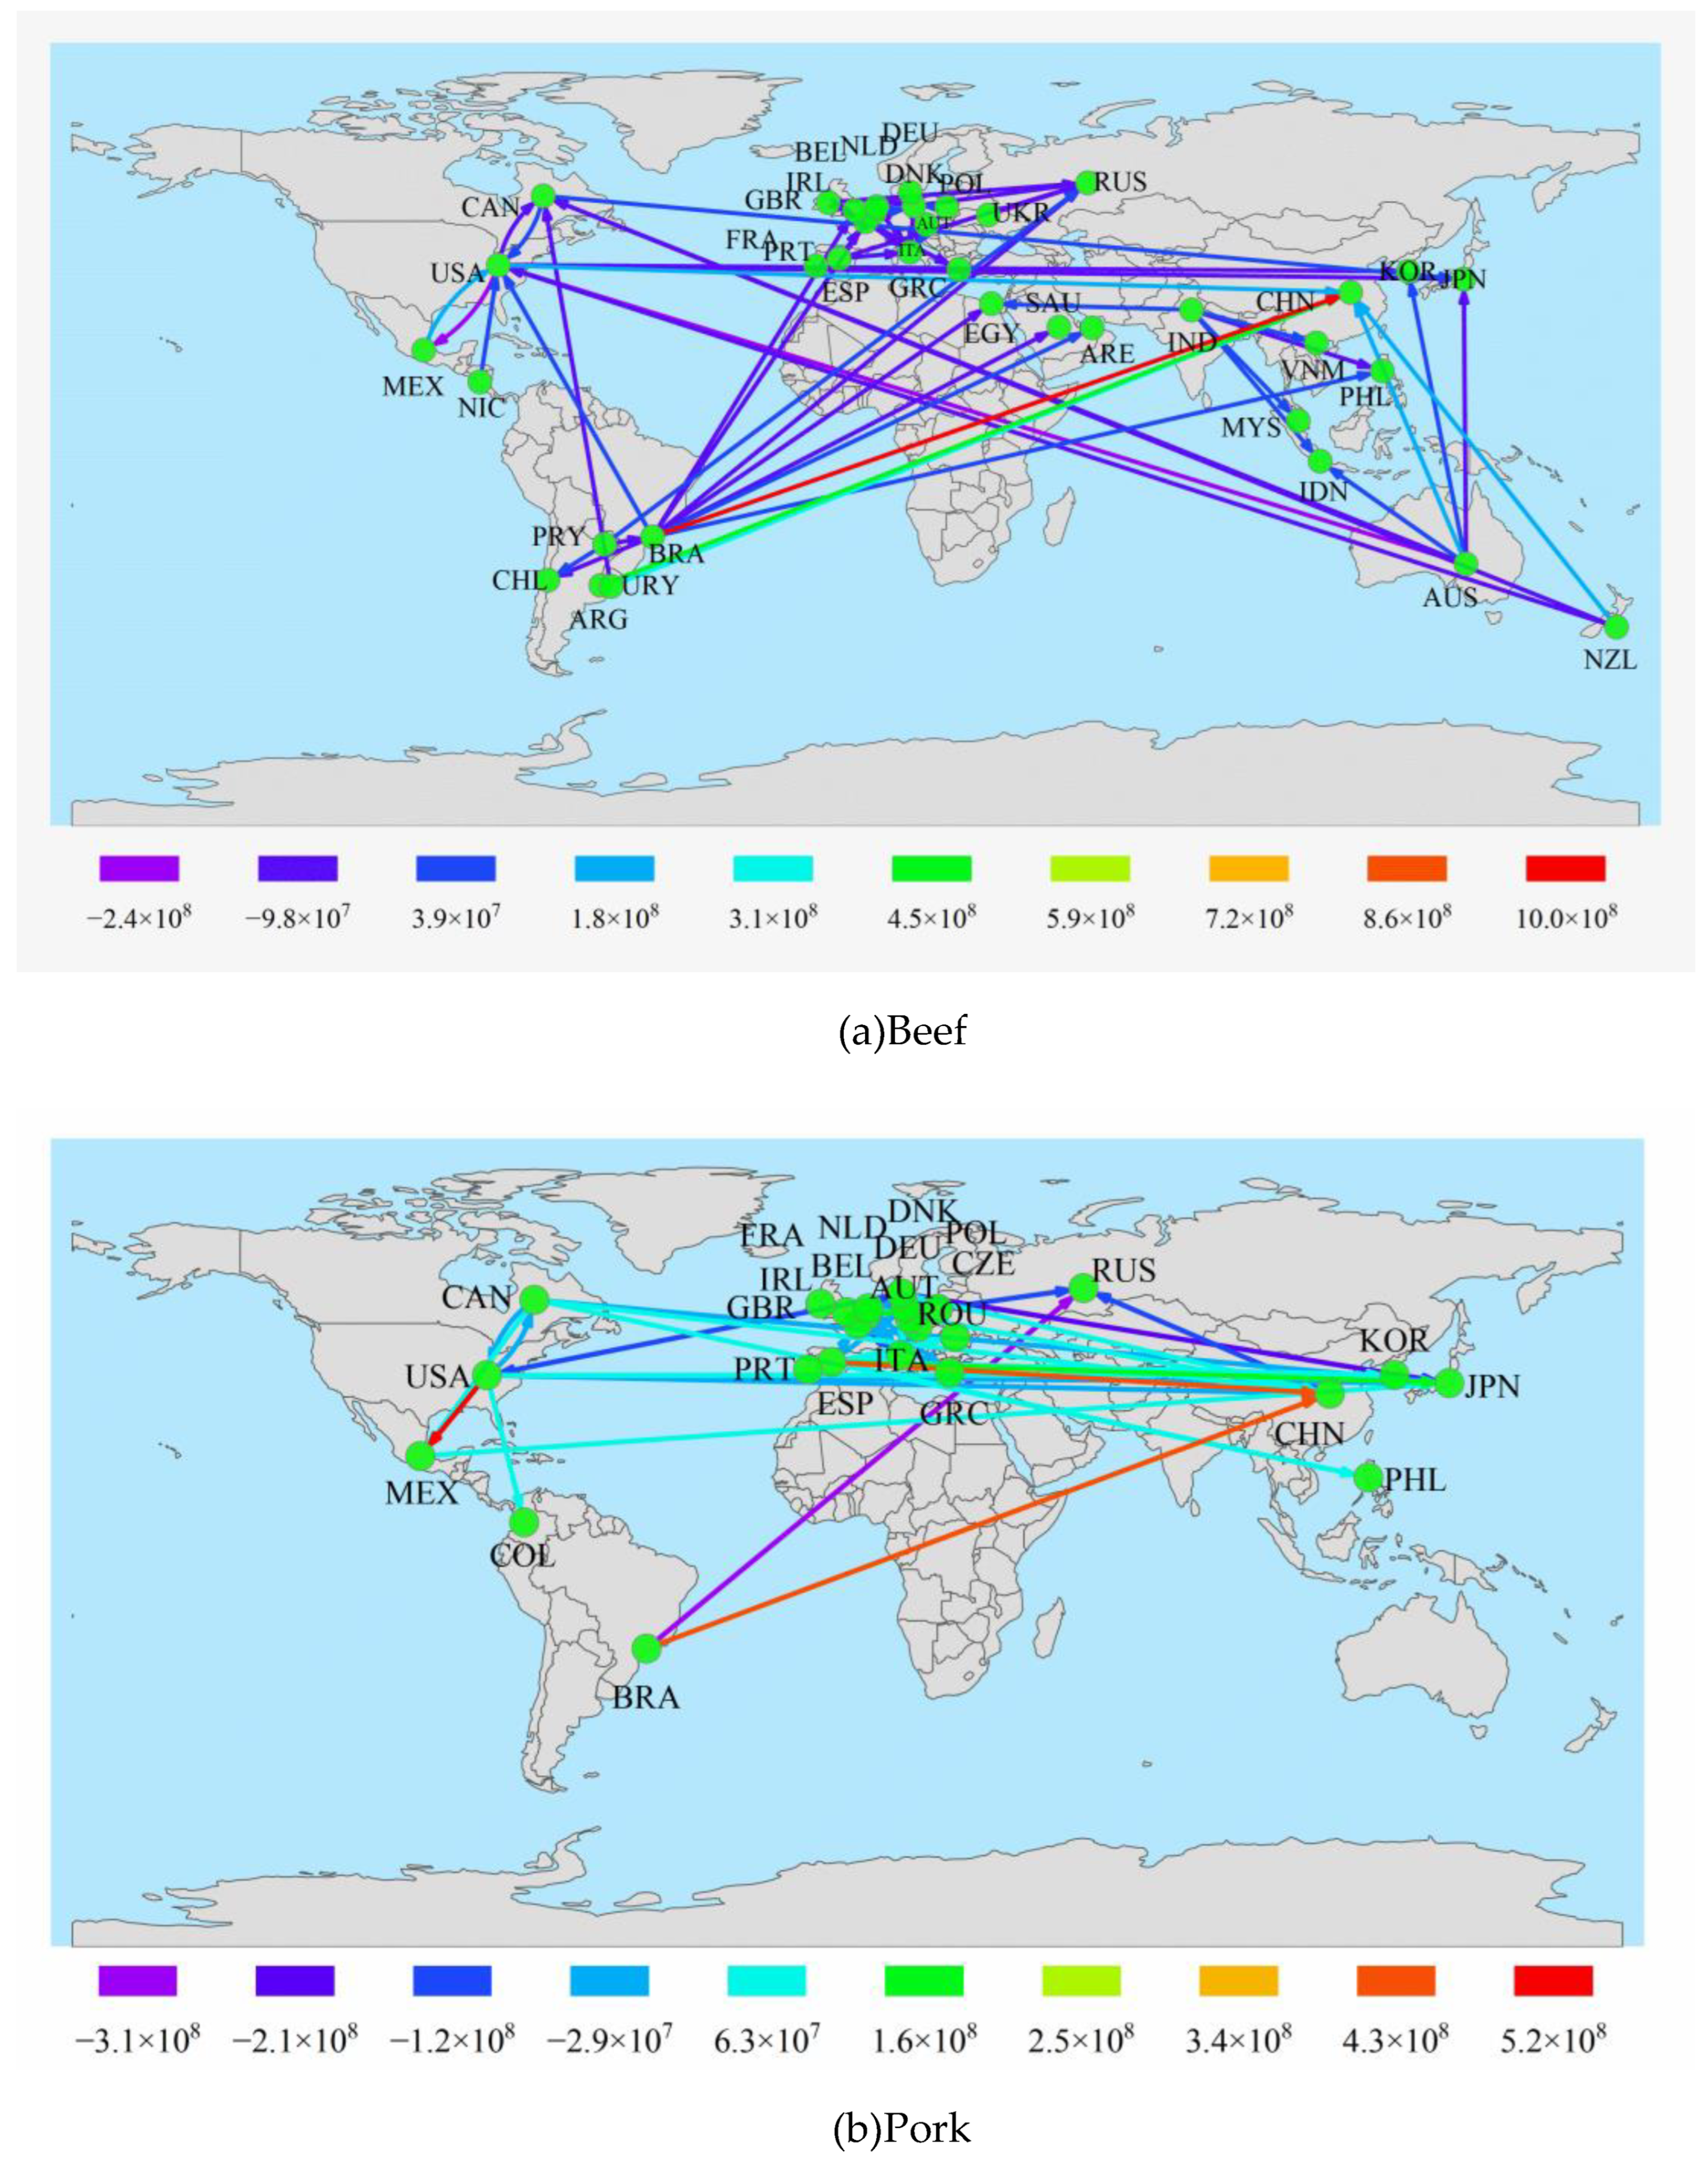
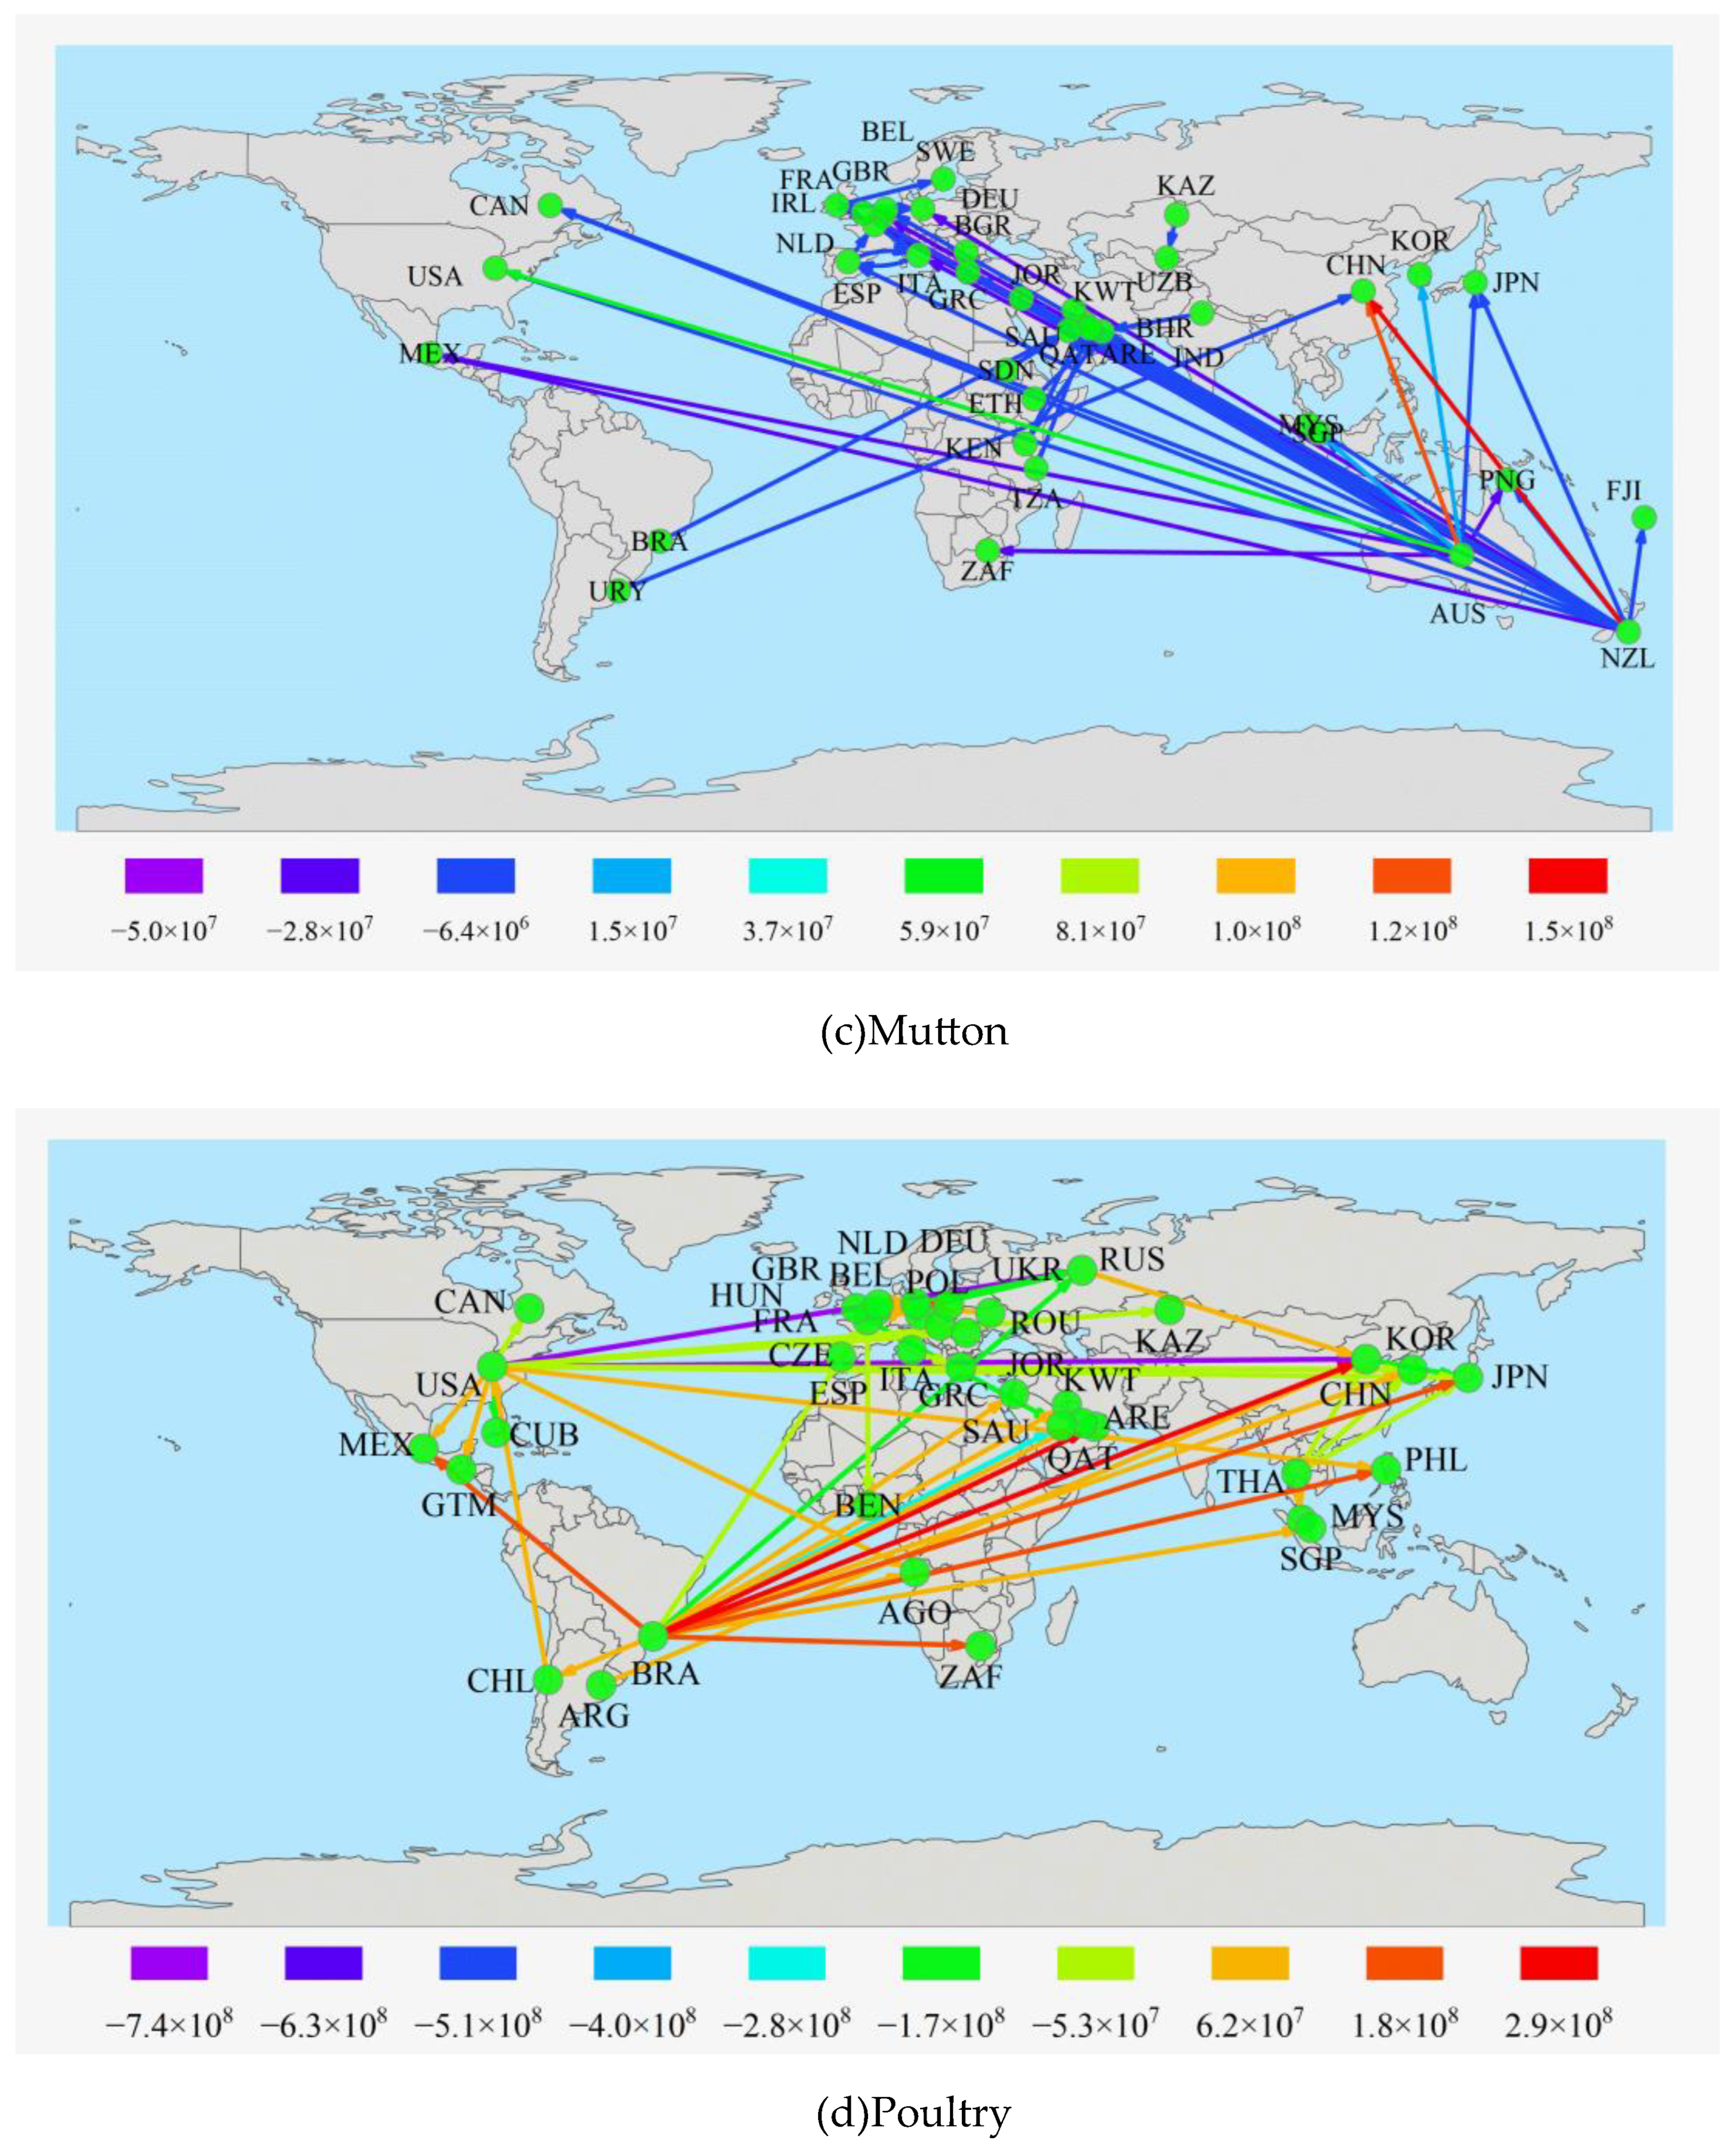
Figure 8.
Evolution of node centrality in the weighted trade network in 2003 and 2022.
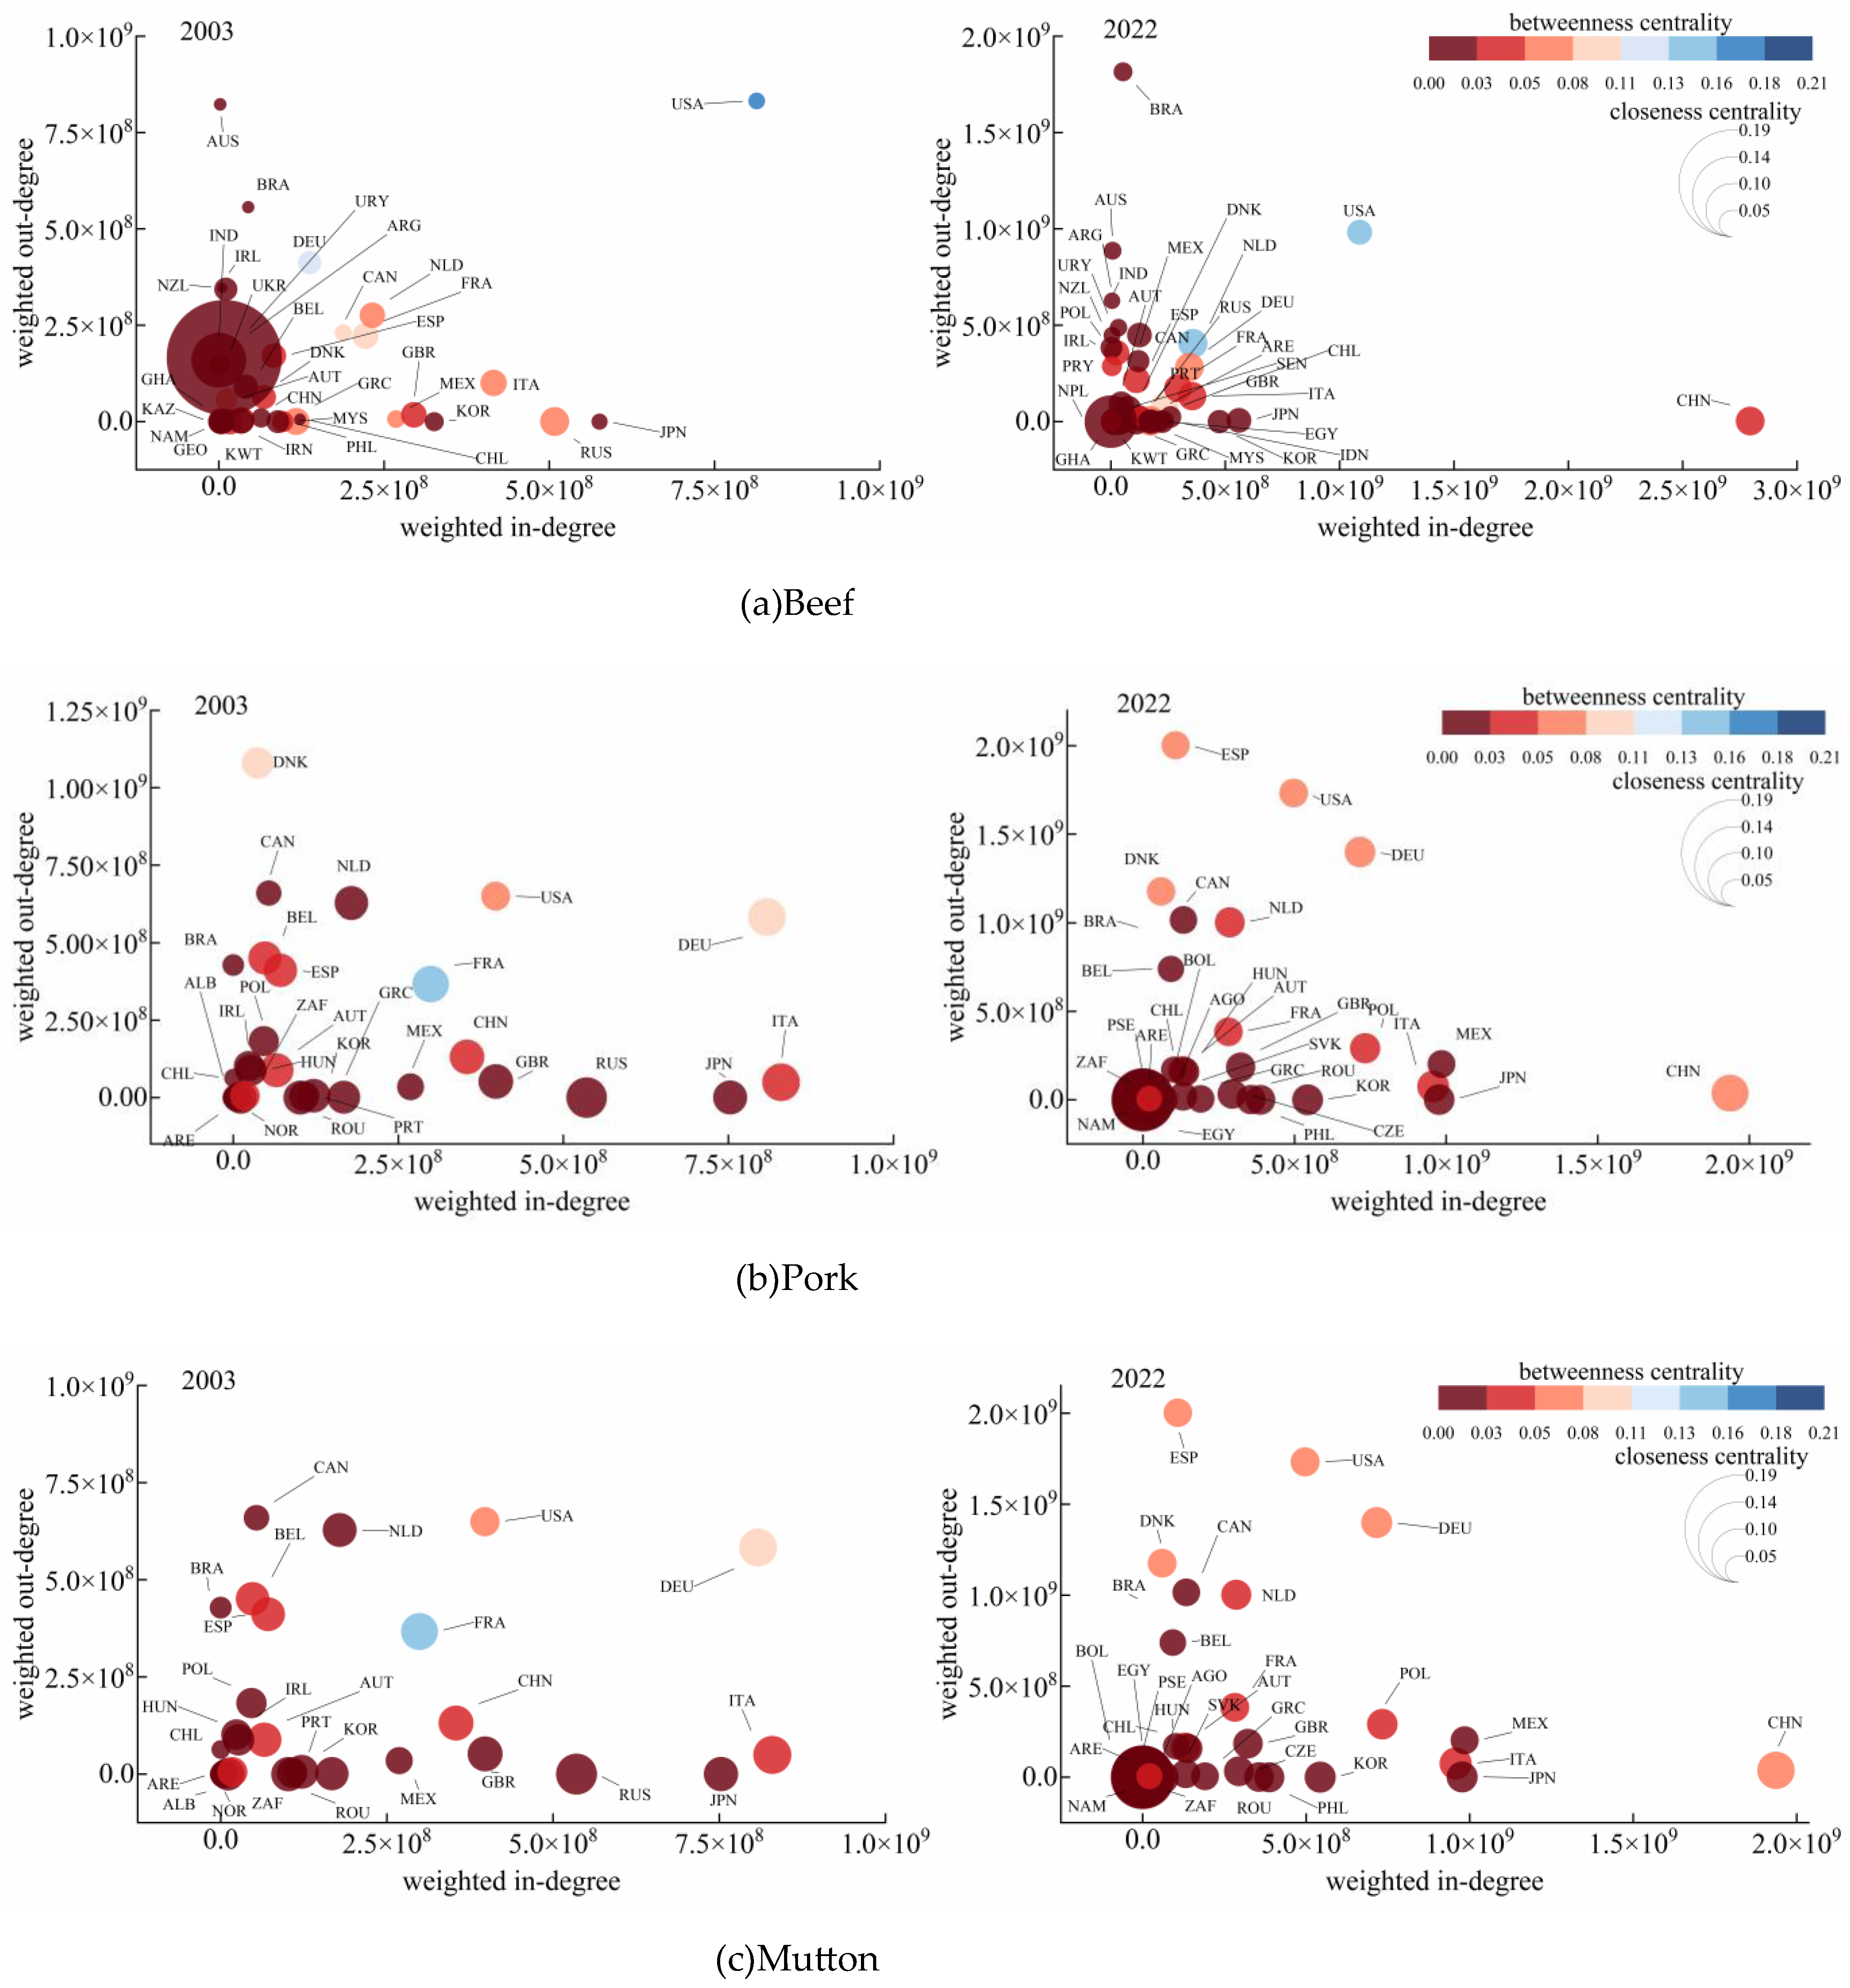
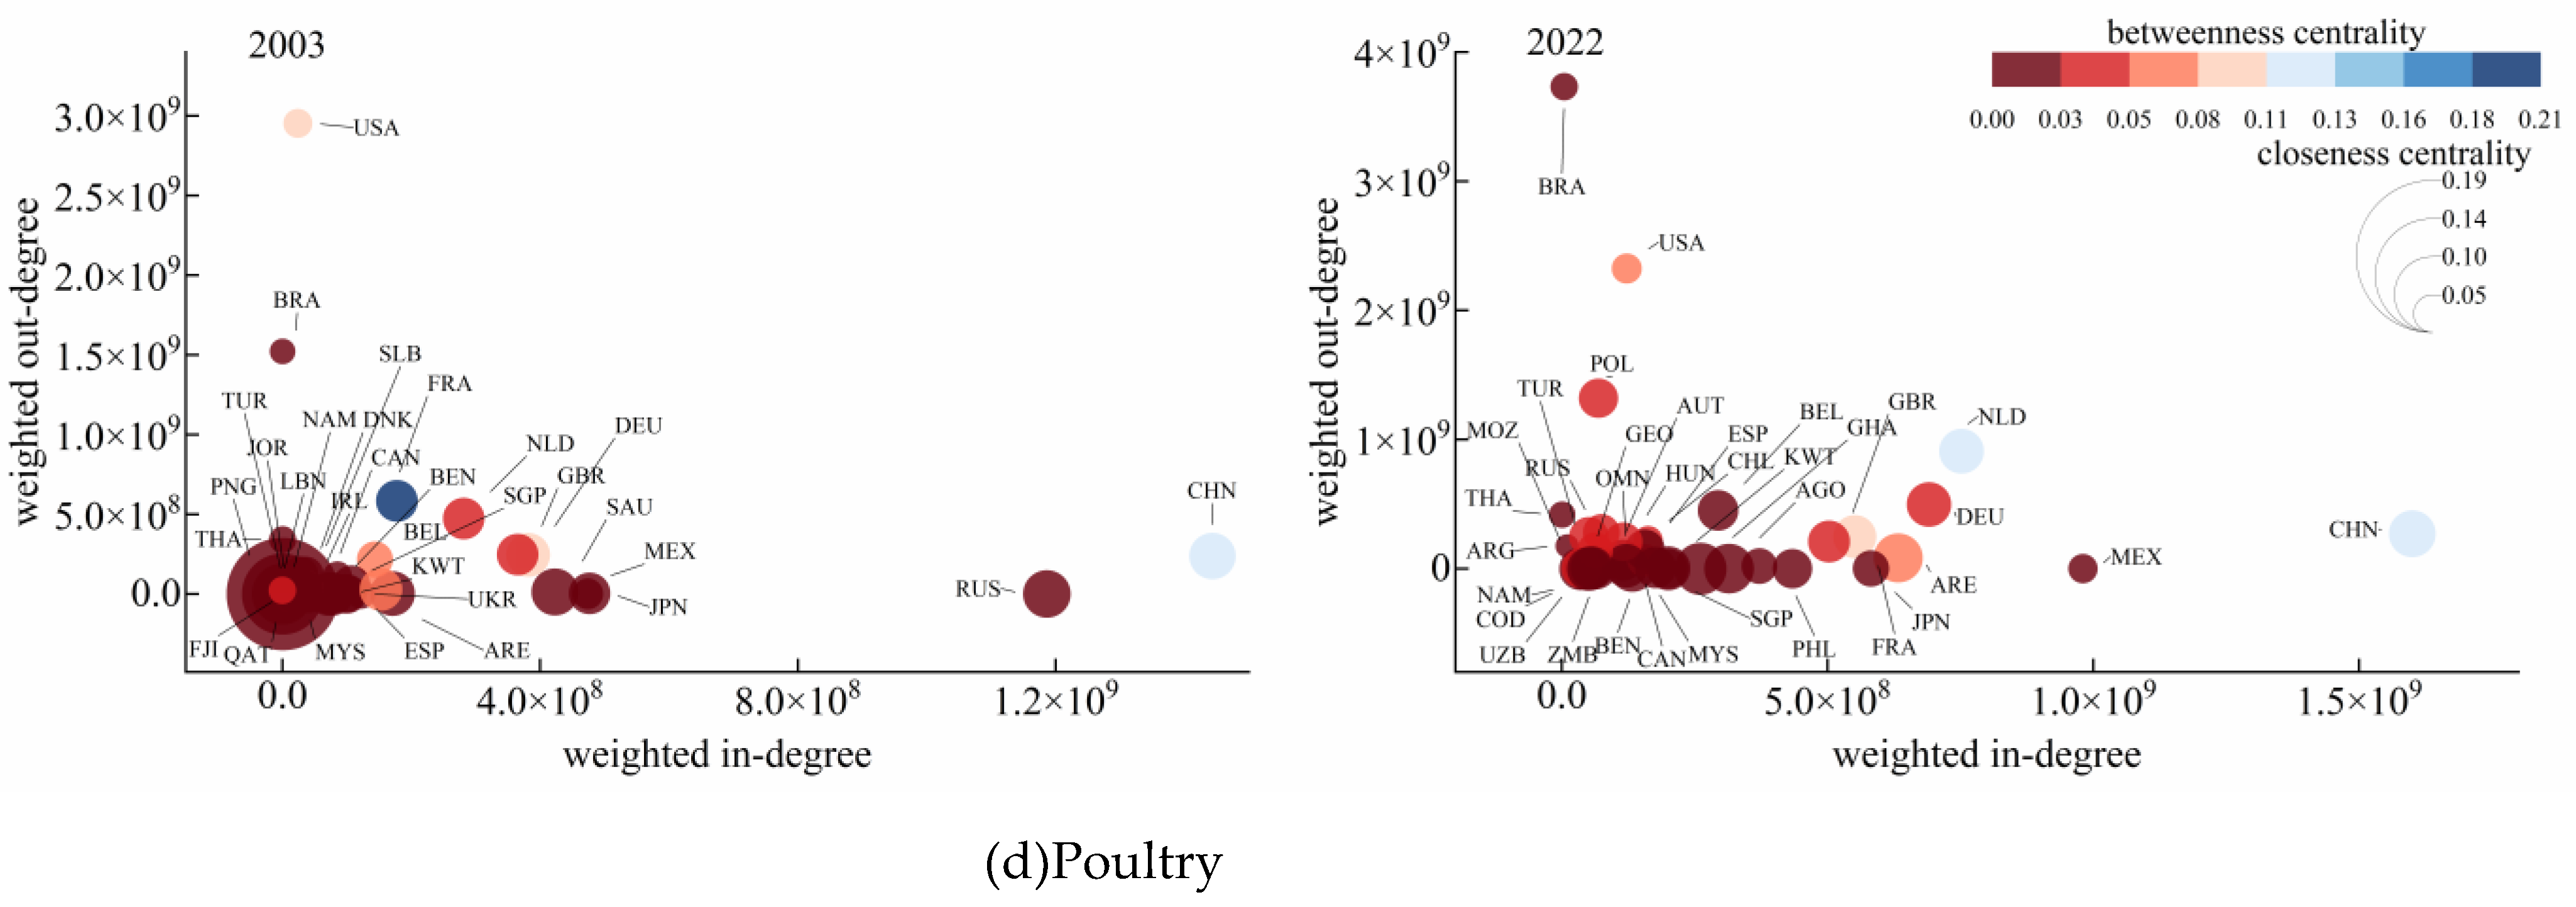
Figure 10.
Evolution of the global efficiency of the trade network.
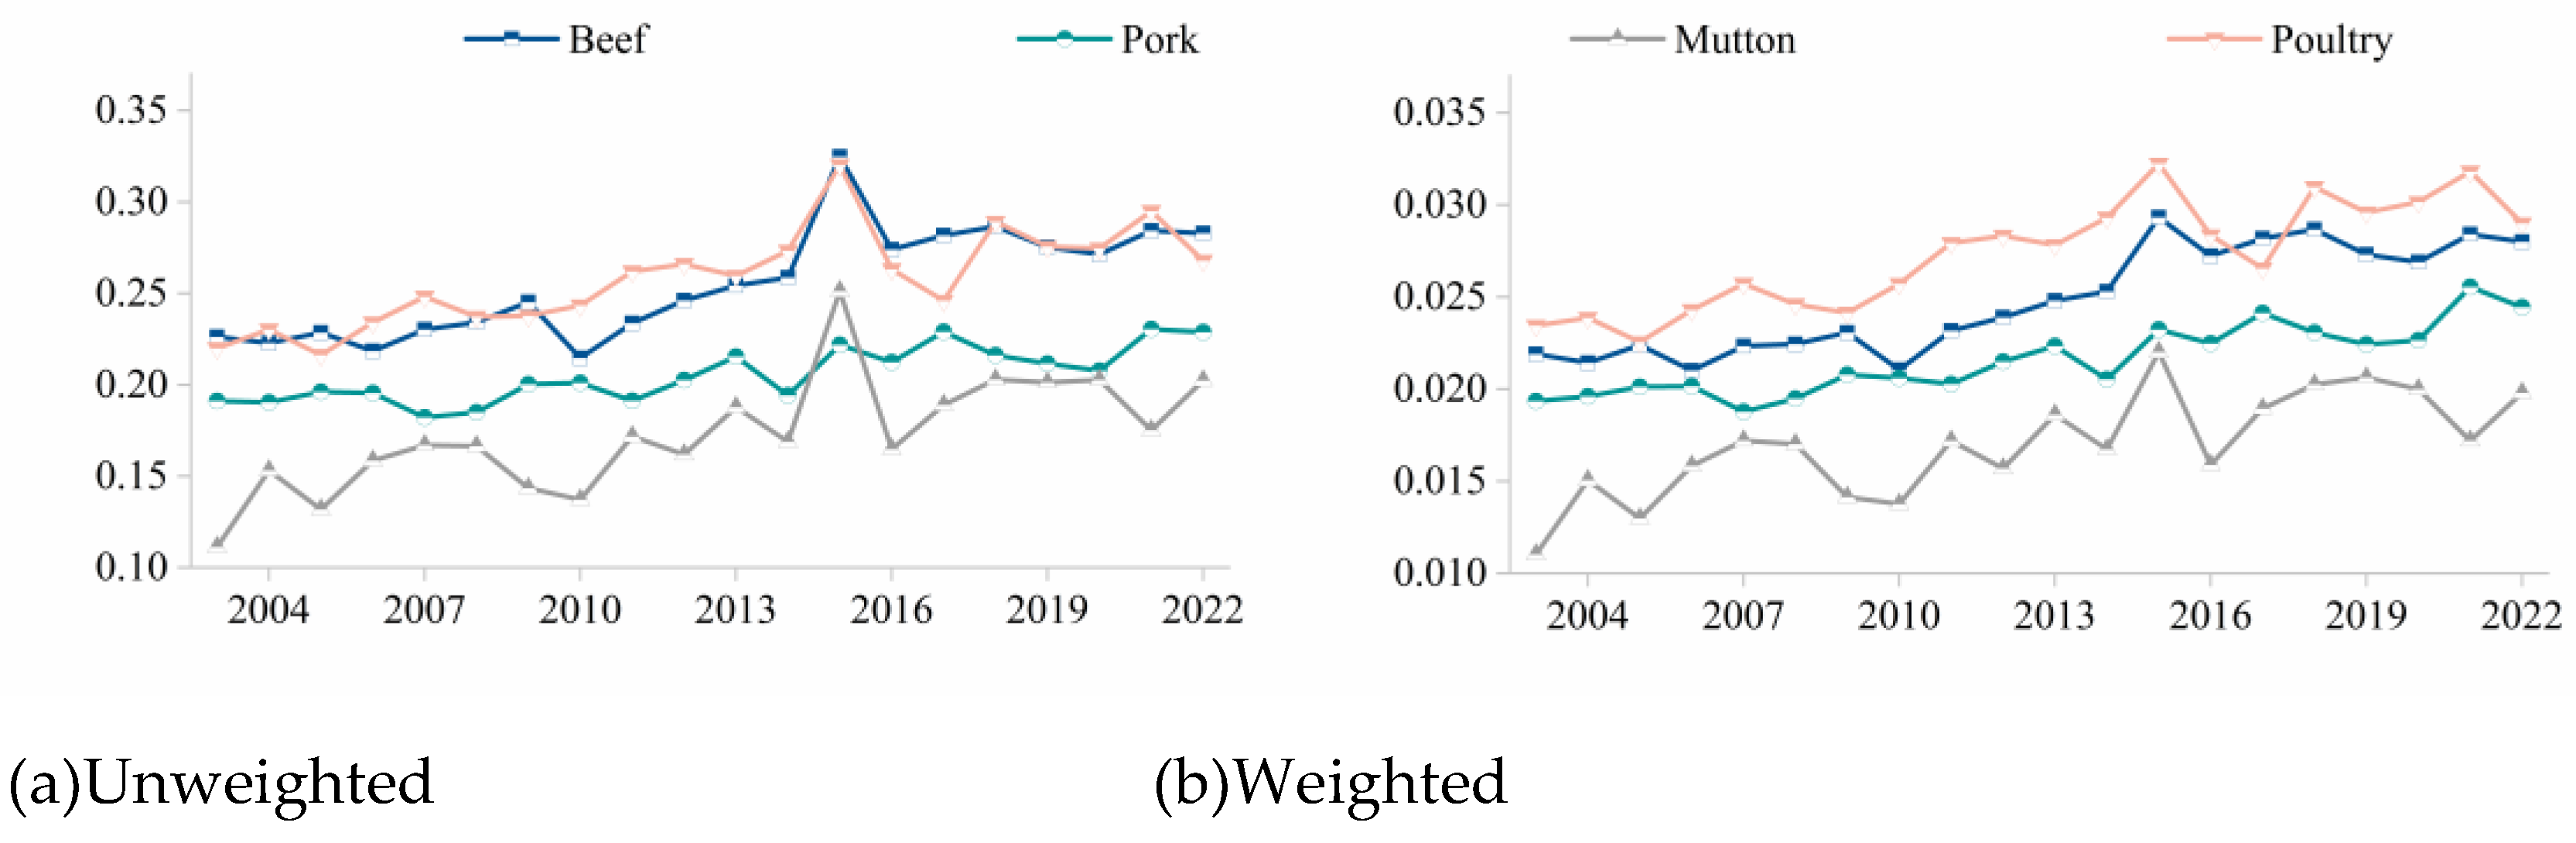
Figure 11.
Evolution of the average clustering coefficient of the trade network.
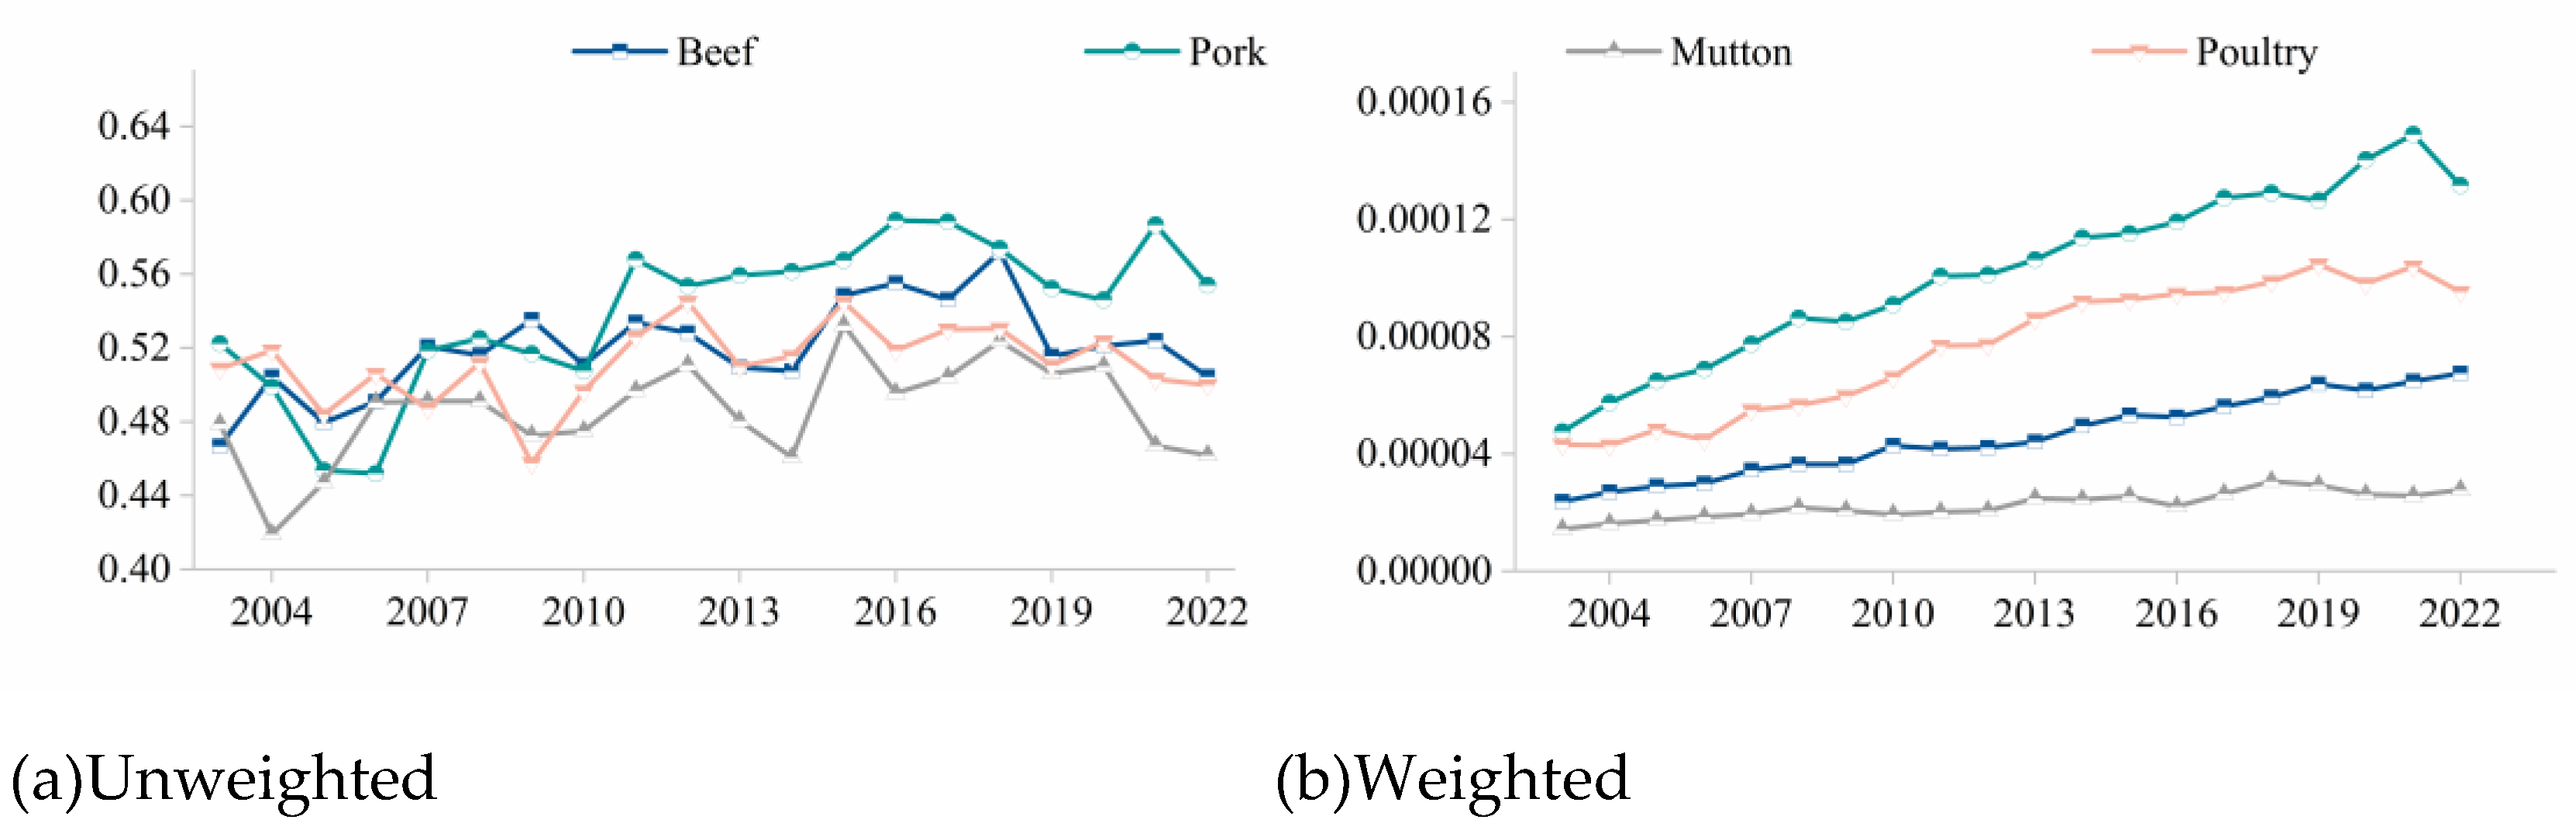
Figure 13.
Evolution of the assortativity coefficient of the trade network.
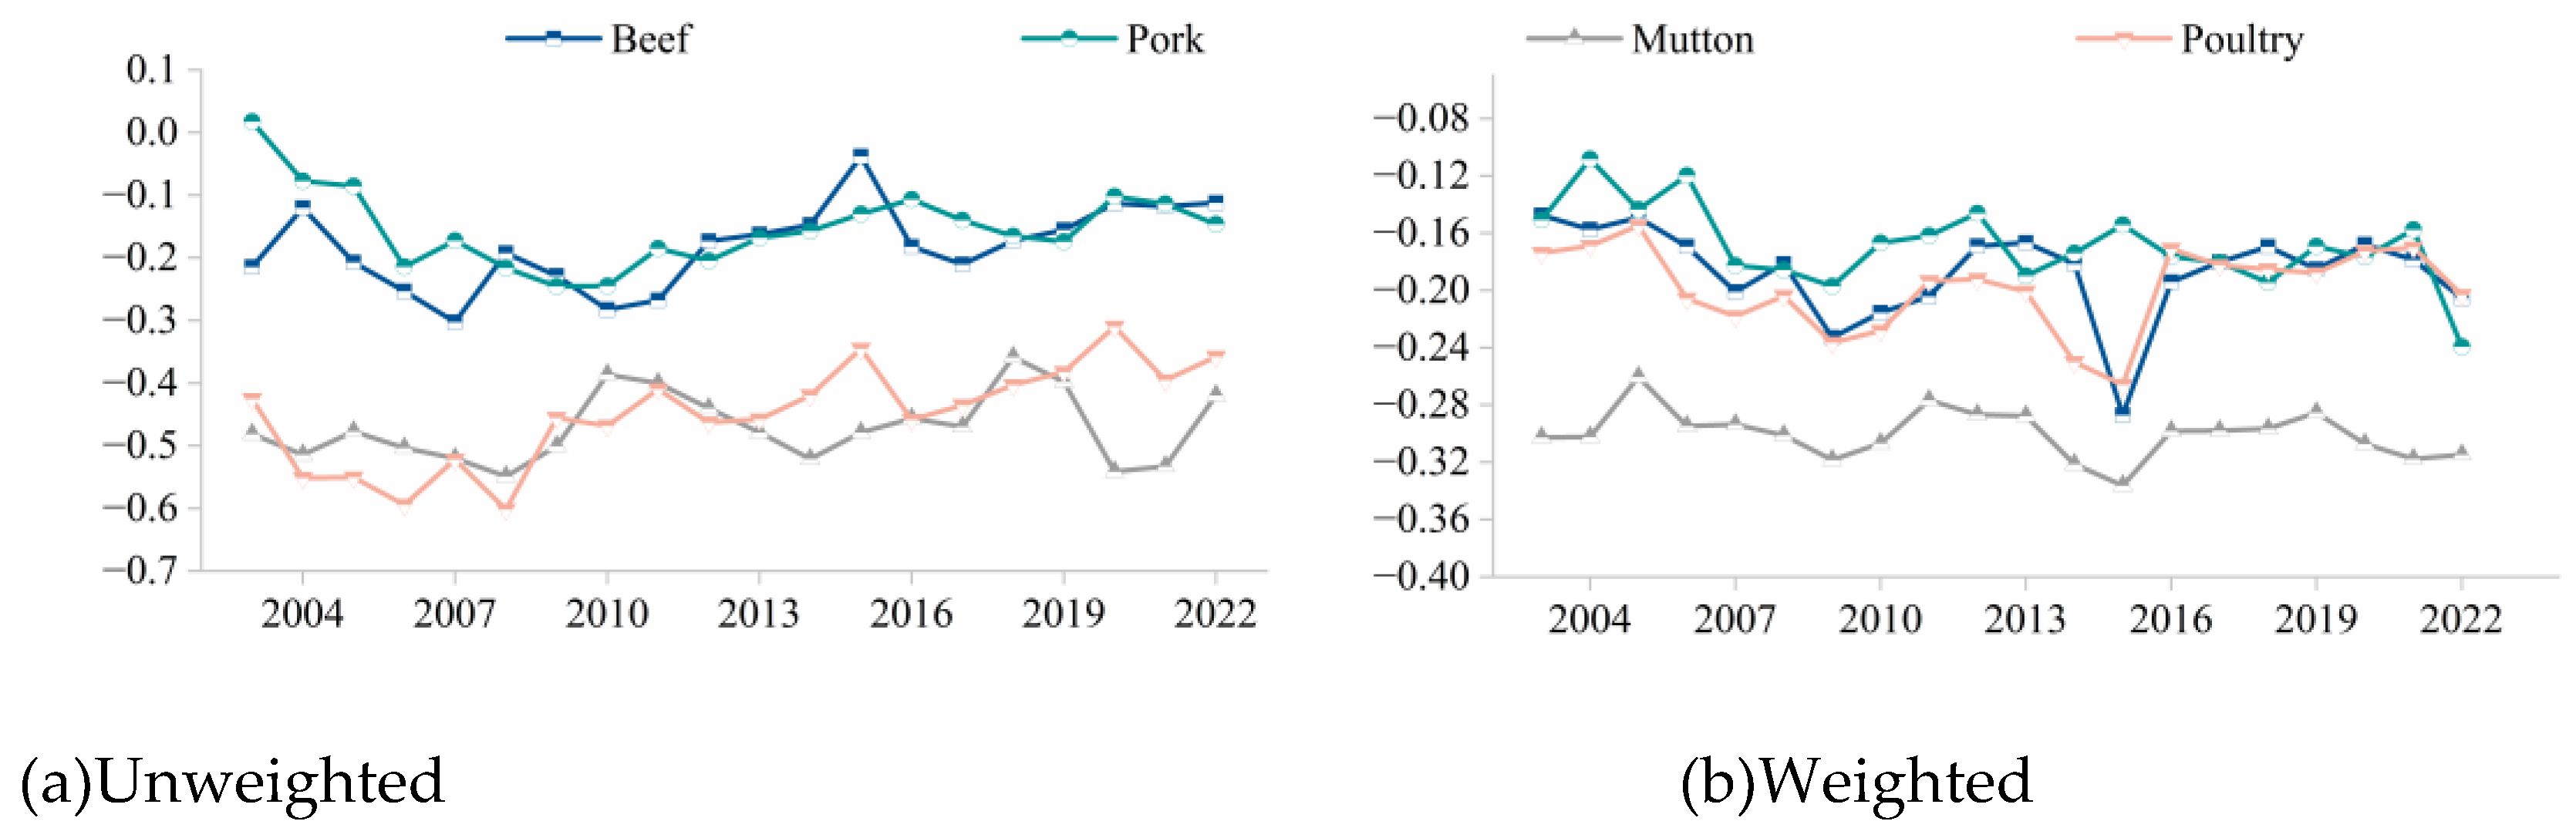
Figure 14.
Performance loss rate of the trade network based on single node disruption in 2022.
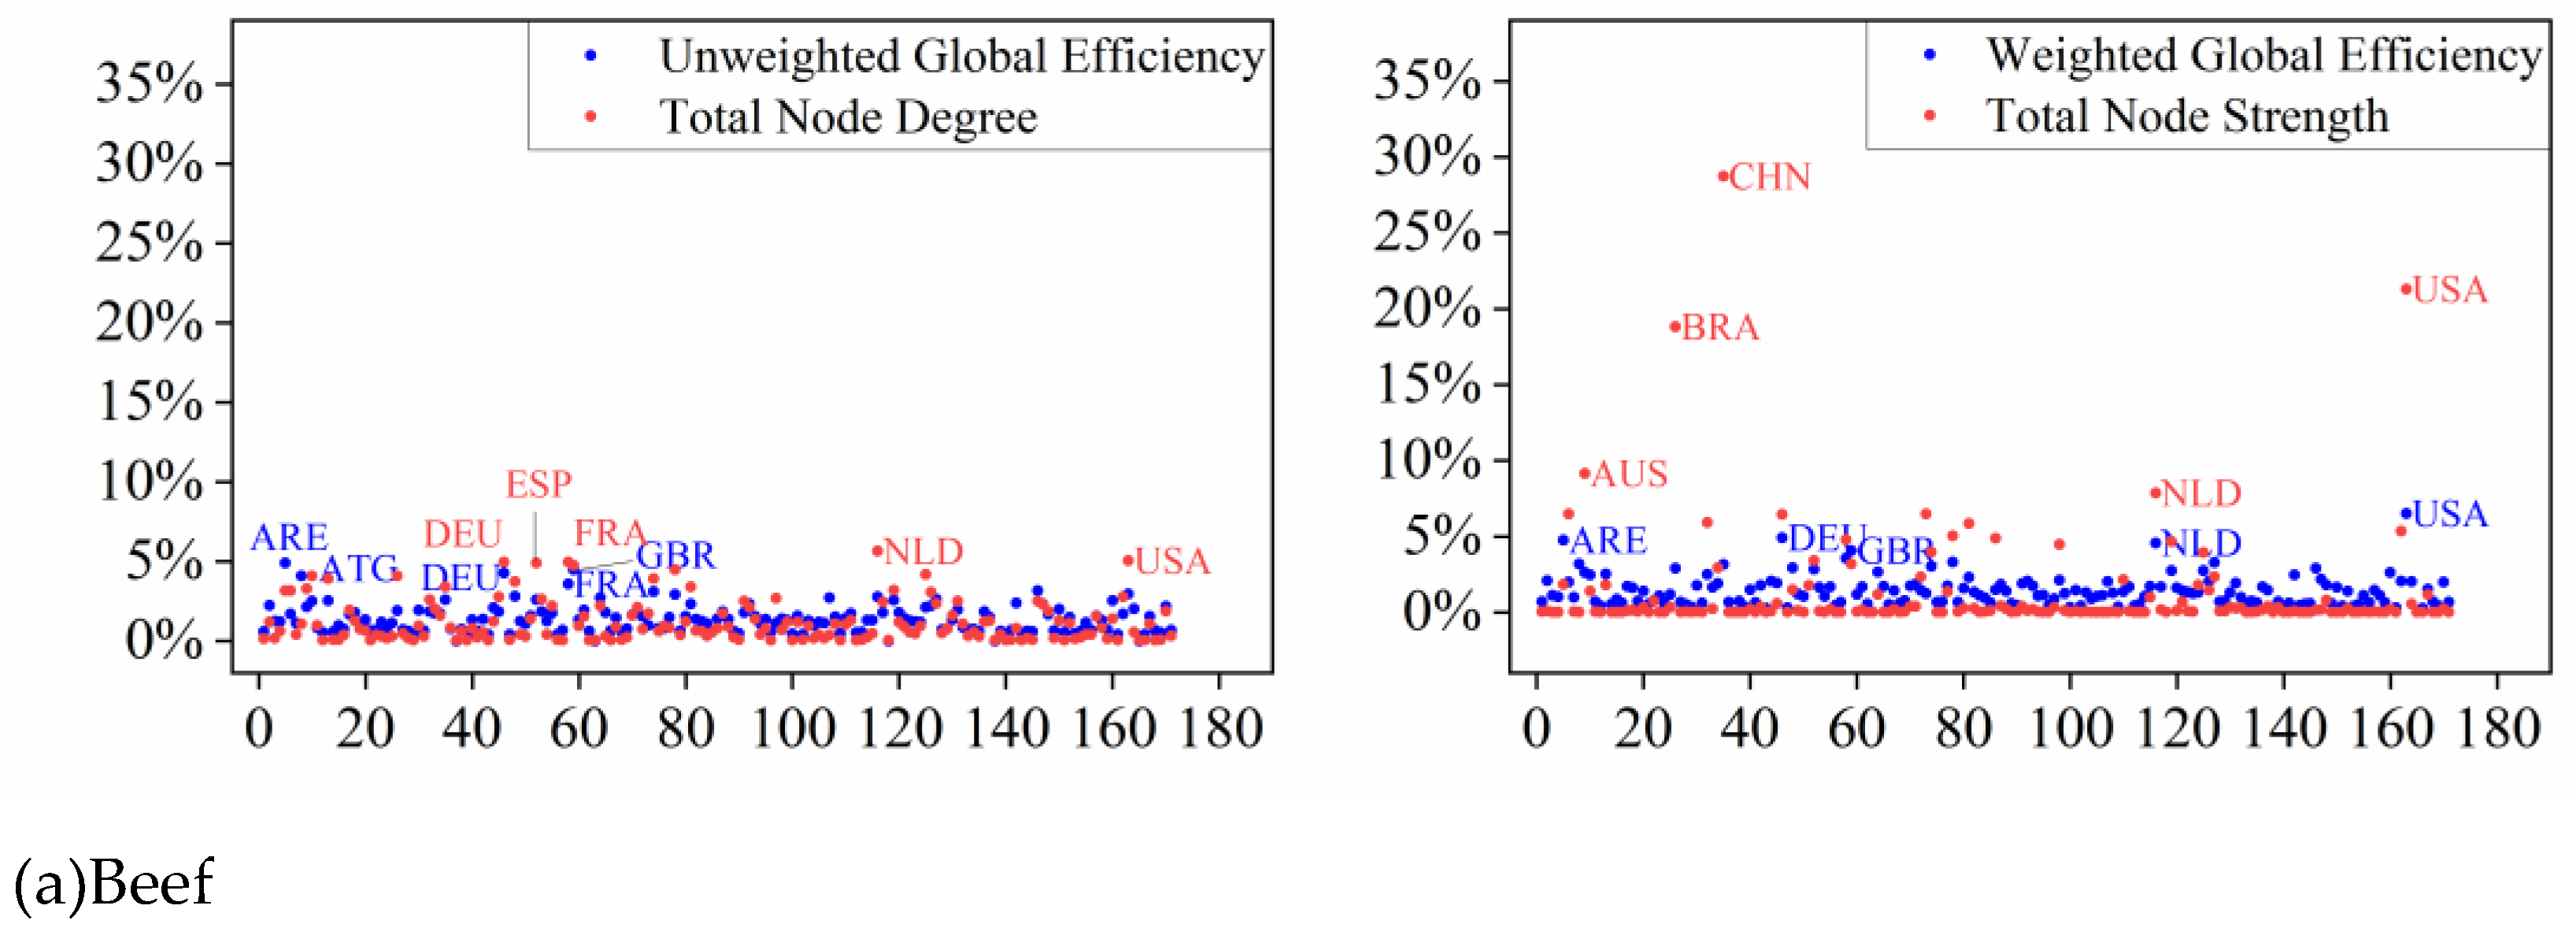
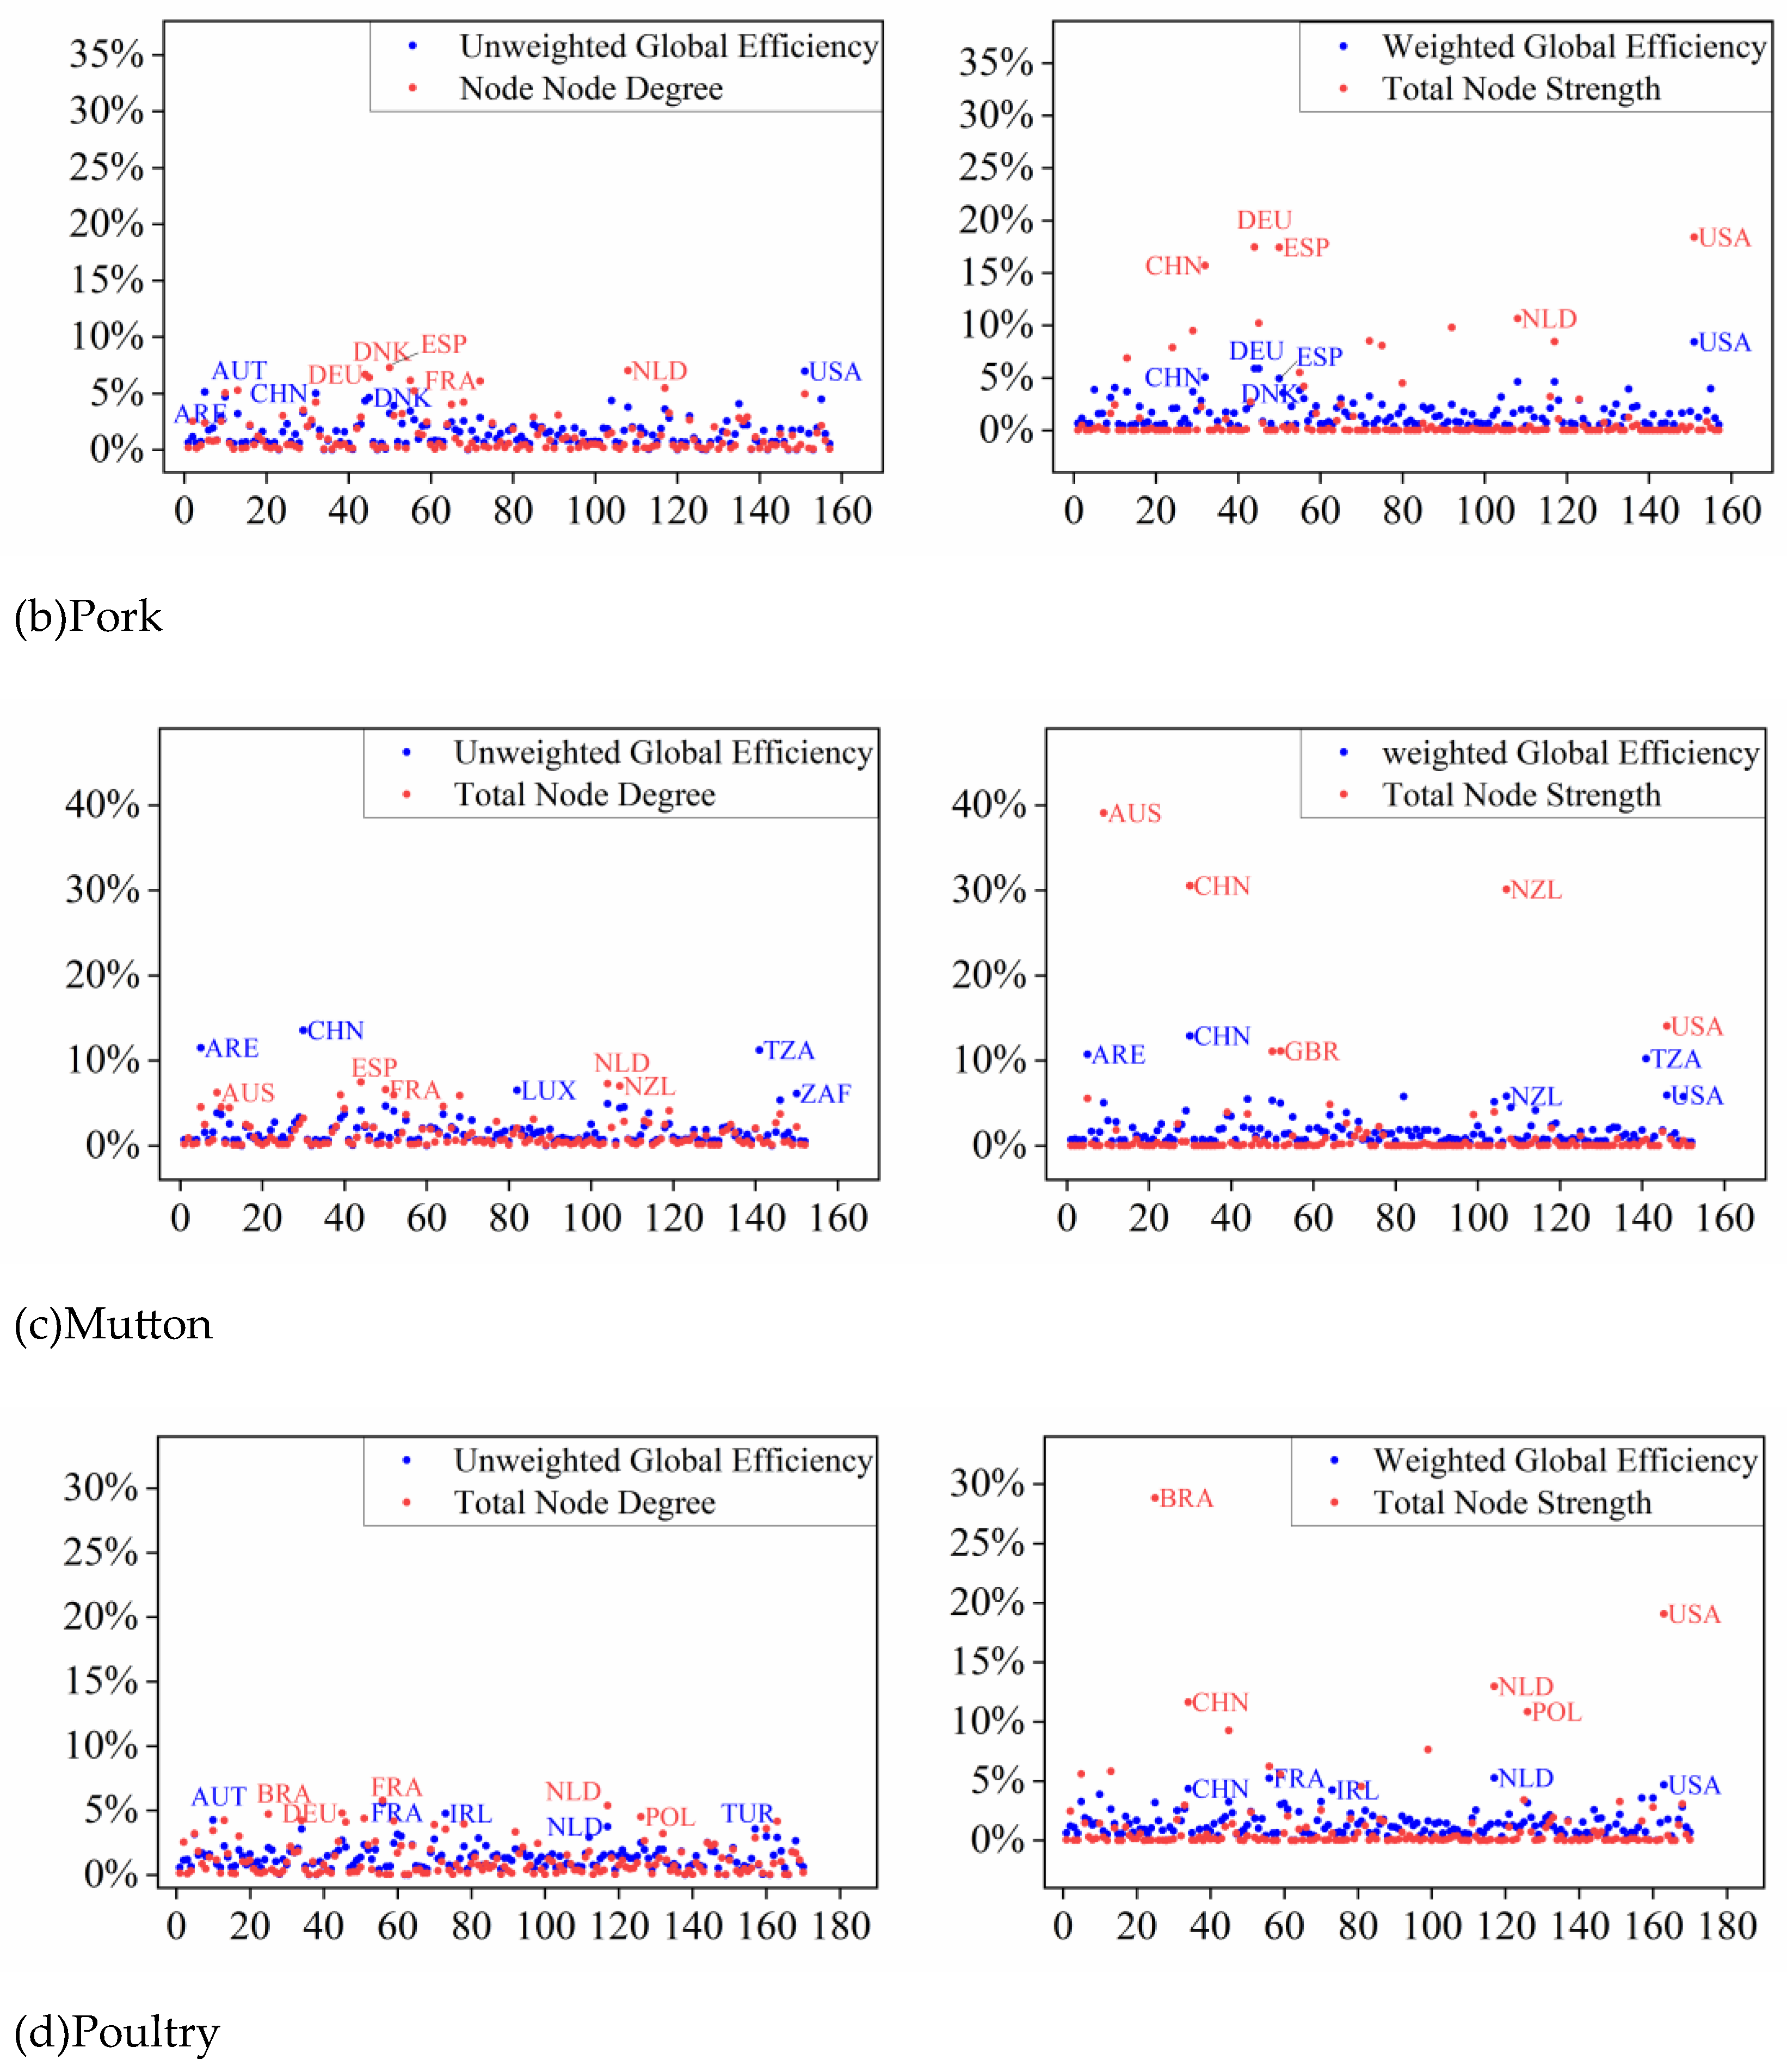
Figure 15.
Comparison of performance loss rates in trade networks due to disruptions at critical nodes in 2022.
Figure 15.
Comparison of performance loss rates in trade networks due to disruptions at critical nodes in 2022.
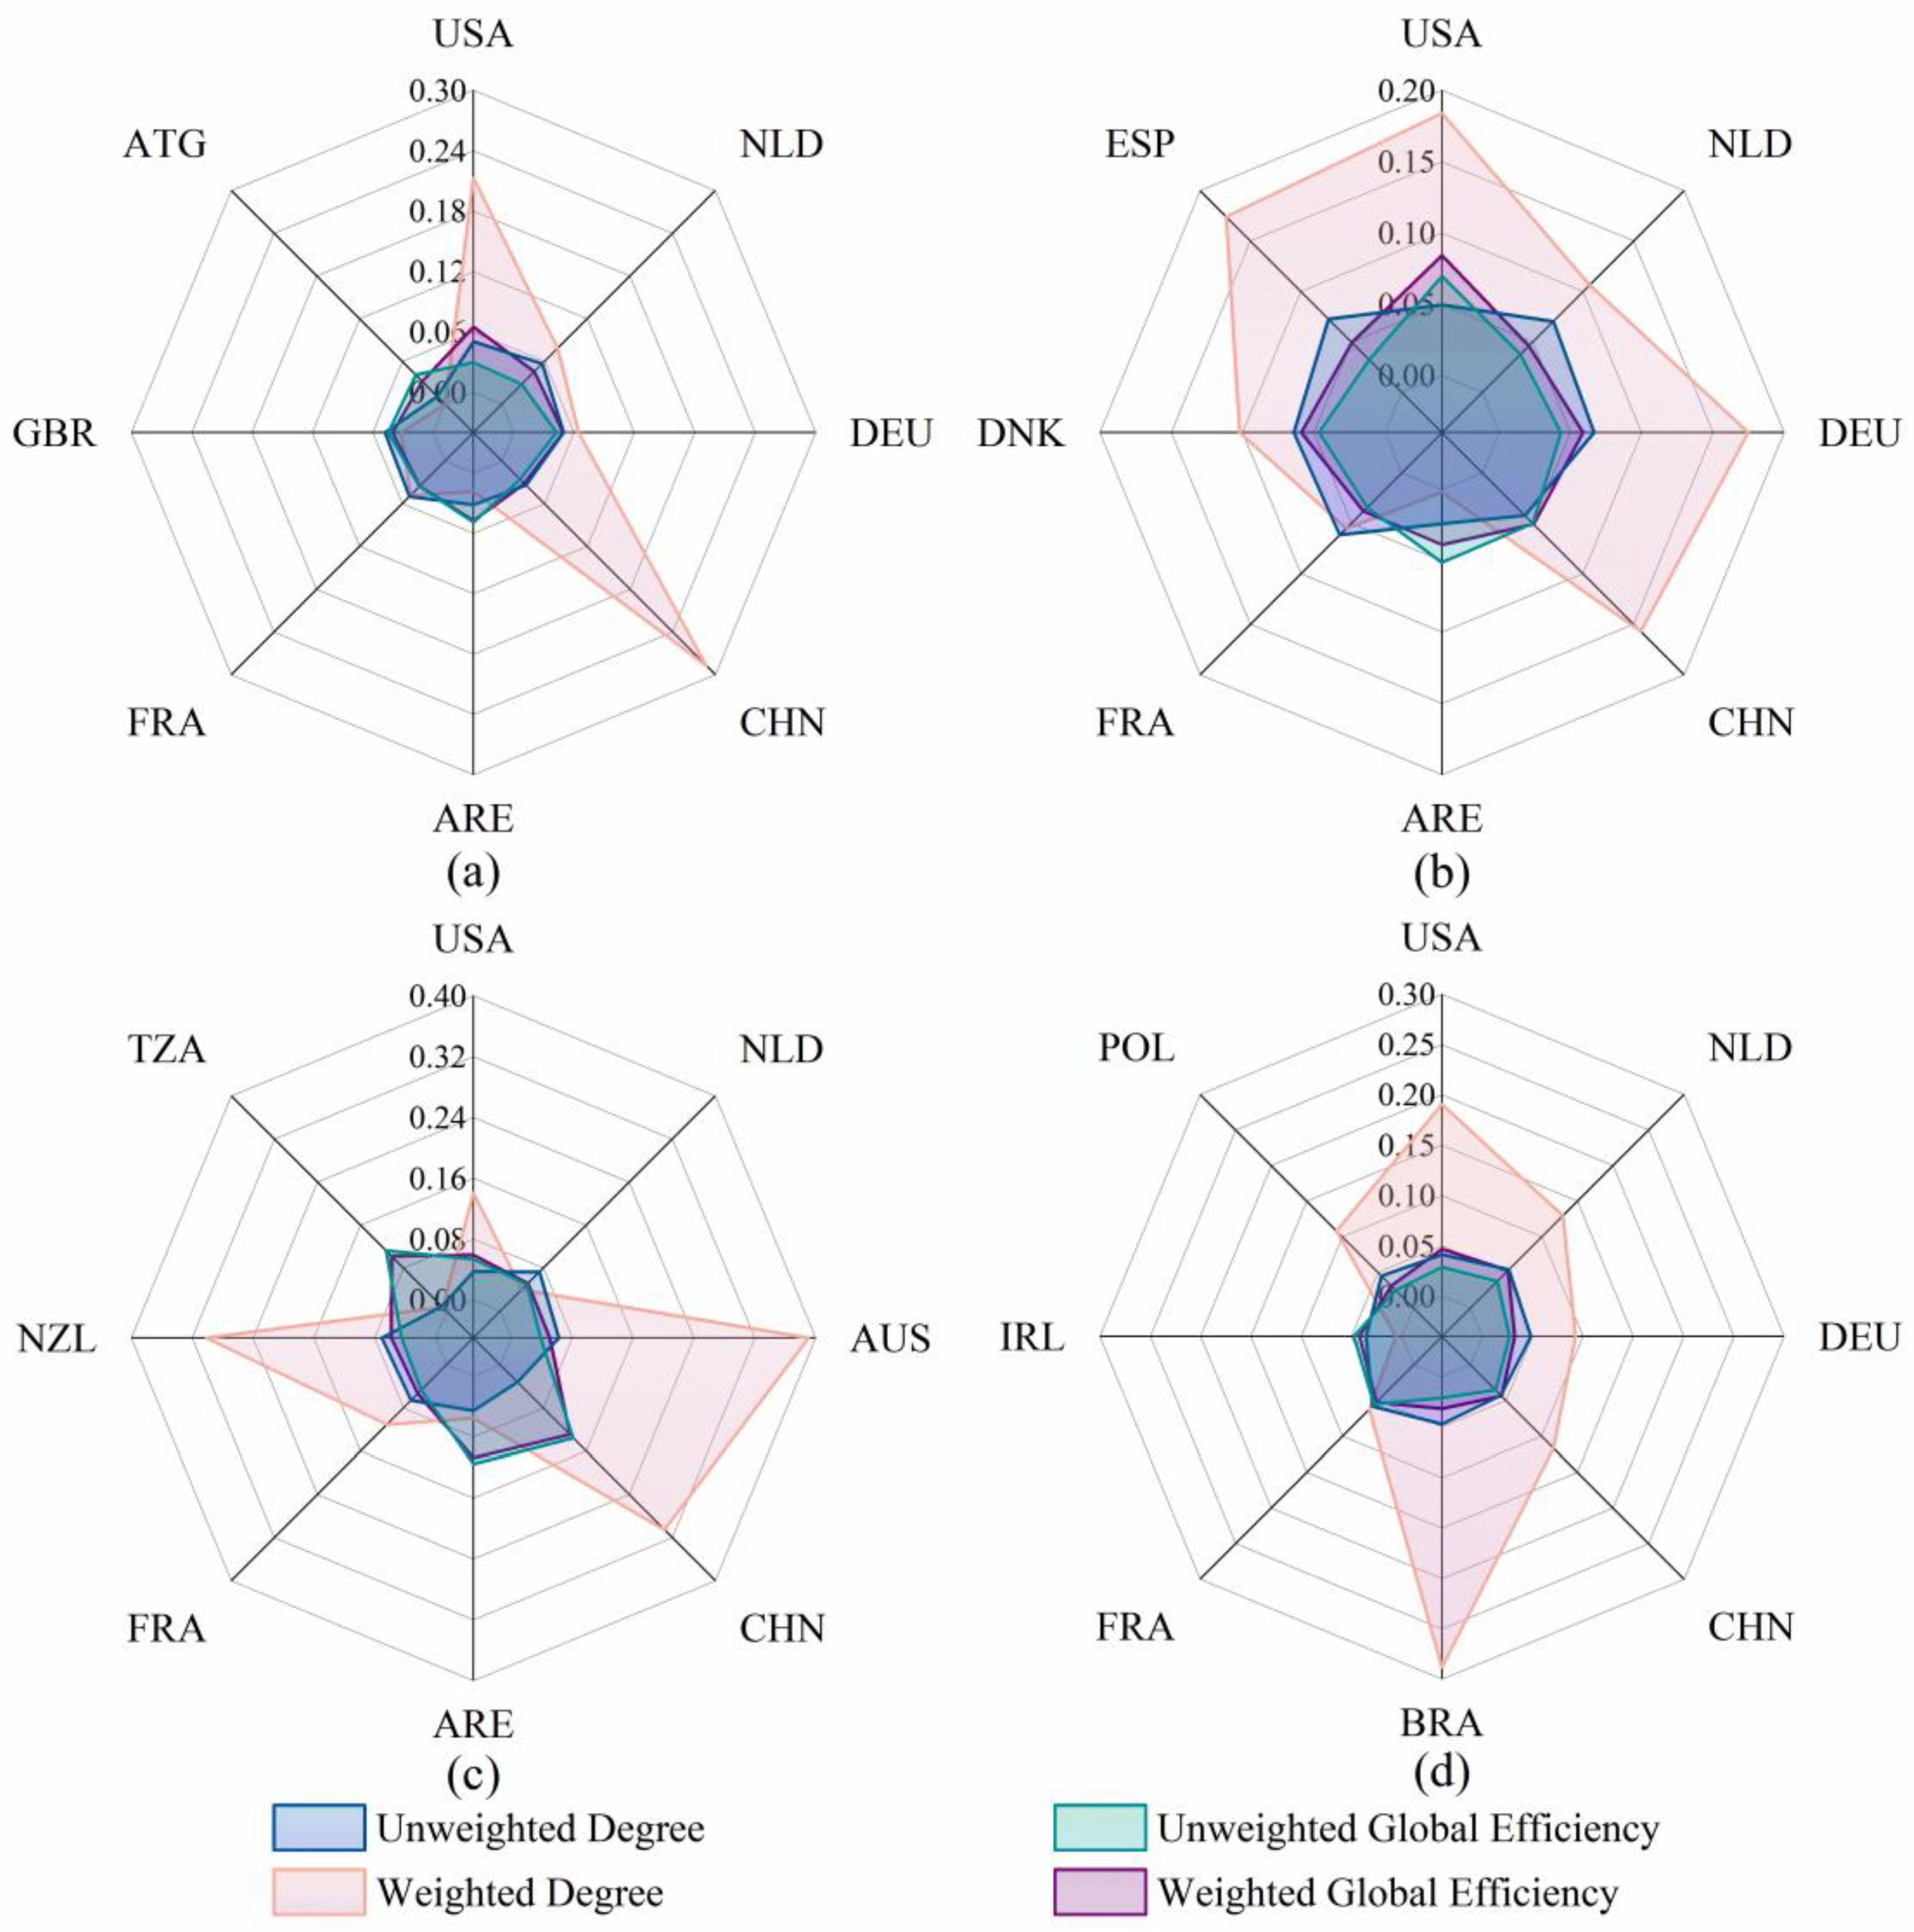
Figure 16.
Evolution of the maximum global efficiency loss rate due to a single node of interruption.
Figure 16.
Evolution of the maximum global efficiency loss rate due to a single node of interruption.
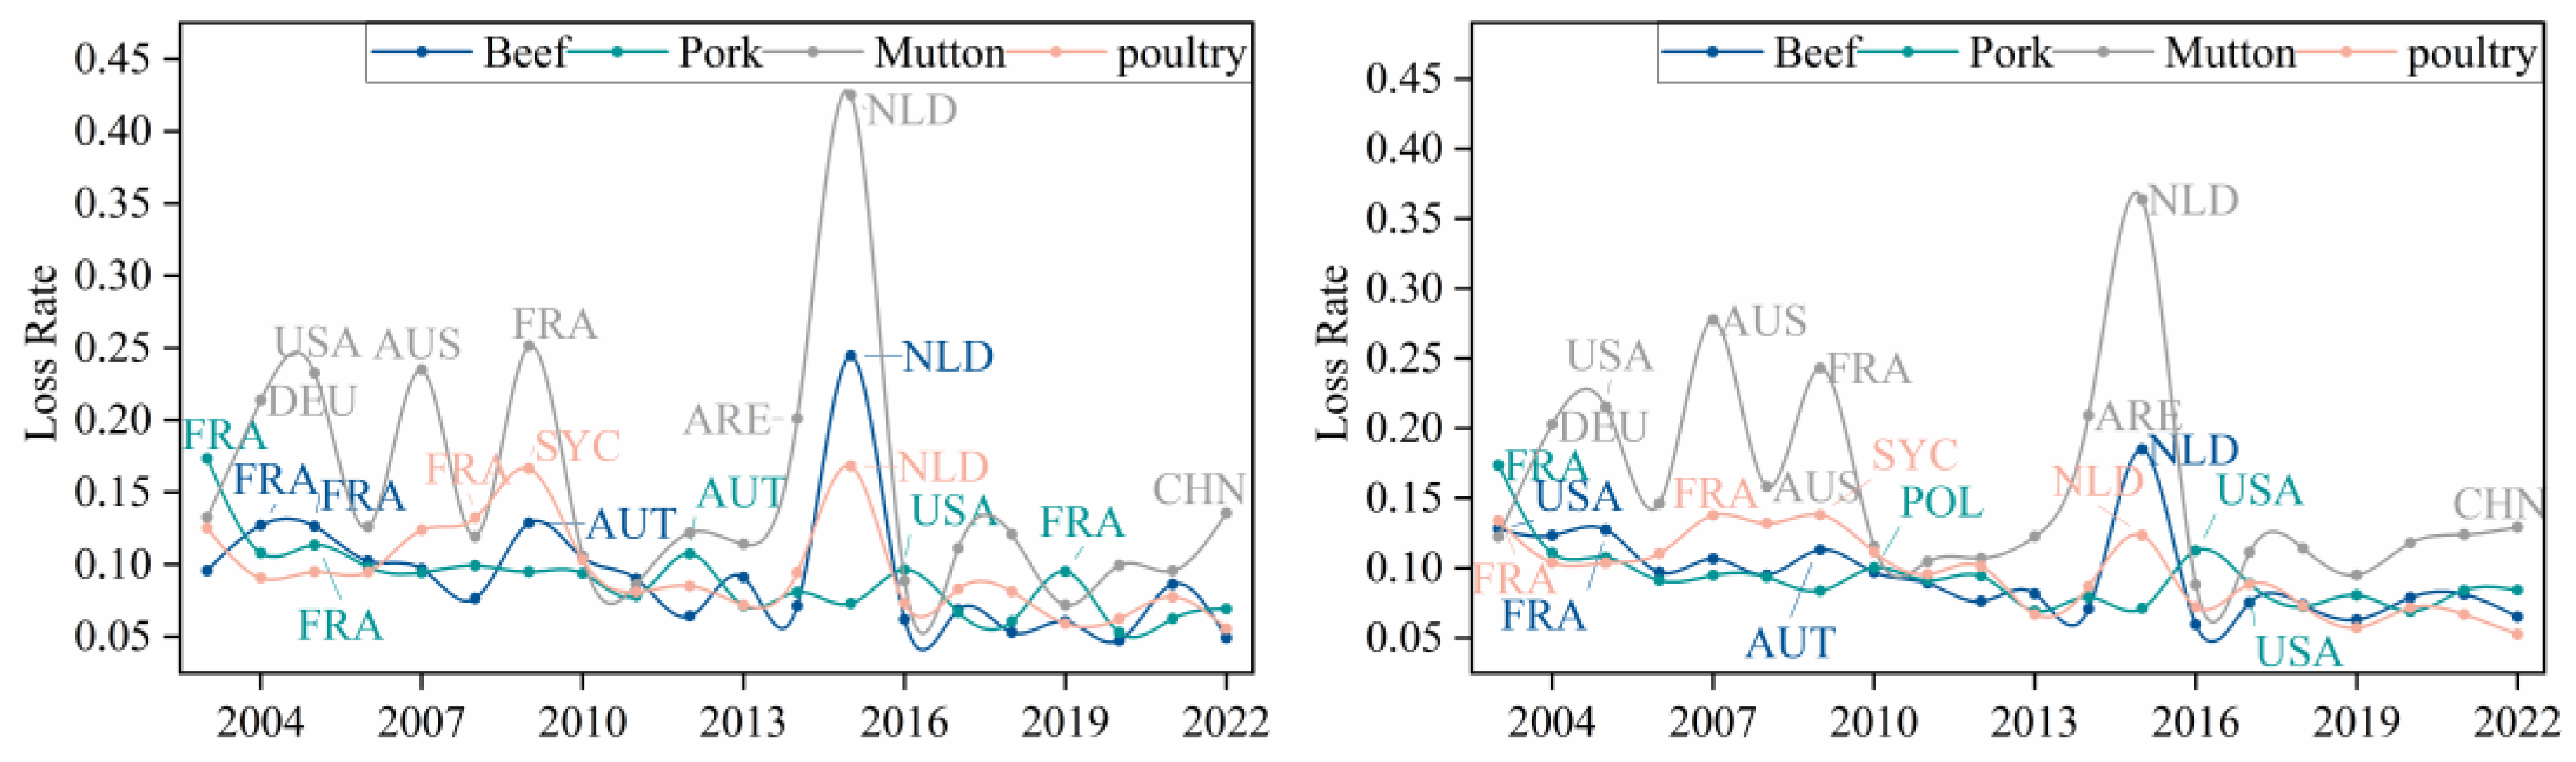
Figure 17.
Evolution of the maximum loss rates of node strength due to a single node of interruption.
Figure 17.
Evolution of the maximum loss rates of node strength due to a single node of interruption.
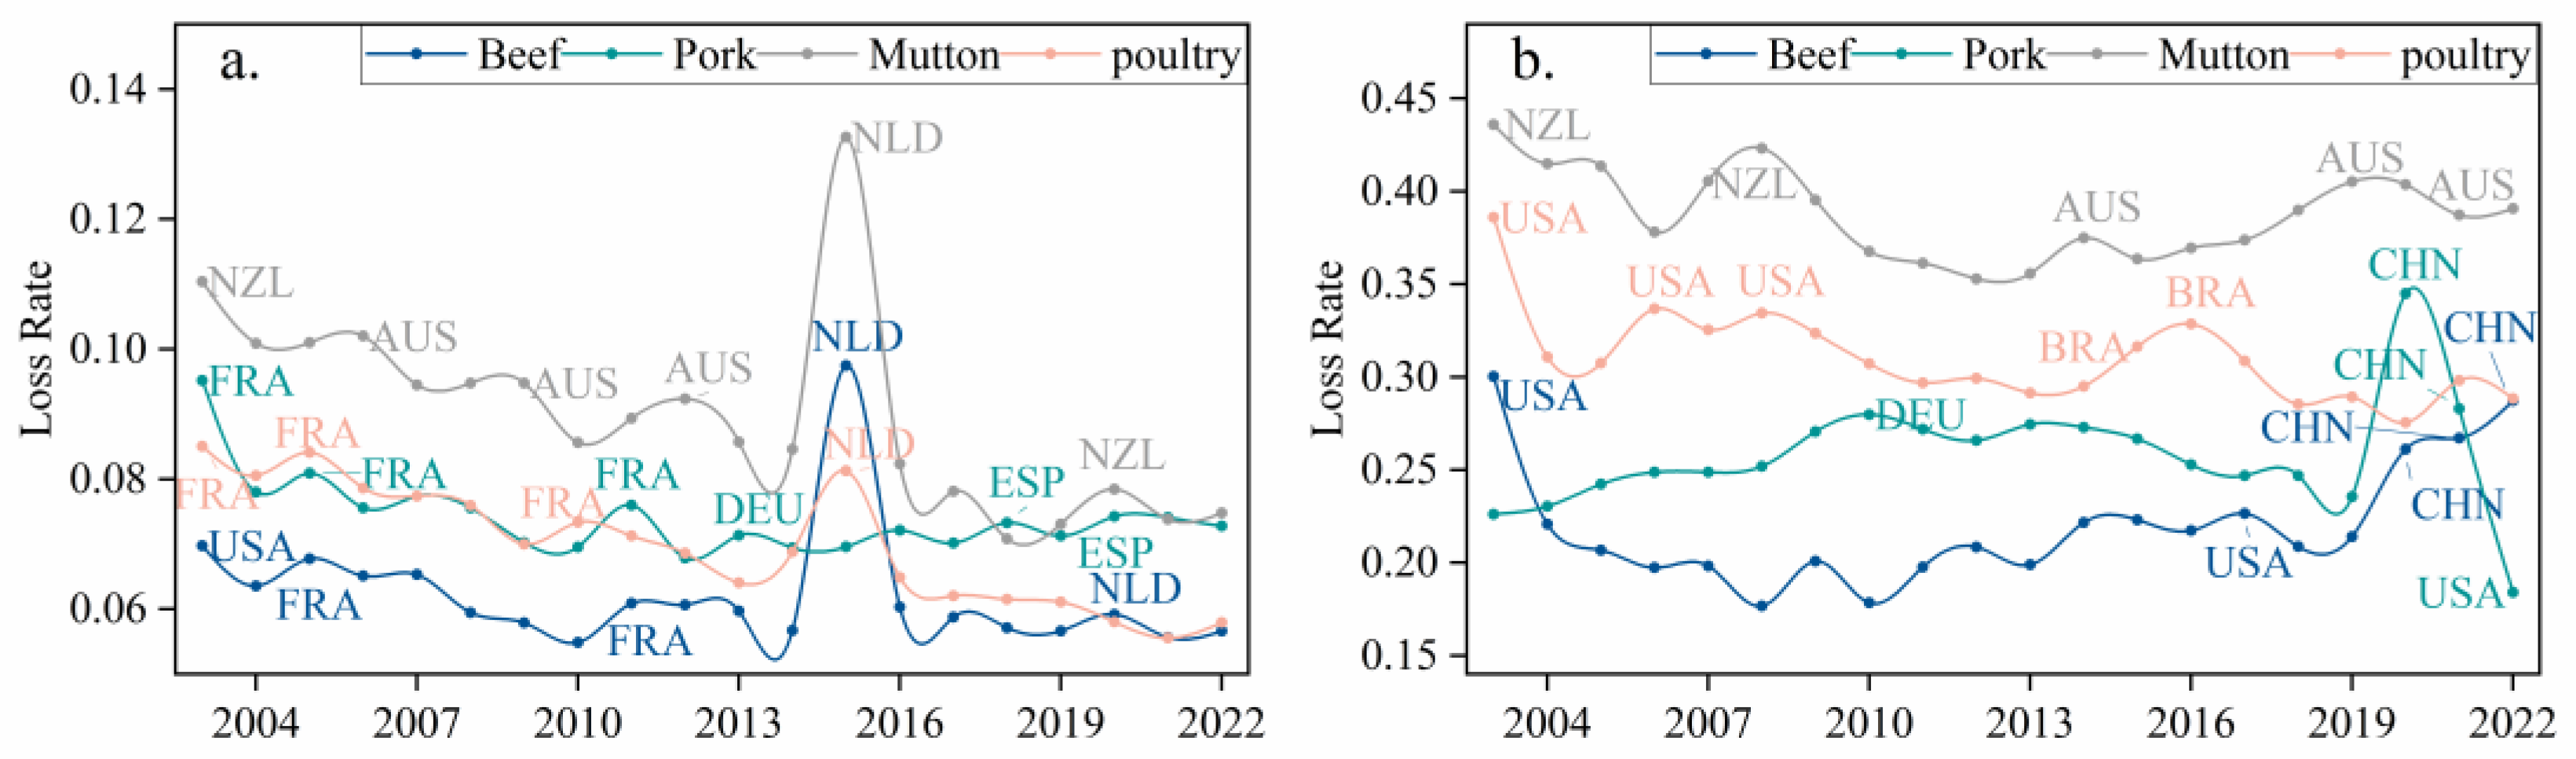
Figure 18.
Evolution of the average retention rate of global efficiency due to the interruption of core nodes.
Figure 18.
Evolution of the average retention rate of global efficiency due to the interruption of core nodes.
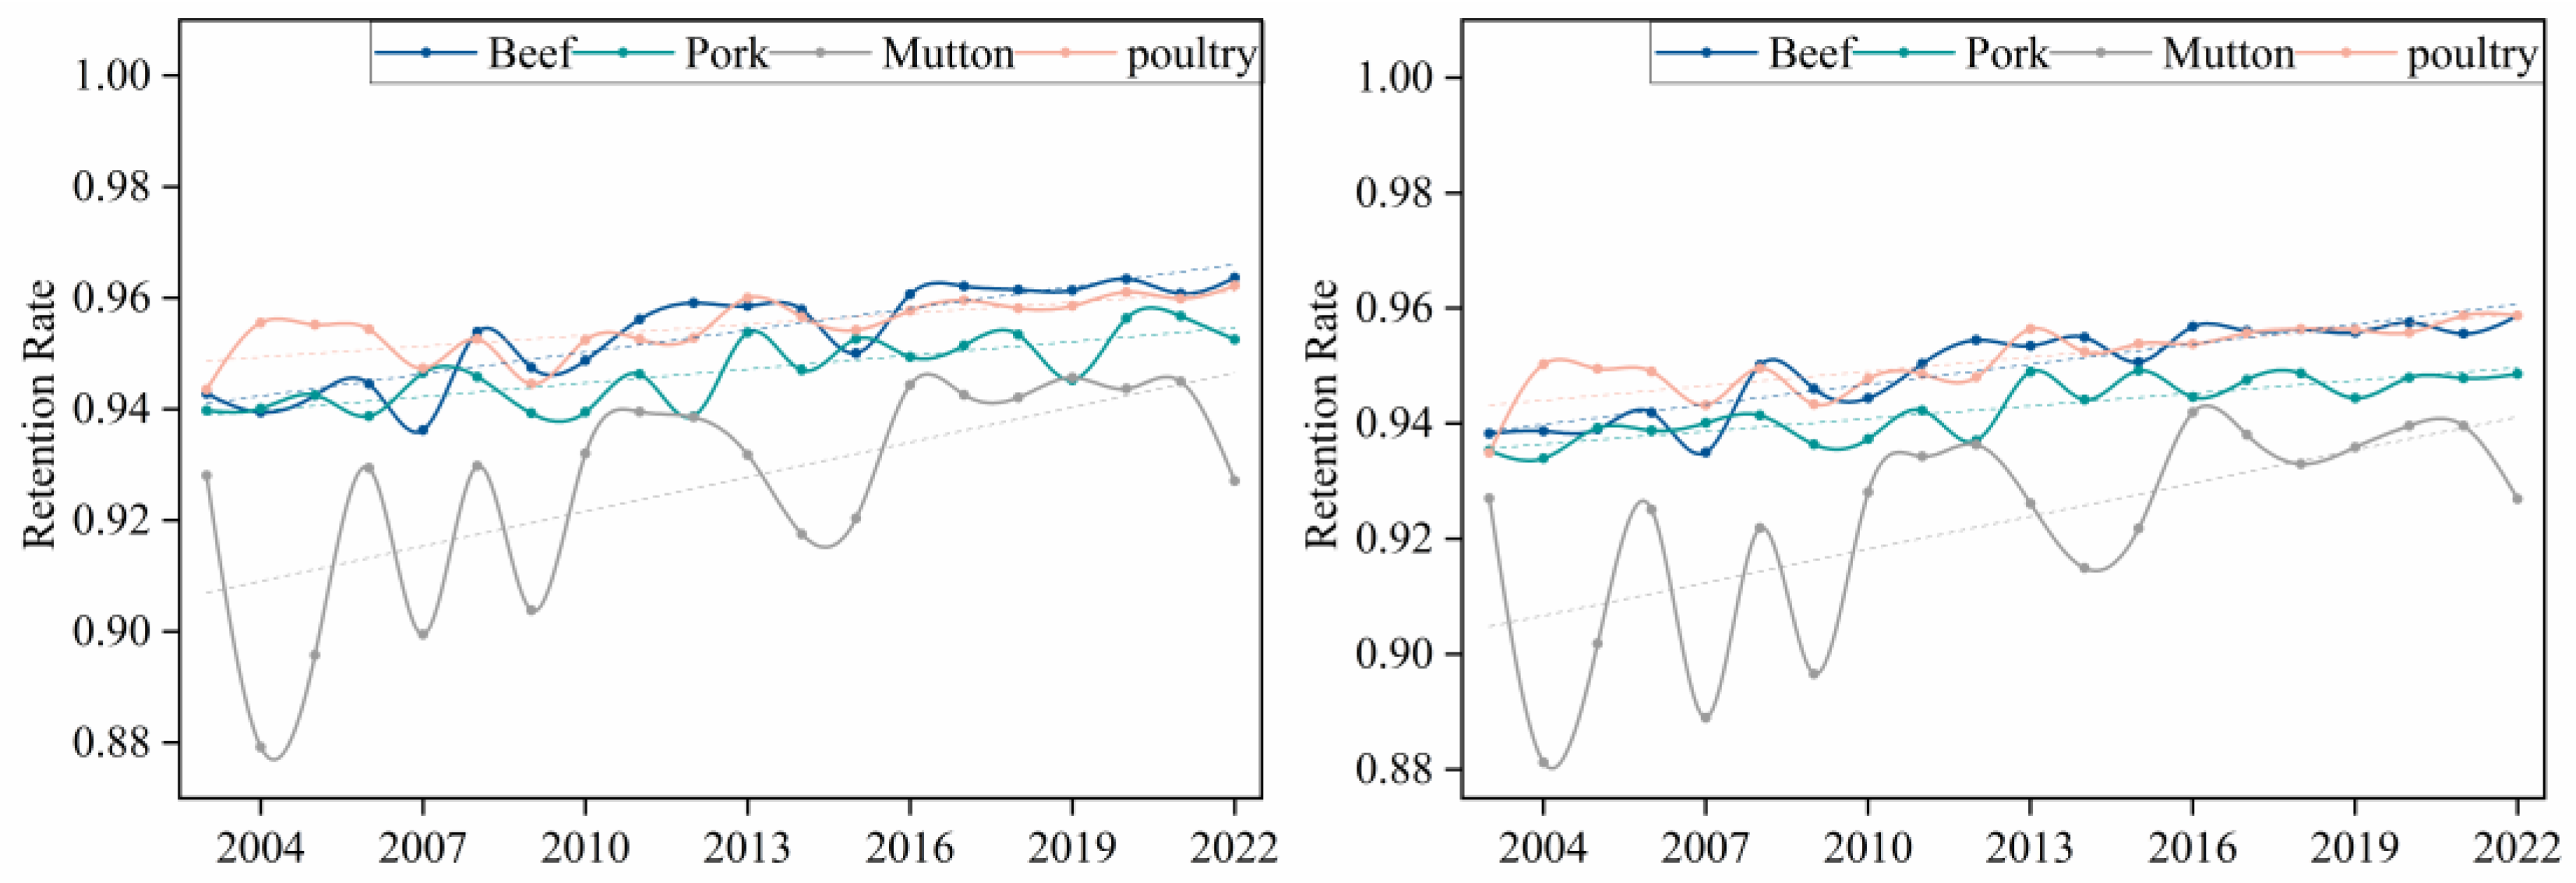
Figure 19.
Evolution of the average retention rate of node strength due to the interruption of core nodes.
Figure 19.
Evolution of the average retention rate of node strength due to the interruption of core nodes.
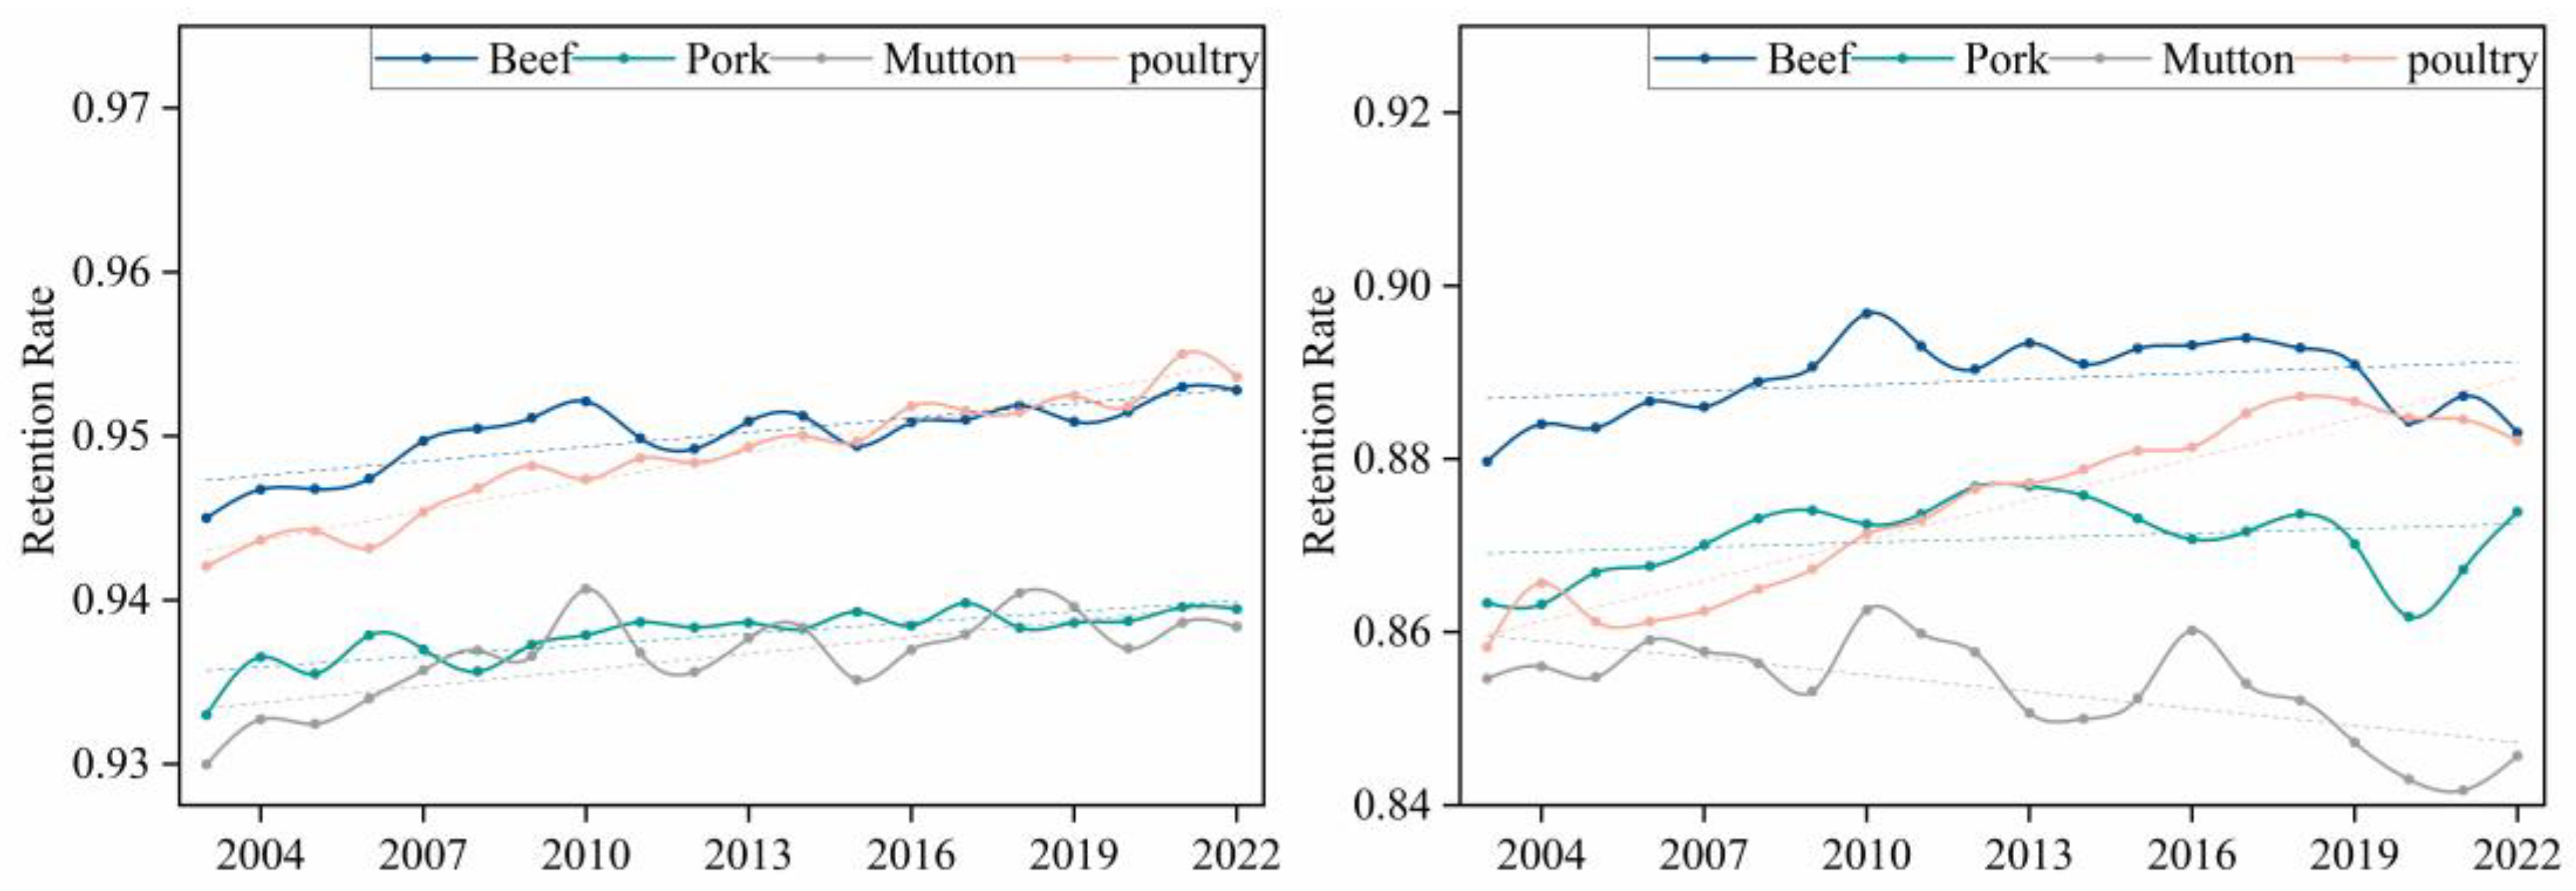
Table 6.
Node importance ranking based on single node disruption network performance loss rate in 2022.
Table 6.
Node importance ranking based on single node disruption network performance loss rate in 2022.
| No. | Node | beef | Node | pork | Node | mutton | Node | poultry | Node | beef | Node | pork | Node | mutton | Node | poultry |
| Unweighted Global Efficiency Loss Rate | Total Node Degree Loss Rate | |||||||||||||||
| 1 | ARE | 0.049 | USA | 0.069 | CHN | 0.136 | FRA | 0.056 | NLD | 0.057 | ESP | 0.073 | ESP | 0.075 | FRA | 0.058 |
| 2 | GBR | 0.045 | ARE | 0.051 | ARE | 0.115 | IRL | 0.048 | USA | 0.050 | NLD | 0.070 | NLD | 0.073 | NLD | 0.054 |
| 3 | DEU | 0.043 | CHN | 0.050 | TZA | 0.112 | AUT | 0.043 | DEU | 0.050 | DEU | 0.066 | NZL | 0.070 | DEU | 0.048 |
| 4 | ATG | 0.041 | AUT | 0.047 | LUX | 0.065 | NLD | 0.037 | FRA | 0.050 | DNK | 0.064 | FRA | 0.066 | BRA | 0.047 |
| 5 | FRA | 0.036 | DNK | 0.046 | ZAF | 0.061 | TUR | 0.036 | ESP | 0.049 | FRA | 0.061 | AUS | 0.062 | POL | 0.045 |
| 6 | SVK | 0.032 | ZAF | 0.045 | USA | 0.054 | CHN | 0.036 | GBR | 0.048 | ITA | 0.061 | GBR | 0.060 | ESP | 0.044 |
| 7 | IRL | 0.031 | NAM | 0.044 | NLD | 0.049 | GEO | 0.032 | ITA | 0.045 | POL | 0.055 | DEU | 0.060 | CHN | 0.042 |
| 8 | USA | 0.029 | DEU | 0.043 | FRA | 0.047 | ARE | 0.032 | POL | 0.042 | BEL | 0.053 | ITA | 0.059 | BEL | 0.042 |
| 9 | ITA | 0.029 | SVK | 0.041 | OMN | 0.046 | GHA | 0.030 | AUT | 0.041 | GBR | 0.052 | IRL | 0.046 | GBR | 0.042 |
| 10 | DNK | 0.028 | EST | 0.039 | NZL | 0.044 | UKR | 0.030 | BRA | 0.041 | AUT | 0.050 | ARE | 0.045 | USA | 0.041 |
| No. | Weighted Global Efficiency Loss Rate | Total Node Strength Loss Rate | ||||||||||||||
| 1 | USA | 0.065 | USA | 0.084 | CHN | 0.129 | NLD | 0.053 | CHN | 0.287 | USA | 0.184 | AUS | 0.391 | BRA | 0.288 |
| 2 | DEU | 0.049 | DEU | 0.059 | ARE | 0.107 | FRA | 0.052 | USA | 0.213 | DEU | 0.175 | CHN | 0.305 | USA | 0.191 |
| 3 | ARE | 0.047 | DNK | 0.059 | TZA | 0.102 | USA | 0.047 | BRA | 0.188 | ESP | 0.174 | NZL | 0.301 | NLD | 0.130 |
| 4 | NLD | 0.045 | CHN | 0.051 | USA | 0.059 | CHN | 0.044 | AUS | 0.092 | CHN | 0.157 | USA | 0.141 | CHN | 0.116 |
| 5 | GBR | 0.041 | ESP | 0.049 | NZL | 0.058 | IRL | 0.042 | NLD | 0.079 | NLD | 0.106 | GBR | 0.111 | POL | 0.108 |
| 6 | FRA | 0.036 | POL | 0.046 | LUX | 0.058 | AUT | 0.039 | IND | 0.065 | DNK | 0.102 | FRA | 0.111 | DEU | 0.093 |
| 7 | ITA | 0.033 | NLD | 0.046 | ZAF | 0.058 | UKR | 0.036 | ARG | 0.065 | MEX | 0.098 | ARE | 0.056 | MEX | 0.077 |
| 8 | PRY | 0.033 | AUT | 0.041 | ESP | 0.055 | TUR | 0.036 | DEU | 0.064 | CAN | 0.095 | IRL | 0.049 | FRA | 0.062 |
| 9 | ATG | 0.032 | ZAF | 0.040 | FRA | 0.053 | HUN | 0.033 | CAN | 0.059 | ITA | 0.085 | NLD | 0.040 | BEL | 0.058 |
| 10 | CHN | 0.032 | SVK | 0.039 | NLD | 0.052 | ARE | 0.033 | JPN | 0.058 | POL | 0.085 | DEU | 0.039 | ARE | 0.056 |
Table 7.
The most destructive nodes and their occurrence frequencies from 2003 to 2022.
| classification | Beef | Pork | Mutton | Poultry | ||||
| country | frequency | country | frequency | country | frequency | country | frequency | |
| Unweighted global efficiency | FRA | 10 | FRA | 9 | ARE | 5 | FRA | 10 |
| ARE | 3 | USA | 4 | FRA | 4 | CHN | 3 | |
| Weighted global efficiency | USA | 10 | FRA | 7 | ARE | 4 | FRA | 8 |
| FRA | 6 | USA | 6 | USA | 4 | CHN | 5 | |
| Node degree | FRA | 10 | ESP | 9 | NZL | 12 | FRA | 19 |
| NLD | 9 | FRA | 8 | AUS | 6 | NLD | 1 | |
| Node strength | USA | 16 | DEU | 17 | NZL | 11 | BRA | 13 |
| CHN | 4 | CHN | 2 | AUS | 9 | USA | 7 | |
Disclaimer/Publisher’s Note: The statements, opinions and data contained in all publications are solely those of the individual author(s) and contributor(s) and not of MDPI and/or the editor(s). MDPI and/or the editor(s) disclaim responsibility for any injury to people or property resulting from any ideas, methods, instructions or products referred to in the content. |
© 2025 by the authors. Licensee MDPI, Basel, Switzerland. This article is an open access article distributed under the terms and conditions of the Creative Commons Attribution (CC BY) license (http://creativecommons.org/licenses/by/4.0/).
Copyright: This open access article is published under a Creative Commons CC BY 4.0 license, which permit the free download, distribution, and reuse, provided that the author and preprint are cited in any reuse.


