
Submitted:
12 July 2025
Posted:
15 July 2025
You are already at the latest version
Abstract
Food security, defined as universal access to sufficient, safe, and nutritious food, is a complex and multi-dimensional issue involving agricultural, ecological, and sociological systems. This paper explores food security through the development of a stylized mathematical model focused on the UK pork industry, an agricultural system shaped by environmental, economic, and social factors. The model employs coupled ordinary differential equations (ODEs) to capture dynamic interactions among key variables such as capital, inventory, demand, and price, reflecting core economic and ecological processes. Bayesian estimation techniques are used to assess parameter uncertainty and enhance the model's robustness in addressing disruptions like Brexit and the COVID-19 pandemic, which have strained supply chains and labor markets. The findings provide insights into the sustainable capacity of the UK pork industry while offering methodological tools for analyzing food system resilience in the face of environmental and market fluctuations.
Keywords:
food security
; resilience
; dynamical systems
; Bayesian estimation
; agricultural trade
; UK pork industry
1. Introduction
"When all people at all times have physical, social, and economic access to sufficient, safe, and nutritious food to meet their dietary needs and preferences for an active and healthy life" is the definition of food security (FAO 2009). This all-encompassing idea emphasizes how crucial it is to guarantee that people everywhere have access to sufficient amounts of food that are both safe and of high nutritional quality. Three interrelated pillars—access, utilization, and availability—are necessary to achieve food security [1,2]. These pillars rely on and are interconnected with intricate ecological, socioeconomic, and agricultural systems [3].
In recent years, food systems globally and nationally have come under increasing pressure from multifaceted challenges. These include rapid population growth, accelerating climate change, geopolitical instability, and evolving dietary preferences [4,5,6]. The cumulative impact of these issues has heightened the urgency of building resilience within food systems. Resilience refers to a system’s capacity to absorb shocks, adapt to changes, and sustain functionality despite adverse conditions [4]. Addressing these challenges is not only critical for ensuring food security but also for mitigating the significant environmental impacts of food systems, which contribute to issues such as biodiversity loss, environmental degradation, and substantial greenhouse gas emissions [7].
Quantitative modelling has become an indispensable tool for understanding and projecting outcomes in food systems. By simulating variables such as production levels, environmental impacts, and consumer behaviors under different scenarios, these models provide crucial insights [7]. However, the inherent complexity of food systems often results in models with numerous parameters, many of which are difficult to estimate accurately from real-world data. Such complexity can reduce the practical utility of these models, as they may become prone to overfitting, lack generalizability, and obscure the fundamental dynamics governing system behavior.
To address these limitations, simplified theoretical or stylized models have emerged as an effective alternative. These models focus on capturing the core dynamics of systems rather than exhaustively representing every detail. While they may not predict specific outcomes with precision, they offer valuable insights into causal mechanisms, emergent properties, and critical thresholds. Stylized models have demonstrated their utility across disciplines such as ecology, where they have clarified population dynamics and stability, and economics, where they have informed fundamental theories of supply and demand. Despite their proven utility, stylized models remain underutilised in the domain of food systems research, where their ability to simplify complexity into actionable insights holds immense potential.
This paper fosters a stylised, public level food framework model motivated by the standards of framework elements. The model is intended to investigate the interaction between key factors, for example, capital, stock, shopper interest, and cost. By zeroing in on these collaborations, the model looks to enlighten the circumstances under which flexibility or implode may emerge inside food frameworks. Significantly, the structure finds some kind of harmony among straightforwardness and authenticity, giving a useful device to figuring out the foundational drivers of maintainability. To demonstrate the applicability of this framework, the model is applied to the UK pork industry, a critical component of the nation’s food supply chain. This industry employs approximately 75,000 individuals and contributes £1.25 billion annually to the UK economy [8]. Over the past two decades, the industry has faced significant challenges, including a 50% decline in sow numbers driven by regulatory changes, disease outbreaks, and increased competition from imports. More recently, the combined impacts of Brexit and the COVID-19 pandemic have introduced further uncertainties, affecting trade, labor availability, and consumer demand. These dynamics make the UK pork industry an ideal case study for assessing food system sustainability.
Using empirical data from 2015–2019, this study employs Bayesian estimation techniques to quantify uncertainties in critical parameters, identify thresholds for resilience, and evaluate vulnerabilities within the system. The findings provide a nuanced understanding of the dynamics that underpin food system sustainability and resilience. Additionally, the insights derived from this model offer actionable strategies for policymakers and stakeholders to strengthen resilience in the face of ongoing and future challenges.
2. Materials and Methods
2.1. Theoretical Model
This study fosters a point by point and stylised hypothetical model of a public food framework, zeroing in on the communications of basic factors: capital, stock, customer interest, and cost. The elements of these factors are portrayed utilizing an arrangement of coupled customary differential conditions (Tributes). This approach guarantees a harmony between catching key framework ways of behaving and keeping up with insightful manageability. The model structure is generalizable to different product based food frameworks yet is applied explicitly to the UK pork industry for this review.
Model Structure
The model comprises four primary variables, each representing a fundamental aspect of the food system:
- Capital (C): Represents essential resources for sustaining production, such as the breeding herd size in livestock systems or arable land for crop production.
- Inventory (I): Denotes the stock of processed food commodities available for distribution and consumption at any given time.
- Consumer Demand (D): Reflects the quantity of the commodity desired by consumers per unit time, influenced by the prevailing price and other factors.
- Price (P): Represents the producer price per unit of the commodity, serving as a key indicator of market conditions.
The interactions among these variables are encapsulated by the following equations:
Capital Dynamics
Capital growth and depreciation are governed by:
where a is the intrinsic growth rate, b represents the cost-to-production ratio, and e denotes the depreciation rate. The term reflects the profitability threshold that incentivizes capital investment or leads to decay.
Inventory Dynamics
The changes in inventory are described by:
where f and g are production coefficients, w is the inventory decay rate, k denotes trade-related adjustments, h is a reference demand level, and captures the non-linear relationship between inventory and demand.
Consumer Demand Dynamics
Demand evolves in response to price fluctuations:
where m is the demand adjustment rate, q reflects price sensitivity, and h represents a baseline demand level. This equation encapsulates how consumer behavior adjusts over time to changing prices.
Price Dynamics
The dynamics of price are determined by supply-demand imbalances:
where r is the price adjustment rate, s scales the demand-to-inventory ratio, and represents the balance between demand and supply.
Non-Dimensionalisation
To facilitate analysis, the equations were non-dimensionalised, reducing the system to a form governed by scaled variables and a reduced parameter set. The non-dimensionalised equations are as follows:
where correspond to scaled representations of capital, inventory, demand, and price, respectively.
2.2. Data Sources
Empirical data spanning 2015–2019 from the UK pork industry were utilized for model parameterization and validation. Monthly inventory data were computed as the sum of domestic production and imports, subtracting exports. Demand was treated as a latent variable, inferred through trends in production and trade flows. Missing data points were assumed to be missing at random, ensuring unbiased analysis.
2.3. Bayesian Estimation
Bayesian inference was employed to estimate model parameters and initial conditions, leveraging Stan [9] interfaced via RStan. Observational data were modeled as log-normally distributed:
where represents observed values, denotes model predictions, and accounts for observation noise.
Additional Flows
Key flows include production, imports, and exports, modeled as:
where denote associated error terms.
Sampling and Convergence
Boundaries were doled out standard typical priors. Inspecting used four Markov Chain Monte Carlo (MCMC) chains, each involving 2,500 warm-up emphasis and 2,500 examining cycles, yielding 10,000 back examples. Combination was surveyed through the potential scale decrease factor (), guaranteeing values somewhere in the range of and .
2.4. Software and Computational Resources
All computations were executed on a high-performance computing cluster, using R version 4.x and Stan. Visualization and result summaries were created with ggplot2 and latex2exp.
3. Results
3.1. Mathematical Analysis
We begin by analyzing the dynamics of the model using linear stability analysis, following the methodology outlined. This analysis identifies fixed points, or equilibrium states, where the system does not change over time. Stability of these fixed points is determined by examining the eigenvalues of the Jacobian matrix evaluated at each fixed point. Stability is inferred when the real parts of all eigenvalues are negative, indicating that small perturbations from equilibrium will decay over time. The leading eigenvalue’s inverse gives the characteristic return time of the system, providing an estimate of how quickly the system will return to equilibrium after a disturbance. This concept is often used to quantify the resilience of the system.
3.1.1. Without International Trade
In the case where international trade is not considered (), the model simplifies, and the system has a stable fixed point given by the following values for capital, inventory, demand, and price:
At the trivial fixed point, where all variables are zero , the eigenvalues of the Jacobian matrix are:
indicating that the system is always stable, and domestic production is viable without the influence of external trade. These eigenvalues confirm that, in the absence of international trade, the food system remains resilient under the given parameters.
3.1.2. With Global Trade
Whenever worldwide exchange is presented, with , extra harmony focuses emerge. These incorporate a temperamental trifling balance and an unreasonable homegrown creation harmony, as well as a steady balance addressing a manageable homegrown creation framework.
The unstable equilibrium for the system occurs when the capital and inventory are driven by international trade influences and is given by:
In addition to the trivial equilibrium, a second equilibrium exists that represents unsustainable domestic production, given by the following values:
This equilibrium is unsustainable due to the destabilizing effects of international trade on domestic resources. The Jacobian matrix at this equilibrium is given by:
The leading eigenvalue, which determines the stability of the equilibrium, is:
For the system to be stable, the critical ratio must satisfy the condition:
The way of behaving of the framework is delicate to this proportion, as displayed in Figure 1a. At the point when this condition holds, the framework can arrive at a steady harmony. Nonetheless, when the proportion surpasses 1, shakiness sets in. The security of the framework is additionally outlined in Figure 1b-d, which show the steady areas in the boundary space of exchange strength () and capital development rate (), for changing upsides of . These plots recognize unreasonable creation (red), supportable creation with imports (blue), and feasible creation with sends out (green).
3.2. Application to UK Pig Industry
In applying the model to the UK pig industry, we saw that the basic proportion is over 1 (Table 1), proposing that the UK pig industry is economical under the ongoing model presumptions. Back expectations from the model show conceivable directions for key factors over the long haul, with occasional varieties and changes in exchange affecting the elements of capital, stock, request, and value (Figure 2).
The exchange strength boundary () relates near the UK’s independence level of 65%, adjusting great to noticed industry conduct. The model expectations represent both homegrown creation and the impact of imports, giving a nuanced perspective on the elements at play.
4. Discussion
This paper presents a hypothetical model of a public food framework, cautiously offsetting scientific straightforwardness with a sensible portrayal of basic elements. The model underscores the maintainability of homegrown food ventures as an element of a basic boundary, which incorporates key factors, for example, benefit, ware interest, capital elements, and exchange strength (see Figure 1a). At the point when this boundary falls underneath solidarity, the homegrown stockpile becomes unreasonable. This system is portrayed by a total dependence on imports, prompting higher balance product costs, lower stock levels, and decreased shopper interest. By utilizing experimental information, the model offers a vigorous structure for assessing the supportability of certifiable food frameworks under its predefined suspicions.
Inside the feasible system, the qualification between net shipper and net exporter frameworks has critical ramifications for flexibility. Net merchants face uplifted weakness to implode in light of the fact that expanded exchange potential frequently lessens homegrown independence. Conversely, net exporters can use extended exchange chances to reinforce their maintainability, gave stable commodity markets stay accessible. These discoveries confirm existing writing, which highlights the significance of expanding food sources to upgrade strength. While worldwide exchange has worked with dietary enhancement and strength, it has likewise prompted weaknesses emerging from over-dependence on a predetermined number of prevailing exchange accomplices. This example, saw in both hypothetical and observational examinations, features a compromise inborn in globalized food frameworks.
The use of the model to the UK pork industry (2015- - 2019) showed its conventional utility. Results recommend that the business at present works inside a useful framework, with essential limit measures on a very basic level above fortitude. Regardless, these disclosures moreover reveal that a decline in freedom under 50% could push the business toward breakdown. This lines up with challenges the UK food structure faces, including the normal impacts of Brexit, pushing purchaser tendencies toward plant-based diets, and risks of sickness episodes like African Pig Fever. Though certain circumstances, like duty changes leaning toward local creators, could increase costs and momentarily benefit the business, the model shows that higher long stretch expenses could suggest advancing toward difficulty.
The components implanted in the model, while useful, improve on the intricacies of genuine food frameworks. For example, the model accepts that item costs answer solely to supply-request lopsided characteristics, barring the impact of worldwide ware costs, creation costs, or administrative obstructions. Besides, it doesn’t represent the heterogeneity in food supply chains or the elements of outside factors, for example, environmental change or wellbeing and government assistance contemplations. Stretching out the model to incorporate inventory network disaggregation, environment effects, and item unambiguous elements could fundamentally improve its importance and prescient precision.
In spite of these restrictions, the introduced model fills in as a strong structure for understanding and examining the maintainability of homegrown food enterprises. It is grounded in both hypothetical and observational work, giving important bits of knowledge into the basic circumstances under which food frameworks stay strong. Policymakers and partners can use this structure to distinguish weaknesses, plan designated mediations, and advance the drawn out supportability of homegrown food frameworks in an undeniably interconnected worldwide scene. S
5. Conclusion
This study presents a comprehensive theoretical framework designed to analyze the sustainability of national food systems by examining a critical compound parameter that integrates key dynamics. The proposed model incorporates essential factors such as profitability, consumer demand, capital dynamics, and trade strength to identify the conditions under which domestic food systems can maintain sustainability. By applying this framework to the UK pork industry, we demonstrated its utility in assessing industry resilience and pinpointing critical thresholds that influence its stability.
The analysis revealed that the UK pork industry currently operates within a sustainable regime. However, the findings indicate that a reduction in self-sufficiency below 50% could drive the system toward collapse. These insights underscore the fragile equilibrium between trade potential and domestic production, emphasizing the importance of maintaining a balanced approach to ensure resilience in food systems.
Additionally, our results highlight the dual-edged nature of global food trade. While international trade offers opportunities for diversification and enhanced stability, over-reliance on imports can significantly weaken the resilience of domestic industries. Conversely, striving for complete self-sufficiency is not inherently optimal, as it may lead to vulnerabilities stemming from dependencies on single-supply chains and limited diversification.
This study offers a valuable tool for policymakers, industry leaders, and stakeholders to evaluate and enhance the sustainability of food systems. The framework enables a nuanced understanding of the interplay between trade and production, facilitating the development of strategies that mitigate risks associated with imbalances. By addressing these challenges, stakeholders can better safeguard food security, promote resilience, and adapt to the complex dynamics of global and national food systems.
6. Future Work
While the presented model offers critical insights into food system sustainability, it simplifies the complexities of real-world systems. Future research should aim to extend the model by addressing several limitations and incorporating additional factors to enhance its applicability and predictive power. One avenue for improvement involves incorporating supply chain heterogeneity. Real food systems consist of multiple interconnected actors and stages, such as producers, processors, and distributors, each with unique dynamics. Modeling these disaggregated components would provide a more nuanced understanding of how variations at different stages influence overall system sustainability.
Another critical extension is to include external drivers such as global commodity prices, regulatory influences, and climate change impacts. These factors significantly affect food production, trade, and consumption patterns but are not explicitly captured in the current model. For instance, climate variability could disrupt production and alter trade dynamics, necessitating adaptations in domestic and international supply chains. Additionally, disaggregating product types within the system could reveal important distinctions. Different commodities, such as fresh pork versus processed products like bacon or sausages, have unique production, demand, and trade characteristics. Including such differentiation would refine the model’s ability to predict industry-specific sustainability outcomes.
Finally, empirical validation of the model across diverse geographies and food systems is essential to establish its generalizability. Applying the framework to other industries and countries with varying levels of trade dependency and domestic production capacity would provide broader insights into the conditions that support sustainable food systems globally. These enhancements would not only improve the theoretical robustness of the model but also make it a more practical tool for guiding food system policy and management in an increasingly interconnected and volatile world.
References
- Maxwell, S. Food security: a post-modern perspective. Food policy 1996, 21, 155–170. [Google Scholar] [CrossRef]
- Barrett, C.B. Measuring food insecurity. Science 2010, 327, 825–828. [Google Scholar] [CrossRef] [PubMed]
- Hammond, R.A.; Dubé, L. A systems science perspective and transdisciplinary models for food and nutrition security. Proceedings of the National Academy of Sciences 2012, 109, 12356–12363. [Google Scholar] [CrossRef] [PubMed]
- Nyström, M.; Jouffray, J.B.; Norström, A.V.; Crona, B.; Jørgensen, P.S.; Carpenter, S.; Bodin, Ö.; Galaz, V.; Folke, C. Anatomy and resilience of the global production ecosystem. Nature 2019, 575, 98–108. [Google Scholar] [CrossRef] [PubMed]
- Tendall, D.; Joerin, J.; Kopainsky, B.; Edwards, P.; Shreck, A.; Le, Q.; Krütli, P.; Grant, M.; Six, J. Food system resilience: defining the concept. Global Food Security 2015, 6, 17–23. [Google Scholar] [CrossRef]
- Béné, C.; Headey, D.; Haddad, L.; von Grebmer, K. Is resilience a useful concept in the context of food security and nutrition programmes? Some conceptual and practical considerations. Food Security 2016, 8, 123–138. [Google Scholar] [CrossRef]
- Springmann, M.; Clark, M.; Mason-D’Croz, D.; Wiebe, K.; Bodirsky, B.L.; Lassaletta, L.; de Vries, W.; Vermeulen, S.J.; Herrero, M.; Carlson, K.M.; et al. Options for keeping the food system within environmental limits. Nature 2018, 562, 519. [Google Scholar] [CrossRef] [PubMed]
- Department for Environment, Food and Rural Affairs. Agriculture in the United Kingdom 2018, 2019.
- Carpenter, B.; Gelman, A.; Hoffman, M.D.; Lee, D.; Goodrich, B.; Betancourt, M.; Brubaker, M.; Guo, J.; Li, P.; Riddell, A. Stan: a probabilistic programming language. Journal of Statistical Software 2017, 76. [Google Scholar] [CrossRef] [PubMed]
Figure 1.
Model strength with global exchange (). Board (a) represents the responsiveness of the basic proportion to boundaries in Table ??, with the ran line denoting the solidarity edge. Boards (b-d) show stable ways of behaving in () space for shifting , featuring impractical (red), manageable with imports (blue), and supportable with sends out (green) locales, utilizing , , and .
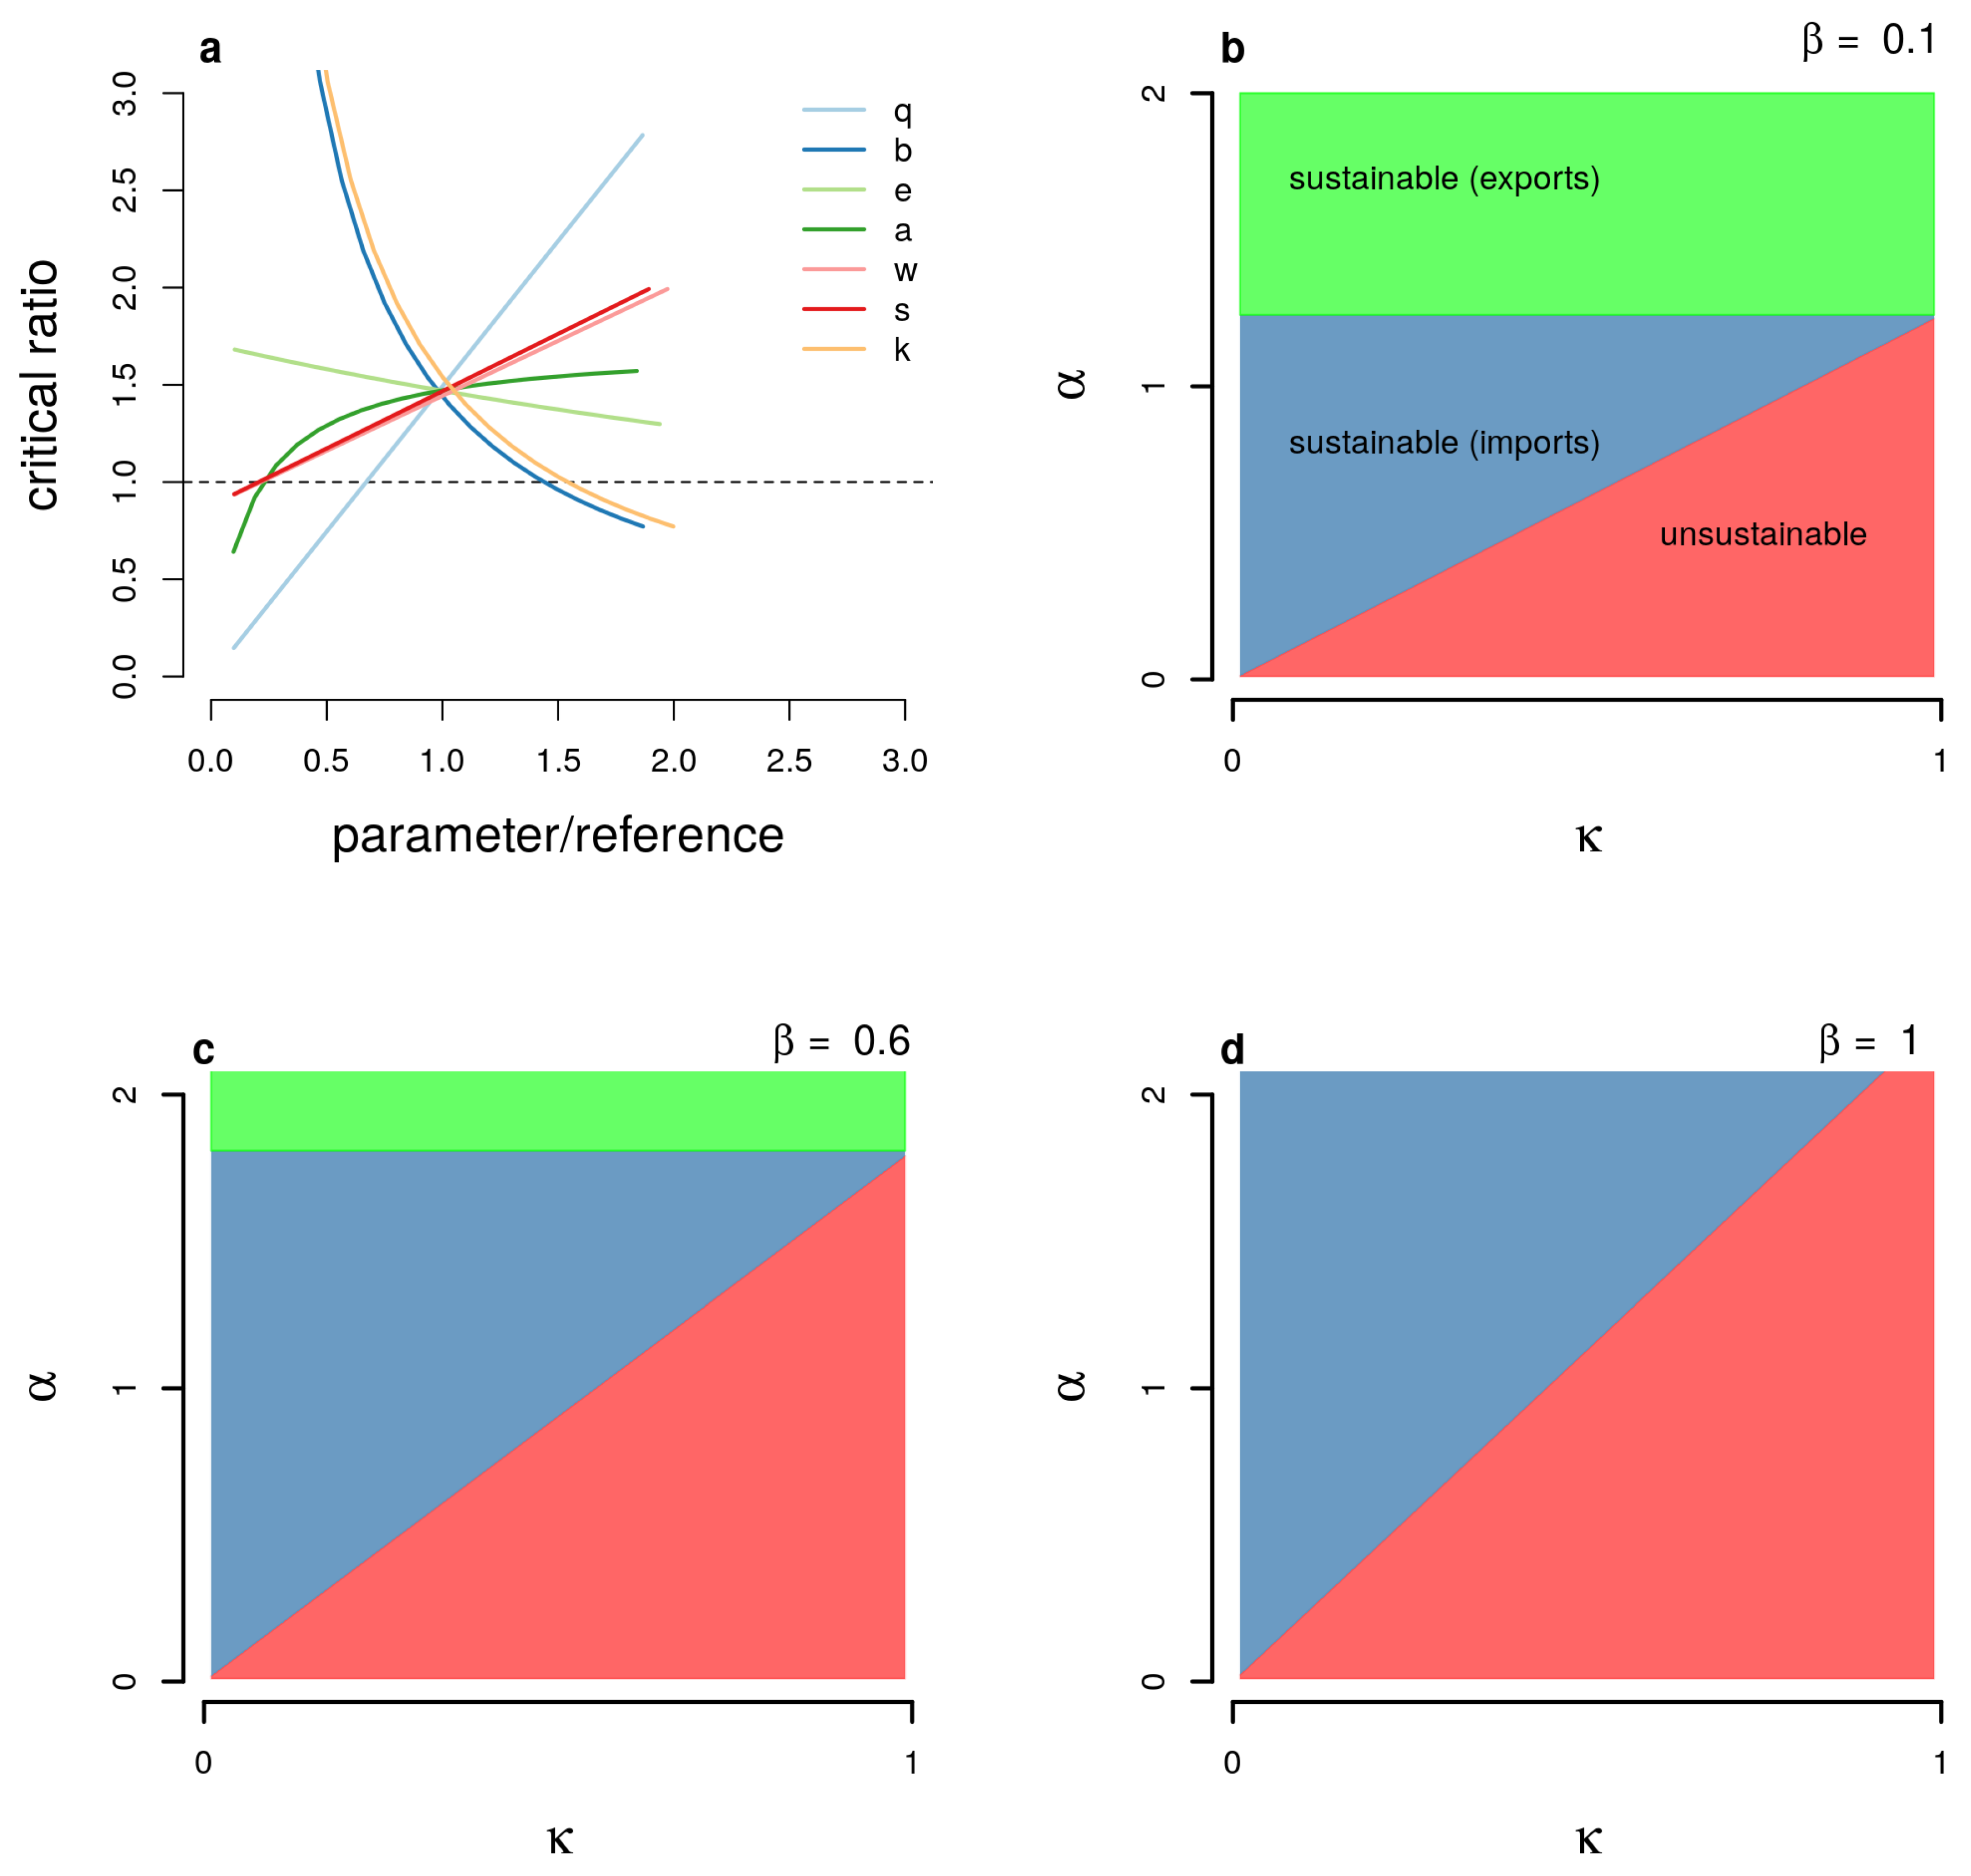
Figure 2.
Model fit to UK pig industry information. Orange circles address crude month to month information (some missing), dark lines portray 200 back examples, the thick dark line demonstrates the mean back direction, and blue circles show 200 back prescient examples with noise.
Figure 2.
Model fit to UK pig industry information. Orange circles address crude month to month information (some missing), dark lines portray 200 back examples, the thick dark line demonstrates the mean back direction, and blue circles show 200 back prescient examples with noise.
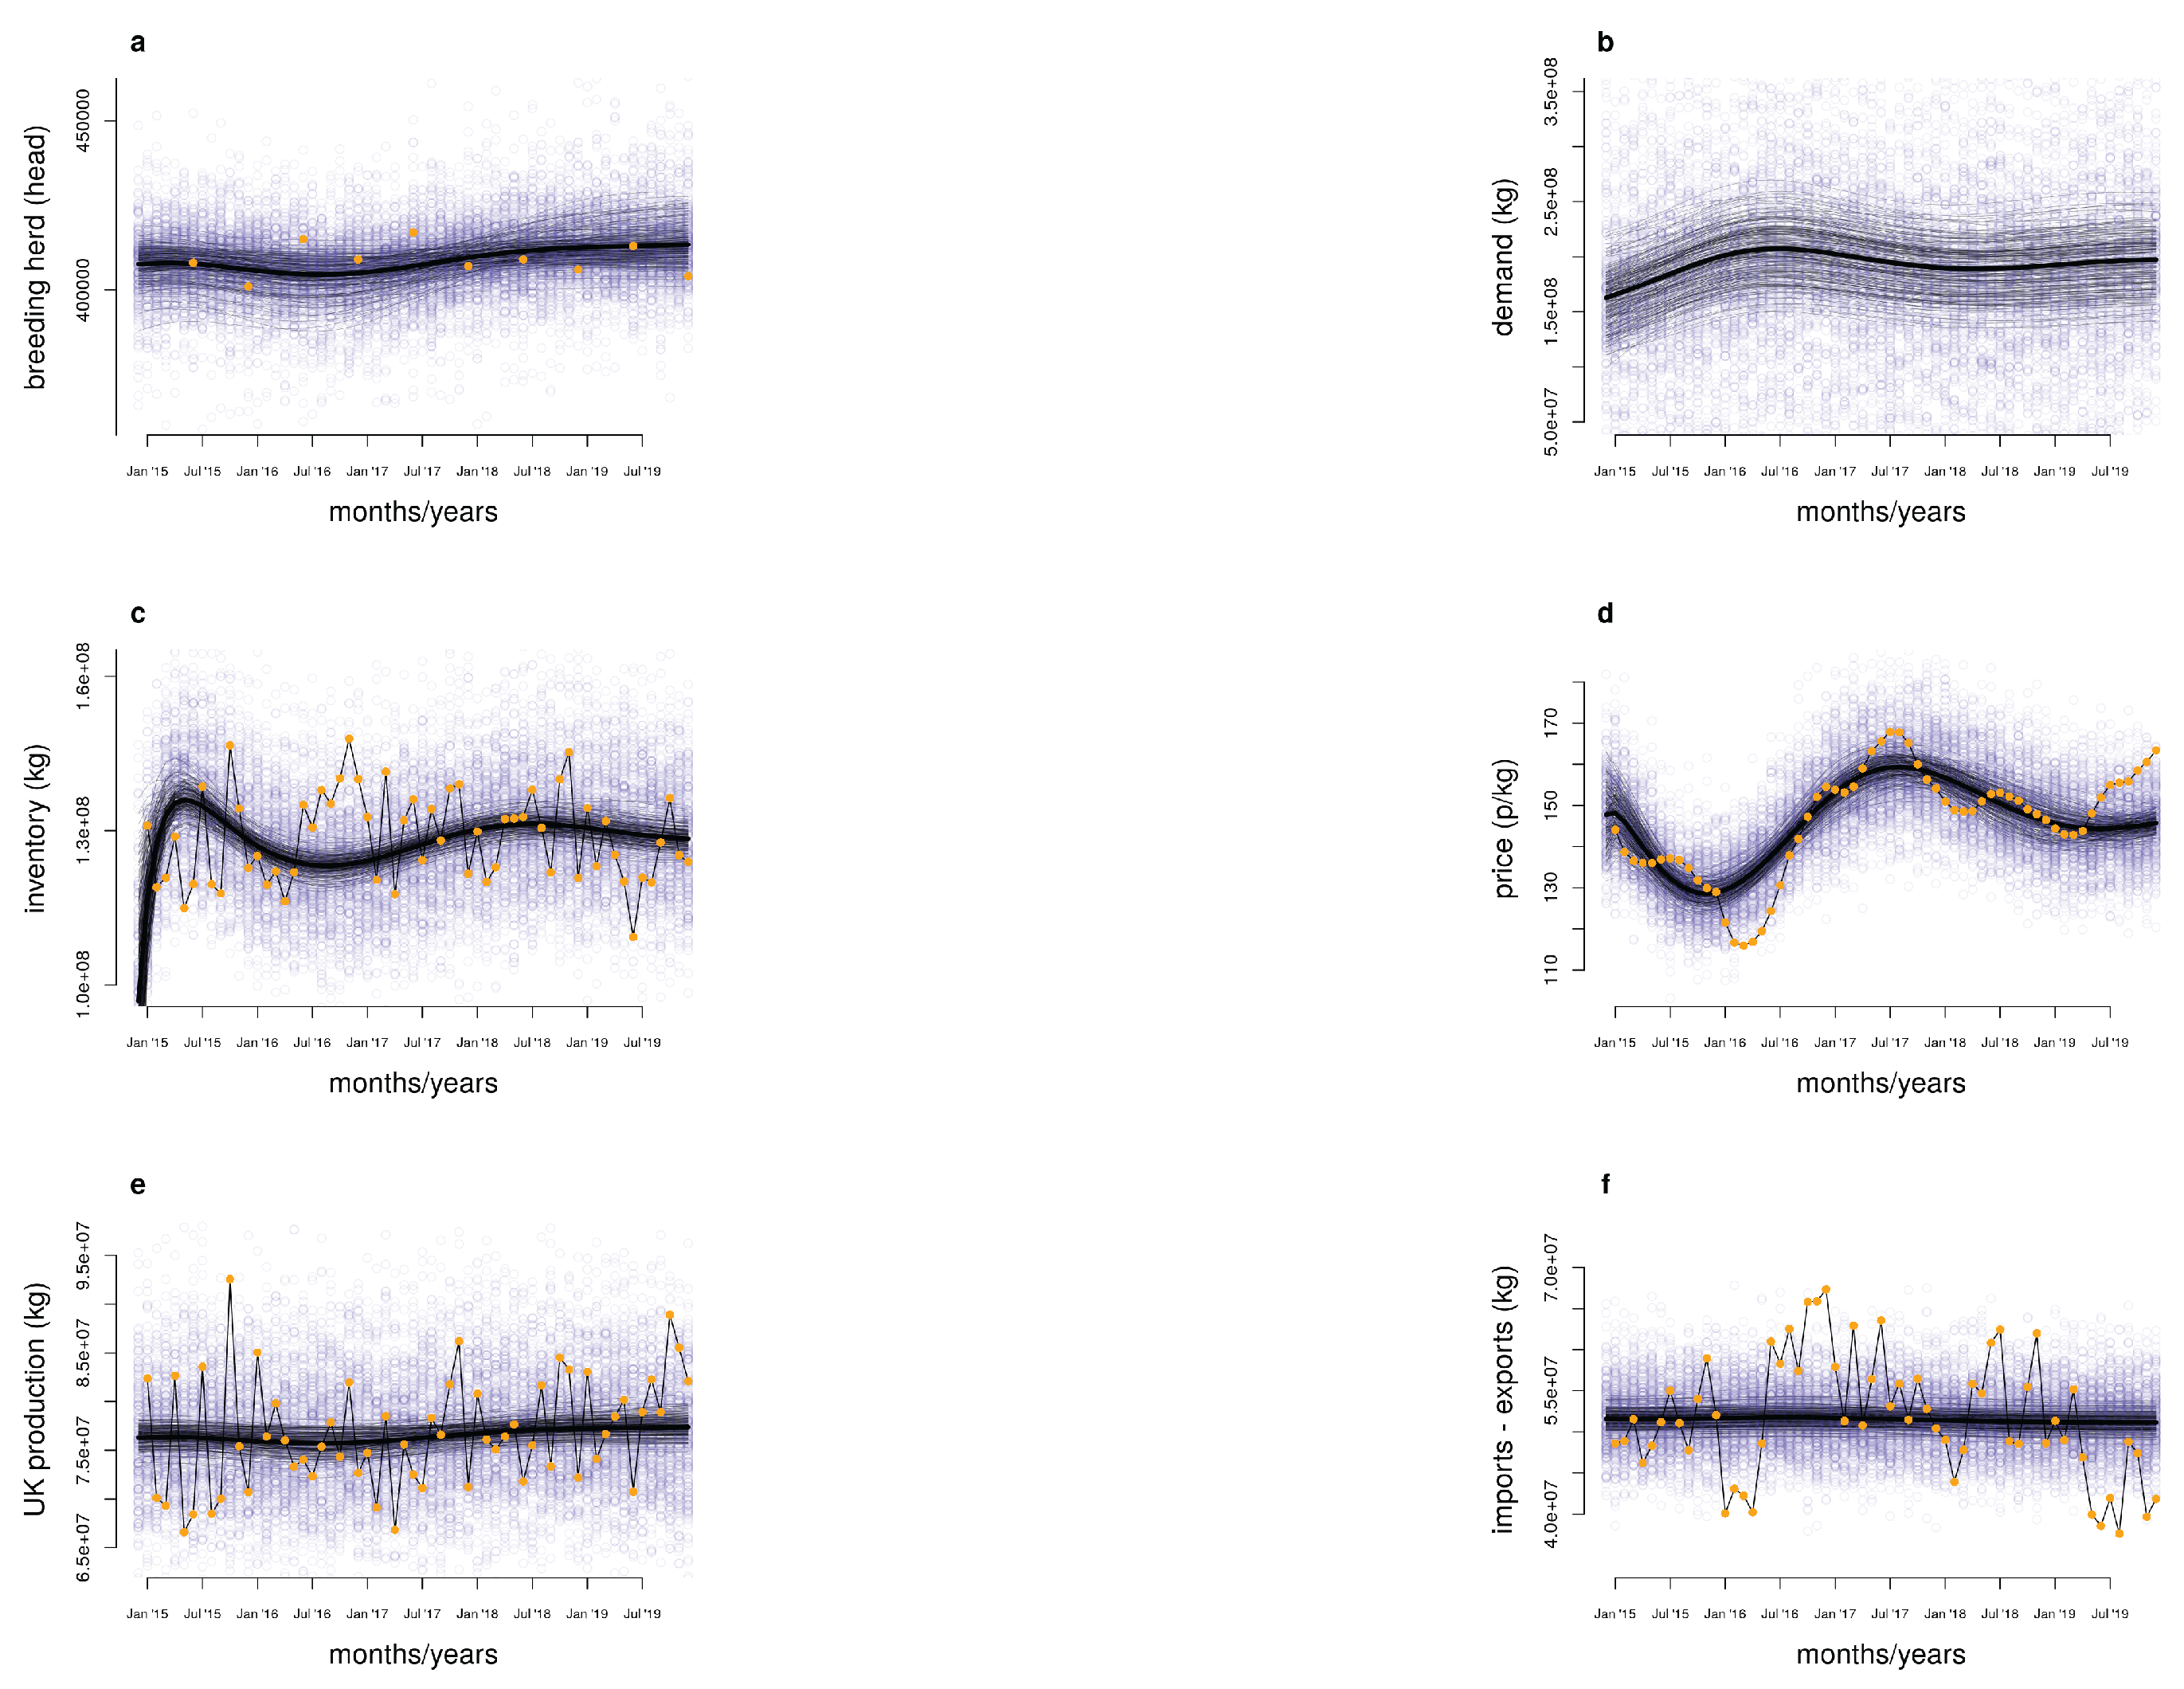

Table 1.
Parameter gauges (mean and 95% HDI) and viable example sizes (ESS) from model fitting to UK pig industry information. Constants: p/kg, kg/pig.
Table 1.
Parameter gauges (mean and 95% HDI) and viable example sizes (ESS) from model fitting to UK pig industry information. Constants: p/kg, kg/pig.
| Parameter | Mean | 95% HDI | ESS |
|---|---|---|---|
| a | 0.0086 | [0, 0.0195] | 5,799 |
| e | 0.0002 | [0, 0.0007] | 8,175 |
| f | 2.2712 | [2.2152, 2.3276] | 7,366 |
| k | 0.3602 | [0.3474, 0.3739] | 7,180 |
| h | 219478906 | [209862509, 229180910] | 7,320 |
| w | 0.2392 | [0.0634, 0.4037] | 3,431 |
| m | 0.0937 | [0.0644, 0.1224] | 5,120 |
| q | 132.0101 | [102.3935, 161.8261] | 3,502 |
| r | 0.1514 | [0.0905, 0.2221] | 6,829 |
| s | 0.6703 | [0.5247, 0.8303] | 3,578 |
| critical ratio | 1.6796 | [1.5549, 1.7797] | 5,349 |
Disclaimer/Publisher’s Note: The statements, opinions and data contained in all publications are solely those of the individual author(s) and contributor(s) and not of MDPI and/or the editor(s). MDPI and/or the editor(s) disclaim responsibility for any injury to people or property resulting from any ideas, methods, instructions or products referred to in the content. |
© 2025 by the authors. Licensee MDPI, Basel, Switzerland. This article is an open access article distributed under the terms and conditions of the Creative Commons Attribution (CC BY) license (http://creativecommons.org/licenses/by/4.0/).
Copyright: This open access article is published under a Creative Commons CC BY 4.0 license, which permit the free download, distribution, and reuse, provided that the author and preprint are cited in any reuse.


