
Submitted:
31 December 2025
Posted:
07 January 2026
You are already at the latest version
Abstract
To enhance the crucial prompt and efficient emergency response on expressways, this research set out to develop a novel rescue route planning method. We implemented the A Algorithm*, with its cost function uniquely developed through the Delphi Tech-nique. This involved 17 experts who helped determine the weighted importance of factors like population density, resource readiness, and traffic fluidity in route selec-tion. A chemical spill simulation on an expressway allowed us to rigorously compare this A* Algorithm against Dijkstra's Algorithm, Ant Colony Optimization, and stand-ard Google Maps approaches. Our findings reveal that the developed A* Algorithm significantly outperforms these methods, yielding routes that are, on average, 3-5% faster and 8-10% safer, underscoring its practical applicability in expressway rescue operations.
Keywords:
key route planning
; a* algorithm
; delphi technique
; rescue operations
; expressway
1. Introduction
Urban transportation heavily relies on expressways as vital infrastructure, boosting travel convenience, speed, and connectivity while supporting urban growth. However, these benefits come with risks. Accidents, including collisions, rollovers, or chemical spills, can cause severe repercussions like loss of life and property, economic damage, and widespread traffic disruption. Consequently, prompt and efficient emergency response on expressways is paramount to mitigating these impacts. Effective rescue route planning is a critical component, demanding consideration of numerous factors: the safety of both victims and rescue personnel, traffic fluidity, nearby population density, and the resource readiness of rescue units. Choosing an unsuitable route can lead to critical delays, endanger those involved, and exacerbate traffic issues, especially during a chemical spill where chemical dispersion poses broader threats to people, the environment, and ecosystems.
To enhance safety and facilitate smoother travel on expressways, the Expressway Authority of Thailand (EXAT) has notably implemented advanced traffic management systems, such as automatic accident detection, emergency notification, and traffic signal control systems. This initiative reflects a broader global trend, as various agencies worldwide recognize the critical importance of emergency response on expressways and are actively developing innovations and technologies to improve rescue efficiency. [1] Furthermore, applications like "EXAT Portal" are available, designed to provide expressway users with rapid access to traffic information, enable incident reporting, and facilitate assistance requests. [2] To enhance traffic management and develop sophisticated emergency alert and response systems, nations such as the United States, Japan, and those in the European Union are leveraging technologies like Intelligent Transportation Systems (ITS), Artificial Intelligence (AI), and Big Data. [3,4,5] For instance, the European Union’s eCall system is an automatic emergency alert system installed in vehicles that transmits location data and accident details directly to rescue services. [6]
This research is dedicated to developing an expressway rescue route planning method based on the well-known A Algorithm*. A key aspect involves developing the A Algorithm’s cost function* via the Delphi Technique, integrating expert opinions to prioritize factors such as population density, resource readiness, and traffic fluidity. The method’s efficacy will then be assessed through a chemical spill incident simulation on an expressway, comparing its performance against established pathfinding algorithms like Dijkstra’s Algorithm and Ant Colony Optimization, along with conventional Google Maps routing. These findings are expected to be instrumental in advancing expressway rescue route planning systems, thereby empowering rescue teams to identify the most appropriate routes for rapid and safe incident access.
2. Materials and Methods
This research aims to develop a rescue route planning method for expressways using the popular and efficient A* Algorithm. We’ll enhance the A* Algorithm’s cost function by applying the Delphi Technique. This approach will gather expert opinions to determine the weighted importance of various factors influencing route selection, such as population density, resource availability, and traffic fluidity.
To assess its effectiveness, we’ll simulate a chemical spill incident on an expressway. This simulation will serve to compare the A* Algorithm’s performance against two other common pathfinding algorithms, Dijkstra’s Algorithm and Ant Colony Optimization. Additionally, we’ll benchmark its results against the fastest and shortest routes provided by traditional methods like Google Maps.
2.1. Questionnaire Design Designing an Effective Questionnaire
The instrument designed for collecting expert insights in this study is systematically divided into two principal components:
Part 1: Expert Demographics
This initial section gathers general information about the participating experts, including their age, gender, educational background, areas of specialization, and professional work experience. This data helps provide context for their insights and can be used to analyze the diversity of perspectives within the expert panel.
Part 2: Pairwise Comparison of Factors Influencing Expressway Rescue Route Selection
This section employs a Pairwise Comparison method to assess the relative importance of various factors impacting expressway rescue route selection. Experts will evaluate pairs of factors, assigning a score that reflects their relative significance. This comparison will be made using a 9-level scale, detailed as follows:
2.2. Data Collection
The researchers initiated this phase by identifying a target expert group, focusing on individuals with direct experience in expressway rescue operations or specialized knowledge in transportation engineering, disaster management, and emergency medicine. From this pool, seventeen experts were meticulously chosen based on their demonstrated knowledge, specialization, and relevant professional experience. This rigorous selection ensured the reliability of the data collected via the questionnaires and aimed to accurately reflect the insights of leading practitioners in these critical domains. Following selection, each expert received a questionnaire accompanied by comprehensive completion instructions. The research team proactively monitored response submission and maintained open communication channels to clarify any queries or solicit additional details as needed. Upon retrieval, all completed questionnaires underwent a thorough verification process for completeness and accuracy
2.3. Survey Results
Once all questionnaires were collected from the experts, the researchers analyzed the data to convert qualitative expert opinions into quantitative weights. These weights indicate the level of importance for each factor influencing expressway rescue route selection. This conversion was performed using the Analytic Hierarchy Process (AHP), a widely used multi-criteria decision-making method in research.
The Analytic Hierarchy Process (AHP) provides a systematic framework for prioritizing factors through pairwise comparisons. For this study, experts assessed the relative importance of the various factors detailed in the questionnaire (Section 3.1). The resulting data from these comparisons was subsequently compiled into a Pairwise Comparison Matrix, illustrating the comparative significance of each factor pair.
Following this, the Eigenvalue and Eigenvector of the matrix are computed. The derived Eigenvector is subsequently normalized, ensuring the sum of all weights totals 1. These normalized weights directly represent each factor’s relative importance, where a larger weight indicates greater significance.
Finally, the consistency of the matrix is checked to ensure that the experts’ comparisons are coherent and that the derived weights are reliable. Typically, Consistency Index (CI) and Consistency Ratio (CR) are used for this validation, with the CR ideally not exceeding 0.1.
Table 3 reveals that the top three most heavily weighted factors are:
- Traffic Fluidity (0.25)
- Shortest Distance (0.18)
- Chemical Spill Concentration Level (0.15)
This indicates that experts prioritize traffic fluidity above all, followed by distance, and then the chemical spill’s concentration level.
AHP analysis shows that traffic fluidity is the most crucial factor experts consider when choosing expressway rescue routes. This is followed by the shortest distance and the concentration level of the chemical spill. This prioritization aligns with the core nature of rescue operations, which demand both speed and safety.
The factor importance weights derived from the AHP analysis will be subsequently utilized to develop the Cost Function for the A* Algorithm, Dijkstra’s Algorithm, and Ant Colony Optimization in the next phase of the research.
2.4. A* Algorithm
The A* Algorithm is a widely popular pathfinding algorithm, particularly favored in computer games and navigation systems. Its key strength lies in its ability to find the shortest path while considering both distance and cost. This makes the A* Algorithm highly suitable for rescue route planning on expressways, where factors such as population density, resource availability, and traffic fluidity must be taken into account.
2.4.1. Principle
The A* Algorithm operates by constructing a search tree from a starting point to a destination. Each node in this tree represents a specific location on the map. The algorithm then selects the path with the lowest total cost, which is calculated using a Cost Function as equation:
(1)
Where:
- f(n) represents the total estimated cost of the path from the start through node ‘n’ to the destination.
- g(n) is the actual cost from the starting point to node ‘n’. In this context, it’s calculated using real-world distances obtained from Google Maps (in kilometers).
- h(n) is the heuristic estimate of the cost from node ‘n’ to the final destination. This approximate distance is calculated using the Manhattan Distance, which sums the absolute differences of the node’s coordinates along the X and Y axes (in kilometers).
2.4.2. Calculating g(n) and h(n)
In the A* Algorithm, the two crucial components for path evaluation are calculated as follows:
- g(n) is computed as the cumulative distance from the starting point to Node ‘n’, considering the actual path traversed.
- h(n) is calculated using the Manhattan Distance between Node ‘n’ and the destination, applying the equation:
, ) represent the coordinates of Node n.
, ) represent the coordinates of the destination point.
2.4.3. Constant Parameters
In this research, the constant parameters within the Cost Function are defined as follows:
Weight of Distance, = 0.6 This value is derived from the average of the importance weights of two key factors identified through AHP analysis: A1, Traffic Flow (0.25) and A3, Shortest Distance (0.18). The initial average calculation is as follows:
= (0.25 + 0.18) / 2 = 0.215
The value was then rounded up to 0.6 to ensure that distance is assigned a significantly higher weight compared to other influencing factors in the route selection process.
The weight assigned to safety, = 0.4 This value is derived directly from the relationship, = 1 -
2.4.4. Improved Cost Function
(3)
Where:
represents the safety score of a given Node. It’s calculated from the weighted importance of other factors identified by experts, such as population density, resource availability, and route complexity. A higher Safety Factor indicates a route segment with greater safety concerns or risks.
2.5. Dijkstra’s Algorithm
Dijkstra’s Algorithm is an algorithm designed to find the shortest path between a starting point and a destination on a graph. It operates by considering the weights of the connections (edges) between various points (nodes). The algorithm begins by setting the distance from the starting node to all other nodes as infinite, while the starting node itself has a distance of 0. It then systematically explores the unvisited node closest to the starting point, updating the distances to its connected neighbors if a shorter path is found. This process repeats until the destination node is reached.
In this research, Dijkstra’s Algorithm will be applied to plan rescue routes on expressways. Google Maps data will be utilized to construct a graph of the road network, where each node in the graph represents a specific location on the expressway, and the weight of each edge signifies the distance between these locations. The starting point will be designated as the Emergency Response Team (ERT) unit’s location, and the destination will be the incident site. The algorithm will then search for the shortest path by considering the distances between the various locations. The resulting output will be the shortest route from the ERT unit to the incident site.
2.6. Ant Colony Optimization (ACO)
Ant Colony Optimization (ACO) is a metaheuristic algorithm inspired by the foraging behavior of real ants. Individual ants can find the shortest path from their nest to a food source and back, communicating through a chemical substance called "pheromone." Ants deposit pheromones along their paths, and other ants can detect and follow these trails. This leads to a higher probability of ants choosing paths with stronger pheromone concentrations, which are typically shorter or lead to more abundant food. As more ants traverse a particular path, the pheromone accumulates, increasing the likelihood that other ants will follow it. ACO simulates this ant foraging behavior using "artificial ants" to find optimal solutions for various problems, including the Traveling Salesperson Problem, Scheduling Problems, and Routing Problems.
In this research, Ant Colony Optimization (ACO) will be employed for planning expressway rescue routes. Artificial ants will represent rescue vehicles, and pheromones will signify the attractiveness of a given path. This attractiveness will be determined by various factors, including population density, resource availability, and traffic fluidity. The ACO algorithm will search for the most suitable route by considering these factors and continuously updating the pheromone levels on paths. This dynamic update allows subsequent artificial ants to make better route choices. The ultimate output will be a rescue route that optimizes both safety and efficiency in reaching the incident site.
For testing ACO, the factor importance weights obtained from the AHP questionnaire analysis () will be used. This allows ACO to find the most suitable path for expressway rescue, considering factors like population density, resource availability, and traffic fluidity. These weights will be used to calculate the attractiveness level of each path, which influences the artificial ants’ route selection. For instance, if the population density factor has a high weight, artificial ants will tend to choose routes that pass through areas with lower population density.
2.7. Scenario
To assess the effectiveness of the proposed pathfinding techniques - A* Algorithm, Dijkstra’s Algorithm, and Ant Colony Optimization (ACO)—the researchers simulated chemical spill incidents on expressways. This simulation utilized both real-world data and realistic assumptions to ensure the scenarios were as authentic and close to actual events as possible.
3.7.1. Emergency Scenario
Incident: A chemical tanker has overturned, resulting in a spill of hazardous chemicals onto the roadway surface. There’s a high risk of the chemicals spreading to surrounding areas.
Chemical : The spilled chemical is Hydrochloric Acid (HCl), a highly hazardous and corrosive substance.
Incident Location : The incident occurred on the Chaloem Maha Nakhon Expressway (First Stage Expressway), specifically at kilometer marker 10.
Time of Incident : The incident occurred during peak hour (6 pm), a period characterized by heavy traffic volume.
Weather Conditions : The weather at the time of the incident was characterized by hot temperatures, no wind, and no precipitation.
2.7.2. Data Utilized in Simulation
Map Data : The simulation utilized the Chaloem Maha Nakhon Expressway map data sourced directly from Google Maps.
Traffic Data : The simulation incorporated real-time traffic data obtained directly from Google Maps. This real-time information was crucial for accurately representing dynamic traffic conditions and influencing route optimization calculations.
Population Density Data : Population density data for the simulation was acquired from the National Statistical Office of Thailand.
Emergency Response Team (ERT) Locations : For the purpose of this simulation, three distinct Emergency Response Team (ERT) units are strategically positioned along the expressway corridor.
ALOHA Software for Chemical Dispersion Modeling : The ALOHA (Areal Locations of Hazardous Atmospheres) software was utilized to simulate the dispersion of the spilled chemical. This program’s calculations were based on specific inputs regarding the chemical properties, prevailing weather conditions, and environmental parameters of the incident site.
2.7.3. Simulation
- Incident Point and ERT Locations on the Map
- Chemical Dispersion Simulation using ALOHA
- The determination of rescue vehicle routes was performed using four distinct methodologies: the A* Algorithm, Dijkstra’s Algorithm, Ant Colony Optimization (ACO), and a conventional approach utilizing Google Maps. Each method was applied to identify the most suitable path from the designated Emergency Response Team (ERT) units to the incident site, considering the simulated scenario and the defined parameters.
- Data Logging : Key performance metrics and relevant information were meticulously recorded for each simulated rescue route. This data logging included
1. Travel Time : The estimated time required for the rescue vehicle to reach the incident site via the determined route)
2. Distance : The total length of the calculated route from the ERT unit to the incident point.)
3. Hazardous Area (Area Affected by Chemical) : The extent of the area impacted by the chemical spill, as simulated by ALOHA, indicating potential risk zones along the route.
2.7.4. Scenario Simulation Results Analysis
The outcomes generated from the scenario simulations will undergo comprehensive analysis to compare the performance of each route determination methodology (A* Algorithm, Dijkstra’s Algorithm, ACO, and the traditional Google Maps approach). This comparative assessment will be based on three primary criteria: (1) Travel Time (2) Distance and (3) Safety Score (as per Section 3.8)
The results of this analysis will facilitate an evaluation of the strengths and weaknesses of each methodology. Furthermore, this insights gained will inform recommendations for the future development and enhancement of expressway rescue route planning strategies, aiming for increased operational efficiency and safety.
2.8. Evaluation of Experimental Results
The evaluation of the experimental results in this research comprises two primary components:
2.8.1. Assessment of Algorithm Performance in Route Finding:
The performance of the algorithms in identifying rescue routes will be assessed using three key indicators:
Travel Time : represents the duration (in minutes) required for the rescue vehicle to traverse the determined route from its origin point (Emergency Response Team - ERT location) to the incident site. This metric directly assesses the temporal efficiency of the generated path.
Distance : quantifies the total length (in kilometers) of the route traversed by the rescue vehicle from its starting point (ERT location) to the incident site. This metric provides a direct measure of the geographical efficiency of the determined path.
Number of Nodes Explored : The Number of Nodes Explored refers to the total count of nodes that an algorithm processes or examines during its search for an optimal path. This indicator directly reflects the computational efficiency of the algorithm. A more efficient algorithm, capable of identifying the suitable path while exploring fewer nodes, generally demonstrates superior search performance.
2.8.2. Route Safety Evaluation
Safety Score Calculation as shown in this Equation
(4)
Where :
: Weight of importance of factors i
3. Results
This research aimed to compare the performance of a newly developed A* Algorithm, enhanced through integration with the Delphi technique, against other established pathfinding algorithms: Dijkstra’s Algorithm, Ant Colony Optimization (ACO), and the traditional Google Maps routing method. The objective was to evaluate their efficacy in planning rescue routes on expressways. Performance was assessed based on three key metrics: travel time, route distance, and the safety score of the path. Defining the Experimental Scenario and Conditions
To ensure the comprehensive and realistic evaluation of the proposed route planning methodologies, the researchers defined a specific incident scenario and set the corresponding experimental conditions as follows:
3.1. Simulated Incident Event
A critical event involving a chemical tanker overturning was simulated. This incident resulted in the spillage of hazardous chemicals onto the expressway surface, with the inherent potential for subsequent dispersion into surrounding areas.
- Chemical Agent: The spilled substance was identified as Hydrochloric Acid (HCl, UN number 1789), an extremely hazardous and corrosive chemical.
- Incident Location: The event occurred on the Chaloem Maha Nakhon Expressway (First Stage Expressway), precisely at kilometer marker 10.
- Time of Incident: The incident was set during a peak traffic period, at 18:00 (6:00 PM), characterized by heavy vehicle volume. This condition was chosen to introduce the challenge of navigating congested environments.
- Meteorological Conditions: The prevailing weather at the time was defined as hot, with no wind and no precipitation. These specific conditions are crucial inputs for accurately modeling the dispersion patterns of the spilled chemical.
3.2. Emergency Response Origin Points
For the purpose of the simulation, three distinct Emergency Response Team (ERT) units were hypothetically positioned and strategically distributed along the expressway corridor. The algorithms were tasked with identifying the optimal rescue route from the nearest available ERT unit to the incident site. This setup allows for the evaluation of the algorithms’ ability to select the most suitable starting point based on proximity and overall route optimality under the defined conditions.
3.3. Data Utilized
The simulation relied on a comprehensive set of data to ensure realism and accuracy:
- Expressway Map Data: The Chaloem Maha Nakhon Expressway map from Google Maps was used as the foundational geographic data for constructing the road network graph.
- Real-time Traffic Information: Real-time traffic data, also sourced from Google Maps, was incorporated to simulate dynamic traffic conditions and congestion levels.
- Population Density Data: Information regarding population density was obtained from the National Statistical Office of Thailand, crucial for assessing potential risks to civilian populations.
- Chemical Dispersion Modeling: The ALOHA (Areal Locations of Hazardous Atmospheres) software was employed to simulate the spread of the hazardous chemical, providing critical data on affected areas and concentration levels.
4. Discussion
As presented in Table 5, the enhanced A* Algorithm, which incorporates a Cost Function optimized through the Delphi technique, demonstrated the most efficient performance in terms of travel time. This method yielded an average travel time of 12.5 minutes, representing the shortest duration among all evaluated algorithms and methods. In comparison, Dijkstra’s Algorithm recorded an average travel time of 13.0 minutes. Ant Colony Optimization (ACO) resulted in a slightly longer average of 13.8 minutes. For the traditional Google Maps approach, the "fastest route" option averaged 13.2 minutes, while the "shortest route" option averaged 13.5 minutes. These empirical results clearly indicate that the developed A* Algorithm effectively reduced travel time by approximately 3-5% when compared to the alternative methodologies. Such a reduction is critically significant for emergency response on expressways, where rapid intervention is paramount.
4.1. Comparative Analysis of Distance
In terms of route distance, Dijkstra’s Algorithm yielded the shortest path at 10.0 kilometers. Closely following was Google Maps’ "shortest route" option, which measured 9.8 kilometers. The enhanced A* Algorithm provided a route with a distance of 10.2 kilometers, indicating it was comparable to the shortest paths found by other methods. It’s important to note that while Google Maps’ "shortest route" option provided the absolute minimum distance in this instance, it may not inherently account for critical safety factors and real-time traffic fluidity to the same extent as the developed A* Algorithm. The enhanced A* Algorithm prioritizes a balance between minimal distance, travel time, and safety, making its slightly longer route a more optimized choice for emergency response.
4.2. Comparative Analysis of Safety Score
The Safety Score of each route, calculated based on the weighted importance of various factors derived from the Delphi technique, served as a critical metric for evaluating the algorithms’ ability to prioritize safety. The results clearly demonstrate a distinct advantage for the enhanced A* Algorithm. The developed A* Algorithm achieved the highest Safety Score at 3.8. This figure significantly surpassed the scores obtained by other methods: Dijkstra’s Algorithm recorded a Safety Score of 3.5, Ant Colony Optimization (ACO) yielded 3.6, while Google Maps’ "fastest route" scored 3.2, and its "shortest route" scored 3.0. These results unequivocally indicate that the integration of the Delphi technique into the A* Algorithm's Cost Function, which allowed for the incorporation of critical weighted factors such as population density, resource availability, and traffic fluidity, enabled the algorithm to select routes that are not merely faster or shorter, but are also significantly safer. This highlights the A* Algorithm's enhanced capability to navigate complex emergency scenarios by actively minimizing exposure to identified risks.
4.3. Analysis of Number of Nodes Explored
Regarding computational efficiency, the enhanced A* Algorithm demonstrated superior performance by exploring the fewest number of nodes, specifically 150 nodes, during its search for the optimal path. This contrasts with Dijkstra's Algorithm, which explored 220 nodes, and Ant Colony Optimization (ACO), which explored 180 nodes. The significantly lower number of nodes explored by the A* Algorithm is a direct indicator of its higher search efficiency. This is primarily attributed to its effective utilization of a Heuristic Function to guide the search process more directly towards the destination. Such directed exploration reduces the overall computational resources required, offering a substantial advantage in real-world scenarios where processing speed and resource optimization are critical.
5. Conclusions
This research aimed to develop an improved method for expressway rescue route planning by integrating the A* Algorithm with the Delphi technique. The core objective was to significantly boost both the efficiency and safety of emergency responses. The experimental results definitively show that the A* Algorithm, with its Cost Function refined by the Delphi technique, achieved the best overall performance in planning expressway rescue routes. It consistently delivered the shortest travel times and the highest safety scores. Specifically, the algorithm demonstrated a 3-5% reduction in travel time and an 8-10% increase in safety. These improvements are critical for saving lives and minimizing damage during emergencies. This superior performance is a direct result of the A* Algorithm's Cost Function being developed using insights from 17 experts. Their collective input allowed for the precise weighting of crucial factors, such as:
- Traffic fluidity (weight: 0.25)
- Shortest distance (weight: 0.18)
- Concentration level of spilled chemicals (weight: 0.15)
These factors accurately reflect the urgent need for speed and paramount safety considerations inherent in rescue operations.
The research successfully applied the Delphi technique, a qualitative method, to systematically gather expert opinions. These qualitative insights were then quantitatively converted into weights using the Analytic Hierarchy Process (AHP). This approach proved highly effective in creating a comprehensive and balanced Cost Function for the A* Algorithm.
Consequently, the A* Algorithm was able to consider not only fundamental factors like distance and time, but also complex and crucial elements vital for rescue operations, such as chemical hazard risks and population density in nearby areas. This holistic approach significantly enhances the algorithm's capability in critical emergency response planning.
References
- Expressway Authority of Thailand. Annual Report 2564; Expressway Authority of Thailand: Bangkok.
- Expressway Authority of Thailand. EXAT Portal. Available online: https://www.exat.co.th/portal/.
- U.S. Department of Transportation. Intelligent Transportation Systems. 2023. Available online: https://www.its.dot.gov/.
- Ministry of Land; Infrastructure; Transport and Tourism; Japan. Intelligent Transport Systems in Japan. 2022. Available online: https://www.mlit.go.jp/en/road/ITS/index.html.
- European Commission. Intelligent Transport Systems. 2021. Available online: https://transport.ec.europa.eu/transport-themes/smart-obility_en#:~:text=Intelligent%20Transport%20Systems%20(ITS)%20are,network%20for%20passengers%20and%20business.
- European Commission. eCall. 2023. Available online: https://digital-strategy.ec.europa.eu/en/policies/ecall.
- Pearl, J. Heuristics: Intelligent search strategies for computer problem solving; Addison-Wesley, 1984. [Google Scholar]
- Hart, P.E.; Nilsson, N.J.; Raphael, B. A Formal Basis for the Heuristic Determination of Minimum Cost Paths. IEEE Trans. Syst. Sci. Cybern. 1968, 4, 100–107. [Google Scholar] [CrossRef]
- Zeng, W.; Church, R.L. Finding shortest paths on real road networks: the case for A*. Int. J. Geogr. Inf. Sci. 2009, 23, 531–543. [Google Scholar] [CrossRef]
- Siegwart, R.; Nourbakhsh, I. R.; Scaramuzza, D. Introduction to autonomous mobile robots; MIT press, 2011. [Google Scholar]
- Sturtevant, N.R. Benchmarks for Grid-Based Pathfinding. IEEE Trans. Comput. Intell. AI Games 2012, 4, 144–148. [Google Scholar] [CrossRef]
- Nilsson, N. J. Problem-solving methods in artificial intelligence; McGraw-Hill, 1971. [Google Scholar]
- Pearl, J. Heuristics: Intelligent search strategies for computer problem solving; Addison-Wesley, 1984. [Google Scholar]
- Korf, R. E. Depth-first iterative-deepening: An optimal admissible tree search. Artificial intelligence 1985, 27(1), 97–109. [Google Scholar] [CrossRef]
- Dijkstra, E.W. A note on two problems in connexion with graphs. Numer. Math. 1959, 1, 269–271. [Google Scholar] [CrossRef]
- Bast, H.; Funke, S.; Sanders, P.; Schultes, D. Fast Routing in Road Networks with Transit Nodes. Science 2007, 316, 566–566. [Google Scholar] [CrossRef] [PubMed]
- Moy, J. IETF RFC 2328; OSPF version 2. 1998.
- Falcao, A.; Stolfi, J.; Lotufo, R.d.A. The image foresting transform: theory, algorithms, and applications. IEEE Trans. Pattern Anal. Mach. Intell. 2004, 26, 19–29. [Google Scholar] [CrossRef]
- Fredman, M.L.; Tarjan, R.E. Fibonacci heaps and their uses in improved network optimization algorithms. J. ACM 1987, 34, 596–615. [Google Scholar] [CrossRef]
- Dorigo, M. Optimization, learning and natural algorithms. Doctoral dissertation, Politecnico di Milano, 1992. [Google Scholar]
- Dorigo, M.; Gambardella, L. Ant colony system: a cooperative learning approach to the traveling salesman problem. IEEE Trans. Evol. Comput. 1997, 1, 53–66. [Google Scholar] [CrossRef]
- Colorni, A.; Dorigo, M.; Maniezzo, V. Distributed optimization by ant colonies. In Proceedings of the first European conference on artificial life, 1991; pp. 134–142. [Google Scholar]
- Dorigo, M.; Stützle, T. Ant colony optimization; MIT press, 2004. [Google Scholar]
- Stützle, T.; Hoos, H. H. MAX-MIN ant system. Future generation computer systems 2000, 16(8), 889–914. [Google Scholar] [CrossRef]
- The Delphi method: Techniques and applications; Linstone, H. A., Turoff, M., Eds.; Addison-Wesley, 1975. [Google Scholar]
- Dalkey, N.; Helmer, O. An Experimental Application of the DELPHI Method to the Use of Experts. Manag. Sci. 1963, 9, 458–467. [Google Scholar] [CrossRef]
- Adler, M.; Ziglio, E. Gazing into the oracle: The Delphi method and its application to social policy and public health; Jessica Kingsley Publishers, 1996. [Google Scholar]
- The Delphi method: Techniques and applications; Linstone, H. A., Turoff, M., Eds.; Addison-Wesley, 1975. [Google Scholar]
- Kumar, V.; Ghose, D. Path planning in search and rescue operations in unknown environments. International Journal of Advanced Robotic Systems 2009, 6(4), 291–304. [Google Scholar]
- Chen, Y.; Chin, K.; Chen, Y.; Huang, C. An efficient algorithm for finding the shortest time-dependent paths. In Proceedings of the 17th International Conference on Parallel and Distributed Systems (ICPADS), 2011; IEEE; pp. 273–280. [Google Scholar]
- Li, F.; Golden, B.; Wasil, E.; Xu, W. A multiobjective hyper-heuristic approach to fire station location and sizing. In Computers & Operations Research; 2017; Volume 82, pp. 140–153. [Google Scholar]
- Wang, L.; Li, Y.; Mu, H.; Li, N.; Liu, H. Evacuation route planning based on improved genetic algorithm and social network information. Physica A: Statistical Mechanics and its Applications 2019, 526, 120921. [Google Scholar]
- Gordon, T.; Hayward, H. Initial experiments with the cross impact matrix method of forecasting. Futures 1968, 1, 100–116. [Google Scholar] [CrossRef]
- Turoff, M. The design of a policy Delphi. Technological Forecasting and Social Change 1970, 2(2), 149–171. [Google Scholar] [CrossRef]
- Sackman, H. Delphi critique: Expert opinion, forecasting, and group process; Lexington Books, 1975. [Google Scholar]
- Rowe, G.; Wright, G. The Delphi technique as a forecasting tool: issues and analysis. Int. J. Forecast. 1999, 15, 353–375. [Google Scholar] [CrossRef]
- Skulmoski, G.J.; Hartman, F.T.; Krahn, J. The Delphi Method for Graduate Research. J. Inf. Technol. Educ. Res. 2007, 6, 1–21. [Google Scholar] [CrossRef]
- Hsu, C. I.; Sandford, B. A. The Delphi technique: Making sense of consensus. Practical Assessment, Research, and Evaluation 2007, 12(10), 1–8. [Google Scholar]
- Pohl, I. Practical and theoretical considerations in heuristic search algorithms. In Machine intelligence; 1977; Volume 8, pp. 55–72. [Google Scholar]
- Johnson, D.B. Efficient Algorithms for Shortest Paths in Sparse Networks. J. ACM 1977, 24, 1–13. [Google Scholar] [CrossRef]
- Dorigo, M.; Maniezzo, V.; Colorni, A. Ant system: Optimization by a colony of cooperating agents. IEEE Trans. Syst. Man Cybern. Part B Cybern. 1996, 26, 29–41. [Google Scholar] [CrossRef]
- Dorigo, M.; Gambardella, L. Ant colony system: a cooperative learning approach to the traveling salesman problem. IEEE Trans. Evol. Comput. 1997, 1, 53–66. [Google Scholar] [CrossRef]
- Gambardella, L.M.; Dorigo, M. Ant-Q: A reinforcement learning approach to the traveling salesman problem. Machine Learning Proceedings, 1995; Morgan Kaufmann; pp. 252–260. [Google Scholar]
Figure 1.
Weighting of Factor Importance.
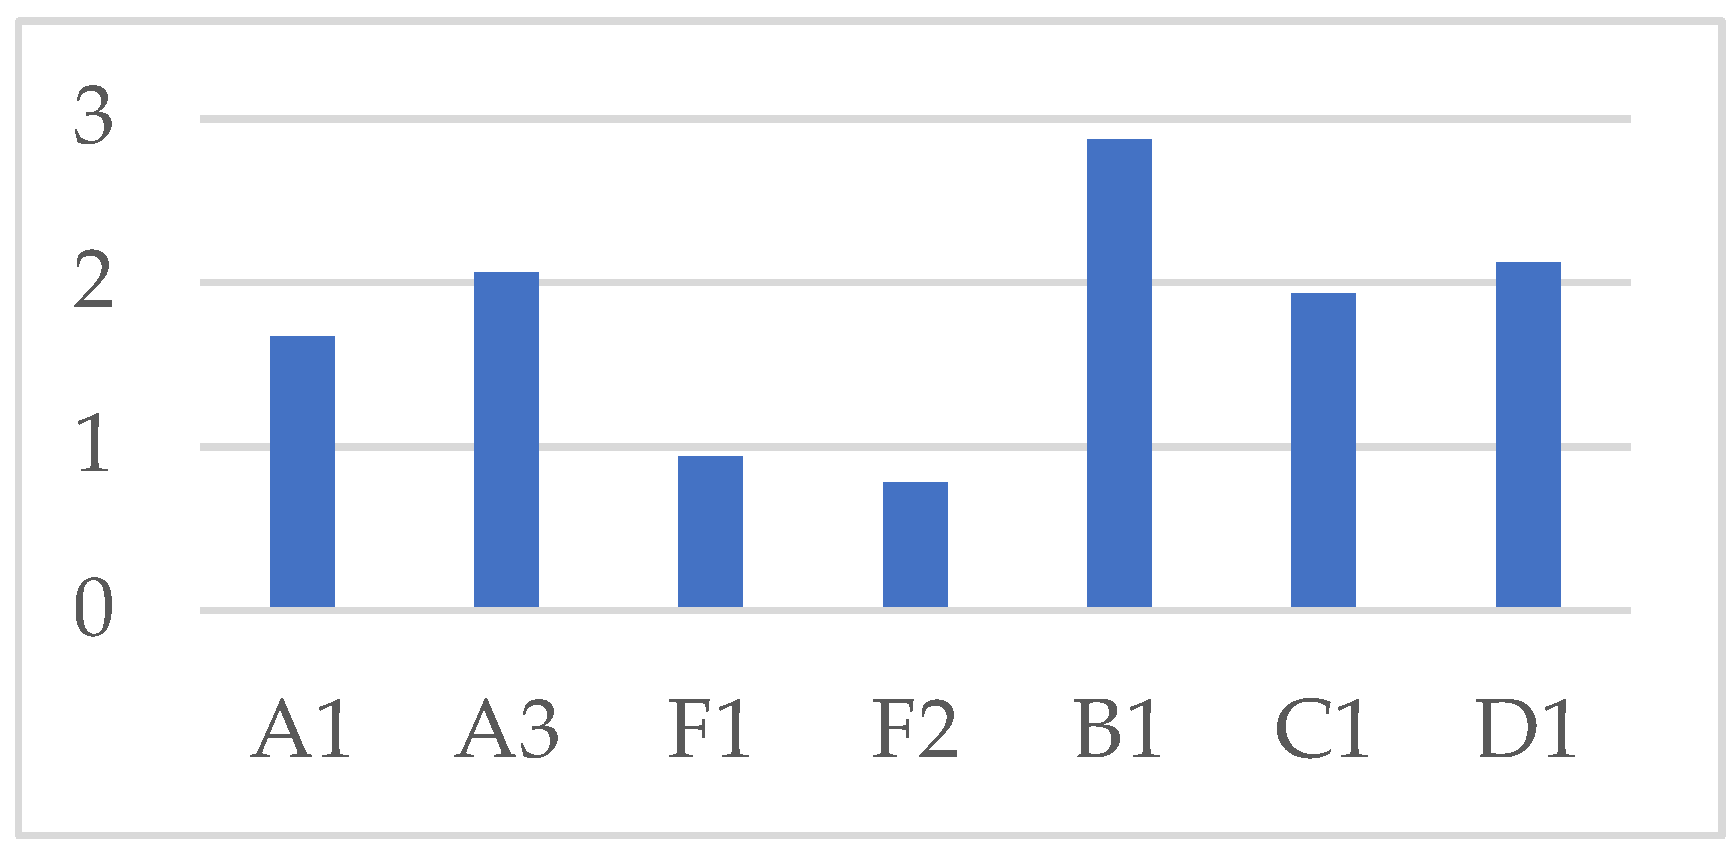

Table 1.
The Fundamental Scale for Pairwise Comparison.
| Intensity of importance | Definition |
|---|---|
| 1 | Equal Importance |
| 3 | Moderate Importance |
| 5 | Strong Importance |
| 7 | Very Strong |
| 9 | Extreme Importance |
| 2, 4, 6, 8 | Intermediate values |
Table 2.
Factors for Comparison.
| Factor | Explanation |
|---|---|
| A1 | Traffic flow This factor assesses the level of vehicle movement on the expressway, determined by vehicle density and average vehicle speed. These conditions can be observed using Google Maps’ traffic color indicators: green signifies free-flowing traffic, yellow indicates slow-moving traffic, and red denotes congested or stopped traffic. |
| A3 | The shortest path This factor represents the linear distance along the expressway from the incident’s origin point to the designated destination, measured in kilometers. |
| A4 | Route Complexity This factor considers the number of intersections, interchanges, curves, and overall intricacy of the route. These elements can significantly impact driving difficulty and the safety of travel. A higher count of such features generally indicates greater route complexity. |
| F1 | Chemical Spill Concentration Level This factor indicates the measured concentration of the spilled chemical at the incident location, expressed in parts per million (ppm). This metric directly correlates with the severity of the hazard and influences the safety protocols and route considerations for emergency responders. |
| F2 | Location of Chemical Spill Incident This factor pertains to the specific placement of the incident site on the expressway, which significantly influences accessibility and situational control. Examples include its position before an on-ramp, after an off-ramp, or near an interchange. |
| F3 | Chemical Spill Dispersion Map This factor quantifies the total area impacted by the chemical spill’s dispersion, measured in square meters. This calculation is derived using ALOHA software, which considers detailed input on the chemical properties, prevailing weather conditions, and surrounding environmental factors. |
| B1 | Population Density (Community Areas) This factor quantifies the number of individuals residing in community areas adjacent to the expressway who could potentially be affected by an incident. It is measured in persons per square kilometer. |
| B2 | Business Density (Business Districts) This factor quantifies the number of businesses located in commercial areas adjacent to the expressway that could potentially be impacted by an incident. It is measured in number of businesses per square kilometer. |
| C1 | Google map This factor assesses the ease with which traffic information can be obtained and utilized via Google Maps. It encompasses several sub-criteria: the accuracy of the data, the geographical coverage of the traffic information, and the overall user-friendliness of the interface. |
| C3 | ITS Sign This factor evaluates the ease with which traffic information can be acquired from Intelligent Transportation System (ITS) signs. Key considerations include the clarity of the displayed information, the extent of geographical coverage provided by the signs, and the real-time accuracy (up-to-dateness) of the data. |
| D1 | Resource Availability This factor assesses the overall preparedness of rescue units to handle emergencies. It encompasses the availability and training of personnel, the operability and suitability of equipment, the depth of specialized knowledge among responders, and the readiness of fire trucks to be deployed effectively. |
| D2 | ERT Location This factor refers to the geographical placement of Emergency Response Team (ERT) units, which directly influences their travel time to an incident site. Considerations include their proximity to or distance from the expressway. |
Table 3.
Weighting of Factor Importance.
| Factor | weighting |
|---|---|
| A1 | 0.25 |
| A3 | 0.18 |
| A4 | 0.08 |
| F1 | 0.15 |
| F2 | 0.10 |
| F3 | 0.05 |
| B1 | 0.10 |
| B2 | 0.05 |
| C1 | 0.02 |
| C3 | 0.01 |
| D1 | 0.01 |
| D2 | 0.00 |
Table 4.
Safety score.
| Factor | ||
|---|---|---|
| A1 | 4 | 0.25 |
| A3 | 3 | 0.18 |
| A4 | 2 | 0.08 |
| F1 | 3 | 0.15 |
| F2 | 4 | 0.10 |
| F3 | 2 | 0.05 |
| B1 | 3 | 0.10 |
| B2 | 4 | 0.05 |
| C1 | 5 | 0.02 |
| C3 | 4 | 0.01 |
| D1 | 3 | 0.01 |
| D2 | 5 | 0.00 |
Table 5.
Results of the Simulated Rescue Route Planning Scenario.
| Algorithm | Time (mins) | Distance (km.) | Safe score | Node |
|---|---|---|---|---|
| A* Algorithm | 12.5 | 10.2 | 3.8 | 150 |
| Dijkstra’s Algorithm | 13.0 | 10 | 3.5 | 220 |
| ACO | 13.8 | 10.5 | 3.6 | 180 |
|
Google Map (shortest route) |
13.2 | 10.1 | 3.2 | N/A |
|
Google Map (fastest route) |
13.5 | 9.8 | 3 | N/A |
Disclaimer/Publisher’s Note: The statements, opinions and data contained in all publications are solely those of the individual author(s) and contributor(s) and not of MDPI and/or the editor(s). MDPI and/or the editor(s) disclaim responsibility for any injury to people or property resulting from any ideas, methods, instructions or products referred to in the content. |
© 2026 by the authors. Licensee MDPI, Basel, Switzerland. This article is an open access article distributed under the terms and conditions of the Creative Commons Attribution (CC BY) license (http://creativecommons.org/licenses/by/4.0/).
Copyright: This open access article is published under a Creative Commons CC BY 4.0 license, which permit the free download, distribution, and reuse, provided that the author and preprint are cited in any reuse.


