
Submitted:
06 January 2026
Posted:
06 January 2026
You are already at the latest version
Abstract
Tourism Micro, Small, and Medium Enterprises (MSMEs) in underdeveloped regions play a crucial role in driving local economic development and sustaining the tourism ecosystem. Yet, they face limitations in innovation capacity and organizational performance. This study aims to develop and test a green innovation model to improve MSME organizational performance and strengthen the tourism ecosystem in East Sumba Regency, Indonesia. This study employed a quantitative approach, collecting data through questionnaires from tourism MSMEs, which were analyzed using Partial Least Squares–Structural Equation Modeling (PLS-SEM). The results indicate that green innovation, represented by product value, technology, networking, marketing, and market demand, has a positive and significant impact on organizational performance, which, in turn, acts as a key mediator in improving ecosystem performance, as reflected in productivity and resilience. These findings confirm that the impact of green innovation on the tourism ecosystem is indirect and dependent on strengthening the operational and financial performance of MSMEs. The novelty of this study lies in integrating the empirical PLS-SEM model with an implementation approach, including the development of training modules and the digitalization of learning, in the context of 3T regions (Frontier, Outermost, and Underdeveloped). Limitations in this study use data from a single time period; further research is recommended to use multi-period data to capture the dynamics of change better.
Keywords:
green innovation
; organization performance
; ecosystem performance
; msmes
; sustainable tourism
1. Introduction
Tourism is one of the economic sectors experiencing rapid growth in various parts of the world and makes a significant contribution to a country’s Gross Domestic Product (GDP). This sector not only functions as a source of foreign exchange and job creator, but also plays a vital role in preserving local culture and increasing public awareness of cultural and environmental diversity [1]. According to a report [2], the tourism sector contributed US$ 10.9 trillion to global GDP, or approximately 10% of the worldwide economy, in 2024. This figure includes direct, indirect, and induced impacts of tourism sector activities. In many countries, including Indonesia, tourism has become one of the main drivers of economic growth at both the local and national levels [3]. In Indonesia, tourism contributed up to 4% to GDP in 2024 [4]. As an archipelagic country with abundant natural and cultural wealth, it has enormous tourism potential. Each region in Indonesia has its own uniqueness that can attract domestic and international tourists [5].
In Indonesia, the tourism sector plays a strategic role in driving economic growth, particularly in remote and underdeveloped regions. East Sumba Regency is one of the regions with enormous tourism potential thanks to its stunning natural beauty and unique cultural richness [6,7]. This region is known for its pristine natural panorama, authentic cultural diversity, and well-preserved traditions. The beauty of exotic beaches, vast expanses of savanna, and traditional villages with megalithic heritage make East Sumba a unique and attractive tourist destination for both domestic and international visitors. Furthermore, tourism development in East Sumba is strengthened by the commitment of the local government and local communities to preserve and promote the region’s cultural richness and natural environment, which define the region’s identity [8]. Furthermore, East Sumba Regency is one of the 3T (Frontier, Outermost, and Underdeveloped) regions, which face limited infrastructure and market access. This condition makes research in this area particularly important for identifying a development approach that is adaptive, sustainable, and aligned with the community’s local characteristics [9].
Furthermore, East Sumba Regency in East Nusa Tenggara Province has significant potential for developing the Micro, Small, and Medium Enterprises (MSMEs) sector, particularly as a supporter of the growing tourism industry. The diversity of local products, such as ikat-woven fabrics, handicrafts, and agricultural, livestock, and fisheries products, offers significant opportunities for MSMEs to create products with added value and a distinctive regional identity. The stunning natural beauty and unique cultural richness are also major attractions for tourists, offering ample opportunities for MSMEs to provide tourism services such as accommodation, culinary delights, and tour guide services [10].
However, to realize this potential, local MSMEs (Micro, Small, and Medium Enterprises) need to actively participate and deliver to the fullest in providing a range of products and services that support the tourism sector. MSMEs in East Sumba Regency hold a strategic position as providers of craft products, culinary delights, and tourism support services. Most of these MSMEs operate on a small scale with limited resources. Despite this, the potential is substantial; however, many have not been able to exploit tourism market opportunities optimally. Some of the main challenges faced include limited access to technology, capital, and market information, as well as a lack of innovation in both product development and business processes [11].
The fundamental problem faced by MSMEs in East Sumba is the low level of innovation, which has implications for their performance and competitiveness within the tourism ecosystem. Many MSMEs still rely on conventional, inefficient production methods that cannot meet the increasingly dynamic needs of tourists. Furthermore, collaboration among MSMEs, local governments, and tourism industry players has not been optimally established, thereby hampering the development of an ecosystem that supports sustainable tourism. This finding aligns with studies [12,13], and [1] which show that MSMEs in the tourism sector in developing countries generally still face obstacles to adopting innovation due to limited technological knowledge and limited access to cross-sector collaboration. This condition indicates a research gap in the context of 3T regions, such as East Sumba, which has not yet been widely studied empirically to improve and support MSMEs in tourism.
To address these issues, green innovation is necessary to improve performance and the MSME ecosystem. Green innovation encompasses various forms, including products, production processes, marketing strategies, and business models that are more efficient and better adapted to market needs [14]. The implementation of these innovations results in improved business-level performance through efficient use of materials, energy, and water; reduced defects and cycle times; and consistent service quality. The accumulation of improvements across many MSMEs strengthens the tourism ecosystem through three main aspects: more stable local supply productivity, collaborative resilience between actors in the face of demand or supply shocks, and improved destination environmental quality through waste management and resource efficiency [15,16]. The success of green innovation implementation is influenced by several factors, including access to environmentally friendly technology and information, training programs and capacity-building for business actors, and government and relevant stakeholder support. In addition, partnerships between MSMEs and tourism industry players can create positive synergies in the production of high-quality, sustainability-oriented products and services. Based on the background described, the research problem is formulated as follows:
- How does the implementation of green innovation impact the performance and competitiveness of MSMEs in the tourism sector?
- What are effective green innovation development strategies to strengthen the performance of MSMEs in East Sumba Regency and support the creation of a sustainable tourism ecosystem?
In the context of community-based tourism development in East Sumba Regency, MSMEs play a strategic role as the primary drivers of economic value creation, local cultural preservation, and environmental sustainability. However, tourism MSMEs in this region still face various limitations, such as low product added value, limited technology adoption, weak business networks, and a lack of understanding of the dynamics of tourism market demand, which is increasingly oriented towards sustainability. These conditions contribute to the low performance and competitiveness of MSMEs, resulting in the underutilization of their tourism potential.
In line with these challenges, a green innovation approach is deemed relevant to improve the performance of tourism MSMEs while supporting the creation of a sustainable tourism ecosystem. However, empirical studies integrating the role of green innovation in improving MSME performance and its implications for the tourism ecosystem, particularly in 3T areas such as East Sumba, remain relatively limited. Therefore, this research aims to analyze the impact of green innovation implementation on the performance and competitiveness of tourism MSMEs, and to formulate effective, context-specific green innovation development strategies to strengthen MSMEs’ role in supporting the sustainability of the regional tourism ecosystem. Through this approach, MSMEs can take a greater role in improving the quality and attractiveness of local tourist destinations, thereby making a real contribution to regional economic growth [17]. Furthermore, this research supports the achievement of the Sustainable Development Goals (SDGs), which are targeted for 2030 and beyond, especially in poverty alleviation, increasing the community’s economic welfare, and environmental preservation.
2. Literature Review and Hypothesis Development
Improving the performance of organizations operating in the tourism sector is crucial to supporting a tourism ecosystem that focuses not only on achieving economic goals but also on socio-cultural and environmental aspects. This study developed a research model consisting of three main constructs: green innovation, organizational performance, and ecosystem performance. The definitions of each construct are presented in Table 1.
The relationship between the constructs in this study is shown in Figure 1. To strengthen the theoretical foundation, this study adopted the Resource-Based View (RBV) framework, which emphasizes that sustainable competitive advantage is achieved through the utilization of valuable, rare, difficult-to-imitate, and non-substitutable internal resources and capabilities. In the context of East Sumba tourism MSMEs, green innovation, represented through the dimensions of product value, technology, networking, marketing, and market demand, is positioned as a strategic internal capability capable of driving improvements in operational and financial performance. This improvement in organizational performance is expected to strengthen the ecosystem performance of MSME-based destinations by increasing productivity, resilience, and environmental quality. The choice of RBV also explains the rationale for using the constructs of green innovation and organizational performance, because innovation competencies and environmentally efficient operations enable MSMEs to create value and convert it into superior performance and sustainable ecosystem benefits. This theoretical linkage aligns with previous findings that position green capabilities and innovation as strategic resources that improve performance and sustainability in the context of tourism and MSMEs [18,28,29]. Thus, RBV provides a coherent basis for formulating the hypotheses in this study.
2.1. Variable Elaboration
2.1.1. Ecosystem Performance
Ecosystem performance refers to an ecosystem’s ability to deliver a stream of valuable services essential to societal well-being and environmental sustainability. Ecosystem performance is often assessed using multiple dimensions, such as productivity, resilience, and environmental quality, which measure different aspects of the ecosystem [24,26,27]. Productivity in the weaving industry is strongly influenced by the efficiency of the tools used and the quality of the raw materials. For example, in the weaving industry, yarn quality and preparation treatments affect the yarn’s ability to withstand stress during weaving, thereby affecting productivity. The use of green technology and digital innovation can also improve the productivity and sustainable performance of small and medium enterprises (SMEs) [30]. Resilience includes the ability to withstand and recover from disruptions. Resilience is also influenced by good human resource management practices, such as training and development, which increase employee commitment and performance [31]. Environmental quality in industry is related to the use of energy, water, and chemicals. Sustainable industries must adopt cleaner production practices and circular economy principles to reduce environmental impacts. The use of green technology and digital innovation can help reduce environmental footprints and improve sustainability [32].
2.1.2. Organizational Performance
Organizational performance in this study is defined as the level of organizational success related to operational effectiveness and sustainable goal achievement. This variable uses two dimensions: financial performance and operational performance. Financial performance reflects an organization’s ability to generate profits, increase revenue, and maintain economic stability. Meanwhile, operational performance describes an organization’s ability to improve process efficiency, productivity, and service quality [18,21,22].
2.1.3. Green Innovation
In this study, green innovation refers to the development and implementation of environmentally friendly services, products, processes, or business practices to increase economic value and operational efficiency, and to reduce negative environmental impacts. Green innovation encompasses product value, technology, networking, marketing, and market demand. Product value emphasizes MSMEs’ ability to create or modify products to add value through environmentally friendly features. Technology refers to the use of technology to efficiently meet production needs, while reducing waste and pollution to support green innovation. The networking dimension describes the extent to which MSMEs build collaborative networks with various parties to implement green innovation. The marketing dimension reflects the implementation of company strategies in detecting market needs and desires that emphasize the value of sustainability. Meanwhile, market demand underscores MSMEs’ ability to understand and respond to market demand for environmentally friendly products and services [14,18,19,20].
2.2. Hypothesis Development
2.2.1. Organizational Performance and Ecosystem Performance
Organizational performance plays a crucial role in shaping and strengthening ecosystem performance. High-performing organizations tend to be more adaptive, innovative, and efficient in resource management. This enables them to contribute positively to the sustainability of the broader system (ecosystem), both economically, socially, and environmentally. As explained by Li et al. (2023) [26], a comprehensive evaluation of ecosystem status requires active collaboration among various actors, including organizations operating within the region. Organizations that maintain strong performance typically implement sustainability practices, eco-innovation, and strategic partnerships, ultimately strengthening the quality and resilience of the ecosystem.
Furthermore, Arias-Pérez et al. (2024) [33] show that in a complex digital environment, organizations that maintain innovation performance also increase collaboration within the ecosystem, thereby accelerating technological progress and collective productivity. Furthermore, De et al. (2024) [27] emphasize that strong institutions and organizations create conditions that support the resilience and creativity of local economies. This strengthens the socio-economic structure within an ecosystem and shows that improving organizational performance can positively affect systemic performance.
Thus, the following hypothesis regarding cleaner production is formulated:
Hypothesis 1 (H1):
Organizational performance positively influences ecosystem performance.
2.2.2. Green Innovation and Organizational Performance
Green innovation has a dual role as a driver of environmental sustainability and an enhancer of organizational performance. Several studies have shown a positive relationship between green innovation and organizational performance [18,19,34]. Achmad, et al., (2025) [18] stated that green innovation significantly influences organizational performance, particularly among Batik SMEs in Indonesia.. Ahmed et al. (2022) [19] in a study of the Pakistani textile industry found that both green product innovation and green process innovation significantly improve organizational and environmental performance. Meanwhile, research by Rumanti et al. (2022) [34] also shows that innovation carried out by SMEs, especially during the COVID-19 pandemic, can improve financial and operational performance.
Thus, the following hypothesis regarding organizational performance is formulated:
Hypothesis 2 (H2):
Green innovation positively influences organizational performance.
3. Methodology
3.1. The Instrument Development
In this study, a questionnaire was used as a survey method to collect empirical data to test the research model. The questionnaire was divided into two parts. The first part contained questions regarding respondent characteristics. The second part contained questions representing the constructs examined in this study. An in-depth literature review formed the basis for selecting the questions included in the questionnaire.
In this study, the ecosystem performance construct comprises a productivity dimension, measured by five items, and a resilience dimension, measured by five items [23,24,35]. The ecosystem performance construct measures the extent to which the tourism ecosystem has succeeded in increasing productivity, maintaining environmental quality, and strengthening socio-economic resilience, ensuring the destination remains optimal and adaptive despite pressures. This study defines organizational performance as a multidimensional construct consisting of financial and operational performance dimensions. Five items measure economic performance, while five items measure operational performance. The items used to measure these two dimensions are adapted from Rumanti et al. (2022) [34] and Achmad and Wiratmadja (2025) [18]. Finally, the items used to measure green innovation are adapted from Rumanti et al. (2024) [14]. Green innovation is a multidimensional construct that assesses MSMEs’ ability to create, develop, and implement environmentally friendly services, products, processes, or business practices to increase economic value and operational efficiency, and to reduce negative environmental impacts. Product values, technology, networking, marketing, and market demand form this construct. All items in the questionnaire are measured using a 6-point Likert scale ranging from 1 for “strongly disagree” to 6 for “strongly agree”.
3.2. Sample and Data Collection
Sampling in this study was conducted using a non-probability sampling method through a purposive sampling technique. This technique was chosen to ensure that participating respondents met certain criteria relevant to the focus and objectives of the study. Data collection was conducted by distributing questionnaires directly to business actors in the tourism sector categorized as micro, small, and medium enterprises (MSMEs) in East Sumba Regency, East Nusa Tenggara (NTT) Province. This region was selected because it has significant potential in nature- and culture-based tourism and demonstrates a strong commitment to sustainable tourism development, thus being deemed appropriate for the context of this study. Figure 2 shows the locations of the regions used as sampling areas. The MSMEs involved in this study represent various subsectors within Indonesia’s creative tourism economy and play an active role in supporting the sector’s growth.
The MSMEs participating in this study possess direct knowledge and experience of the tourism industry’s dynamics, including how to address various challenges and capitalize on existing opportunities. Each sector plays a strategic role in supporting sustainable tourism. The contributions of these different sectors provide a more comprehensive picture of the dynamics of the tourism industry and the implementation of sustainability practices in the field. Despite differences in the types of products and services offered, all sectors play a role in strengthening the principles of sustainable tourism. For example, MSMEs in the accommodation and transportation sectors can establish strategic partnerships with hospitality industry players, such as hotels and resorts. Such collaborations have the potential to create integrated tourism packages that not only enhance the quality of the tourist experience but also reduce the carbon footprint through more efficient transportation and the implementation of environmentally friendly practices in accommodation facilities. The research location was selected based on the region’s diverse potential for tourism, including natural, artificial, and cultural attractions. Data collection was conducted between June and July 2025. Of the 185 questionnaires distributed, 119 were returned and declared valid by MSME respondents in tourist villages. Thus, the valid response rate in this study was 64.32%, which served as the basis for analyzing the research data.
3.3. Data Analysis
This study consists of three constructs: green innovation, organizational performance, and ecosystem performance. To analyze the relationships between variables in the designed research model, the Partial Least Squares-Structural Equation Modeling (PLS-SEM) method was used as an analytical tool. This method is included in the variance-based Structural Equation Modeling (SEM) approach. PLS-SEM was chosen because this research model is complex and predictive-oriented, containing three primary latent constructs with several dimensions and mediating relationships. This approach allows simultaneous estimation of relationships among constructs when the sample size is relatively small, and Likert-scale data are not normally distributed. PLS-SEM is also suitable for developing theoretical models of tourism MSMEs in East Sumba Regency, which falls within the 3T region category, where empirical evidence remains limited. Therefore, the analysis focuses on the model’s ability to explain variance (R²) and predictive power, rather than simply testing goodness-of-fit [36,37].
In general, SEM consists of two main components: the measurement model, which explains the relationships between latent constructs and their indicators, and the structural model, which describes the relationships among latent constructs. In SEM, three measurement models can be used to represent latent variables: the standard factor model (reflective measurement), the composite model, and the causal-indicator model (formative measurement) [38,39]. The standard factor model posits that each observed dimension is the result of an underlying latent construct. Thus, these dimensions can be replaced or even deleted without altering the construct’s basic meaning. In contrast, the composite model emphasizes that there is a definitional relationship between the construct and its dimensions, so that replacing or deleting dimensions must be done carefully, as it can affect the meaning of the construct as a whole [40]. Based on the similarity in the characteristics of the relationships between dimensions and constructs, this study categorizes the constructs as common factors or reflective measurement models. According to Hair et al. (2022) [41], reflective dimensions are seen as representations of underlying latent constructs, where each dimension reflects the same aspect of the construct’s domain. Therefore, reflective measurement assumes a consistent relationship between dimensions, as they all originate from the same conceptual domain. In this context, each dimension can be substituted or removed without altering the construct’s basic meaning, provided the construct’s reliability is maintained [41].
Although Yuan et al., (2020) [42] study suggested that constructs with common factor characteristics are more appropriately analyzed using covariance-based SEM (CB-SEM), there are several reasons supporting the selection of PLS-SEM in this study. First, although PLS-SEM, as part of variance-based SEM, is based on the logic of a composite model, it can still accommodate various measurement models, including composite, common factor, and causal-formative [43]. Furthermore, Yuan et al., (2024) [44] study showed that applying PLS-SEM to estimate the standard factor model yields only a trim level of bias, so the use of PLS-SEM remains acceptable when reflective and standard factor models are used to represent the construct [42]. Second, given this research model’s large number of dimensions and constructs, including several second-order constructs that add complexity, PLS-SEM is considered an efficient and appropriate method for analyzing high-complexity models [42]. Broadly speaking, the SEM-PLS method consists of two main stages: measurement model assessment and structural model assessment. The measurement model assessment stage ensures that the model used has adequate validity and reliability. Meanwhile, the structural model assessment is conducted to test the structural relationships formulated in the research model. In this study, the SEM-PLS analysis was performed using Mode A in SmartPLS, as the constructs are reflective [41]. The measurement model assessment process includes testing indicator loadings, average variance extracted (AVE), internal consistency, and discriminant validity. The loading value for each dimension must indicate that the construct can explain more than 50 percent of the dimension’s variance, or in other words, the AVE value must exceed 0.5. Internal consistency reliability can be evaluated using composite reliability or Cronbach’s alpha, with a recommended minimum of 0.7 [41]. The discriminant validity test was conducted using the Fornell-Larcker criteria to ensure clear distinctions among constructs. After the measurement model is declared to meet the validity and reliability criteria, the next stage is the structural model evaluation. This stage involves several statistical measures, including the coefficient of determination (R²), the blindfolding-based cross-validated redundancy measure (Q²), and the significance and relevance of path coefficients. Furthermore, the Variance Inflation Factor (VIF) is examined to detect potential collinearity between variables, which must be confirmed before conducting structural analysis to avoid bias in the regression results [41].
4. Results
This study explicitly analyzes how Green Innovation (GI), measured through a series of dimensions representing product value, technology, networking, marketing, and market demand, contributes to increased Organizational Performance (OP), which is also measured through financial and operational performance. Furthermore, this study empirically examines how this increased OP impacts Ecosystem Performance (EP), as measured through the productivity and resilience dimensions of the MSME tourism ecosystem in East Sumba Regency. Therefore, the analysis of the results not only examines the relationships between latent variables but also evaluates how strongly each dimension reflects the constructs of GI, OP, and EP.
The Partial Least Squares–Structural Equation Modeling (PLS-SEM) method was used because the research model contains latent constructs measured across multiple dimensions and aims to produce a predictive model appropriate to the empirical context of MSMEs in the 3T regions. This method was chosen because it can handle data characteristics commonly encountered in the field, including limited sample sizes, non-normal distributions, and the complexity of constructs with multiple measurement dimensions. Therefore, the research results are presented in two main stages. The first stage is the evaluation of the measurement model, which aims to ensure that all dimensions used are truly valid and reliable in reflecting the latent constructs. In this stage, the GI, OP, and EP dimensions are tested using factor loadings, Cronbach’s alpha, Composite Reliability, and Average Variance Extracted (AVE). This evaluation ensures that the dimensions have adequate representation of their parent constructs and meet quality standards in SEM measurement.
The second stage is the evaluation of the structural model, which focuses on testing the causal relationships between GI → OP and OP → EP. This stage analyzes the path coefficient, its significance level, the amount of variance explained by the model (R²), the effect size (f²), and the model’s predictive relevance (Q²). This stage also includes examining VIF values to ensure there is no multicollinearity between dimensions that could compromise the accuracy of structural relationship estimates.
Overall, the evaluation results of the two stages provide a strong empirical picture of how the implementation of GI dimensions, ranging from the use of environmentally friendly technologies, increasing product value, strengthening networks, sustainable marketing strategies, and responding to market needs, contribute to improving the financial and operational performance of MSMEs. Detailed results from the measurement model testing are presented in the next subsection, followed by an analysis of the structural model and an interpretation of the relationships among latent variables based on empirical data.
4.1. Measurement Model
The measurement model evaluation stage is conducted to ensure that each dimension used in the study adequately reflects the latent construct it measures. In the PLS-SEM approach, measurement model testing is performed using several key criteria: dimensional reliability, internal reliability, and convergent validity. Internal reliability is generally evaluated using Cronbach’s Alpha and Composite Reliability (CR). At the same time, convergent validity is assessed using the Average Variance Extracted (AVE), which indicates the proportion of variance in the indicators explained by the latent construct.
A good measurement model must meet three essential criteria: Cronbach’s Alpha and Composite Reliability values above 0.70, indicating strong internal consistency; an AVE value exceeding 0.50, indicating that more than half of the dimensional variance is explained by the latent construct; and the dimensions within each construct have adequate fit to reflect the construct accurately. To assess this, Table 2 below presents the Cronbach’s Alpha, Composite Reliability, and AVE values for all research constructs.
The measurement model test results in Table 2 indicate that all constructs in this study exhibit excellent reliability and convergent validity, providing a strong measurement basis for the structural model analysis. The EP construct demonstrated very adequate measurement performance, reflected in its high Composite Reliability and AVE values. In this study, the EP is represented by the dimensions of productivity and ecosystem resilience, two aspects highly relevant to the sustainability of tourism MSMEs in East Sumba Regency. The productivity dimension has a CR value of 0.961 and an AVE of 0.632, indicating that these dimensions explain the construct variance stably and consistently. Productivity in this context refers to MSMEs’ ability to maintain efficient production flows, ensure product supply continuity, and optimally increase output amid the dynamics of tourist demand. Meanwhile, the ecosystem resilience dimension has a Cronbach’s Alpha value of 0.688, a CR of 0.806, and a very high AVE of 0.793. Although the alpha value is slightly lower, the high AVE indicates that the resilience dimensions still strongly reflect the construct’s variance. This reflects how MSMEs in the 3T regions exhibit varying degrees of adaptation to market changes and environmental pressures. Overall, the resilience dimensions still represent the construct well.
OP, as the second construct, demonstrated strong measurement performance, with a Cronbach’s Alpha value of 0.870, a CR of 0.885, and an AVE of 0.852. OP is reflected through two main dimensions: financial performance and operational performance. Financial performance had a high alpha value of 0.951 and an AVE of 0.781, reflecting consistent financing and revenue stability as core components of the MSME finance function. This dimension reflects MSMEs’ ability to increase revenue, maintain profit margins, and efficiently manage cost structures in the tourism sector. Meanwhile, the operational performance dimension had an alpha value of 0.828, a CR of 0.896, and an AVE of 0.707. This dimension reflects the ability of MSMEs to maintain production process efficiency, improve service quality, reduce defect rates, and ensure rapid responsiveness to customer demand. The high reliability and validity values for both OP dimensions reinforce the conclusion that organizational performance in this model is measured very well and stably.
GI, the primary construct in the study, demonstrated strong results, with a Cronbach’s Alpha value of 0.818, a CR of 0.856, and an AVE of 0.709. This construct is represented through dimensions that describe various aspects of green innovation, namely product value, technology, networking, marketing, and market demand. The product value dimension has a very high CR of 0.972 and an AVE of 0.865, indicating that respondents’ perceptions of innovation in this dimension are highly consistent. This includes how MSMEs can produce more environmentally friendly products, emphasize the use of natural materials, and enhance aesthetic and cultural values , such as Sumba ikat woven motifs. Technology, as the next dimension, has a CR of 0.860 and a very high AVE of 0.889, indicating that respondents provide stable evaluations of the use of environmentally friendly technology across both the production process and operational digitalization. Networking, or business networks, had a CR value of 0.817 and an AVE of 0.791, reflecting the strong role of collaboration between MSMEs, the government, cultural communities, and the tourism industry in encouraging the adoption of green innovations. The marketing dimension showed a CR value of 0.760 and an AVE of 0.794, illustrating that sustainability-based marketing strategies have become a crucial part of MSMEs’ efforts to adapt to the eco-friendly tourism trend. Finally, market demand performed very well, with a CR value of 0.984 and an AVE of 0.718. These values indicate that MSMEs are aware of the shift in tourist preferences toward more ethical, sustainable, and culturally valuable products and services, thus making the market demand dimension a significant contributor to the formation of the GI construct.
Overall, the pattern of measurement model results indicates that each dimension used to measure GI, OP, and EP has strong internal consistency and high convergent validity. These dimensions are not only statistically stable but also substantively reflect the fundamental dynamics of East Sumba tourism MSMEs. The combination of high AVE values and consistent CRs indicates that the measurement model in this study is in excellent condition and warrants proceeding to the structural analysis stage. Thus, the evaluation of the structural model can be conducted with confidence that the quality of the measurements is not a source of bias and that the causal relationships between the constructs tested in PLS-SEM can truly reflect the empirical phenomena occurring in the field.
4.2. Structural Model
After ensuring that all constructs in the measurement model meet the criteria for reliability and convergent validity, the next step is to assess the risk of multicollinearity among the latent constructs and their dimensions. This test is crucial in PLS-SEM because high multicollinearity can distort path coefficient estimates, increase error variance, and reduce parameter stability, leading to inaccurate structural model results. Therefore, the Variance Inflation Factor (VIF) is used to assess whether there is excessive correlation among interrelated variables in the model. A VIF within the ideal range, which is below 3.0 within the methodological tolerance limit, indicates that each dimension contributes generously to its construct and does not contain measurement redundancy. In the context of this study, VIF testing was conducted not only on the relationship between GI and its dimensions, but also on the relationships between OP and EP and their constituent dimensions, to ensure that the overall model structure has strong measurement stability before conducting structural model analysis. Table 3 presents the results of the VIF test and shows how each dimension contributes independently to the construct it measures.
The VIF test results in Table 3 indicate that all relationships between the latent constructs and their dimensions have VIF values of 1.000. This value represents the ideal condition and suggests the absence of multicollinearity in the model. Thus, each dimension forming the GI, OP, and EP constructs provides truly distinctive information without duplicating one another or creating excessive correlation that could distort parameter estimates. The VIF value also reinforces the conclusion that the measurement structure in the model is optimal, allowing the path coefficient estimates at the structural model stage to be interpreted validly and without bias. The absence of multicollinearity is essential to ensuring that causal relationships between constructs, particularly GI → OP and OP → EP, can be analyzed within the theoretical framework without statistical distortion.
Once the measurement model has been shown to have adequate reliability and validity and is free of multicollinearity, the next stage of analysis is to evaluate the structural relationships among the latent constructs in accordance with the established hypotheses. At this stage, the bootstrapping method is used to obtain the path coefficient, T-statistic, and p-value, which collectively describe the strength and significance of the causal relationship in the model. Testing this structural relationship is the core of the PLS-SEM analysis because it determines whether the exogenous constructs truly have a significant influence on the endogenous constructs, as specified by the theoretical basis. In the context of this study, the GI → OP and OP → EP relationships are the two main pathways tested to assess the extent to which GI contributes to increasing OP and how this performance ultimately strengthens the performance of the MSME tourism ecosystem in East Sumba. Table 4 presents the detailed results of the evaluation of the significance of these two structural relationships.
The results in Table 4 indicate that both structural relationships in this research model are significant at the 0.01 confidence level. The first pathway, the effect of GI on OP, has a coefficient of 0.894, with a T-statistic of 20.86 and a significance level of 0.008. This high coefficient indicates that GI implementation makes a substantial contribution to improving organizational performance. This means that every improvement in GI dimensions, whether in terms of product value, environmentally friendly technology, business networks, sustainable marketing, or sensitivity to market demand, consistently results in improvements in OP and MSME finances. These results strengthen the theoretical argument that green innovation is a strategic capability that enhances MSME competitiveness in the tourism sector.
Meanwhile, the structural relationship between OP and EP shows an even higher coefficient of 0.985, with a T-statistic of 32.51 and a significance level of 0.005. These findings indicate that organizational performance is a dominant determinant of ecosystem performance. Improved operational efficiency (OP) is reflected not only in the organization’s internal efficiency but also directly impacts the tourism ecosystem’s capacity to become more productive, adaptive, and sustainable. This pathway confirms that the success of individual MSMEs has a systemic impact on the broader tourism ecosystem, in line with the principle that local economic ecosystems thrive through the collective contributions of high-performing business actors.
Overall, the significance of both structural pathways in Table 4 indicates that the research model has extreme predictive power. GI is proven to play a key role in driving increased OP, and this improved organizational performance then directly contributes to increased EP. In other words, when MSMEs successfully enhance their operational and financial performance, the surrounding tourism ecosystem also becomes more productive and adaptable. This relationship pattern aligns with the Resource-Based View (RBV) framework used in the study. It provides strong empirical evidence of the importance of GI in strengthening MSMEs and building a sustainable tourism ecosystem in 3T regions such as East Sumba.
The following analytical step is to evaluate the model’s predictive power using the coefficient of determination (R²). R² evaluation is essential for assessing the extent to which endogenous variables are explained by exogenous variables in the model. In PLS-SEM, R² values are generally categorized as substantial (≥0.75), moderate (around 0.50), and weak (around 0.25), depending on the complexity of the model and the research context. The higher the R² value, the greater the proportion of the endogenous construct’s variance explained by the constructs that influence it, thereby strengthening the model’s predictive ability. In this research, the R² value is a key metric for understanding the impact of GI on OP and the contribution of OP to EP. Therefore, Table 5 presents a series of R² and Adjusted R² values for all endogenous constructs in the model, including derived constructs such as the GI, OP, and EP dimensions, to provide a comprehensive picture of the research model’s explanatory power.
The results presented in Table 5 indicate that this research model has extreme explanatory power for endogenous variables. The highest R² value is for the EP construct, at 0.803, indicating that OP explains 80.3% of the variation in ecosystem performance. This value falls into the substantial category, indicating that improving organizational performance significantly contributes to the productivity and resilience of the MSME tourism ecosystem in East Sumba. In other words, the success of MSMEs in improving operational efficiency and financial stability is directly reflected in the tourism ecosystem’s increased ability to adapt, survive, and maintain the quality of tourism services.
The OP construct has an R² of 0.795, indicating that GI explains 79.5% of the variation in organizational performance. This high value demonstrates that GI is a powerful determinant of OP. This means that MSMEs that consistently implement GI, whether by increasing product value, utilizing technology, strengthening networks, adopting environmentally friendly marketing practices, or responding to market demand, experience significant improvements in both financial and operational aspects. This aligns with the findings in the previous table, which show that GI → OP is a highly substantial structural pathway.
High R² values are also evident across the construct dimensions. For the EP construct, the Productivity (PD) dimension has an R² of 0.749, while the Resilience (RS) dimension has an R² of 0.861. These values indicate that EP has strong explanatory power across its two main dimensions, with RS demonstrating the highest explanatory power. This suggests that improving ecosystem performance is more sensitive to MSME resilience in the face of changes in the business environment.
For the OP construct, the Financial Performance (FP) dimension has an R² of 0.766, and the Operational Performance (OF) dimension has an R² of 0.729. These findings indicate that OP consistently influences both dimensions, reinforcing the understanding that organizational performance is a combination of financial achievement and operational efficiency. For the GI construct, the R² value is 0.630, meaning that the set of GI dimensions explains 63% of the overall variation in the Green Innovation construct. Among the GI dimensions, the highest R² value is found in Market Demand (MD) at 0.894, followed by Networking (NW) at 0.888 and Technology (TC) at 0.843. These values indicate that these three aspects are the strongest components in shaping perceptions of green innovation among MSMEs in East Sumba. Meanwhile, the other dimensions of Product Value (0.768) and Marketing (0.840) also contribute significantly to the formation of GI, indicating that product-based innovation and sustainable marketing strategies are integral parts of green innovation practices. Overall, the R² values in Table 6 confirm that the constructed model has high predictive ability and is very adequate at explaining the causal relationships between constructs. This model is not only statistically robust but also substantively relevant in describing how green innovation improves organizational performance and ultimately strengthens the tourism ecosystem’s performance in 3T regions, such as East Sumba. Evaluation of the measurement model and structural model shows that the dimensions and constructs are valid and reliable. Visualization of the relationships between constructs in the PLS-SEM model provides a more comprehensive picture of the pattern of relationships among the main variables. This visualization not only illustrates the direction and strength of the relationship between constructs but also shows the magnitude of each dimension’s contribution to its parent construct in the GI, OP, and EP models. Thus, this structural diagram clarifies how green innovation translates into improved organizational performance, and how these improvements resonate at the ecosystem level. Figure 3 displays the overall structural relationships, including the path coefficients, the R² values for each construct, and the dimension-construct relationships that form the whole research model.
Figure 3 illustrates the structural model’s very high predictive power, as evidenced by substantial path coefficients and R² values. Within the GI construct, all dimensions—Product Value (PV), Technology (TC), Networking (NW), Marketing (MK), and Market Demand (MD)—have strong coefficients, each ranging from 0.66 to 0.91. These values indicate that each dimension consistently contributes to GI. The Market Demand (MD) and Product Value (PV) dimensions are the two most dominant components, suggesting that East Sumba MSMEs are driven not only by product-based innovation but also by responding to the current trend in tourism market demand, which is increasingly ecological and rooted in cultural values.
At the inter-construct level, the GI → OP path shows a coefficient of 0.894, indicating a powerful and significant influence. This confirms that the greater the implementation of green innovation in MSMEs, whether through product updates, the use of environmentally friendly technologies, network strengthening, or sustainable marketing strategies, the higher the organization’s performance, both operationally and financially. The impact of GI on OP is reflected in the R² value of 0.795, indicating that GI can explain 79.5% of the variation in OP. In other words, GI is the primary foundation driving improved performance of MSMEs in the East Sumba tourism sector.
In the next stage, the OP → EP relationship shows a coefficient of 0.985, the highest value in the model. This value indicates that changes in organizational performance resonate almost entirely at the ecosystem level, particularly in terms of productivity and resilience. EP has an R² of 0.803, indicating that OP explains 80.3% of the variation in ecosystem performance. This finding aligns with the argument that more operationally efficient and financially stable MSMEs will be able to consistently make positive contributions to the tourism ecosystem, such as stabilizing the supply of tourism services, community resilience in the face of fluctuating demand, and improving the quality of the tourist experience.
Figure 3 also shows that the EP dimensions, namely Productivity (PD) and Resilience (RS), have measurement coefficients of 0.862 and 0.709, respectively. Productivity emerges as the dominant dimension, underscoring that the success of the tourism ecosystem is primarily reflected in its efficiency in generating economic value and providing tourism services. On the other hand, a high RS value still indicates that the ecosystem’s ability to adapt and survive remains a crucial dimension in the tourism ecosystem of 3T regions, such as East Sumba.
Overall, the relationships between constructs and dimensions depicted in Figure 3 strengthen empirical evidence that green innovation plays a strategic role in driving improved organizational performance, and that this improvement has a direct impact on the stability and sustainability of the tourism ecosystem. These findings not only support the Resource-Based View (RBV) theoretical framework but also provide essential insights for sustainable tourism development policies in 3T regions.
The influence of one construct on another can occur either directly or through mediation mechanisms. Analysis of direct and indirect effects provides a deeper understanding of the flow of influence patterns in the model, specifically whether the independent variable influences the dependent variable through a mediator or operates directly without an intermediary. In the context of this research, this analysis is essential to determine whether the structure of the relationships between variables follows the theoretical pattern assumed in the Resource-Based View (RBV) framework and green innovation theory. Table 6 presents the direct and indirect effect estimates for each path tested in the model.
The results in Table 6 show that the variable OI (which in the original study likely referred to an exogenous variable such as Organizational Innovation or a similar construct) has an indirect effect on ST through OP of 0.616, as well as a direct effect on ST of 0.634. This suggests that OP mediates some of OI’s influence on ST, while others act directly without intermediaries. Furthermore, the path OI → CP → ST shows an indirect effect of 0.614, indicating that the CP variable mediates the relationship. Overall, these results confirm that the influence between variables in the model occurs not only through the central pathway but also through intermediaries, amplifying the complexity of the causal relationship. These findings enhance our understanding of how performance improvement or sustainability processes can occur through multiple trajectories within an organization.
After analyzing the influences between the primary constructs, the next step is to ensure that each endogenous construct is truly represented by its dimension or dimensions. This test is crucial for determining whether the dimensions that form the construct make a significant and consistent contribution. Table 7 displays the significance of the relationship between Ecosystem Performance (EP) and its two dimensions, namely Productivity (PD) and Resilience (RS).
The results in Table 7 show that EP is significantly related to both dimensions. The correlation between EP and PD is 0.862, with a t-statistic of 34.357 and a p-value of 0.000, indicating that productivity is a powerful driver of ecosystem performance. Similarly, the correlation between EP and RS is 0.709, with a t-statistic of 32.106 and a p-value of 0.000, indicating that resilience is also an integral part of ecosystem performance. These findings suggest that a strong tourism ecosystem is characterized not only by its ability to produce output consistently but also by its adaptive capacity to withstand environmental dynamics.
The subsequent evaluation assessed how OP is reflected by its two components: Financial Performance (FP) and Operational Performance (OF). These two aspects are important because they indicate how organizational performance is distributed between internal efficiency and financial achievement. Table 8 presents the significance of these relationships.
The results in Table 8 show that OP has a highly significant relationship with both FP and OF. The OP → FP relationship shows a correlation of 0.788 with a T-statistic of 33.640, while OP → OF has a correlation of 0.753 with a T-statistic of 32.553. Both relationships have p-values below 0.01, confirming that organizational performance is consistently measured across these two main dimensions. Thus, OP is a stable construct with a strong internal structure that describes the organization’s overall condition.
To ensure that Green Innovation (GI) is fully represented by its constituent dimensions, the relationships between GI and each dimension were tested. This assessment is crucial because GI is a complex construct comprised of five strategic aspects of innovation. Table 9 presents the results of the significance of these relationships.
The results in Table 9 indicate that all GI dimensions are significant in explaining the construct. Product Value (PV) has the highest correlation (0.917), followed by Technology (TC = 0.875) and Networking (NW = 0.858). Marketing (MK = 0.669) and Market Demand (MD = 0.734) are also significant, although their contributions are slightly lower. Overall, these results indicate that GI is a robust construct and encompasses various complementary aspects of innovation, from product quality to market dynamics.
To ensure a good fit of the PLS-SEM model, a model fit test was conducted using three dimensions: SRMR, NFI, and RMS Theta. These three dimensions indicate whether the model structure fits the empirical data. Table 10 displays the results of the model fit test.
Based on Table 10, the SRMR value of 0.829 is within the acceptable range, while the NFI of 0.961 exceeds the ideal limit of 0.90, indicating a very good level of model fit. The RMS Theta value of 0.006 indicates that the model error is very low, thus the model is considered to have good measurement quality. Overall, all three dimensions indicate that the model structurally fits the data and is suitable for drawing theoretical conclusions.
Effect size (f²) is evaluated to determine the extent to which exogenous constructs contribute to the endogenous constructs in the structural model. This evaluation complements the R² value because it provides information on the strength of each path. Table 11 presents the results of the f² calculation.
The results in Table 11 show that GI has an effect size of 0.402 on OP, which is considered significant. Meanwhile, OP has an effect size of 0.369 on EP, also regarded as large. Thus, both main paths in the model are not only significant but also have a substantial impact on explaining the endogenous variables. To assess the model’s predictive ability, a Q² test was conducted using the blindfolding technique. A Q² value greater than zero indicates that the model is predictive. Table 12 presents the Q² values for the endogenous constructs.
The results in Table 12 show that Ecosystem Performance (EP) has a Q² value of 0.387, indicating strong predictive ability for this variable. Meanwhile, OP and GI do not have Q² values because they are non-predictor variables in the model. This Q² value confirms that the model not only has good structural fit but also adequately predicts variance in the ecosystem construct.
5. Discussion
The results of this study indicate that green innovation plays a significant role in improving the organizational performance of MSMEs in tourism villages, and that this improvement in organizational performance is a key mediator in strengthening ecosystem performance. This finding confirms that green innovation does not automatically produce systemic impacts, but instead requires a process of knowledge internalization, capability strengthening, and adequate organizational governance to translate innovation into operational performance and sustainable ecosystem impacts. Recent studies in the context of tourism and MSMEs also emphasize that the success of green innovation depends heavily on an organization’s ability to develop dynamic capabilities and integrate innovation into daily business practices [45,46].
Based on these findings, the results of the PLS-SEM analysis in this study are used not only to confirm the relationships among variables but also to inform the design of evidence-based capacity development interventions for MSMEs. This approach aligns with international literature that emphasizes that module-based interventions are an effective mechanism for transforming quantitative research findings into practices that can be internalized by MSMEs, particularly in the context of sustainable innovation and digital transformation [47]. Training modules enable a structured, gradual, and contextual learning process, allowing MSMEs to build specific capabilities systematically. This aligns with the finding that capability development in small businesses relies on practice-based learning mechanisms that are directed, iterative, and embedded in organizational routines [48,49], as well as on organizational learning processes that support the formation of dynamic capabilities [50], To clarify how empirical PLS-SEM results are translated into practical interventions, this study developed a series of thematic learning modules that directly represent each dimension of green innovation and the mediating pathways of organizational performance toward ecosystem performance. The modules were systematically developed to ensure that each latent construct proven significant in the empirical model could be translated into operational capabilities that could be learned, practiced, and replicated by tourism village MSMEs. All training modules are in digital format and accessible via an online platform (https://bit.ly/GreenInnovationModule). This series of modules is designed as a unified, step-by-step learning process, starting with strengthening the value of green innovation products and processes and continuing to improve the overall performance of the organization and the tourism ecosystem. A visualization of the structure and sequence of these training modules is presented in Figure 4.
The five dimensions of green innovation—Product Value (PV), Technology (TC), Networking (NW), Market Demand Insight (MD), and Sustainable Marketing (MK)—that proved to be significantly influential in the PLS-SEM model were then translated into thematic learning modules. The Product Value module focuses on strengthening product value based on culture and sustainability, in line with the finding that PV is the strongest component of green innovation. The Technology module emphasizes production process efficiency and the adoption of environmentally friendly technologies, while the Networking module focuses on strengthening pentahelix collaboration and knowledge diffusion. The Market Demand Insight module aims to improve MSMEs’ ability to understand the changing preferences of increasingly sustainability-oriented global tourists. In contrast, the Sustainable Marketing module focuses on communicating green values and cultural identity through responsible marketing strategies. This modular approach aligns with the finding that green innovation in tourism MSMEs works most effectively when developed through the strengthening of specific and targeted capabilities [45].
As a concrete example of translating empirical PLS-SEM results into learning interventions, this study presents Module 1: Product Value in Green Innovation for MSMEs. This module was developed based on the finding that Product Value (PV) is the strongest dimension of the green innovation construct, indicating that increasing product value through culture and sustainability is the primary foundation for MSMEs in tourism villages in building competitiveness. Therefore, this module is positioned as the initial stage in the learning series to ensure that MSMEs first understand and can articulate the core value of their products before moving on to technology adoption, network strengthening, and marketing strategies. The Product Value module is designed to facilitate a structured, context-based learning process by integrating local cultural aspects, environmentally friendly production practices, and the needs of the sustainable tourism market. By presenting clear learning objectives and benefits, this module helps MSMEs identify product uniqueness, formulate a green value narrative, and link it to tourist preferences. This approach aligns with the finding that strengthening product value not only improves perceived quality and market differentiation but also serves as a gateway to further developing innovation capabilities. The visualization of Module 1 in Figure 5 shows how the Product Value concept is translated into an operational module structure, from the definition of product value and learning objectives to economic, social, and environmental benefits. Thus, Module 1 serves as a foundation for learning that prepares MSMEs to develop other dimensions of green innovation in a gradual, integrated manner in subsequent modules.
To ensure that Product Value strengthening is not only conceptually understood, but Module 1 is also designed with practice-based learning activities that allow MSMEs to directly reflect on the condition of their products before the training intervention is carried out. One example of implementing this activity is the Existing Product Analysis (Baseline PV Assessment), which aims to identify the initial condition of MSME product value as a starting point for the learning process and continuous improvement. At this stage, participants are asked to conduct a self-assessment of the main product, using the Product Value Assessment Sheet (Pre-Test). This worksheet is structured around the Product Value dimensions used in the PLS-SEM model, including environmentally friendly materials, environmental appeal to consumers, contribution to environmental conservation, unique cultural values, and compliance with environmentally friendly production principles. With this approach, the learning instruments used in the module directly reflect the empirical constructs tested in the research. Figure 6 shows the activity structure of Module 1, including learning objectives, implementation steps, and expected outcomes, along with an example participant worksheet as an initial measurement tool (baseline). Through this activity, MSMEs not only gain an initial understanding of their product’s value proposition but also systematically identify weaknesses and opportunities for improvement. This reflection-based and practice-based learning approach strengthens the internalization of sustainability-based product values . It serves as a foundation for developing other dimensions of green innovation in subsequent modules.
Another key finding in this study is the role of organizational performance as a key mediator between green innovation and ecosystem performance. This indicates that green innovation will only impact ecosystem productivity and resilience if accompanied by improvements in operational and financial governance of MSMEs. International literature confirms that operational and financial performance are key enablers of MSME sustainability, enabling small businesses to absorb innovation, manage risk, and survive in the dynamic tourism market [46,47]. Therefore, an Organizational Performance module was developed to strengthen MSMEs’ capabilities in managing production processes, reducing defects, calculating COGS and BEP, and managing cash flow more systematically.
In the final stage, the Ecosystem Performance dimension, reflected through productivity and resilience, was developed into an integrative module emphasizing a systems thinking approach. This module helps MSMEs understand their role as core actors in the village tourism ecosystem and build adaptive capacity to withstand fluctuations in demand, external pressures, and environmental changes. This approach aligns with the sustainable tourism literature, which emphasizes that destination resilience depends heavily on local actors’ capacity to sustain collective productivity and resilience through innovation and collaboration [51].
To ensure the sustainability, scalability, and accessibility of the research results, all modules, compiled in PDF format, were then integrated into the visitdesasumba.com digital platform. The use of this digital platform is supported by international literature, which confirms that digital tourism platforms function not only as promotional media but also as knowledge dissemination platforms that accelerate knowledge transfer, expand access to learning, and strengthen sustainable practices in MSMEs [51,52]. In the context of 3T regions, digitizing modules is a strategic solution to overcome geographic limitations and limited access to face-to-face training.
Through visitdesasumba.com, training modules can be accessed independently by MSMEs, facilitators, and other stakeholders, enabling a sustainable learning process independent of short-term interventions. This platform also serves as an integrated space for learning, innovation, and MSME product promotion, thereby supporting the simultaneous creation of economic and social value. Recent studies have shown that the digitalization of tourism MSMEs positively contributes to increased innovation, performance, and ecosystem sustainability when supported by relevant and contextual learning content [46,47]. Figure 7 shows the main page (dashboard) of visitdesasumba.com, which serves as an integrative medium for destination promotion, cultural narratives, and green innovation-based learning contexts. This platform is designed to support sustainable access to knowledge and innovation by MSMEs in tourist villages, particularly in the 3T regions, through a contextual and inclusive digital approach.
As part of the digital platform architecture, visitdesasumba.com offers a special Modules & Catalog feature that serves as a knowledge dissemination platform and a self-learning resource for MSMEs. This feature serves as a meeting point between the empirical results of PLS-SEM and field practice, enabling each training module, developed along the dimensions of green innovation, organizational performance, and ecosystem performance, to be accessed in a structured, gradual manner. With this approach, the learning process does not depend on short-term, face-to-face training but can be ongoing, flexible, and repeatable to meet the needs of MSMEs. Figure 8 shows the Modules & Catalog feature on the visitdesasumba.com platform, which contains training modules in PDF format, including Product Value, Technology, Networking, Market Demand Insight, Sustainable Marketing, Organizational Performance, and Ecosystem Performance. This feature is designed to facilitate structured, gradual, and context-specific self-learning, translating PLS-SEM analysis results into digital interventions that support the sustainability of MSMEs and the tourism village ecosystem.
Theoretically, this study extends the contribution of PLS-SEM studies by demonstrating how empirical model results can be translated into implementable instruments for modules and digital platforms. In practice, integrating training modules into visitdesasumba.com strengthens MSMEs in tourism villages’ readiness to adopt green innovation, improves organizational performance, and contributes to sustainably enhancing ecosystem performance. Thus, this study presents a clear, integrated implementation path that links SEM-based empirical model testing with the development of evidence-based training modules and their digitalization through tourism platforms, making it a relevant approach for developing MSMEs and sustainable tourism destinations, especially in the context of 3T regions.
6. Conclusions
This study examines the role of green innovation in improving the performance of tourism MSMEs and its implications for strengthening the sustainable tourism ecosystem in East Sumba Regency. This region has high potential for cultural and nature-based tourism, but still faces limitations in innovation capacity and business performance. Focusing on the 3T (Frontier, Outermost, and Underdeveloped) regions makes this study relevant for understanding how an environmentally oriented innovation approach can strengthen MSMEs while supporting the sustainability of the tourism destination ecosystem.
Based on the results of the PLS-SEM analysis, this study shows that green innovation, represented by product value, technology, networking, marketing, and market demand insight, has a positive and significant impact on the organizational performance of tourism MSMEs. Improved organizational performance, reflected in operational and financial aspects, further contributes significantly to strengthening the ecosystem’s performance, as demonstrated by increased productivity and resilience. These findings suggest that green innovation does not directly affect the ecosystem but rather strengthens the internal performance of MSMEs, key actors in the village tourism system.
The research results also show that product value is the most dominant dimension in shaping green innovation. This finding indicates that strengthening product value grounded in local culture and sustainability principles is the primary foundation for increasing the competitiveness of tourism MSMEs in the 3T regions. Furthermore, insights into technology, networking, and market demand help enhance MSMEs’ adaptability to changing tourist preferences and market dynamics. At the same time, sustainable marketing supports more effective communication of green values and local identity to tourists. Overall, the combination of these five dimensions indicates that green innovation in tourism MSMEs is multidimensional and requires integrated capability development.
In addition to producing empirical findings, this research also produced implementable outputs, including the development of thematic training modules directly derived from the PLS-SEM analysis, specifically the significant relationships between green innovation constructs and dimensions and organizational performance. These modules are structured around empirically proven dimensions and subsequently integrated into the visitdesasumba.com digital platform. This integration provides a sustainable, context-based learning approach for tourism MSMEs. It demonstrates how SEM-based quantitative research findings can be systematically translated into practical interventions to support business capacity building and destination ecosystems. This approach offers practical benefits for MSMEs, business facilitators, and local governments in designing more targeted and sustainable green innovation-based tourism development programs.
However, this study has several limitations. The cross-sectional nature of the data used prevents it from capturing the dynamics of change in green innovation, MSME performance, and the tourism ecosystem over the long term. The study’s geographic context, limited to East Sumba Regency, also limits the generalizability of its findings to other regions with different social and cultural characteristics and levels of digital readiness.
Given these limitations, future research is recommended to employ a longitudinal design to observe the transformation of tourism MSMEs over time. Further research could also expand the study context to other tourism villages or non-3T areas to test the model’s consistency and to explore the role of advanced digital technologies, such as data-driven tourism platforms and artificial intelligence, in systematically strengthening the adoption of green innovation. With this development, studies on green innovation and sustainable tourism are expected to provide a broader contribution to strengthening MSMEs and the tourism ecosystem in various contexts.
6.1. Theoretical Implication
Theoretically, this study makes an essential contribution to the literature on green innovation, SME performance, and tourism ecosystems in several key ways. First, it strengthens the Resource-Based View (RBV) framework by demonstrating that green innovation can be positioned as a valuable, difficult-to-imitate, and contextually relevant strategic internal capability for tourism MSMEs. The empirical finding that green innovation significantly influences organizational performance supports the argument that green innovation is not simply a response to regulatory or market pressures, but rather a source of sustainable competitive advantage.
Second, this study broadens our understanding of the mediating mechanisms in the relationship between innovation and ecosystem performance. By positioning organizational performance as the primary mediator between green innovation and ecosystem performance, this study demonstrates that green innovation’s impact is indirect and depends on the organization’s ability to internalize it into operational and financial practices. These findings enrich the PLS-SEM literature in tourism by providing strong empirical evidence of a multi-stage causal mechanism in the context of MSMEs.
Third, this study contributes to the methodological literature by demonstrating that PLS-SEM model results not only serve as a theoretical confirmation tool but also provide a basis for designing evidence-based interventions. The transformation of latent constructs into thematic learning modules demonstrates how quantitative research can be operationalized into concrete capability-building instruments, bridging the gap between academic research and field practice.
6.2. Practical Implication
Practically, this study offers direct implications for MSMEs, local governments, business facilitators, and tourism destination managers, particularly in 3T regions. First, the findings emphasize that strengthening tourism-oriented MSMEs should be pursued through a modular capacity-building approach that focuses on the development of specific capabilities, rather than through generic, one-off training programs. Training modules structured around the dimensions of green innovation enable a more systematic, incremental, and context-sensitive learning process, allowing MSMEs to build capabilities in accordance with their needs and levels of readiness.
Second, the integration of training modules into the digital platform visitdesasumba.com offers a practical solution to challenges related to geographical constraints, limited access, and the sustainability of training programs in 3T regions. This digital platform functions not only as a destination promotion medium but also as a knowledge dissemination platform, facilitating self-directed learning, repeated access to learning materials, and the wider diffusion of green innovation practices. Such an approach enhances the sustainability of the study’s impact, as learning processes are no longer dependent on physical presence or short-term interventions.
Third, for policymakers, this study provides empirical foundations for designing more targeted green innovation–based tourism MSME development programs. Rather than fragmented interventions, policy efforts can be directed toward strengthening culturally embedded product value, promoting the adoption of environmentally friendly technologies appropriate to the MSME scale, reinforcing penta-helix collaboration networks, and leveraging digital platforms as integrated infrastructures for learning and promotion. Accordingly, the findings support the formulation of more inclusive, adaptive, and evidence-based policies for sustainable tourism development.
6.3. Limitation and Future Research
Although this study provides strong empirical findings, several limitations require attention in interpretation and further research. First, the cross-sectional design of the study prevents the analysis from capturing the dynamics of changes in green innovation, organizational performance, and ecosystem performance over time. Second, the study was conducted in a specific geographic context, namely East Sumba Regency. Hence, generalizations to other regions require caution, given differences in social, cultural, and digital readiness across areas. Third, the variables used were largely perceptual, potentially subjecting them to respondent bias. Future research is recommended to use a longitudinal design to observe the transformation of MSMEs over time, including objective variables such as revenue growth, energy efficiency, or carbon footprint, and expand the research context to other tourism villages to test the model’s consistency. Furthermore, further research could explore the role of digital technologies, such as green marketplaces, supply chain management systems, or AI-based tourism platforms, in systematically strengthening the adoption of green innovation.
Author Contributions
Conceptualization, A.A.R.; methodology, A.A.R., M.AP., M,.D.A., and I.D.N.; software, A.A.R. and I.Z.; validation, A.S.R. and M.A.; formal analysis, A.S.R., M.A., and I.D.N.; investigation, A.A.R., A.S.R., and M.A.; resources, A.A.R., M.A.P., and M.D.A.; data curation, A.A.R, A.S.R, and M.A.; writing—original draft preparation, A.S.R., M.A. and I.D.N; writing—review and editing, A.A.R., M.A.P., and M.D.A.; visualization, A.S.R., M.A., I.Z. and I.D.N; supervision, A.A.R., M.A.P., and M.D.A.; project administration, A.A.R., A.S.R., and M.A.; funding acquisition, A.A.R. All authors have read and agreed to the published version of the manuscript.
Funding
This research was funded by Telkom University, Indonesia, under the institutional research grant scheme, Decree No. 331/LIT06/PPM-LIT/2025. The APC was funded by Telkom University, Indonesia.
Institutional Review Board Statement
Ethical review and approval were waived for this study because it involved non-invasive procedures, anonymous survey data, and voluntary participation of adult respondents, and did not include any sensitive personal or clinical information.
Informed Consent Statement
Informed consent was obtained from all subjects involved in the study. Participation was voluntary, and respondents were informed about the purpose of the study and the confidentiality of their responses.
Data Availability Statement
The data supporting the findings of this study are available from the corresponding author upon reasonable request. The data are not publicly available due to confidentiality agreements with the participating MSMEs and ethical considerations.
Acknowledgments
The authors would like to acknowledge the support and cooperation of the MSME actors, village tourism managers, and local stakeholders in East Sumba Regency who participated in this study. The authors also thank all facilitators and field assistants for their support during data collection and training activities. The authors gratefully acknowledge Telkom University, Indonesia, for its institutional support and contribution to the research implementation. During the preparation of this manuscript, the authors used ChatGPT (OpenAI) for language editing and improving the clarity and structure of the text. The authors have reviewed and edited the content and take full responsibility for the accuracy and integrity of the work.
Conflicts of Interest
The authors declare no conflicts of interest.
Appendix A

Table A1.
Ecosystem Performance Construct Specification.
| Variable | Dimension | Definition | Code | Item |
|---|---|---|---|---|
| Ecosystem Performance | Productivity | The ability of MSMEs to generate competitive, efficient, and value-added tourism outputs (products and services) to support the ecosystem | PD1 | Our business is able to increase production output or sales each year. |
| PD2 | We use raw materials, labor, and capital efficiently. | |||
| PD3 | Our products or services have advantages compared to competitors. | |||
| PD4 | We frequently innovate in the products or services we offer. | |||
| PD5 | The number of customers or tourists using our products or services continues to increase. | |||
| Resilience | The ability to survive, recover, and adapt to external disruptions (economic crises, pandemics, market changes, or environmental pressures) to support the ecosystem | RS1 | Our business is able to survive despite difficult situations (e.g., pandemics or economic crises). | |
| RS2 | We can recover quickly after facing major business problems. | |||
| RS3 | We offer more than one type of product or service to reduce the risk of losses. | |||
| RS4 | We receive support from the community, government, or other institutions during difficult times. | |||
| RS5 | We can easily adjust our operations and strategies when market conditions change. |
Table A2.
Organizational Performance Construct Specification.
| Construct | Dimension | Definition | Code | Item | |
|---|---|---|---|---|---|
| Organizational Performance | Financial Performance | The organization’s ability to manage profits, revenues, and investments consistently to support business growth and sustainability. | FP1 | My business’s net profit has increased over the past year. | |
| FP2 | Sales of my products/services grow from year to year. | ||||
| FP3 | My business is able to maintain a balance between costs and revenues. | ||||
| FP4 | My business income has increased steadily. | ||||
| FP5 | I evaluate investment costs against the value generated. | ||||
| Operational Performance | The organization’s ability to conduct business activities efficiently, productively, and on time to meet customer satisfaction and maintain competitiveness. | OF1 | Customer reviews/ratings of my business have improved year by year. | ||
| OF2 | Production/service targets set by the organization were consistently achieved during the past year. | ||||
| OF3 | Our company delivers products/services on time. | ||||
| OF4 | The quality of our products/services is better than that of local competitors. | ||||
| OF5 | Sales have increased over the past 12 months. |
Table A3.
Green Innovation Construct Specification.
| Construct | Dimension | Definition | Code | Item | |
|---|---|---|---|---|---|
| Green Innovation | Product Value | Value added to products through green innovation practices | PV1 | The products I produce use more environmentally friendly materials compared to conventional materials. | |
| PV2 | Consumers are more interested in purchasing my products because they consider environmental aspects. | ||||
| PV3 | Environmental considerations increase consumers’ interest in my products. | ||||
| PV4 | My products have distinctive appeal because they support environmental conservation. | ||||
| PV5 | Most of my products incorporate environmentally friendly aspects in materials or production processes. | ||||
| Technology | Technologies used to improve production efficiency, reduce waste and pollution, and support green innovation implementation | TC1 | My business has its own facilities or methods to manage waste without polluting the environment. | ||
| TC2 | My business utilizes shared facilities (e.g., government or community facilities) for managing production waste. | ||||
| TC3 | I have access to training or information on environmentally friendly technologies. | ||||
| TC4 | My business conducts recycling of production waste so it can be reused. | ||||
| TC5 | I use energy-efficient tools or machines that generate minimal pollution. | ||||
| Networking | Collaboration networks among MSMEs and external stakeholders (government, academia, communities, and customers) established to support green innovation | NW1 | I have access to training or information on environmentally friendly technologies through networks. | ||
| NW2 | There are organizations, communities, or associations that help MSMEs like mine share experiences on environmentally friendly business practices. | ||||
| NW3 | I collaborate with external parties (government, training institutions, universities, or NGOs) to develop sustainable businesses. | ||||
| NW4 | I actively participate in activities, training, or forums related to environmentally friendly innovation for businesses. | ||||
| NW5 | Through collaboration networks, I gain new knowledge or ideas to improve business processes toward greater environmental sustainability. | ||||
| Marketing | MSMEs’ efforts to identify market needs and preferences and implement promotional strategies to support green innovation. | MK1 | I obtain information on market needs and preferences from within the business (employees, production team, or sales staff). | ||
| MK2 | I obtain information on market needs and preferences from external sources (customers, suppliers, or business partners). | ||||
| MK3 | My customers often provide ideas or feedback for developing environmentally friendly products. | ||||
| MK4 | Most ideas for new products come from observing market trends and customer information. | ||||
| MK5 | I promote products by highlighting environmental benefits, such as natural materials or eco-friendly processes. | ||||
| Market Demand | Market needs and preferences for environmentally friendly products and services | MD1 | An increasing number of consumers are interested in purchasing the environmentally friendly products I produce. | ||
| MD2 | My customers have increasing knowledge about the quality of environmentally friendly products. | ||||
| MD3 | Demand for environmentally friendly products or services increases over time. | ||||
| MD4 | I adjust my products or services based on market feedback and sustainability-related needs. | ||||
| MD5 | I monitor market trends and changes in consumer preferences to ensure my products remain aligned with green market demand. |
References
- Achmad, F.; Prambudia, Y.; Rumanti, A.A. Sustainable Tourism Industry Development: A Collaborative Model of Open Innovation, Stakeholders, and Support System Facilities. IEEE Access 2023, 11, 83343–83363. [Google Scholar] [CrossRef]
- World Travel & Tourism Economic World Travel & Tourism Economic Impact 2025. In World Travel & Tourism Economic; 2025.
- Primayesa, E.; Widodo, W.; Sugiyanto, F.X. Tourism and Economic Growth Nexus In Indonesia: The Dynamic Panel Data Approach. Regional Science Inquiry 2019, XI, 83–91. [Google Scholar]
- Snapshot; Minister of Tourism Indonesia Tourism. Beyond Recovery: Toward Transformation in Indonesia’s Tourism Resiliency. In Minister of Tourism Indonesia; 2025; Volume 1. [Google Scholar]
- Rizaldi, A.S.; Rumanti, A.A.; Andrawina, L. Sustainable Tourism Industry in Indonesia through Mapping Natural Tourism Potential: Taxonomy Approach. Sustainability 2024, 16, 4201. [Google Scholar] [CrossRef]
- Fowler, C.T. Customary Rights and Freshwater Ecology in Pluralistic Societies on the Monsoonal Island of Sumba (Eastern Indonesia). Front Environ Sci 2022, 10. [Google Scholar] [CrossRef]
- Husnaini, A. Marketing Strategy for Ecotourism Products in Labuan Bajo, East Nusa Tenggara. International Journal of Sustainable Competitiveness in Tourism 2023, 2, 65–76. [Google Scholar] [CrossRef]
- Sari, W.P.; Pandrianto, N.; Sukendro, G.G.; Azeharie, S.; Irena, L. Development Model of Tourism Communication and Creative Economy Based on Local Culture in East Sumba. Jurnal Komunikasi 2023, 15, 418–432. [Google Scholar] [CrossRef]
- Randjawali, E.; Lalupanda, E.M.; Enda, R.R.H.; Bano, V.O.; Nggaba, M.E.; Pakereng, Y.M.; Kaka, A.; Lulu, V.S.L. Evaluation of the Implementation of the Ideal Online Learning System in Frontier, Outermost, and Disadvantaged Regions (3T). Jurnal Kependidikan: Jurnal Hasil Penelitian dan Kajian Kepustakaan di Bidang Pendidikan, Pengajaran dan Pembelajaran 2022, 8, 592. [Google Scholar] [CrossRef]
- Rachmawati, A.; Sari, S.P.; Buditomo, A.S. Community Based Tourism Approach Implements One Stop Services Tourism in the Development of Watuhadang Tourism Village, Umalulu District, East Sumba Regency. In Proceedings of the Proceedings of the International Conference on Business, Accounting, Banking, and Economics (ICBABE 2022), 2023; Springer Nature; pp. 56–66. [Google Scholar]
- Achmad, F.; Prambudia, Y.; Rumanti, A.A. Improving Tourism Industry Performance through Support System Facilities and Stakeholders: The Role of Environmental Dynamism. Sustainability (Switzerland) 2023, 15. [Google Scholar] [CrossRef]
- Indrawati, H.; Caska, H.; Suarman, H. Barriers to Technological Innovations of SMEs: How to Solve Them? International Journal of Innovation Science 2020, 12, 545–564. [Google Scholar] [CrossRef]
- Lopes, J.M.; Oliveira, M.; Lopes, J.; Zaman, U. Networks, Innovation and Knowledge Transfer in Tourism Industry: An Empirical Study of Smes in Portugal. Soc Sci 2021, 10. [Google Scholar] [CrossRef]
- Rumanti, A.A.; Rizaldi, A.S.; Amelia, M. Green Innovation toward Knowledge Sharing and Open Innovation in Indonesian SMIs. Proceedings of the 2024 IEEE International Conference on Industrial Engineering and Engineering Management (IEEM); IEEE 2024, Vol. 2, 147–151. [Google Scholar]
- Shahbaz, M.H.; Ahmad, S.; Malik, S.A. Green Intellectual Capital Heading towards Green Innovation and Environmental Performance: Assessing the Moderating Effect of Green Creativity in SMEs of Pakistan. International Journal of Innovation Science 2025, 17, 683–704. [Google Scholar] [CrossRef]
- Sobaih, A.E.E.; Hasanein, A.; Elshaer, I. Influences of Green Human Resources Management on Environmental Performance in Small Lodging Enterprises: The Role of Green Innovation. Sustainability (Switzerland) 2020, 12, 1–19. [Google Scholar] [CrossRef]
- Mugellini, G.; Villeneuve, J.P.; Heide, M. Monitoring Sustainable Development Goals and the Quest for High-Quality Indicators: Learning from a Practical Evaluation of Data on Corruption. Sustainable Development 2021, 29, 1257–1275. [Google Scholar] [CrossRef]
- Achmad, F.; Wiratmadja, I.I. Organizational Performance and Competitive Advantage in SMEs: The Role of Green Innovation and Knowledge Management. Journal of Open Innovation: Technology, Market, and Complexity 2025, 11. [Google Scholar] [CrossRef]
- Ahmed, R.R.; Akbar, W.; Aijaz, M.; Channar, Z.A.; Ahmed, F.; Parmar, V. The Role of Green Innovation on Environmental and Organizational Performance: Moderation of Human Resource Practices and Management Commitment. Heliyon 2023, 9. [Google Scholar] [CrossRef]
- Rumanti, A.A.; Samadhi, T.M.A.A.; Wiratmadja, I.I.; Reynaldo, R. Conceptual Model of Green Innovation toward Knowledge Sharing and Open Innovation in Indonesian SME. In Proceedings of the 2017 4th International Conference on Industrial Engineering and Applications (ICIEA), April 2017; IEEE; pp. 182–186. [Google Scholar]
- Rumanti, A.A.; Rizana, A.F.; Achmad, F. Exploring the Role of Organizational Creativity and Open Innovation in Enhancing SMEs Performance. Journal of Open Innovation: Technology, Market, and Complexity 2023, 9. [Google Scholar] [CrossRef]
- Rumanti, A.A.; Daryanto, Y.; Amelia, M.; Rizaldi, A.S.; Zulkarnain, I.; Andrawina, L. The Role of Organizational and Stakeholder Factors in Strengthening Digital Literacy and Communication for Edu-Tourism. Journal of Open Innovation: Technology, Market, and Complexity 2025, 11. [Google Scholar] [CrossRef]
- Nguyen, V.K.; Natoli, R.; Divisekera, S. Innovation and Productivity in Tourism Small and Medium Enterprises: A Longitudinal Study. Tour Manag Perspect 2021, 38. [Google Scholar] [CrossRef]
- Fa’rifah, R.Y.; Achmad, F.; Septiningrum, L.; Wiratmadja, I.I. Segmentation of Potential Sustainable Tourism Based on Support System Facility Perspective. In Proceedings of the Lecture Notes in Mechanical Engineering, 2023; Springer Science and Business Media Deutschland GmbH; pp. 285–291. [Google Scholar]
- Wang, Z.; Huang, W.; Guan, X. Ecosystem Resilience Trends and Its Influencing Factors in China’s Three-River Headwater Region: A Comprehensive Analysis Using CSD Indicators (1982–2023). Land (Basel) 2024, 13. [Google Scholar] [CrossRef]
- Li, Z.; Zhai, Y.; Zhang, T.; Zhou, X.; Cheng, Z.; Xu, T.; Li, C.; Hong, J. How Can Ecosystem Status Be More Comprehensively Reflected? A Case Study of Jinan City, China. Science of the Total Environment 2023, 863. [Google Scholar] [CrossRef]
- De, I.; Biswas, S.N.; Dey, D. Micro-Entrepreneurship, Institutional Environment and the COVID-19 Pandemic: A Comparison of Weaving Clusters in West Bengal, India. Journal of Entrepreneurship 2024, 33, 59–87. [Google Scholar] [CrossRef]
- Khanra, S.; Kaur, P.; Joseph, R.P.; Malik, A.; Dhir, A. A Resource-Based View of Green Innovation as a Strategic Firm Resource: Present Status and Future Directions. Bus Strategy Environ 2022, 31, 1395–1413. [Google Scholar] [CrossRef]
- Elizabeth, E.; Prabowo, H.; Bandur, A.; Setiowati, R. Harnessing Green Dynamic Capabilities for Sustainable Tourism Performance: The Mediating Role of Green Service Innovation in Bali’s Tour and Travel SMEs. Tourism and Hospitality 2025, 6. [Google Scholar] [CrossRef]
- Antara, M.E.Y.; Sugianingrat, I.A.P.W.; Martini, I.A.O. Leadership Strategy as the Driver of Achieving Sustainable Business: A Case of Endek Weaving SMEs in Indonesia. Problems and Perspectives in Management 2024, 22, 288–298. [Google Scholar] [CrossRef]
- Babu, R.J.K.; Rajeswari, P.S.; Babu, S. Threads of Unity: Elevating Performance and Commitment in Weaving Cooperatives. Qubahan Academic Journal 2025, 5, 16–43. [Google Scholar] [CrossRef]
- Sineviciene, L.; Kubatko, O.; Derykolenko, O.; Kubatko, O. The Impact of Economic Performance on Environmental Quality in Developing Countries. International Journal of Environmental Technology and Management 2018, 21, 222. [Google Scholar] [CrossRef]
- Arias-Pérez, J.; dos Santos, C.A.F.; Velez-Ocampo, J.; Zen, A.C. Beating around the Bush over Knowledge Sabotage: The Fatal Flaw in Increasing Digital Innovation Ecosystem Performance through Innovation Capability under Technological Turbulence. Journal of Strategy and Management 2024. [Google Scholar] [CrossRef]
- Rumanti, A.A.; Rizana, A.F.; Septiningrum, L.; Reynaldo, R.; Isnaini, M.M. Innovation Capability and Open Innovation for Small and Medium Enterprises (SMEs) Performance: Response in Dealing with the COVID-19 Pandemic. Sustainability (Switzerland) 2022, 14. [Google Scholar] [CrossRef]
- Mai, N.T.T.; Tuan, H.T.; Tien, N.H.; Van Tho, D.; Trang, N.T.T.; Mai, N.P. Cultural Tourism Resources: State Policy and Solutions for SMEs in Tourism Industry. Int. J. Entrepreneurship and Small Business 2023. [Google Scholar]
- Anzules-Falcones, W.; Martin-Castilla, J.I.; Tulcanaza-Prieto, A.B. Innovation Strategies and Business Networks: A PLS-SEM Analysis in Rural Tourism Entrepreneurship. Sustainability (Switzerland) 2025, 17. [Google Scholar] [CrossRef]
- Rehman, U.H.; Rehman, A.; Ahmed, Z.; Sajid, M.M.; Rehman, F.U. Importance-Performance Map Analysis of Capital Structure Using PLS-SEM: Evidence from Non-Financial Sector. In Partial Least Squares Path Modeling; Springer International Publishing: Cham, 2023; pp. 417–451. [Google Scholar]
- Kono, S.; Sato, M. The Potentials of Partial Least Squares Structural Equation Modeling (PLS-SEM) in Leisure Research. J Leis Res 2023, 54, 309–329. [Google Scholar] [CrossRef]
- Yuan, K.-H.; Deng, L. Equivalence of Partial-Least-Squares SEM and the Methods of Factor-Score Regression. Struct Equ Modeling 2021, 28, 557–571. [Google Scholar] [CrossRef]
- Schuberth, F. Confirmatory Composite Analysis Using Partial Least Squares: Setting the Record Straight. Review of Managerial Science 2021, 15, 1311–1345. [Google Scholar] [CrossRef]
- Hair, J.F.; Hult, G.T.M.; Ringle, C.M.; Sarstedt, M. A Primer on Partial Least Squares Structural Equation Modeling (PLS-SEM) Third Edition, 3rd ed.; SAGE: Thousand Oaks, CA, 2022. [Google Scholar]
- Yuan, K.-H.; Wen, Y.; Tang, J. Regression Analysis with Latent Variables by Partial Least Squares and Four Other Composite Scores: Consistency, Bias and Correction. Struct Equ Modeling 2020, 27, 333–350. [Google Scholar] [CrossRef]
- Cheah, J.-H.; Amaro, S.; Roldán, J.L. Multigroup Analysis of More than Two Groups in PLS-SEM: A Review, Illustration, and Recommendations. J Bus Res 2023, 156, 113539. [Google Scholar] [CrossRef]
- Yuan, K.-H.; Zhang, Z.; Wang, L. Signal-to-Noise Ratio in Estimating and Testing the Mediation Effect: Structural Equation Modeling versus Path Analysis with Weighted Composites. Psychometrika 2024, 89, 974–1006. [Google Scholar] [CrossRef] [PubMed]
- Elizabeth, E.; Prabowo, H.; Bandur, A.; Setiowati, R. Harnessing Green Dynamic Capabilities for Sustainable Tourism Performance: The Mediating Role of Green Service Innovation in Bali’s Tour and Travel SMEs. Tourism and Hospitality 2025, 6. [Google Scholar] [CrossRef]
- Soomro, R.B.; Memon, S.G.; Dahri, N.A.; Al-Rahmi, W.M.; Aldriwish, K.; A. Salameh, A.; Al-Adwan, A.S.; Saleem, A. The Adoption of Digital Technologies by Small and Medium-Sized Enterprises for Sustainability and Value Creation in Pakistan: The Application of a Two-Staged Hybrid SEM-ANN Approach. Sustainability (Switzerland) 2024, 16. [Google Scholar] [CrossRef]
- Zuñiga-Collazos, A.; Galvez-Albarracin, E.J.; Vera-Jaramillo, F.; Patiño-Giraldo, L.V. Digitalization, Innovation, Sustainability and Performance: A Causal Analysis Applied to Tourism MSMEs. International Journal of Innovation Studies 2025, 9, 46–59. [Google Scholar] [CrossRef]
- Bourke, J.; Roper, S. Innovation, Quality Management and Learning: Short-Term and Longer-Term Effects. Res Policy 2017, 46, 1505–1518. [Google Scholar] [CrossRef]
- Papa, A.; Chierici, R.; Ballestra, L.V.; Meissner, D.; Orhan, M.A. Harvesting Reflective Knowledge Exchange for Inbound Open Innovation in Complex Collaborative Networks: An Empirical Verification in Europe. Journal of Knowledge Management 2021, 25, 669–692. [Google Scholar] [CrossRef]
- Teece, D.J. Fundamental Issues in Strategy: Time to Reassess? Startegic Management Review 2020, 1, 103–144. [Google Scholar] [CrossRef]
- Zeqiri, A.; Ben Youssef, A.; Maherzi Zahar, T. The Role of Digital Tourism Platforms in Advancing Sustainable Development Goals in the Industry 4.0 Era. Sustainability (Switzerland) 2025, 17. [Google Scholar] [CrossRef]
- Succurro, M. Digital Transformation in Tourism SMEs: A Strategic Imperative in the Evolving Business Landscape. Res Sq 2025. [Google Scholar] [CrossRef]
Figure 1.
Research Model Elaboration Scheme (source: self-produced).
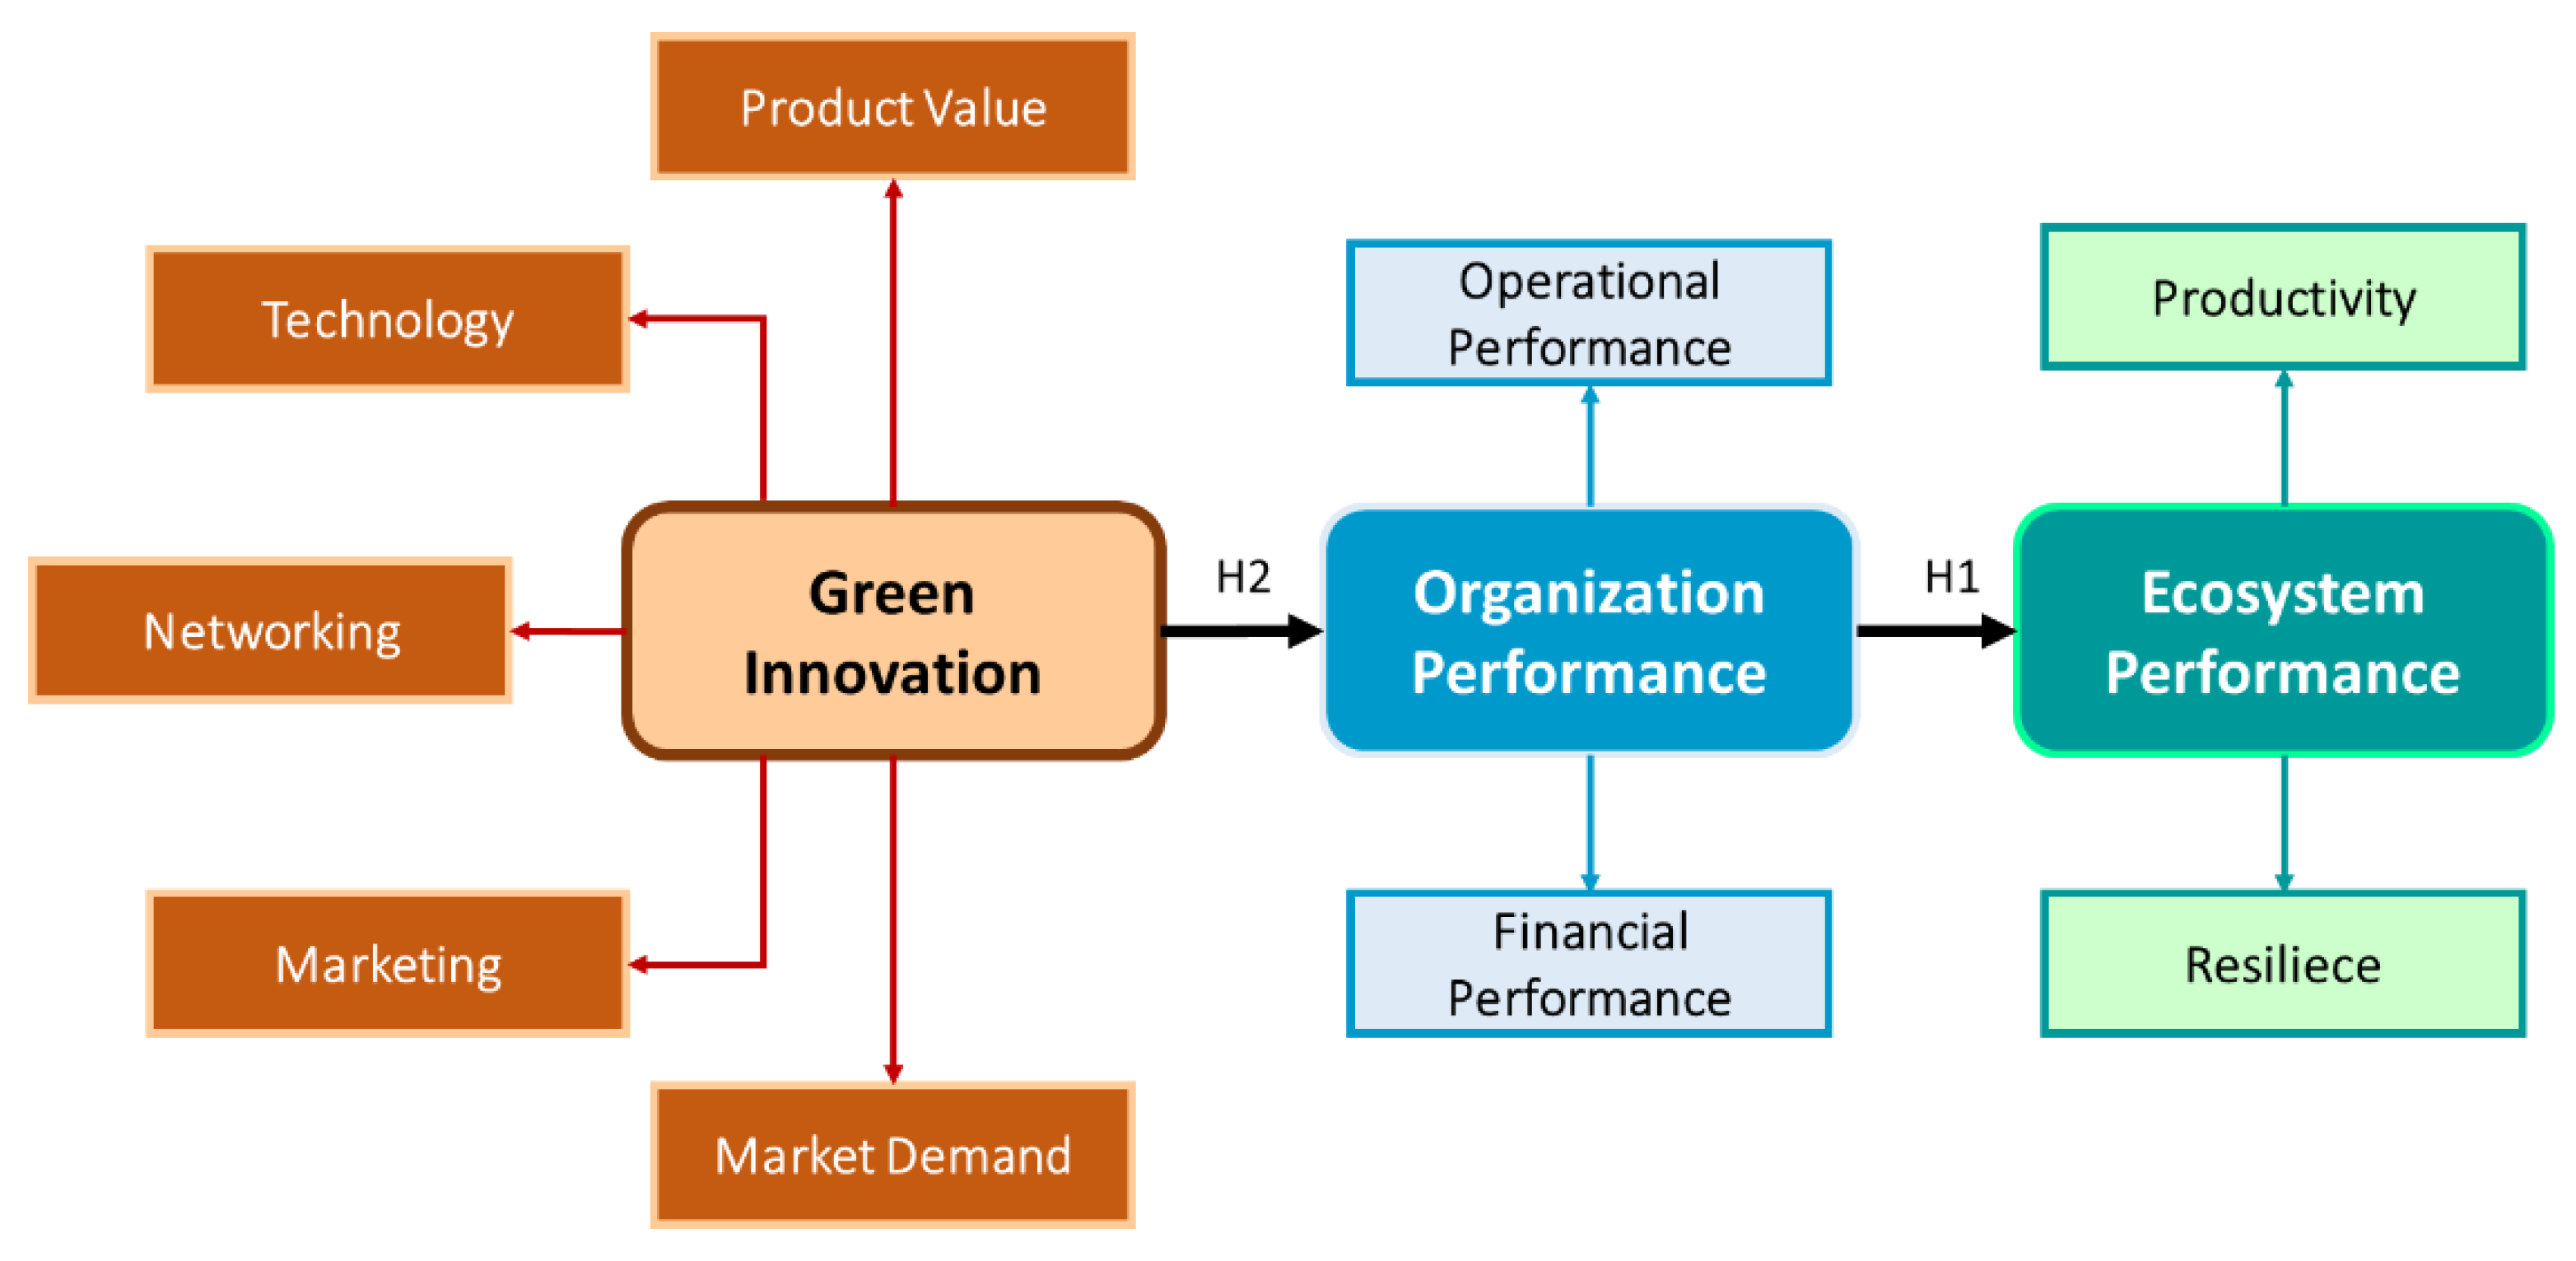
Figure 2.
Location of the selected sampling area (East Sumba Regency) (source: self-produced).
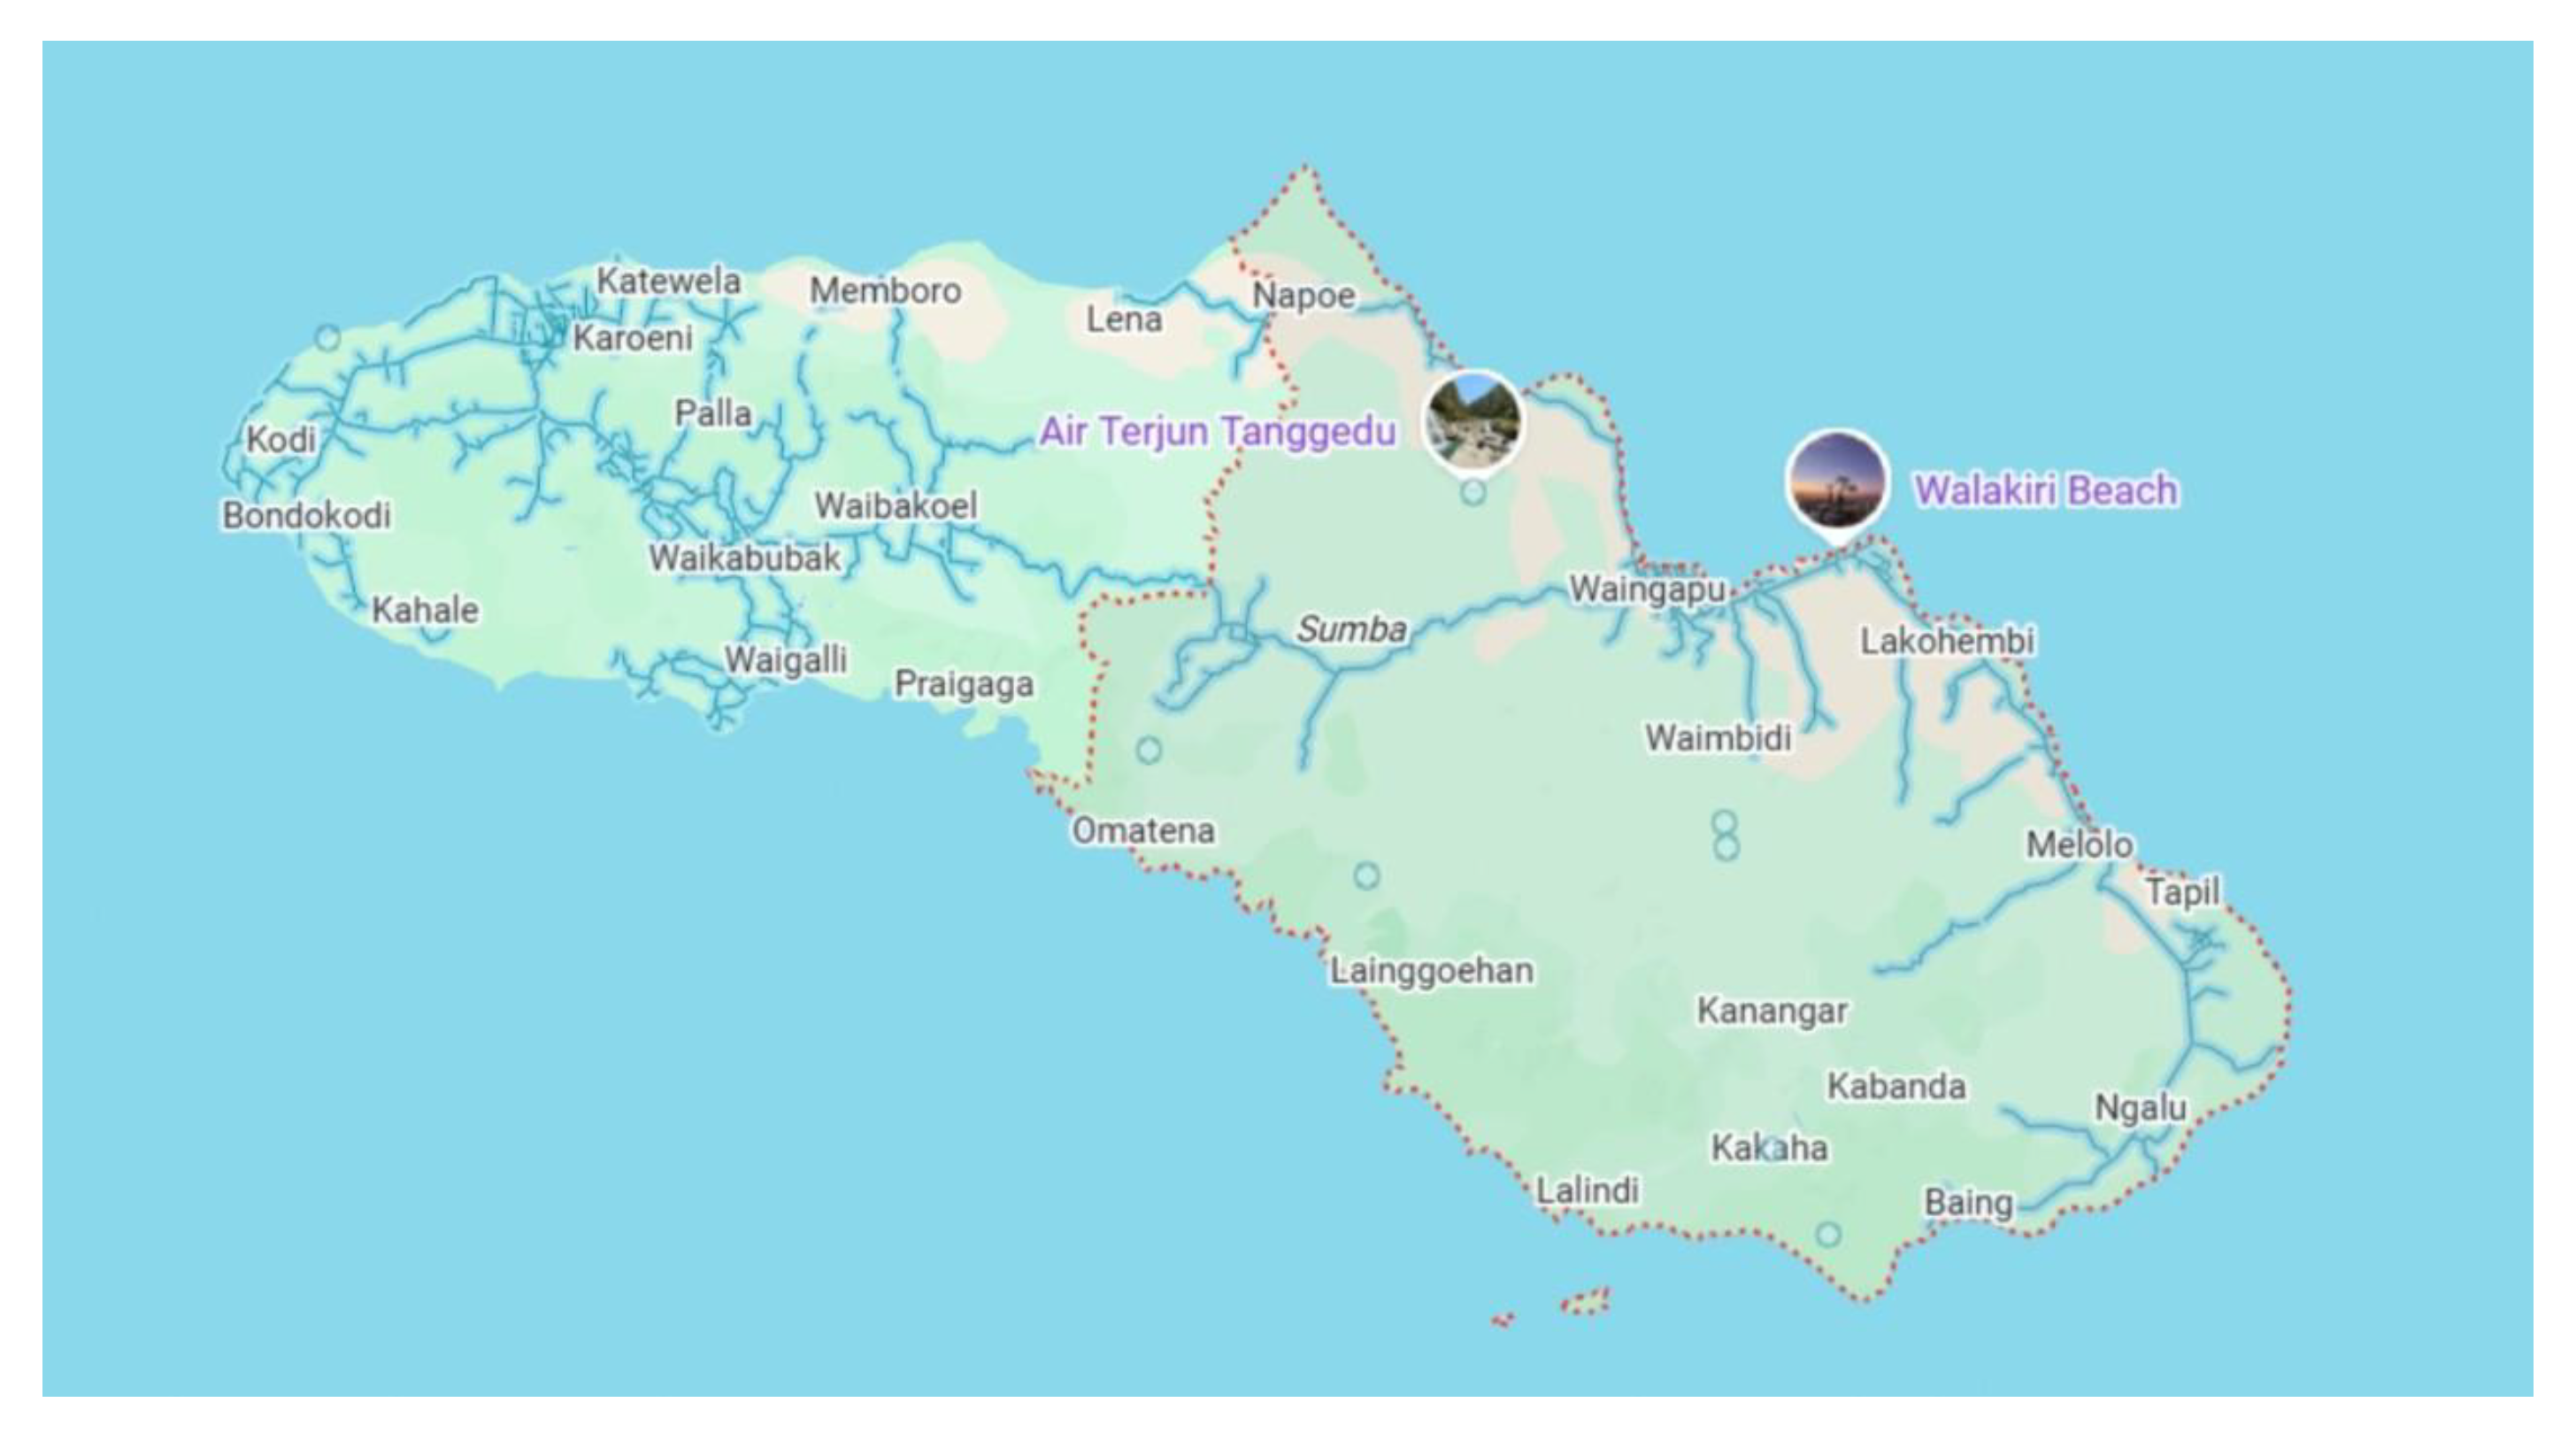
Figure 3.
Relationship significance in the structural model (source: self-produced).
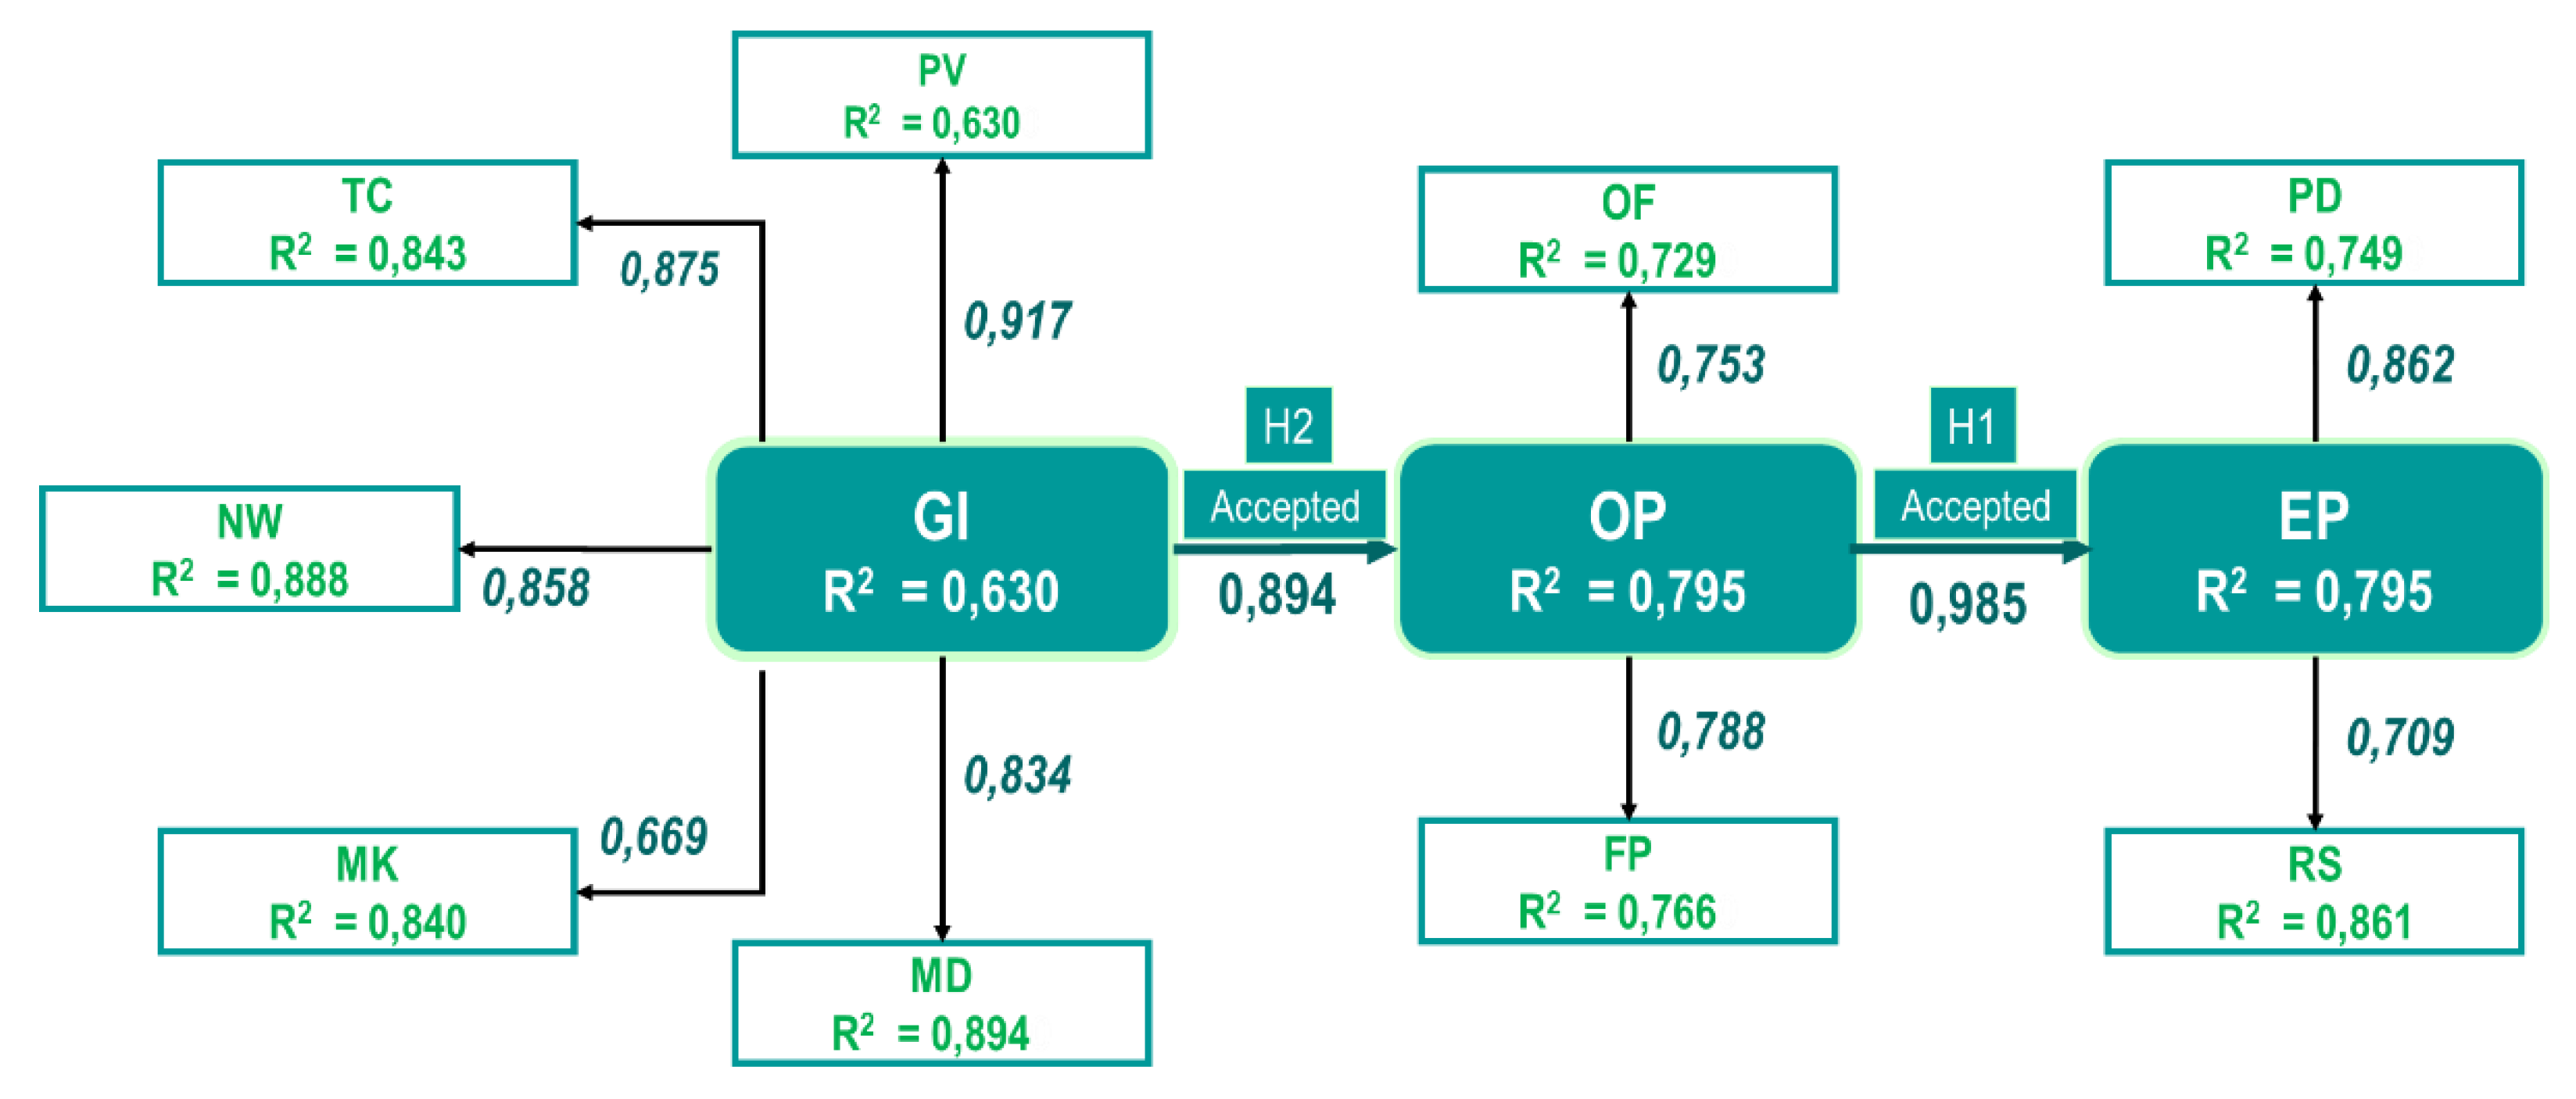
Figure 4.
Structure and Sequence of PLS-SEM Results-Based Training Modules for Strengthening Green Innovation, Organizational Performance, and Ecosystem Performance of Tourism Village MSMEs.
Figure 4.
Structure and Sequence of PLS-SEM Results-Based Training Modules for Strengthening Green Innovation, Organizational Performance, and Ecosystem Performance of Tourism Village MSMEs.

Figure 5.
Example of Implementation of Module 1: Product Value in Green Innovation for MSMEs.
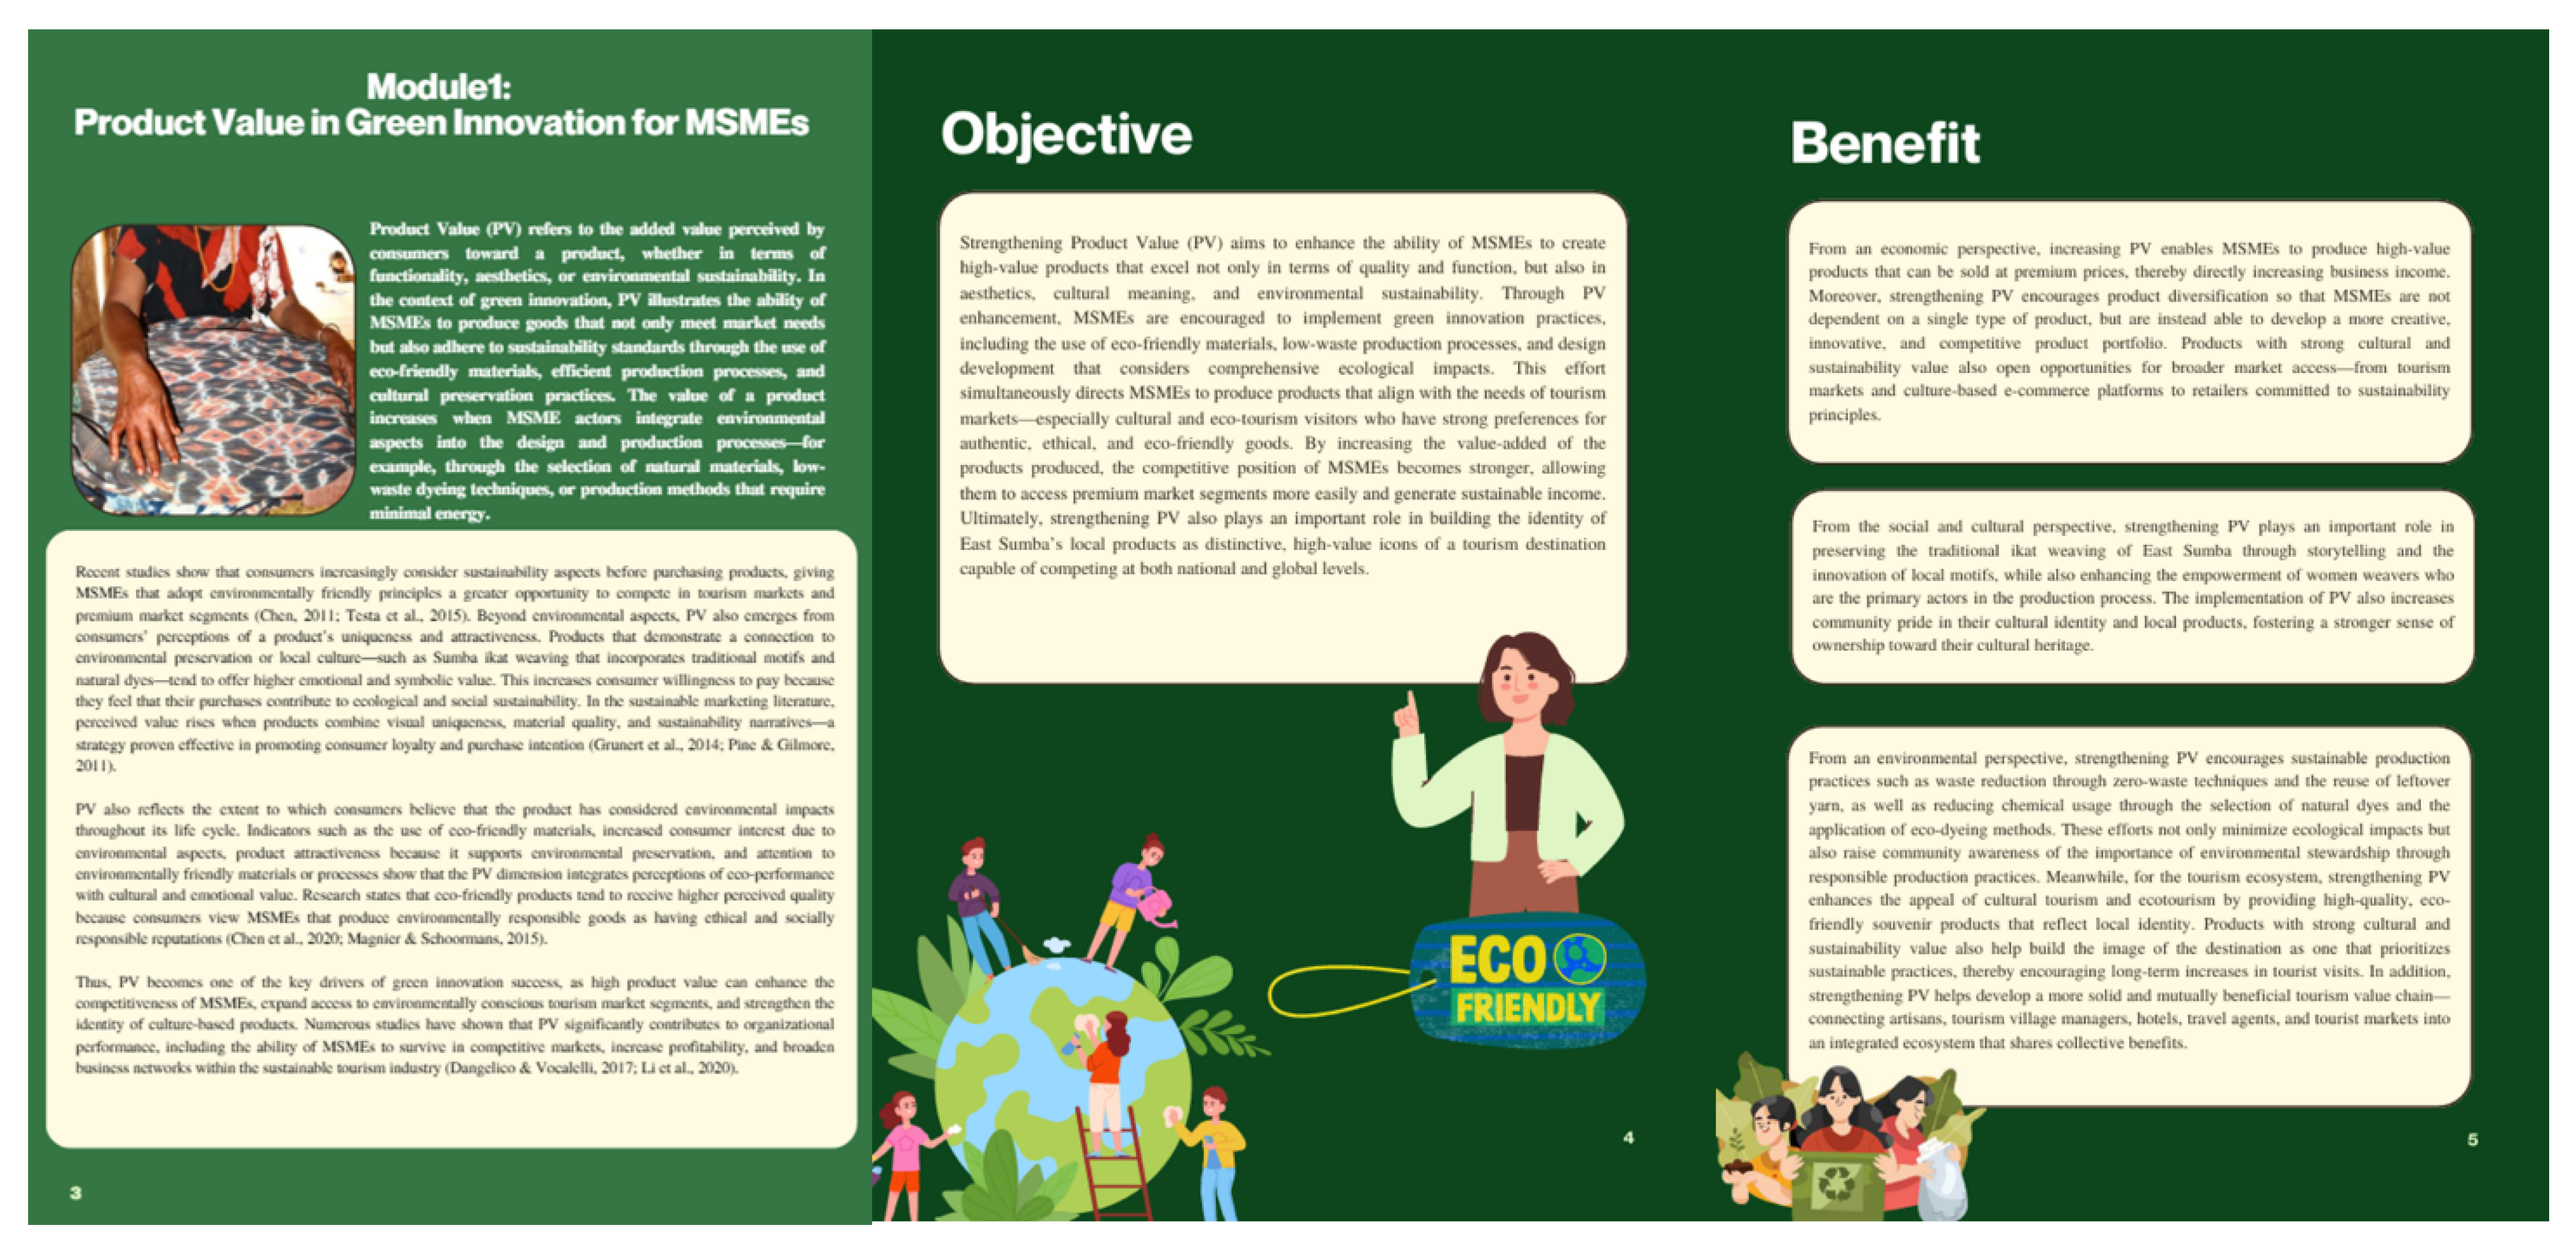
Figure 6.
Example of Learning Activities and Participant Worksheets in Module 1: Product Value in Green Innovation for MSMEs.
Figure 6.
Example of Learning Activities and Participant Worksheets in Module 1: Product Value in Green Innovation for MSMEs.
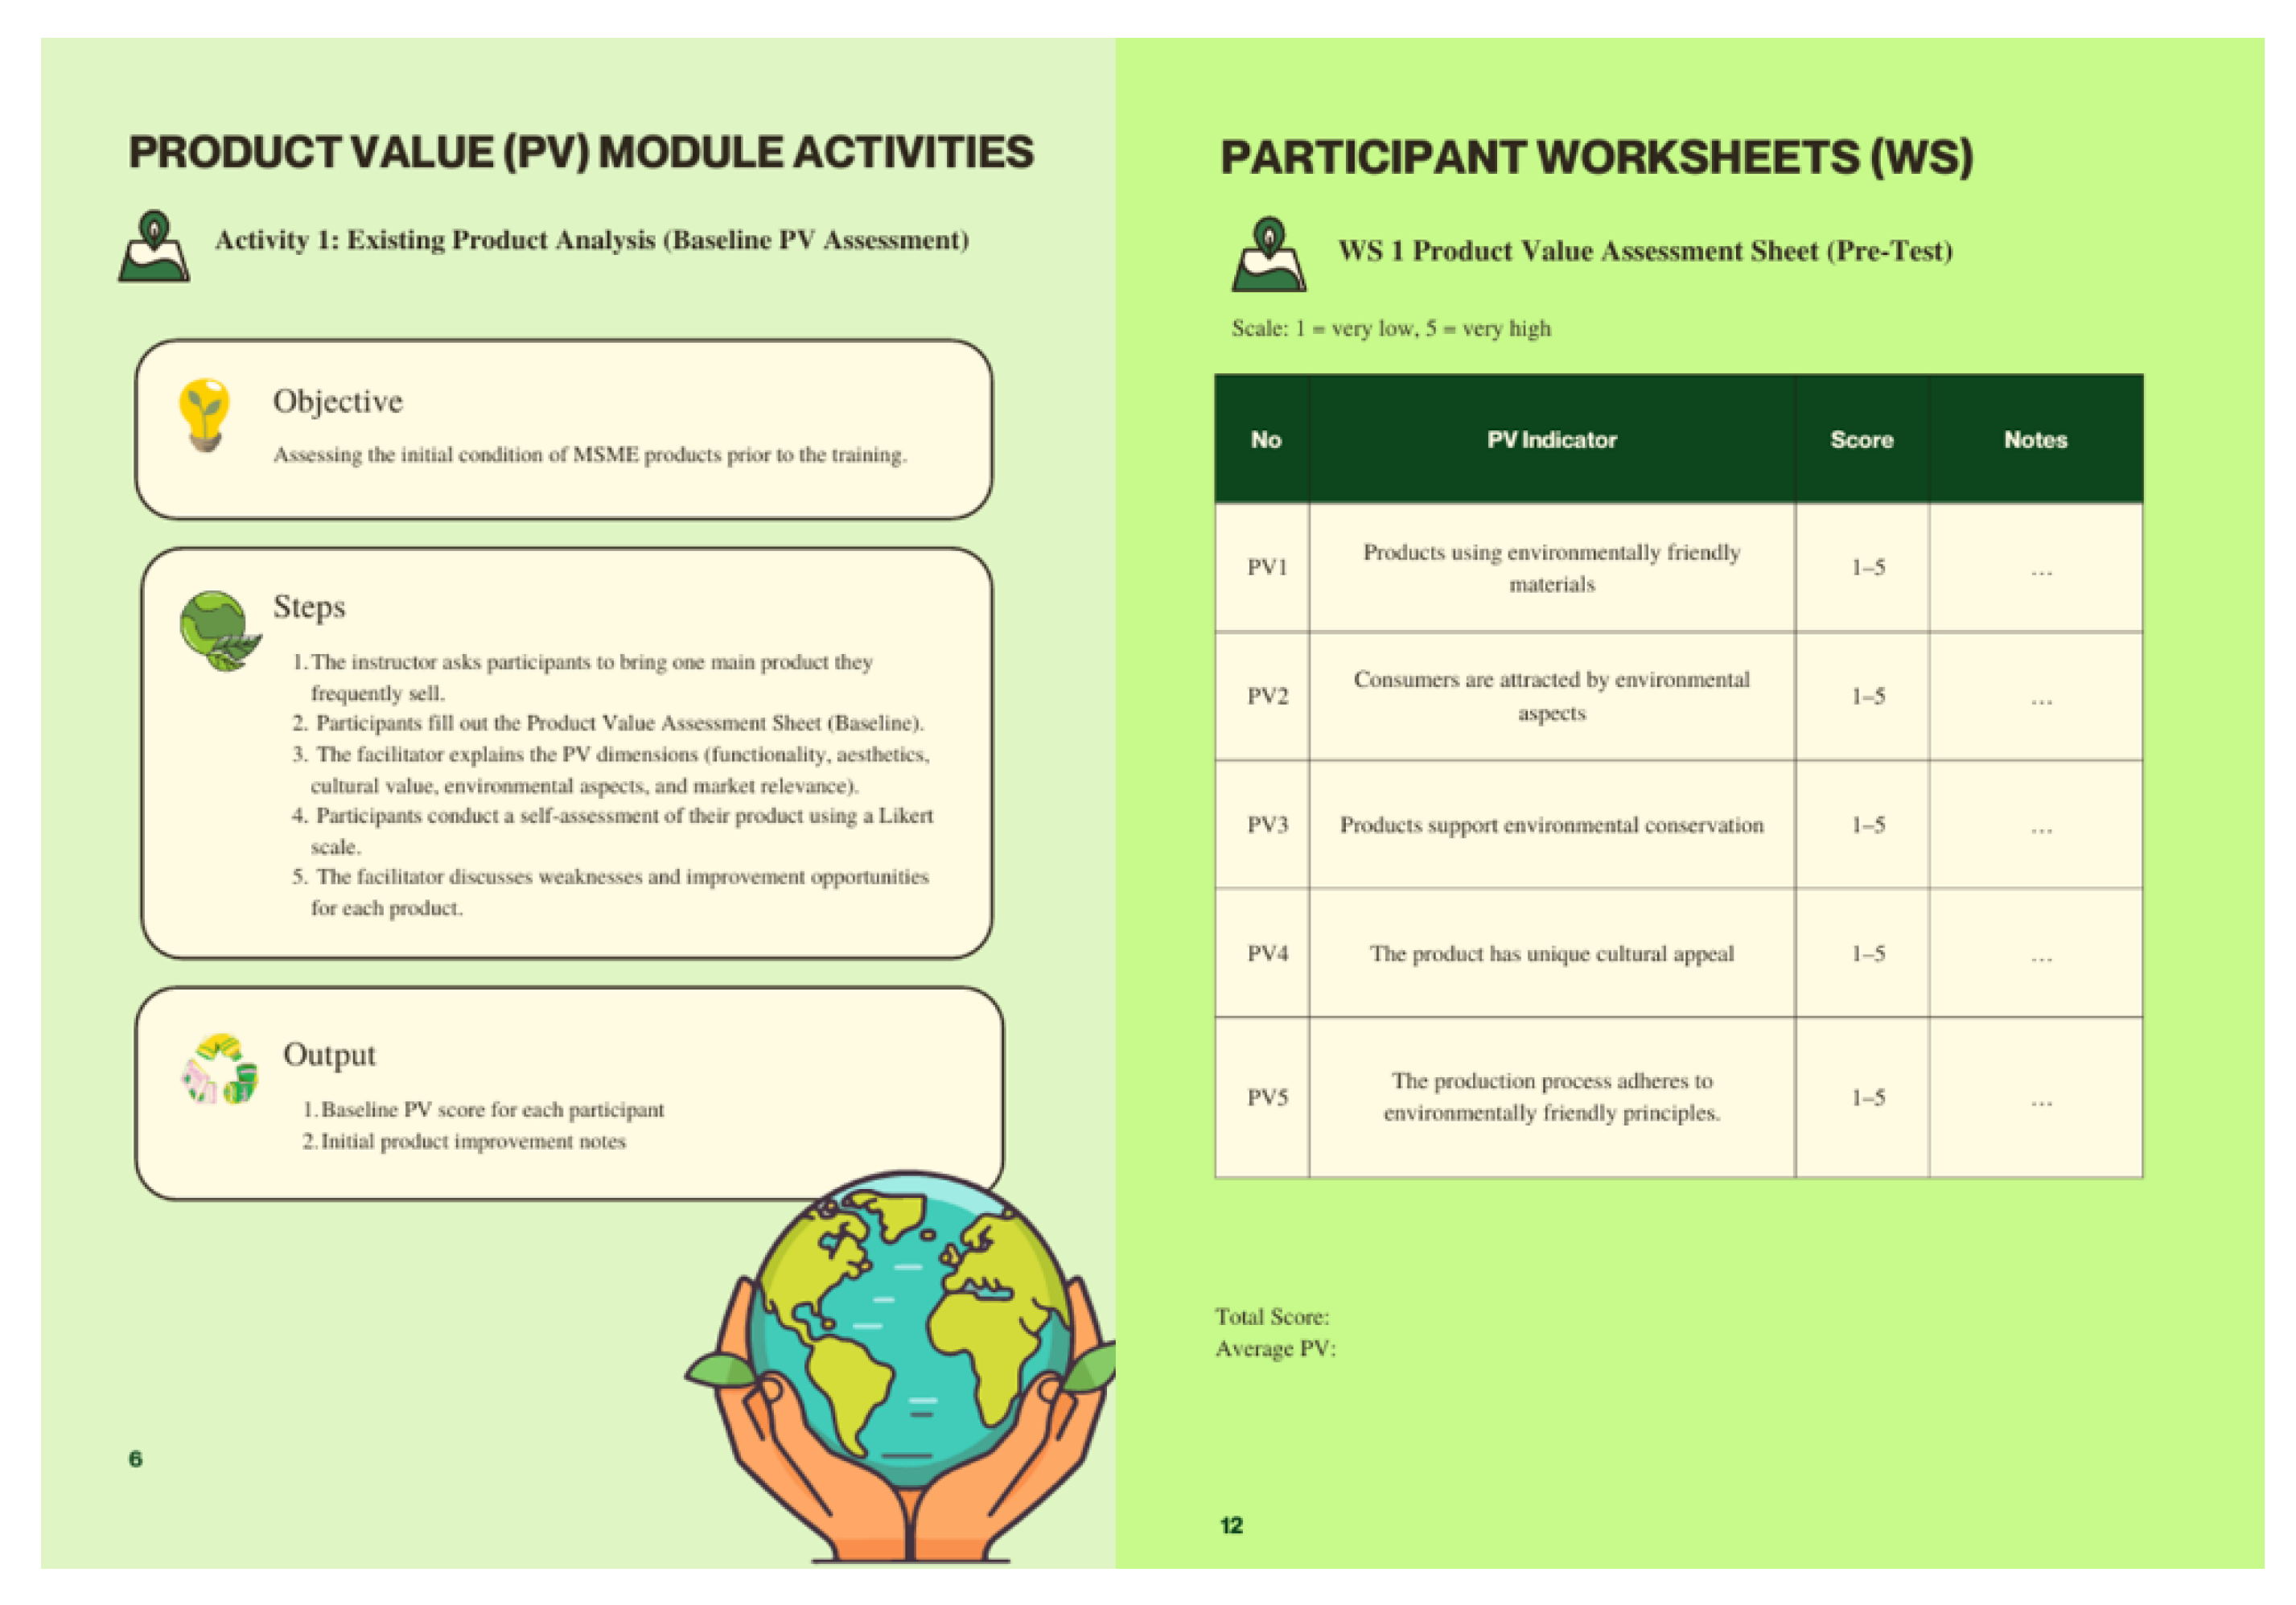
Figure 7.
The Dashboard Display of the visitdesasumba.com Digital Platform as a Media for Integrating Destinations, Knowledge, and Innovation for Tourism Village MSMEs.
Figure 7.
The Dashboard Display of the visitdesasumba.com Digital Platform as a Media for Integrating Destinations, Knowledge, and Innovation for Tourism Village MSMEs.

Figure 8.
The Modules & Catalog feature on visitdesasumba.com as a dissemination medium for PLS-SEM results-based training modules.
Figure 8.
The Modules & Catalog feature on visitdesasumba.com as a dissemination medium for PLS-SEM results-based training modules.

Table 1.
Definition of Research Construct.
| Construct | Definition |
|---|---|
| Green Innovation | A form of innovation used to create, develop, and implement environmentally friendly services, products, processes, or business practices to increase economic value, operational efficiency, and reduce negative impacts on the environment [14,18,19,20]. |
| Organizational Performance | The level of organizational success related to operational effectiveness and financial performance in achieving goals in a sustainable manner [21,22]. |
| Ecosystem Performance | The success of the tourism ecosystem in increasing productivity, maintaining environmental quality, and strengthening socio-economic resilience so that destinations remain optimal and adaptive despite facing external pressures [23,24,25,26,27]. |
Table 2.
Composite Reliability Value and AVE.
| Measuring Instrument | Alfa Cronbach |
Composite Reliability | Average Variance Extracted (AVE) |
|---|---|---|---|
| Ecosystem Performance (EP) | 0.824 | 0.794 | 0.859 |
| Productivity (PD) | 0.879 | 0.961 | 0.632 |
| Resilience (RS) | 0.688 | 0.806 | 0.793 |
| Organizational Performance (OP) | 0.870 | 0.885 | 0.852 |
| Financial Performance (FP) | 0.951 | 0.790 | 0.781 |
| Operational Performance (OF) | 0.828 | 0.896 | 0.707 |
| Green Innovation and Flexibility (GI) | 0.818 | 0.856 | 0.709 |
| Product Value (PV) | 0.874 | 0.972 | 0.865 |
| Technology (TC) | 0.910 | 0.860 | 0.889 |
| Networking (NW) | 0.845 | 0.817 | 0.791 |
| Marketing (MK) | 0.807 | 0.760 | 0.794 |
| Market Demand (MD) | 0.972 | 0.984 | 0.718 |
Table 3.
VIF Value.
| Collinearity Between | Value | Decision |
|---|---|---|
| Ecosystem Performance à Productivity | 1.000 | No collinearity |
| Ecosystem Performance à Resilience | 1.000 | No collinearity |
| ion à Product Value | 1.000 | No collinearity |
| Green Innovation à Technology | 1.000 | No collinearity |
| Green Innovation à Networking | 1.000 | No collinearity |
| Green Innovation à Marketing | 1.000 | No collinearity |
| Green Innovation à Market Demand | 1.000 | No collinearity |
| Organizational Performance à Financial Performance | 1.000 | No collinearity |
| Organizational Performance à Operational Performance | 1.000 | No collinearity |
Table 4.
Significance of Structure Relationship.
| Hypothesis | Path Coefficient | T-Statistic | Sig | Conclusion | |
|---|---|---|---|---|---|
| H1 GI à OP | 0,894 | 20,86 | 0,008 | Accepted* | |
| H2 OP à EP | 0,985 | 32,51 | 0,005 | Accepted* | |
Table information: *: significant at level 0.01 .
Table 5.
R2 Value.
| R2 Square | R Square Adjusted | |
|---|---|---|
| EP | 0,803 | 0,801 |
| PD | 0,749 | 0,747 |
| RS | 0,861 | 0,858 |
| OP | 0,795 | 0,793 |
| FP | 0,766 | 0,762 |
| OF | 0,729 | 0,727 |
| GI | 0,630 | 0,627 |
| PV | 0,768 | 0,765 |
| TC | 0,843 | 0,841 |
| NW | 0,888 | 0,886 |
| MK | 0,840 | 0,838 |
| MD | 0,894 | 0,892 |
Table 6.
Direct & Indirect Effect.
| Indirect Effect | Direct Effect | |
|---|---|---|
| OI à OP à ST | 0.616 | - |
| OI à ST | - | 0.634 |
| OI à CP à ST | 0.614 | - |
Table 7.
Relationship Significance for EP with its Dimension.
| Relationship | Correlation Value | T- Statistic | P-Value | Conclusion |
|---|---|---|---|---|
| EP à PD | 0,862 | 34,357 | 0,000 | Significant |
| EP à RS | 0,709 | 32,106 | 0,000 | Significant |
Table 8.
Relationship Significance for OP with its Dimension.
| Relationship | Correlation Value | T- Statistic | P-Value | Conclusion |
|---|---|---|---|---|
| OP à FP | 0,788 | 33,640 | 0,001 | Significant |
| OP à OF | 0,753 | 32,553 | 0,003 | Significant |
Table 9.
Relationship Significance for GI with its Dimension.
| Relationship | Correlation Value | T- Statistic | P-Value | Conclusion |
|---|---|---|---|---|
| GI à PV | 0,917 | 36,533 | 0,000 | Significant |
| GI à TC | 0,875 | 34,590 | 0,000 | Significant |
| GI à NW | 0,858 | 34,402 | 0,000 | Significant |
| GI à MK | 0,669 | 30,879 | 0,006 | Significant |
| GI à MD | 0,734 | 32.052 | 0,003 | Significant |
Table 10.
Model of Fit Value.
| Model of Fit | Criteria | Value | Conclusion |
|---|---|---|---|
| SMRS | 0.08 <SRMS<HI95 | 0,829 | Demonstrating a satisfactory fit of the model |
| NFI | > 0.9 | 0,961 | Demonstrating a satisfactory fit of the model |
| RMS Theta | < 0.12 | 0,006 | Demonstrating a satisfactory fit of the model |
Table 11.
f 2 Value.
| Construct | f2 |
|---|---|
| Ecosystem Performance (EP) | - |
| Organizational Performance (OP) | 0,369 |
| Green Innovation and Flexibility (GI) | 0,402 |
Table 12.
Q2 Value.
| Construct | Q2 |
|---|---|
| Ecosystem Performance (EP) | 0,387 |
| Organizational Performance (OP) | - |
| Green Innovation and Flexibility (GI) | - |
Disclaimer/Publisher’s Note: The statements, opinions and data contained in all publications are solely those of the individual author(s) and contributor(s) and not of MDPI and/or the editor(s). MDPI and/or the editor(s) disclaim responsibility for any injury to people or property resulting from any ideas, methods, instructions or products referred to in the content. |
© 2026 by the authors. Licensee MDPI, Basel, Switzerland. This article is an open access article distributed under the terms and conditions of the Creative Commons Attribution (CC BY) license.
Copyright: This open access article is published under a Creative Commons CC BY 4.0 license, which permit the free download, distribution, and reuse, provided that the author and preprint are cited in any reuse.


