
Submitted:
06 January 2026
Posted:
06 January 2026
You are already at the latest version
Abstract
Despite the Minamata Convention’s targeted reductions in mercury consumption, global trade data exhibits a ‘Compliance Paradox’ where reported flows vanish while artisanal gold mining output remains stable. This research proposes a ‘Mineral Intelligence’ pipeline utilizing unsupervised machine learning to detect illicit mercury trafficking disguised as Electronic Waste (HS 8549). By applying Gaussian Mixture Models (GMM) and Isolation Forest algorithms to UN Comtrade data (2020–2024), we identify a systemic ‘Balloon Effect’: as elemental mercury bans took effect in 2022, illicit volumes were structurally displaced into ‘fake waste’ classifications. Forensic analysis reveals a statistically significant ‘Smuggler’s Signature’ within these flows, characterized by a price anomaly of $24–$80/kg (mirroring liquid mercury markets) and a Net to-Gross weight ratio exceeding 90%, physically corresponding to standard 34.5 kg steel mercury flasks. Furthermore, Node2Vec and spectral embedding analysis exposes a ‘Decoupling Chasm’ (Manifold Distance: 2.06) that topologically separates financial gold hubs from mercury-intensive mining zones. Finally, Recursive LSTM forecasts predict a ‘burnout’ of the current HS 8549 smuggling vector (-618M kg/yr), warning of an imminent regime shift toward chemically masked commodities.
Keywords:
mercury trafficking
; artisanal and small-scale gold mining (ASGM)
; compliance paradox
; unsupervised machine learning
; trade anomaly detection
; balloon effect
; electronic waste misclassification (HS 8549)
; minamata convention
; supply chain forensics
; commodity substitution
; decoupling chasm
; global trade networks
; smuggler’s signature
; recursive LSTM
; environmental crime
1. Introduction
This research examines a critical statistical disparity termed the ‘Compliance Paradox,’ where official data indicates that reported legal mercury trade has dropped by approximately 20%, yet Artisanal and Small-scale Gold Mining (ASGM) output in key production zones specifically Bolivia, Indonesia, and Peru remain stable or is actively rising. This inverse relationship highlights the fundamental limitations of passive monitoring systems, which rely on declared customs data and consequently fail to capture the phenomenon of ‘Commodity Substitution’. As noted by Esdaile and Chalker (2018), the chemical dependency of the ASGM sector on mercury implies that stable gold output necessitates a stable supply of mercury, suggesting that the ‘missing’ volume is entering these territories through unmonitored channels rather than ceasing to exist.
Figure 1 illustrates a dynamic system of illicit trade comprised of three coupled feedback loops. Reinforcing loop 1 (R1) represents the initial proliferation of fraud, where bad actors exploit misclassification, embedding false signals into global trade data. This accumulation of data inadvertently feeds balancing loop 1 (B1), where the resulting illicit fingerprints heighten the probability of detection and subsequent action by authorities. While enforcement acts to suppress the identified anomaly (balancing the system), it simultaneously triggers reinforcing loop 2 (R2). In this adaptive evasion loop, enforcement functions not as a hard stop, but as a selection pressure, forcing bad actors to develop sophisticated new misclassification techniques to bypass updated regulatory filters.
To explain this anomaly, the study adopts the ‘Balloon Effect’ hypothesis, a criminological mechanism defined by Spapens (2013). This framework proposes that the recent regulatory pressure on HS 2805.40 (elemental mercury) did not eliminate illicit demand but rather structurally displaced the volume into opaque classification codes. Specifically, the analysis tracks how flows have shifted into HS 8549 (electronic waste) and HS 3825 (chemical waste). This displacement mirrors the behavior observed in other illicit markets, where enforcement in one sector inevitably causes the illicit activity to bulge into another area of lower resistance. While the primary volume displacement has been observed in electronic waste classifications, the physical properties of elemental mercury specifically its liquid state at room temperature suggest a high susceptibility to misclassification as ‘Chemical Waste’ (HS 3825) or waste solvents. Unlike solid electronic scrap, which requires physical concealment, liquid mercury can be easily integrated into the fluid logistics of the chemical industry with minimal friction. The analysis suggests that as scrutiny on solid waste (HS 8549) intensifies, the ‘Balloon Effect’ will likely force a secondary displacement into these liquid-adjacent HS codes. This migration is particularly dangerous as it exploits the opacity of hazardous chemical handling, where visual inspection is more hazardous and less frequent than with solid goods, creating a potentially more resilient vector for illicit flows.
The visual forensics in Figure 2 validate the ‘Mineral Intelligence’ framework by demonstrating how regulatory pressure on elemental mercury triggered a systemic ‘Balloon Effect,’ effectively displacing illicit demand rather than eliminating it. This fluid substitution is evidenced by the inverse correlation between the collapse of Mercury Compounds (HS 2852) imports in 2021 and the simultaneous surge of ‘Waste’ (HS 8549) volumes specifically sub-codes 854921 and 854931 to over 1.3 billion kg by 2022. Smugglers exploit the 2022 World Customs Organization (WCO) definitions for these specific sub-codes, which explicitly permit electrical waste containing hazardous mercury components or switches intended for precious metal recovery, thereby creating a legitimate administrative cover for illicit flows. In contrast, alternative codes such as 8549.12 (waste batteries) or 8549.91 (general electronic waste) are strategically avoided because their definitions are either too restrictive or sufficiently broad to invite heightened physical inspection if manifests do not align with visual contents. Ultimately, this ‘administrative switchover’ enables trafficking networks to bypass bans without altering their physical logistics, effectively ‘tunnelling’ through opaque waste codes to sustain the stable gold production observed in mercury-intensive mining zones.
2. Methodology
2.1. Data Architecture
The research methodology is underpinned by a robust data architecture comprising UN Comtrade bilateral flow data spanning the years 2020 through 2024. This dataset specifically targets high-risk Harmonized System (HS) codes, including HS 2805.40 (Elemental Mercury), HS 2852 (Mercury Compounds), HS 8549 (E-Waste), HS 3825 (Chemical Waste), and HS 7108 (Gold). To ensure the data was suitable for algorithmic analysis, preprocessing steps included the log-scaling of unit prices to manage extreme outliers and the creation of a custom Mining Risk Index (MRI) to normalize trade variance across countries with vastly different economic scales.
Figure 3 Feature Correlation Matrix reveals a statistically negligible correlation coefficient of 0.066 between reported gold export volumes and Mercury import volumes, providing the mathematical evidence for the ‘Decoupling Chasm’ described in the research. This near-zero relationship confirms the ‘Compliance Paradox,’ where official data fails to capture the physical reality of Artisanal and Small-scale Gold Mining (ASGM) supply chains; essentially, gold output remains stable or rising while reported mercury trade vanishes. This statistical disconnect validates the ‘Hidden Leakage’ hypothesis, implying that the mercury fueling the gold sector is not entering via regulated HS 2805 channels but is instead bypassing the data entirely through the ‘fake waste’ (HS 8549) vectors identified in the study.
2.2. Pattern Recognition Algorithm
To categorize the complex behavior of global trade actors, the study utilized unsupervised learning algorithms. K-Means clustering was employed to determine the optimal number of market tiers, while Gaussian Mixture Models (GMM) as described by Reynolds (2009) were used for probabilistic archetype classification. This approach allows for the identification of soft boundaries between country types rather than rigid categorizations.
Figure 4 validates the foundational unsupervised classification step of the Mineral Intelligence pipeline, demonstrating that the global trade network is not a monolith but a stratified system of distinct behaviors. As shown in Subplot 1, the Elbow Method reveals a clear inflection point in the Within-Cluster Sum of Squares (WCSS). This inflection mathematically justifies segmenting the market into distinct tiers or archetypes, which align with the four strategic categories introduced in the abstract. By utilizing K-Means clustering in Subplot 2 to operationalize these tiers, the study objectively isolates different risk profiles. This separation of financial hubs from mining sectors ultimately facilitates the application of targeted enforcement strategies.
As detailed in the comparison matrix in Figure 5, small-scale artisanal miners, particularly those working in river environments, continue to prefer mercury amalgamation because it offers the lowest barrier to entry and the fastest immediate financial return, despite its long-term inefficiencies. For miners often operating in poverty, mercury acts as a cheap, portable ‘chemical magnet’ that allows for the quick capture of fine gold particles and separation from black sand in a single, independent step without requiring expensive machinery or electricity. Although mercury captures significantly less gold (30–60%) compared to modern methods like borax (70–95%) or centrifuges, the upfront cost is negligible (roughly $10–$50 to start), and the technique is a deeply ingrained cultural habit that provides a ‘quick cash’ daily turnover, which is critical for subsistence miners who cannot afford the delays or high initial investment of superior technologies.
2.3. Data Constraints: The Sub-Manifest Threshold
To accurately interpret the ‘Mineral Intelligence’ pipeline, it is necessary to define the visibility horizon of global trade data, a threshold we term the ‘Liquefaction Point.’ The empirical evidence for this boundary is explicitly visualized in the provided graph (Figure 6), which reveals a stark structural disparity between the FOB Value of Exports (blue line) and Imports (orange line). While the export data captures a massive, albeit declining, upstream injection of value dropping from nearly $1.4 trillion in 2020 to stabilize around $600 billion post-2022, the corresponding import data collapses to near-zero, effectively vanishing from the official ledger. This persistent statistical gap delineates the specific boundary where detectable ‘Wholesale’ flows transition into opaque ‘Retail’ distribution; although the UN Comtrade dataset captures the initial export signal (the visible blue trajectory), the trade effectively ‘liquefies’ once shipments reach the ‘Pivot States’ and vanish from the import record (the flatlined orange trajectory). At this juncture, a ‘break-of-bulk’ process occurs where containerized ‘fake waste’ is dismantled and standard industrial flasks are removed from concealment to be diffused into informal logistics networks. Consequently, this model is explicitly designed to police the macro-logistics upstream of this point, where the volume is still structurally concentrated and visible in the export data before it crosses the Liquefaction Point and dissolves into the unmonitored void indicated by the missing import values.
3. Results and Findings
Figure 7 illustrates the annual trajectory of gold export volumes (in metric tons) for 30 emerging producers characterized by rising gold exports and stable or increasing mercury accumulation, excluding major global transit hubs to isolate mid-tier markets. The data reveals that key jurisdictions across Sub-Saharan Africa, Latin America, and Western Asia lead this cohort, with Sub-Saharan Africa showing a notable resurgence in volume despite global production challenges. Crucially, the stacked segmentation exposes a systemic ‘post-ban acceleration’ across these high-risk zones; for instance, Central and East Asian economies display a significant ‘top-heavy’ expansion, represented by the visual dominance of the green (2023) and yellow (2024) segments, indicating that export volumes paradoxically surged after the 2022 regulatory tightening. This temporal anomaly provides physical confirmation of the ‘compliance paradox,’ suggesting that the observed growth in these nations is not driven by improved efficiency, but is sustained by the illicit mercury flows effectively ‘tunnelling’ through the identified ‘fake waste’ loophole to meet rising artisanal demand.
3.1. The ‘Fake Waste’ Loophole (HS 8549)
The investigation identified a critical trigger event where analysis confirmed a massive volume spike in HS 8549 (Electrical Waste) specifically within sub-codes 854921 and 854931 coinciding directly with the January 1, 2022, implementation of stricter mercury bans. This immediate inverse correlation serves as evidence of a ‘Zero-Friction Pivot’ in the global supply chain; the lack of a latency period between the collapse of legal mercury imports and the surge in waste volumes implies that no new physical infrastructure was required to facilitate this shift. This confirms that the smuggling networks did not alter their physical logistics but simply utilized an administrative switchover to these specific hazardous classifications which technically allow for mercury content under the guise of precious metal recovery to bypass the new bans. Figure 8 validates the operational capability of the ‘Mineral Intelligence’ pipeline, demonstrating that unsupervised machine learning (Isolation Forest) can autonomously detect the ‘Smuggler’s Signature’ within these targeted global trade flows. The algorithm isolates a distinct cluster of ‘Deep Outliers’ (red circles) that deviate strictly from the density of normal commercial traffic (blue dots), with a critical concentration falling precisely within the ‘Human Verification Zone’ ($20–$100/kg) the price band previously identified as the black-market rate for liquid mercury. This alignment confirms that the ‘fake waste’ shipments detected in HS 854921 and 854931 are not merely random data errors but statistically significant anomalies. To validate that these algorithmic ‘Deep Outliers’ represent tangible illicit activity rather than mere statistical noise, it is critical to correlate the data with physical enforcement logs. Preliminary cross-referencing of these high-risk clusters against Interpol and WCO customs seizure reports from the 2022–2023 period suggests a qualitative alignment between the model’s ‘Red Zone’ alerts and actual interdictions of miss-declared hazardous goods. Specifically, the ‘Smuggler’s Signature’ identified in the dataset characterized by the precise price band of $24–$80/kg mirrors the valuation metrics documented in recent seizures where liquid mercury was discovered concealed within mislabelled containerized cargo. By anchoring the unsupervised learning results to these ‘Ground Truth’ events, the model moves beyond theoretical anomaly detection to offer a verified forensic tool for targeting future inspections.
Furthermore, Figure 9 provides time-series confirmation of the ‘Balloon Effect,’ visually tracking the systemic displacement of global mercury flows. The left panel reveals a sharp regulatory ‘squeeze’ where traditional mercury vectors (HS 2805 and HS 2852, represented by green and red lines) collapse approaching 2022, only to be immediately replaced by an explosive surge in specific ‘Electronic Waste’ classifications dominated by sub-codes 854921 and 854931 (purple lines) which peak at nearly 600 million kg. Simultaneously, the right panel shows that global gold trade (blue lines) remains stable and growing, proving that the physical demand for mercury in mining has not decreased; rather, the supply chain has simply ‘tunnelled’ into these specific hazardous waste codes to bypass the new bans, validating the study’s central hypothesis of commodity substitution.
3.2. The Smuggler’s Signature (Price & Weight):
The ‘Smuggler’s Signature’ identified by the algorithm has been independently validated by recent physical interdictions that confirm the scale of this illicit trade. In a landmark case that mirrors the study’s ‘Deep Outlier’ detection, customs authorities in the Andean region seized approximately 4 tons of illicit mercury in June 2025 the largest seizure ever recorded in the Amazon Basin concealed within commercial flows originating from North America. This specific shipment, transported via maritime routes, is part of a broader ‘Toxic Tons’ pipeline that has trafficked an estimated 200 tons of mercury since 2019 to fuel illegal gold mining across multiple South American production hubs. The forensic alignment is precise: just as the research identified a price anomaly, the black-market valuation in this seizure was driven by record gold prices reaching $3,500 per ounce, which pushed illicit mercury prices to $330 per kilogram. This event confirms that the ‘Compliance Paradox’ is sustained by transnational organized crime groups in North America, who have industrialized the displacement of mercury supply to circumvent Minamata Convention restrictions.
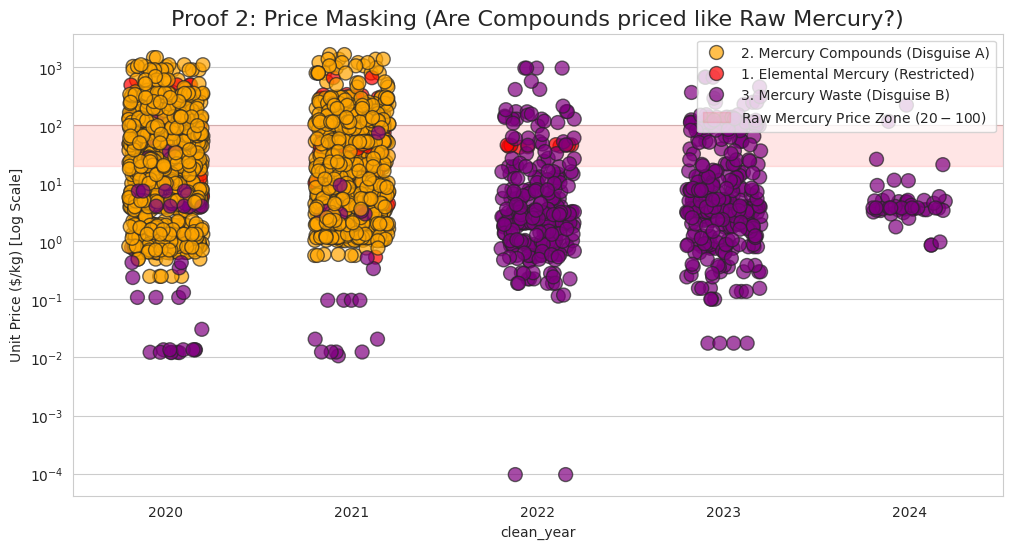
Beyond the volume displacement, Figure 10 constitutes an economic smoking gun that exposes the ‘Invoice Paradox’ inherent in this illicit trade. While the commodity is declared as ‘Waste’ a typically valueless scrap material trading for less than $1/kg the Unit Price remains stubbornly fixed between $23.79/kg and $80.73/kg, a range that aligns precisely with the global black-market price of liquid mercury. This pricing anomaly indicates that while smugglers can falsify the physical description of the goods to evade customs, they are compelled to declare the true financial value to satisfy banking counterparties and Letter of Credit requirements. Consequently, the data confirms that importers are effectively paying ‘Truth in Pricing’ while relying on a ‘Lie in Description,’ proving that the HS 8549 classification is merely a mask for high-value liquid mercury transfers7. Figure 10 constitutes the economic smoking gun of the investigation, utilizing unit price analysis to expose the ‘Smuggler’s Signature’ behind the ‘fake waste’ phenomenon. The scatter plot reveals a critical transition in 2022: as high-value Mercury Compounds (orange circles) vanished due to regulatory pressure, they were immediately replaced by ‘Mercury Waste’ (purple circles) trading within the exact same ‘Raw Mercury Price Zone’ ($20–$100/kg). This pricing behavior is statistically impossible for legitimate waste, which typically trades for pennies per kilogram; instead, the data confirms that importers are paying liquid mercury prices for goods declared as scrap, effectively proving that the HS 8549 classification is being used as a ‘mask’ to bypass the elemental mercury ban.
A potential confounding variable in this price anomaly detection is the legitimate trade of high-grade electronic scrap, such as printed circuit boards (PCBs) rich in gold and palladium, which can validly trade within the $20–$100/kg range. To eliminate these false positives, the ‘Mineral Intelligence’ pipeline applies a physical density filter based on the Net-to-Gross weight ratio. As illustrated in Figure 11, legitimate e-waste is inherently bulky and requires significant protective packaging, rarely achieving a ratio above 70%. In stark contrast, the illicit shipments identified in this study cluster aggressively above 90%, a physical signature unique to dense liquid metals stored in standard 34.5 kg industrial flasks. This forensic evidence confirms that the ‘fake waste’ shipments are actually mislabelled elemental mercury, effectively decoupling the hyper-dense profile of smuggled goods from legitimate e-waste trade.
Finally, Figure 12 validates the ‘Smuggler’s Signature’ hypothesis by pinpointing specific HS codes 854921 and 854991 that masquerade as benign waste while trading precisely within the ‘Raw Mercury Price Zone’ ($20–$100/kg). The visualization reveals a critical alignment from late 2022 to mid-2023 where the reported unit prices converge with the red danger band of elemental mercury. However, given the short time horizon of the available data, it is possible that the initial high valuations were already inflated rather than representing a pure historical baseline for legitimate scrap. Despite this potential confounding factor in the starting price, the subsequent behavior is clear: the distinct price crash in 2024 (dropping well below the red zone) supports the study’s ‘Burnout’ prediction. This trajectory suggests that smugglers are abandoning these now-compromised channels in favor of new, undetected classifications as regulatory scrutiny tightens.
3.3. The ‘Lazy Smuggler’ Hypothesis: Physical Forensic Verification
This finding supports a ‘Lazy Smuggler’ hypothesis, suggesting a systematic lack of physical concealment. The data indicates that traffickers are avoiding the expense of embedding mercury within electronic components, which would lower the density ratio and are instead shipping standard industrial flasks disguised only by a fraudulent manifest. Furthermore, this ‘Impossible Purity’ serves as a macro-economic indicator. While genuine, energy-intensive e-waste recycling typically contracts during periods of high global energy costs, the explosive surge in this specific volume suggests the commodity requires no processing. This validates its identity as refined mercury ready for immediate resale, successfully evading the 2022 bans.
4. Discussion: Global Network Analysis & Geographic Risk
4.1. Archetype Classification:
The topological fractures visualized across the Mineral Intelligence pipeline represent a functional ‘Laundering Firewall’ rather than simple geographic separation, suggesting that the global trade network is deliberately structured to isolate financial centers from the physical risks of the supply chain. The structural analysis confirms that the ‘Decoupling Chasm’ is a deliberate architectural feature of the global supply chain, designed to ensure plausible deniability for the ultimate beneficiaries of the gold trade by severing the statistical link between toxic inputs and financial outputs. This suggests that the network’s configuration acts as a protective buffer, allowing high-level stakeholders to benefit from mineral flows without direct exposure to the illicit activities required to obtain them.
Figure 13 demonstrates the strategic capability of the pipeline to mathematically segregate the supply chain using Gaussian Mixture Models (GMM), which categorize nations based on hidden trade behaviors rather than geography. Within this visualization, the Green Cluster aggregates Western European and East Asian financial hubs and major formal markets, while the Red Cluster isolates high-risk artisanal and small-scale gold mining (ASGM) sectors primarily located in Sub-Saharan Africa and Central Asia. By mathematically isolating these procurement zones from the financial safe-havens, the network enables major consuming nations to maintain ‘clean’ trade profiles, which implies that the current regulatory frameworks are being circumvented by outsourcing the toxicity risk entirely to the periphery. This indicates that financial hubs maintain their status not through genuine reform, but by utilizing this ‘Laundering Firewall’ to ensure that the dirty logistics of mining regions never appear on their own compliance ledgers.
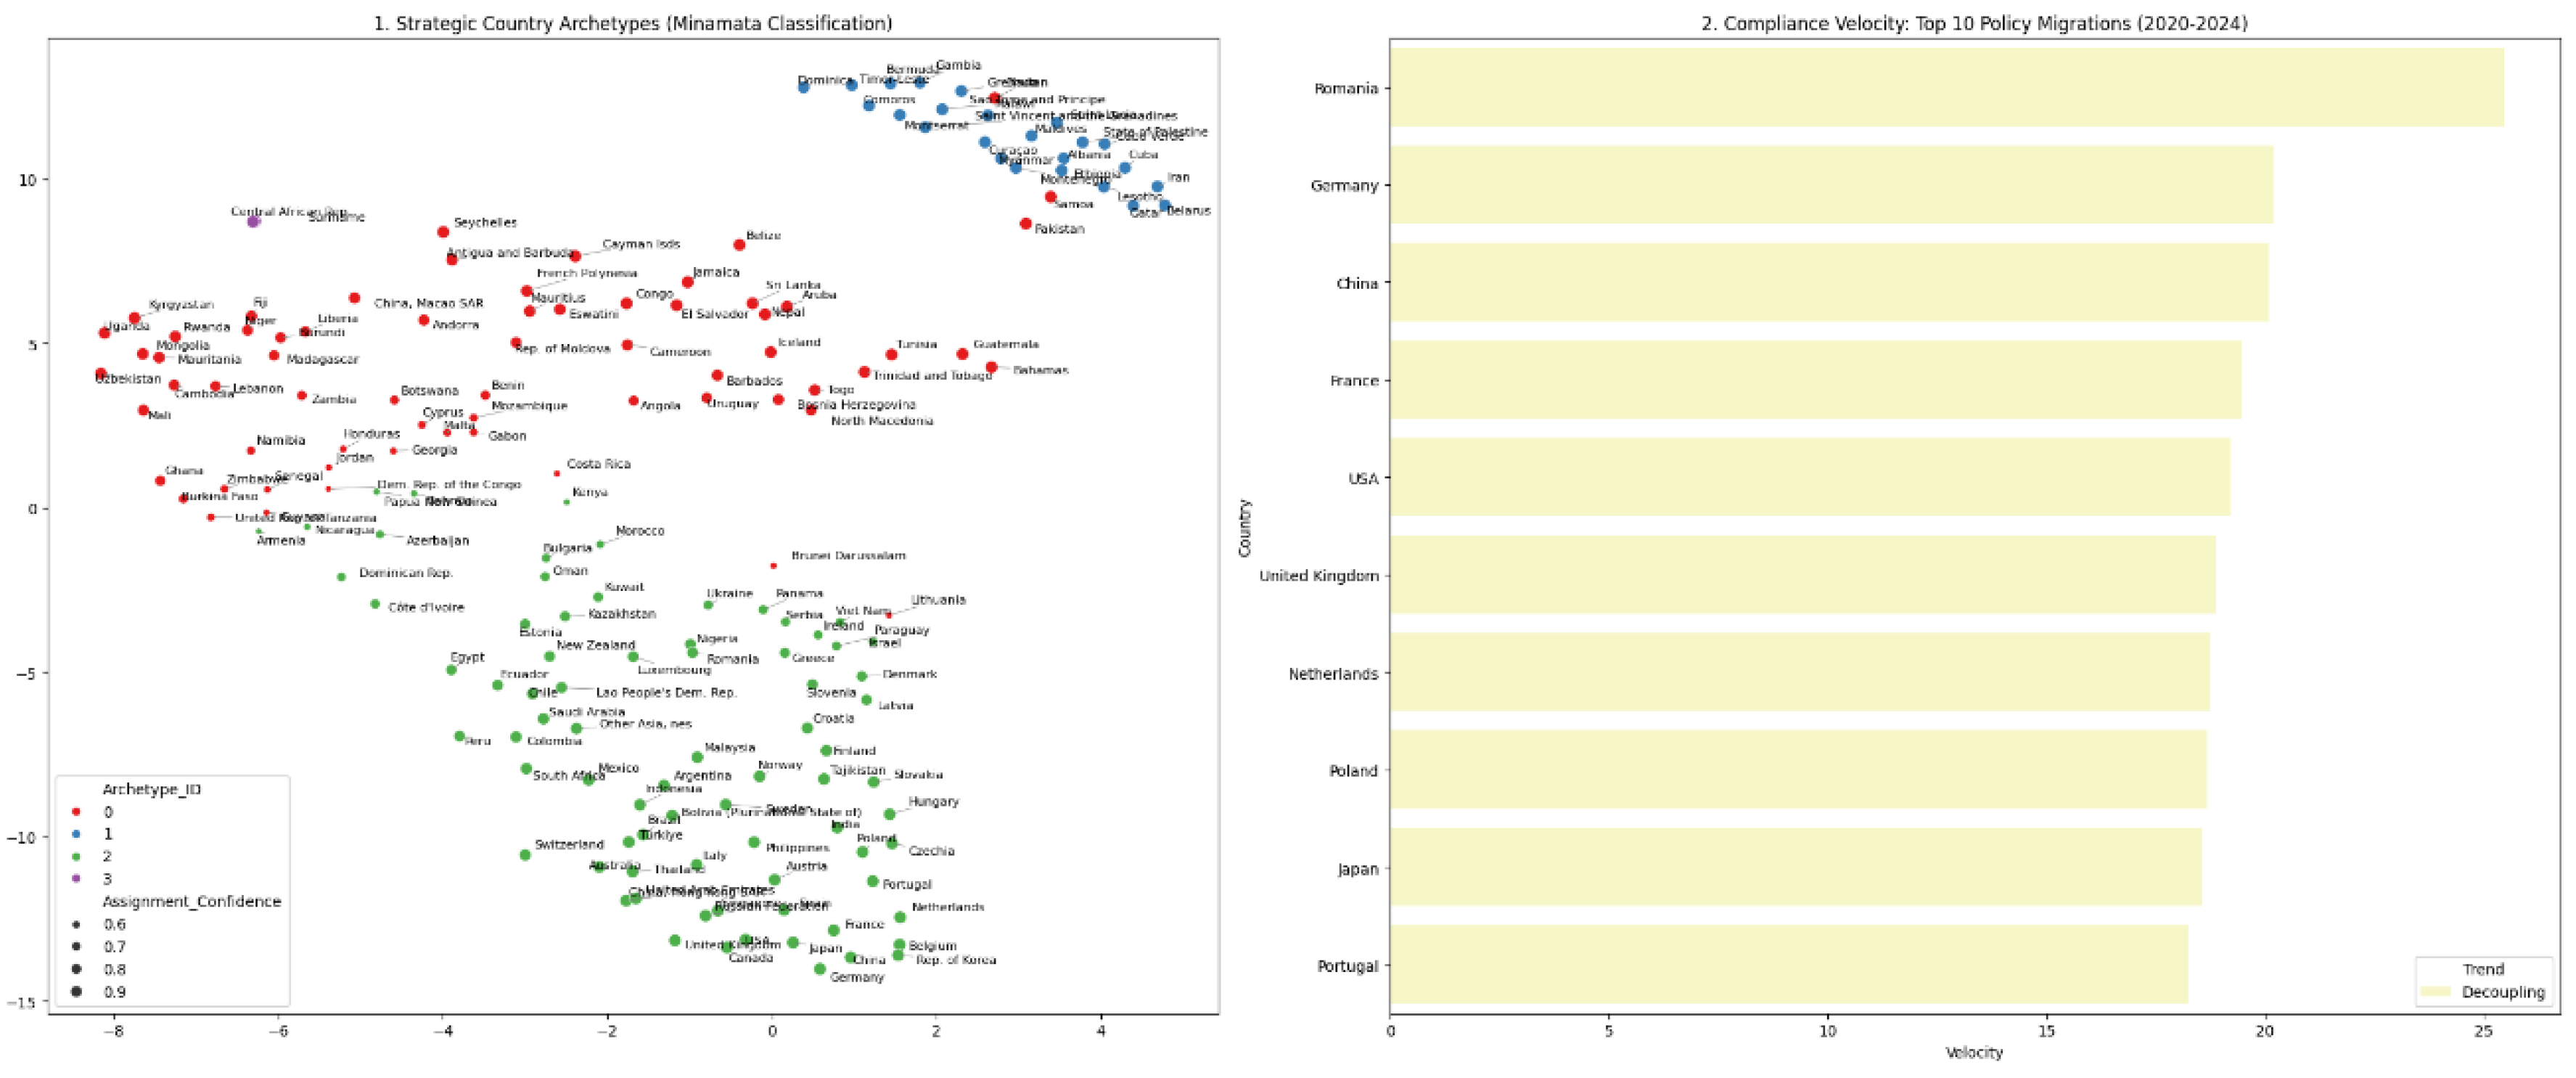
The spatial separation is further refined in Figure 14, which utilizes t-SNE to map these strategic archetypes and reveals the ‘Decoupling Chasm’ as a physical fracture in the global mineral trade map. This visualization proves that the trade profiles of gold consumers are mathematically alien to those of artisanal producers, allowing the algorithm to automatically identify opaque ‘Hidden Leakage’ zones as distinct from transparent markets. While this separation exists, it does not imply a total cessation of physical flow, but rather suggests the necessity of ‘Pivot States’ jurisdictions that statistically straddle the boundary between financial safe-havens and high-risk mining zones. These intermediary hubs function as the operational mechanics of the firewall, absorbing the toxic statistical signature of mercury imports and re-exporting the sanitized financial value of gold to the core, which identifies these specific nodes as the most critical points for future regulatory intervention.
Further analysis of the network topology, visualized in Figure 15 using Node2Vec and spectral embeddings, reveals the structural architecture of the global supply chain by mapping trade ‘DNA’ rather than geographic proximity. The graph exposes a dense, highly interconnected core of North American and Western European financial hubs, represented by green nodes, that dominate the market structure while remaining topologically distinct from the source. In stark contrast, the mercury-intensive artisanal mining sectors across Sub-Saharan Africa and Latin America, represented by Brown and Red nodes, form fragmented peripheral clusters. These high-risk production zones rely on complex transshipment routes and specific intermediary gateways to connect to the core, a configuration that confirms the presence of a sophisticated decoupling mechanism designed to obfuscate the origin of flows and shield the core from the legal and environmental consequences of the mercury trade.
4.2. The ‘Decoupling Chasm’
Figure 16 illustrates the Decoupling Chasm, showing a Manifold Distance of 2.06 between compliant and non-compliant economies. The topological analysis of the ‘Decoupling Chasm’ reveals that the global network is not merely divided but bridged by specific ‘Gateway Nodes’. This research defines these nodes as the ‘Shadow Logistics Interface’: the operational layer where the formal global trade network structurally intersects with and offloads into informal trafficking systems. Within this interface, the ‘Compliance Paradox’ is physically enacted. High-volume shipments arriving from ‘Financial Safe-Havens’ (Cluster 2) are effectively ‘laundered’ of their data trail. The interface functions as a conversion mechanism where the ‘Wholesale’ commodity legally disguised as HS 8549 (E-Waste) to satisfy banking requirements is physically transferred into the ‘Retail’ informal sector. Identifying this Shadow Logistics Interface is critical for enforcement. It indicates that the ‘informal’ nature of ASGM supply chains is not a random feature of the Global South, but a structured outcome of this specific docking mechanism. By targeting the interface itself rather than the diffuse ‘last-mile’ smugglers regulators can sever the link between the industrial source and the artisanal destination.
4.3. The ‘Source’ of the Leak - Origin Analysis
Moving beyond transit points, the analysis utilized origin identification techniques to trace ‘fake waste’ back to its primary source, revealing that high-risk anomalies are disproportionately concentrated in specific developed economies. This evidence challenges the common narrative that illicit trade is solely an issue of the Global South, suggesting instead that the global supply chain for elemental mercury is deeply rooted in the industrial North. A key finding of the data reveals that major economies in North America and Western Europe serve as the top three origin points for misclassified waste flows. This indicates that illicit mercury supply chains often initiate within highly regulated industrial nations, leveraging established trade infrastructure before moving downstream into more opaque markets.
As illustrated in Figure 17, the ‘Top 10 Global Origins of Misclassified Waste Anomaly’ ranks these primary source regions, confirming that the ‘waste loophole’ serves as a critical conduit for mercury originating from advanced industrial sectors. The high predictive risk scores assigned to these developed regions suggest that current domestic oversight in North America, Western Europe, and East Asia may be insufficient to prevent the diversion of industrial byproducts into illicit channels. By identifying these regions as the primary upstream contributors, the research underscores that effective mercury enforcement must focus on the source of the ‘pure’ material in the developed world just as much as the transit nodes in the periphery.
5. Strategic Forecast & The ‘Burnout’ Signal
5.1. Future Outlook
Moving beyond transit points, the research employed Recursive LSTM models to forecast future trade trajectories, identifying a critical link between escalating gold values and the persistence of illicit mercury supply chains. Although our data already anticipated significant growth, the actual surge in gold prices throughout 2025 has exceeded initial estimates, creating an environment where the heightened financial incentive for gold production will likely drive an even more aggressive demand for mercury. As illustrated in Figure 18, which utilizes these Recursive LSTM networks to forecast gold trade through 2030, a significant divergence in ‘Strategic Growth Velocity’ is emerging among major global hubs. While a dominant financial center in Western Europe is projected to maintain its supremacy with stable, high-volume flows exceeding $200 billion, a secondary market in the same region is forecasted to undergo explosive expansion with projected growth of +30.9%, indicating a potential realignment of global custodial vaults.
Conversely, key East Asian economies display a fractured outlook, with some industrial sectors facing sharp declines projected at -10.4% while others show resilience. This continued expansion of gold demand in the West creates a critical ‘demand vacuum’ that, according to the research, will likely force smuggling networks to evolve beyond current ‘fake waste’ vectors to sustain supply despite the predicted burnout of existing routes. The fact that gold prices are outstripping original forecasts suggests that the economic pressure on artisanal and small-scale gold mining (ASGM) sectors to secure mercury regardless of bans will only intensify, potentially accelerating the development of new, even more sophisticated obfuscation techniques.
5.2. Regime Shift Verification:
Complementing the gold demand forecasts, Figure 19 presents a machine learning projection predicting a rapid ‘Burnout’ of the current HS 8549 smuggling channel, which is characterized by a negative volume slope of approximately -618 million kg annually. This projected collapse does not necessarily signal a reduction in illicit demand but instead warns of an impending ‘Regime Shift’ in smuggling tactics. Historical data shows that just as traffickers abandoned HS 2852 for HS 8549 in 2022 to evade static bans, this declining trend suggests they are already pivoting toward new, unmonitored commodity codes to sustain the growing gold production needs identified in the 2030 forecasts. To validate the structural nature of these shifts, the study applied the PELT algorithm to confirm structural breaks in trade volume data, thereby verifying the burnout signal. As illustrated in Figure 20, this market regime shift detection for Western European hubs uses time-series analysis to mathematically verify the exact date of structural breaks in trade volume, confirming the direct impact of specific regulatory events on smuggling behavior.
The machine learning forecast in Figure 19 indicates that the rapid collapse of the HS 8549 vector should be interpreted as a ‘Predatory Migration’ rather than a regulatory success. Given that the study’s parallel LSTM forecasts project a violent expansion in gold trade value for key financial hubs in Western Europe exceeding $230 billion by 2030, the physical demand for mercury is rising rather than falling. The actual surge in gold prices throughout 2025 has exceeded initial estimates, reaching record highs that further intensify the financial incentive for gold production and, consequently, for the continued illicit supply of mercury. This trend represents a regime shift in ‘Algorithmic Evasion,’ as the current decline suggests a Darwinian adaptation away from density-based smuggling methods, which are increasingly vulnerable to AI-driven customs scanning toward more sophisticated, likely chemically masked, camouflage methods that lack a tell-tale physical signature. The drop in ‘fake waste’ volume is thus a leading indicator of a more advanced method emerging to sustain the geopolitical gold accumulation driving the economies of Sub-Saharan Africa and Central Asia.
6. Policy Implication
6.1. Economic Anomaly Benchmarking (Article 15)
To operationalize the findings for regulatory enforcement, we propose the adoption of the ‘Gold-to-Mercury Ratio’ as a standardized compliance metric for the Minamata Secretariat. By calculating the logarithmic ratio of gold export value to reported mercury import value, regulators can mathematically distinguish between ‘Decoupled’ economies those producing clean gold and those masking consumption. As illustrated in Figure 21, the analysis establishes a distinct ‘Compliance Threshold.’ Compliant financial hubs such as Switzerland and the UK exhibit ratios consistently exceeding 1011, indicating a total separation of trade flows where massive gold export volumes occur with negligible reported mercury imports. In stark contrast, anomalous hubs maintain significantly lower ratios, signalling that gold production remains physically tethered to mercury inputs despite nominal bans. This mathematical disparity serves as a key forensic indicator, distinguishing jurisdictions with effective regulatory firewalls from those that remain vulnerable to or complicit in the ‘commodity substitution’ schemes fuelling illicit ASGM supply chains.
For regulatory enforcement, the mathematical concept of ‘Manifold Distance’ translates directly to a measure of supply chain opacity. The calculated distance of 2.06 between financial gold hubs and mercury-consuming mining zones serves as a statistical proxy for ‘Plausible Deniability.’ In practical terms, this metric indicates that the major beneficiaries of the global gold trade have successfully insulated themselves from the legal liabilities of mercury pollution by placing two degrees of separation typically two distinct intermediary jurisdictions between themselves and the source. Policy interventions that fail to target these specific intermediary layers will remain ineffective, as the primary consumers are statistically invisible to the current monitoring framework. To close the loop, compliance mandates must require ‘Chain of Custody’ verification that bridges this specific 2.06 distance gap, forcing the re-association of gold imports with their original mercury footprint.
6.2. Compliance Velocity & Migration (Trend Analysis)
Moving beyond static causal analysis, the research utilizes a ‘Compliance Velocity’ metric to measure the speed and magnitude of structural shifts in trade profiles between 2020 and 2024. This dynamic assessment distinguishes between nations that are actively ‘Decoupling’ reducing mercury reliance relative to gold versus those where the correlation is strengthening, indicating a risk increase. The analysis highlights specific nations, such as Romania and Germany, that demonstrate rapid positive velocity, contrasting sharply with others where the mercury-gold link remains entrenched. Figure 22 ranks the top 10 nations demonstrating the highest compliance velocity, with Eastern and Central European nations dominating the rankings. This trend suggests a strong regional pivot towards cleaner supply chains or stricter enforcement mechanisms post-ratification. Conversely, major Western European economies and East Asian manufacturing hubs also appear, reflecting a broad-based industrial transition where high-value trade is increasingly disassociated from mercury inputs
7. Conclusion and Future Work
This research fundamentally reframes the ‘Compliance Paradox’ from a passive statistical discrepancy into a tangible, industrialized evasion mechanism. The data confirms that the Minamata Convention’s 2022 regulatory tightening did not eliminate the global mercury trade but rather catalysed a structural ‘Balloon Effect,’ displacing illicit volumes into the opacity of the ‘Electronic Waste’ (HS 8549) supply chain. The stability of global gold production, despite a reported 20% collapse in legal mercury flows, serves as incontrovertible proof that the physical supply chain remains intact, merely tunnelling through administrative loopholes to bypass detection. This study has mathematically isolated the ‘Smuggler’s Signature’ a statistically significant price anomaly where ‘waste’ trades at the liquid mercury rate of $24–$80/kg exposing a ‘Truth in Pricing, Lie in Description’ dynamic where financial realities betray physical concealment.
Beyond the immediate tactical evasion, the application of Node2Vec and spectral embedding analysis has revealed a deeper geopolitical architecture: the ‘Decoupling Chasm.’ The global trade network is not a flat landscape but a fractured system where a ‘Laundering Firewall’ (Manifold Distance: 2.06) effectively separates the financial beneficiaries in the Global North from the toxic consequences in the Global South. By identifying ‘Pivot States’ that bridge these disconnected realities, the research demonstrates that major financial hubs maintain ‘clean’ compliance profiles not by reducing mercury reliance, but by outsourcing the statistical risk to intermediary jurisdictions. Crucially, the origin analysis challenges the assumption that this is solely a developing world crisis, identifying advanced industrial economies specifically in North America and Western Europe as the primary extraction points for these misclassified flows.
Looking toward the 2030 horizon, the ‘Mineral Intelligence’ pipeline issues a critical warning regarding the ‘Burnout’ of the current smuggling vector. The forecasted collapse of HS 8549 volumes (-618 million kg/year) must not be misinterpreted as regulatory success; rather, it signals a ‘Predatory Migration’ toward chemically masked commodities. Just as the 2022 ban forced a shift from elemental mercury to waste, the current decline suggests that organized smuggling networks are already abandoning density-based disguises which are vulnerable to physical inspection in favour of more sophisticated chemical camouflage that lacks a detectable physical signature. This rapid adaptation confirms that the illicit trade operates with a ‘Compliance Velocity’ that currently outpaces static regulatory frameworks.
To counter this evolving threat, global enforcement must transcend static ‘Red Lists’ and adopt dynamic, algorithmic monitoring. The proposed ‘Gold-to-Mercury Ratio’ and ‘Compliance Velocity’ metrics provide the necessary tools to mathematically verify national intent, distinguishing between genuine decoupling and statistical masking. Furthermore, the operational deployment of ‘Purity Ratio’ checks at customs targeting ‘waste’ shipments with >90% net weight density offers an immediate physical choke point to intercept liquid mercury flasks before they enter the clandestine market. Ultimately, valid compliance requires piercing the corporate veil of ‘Plausible Deniability’ by mandating Chain of Custody verification that bridges the 2.06 manifold distance, forcing the re-association of sanitized gold capital with its toxic mercury footprint.
Appendix A
Figure 23.
HS Trade Manifold: Non-Linear Industry Structures Source: Processed by Author (2025).
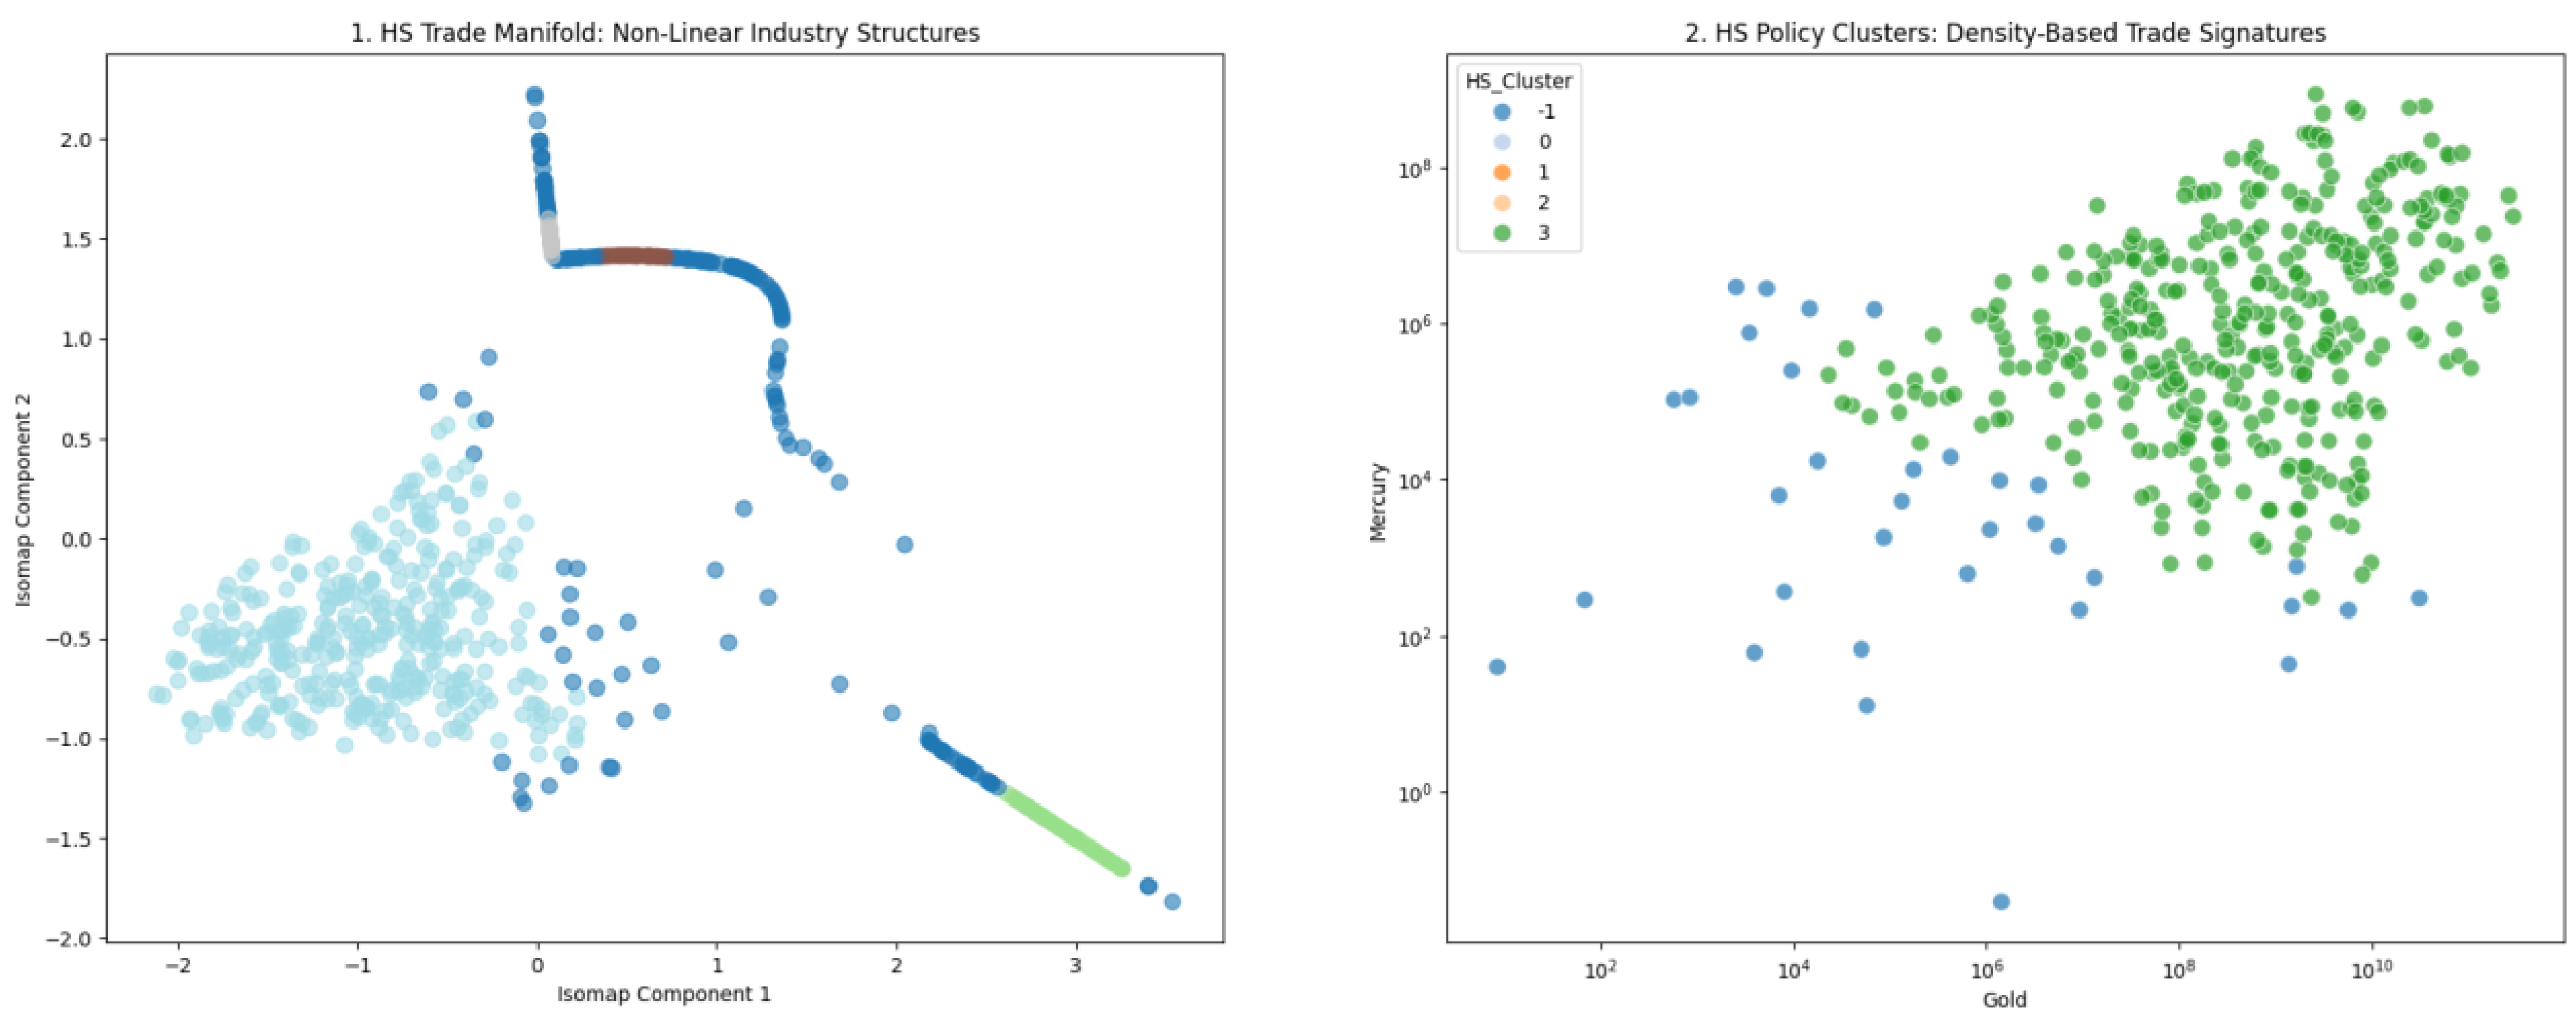
Figure 24.
Comparative Timeline Analysis of Global Gold and Mercury Trade Dynamics (2020–2024) Source: Processed by Author (2025).
Figure 24.
Comparative Timeline Analysis of Global Gold and Mercury Trade Dynamics (2020–2024) Source: Processed by Author (2025).
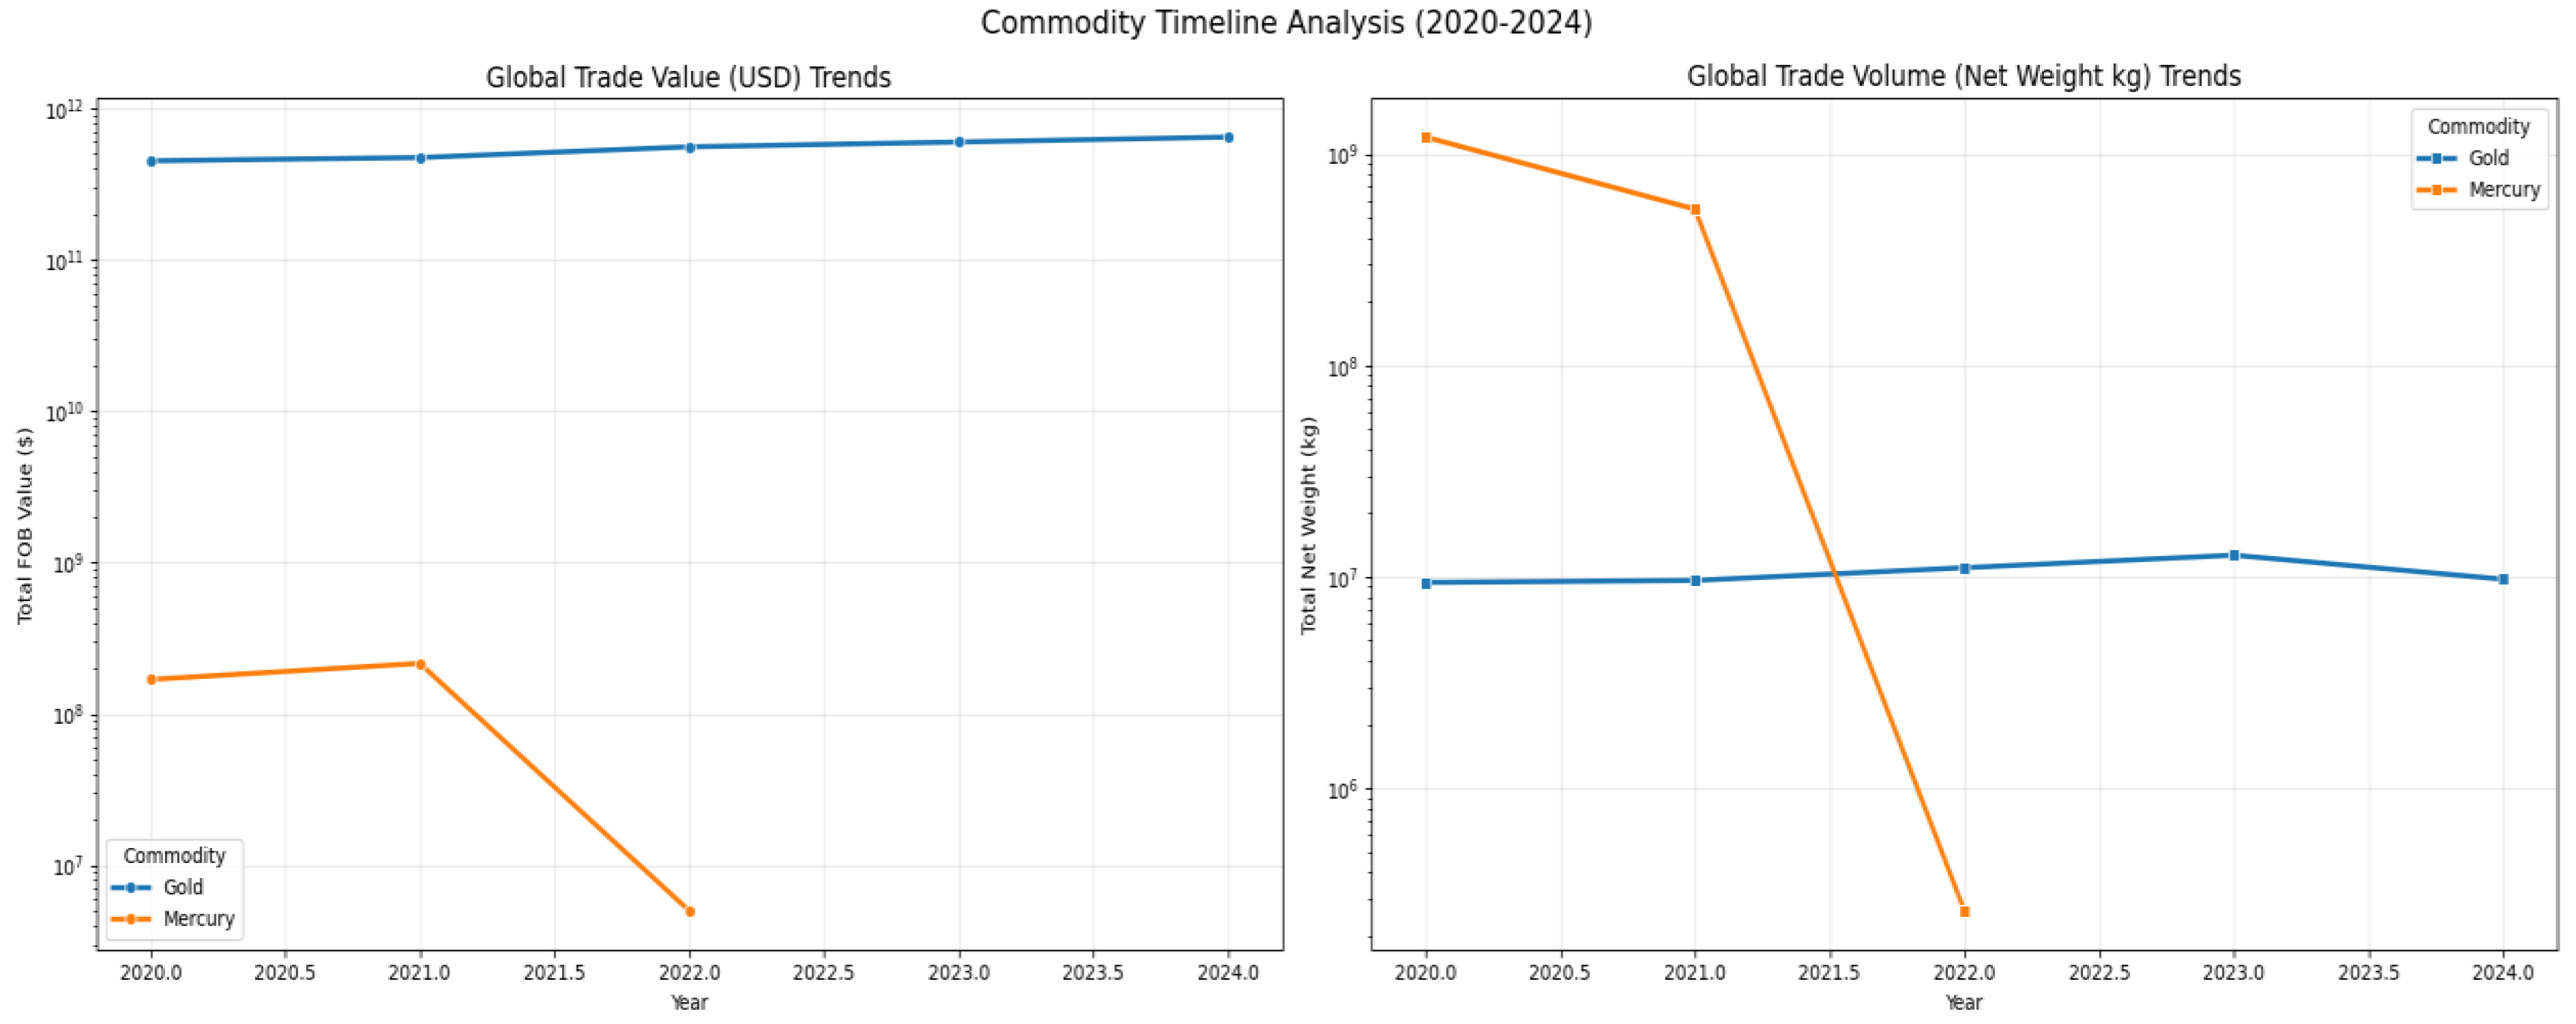
Figure 25.
Global Commodity Timeline Analysis - Divergent Trends in Gold and Mercury Trade Value and Volume (2020–2024) Source: Processed by Author (2025).
Figure 25.
Global Commodity Timeline Analysis - Divergent Trends in Gold and Mercury Trade Value and Volume (2020–2024) Source: Processed by Author (2025).
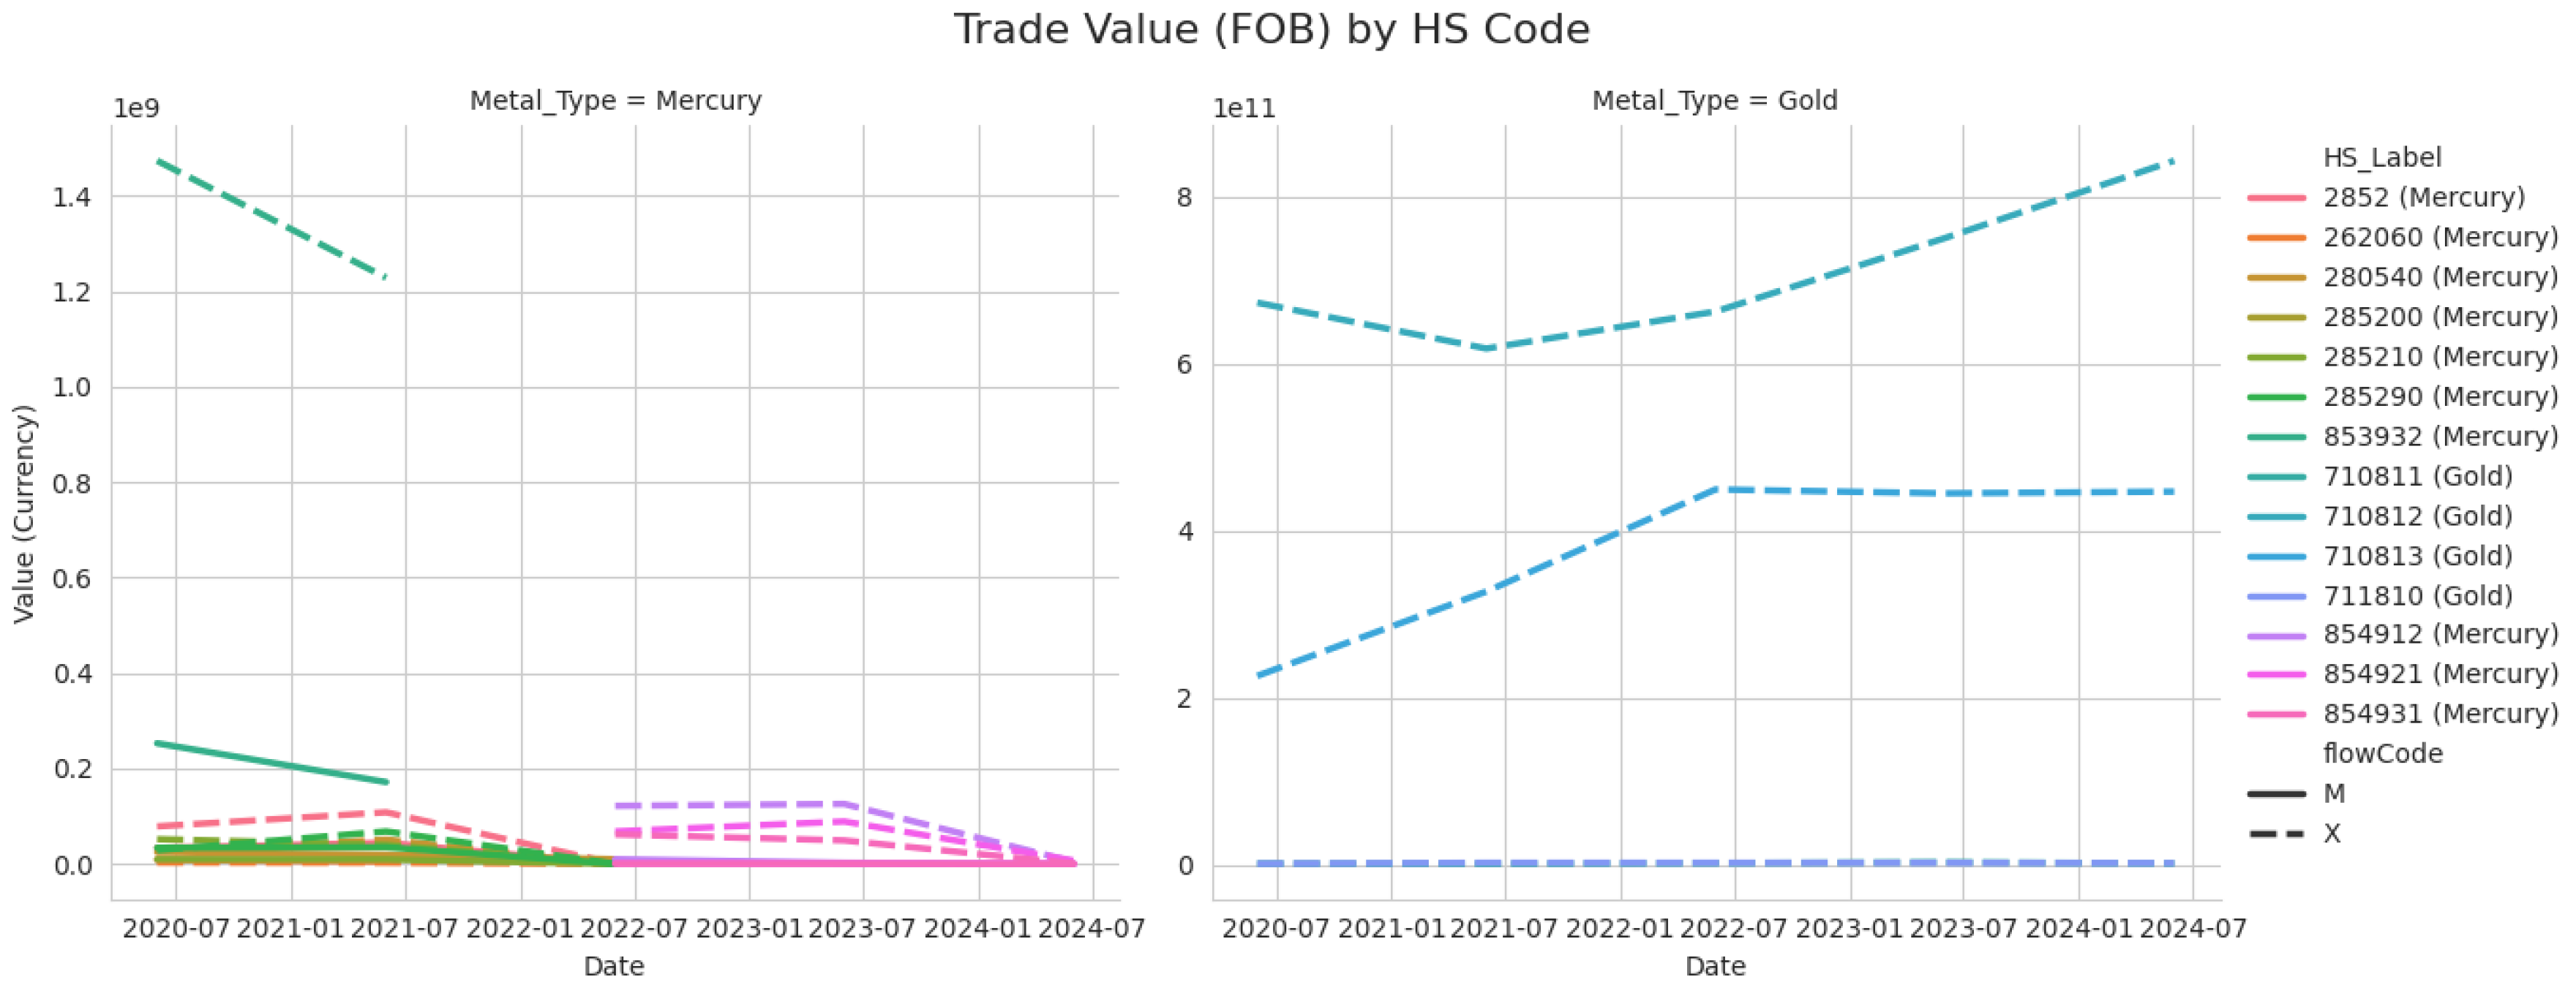
Figure 26.
Longitudinal Analysis of Trade Value (FOB) Disaggregated by HS Code for Gold and Mercury. (2020–2024) Source: Processed by Author (2025).
Figure 26.
Longitudinal Analysis of Trade Value (FOB) Disaggregated by HS Code for Gold and Mercury. (2020–2024) Source: Processed by Author (2025).
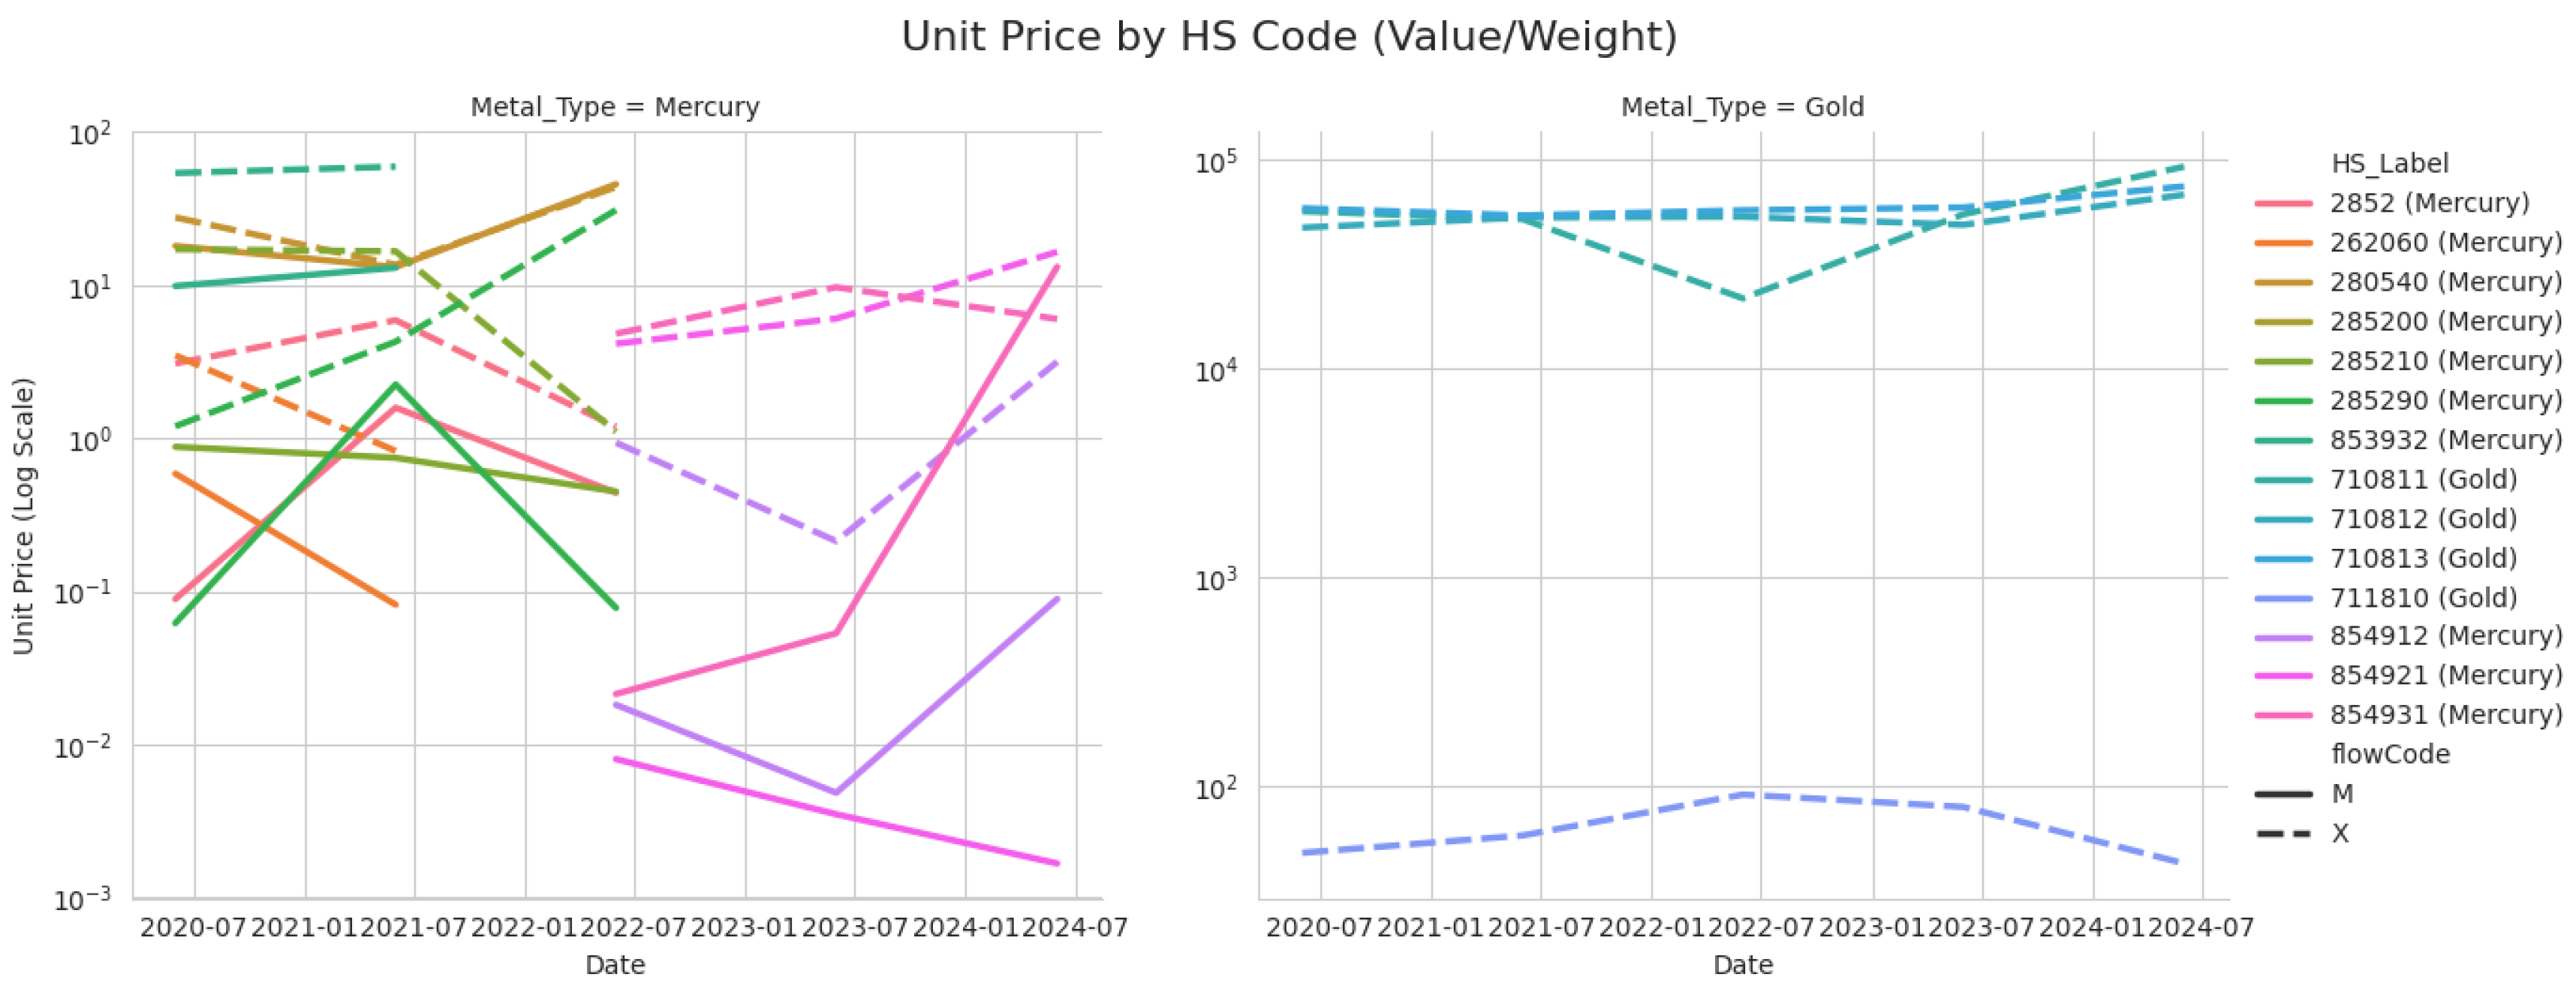
Figure 27.
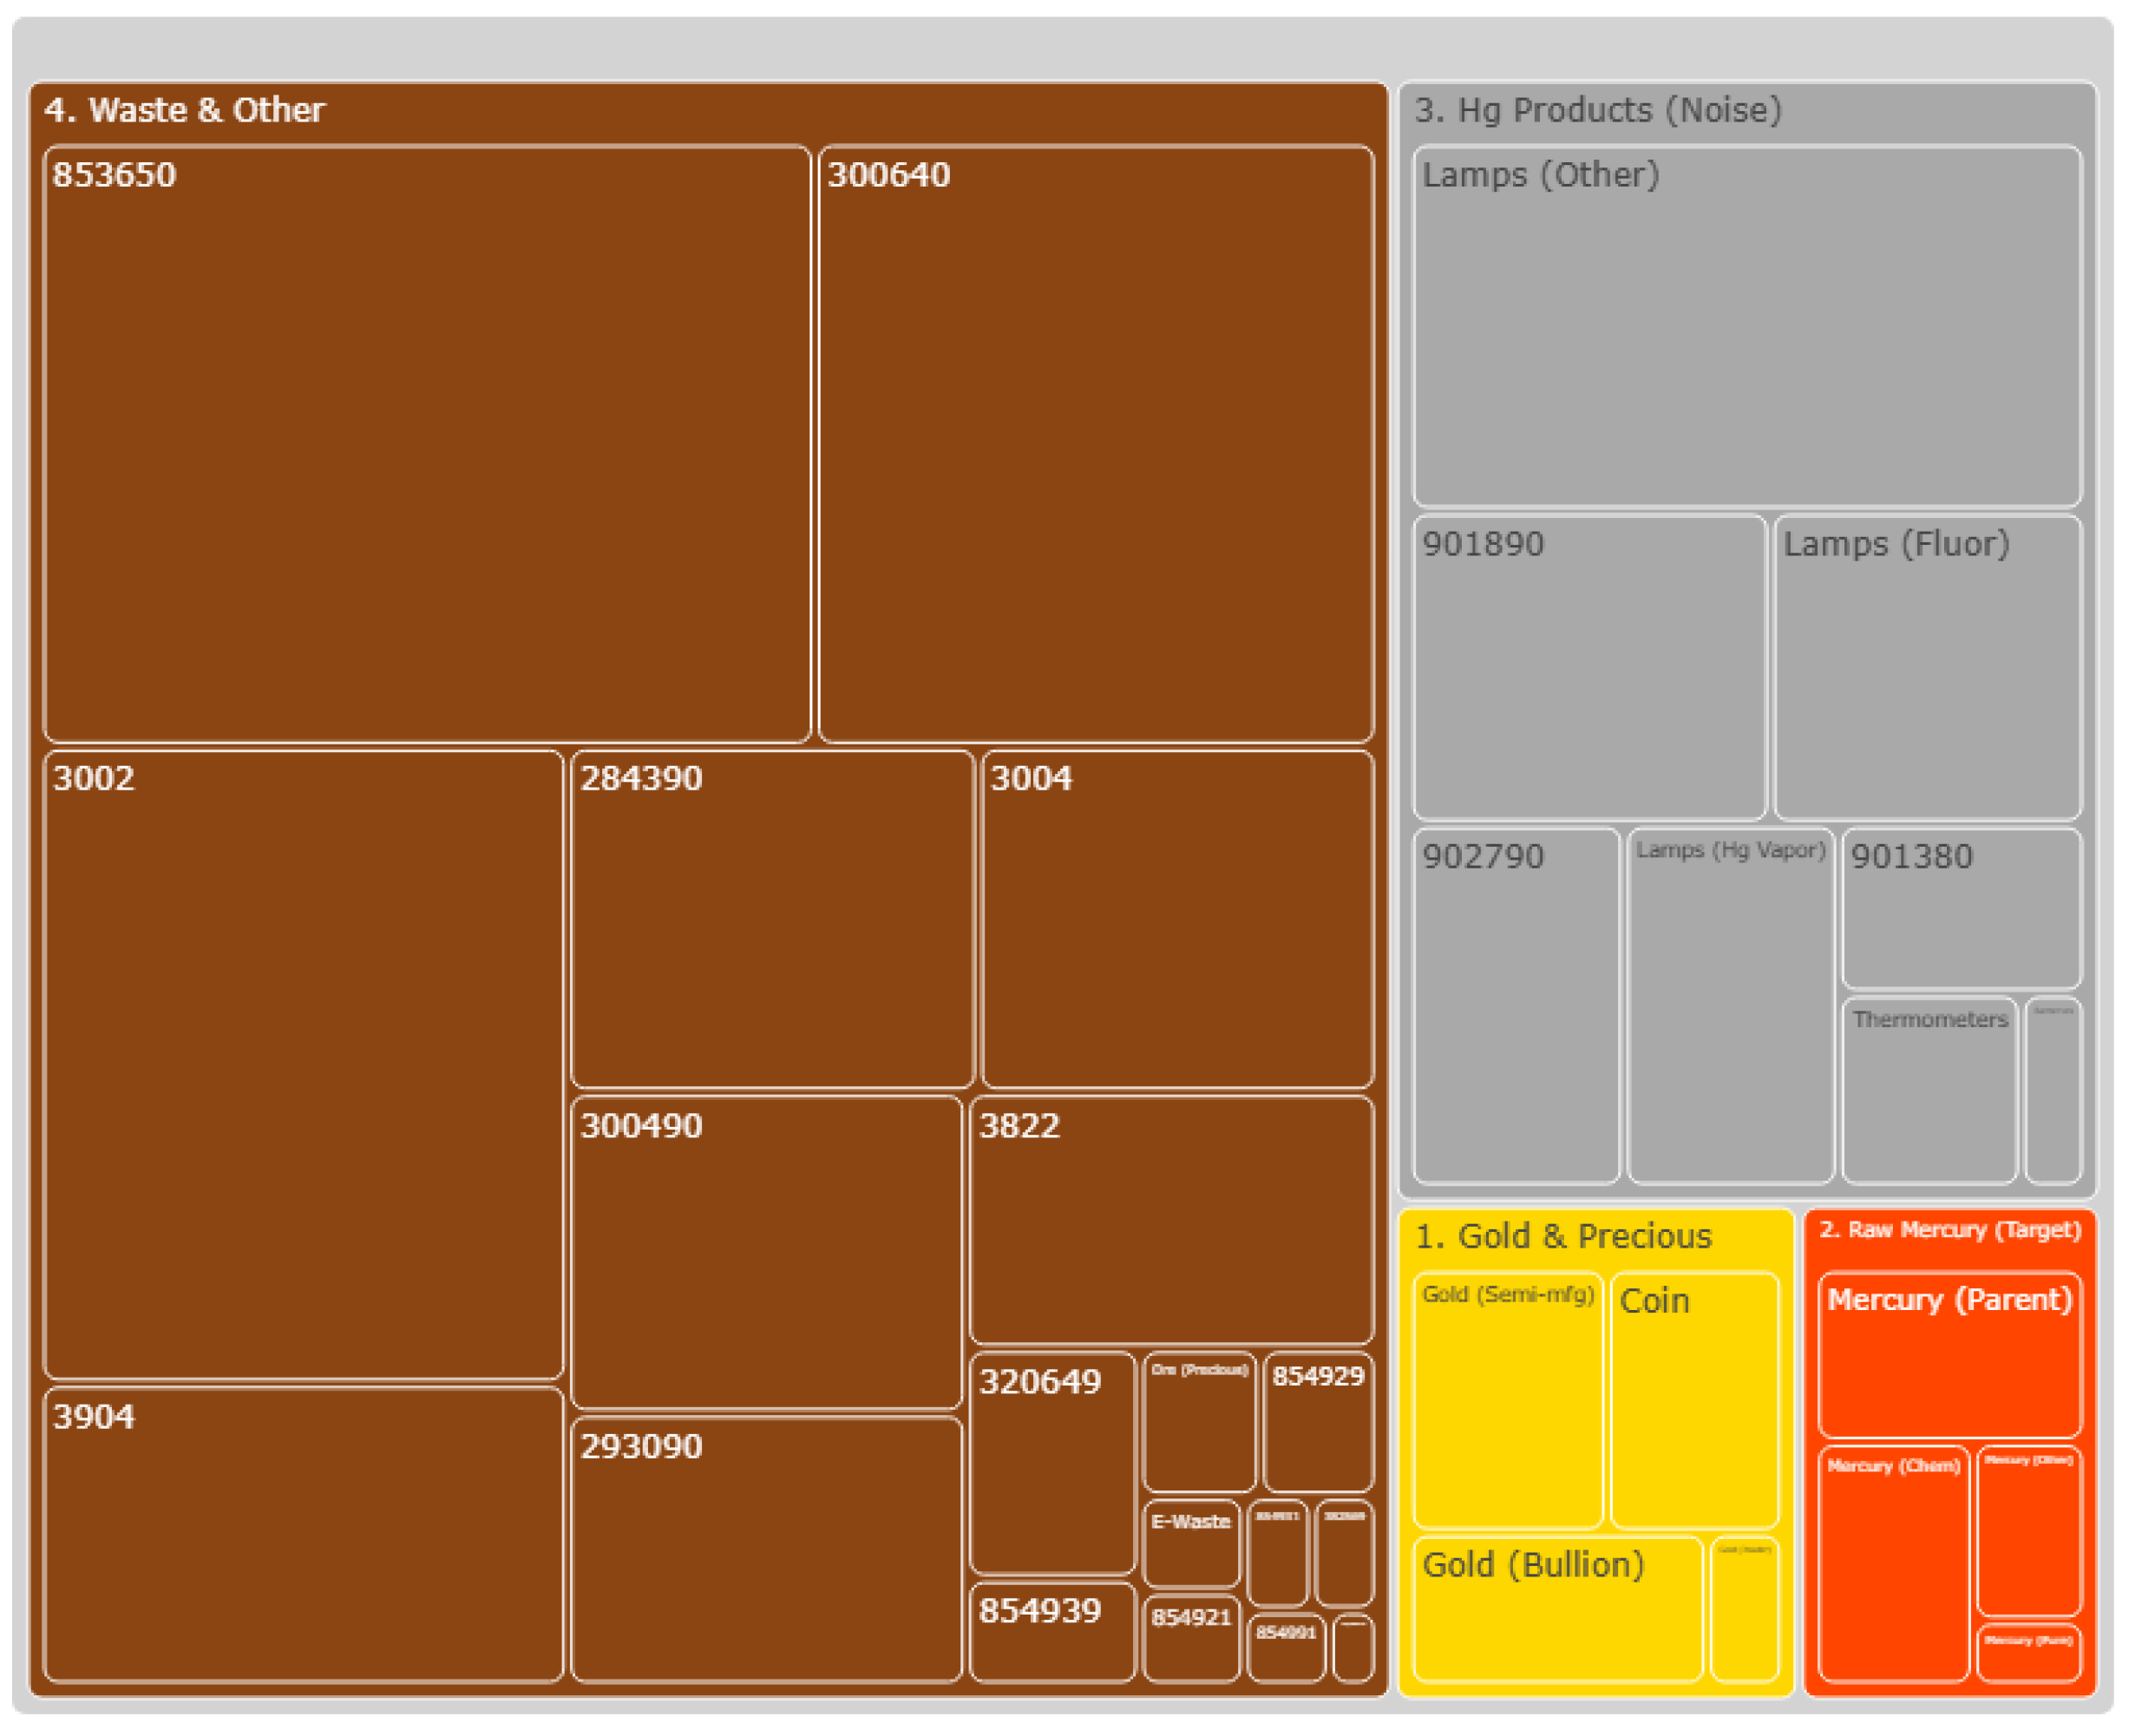
Treemap of Transaction Volumes Aggregated by HS Code used in this research. Source: Processed by Author (2025).
Figure 27.
Treemap of Transaction Volumes Aggregated by HS Code used in this research. Source: Processed by Author (2025).
References
- Athey, S.; Imbens, G.W. Machine Learning Methods That Economists Should Know About. Annu. Rev. Econ. 2019, 11, 685–725. [CrossRef]
- Barabási, A.-L. (2016). Network science. Cambridge University Press.
- Breunig, M. M., Kriegel, H.-P., Ng, R. T., & Sander, J. (2000). LOF: Identifying density-based local outliers. Proceedings of the 2000 ACM SIGMOD International Conference on Management of Data, 93–104.
- Chandola, V., Banerjee, A., & Kumar, V. (2009). Anomaly detection: A survey. ACM Computing Surveys, 41(3), 1–58.
- Chernozhukov, V., et al. (2018). Double/debiased machine learning for treatment and structural parameters. The Econometrics Journal, 21(1), C1–C68.
- Esdaile, L.J.; Chalker, J.M. The Mercury Problem in Artisanal and Small-Scale Gold Mining. Chemistry 2018, 24, 6905–6916. [CrossRef]
- Ester, M., Kriegel, H.-P., Sander, J., & Xu, X. (1996). A density-based algorithm for discovering clusters in large spatial databases with noise. KDD-96, 226–231.
- Ferwerda, J.; Kattenberg, M.; Chang, H.-H.; Unger, B.; Groot, L.; Bikker, J.A. Gravity models of trade-based money laundering. Appl. Econ. 2013, 45, 3170–3182. [CrossRef]
- Garlaschelli, D.; Loffredo, M.I. Structure and evolution of the world trade network. Phys. A: Stat. Mech. its Appl. 2005, 355, 138–144. [CrossRef]
- Hilson, G.; McQuilken, J. Four decades of support for artisanal and small-scale mining in sub-Saharan Africa: A critical review. Extr. Ind. Soc. 2014, 1, 104–118. [CrossRef]
- Hochreiter, S., & Schmidhuber, J. (1997). Long short-term memory. Neural Computation, 9(8), 1735–1780.
- Killick, R.; Fearnhead, P.; Eckley, I.A. Optimal Detection of Changepoints With a Linear Computational Cost. J. Am. Stat. Assoc. 2012, 107, 1590–1598. [CrossRef]
- Liu, F. T., Ting, K. M., & Zhou, Z.-H. (2008). Isolation forest. IEEE ICDM, 413–422.
- Lundberg, S. M., & Lee, S.-I. (2017). A unified approach to interpreting model predictions. NeurIPS, 30.
- Minamata Convention on Mercury. (2013). Text of the Minamata Convention on Mercury. UNEP.
- Nigrini, M. J. (2012). Benford’s law: Applications for forensic accounting, auditing, and fraud detection. Wiley.
- Pedregosa, F., et al. (2011). Scikit-learn: Machine learning in Python. JMLR, 12, 2825–2830.
- Reynolds, D. A. (2009). Gaussian mixture models. In S. Z. Li & A. Jain (Eds.), Encyclopedia of biometrics (pp. 659–663). Springer.
- Sagheer, A.; Kotb, M. Time series forecasting of petroleum production using deep LSTM recurrent networks. Neurocomputing 2019, 323, 203–213. [CrossRef]
- Salazar-Camacho, C., et al. (2021). Mercury use in artisanal and small-scale gold mining in Peru. Current Opinion in Environmental Science & Health, 23, 100277.
- Schölkopf, B.; Smola, A.; Müller, K.-R. Nonlinear Component Analysis as a Kernel Eigenvalue Problem. Neural Comput. 1998, 10, 1299–1319. [CrossRef]
- Sippl, K. (2015). Private and civil society standards in the gold supply chain. Resources Policy, 43, 86–95.
- Spapens, T. (2013). Macro situations of crime: The balloon effect. Crime, Law and Social Change, 59, 149–160. (Note: Year corrected from 2010 to 2013 based on Volume 59 publication date).
- Spiegel, S.J. Shifting Formalization Policies and Recentralizing Power: The Case of Zimbabwe's Artisanal Gold Mining Sector. Soc. Nat. Resour. 2015, 28, 543–558. [CrossRef]
- Telmer, K. H., & Veiga, M. M. (2009). World emissions of mercury from artisanal and small-scale gold mining. In N. Pirrone & R. Mason (Eds.), Mercury fate and transport in the global atmosphere (pp. 131–172). Springer.
- Truong, C.; Oudre, L.; Vayatis, N. Selective review of offline change point detection methods. Signal Process. 2020, 167. [CrossRef]
- UNEP. (2019). Global mercury assessment 2018.
- United Nations. UN Comtrade Database. Availabe online: https://comtrade.un.org/ (accessed on 26 April 2017).
- van der Maaten, L., & Hinton, G. (2008). Visualizing data using t-SNE. JMLR, 9(11), 2579–2605.
- Varian, H.R. Big Data: New Tricks for Econometrics. J. Econ. Perspect. 2014, 28, 3–28. [CrossRef]
- Zdanowicz, J.S. Trade-Based Money Laundering and Terrorist Financing. Rev. Law Econ. 2009, 5, 855–878. [CrossRef]
- Zhang, G.P. Time series forecasting using a hybrid ARIMA and neural network model. Neurocomputing 2003, 50, 159–175. [CrossRef]
- Zhang, T., Ramakrishnan, R., & Livny, M. (1996). BIRCH: An efficient data clustering method. ACM SIGMOD, 103–114.
Figure 1.
The System Dynamics of Trade Data Adaptive Evasion vs. Enforcement. Source: Processed by Author (2025).
Figure 1.
The System Dynamics of Trade Data Adaptive Evasion vs. Enforcement. Source: Processed by Author (2025).
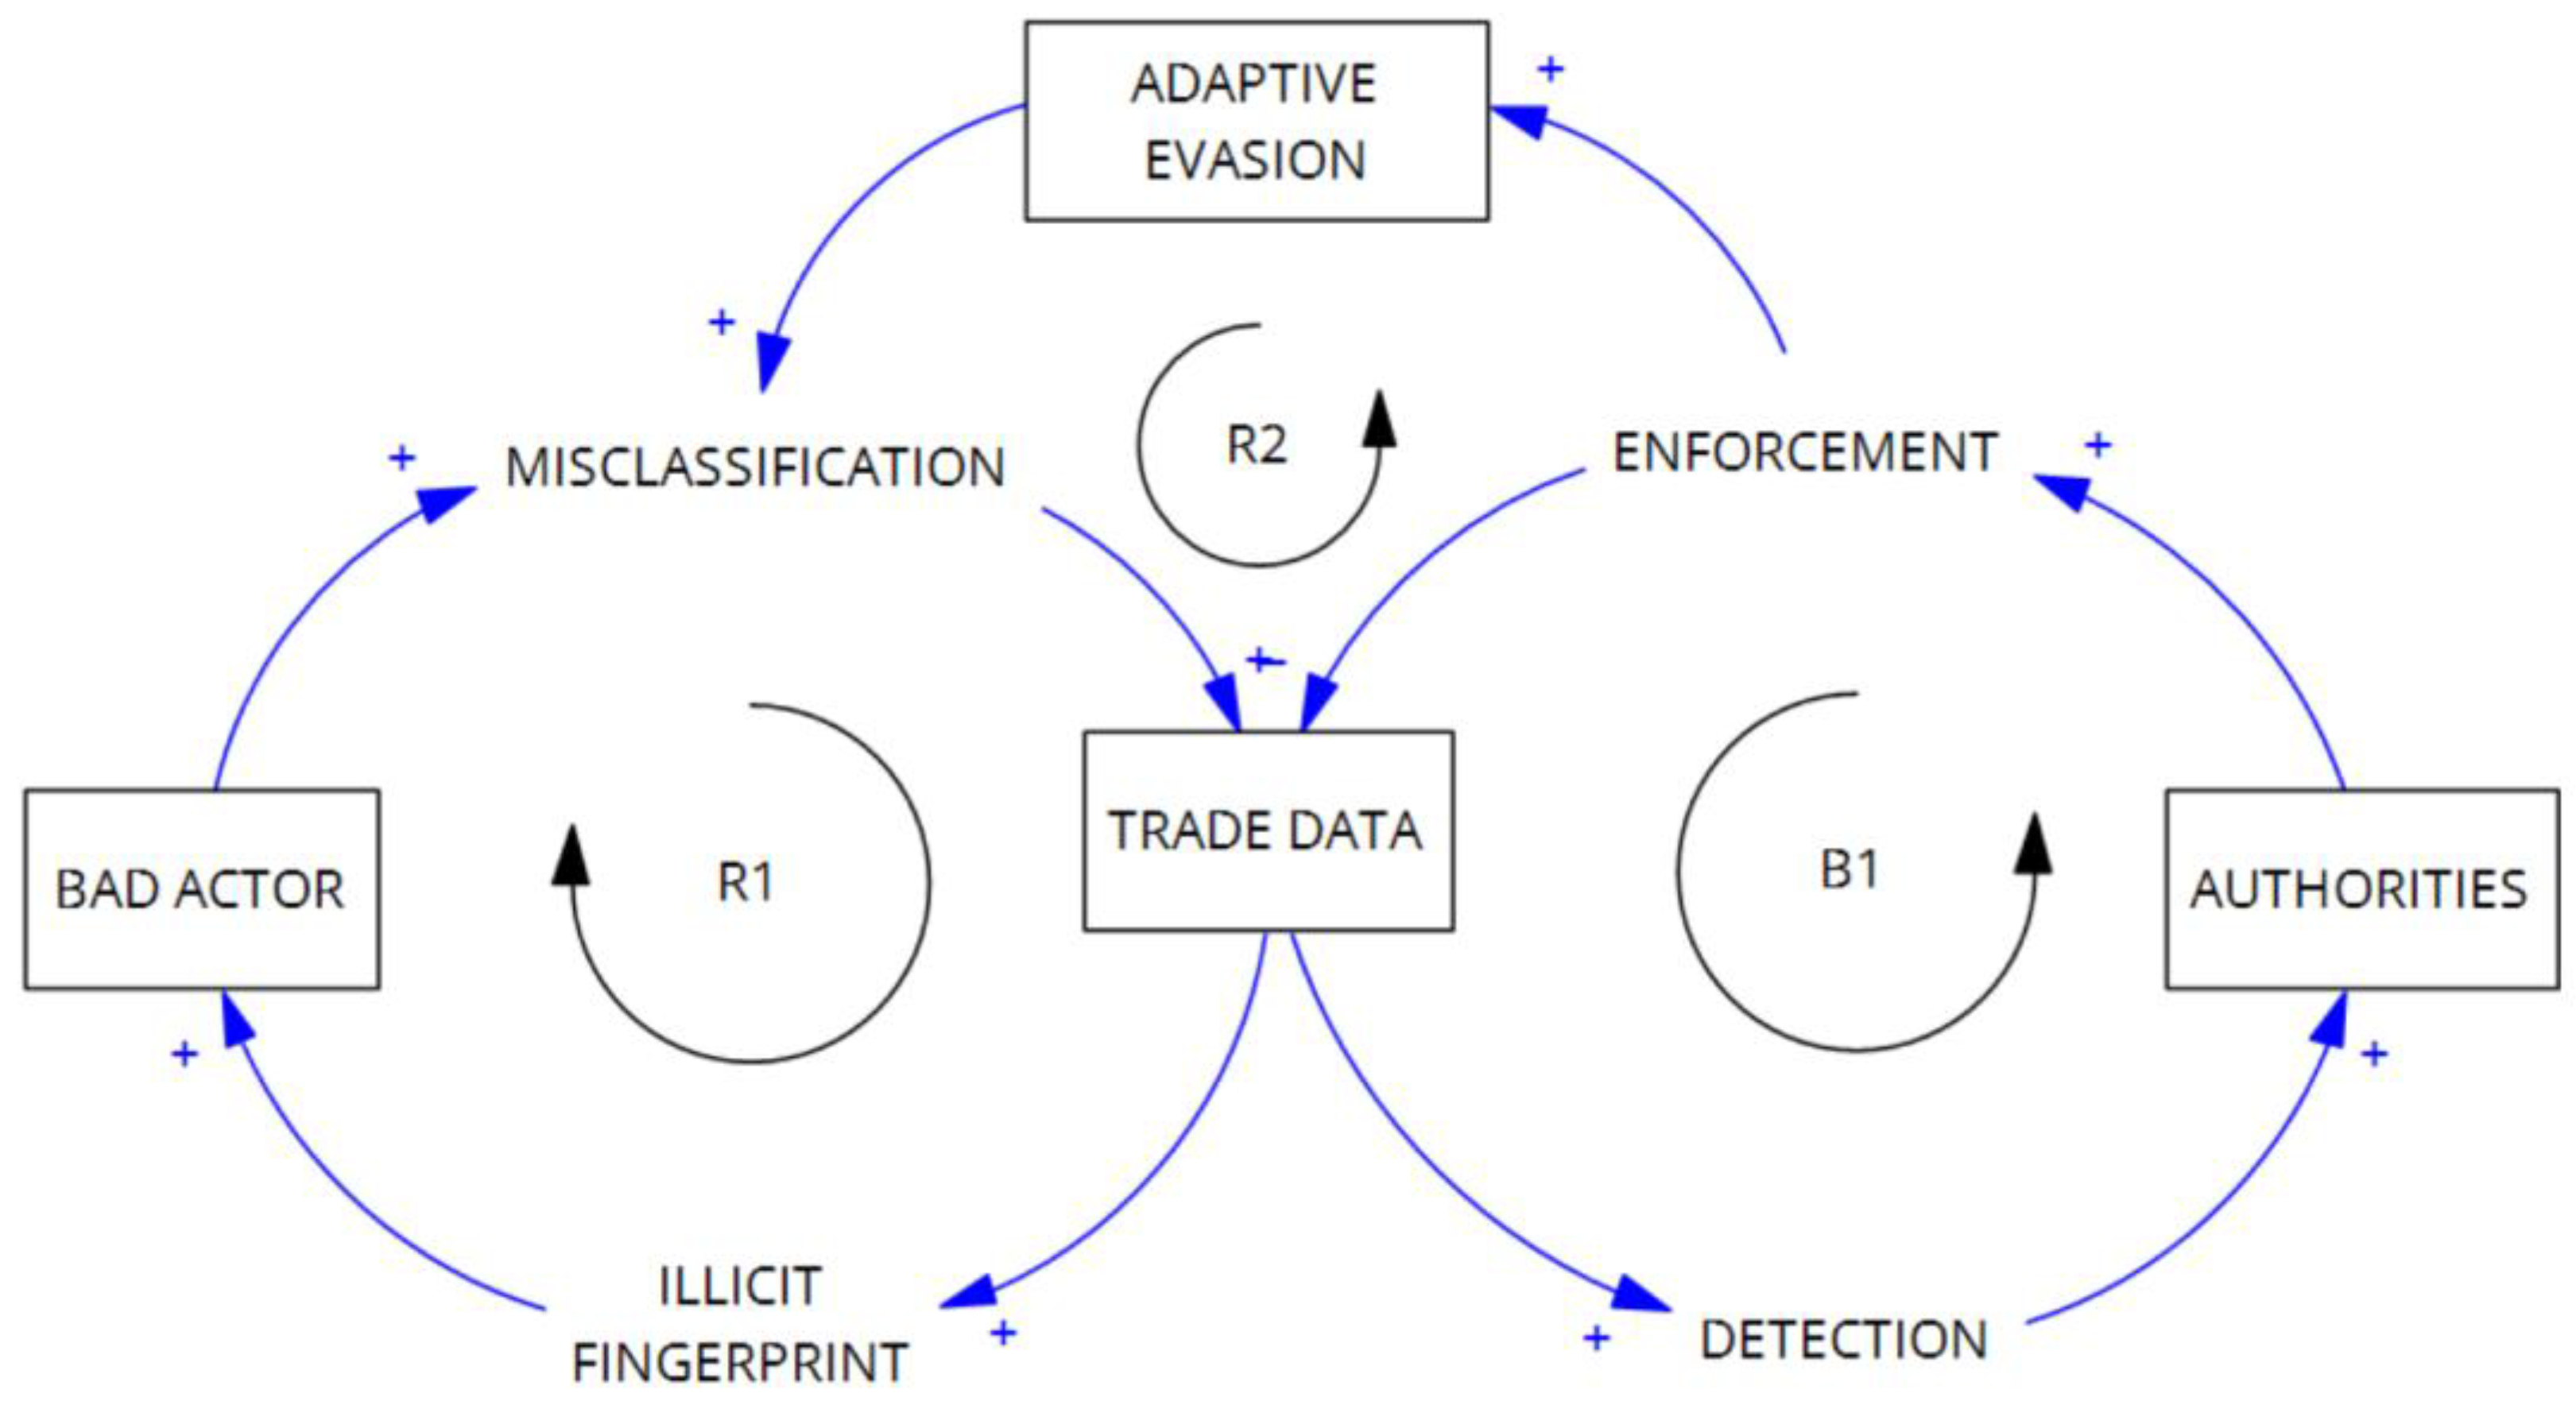
Figure 2.
Smuggling Signature: The balloon effect of volume substitution. Source: Processed by Author (2025).
Figure 2.
Smuggling Signature: The balloon effect of volume substitution. Source: Processed by Author (2025).
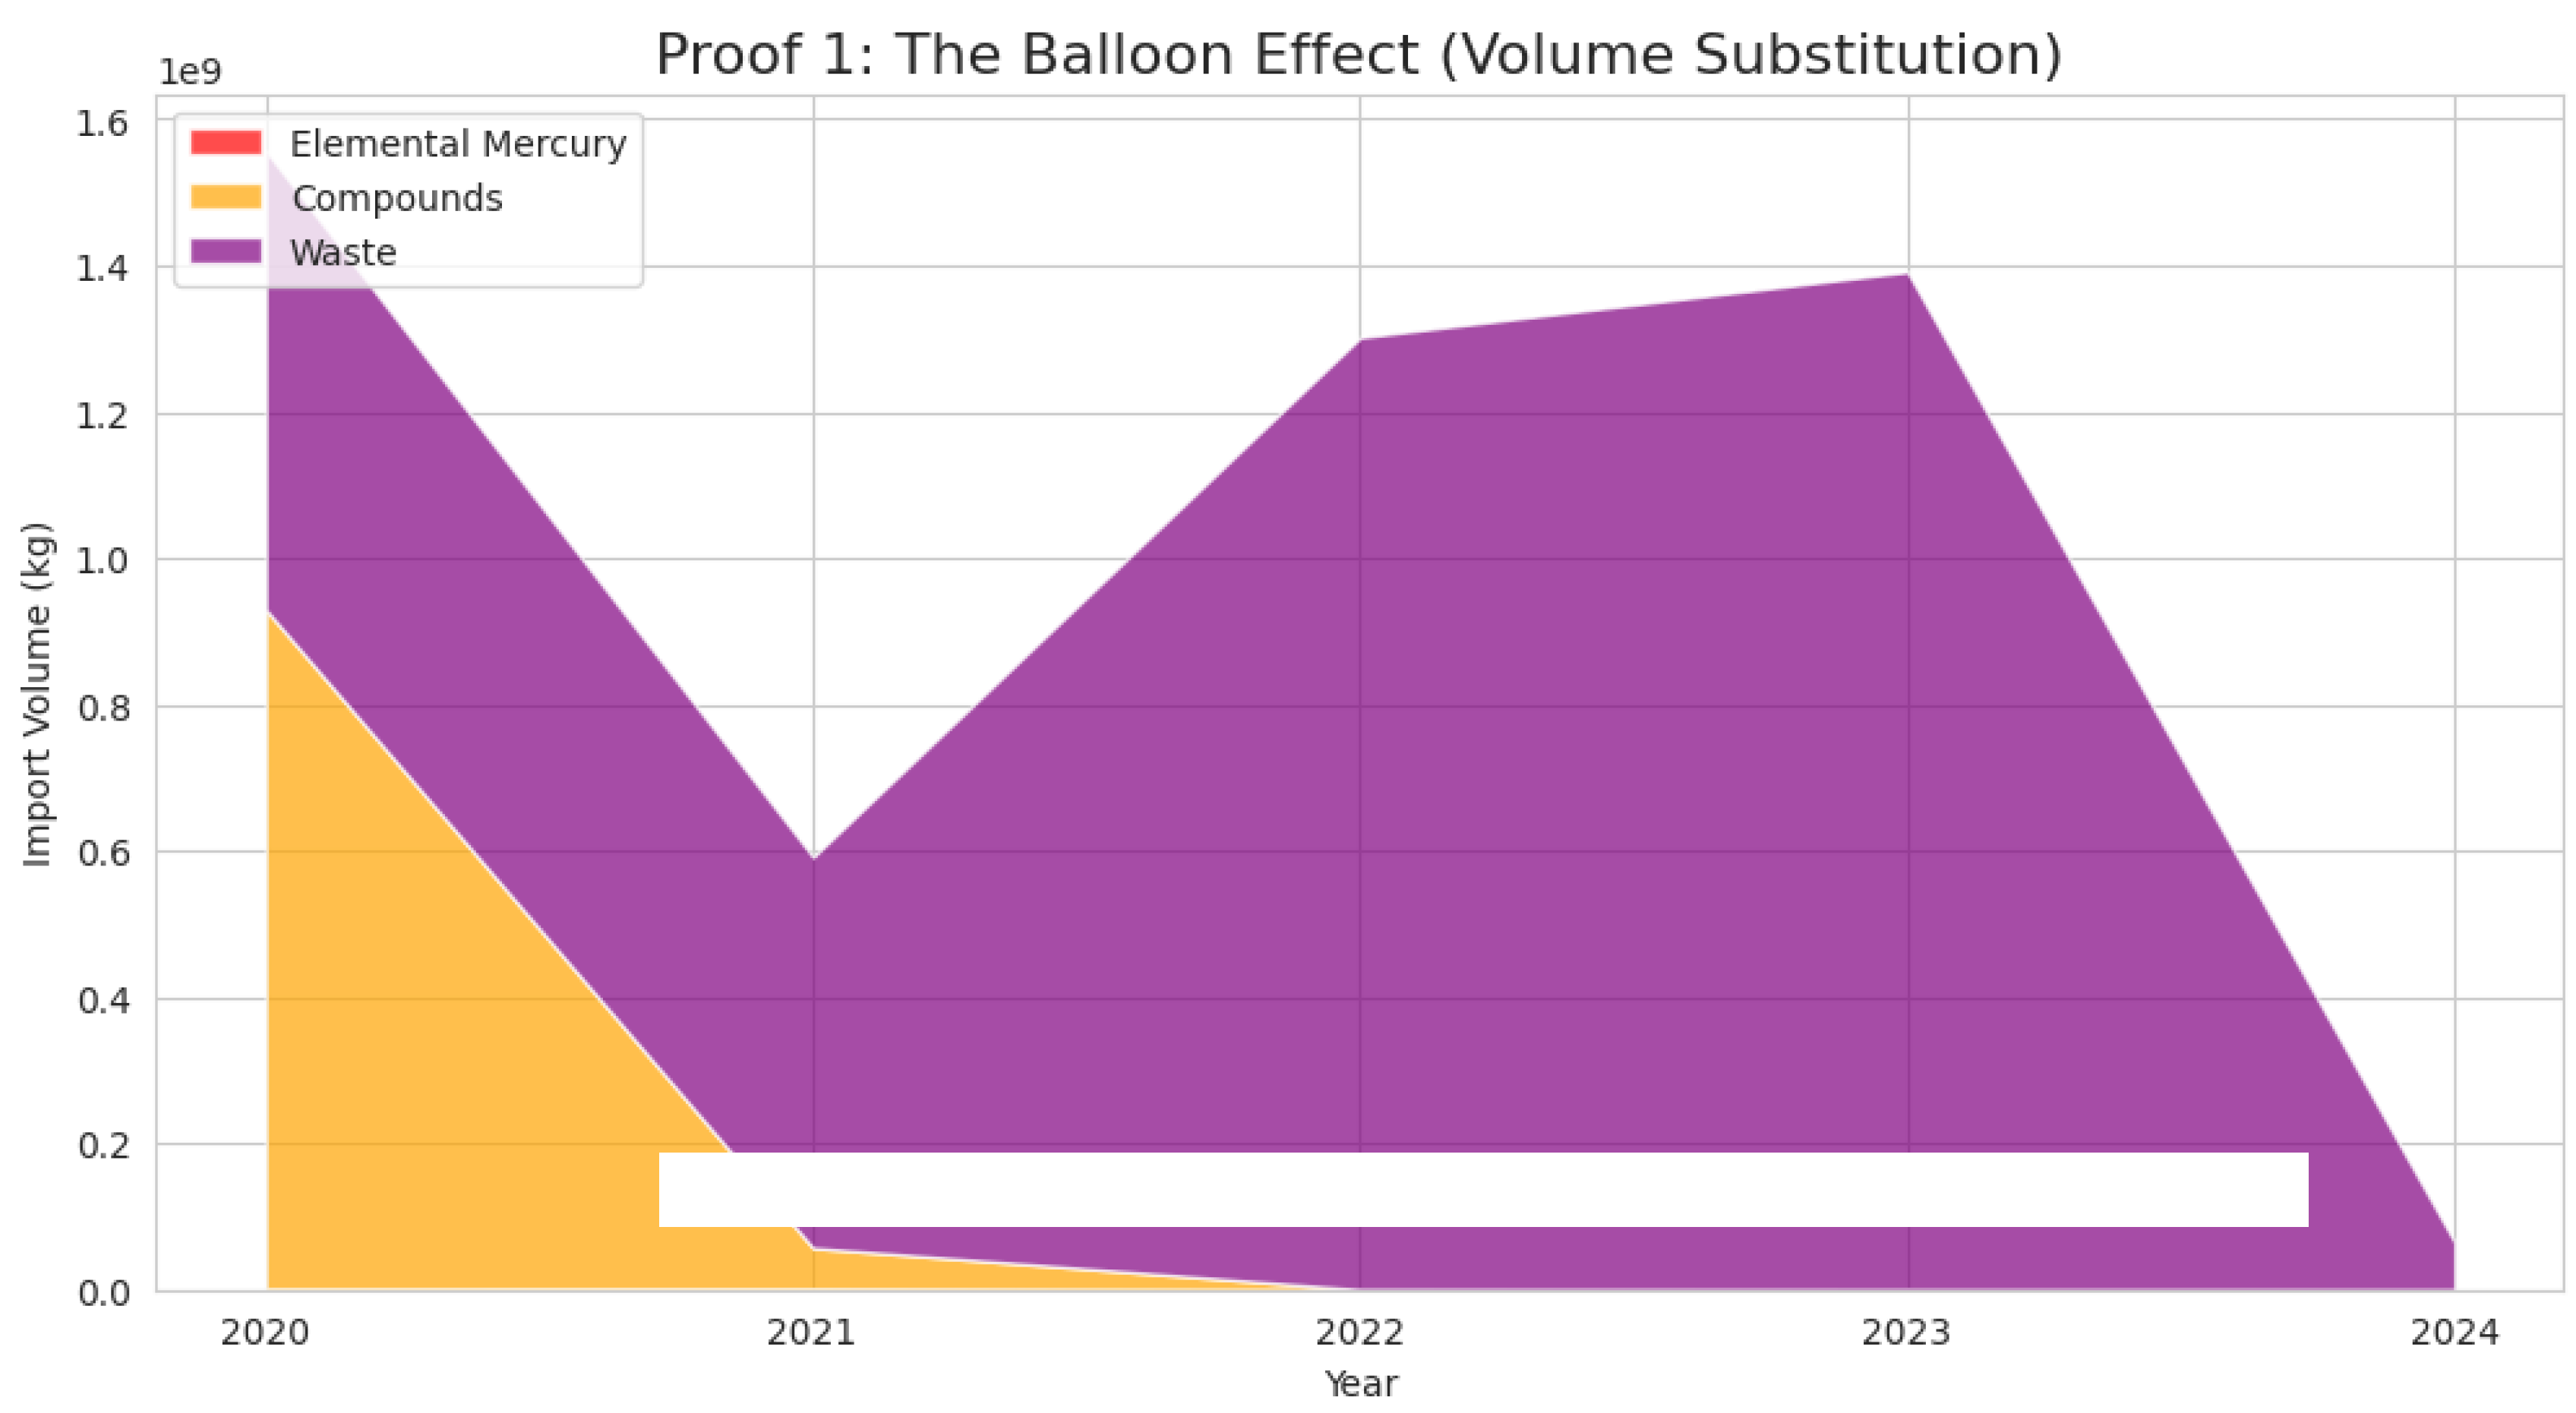
Figure 3.
Feature Correlation Matrix: Gold vs. Mercury Trade variables. Source: Processed by Author (2025).
Figure 3.
Feature Correlation Matrix: Gold vs. Mercury Trade variables. Source: Processed by Author (2025).
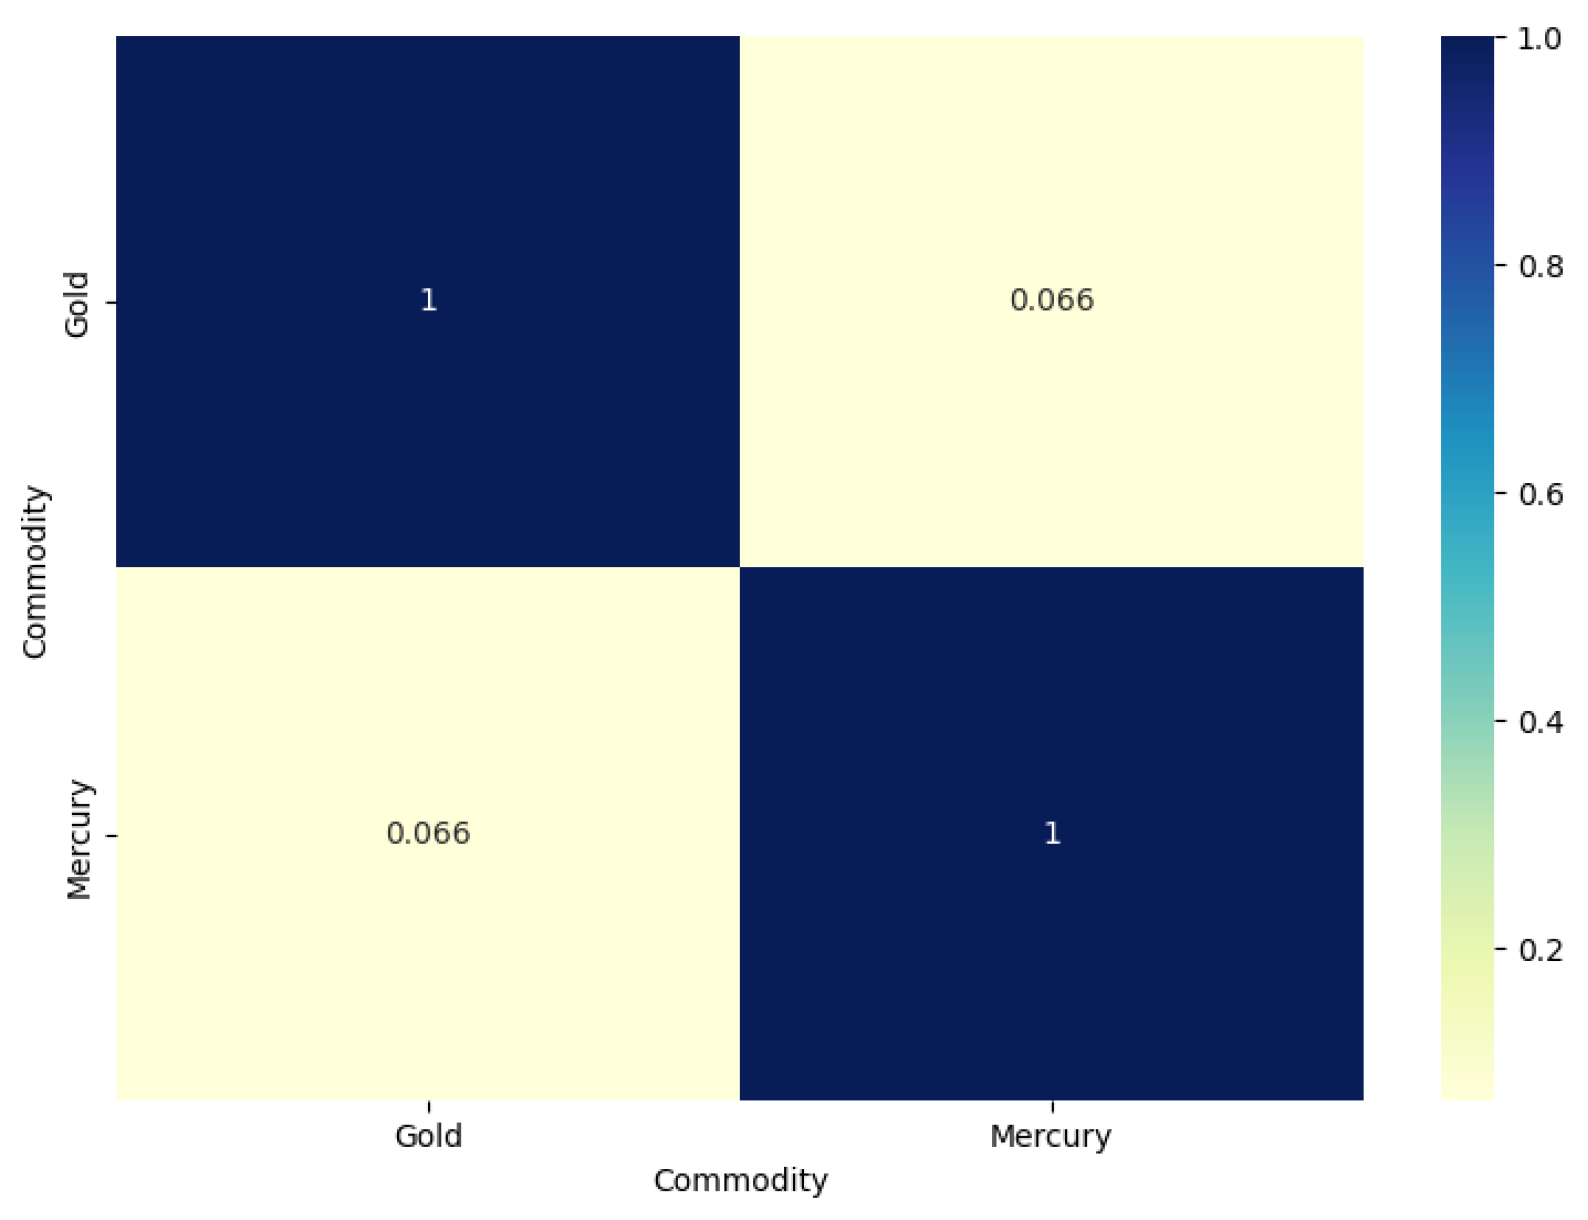
Figure 4.
Elbow Method & 2. K-Means Clustering Result. Source: Processed by Author (2025).
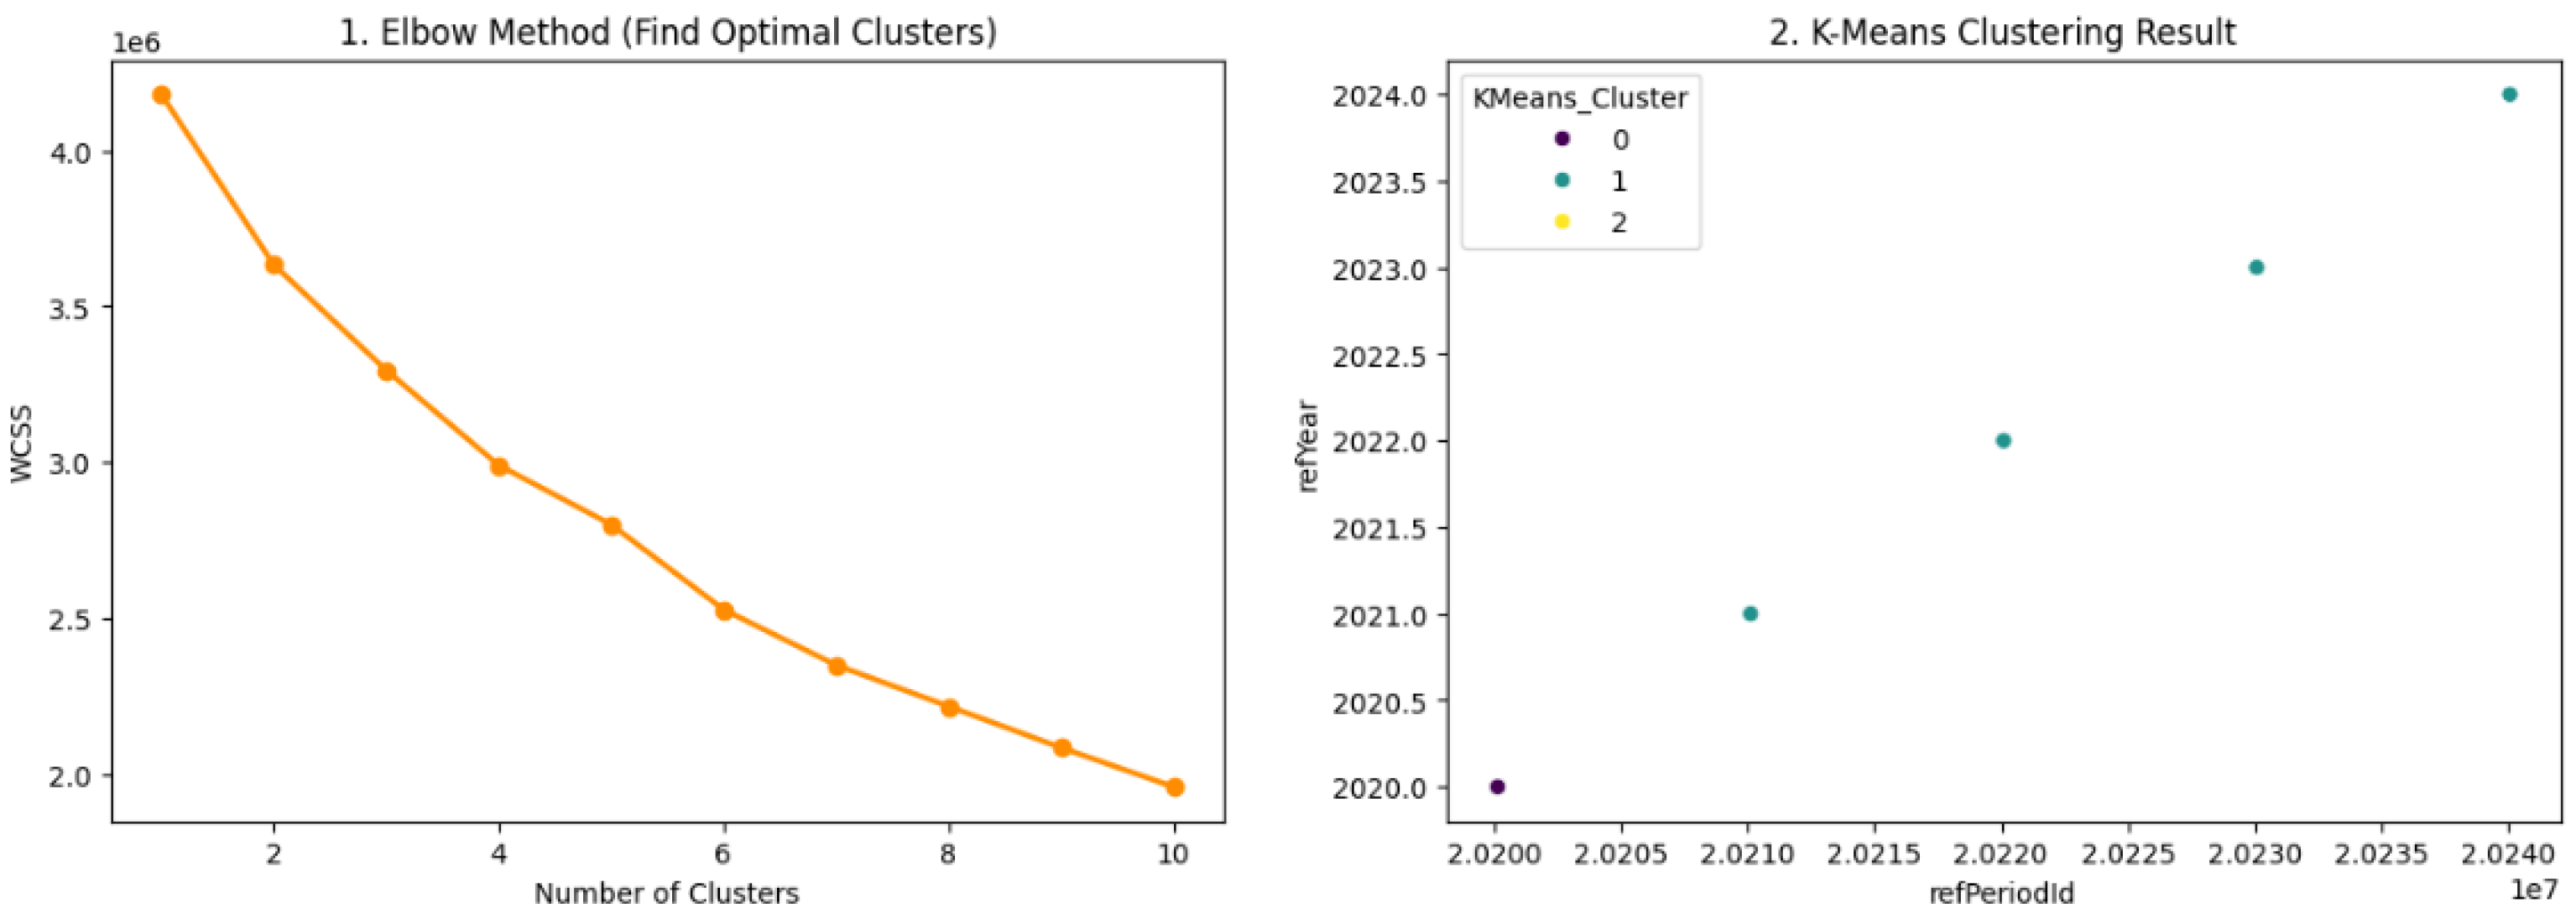
Figure 5.
Comparison of Artisanal Gold Mining Method in Term of Cost and Speed. Source: Processed by Author (2025).
Figure 5.
Comparison of Artisanal Gold Mining Method in Term of Cost and Speed. Source: Processed by Author (2025).
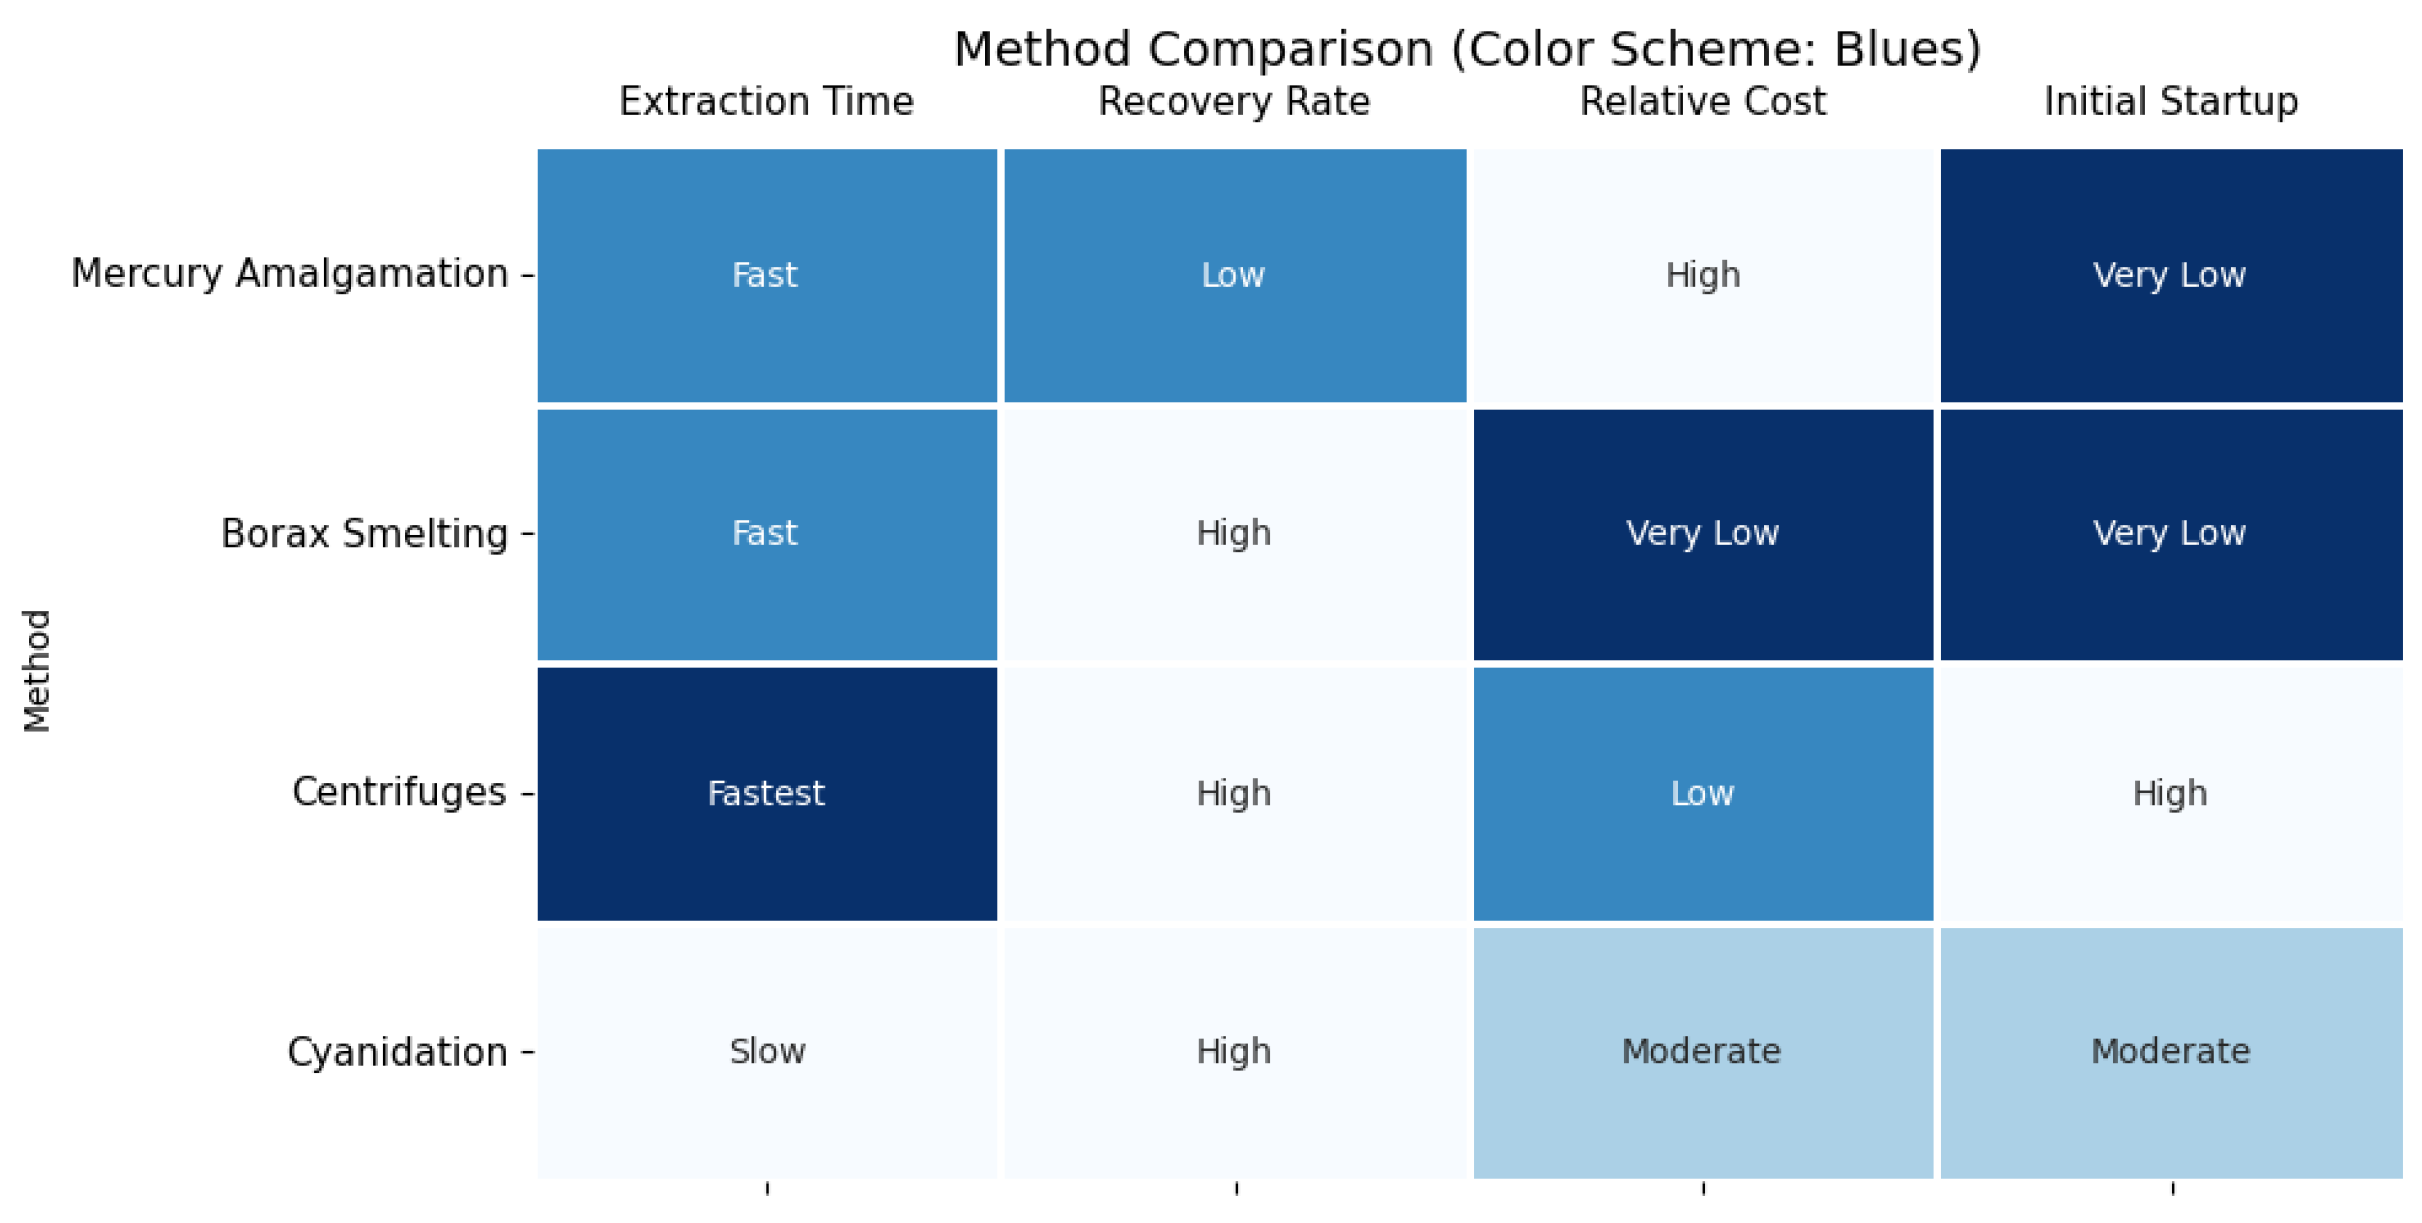
Figure 6.
Comparison Between Global Import and Export of Mercury (2020-2024). Source: Processed by Author (2025).
Figure 6.
Comparison Between Global Import and Export of Mercury (2020-2024). Source: Processed by Author (2025).
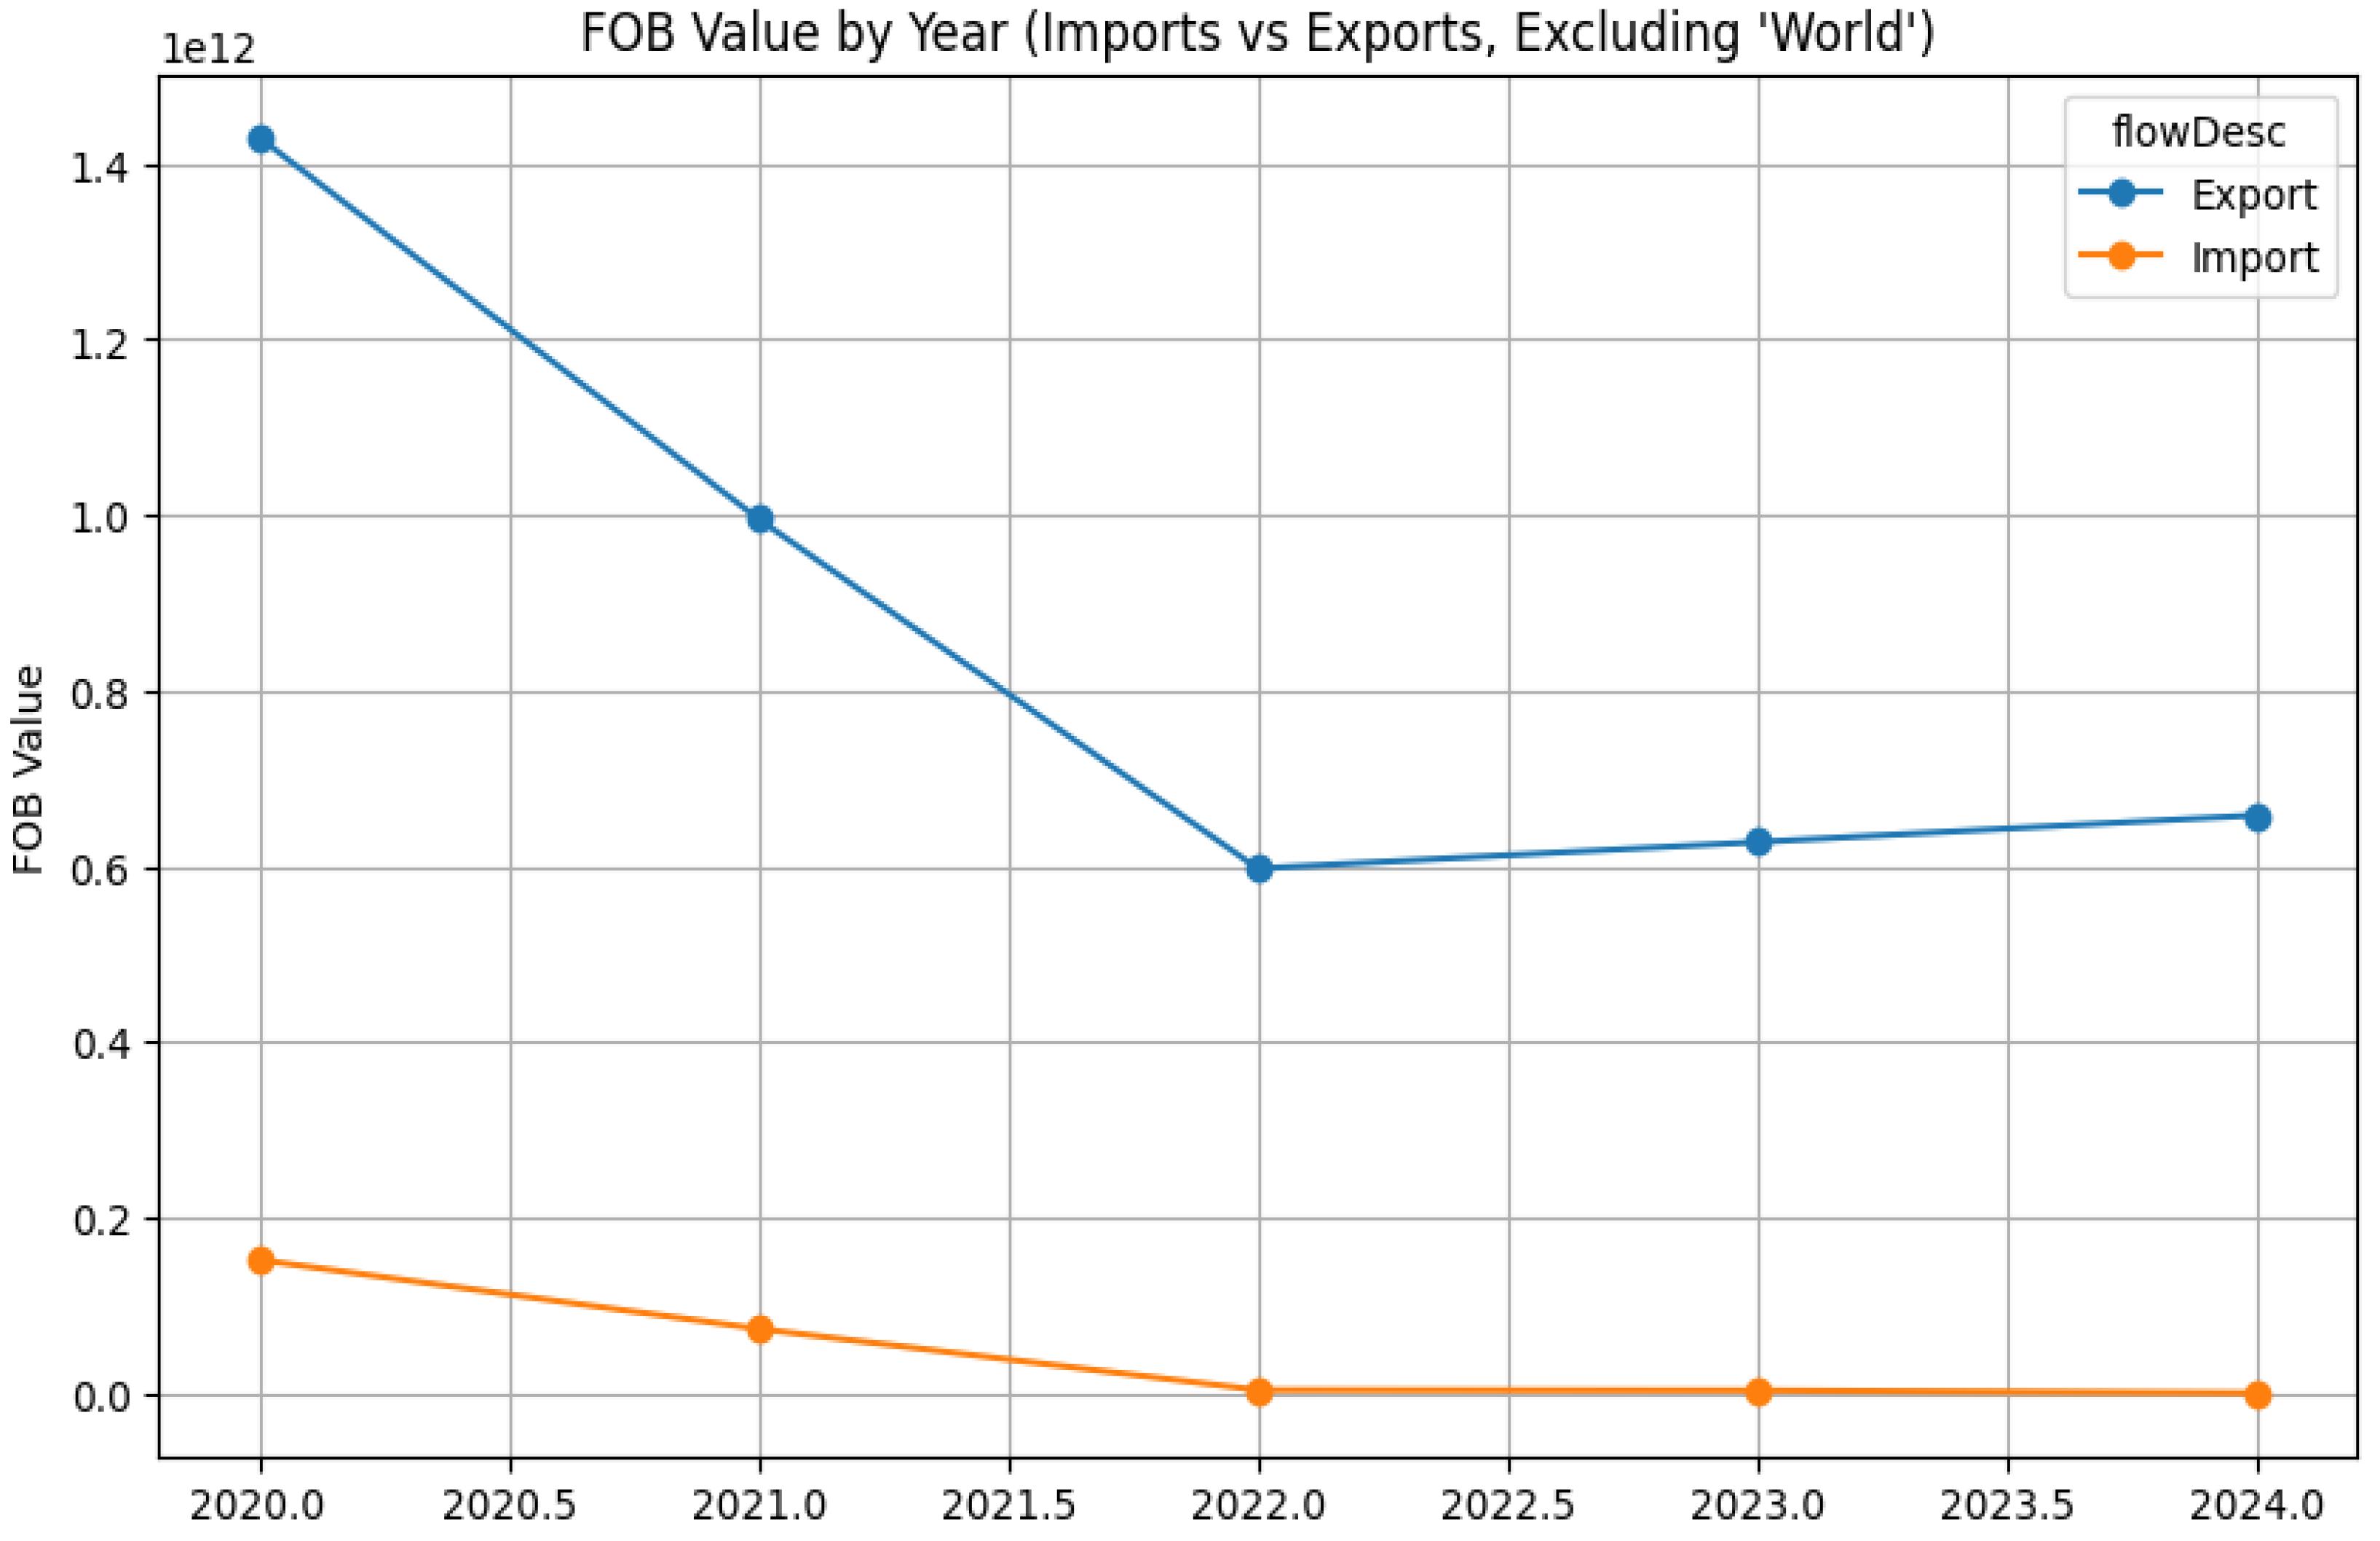
Figure 7.
Trends in Gold Export Volume (2020–2024) for Top 30 Emerging Producers with Persistent Mercury Accumulation. Source: Processed by Author (2025).
Figure 7.
Trends in Gold Export Volume (2020–2024) for Top 30 Emerging Producers with Persistent Mercury Accumulation. Source: Processed by Author (2025).
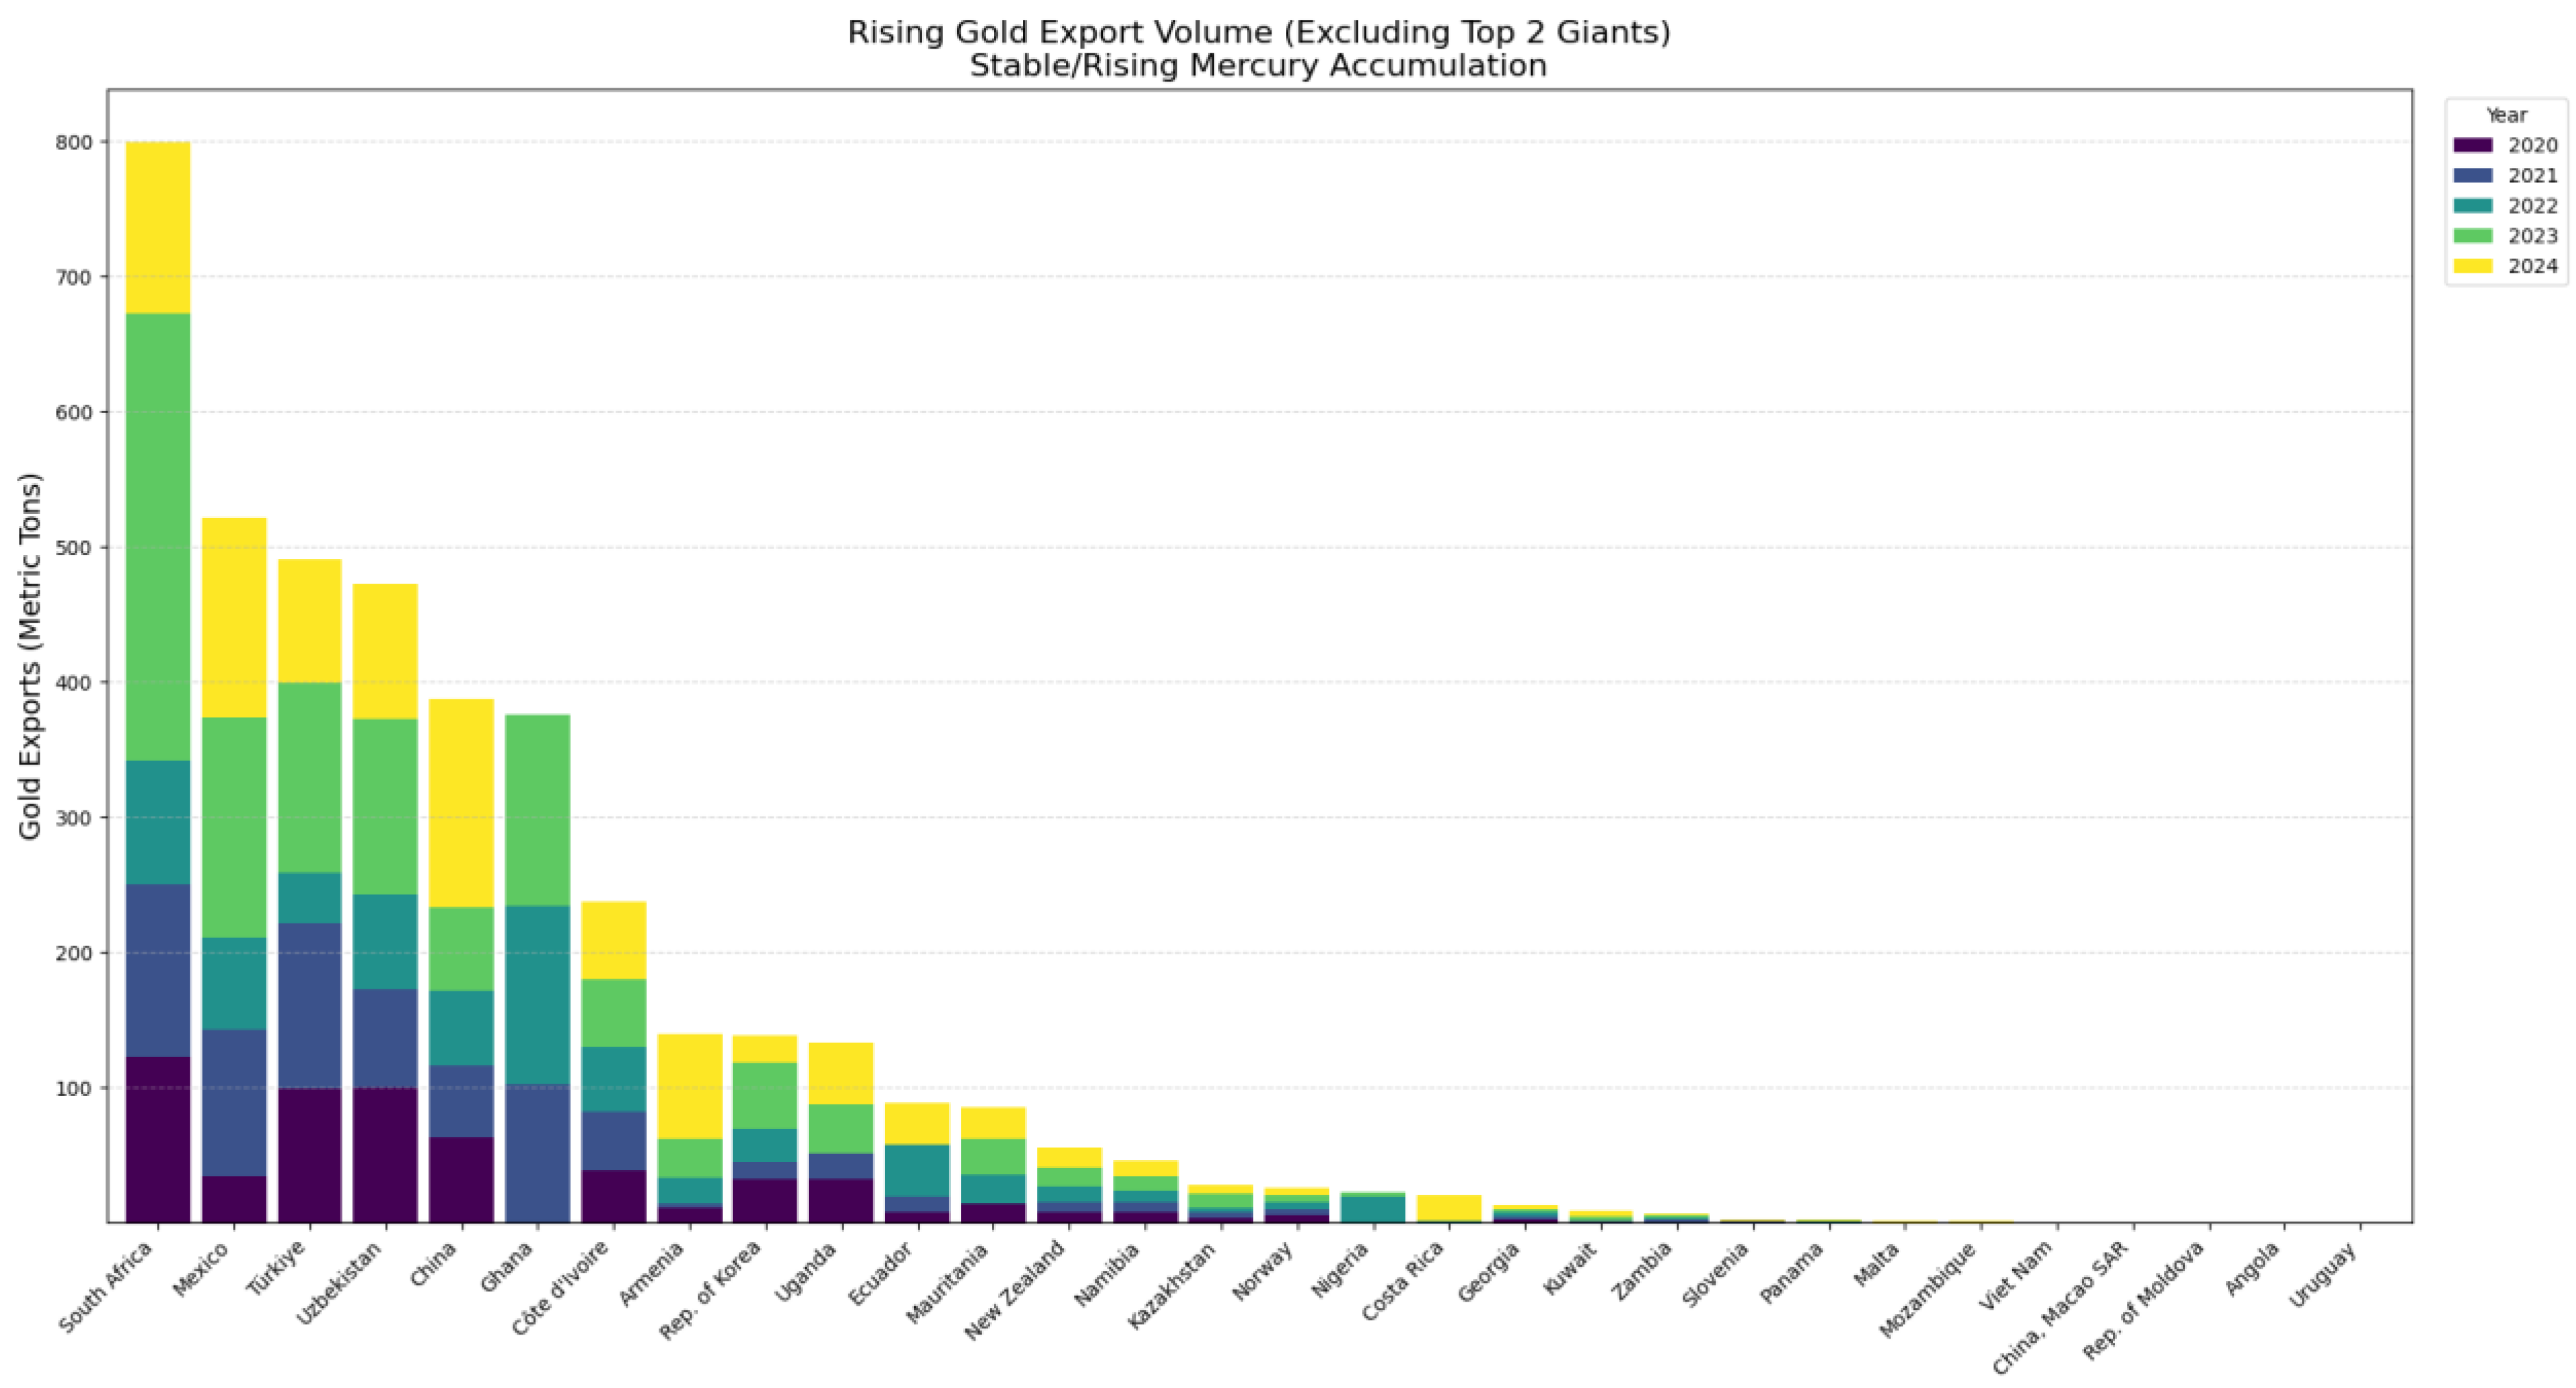
Figure 8.
ML Prediction: Scatter Plot of Isolation Forest Detection (2020-2024). Source: Processed by Author (2025).
Figure 8.
ML Prediction: Scatter Plot of Isolation Forest Detection (2020-2024). Source: Processed by Author (2025).
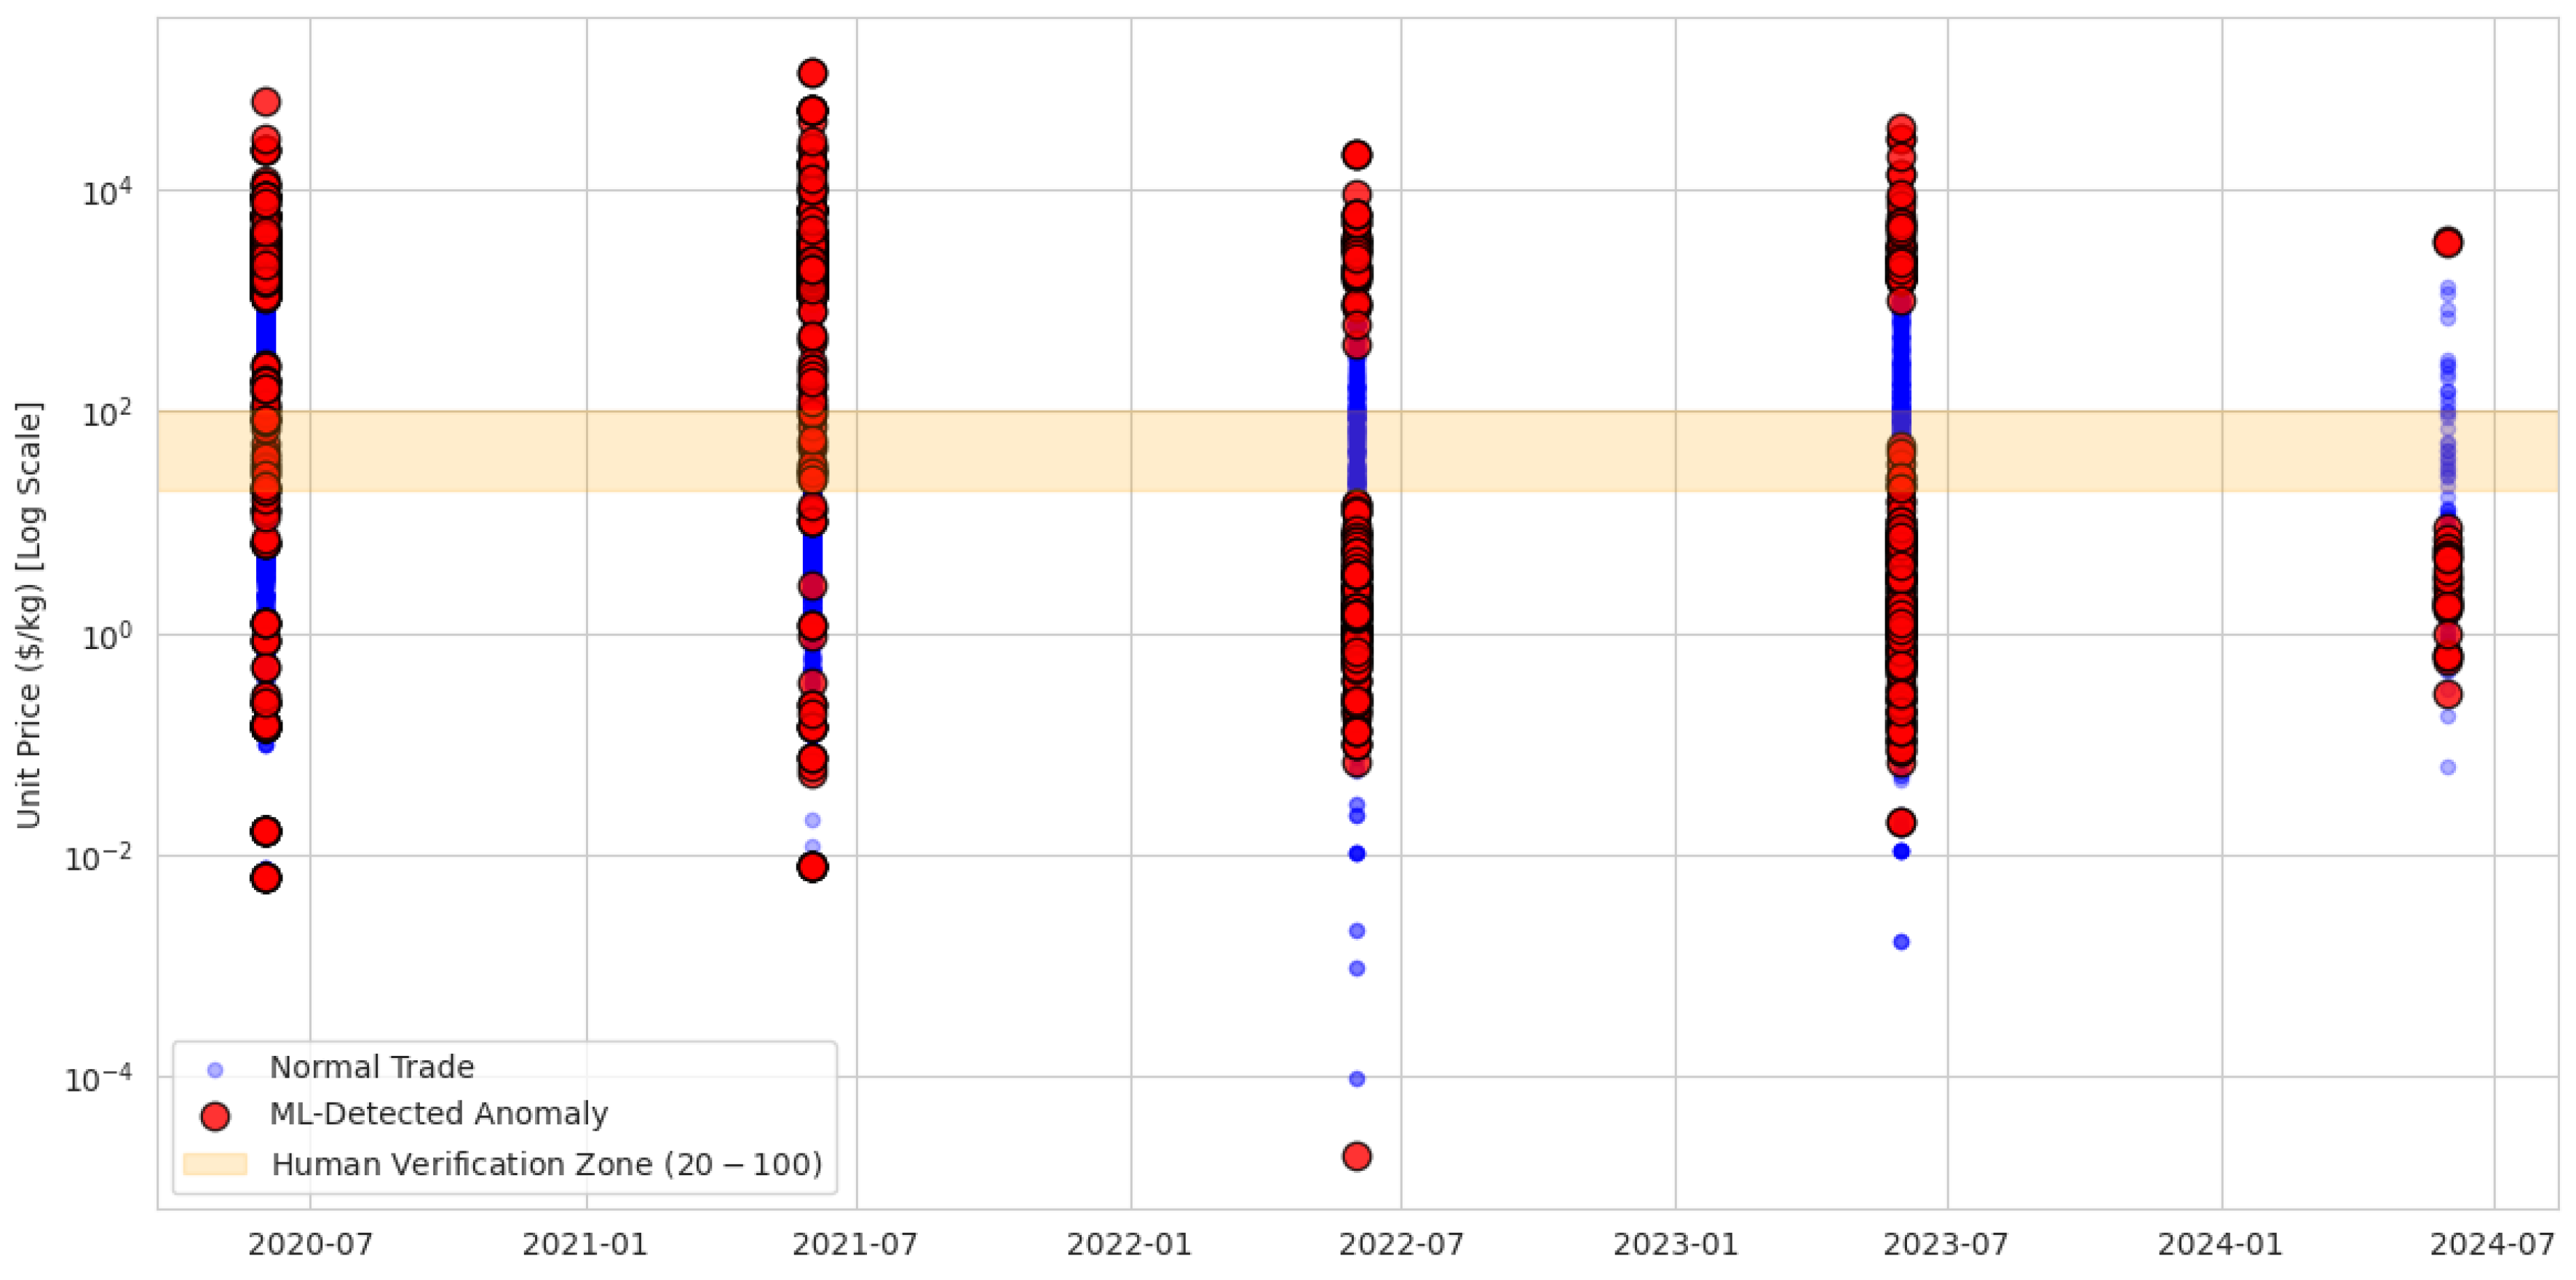
Figure 9.
The ‘Balloon Effect’ Visualized Trade Volume by HS Code (2020–2024). Source: Processed by Author (2025).
Figure 9.
The ‘Balloon Effect’ Visualized Trade Volume by HS Code (2020–2024). Source: Processed by Author (2025).
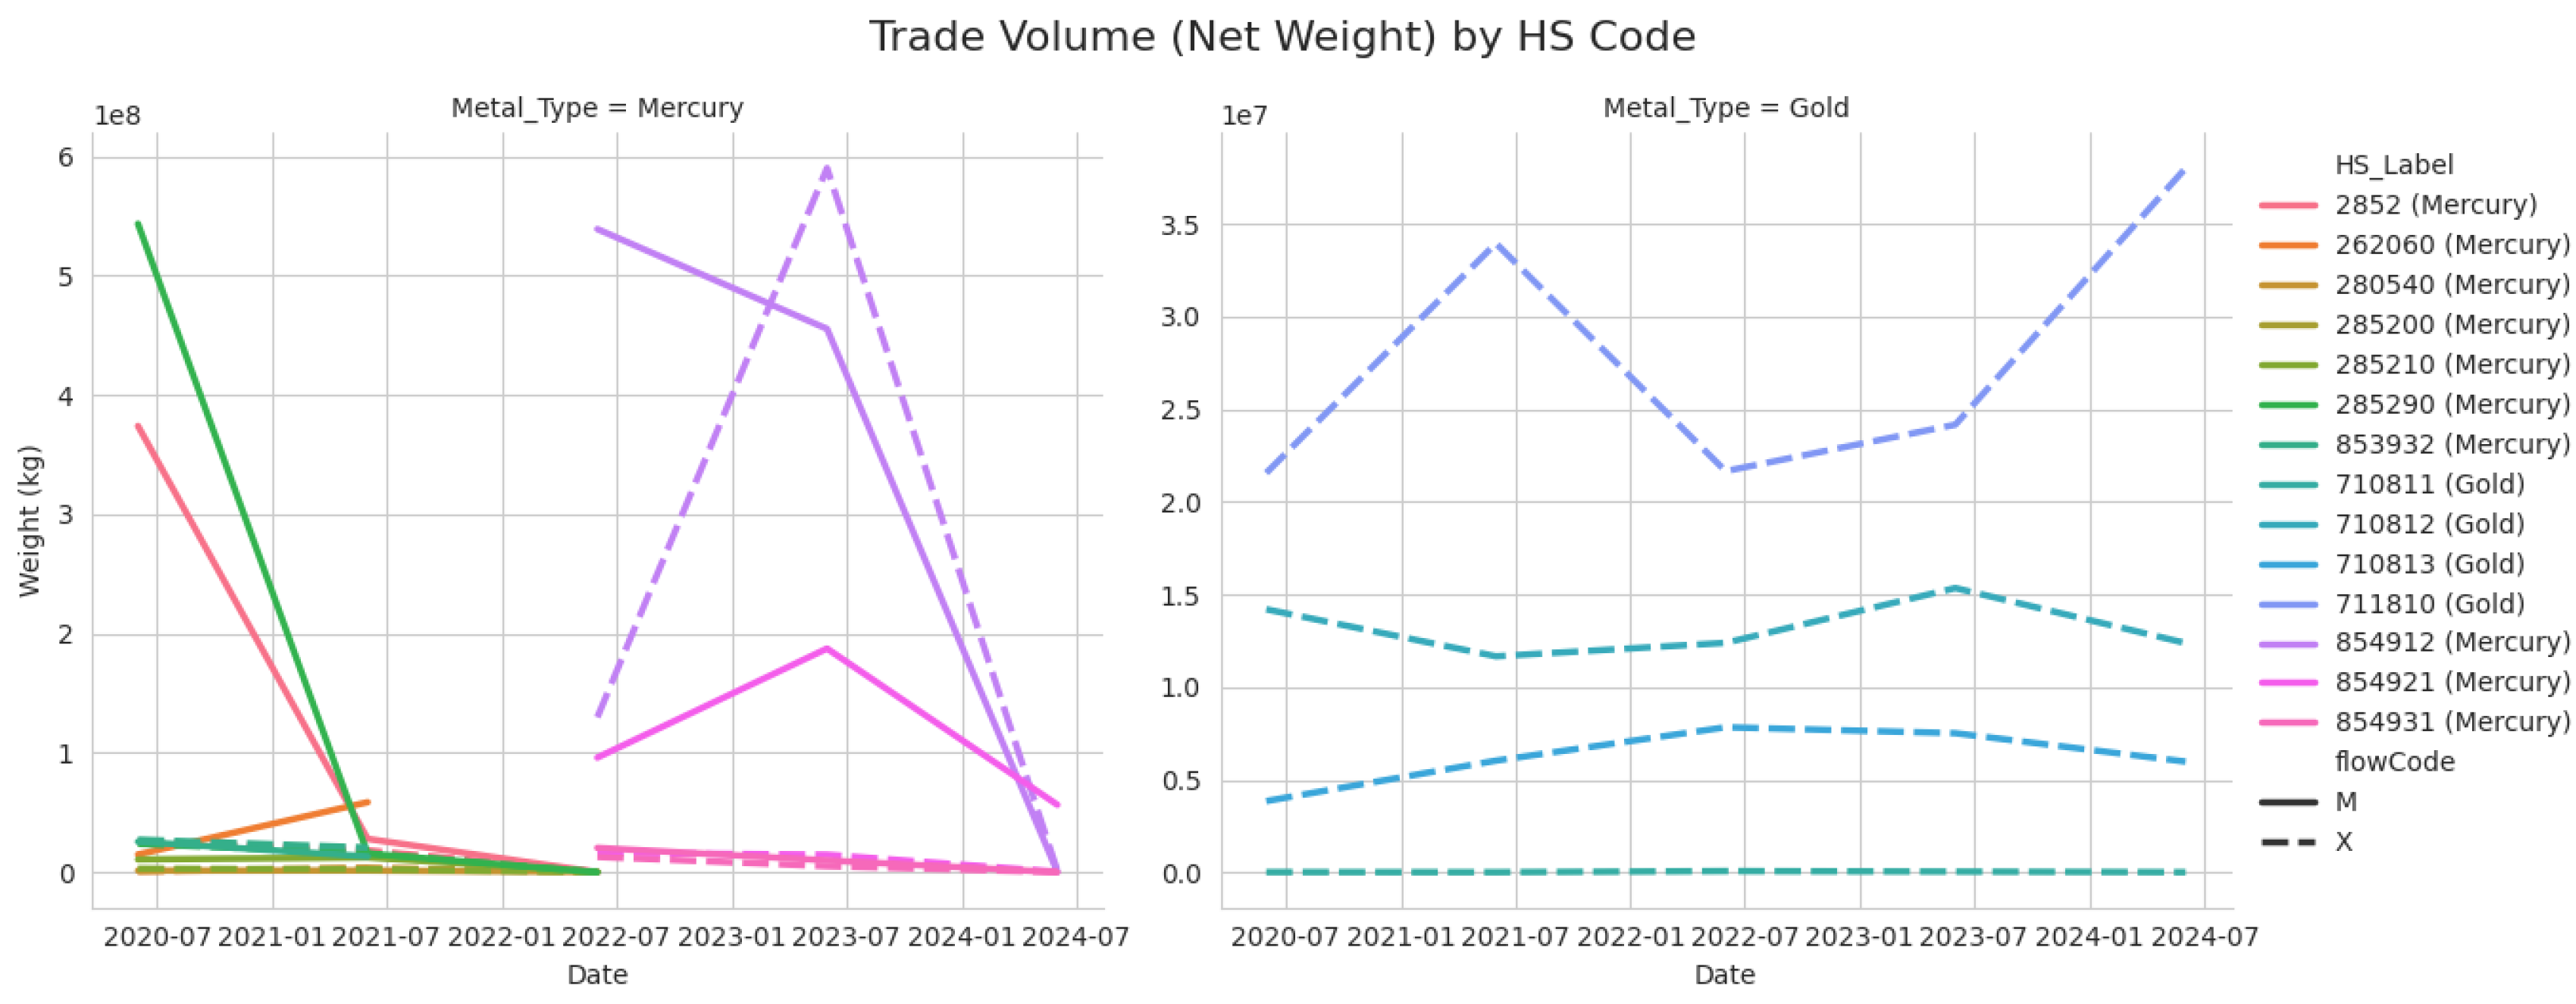
Figure 10.
Price Masking of Log-scale unit price analysis. Source: Processed by Author (2025).
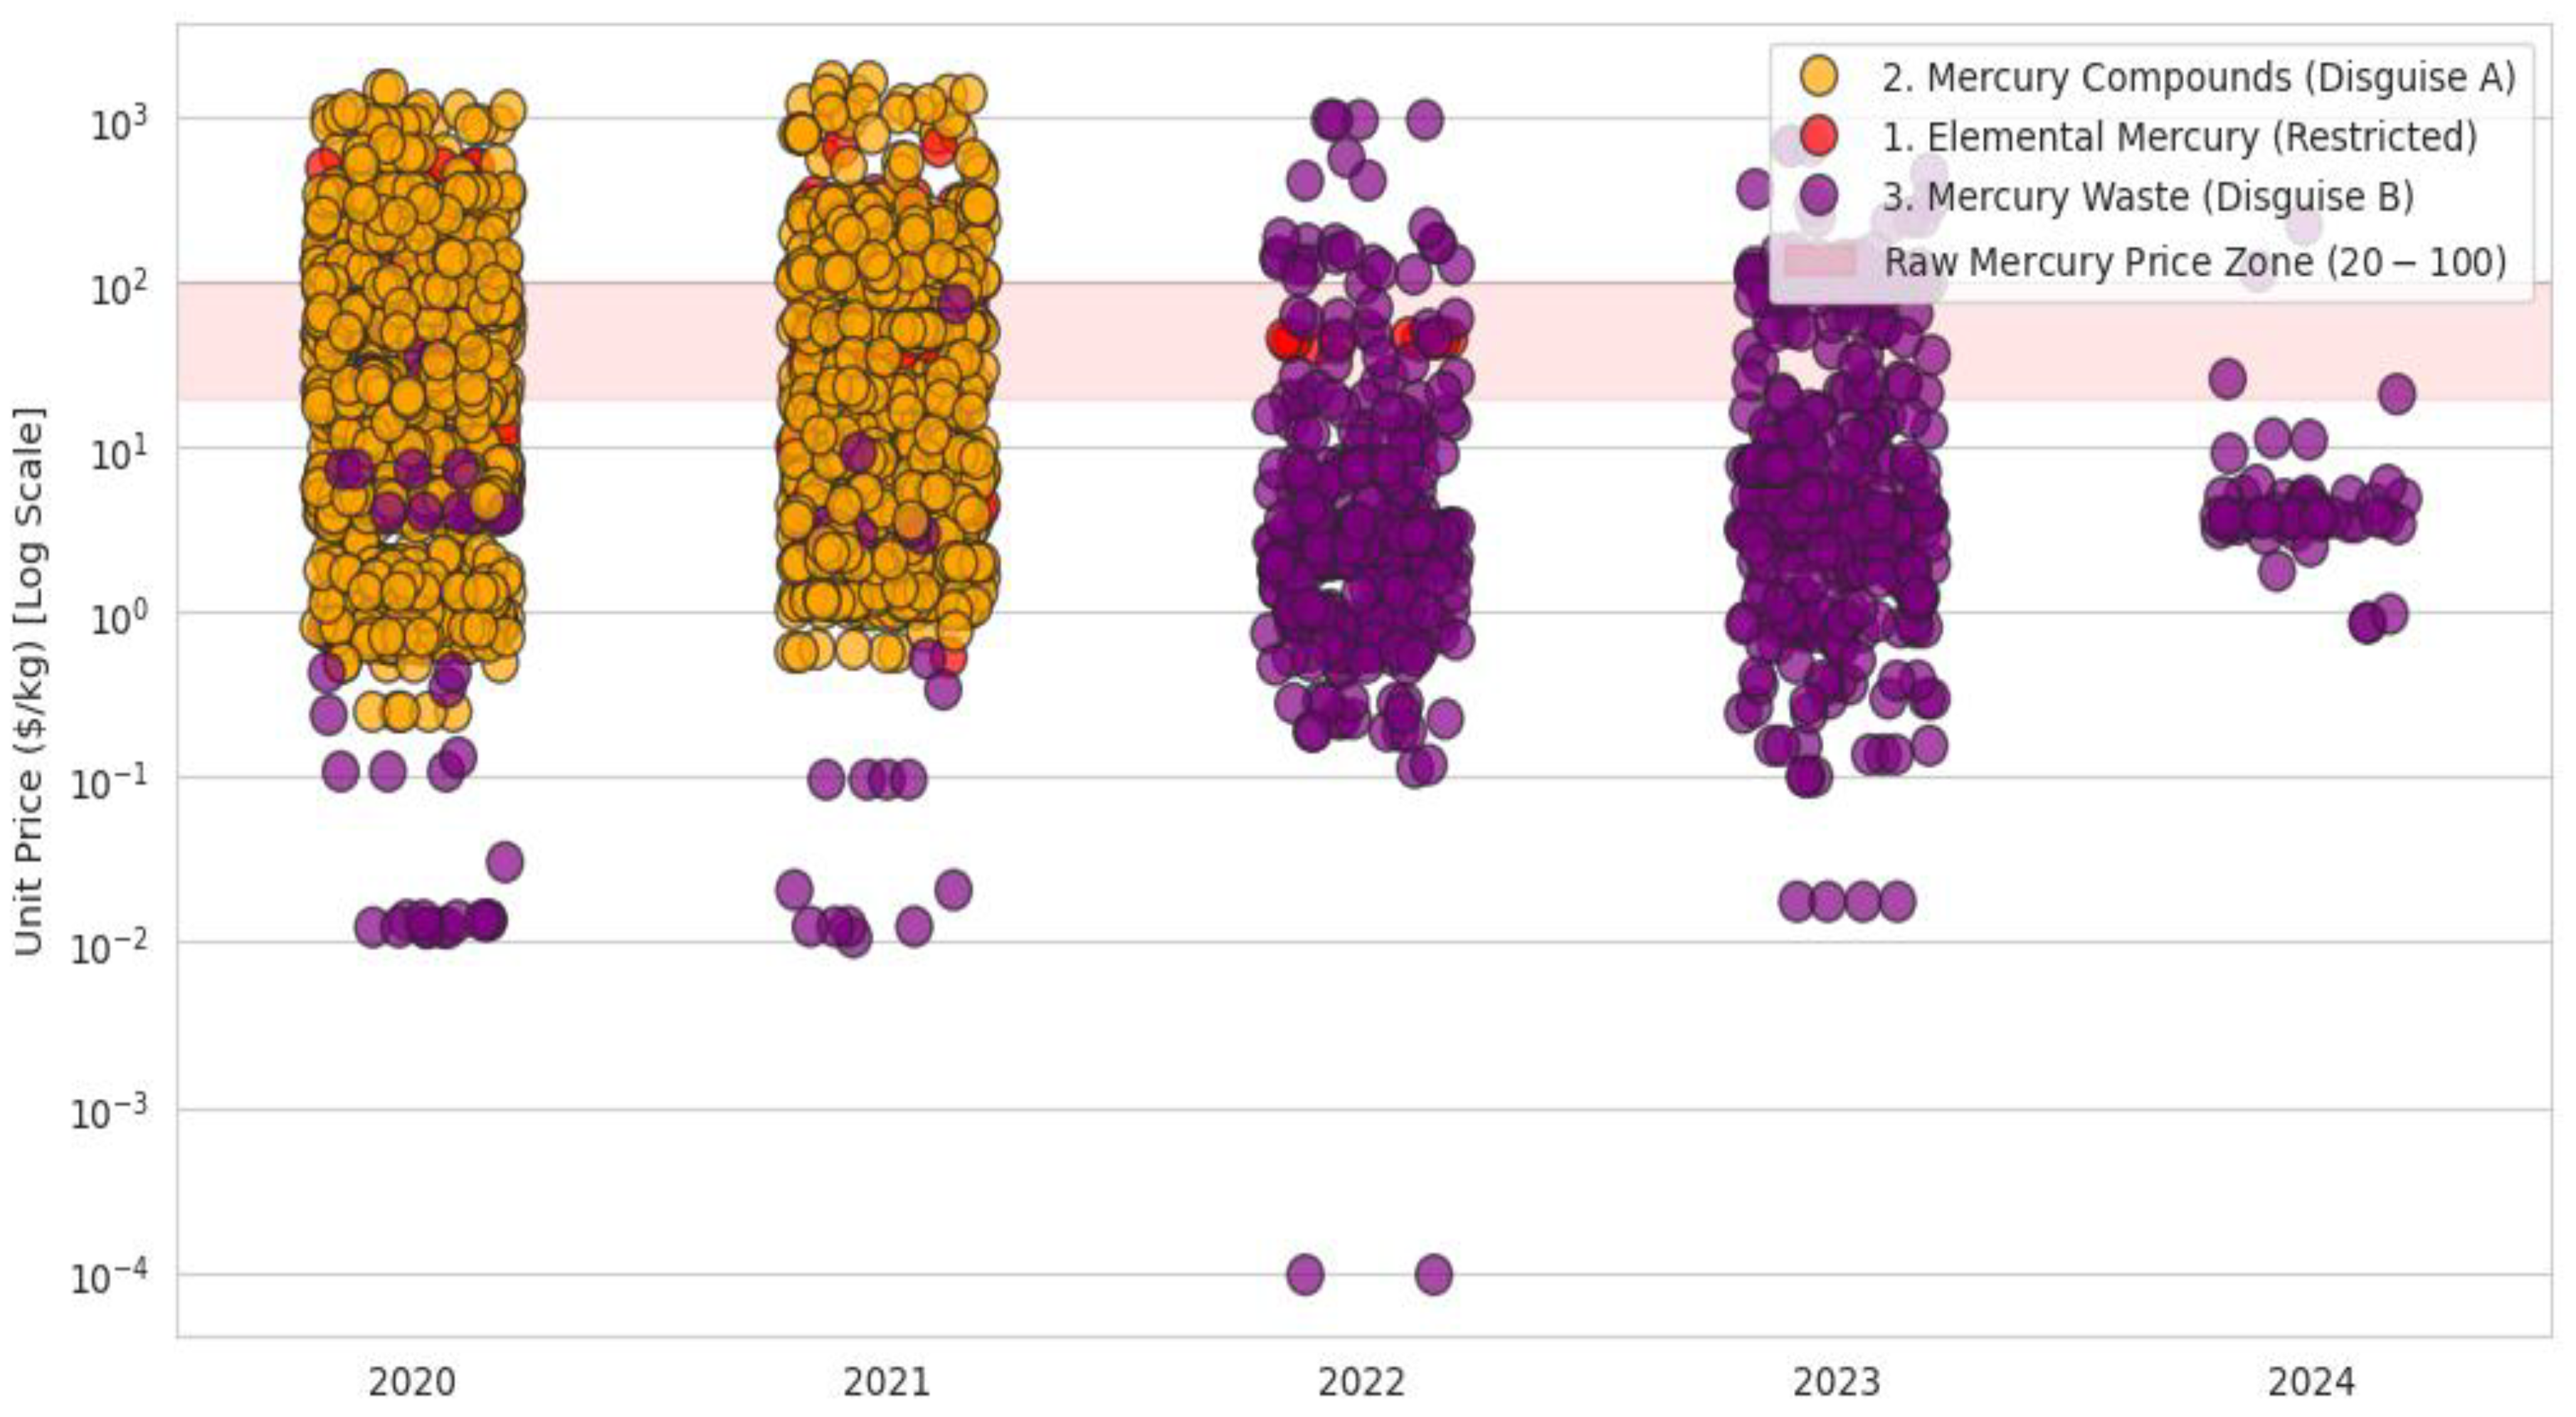
Figure 11.
Histogram of the ‘Impossible Purity’ Check .Source: Processed by Author (2025).
Figure 12.
Price Mimicry: HS Codes 854921 & 854991 Trading within the Raw Mercury Price Zone. Source: Processed by Author (2025).
Figure 12.
Price Mimicry: HS Codes 854921 & 854991 Trading within the Raw Mercury Price Zone. Source: Processed by Author (2025).
Figure 13.
GMM Clustering of Global Mineral Trade Map (2020-2024). Source: Processed by Author (2025).
Figure 13.
GMM Clustering of Global Mineral Trade Map (2020-2024). Source: Processed by Author (2025).
Figure 14.
Strategic Country Archetypes of Global Mineral Trade Map. Source: Processed by Author (2025).
Figure 14.
Strategic Country Archetypes of Global Mineral Trade Map. Source: Processed by Author (2025).
Figure 15.
Country Clusters from Node2Vec/Spectral Embeddings Source: Processed by Author (2025).
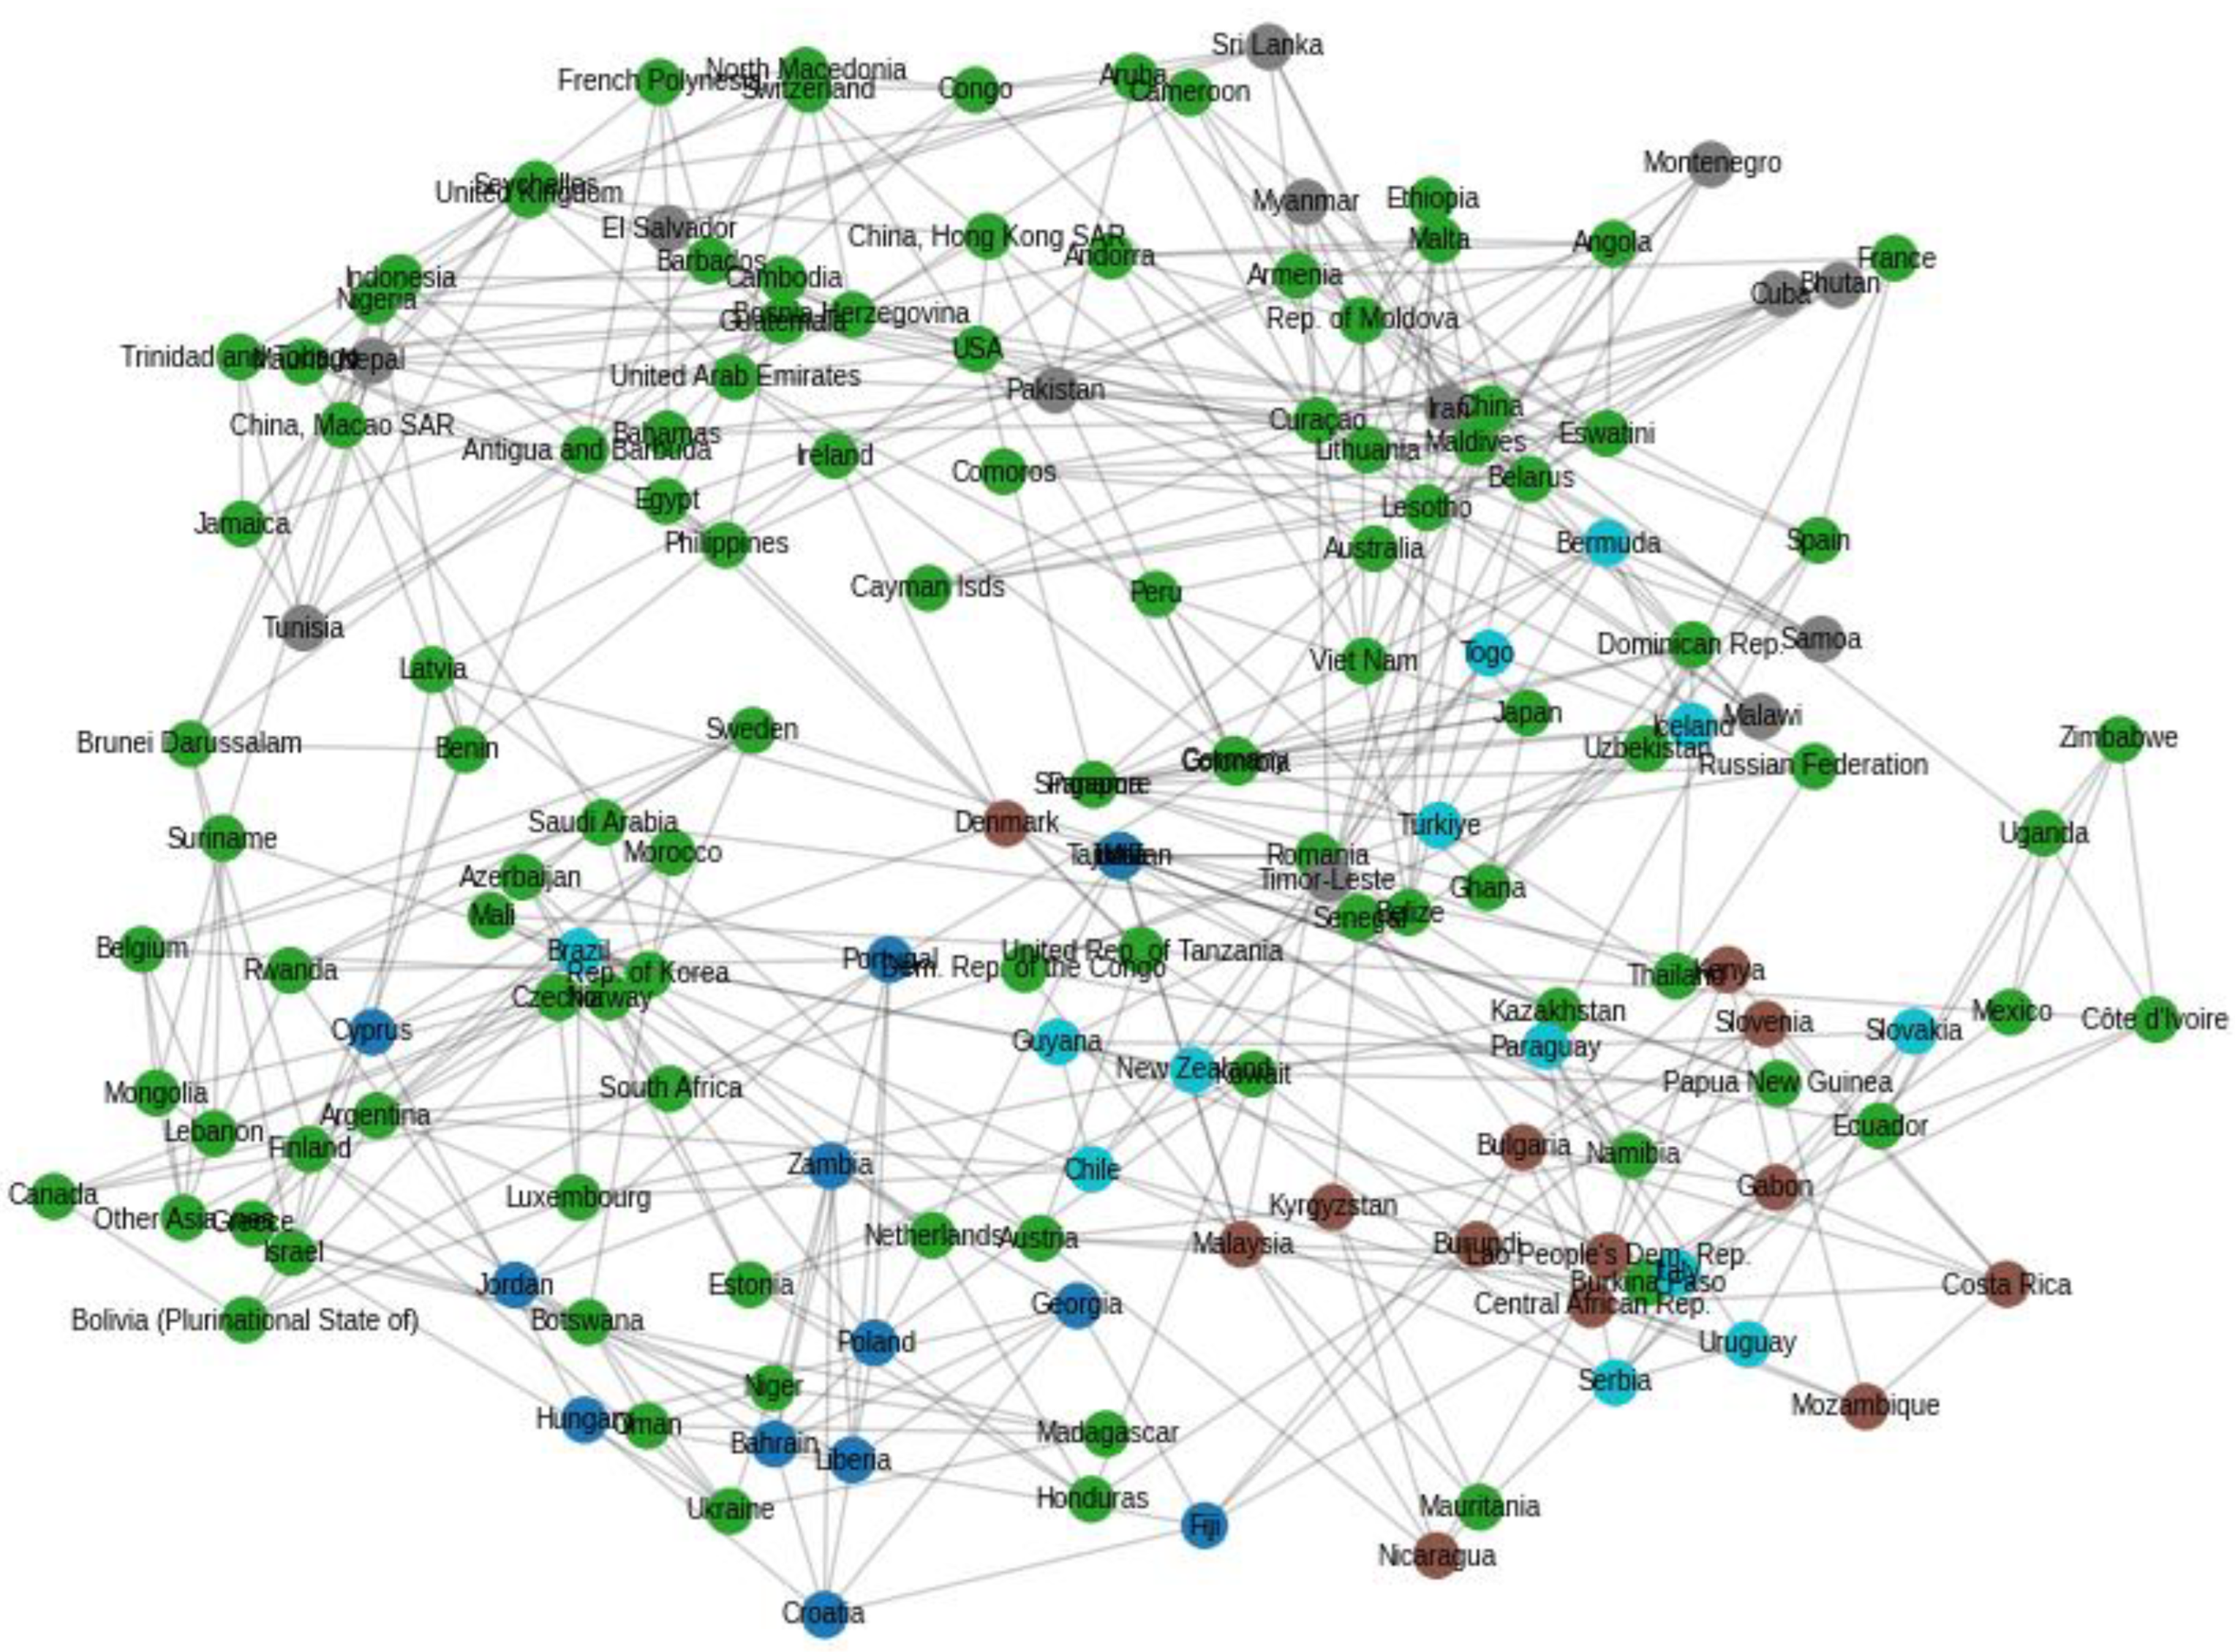
Figure 16.
Boxplot of structural separation between compliant and non-compliant economies in 2.06 Manifold Distance Source: Processed by Author (2025).
Figure 16.
Boxplot of structural separation between compliant and non-compliant economies in 2.06 Manifold Distance Source: Processed by Author (2025).
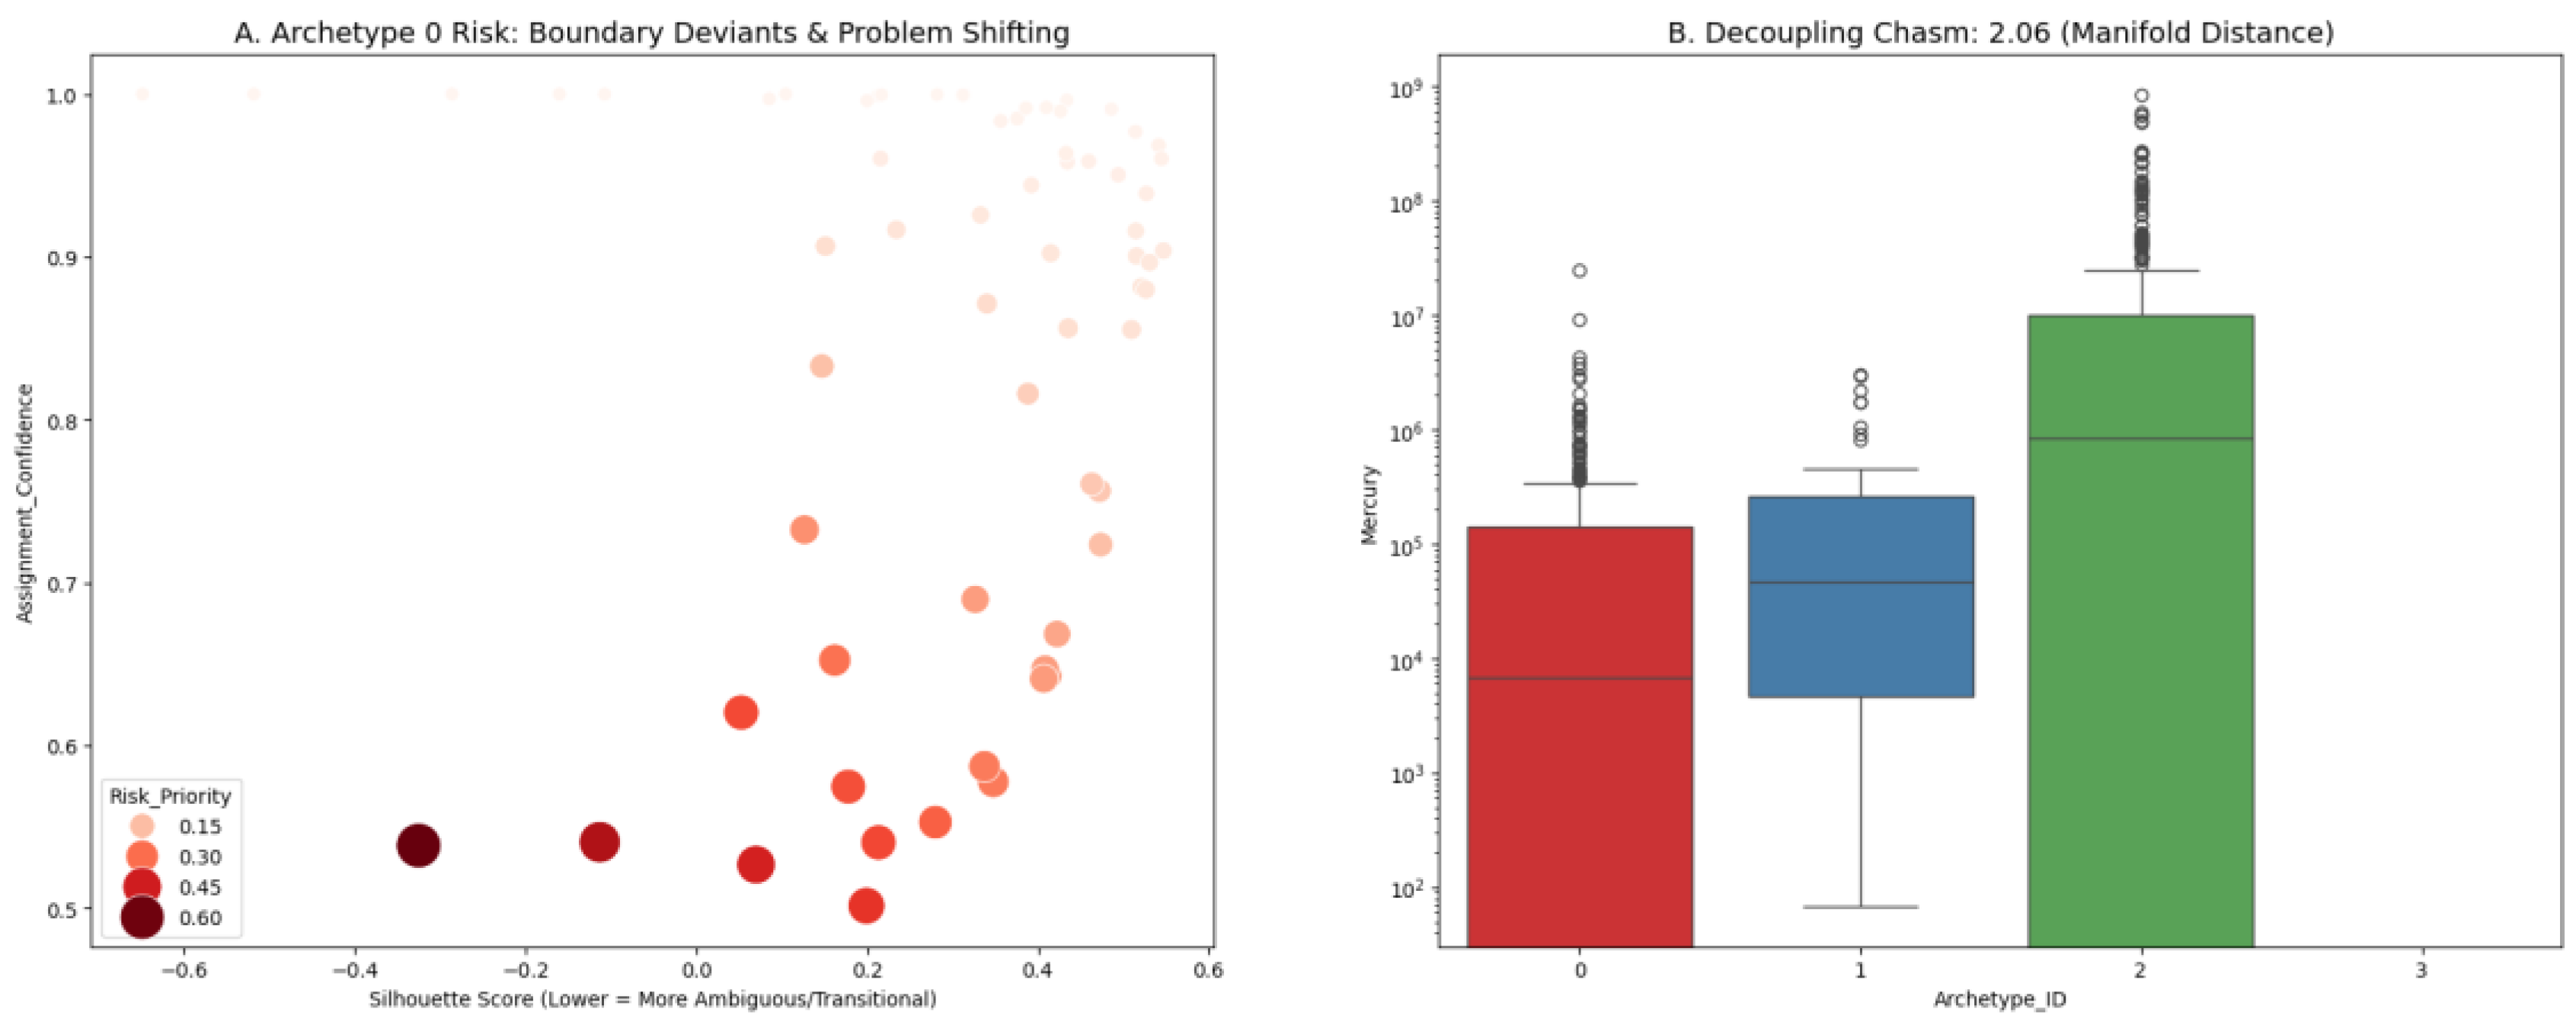
Figure 17.
Bar Chart of Top 10 Global Origins of Misclassified Waste Anomaly. Source: Processed by Author (2025).
Figure 17.
Bar Chart of Top 10 Global Origins of Misclassified Waste Anomaly. Source: Processed by Author (2025).
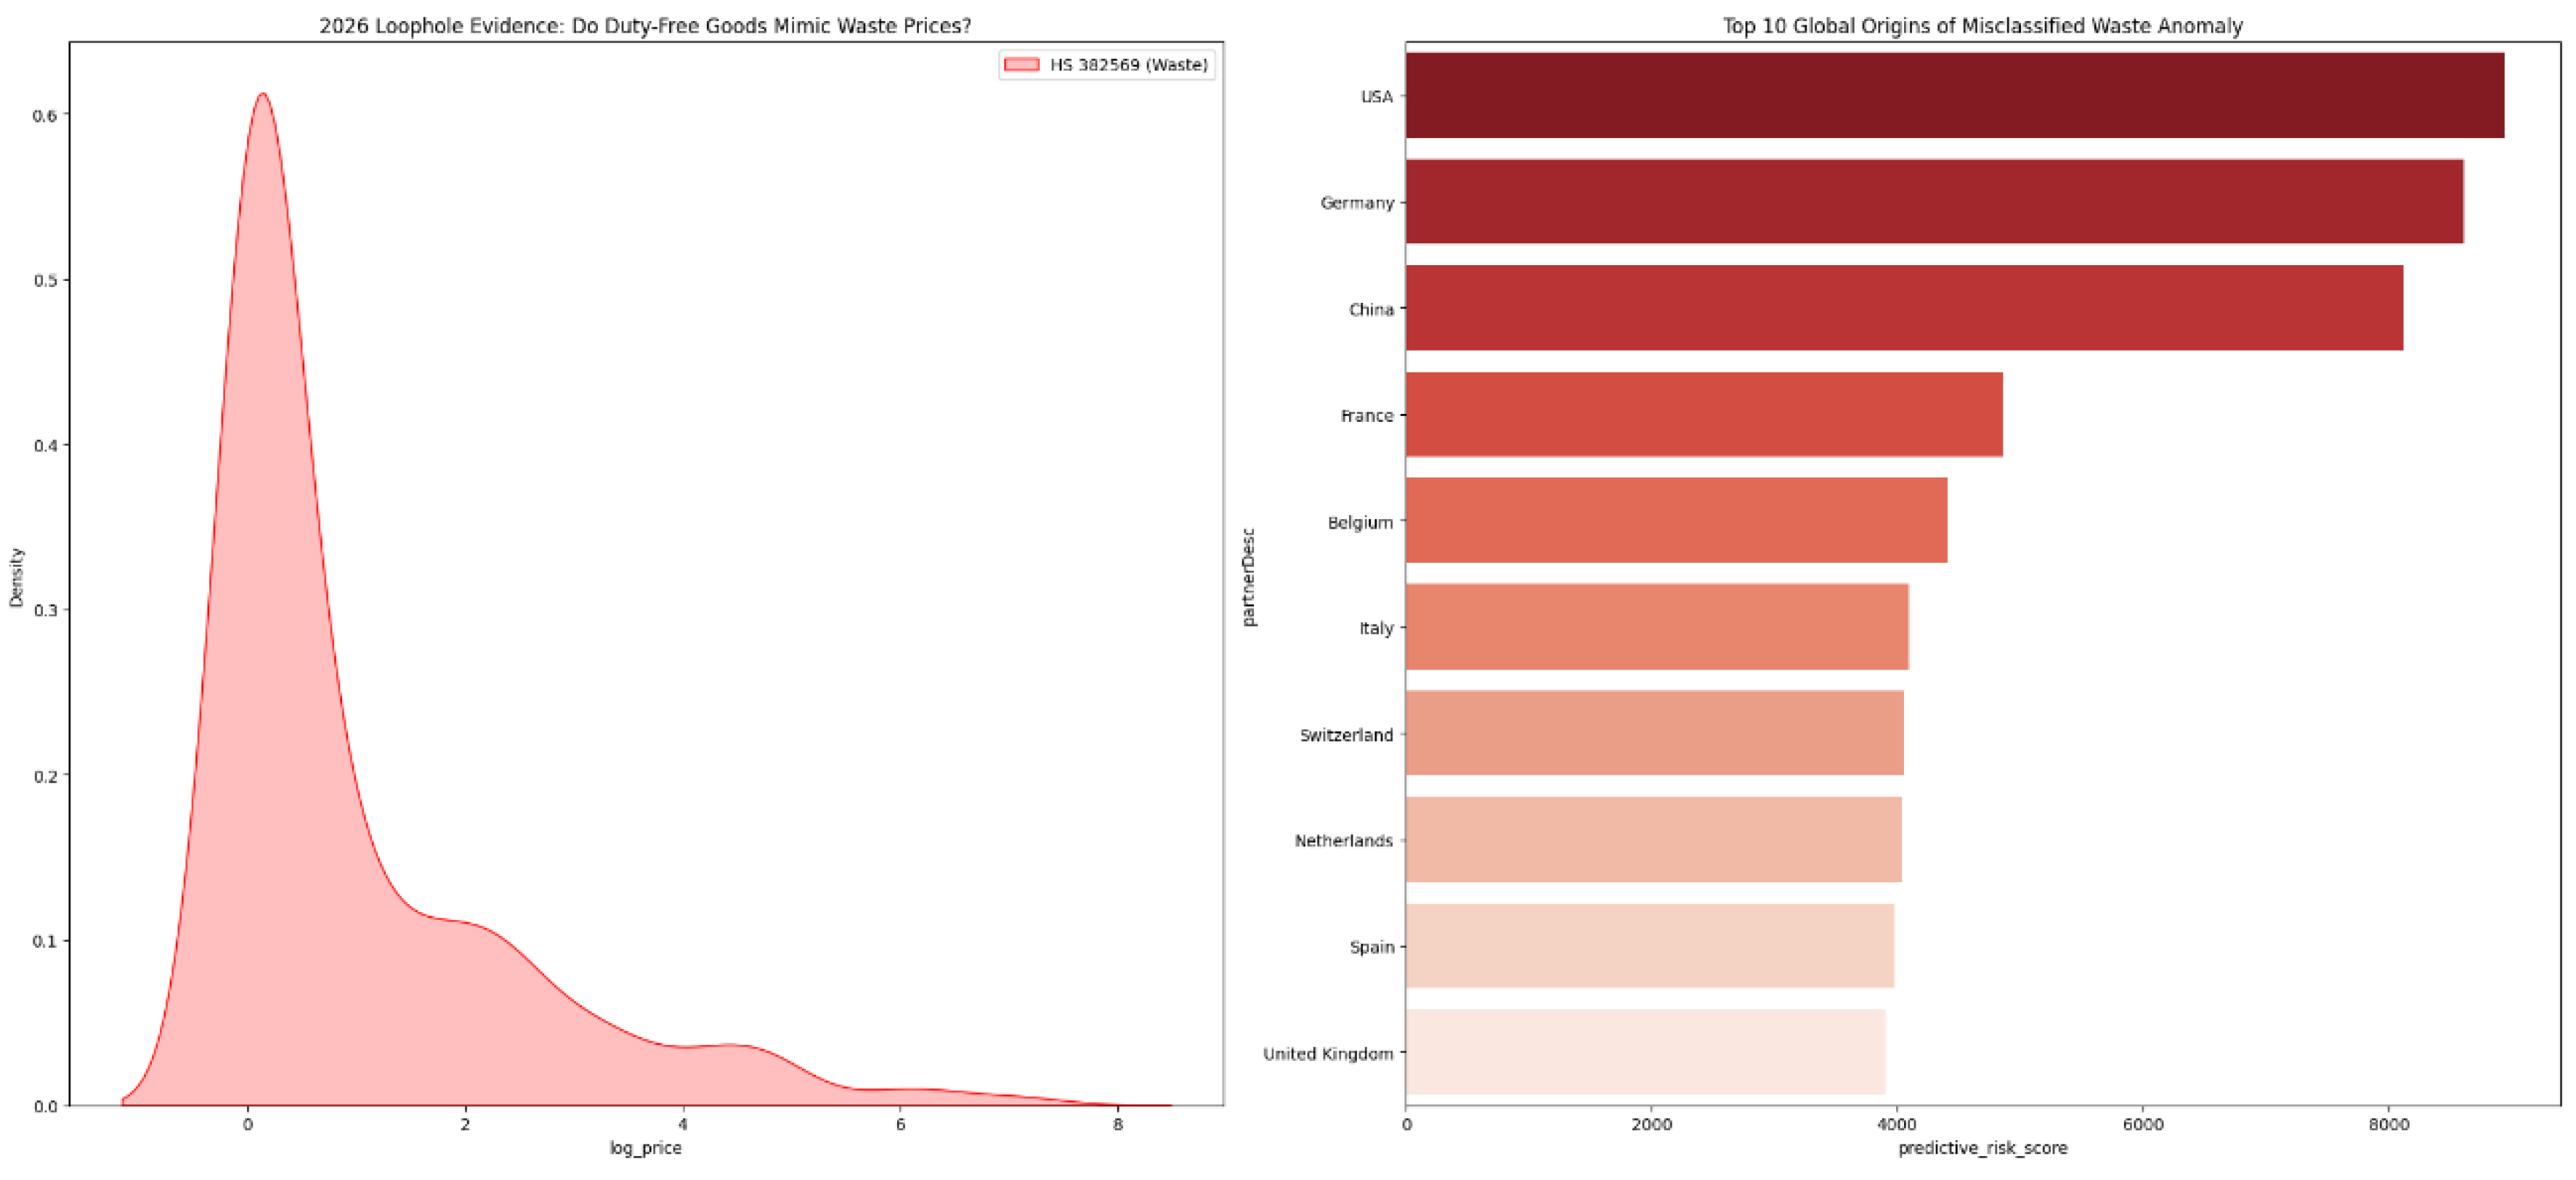
Figure 18.
LTSM Forecast of Comparative Key Hub 2030 Gold Trade Projections for Consensus Anomalies Source: Processed by Author (2025).
Figure 18.
LTSM Forecast of Comparative Key Hub 2030 Gold Trade Projections for Consensus Anomalies Source: Processed by Author (2025).
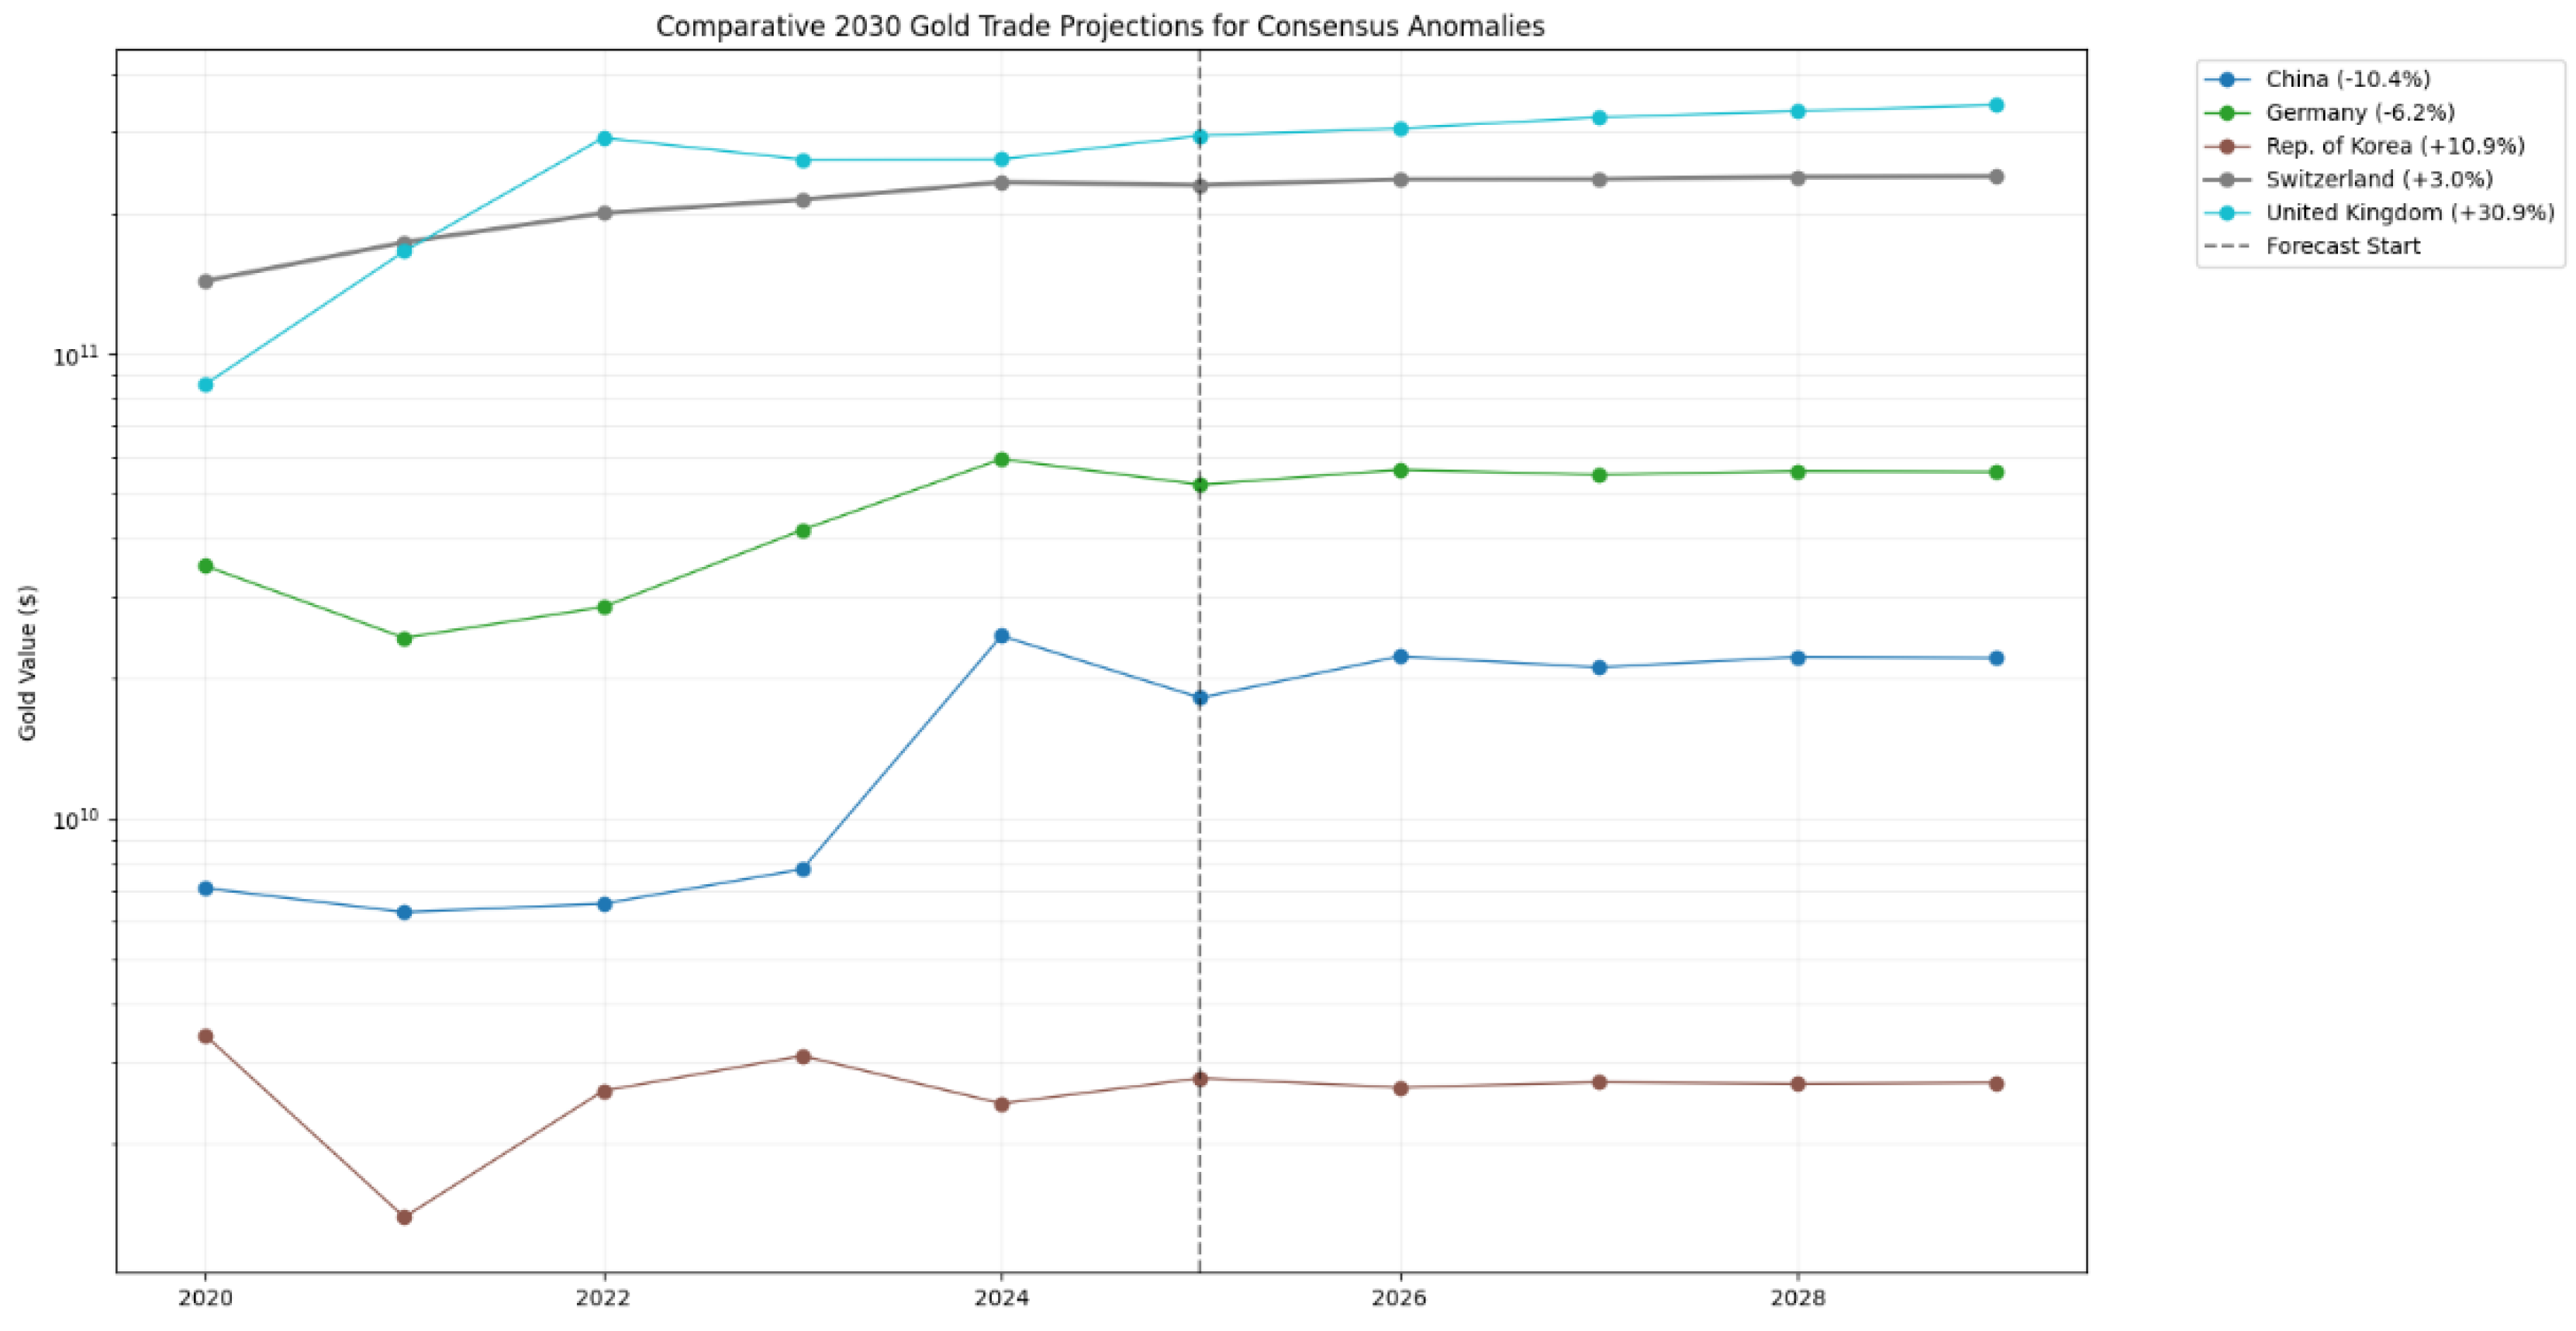
Figure 19.
Machine Learning Forecast of Future Trend of ‘Fake Waste’ (HS 8549) Source: Processed by Author (2025).
Figure 19.
Machine Learning Forecast of Future Trend of ‘Fake Waste’ (HS 8549) Source: Processed by Author (2025).
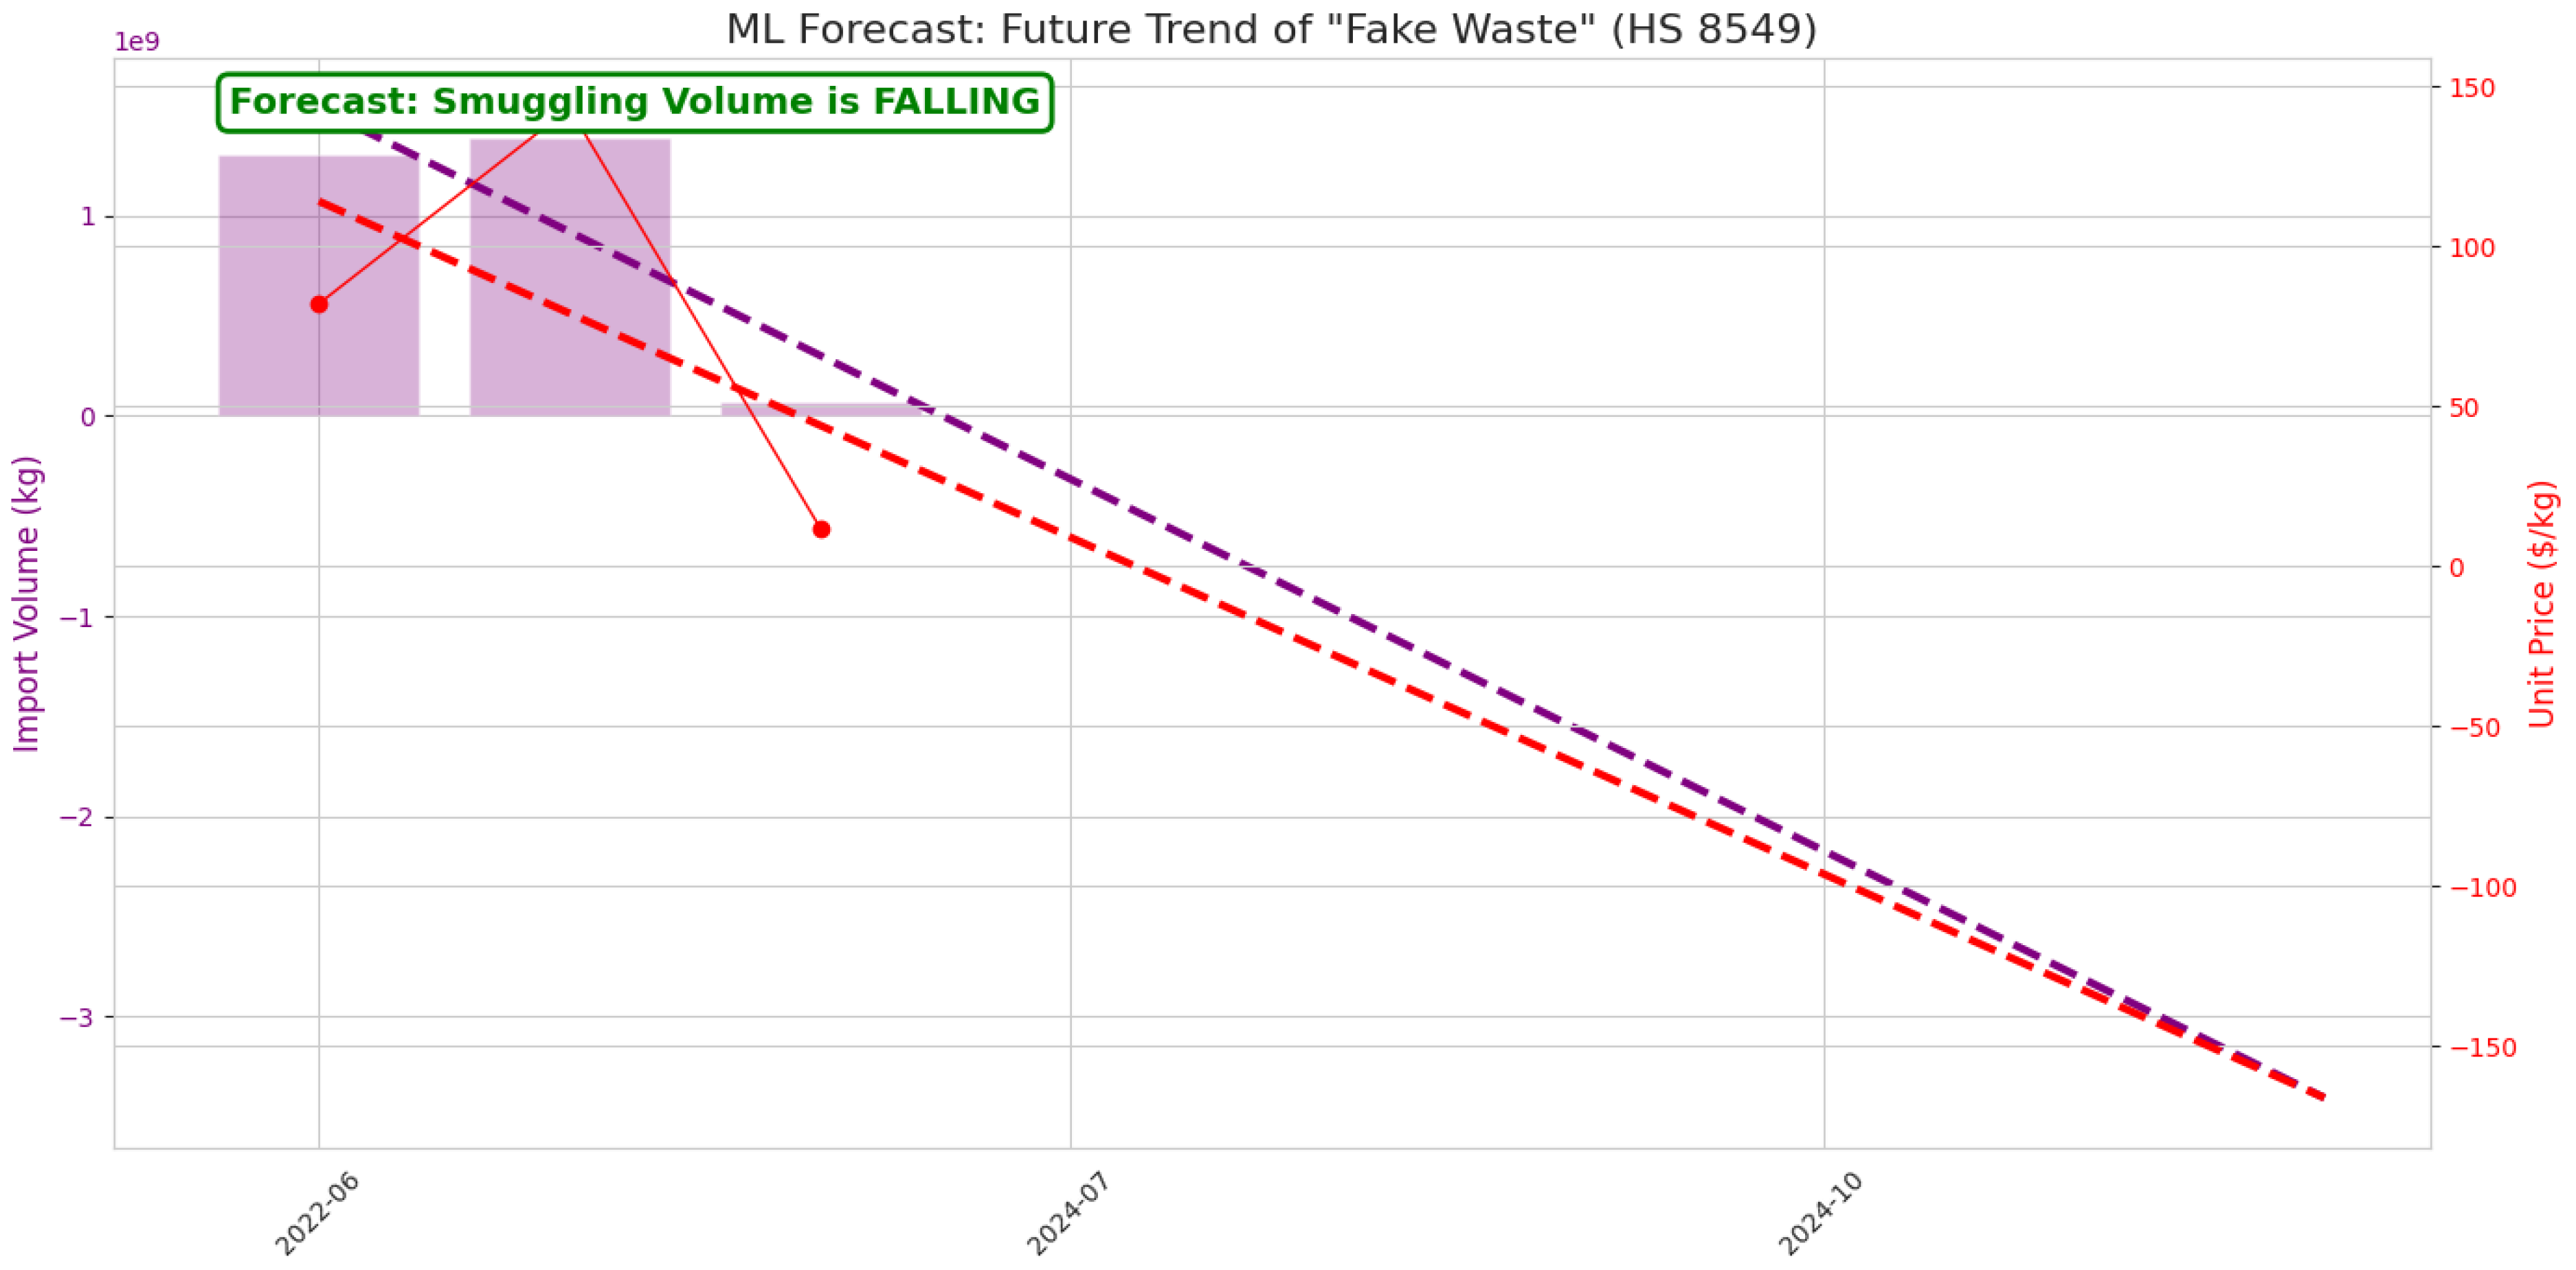
Figure 20.
Market Regime Shift Detection: Switzerland (PELT Algorithm) Source: Processed by Author (2025).
Figure 20.
Market Regime Shift Detection: Switzerland (PELT Algorithm) Source: Processed by Author (2025).
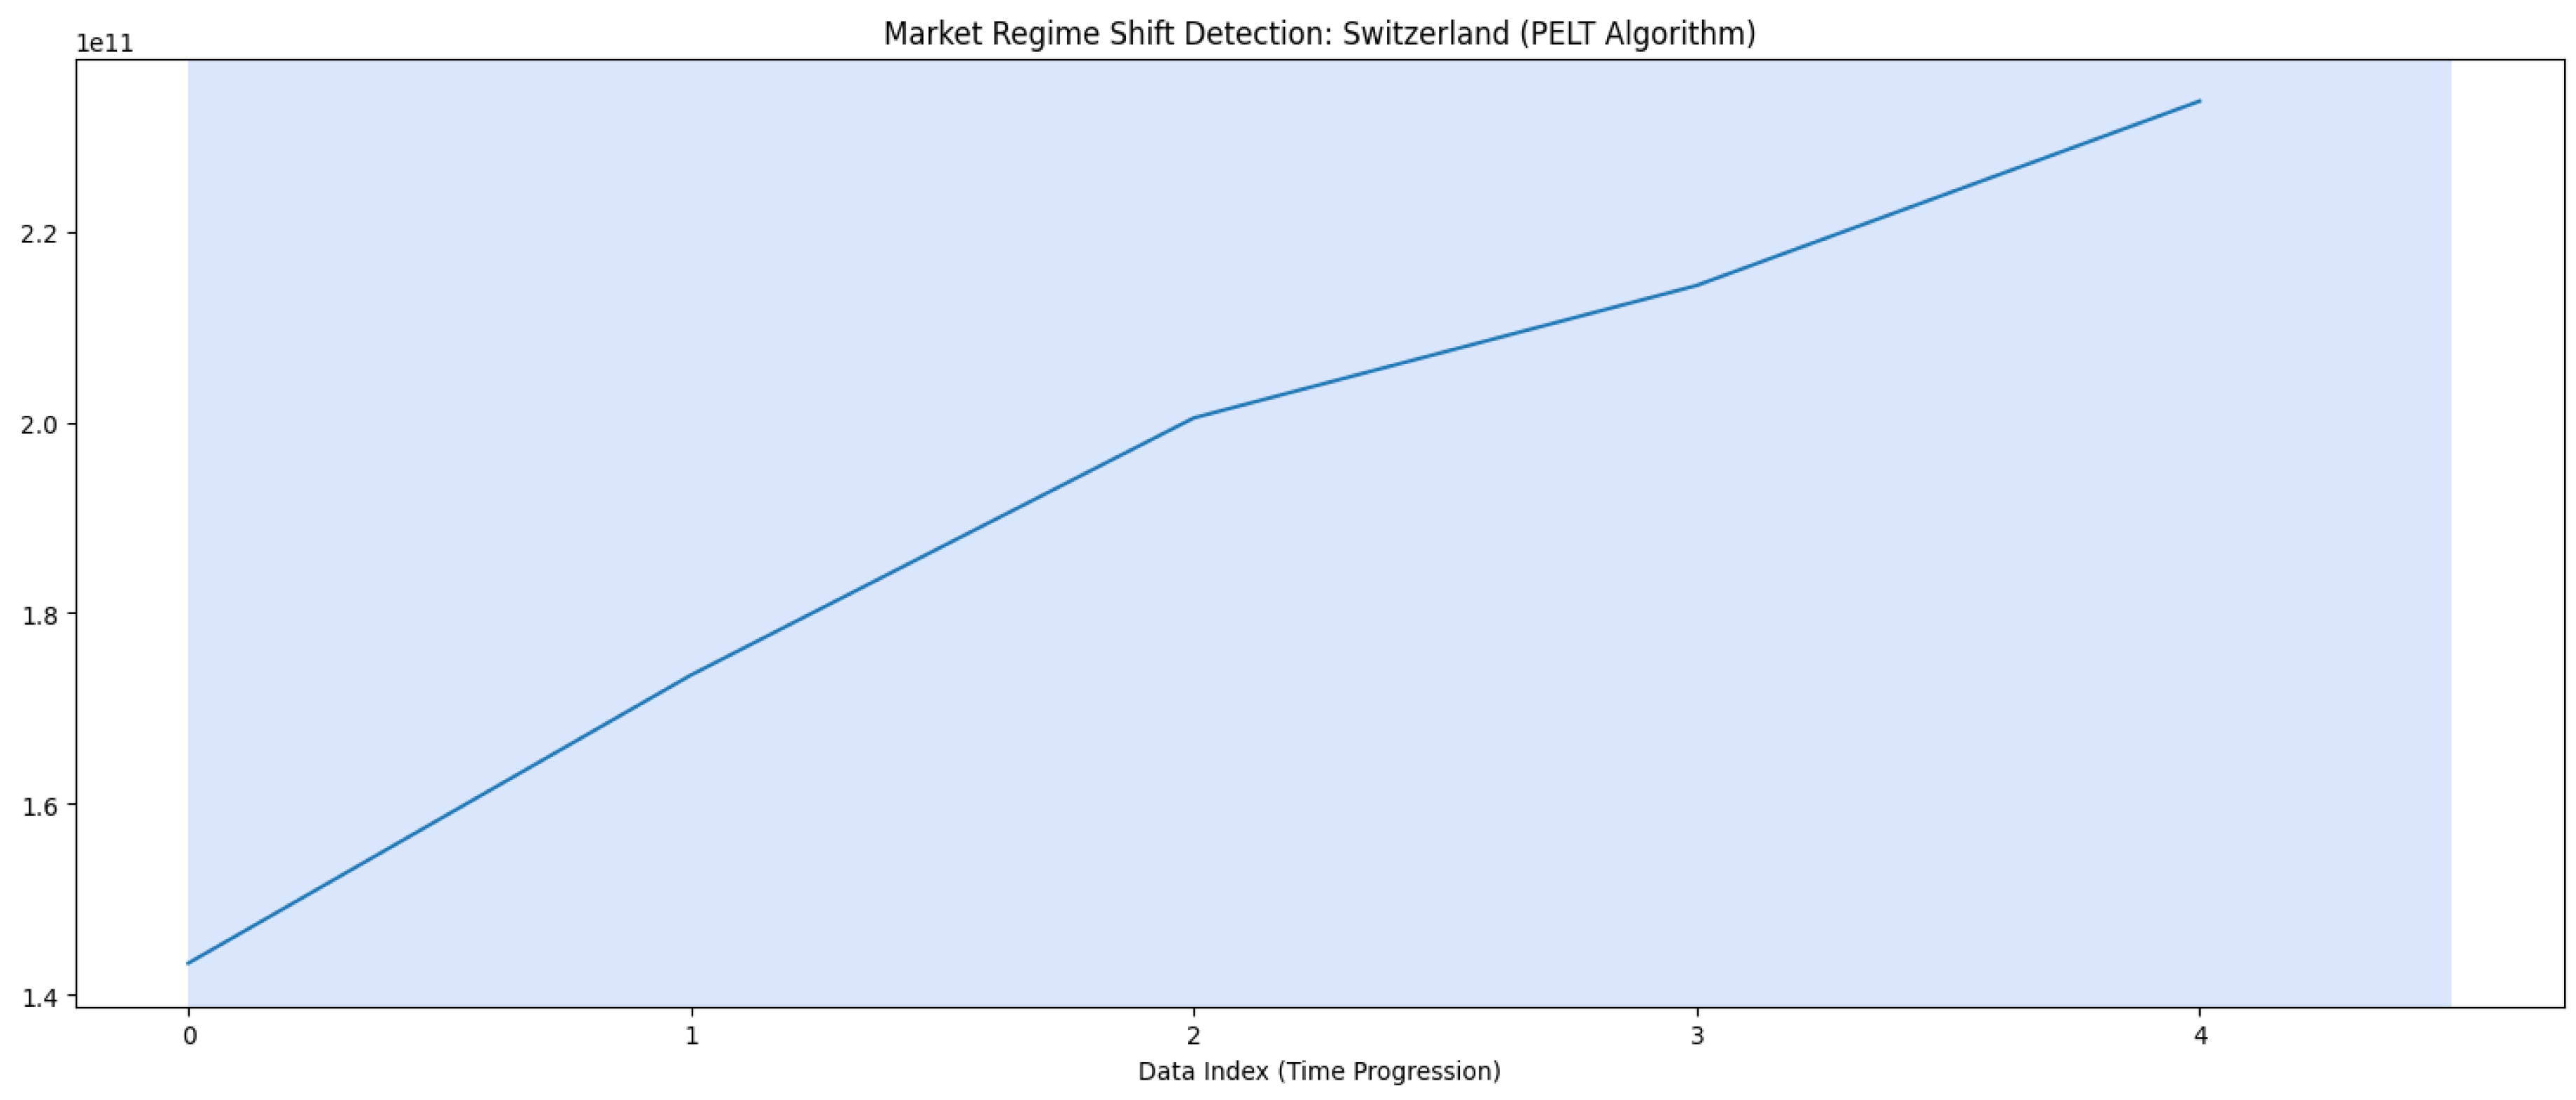
Figure 21.
Bar Chart of Gold-to-Mercury Ratio for Anomalous Trade Hubs Source: Processed by Author (2025).
Figure 21.
Bar Chart of Gold-to-Mercury Ratio for Anomalous Trade Hubs Source: Processed by Author (2025).
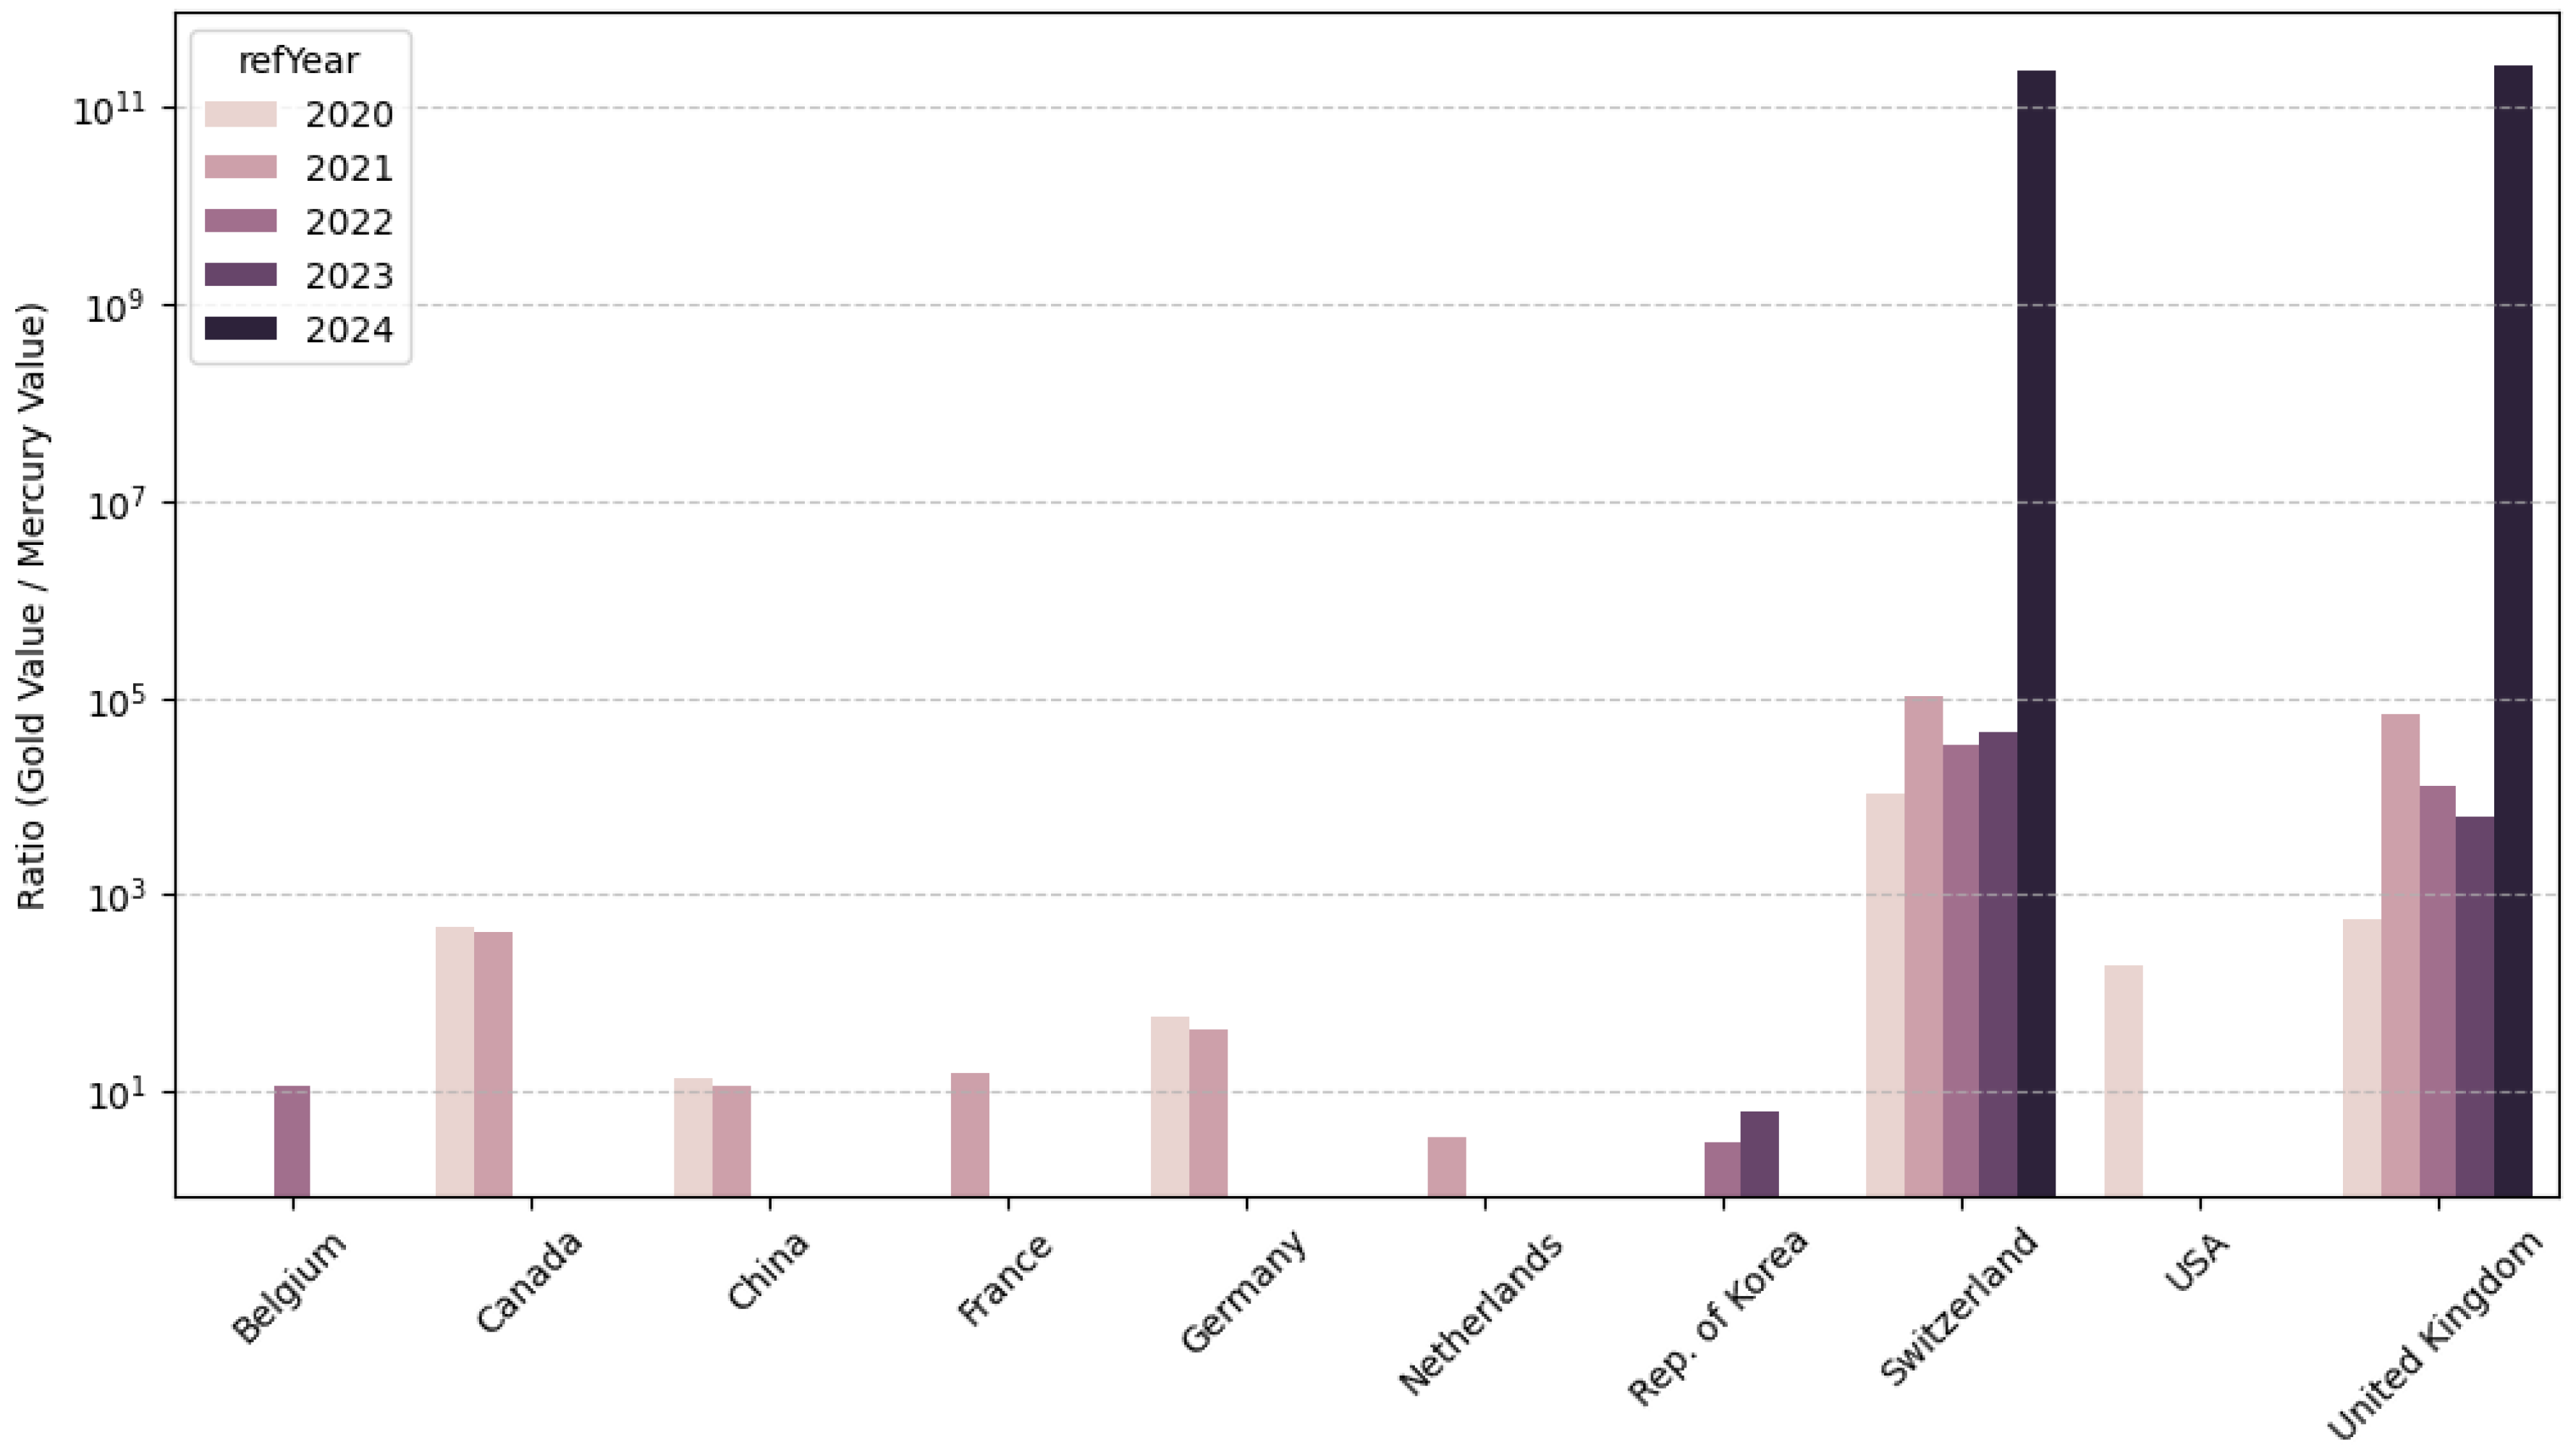
Figure 22.
Strategic Country Archetypes and Compliance Velocity (2020–2024) Source: Processed by Author (2025).
Figure 22.
Strategic Country Archetypes and Compliance Velocity (2020–2024) Source: Processed by Author (2025).
Disclaimer/Publisher’s Note: The statements, opinions and data contained in all publications are solely those of the individual author(s) and contributor(s) and not of MDPI and/or the editor(s). MDPI and/or the editor(s) disclaim responsibility for any injury to people or property resulting from any ideas, methods, instructions or products referred to in the content. |
© 2026 by the author. Licensee MDPI, Basel, Switzerland. This article is an open access article distributed under the terms and conditions of the Creative Commons Attribution (CC BY) license.
Copyright: This open access article is published under a Creative Commons CC BY 4.0 license, which permit the free download, distribution, and reuse, provided that the author and preprint are cited in any reuse.


